0270~6474/82/0201-0017$02.00/O The Journal of Neuroscience Copyright 0 Society for Neuroscience Vol. 2, No. 1, pp. 17-31 Printed in U.S.A. January 1982 ENCODING OF TARGET RANGE AND ITS REPRESENTATION IN THE AUDITORY CORTEX OF THE MUSTACHED BAT’ WILLIAM E. O’NEILL’ AND NOBUO SUGA Department of Biology, Washington University, St. Louis, Missouri 63130 Received August 3, 1981; Revised September 28, 1981; Accepted September 29, 1981 Abstract The time course of acoustic events is a critical element for the recognition of biologically rneaningful sounds. Echolocating bats analyze the time intervals between their emitted biosonar pulses and the echoes returning from objects to assess target distance (range). In this study, we have explored the auditory cortex of the mustached bat, Pteronotus parnellii rubiginosus, using pairs of acoustic stimuli mimicking the multiharmonic biosonar signals (pulses) used by this species and their echoes. A discrete field of auditory cortex dorsorostral to the tonotopicaJly organized primary field contains neurons which are insensitive to pure tone, frequency-modulated (FM), or noise stimuli presented singly. Rather, they respond strongly to pairs of stimuli, specifically, the fundamental FM component of the pulse paired with an FM component of one of the higher harmonics of the echo. We call these neurons FM1-FM, facilitation neurons. There are three separate longitudinal clusters in this cortical area containing FM1-FM2, FM1-FM3, and FMI-FM4 neurons, respectively. Moreover, FMI-FM, neurons are specifically sensitive to the time delay between the two FM components, i.e., the time delay of the echo from the pulse. Thus, they can decode target range. Two types of delay-sensitive neurons were found. Tracking neurons, whose response to echo delay varied according to repetition rate and stimulus duration, were found rarely. Delay-tuned neurons, which were tuned to specific time delays (best delays) of the echo from the pulse, were much more evident. Both types of neurons are organized into columns with similar best delays, and the best delay of delay-tuned neurons was found to increase systematically along the cortical surface in the rostrocaudal direction. This area, therefore, contains a neural representation of target range along this best delay axis. Such an axis exists in each of the clusters of FMI-FMz, FM]-FM3, and FMI-FM4 neurons. This is a new type of cortical organization which is not tonotopic but which represents an important acoustic cue related to the time course of acoustic events. Acoustic signals can be described in terms of physical parameters, such as frequency, amplitude, and time. In mammals, vocal signals are composed typically of dis- crete utterances called phonemes, which are ordered in ’ This work was supported by National Science Foundation Grants BMS 75-17077 and BNS 78-12987 to N. S. W. E. 0. wishes to thank the faculty of the Sensory Physiology group for postdoctoral training received under the auspices of the Sensory Physiology Training Grant (National Institute of Neurological and Communicative Disorders and Stroke Grant l-T32-NS07057-01) administered through the Depart- ment of Physiology and Biophysics, Washington University Medical School. We are indebted to James Jaeger for technical assistance, Peter Wasserbach for the design and construction of the harmonic generators used in these experiments, and Nancy Dintruff and Mary Lee Stein of the University of Rochester for preparing the manuscript. time to convey information. Although the temporal pat- terns within phonemes and their sequences in the acous- tic stream carry much of the total information in vocali- zations, research in mammalian audition has focused mainly on the analysis and representation of frequency in the auditory system. That the cochlea is primarily a frequency analyzer (von B6k6sy, 1960) probably accounts for much of this emphasis. Another factor in favor of this bias is the relative ease of generation and the physical simplicity of pure tone stimuli for investigating the prop- erties of the auditory system. * To whom correspondence should be addressed at his present ad- dress: Center for Brain Research, University of Rochester Medical A major result of this endeavor has been to show that central auditory organization is dominated by the reca- pitulation of the morphology of the sensory epithelium, i.e., the organ of Corti. Mapping of peripheral organiza- tion onto the central nervous system is a property com- mon to the visual and somatosensory systems as well. School, Rochester, NY 14642. For audition, the representation of frequency along the

Welcome message from author
This document is posted to help you gain knowledge. Please leave a comment to let me know what you think about it! Share it to your friends and learn new things together.
Transcript

0270~6474/82/0201-0017$02.00/O The Journal of Neuroscience Copyright 0 Society for Neuroscience Vol. 2, No. 1, pp. 17-31 Printed in U.S.A. January 1982
ENCODING OF TARGET RANGE AND ITS REPRESENTATION IN THE AUDITORY CORTEX OF THE MUSTACHED BAT’
WILLIAM E. O’NEILL’ AND NOBUO SUGA
Department of Biology, Washington University, St. Louis, Missouri 63130
Received August 3, 1981; Revised September 28, 1981; Accepted September 29, 1981
Abstract
The time course of acoustic events is a critical element for the recognition of biologically rneaningful sounds. Echolocating bats analyze the time intervals between their emitted biosonar pulses and the echoes returning from objects to assess target distance (range). In this study, we have explored the auditory cortex of the mustached bat, Pteronotus parnellii rubiginosus, using pairs of acoustic stimuli mimicking the multiharmonic biosonar signals (pulses) used by this species and their echoes.
A discrete field of auditory cortex dorsorostral to the tonotopicaJly organized primary field contains neurons which are insensitive to pure tone, frequency-modulated (FM), or noise stimuli presented singly. Rather, they respond strongly to pairs of stimuli, specifically, the fundamental FM component of the pulse paired with an FM component of one of the higher harmonics of the echo. We call these neurons FM1-FM, facilitation neurons. There are three separate longitudinal clusters in this cortical area containing FM1-FM2, FM1-FM3, and FMI-FM4 neurons, respectively. Moreover, FMI-FM, neurons are specifically sensitive to the time delay between the two FM components, i.e., the time delay of the echo from the pulse. Thus, they can decode target range.
Two types of delay-sensitive neurons were found. Tracking neurons, whose response to echo delay varied according to repetition rate and stimulus duration, were found rarely. Delay-tuned neurons, which were tuned to specific time delays (best delays) of the echo from the pulse, were much more evident. Both types of neurons are organized into columns with similar best delays, and the best delay of delay-tuned neurons was found to increase systematically along the cortical surface in the rostrocaudal direction. This area, therefore, contains a neural representation of target range along this best delay axis. Such an axis exists in each of the clusters of FMI-FMz, FM]-FM3, and FMI-FM4 neurons. This is a new type of cortical organization which is not tonotopic but which represents an important acoustic cue related to the time course of acoustic events.
Acoustic signals can be described in terms of physical parameters, such as frequency, amplitude, and time. In mammals, vocal signals are composed typically of dis- crete utterances called phonemes, which are ordered in
’ This work was supported by National Science Foundation Grants BMS 75-17077 and BNS 78-12987 to N. S. W. E. 0. wishes to thank the faculty of the Sensory Physiology group for postdoctoral training
received under the auspices of the Sensory Physiology Training Grant (National Institute of Neurological and Communicative Disorders and
Stroke Grant l-T32-NS07057-01) administered through the Depart- ment of Physiology and Biophysics, Washington University Medical School. We are indebted to James Jaeger for technical assistance, Peter
Wasserbach for the design and construction of the harmonic generators used in these experiments, and Nancy Dintruff and Mary Lee Stein of the University of Rochester for preparing the manuscript.
time to convey information. Although the temporal pat- terns within phonemes and their sequences in the acous- tic stream carry much of the total information in vocali- zations, research in mammalian audition has focused mainly on the analysis and representation of frequency in the auditory system. That the cochlea is primarily a frequency analyzer (von B6k6sy, 1960) probably accounts for much of this emphasis. Another factor in favor of this bias is the relative ease of generation and the physical simplicity of pure tone stimuli for investigating the prop- erties of the auditory system.
* To whom correspondence should be addressed at his present ad-
dress: Center for Brain Research, University of Rochester Medical
A major result of this endeavor has been to show that central auditory organization is dominated by the reca- pitulation of the morphology of the sensory epithelium, i.e., the organ of Corti. Mapping of peripheral organiza- tion onto the central nervous system is a property com- mon to the visual and somatosensory systems as well.
School, Rochester, NY 14642. For audition, the representation of frequency along the

18 O’Neill and Suga Vol. 2, No. 1, Jan. 1982
co&ear partition is repeated throughout the central auditory system by tonotopic representation. Despite its pervasiveness, the functional significance of tonotopic representation in the cerebral cortex remains obscure, except perhaps for certain species of bats (Suga and Jen, 1976; Ostwald, 1980).
Since auditory information can be carried by several different parameters in sounds, the auditory cortex is likely to be involved in analysis of other acoustic features besides frequency. In this paper, we address directly the representation of temporal information in the central auditory system of the mustached bat, Pteronotus par- nellii rubiginosus. By comparing these results with a previous investigation of frequency representation in the same species (Suga and Jen, 1976; Suga and Manabe, 1982), we show that these two important parameters, time and frequency, are represented separately in the auditory cortex.
In echolocation, it has been shown that the time inter- val between an emitted biosonar signal and the returning echo conveys information about the distance to a target (Simmons, 1971, 1973). Variations in the timing of these acoustic events are very important for successful echo- location. Consequently, echo ranging is a suitable model for investigating the processing of time-varying signals in the mammalian auditory system. We have reported pre- viously that the auditory cortex of the mustached bat contains an area (the FM-FM area) where neurons are specialized to respond to combinations of frequency-mod- ulated (FM) signals and presumably are concerned di- rectly with encoding target range information (O’Neill and Suga, 1979; Suga et al., 1978; Suga and O’Neill, 1979). In this paper, we report in much greater detail on the response properties and functional organization of neu- rons in the FM-FM area in the mustached bat, an area which is not tonotopically organized but contains neurons that encode pulse-echo time intervals related to target range. Furthermore, we provide additional evidence that these neurons are organized along a systematic neural axis representing target range (Suga and O’Neill, 1979).
Most species of bats used in studies of neural range coding are so-called “FM bats,” which employ brief, downward-sweeping FM sounds during target approach. The mustached bat, on the other hand, emits trains of more complex biosonar signals, each pulse containing a long, constant frequency (CF) component followed by a brief, downward-sweeping FM component. Each such CF-FM pulse contains up to four harmonics (Hr to H4). Of these, the second harmonic at around 61 kHz is predominant (see Fig. 1). The mustached bat holds the frequency of the CF under tight control at a value typical for the individual bat, but, during a process called “Doppler shift compensation,” the pulse frequency is reduced in direct proportion to the magnitude of the Doppler shift imparted to the echo by relative motion between the bat and an approaching target (Schnitzler, 1970). In long CF-FM bats, overlap of the CF components of pulse and echo always occurs in target pursuit and in Doppler shift compensation (Schuller, 1974; Schuller and Suga, 1976). CF sounds are excellent for echo detection and especially for analyzing movement, and modulations of the frequency and amplitude of CF portions of the echoes are probably used to sense relative velocity and
to detect animate (i.e., moving) targets (Schuller and Suga, 1976; Suga and Jen, 1977; Goldman and Henson, 1977; Pollak, 1980). Bats adjust the repetition rate and duration of their pulses to avoid overlap of the pulse FM components with the echo FM components, probably both to prevent masking and to obtain target information more rapidly when nearing interception. FM sounds are especially suited for localization, ranging, and character- ization of a target. In fact, the terminal FM component, as shown for all species so far examined, is used for ranging (Simmons, 1971, 1973). In this paper, we show that processing of different aspects of information de- rived from the CF and FM components is done in sepa- rate regions of the mustached bat cortex.
Materials and Methods
Sixteen Panamanian mustached bats, Pteronotus par- nellii rubiginosus,3 were prepared for extracellular re- cording from single neurons or clusters of two to three neurons in the auditory cortex. In a few initial experi- ments, surgery was performed under sodium pentobar- bital anesthesia (Nembutal, 30 mg/kg, i.p.); in subsequent experiments, the short-acting neuroleptanalgesic Inno- var-vet was used (0.08 mg/kg of Fentanyl, 4 mg/kg of droperidol, i.m.), which proved to be much better for the animal’s recovery. The large temporal muscles were re- flected surgically from their origins on the skull, the skull surface was cleaned, and a 1.5cm long nail was mounted on the skull using cyanoacrylate glue (Eastman 910) and acrylamide cement. The animal was allowed to recover for at least 2 days prior to the first experiments.
On the day of the experiment, the animal was placed in a double-walled sound-proofed, echo-attenuating chamber after we measured and recorded the frequency of the predominant second harmonic of the bat’s biosonar signal. The bat’s body was held in a restraint and sus- pended by elastic bands, while the nail on the skull was clamped in a holder to immobilize the head. The position of the head was adjusted to face the free field speaker. We performed all experiments without general anesthe- sia, administering the neuroleptic droperidol (4 mg/kg), when necessary, to reduce excessive movement. Manip- ulation of surgical wounds was preceded by application of local anesthetic (lidocaine). Throughout the experi- ment, the bats were given water liberally and sometimes fed mashed mealworms. Nearly all bats were used for a series of 6- to 12-hr recording sessions over a period of 1 to 6 weeks.
All recordings of neural activity were carried out using sharpened tungsten wire microelectrodes (5- to lo-pm tips) inserted by hydraulic microdrive into the cortex through small holes bored into the skull. An indifferent electrode was placed in contact with the dura mater through another hole distal to the recording site. Neu- ronal discharges were amplified (Grass P15), filtered (0.6 to 6.0 kHz bandpass, 24 dB/octave), and displayed on the screen of an oscilloscope. Action potentials exceeding an adjustable threshold voltage triggered a pulse generator (Tektronix 161), and the resulting uniform pulses were applied to the digital input of a signal processor (Nicolet
3 Pteronotus parnellii rubiginosus = Chilonycteris rubiginosa (Smith, 1972).

The Journal of Neuroscience Target Range Representation in Bat Auditory Cortex 19
a. Search b. Approach
.C 6o H, -----------3
\
CF2 \
b - FM2
\
5 b
: 30 - H, E", -------------7 -------7
-1 FM,’ ‘\ PHI ~-------\ \\
Terminal
Daiaynge) Pulse (P) - Echo(E)----
0 I I 1 1 I I I I I I I I
IO msec per division
Figure 1. Schematized sonagrams of the synthesized mustached bat biosonar pulses (P; solid lines) and echoes (E; dashed lines) mimicking three phases of target-oriented flight. The three harmonics of both the pulses (PII-;?) and the echoes (EHI& each contain a long CF component (CFl-n) followed by a short FM component (FMI-ZI). The fourth harmonic (I&) is not shown in the figure. a, Search phase; CF and FM durations are 30 and 4 msec, respectively. b, Approach phase; CF and FM durations are 15 and 3 msec. c, Terminal phase; CF and FM durations are 5 and 2 msec. Repetition rates for a, b, and c were always 10,40, and 100 pairs/set, respectively. The thickness of the lines indicates the relative amplitudes of each harmonic in the pulses and echoes: Hi is strongest, followed by H:% (-6 dB) and HI (-12 dB). Echo delay is measured as the time interval between the onsets of corresnondine comnonents of the nulse and the echo in a stimulus pair. (From O’Neill and Suga, 1979; used with permission from American Association for the Advancement of Science.)
1072). These same pulses were amplified by an audio monitor and also were used to modulate the brightness of the oscilloscope trace displaying recorded impulses, allowing audiovisual verification of the impulses being processed by the computer. Responses often were quan- tified from peristimulus time (PST) histograms gener- ated by the computer.
Stimulation. The stimulus delivery system consisted of a voltage-controlled waveform generator (Wavetek 115 or 144), variable duration and rise/fall time electronic switch, and decade attenuator (Hewlett-Packard 350D). These produced shaped tone bursts (rise/fall times, 0.5 msec) in the usual fashion. Two such systems were employed to generate pairs of tone bursts simulating pulses and echoes. These were mixed, amplified (Krohn- Hite), and broadcast from a 2-inch-diameter electrostatic loudspeaker (+3 dB from 20 to 130 kHz) located 66 cm in front of the animal’s head. All stimulus amplitudes were measured by a calibrated G-inch microphone (Briiel and Kjaer 4135) placed at the same location as the bat’s head would be in the recording apparatus, and sound levels are expressed in decibels, sound pressure level (dB SPL; sound pressure level re: 2 x lo-” Pa).
Inserted between the oscillator and electronic switch in each of these systems was a circuit which multiplies the oscillator frequency to generate the second and third harmonics. Therefore, we could produce stimulus pairs containing one, two, or three harmonics, in any combi- nation, to mimic the harmonic structure of the bat’s biosonar signal. Complex or simple stimuli of this sort could be used to analyze each neuron’s response selectiv- ity.
To simulate the FM component of the bat’s signal, we applied a ramp voltage to the voltage-controlled genera- tor input of the wave generator to produce a linear FM sweep. We restricted the bandwidth of the FM sweep to values similar to natural biosonar signals: 6, 12, 18, and 24 kHz for the four possible harmonics.
Whenever we delivered stimulus pairs that included all
three harmonics, the amplitude ratios among the har- monics of the individual stimuli were set at values typical of mustached bat pulses; i.e., the first and third harmon- ics were, respectively, 12 and 6 dB lower than the pre- dominant second harmonic.
To simulate more accurately the dynamic conditions of target pursuit, we produced these synthesized pulse- echo stimuli at three repetition rates and durations typ- ical of the search, approach, and terminal phases of mustached bat echolocation (Table I).
Approach and terminal phase stimuli were gated to produce trains of about 500 msec, repeated one per set, to reduce neural “fatigue.” In nature, the durations of the approach and terminal phases are typically 180 and 50 msec, respectively (Novick and Vaisnys, 1964).
Because of the complexity of mustached bat biosonar signals, as well as the stimuli used in the study to mimic their signals, we have introduced a shorthand notation to refer to the various components in these sounds (Suga et al., 1978). These are depicted in Figure 1, which shows pairs of sounds referred to as “pulses” (P) or “echoes” (E). A pulse produced by a bat may consist of up to four harmonics, Hlm4, each of which always contains a constant frequency (CF) component followed immedi- ately by a frequency-modulated (FM) component. The individual CF and FM components of each harmonic are appropriately subscripted (e.g., FM2 is the FM compo- nent of Hz, CFI is the CF component of HI (the funda- mental), and so on). In a similar fashion, an echo also may contain up’to four harmonics, which also can be referred to as CFle4-FMlm4 (i.e., H1-4) or simply as “E.” In all cases, where we needed to distinguish between pulse and echo components, we used prefixes “P” or “E.” In our papers, “P-E” always indicates a pair of CF-FM sounds that are harmonically complex like naturally oc- curring pulses and echoes. P and E are usually also distinguished by their differences in frequency due to Doppler shifts in the echo and by their relationship in time.
20 O’NeiU and Suga Vol. 2, No. 1, Jan. 1982
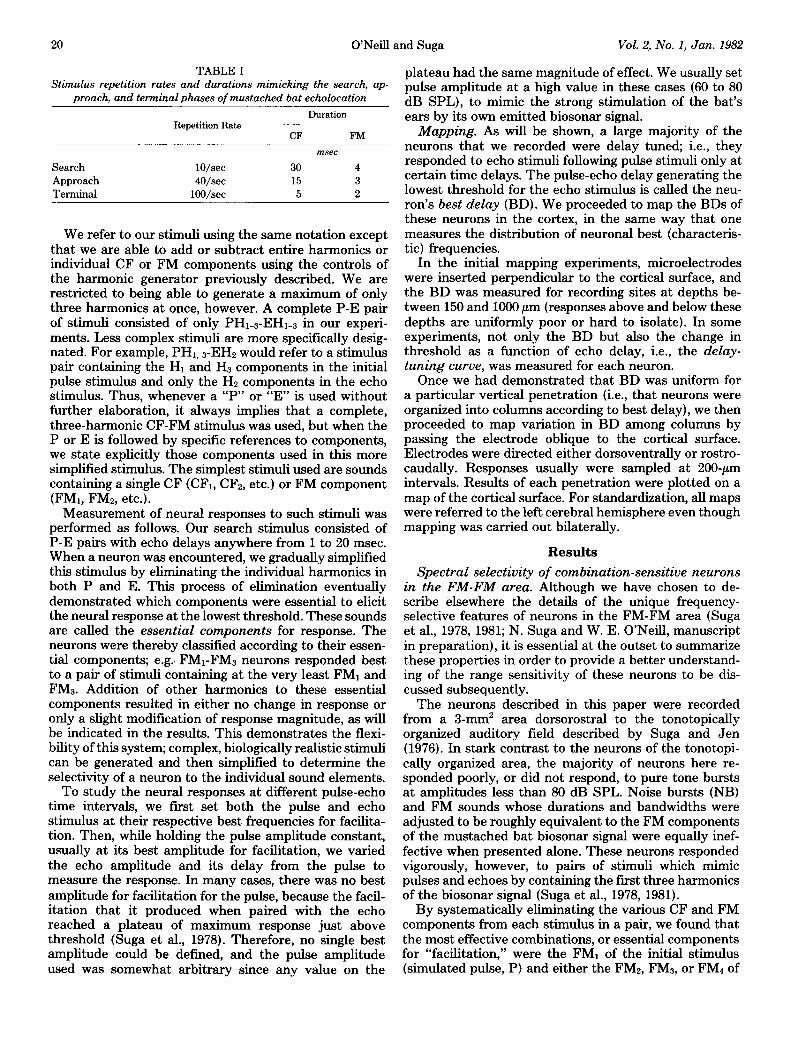
TABLE I Stimulus repetition rates and durations mimicking the search, ap-
proach, and terminal phases of mustached bat echolocation
Duration Repetition Rate
CF FM
msec
Search
Approach Terminal
lO/sec
IO/set lOO/sec
30 4
15 3 5 2
We refer to our stimuli using the same notation except that we are able to add or subtract entire harmonics or individual CF or FM components using the controls of the harmonic generator previously described. We are restricted to being able to generate a maximum of only three harmonics at once, however. A complete P-E pair of stimuli consisted of only PHI-3-EHI-3 in our experi- ments. Less complex stimuli are more specifically desig- nated. For example, PHI, S-EHz would refer to a stimulus pair containing the HI and Hs components in the initial pulse stimulus and only the HP components in the echo stimulus. Thus, whenever a “P” or “E” is used without further elaboration, it always implies that a complete, three-harmonic CF-FM stimulus was used, but when the P or E is followed by specific references to components, we state explicitly those components used in this more simplified stimulus. The simplest stimuli used are sounds containing a single CF (CFI, CFZ, etc.) or FM component (FM*, FM2, etc.).
Measurement of neural responses to such stimuli was performed as follows. Our search stimulus consisted of P-E pairs with echo delays anywhere from 1 to 20 msec. When a neuron was encountered, we gradually simplified this stimulus by eliminating the individual harmonics in both P and E. This process of elimination eventually demonstrated which components were essential to elicit the neural response at the lowest threshold. These sounds are called the essential components for response. The neurons were thereby classified according to their essen- tial components; e.g.1 FMr-FM3 neurons responded best to a pair of stimuli containing at the very least FM1 and FMZ. Addition of other harmonics to these essential components resulted in either no change in response or only a slight modification of response magnitude, as will be indicated in the results. This demonstrates the flexi- bility of this system; complex, biologically realistic stimuli can be generated and then simplified to determine the selectivity of a neuron to the individual sound elements.
To study the neural responses at different pulse-echo time intervals, we first set both the pulse and echo stimulus at their respective best frequencies for facilita- tion. Then, while holding the pulse amplitude constant, usually at its best amplitude for facilitation, we varied the echo amplitude and its delay from the pulse to measure the response. In many cases, there was no best amplitude for facilitation for the pulse, because the facil- itation that it produced when paired with the echo reached a plateau of maximum response just above threshold (Suga et al., 1978). Therefore, no single best amplitude could be defined, and the pulse amplitude used was somewhat arbitrary since any value on the
plateau had the same magnitude of effect. We usually set pulse amplitude at a high value in these cases (60 to 80 dB SPL), to mimic the strong stimulation of the bat’s ears by its own emitted biosonar signal.
Mapping. As will be shown, a large majority of the neurons that we recorded were delay tuned; i.e., they responded to echo stimuli following pulse stimuli only at certain time delays. The pulse-echo delay generating the lowest threshold for the echo stimulus is called the neu- ron’s best delay (BD). We proceeded to map the BDs of these neurons in the cortex, in the same way that one measures the distribution of neuronal best (characteris- tic) frequencies.
In the initial mapping experiments, microelectrodes were inserted perpendicular to the cortical surface, and the BD was measured for recording sites at depths be- tween 150 and 1000 pm (responses above and below these depths are uniformly poor or hard to isolate). In some experiments, not only the BD but also the change in threshold as a function of echo delay, i.e., the delay- tuning curve, was measured for each neuron.
Once we had demonstrated that BD was uniform for a particular vertical penetration (i.e., that neurons were organized into columns according to best delay), we then proceeded to map variation in BD among columns by passing the electrode oblique to the cortical surface. Electrodes were directed either dorsoventrally or rostro- caudally. Responses usually were sampled at 200~pm intervals. Results of each penetration were plotted on a map of the cortical surface. For standardization, all maps were referred to the left cerebral hemisphere even though mapping was carried out bilaterahy.
Results
Spectral selectivity of combination-sensitive neurons in the FM-FM area. Although we have chosen to de- scribe elsewhere the details of the unique frequency- selective features of neurons in the FM-FM area (Suga et al., 1978, 1981; N. Suga and W. E. O’Neill, manuscript in preparation), it is essential at the outset to summarize these properties in order to provide a better understand- ing of the range sensitivity of these neurons to be dis- cussed subsequently.
The neurons described in this paper were recorded from a 3-mm2 area dorsorostral to the tonotopically organized auditory field described by Suga and Jen (1976). In stark contrast to the neurons of the tonotopi- tally organized area, the majority of neurons here re- sponded poorly, or did not respond, to pure tone bursts at amplitudes less than 80 dB SPL. Noise bursts (NB) and FM sounds whose durations and bandwidths were adjusted to be roughly equivalent to the FM components of the mustached bat biosonar signal were equally inef- fective when presented alone. These neurons responded vigorously, however, to pairs of stimuli which mimic pulses and echoes by containing the first three harmonics of the biosonar signal (Suga et al., 1978, 1981).
By systematically eliminating the various CF and FM components from each stimulus in a pair, we found that the most effective combinations, or essential components for “facilitation,” were the FM1 of the initial stimulus (simulated pulse, P) and either the FM2, FMz, or FM4 of

The Journal of Neuroscience Target Range Representation in Bat Auditory Cortex 21
the second stimulus (simulated echo, E). There was never facilitation when the FM1 component was deleted from the pulse; neither was there a response to pairs consisting only of PFM1-EFM,. This selectivity was unaffected by the addition of CF components at any frequency, inten- sity, and duration. The responses to stimulus pairs con- taining the essential components consisted of a single burst of impulses to each pair, following the echo FM component (EFM) with a latency of 5 to 10 msec, de- pending on the neuron. Since the response to the echo component was facilitated by the presence of a preceding FMI, we have called these neurons collectively FjlJl-FM, facilitation neurons (where n = 2, 3, or 4; Suga et al., 1978; O’Neill and Suga, 1979; Suga and O’Neill, 1979).
FMI-FM2 neurons are selective for a pair of sounds: the first sweeping downward from about 30 to 24 kHz (FMI) and the second sweeping from about 62 to 50 kHz (FMZ; the exact frequency values of the best FM stimuli are different for each neuron although the bandwidths of the stimuli were held constant). Likewise, FMI-FM3 neu- rons are selective for an echo FM sweeping typically from about 93 to 75 kHz, and FMI-FMd neurons are selective for an echo FM sweeping from about 124 to 100 kHz. The frequency relationships of the PFM, and EFM, were usually nonharmonic, and in nearly all cases, the best facilitation frequency of the FM1 stimulus was lower than the frequency predicted by calculating the funda- mental of the essential echo FM, component. This may well be an adaptation to Doppler shift compensation which is used by this species to keep the echo CF2 component from moving targets in a narrow frequency band around 61 kHz (Schnitzler, 1970; Schnitzler and Henson, 1980; W. E. O’Neill and N. Suga, unpublished observations).
As we have already implied, a particular time delay between the PFMi and EFM, stimuli is necessary to elicit maximal facilitation of response. This sensitivity to time interval variations led us to investigate systemati- cally the responses of FMI-FM, neurons to changes in pulse-echo delay.
Responses of FMl-FM,, facilitation neurons as a func- tion of echo delay. By delivering either or both of the essential components, or all three harmonics of simulated pulse and echo stimuli, and by varying the time interval between them, we measured the responses of 405 FM1- FM,, neurons to conditions mimicking targets at different distances.
To illustrate the way in which neurons in the FM-FM area responded to different time delays between pulse and echo, PST histograms of the response of an FMI- FM2 facilitation neuron are shown in Figure 2. As illus- trated by the histograms in the top two ranks of the figure, the neuron did not respond when presented with P or E alone at any of the three repetition rates (A = lO/ set; B = 40/set; C = lOO/sec). When P and E were presented as a pair of stimuli with no time interval between them at a rate of lO/sec (E delay = 0 msec), there was also no response (Fig. 2A). This holds also for the other two repetition rates. However, when E was progressively delayed from P, responses to the pairs became stronger as a function of echo delay, reaching a maximum at 6.5 to 7.0 msec echo delay. At lO/sec,
A B
Soarch Approach
P------“- a. e&-A=--
C
Terminal
._..
2 --- -. -“.. ->’ 2 3.. .-
,oMg-.; &CL ,. ..-+h-$de 9.5--
NO ,6- ._ -- _..._ L* ., _. ,6--. :.. . __
’ sti. .. ‘- --- .---F-Y- o.&----- - - - - ._______
R.R.: IO/set 4O/SCiC lOO/sec
Dur.: 30+4 mrec 15+3 5+2 B.W.: 0.2 mrec 0.1 0.1
PH,:29.30 kHz. 52dB SPL Sample: 200 EH+ 60.75 .49 FM,-FM2 UA
Pll-17-78-W
Figure 2. Peristimulus time (PST) histograms of the response of an FM]-FM2 facilitation neuron to pulse-echo stimulus pairs as a function of echo delay. Stimuli were delivered at repetition rates and durations simulating the search (A, lO/sec), approach (B, 40/set), and terminal phases (C, lOO/sec). PSTs in the first two ranks in each condition show the responses to the complete (three harmonics) pulse (P) and the complete echo (E) pre- sented alone. All others show the responses to pairs of P and E sounds at various echo delays. Maximum responses occur at 6.8 to 7.0 msec echo delay at each repetition rate. a.s., time markers of the pulse in the stimulus or stimulus pairs; R.R., repetition rate of stimulation; Dur., duration of the CF and FM compo- nents, respectively; B. IV., bin width in milliseconds of the PST histograms; Sample, the number of stimulus repetitions pre- sented for each PST histogram. UA indicates an unanesthetized preparation. Frequency and amplitude of essential harmonics are given at the bottom. No sti., histogram of spontaneous activity (no stimulus).
responses could be detected at echo delays from 2 to 16 msec at this stimulus amplitude (49 dB SPL re: EH2).
In response to shorter duration stimulus pairs delivered at 40/set (approach phase, Fig. 2B), the maximum re- sponse elicited from this neuron was again at an echo delay of 7.0 msec. When compared to the responses at lO/sec, there is some loss of responsiveness, or a narrow- ing of the temporal selectivity, at delays of 2 or 16 msec.
At 100 stimulus pairs/set (terminal phase, Fig. 2C), the neuron still responded with extraordinary vigor, with a response maximum at 6.8 msec echo delay. Some shifting of the range of the echo delays eliciting responses to shorter values is evident from the increase in responses to 4 msec echo delay and the decrease in response at 9.5 msec echo delay when compared to 10 or 40/set. Never- theless, the echo delay eliciting greatest response re- mained at 6.8 to 7.0 msec at all three repetition rates and corresponding stimulus durations.
The P-E stimulus pairs contained a total of six CF and

22 O’Neill and Suga Vol. 2, No. 1, Jan. 1982
FM components. However, the essential components for facilitation of this neuron were found to be PFMl and EFMZ. The best FM1 and FM2 for facilitation swept from 29.30 to 23.30 kHz and from 60.75 to 48.75 kHz, respec- tively. At these frequencies, the best EH2 was 2.15 kHz greater than PH2 (29.3 x 2 = 58.6 kHz); i.e. the neuron responded best to an echo Doppler-shifted by an ap- proaching target. The measured resting frequency (no Doppler compensation) of this bat was 60.3 to 60.8 kHz. This neuron would be most active for echoes for which compensation had already occurred.
Also important for this response was the amplitude relationship between PFMl and EFMZ. For maximum response, the amplitudes of PFMl and EFMz were 52 and 49 dB SPL, respectively. No facilitation occurred when these components were made much more intense.
Figure 3 illustrates the responses of a different FMI- FM2 neuron in which maximum facilitation occurred at a much shorter echo delay. In this experiment, only the essential harmonics, PHI and EH2, were presented. As in the aforementioned neuron of Figure 2, this neuron did not respond when PHI or EH2 was presented alone regardless of amplitude, duration, and repetition rate, nor did it respond to PHI-EHz pairs with 0 msec delay. When a delay between PHI and EH2 was introduced, however, the neuron responded to each pair. The maxi- mum response was obtained at 4 to 5 msec EHz delay. As repetition rate increased, there was some shrinking of
EH2
Se&h c
EW------ delay mr*c
0
2’ *; ‘.’
5 i .
Al
* 6 .,. ;,
,. ,,,_ ?. _ .;
a. r.I R. R.: lO/sec Dur.: 30*4 msec
B. W.: 0.2 mrec
b c Approach Terminal
-
”
4O/sec lOO/sec
1513 5*2 0.1 0.1
PH,: 30.5-24.5 kHz. 56 dB SPL Sample: 100 EH,: 63.6~ 5 1.6 . 61 “A (PC,-16-78-26)
Figure 3. PST histograms of the responses of an FM,-FM2 neuron selective for echo delays of 3.2 to 4.0 msec. Note the similarity of the response of this neuron to that shown in Figure 2, except that the echo delay eliciting the maximum response is shorter. In this case, the number of stimulus presentations was 100 for each histogram, and only the essential harmonics, PH, and EH2, are used as stimuli. Stimulus frequency and amplitude of the essential harmonics are given at the bottom of the figure. The abbreviations used are defined in the legend to Figure 2.
the range of delays to which the unit responded, and maximum response shifted slightly to 3.2 msec.
As was the case in the neuron described in Figure 2, this neuron also is “preadapted” to respond to Doppler- shifted echoes. In the neuron of Figure 3, the best EFM, was 2.6 kHz greater than the calculated PH2. Measured resting frequency of the bat was 60.7 to 61.0 kHz. In contrast to the previous neuron, which would fire maxi- mally when the bat had already compensated for the echo Doppler shift, this neuron would be most likely to respond to echoes prior to compensation when the bat was still emitting pulses near its resting frequency.
As shown in Figures 2 and 3, FMI-FM, neurons com- monly produced discharges which were well synchronized to the time course of the paired stimuli delivered at lOO/ sec. However, such stimulus-locked responses are not necessary to decode echo delay. In Figure 6B, for in- stance, the neuron responded best to P-E pairs with a 1.5-msec echo delay in spite of the lack of a clear stimu- lus-locked discharge pattern. In striking contrast, its re- sponse to P-E pairs with 0- or 4.5-msec echo delays is quite poor.
In order to quantify the change in response of FMI- FM, neurons to echo delay, we measured the threshold for facilitation as a function of delay, i.e., a delay-tuning curue, in 43 neurons. Best delay (BD) then could be defined as that echo delay to which the neuron was most sensitive (had the lowest threshold). In this way, we found two different types of delay-sensitive neurons, tracking and delay-tuned neurons (O’Neill and Suga, 1979; Suga et al., 1978). In tracking neurons, both the shape of the delay-tuning curve and the best delay changed as the repetition rate and stimulus durations were changed. Two examples of this are shown in Figure 4. Notice that, in both cases, the delay-tuning curves for both 10 and 40/set repetition rates are fairly broad and U shaped. At lOO/sec, the curves become much narrower and V shaped. In both of these neurons as well as in nearly all others of this type, the sharpening of the delay- tuning curves occurs through a change in sensitivity to echo delays greater than BD, while the curves remain roughly the same for echo delays less than BD. Also typical was an increase in minimum threshold by about 10 dB at the high repetition rate. In all neurons of this type, where the BD varied with repetition rate, BD always became shorter as the repetition rate increased. This characteristic would act to maintain responsiveness in these units to the shortening of echo delay occurring as the bat closes on a target.
The more common delay-tuned neurons had much less variable BDs and sharper delay-tuning curves. Fig- ure 5 shows three examples of delay-tuned neurons. The neuron in Figure 5A had BDs of 1.2 to 1.6 msec at all three standard repetition rates; that is, it is tuned to 1.2- to 1.6-msec echo delays regardless of the repetition rate and duration of the stimuli. The delay-tuning curves are somewhat different for echo delays greater than BD, since they are broader at lO/sec than at either 40 or lOO/ sec. At lOO/sec, the tuning is very sharp, and the neuron was clearly nonmonotonic. In fact, upper thresholds ap- peared in the response; i.e., when the echo was above 72 dB SPL, the neuron no longer responded. This is called a “closed” tuning curve. In spite of this variability in the

The Journal of Neuroscience Target Range Representation in Bat Auditory Cortex 23
lP4-23-79-51
FM,- FM, 3 UA lPl-as-78-\71
16 24 0 4 a 12
Echo delay in msec
Figure 4. Delay-tuning curves of two tracking neurons. In both cases, measurements of the echo threshold as a function of delay from the pulse stimulus were made using complete P-E stimuli. The three curves in each graph represent the delay-tuning curve measured at repetition rates of lO/sec (A), 40/set (O), and lOO/sec (0). Frequency and amplitude parameters are given for each on the right of the figure. A6-7 indicates the measurements were made 6 to 7 hr after administration of Innovar-vet. UA, unanesthetized preparation.
shape of the curves, we still consider this neuron delay tuned because of the constancy of the BD.
Figure 5B shows a delay-tuned neuron with a constant BD and nearly similar delay-tuning curves. The BD of this neuron was 1.5 and 1.2 msec at 40 and lOO/sec, respectively. (Measurements were unable to be taken at lO/sec.) BDs this short were nearly always correlated with sharp delay-tuning curves and, very often, closed tuning curves.
Figure 5C illustrates the delay-tuning curves of yet another delay-tuned neuron, whose BDs at 10 and 40/ set were 8 and 7.2 msec, respectively. The delay-tuning curves are closed and very similar in shape and are considerably broader than those measured for the neuron in Figure 5B. As will be demonstrated elsewhere, this again shows that neurons with longer BDs also had broader delay-tuning curves. At lOO/sec, the response of this neuron (Fig. 5C) was still evident, despite its long BD, but was so reduced that a delay-tuning curve could not be measured with accuracy. The area in which clear responses were seen is shown by the hatched rectangle in the figure, located at a delay of 7.5 msec and ampli- tudes between 40 and 50 dB SPL. Very often, neurons with long BDs showed this type of response at lOO/sec; others were found with BDs longer than 9 to 10 msec, which did not respond at all to stimuli at this rate.
Even though there are distinct differences among the delay-tuning curves of different neurons, the common characteristic of delay-tuned neurons is the stability of both the BDs and the shapes of the curves at different repetition rates. Our operational definition for calling a neuron “delay tuned” was that its BD varied 1 msec or less at the three repetition rates used in our study. However, delay-tuned neurons with long BDs responded poorly, if at all, to stimulus pairs at lOO/sec (e.g., Fig. 5C). In most cases, this was because, at this rate, the time interval between repetitions of the P stimulus (10 msec)
was shorter than the BD. At lOO/sec, for example, an echo delayed by 12 msec from the pulse is also actually 2 msec delayed from the subsequent pulse. If the neuron’s BD is 12 msec, then a 2-msec echo delay elicits no response. This problem can be avoided only by lowering the repetition rate or shortening the pulses. As we have mentioned, bats carefully avoid overlap of pulse and echo FM components. Since small targets must be as close as 50 cm (echo delay, 2.9 msec) before the mustached bat begins the terminal phase buzz, responding at high rep- etition rates is normally irrelevant to neurons with long BDs. In these cases, if the BD varied by 1 msec or less for 10 and 40/set stimulation, the neuron also was clas- sified as delay tuned.
The inclusion of the nonessential components in com- plete P-E stimulus pairs did not alter the BD appreciably, but it sometimes reduced the magnitude of facilitation observed when only the essential components were em- ployed. We therefore wondered what differences the nonessential components might produce in the overall delay sensitivity of these neurons. The PST histograms of Figure 6 illustrate the responses of a neuron to different echo delays when presented with P-E pairs (Fig. 6, A and B) as compared to pairs of the essential components, PHI-EH2, only (Fig. 60. At lO/sec repetition rate, the response is already quite diminished at only 3.5 msec echo delay for the P-E pairs (A) in contrast to the clear responses at this delay when using only the essential components (C). The excitation produced by complete P or E stimuli alone (A, top) is also noticeably less than that produced by PHI or EH2 stimuli alone (C, top). The BD of this neuron is very short, 1.5 msec. Consequently, facilitation is noticeable at the suprathreshold echo am- plitude employed (54 dB SPL for EH3 even at 0 msec delay.
Figure 7 illustrates the changes that complete P-E pairs can bring about in the delay-tuning curves. In each

24 O’Neill and Suga Vol. 2, No. 1, Jan. 1982
/ PHi
0 0 4 8 12 f 80. I I I f B
2
0 4 8 12
Echo delay in msec
Figure 5. Delay-tuning curves of three delay-tuned neurons. In these neurons, BD varies by no more than 1 msec at different repetition rates. All are FM,-FM2 facilitation neurons. Values of frequency and amplitude of stimulus pairs used to measure the curves are to the right of each figure. Data at lO/sec were not obtained for the neuron in B because its BD was 0.8 msec nor at lOO/sec for the neuron in C because its response at this rate was so poor. The hatched rectangle indicates the echo delay and amplitude eliciting the greatest responses. A, lO/sec repetition rate; 0, 40/set repetition rate; 0, lOO/sec repetition rate. UA, unanesthetized preparation.
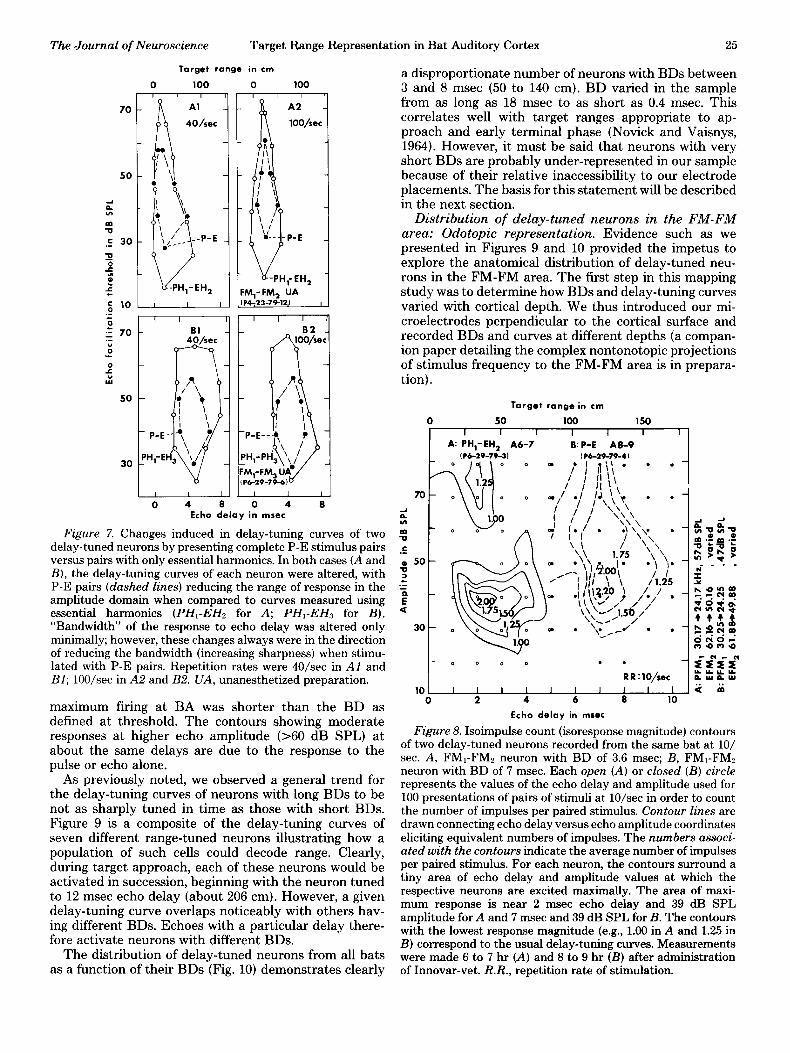
case, the complete P-E pairs generated a delay-tuning curve which was sharper than its counterpart measured only with pairs of essential components, both at 40/set (Fig. 7, Al and BZ) and at lOO/sec (Fig. 7, A2 and B2). Even more noticeable than the change in sharpness is the shrinking of the dynamic range for echo amplitude: the neurons had higher thresholds and were much more strongly nonmonotonic using P-E pairs. Thus, under presumably more natural multiharmonic stimulus config- urations, these neurons become more selective not only for target range but also for echo amplitude (related to subtended target angle). The two cases shown here are examples of delay-tuned neurons tuned to nearby (Fig. 7, Al and A2; BD = 1.5 msec) and moderately distant (Fig. 7, Bl and B2; BD = 4.3 msec) targets.
Many delay-tuned neurons exhibited nonmonotonic responses and even upper thresholds to echo amplitude (e.g., Figs. 4.4, 5, and 7). In Figure 8, we demonstrate this phenomenon quantitatively in two neurons by plotting the isoimpulse count contours, which connect values of delay and amplitude of the echo eliciting equivalent numbers of action potentials.
The neuron of Figure 8B was stimulated using com- plete P and E pairs. This neuron’s response contours show strong amplitude tuning, with a clear best ampli- tude (BA) for facilitation at about 40 dB SPL. In this case, the delay associated with maximum response at BA is the same as the BD, 7.0 msec. At 40 dB SPL, the delay-tuning curve is rather broad, extending nearly to 10 msec. Notice, however, the sharp decline in response magnitude at 40 dB SPL for echo delays less than 7 msec. This sharp cut-off is an excellent example of how even neurons with long BDs can be highly sensitive to small changes in echo delay.
Figure 8A shows a neuron tuned to 3.5 msec delay. The contours circumscribe a peak of maximum response (average 2.0 impulses/stimulus pair) at an echo ampli- tude of 40 dB SPL and an echo delay of 2.0 msec. Thus, 40 dB SPL can be considered the neuron’s best amplitude for facilitation. It is interesting to note that, in this case, the BD as defined by the neuron’s minimum threshold is different from the delay eliciting maximum response at the unit’s BA. This characteristic in the delay tuning is not unique to this neuron alone, since two others out of eight whose responses were measured in this way also exhibited this shift. In these cases, the delay eliciting
A B C
E ii-? - :I:-:.‘___ . EY.. . . . . . p
P-E E delay
./‘,. ;. -_ __, -. 4.5-
a.rl w II R.R.: 1 O/set lOO/sec lO/sec
FM,: 30.24+24.24 kHz, 47dB SPL FM,- FM, UA F& 63.73’51.73 I 54 P4-23-79-12
Scamp.: 200
Figure 6. PST histograms showing the sharpening of delay tuning in delay-tuned neurons when presented with complete P-E pairs versus pairs containing only essential harmonics. A (lO/sec) and B (lOO/sec) sequences were obtained using com- plete P-E pairs. Maximum response is obtained at 1.5 msec echo delay at both repetition rates. Facilitation responses are no longer visible at delays more than 3.5 msec. In contrast, stimulus pairs (lO/sec) with only essential harmonics (PHI- EHJ elicit stronger responses over a broader echo delay range, well beyond 4.5 msec delay (C). The delay eliciting maximum response remains the same as with P-E pairs (1.5 msec). Re- sponses to stimuli presented alone are presented in the top two ranks of the histograms. N = 200 samples/histogram. The abbreviations used are defined in the legend to Figure 2.
The Journal of Neuroscience Target Range Representation in Bat Auditory Cortex 25
Target range in cm
0 100 0 100
I ‘̂ I ’ ‘II ‘̂ I ’ 1
30
-- 0 4 0 0 4 8
Echo delay in mrec
Figure 7. Changes induced in delay-tuning curves of two delay-tuned neurons by presenting complete P-E stimulus pairs versus pairs with only essential harmonics. In both cases (A and B), the delay-tuning curves of each neuron were altered, with P-E pairs (dashed lines) reducing the range of response in the amplitude domain when compared to curves measured using essential harmonics (PHI-EH2 for A; PHI-EHz for B). “Bandwidth” of the response to echo delay was altered only minimally; however, these changes always were in the direction of reducing the bandwidth (increasing sharpness) when stimu- lated with P-E pairs. Repetition rates were 40/set in Al and Bl; lOO/sec in A2 and B2. UA, unanesthetized preparation.
maximum firing at BA was shorter than the BD as defined at threshold. The contours showing moderate responses at higher echo amplitude (>60 dB SPL) at about the same delays are due to the response to the pulse or echo alone.
As previously noted, we observed a general trend for the delay-tuning curves of neurons with long BDs to be not as sharply tuned in time as those with short BDs. Figure 9 is a composite of the delay-tuning curves of seven different range-tuned neurons illustrating how a population of such cells could decode range. Clearly, during target approach, each of these neurons would be activated in succession, beginning with the neuron tuned to 12 msec echo delay (about 206 cm). However, a given delay-tuning curve overlaps noticeably with others hav- ing different BDs. Echoes with a particular delay there- fore activate neurons with different BDs.
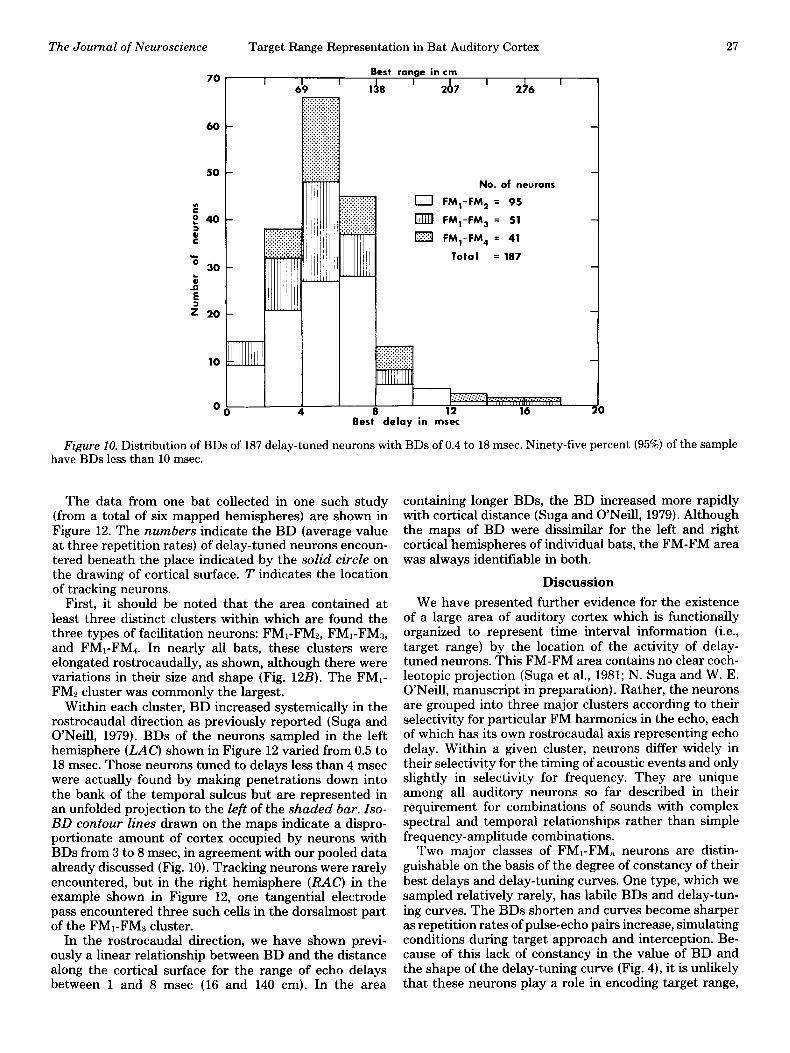
The distribution of delay-tuned neurons from all bats as a function of their BDs (Fig. 10) demonstrates clearly
a disproportionate number of neurons with BDs between 3 and 8 msec (50 to 140 cm). BD varied in the sample from as long as 18 msec to as short as 0.4 msec. This correlates well with target ranges appropriate to ap- proach and early terminal phase (Novick and Vaisnys, 1964). However, it must be said that neurons with very short BDs are probably under-represented in our sample because of their relative inaccessibility to our electrode placements. The basis for this statement will be described in the next section.
Distribution of delay-tuned neurons in the FM-FM area: Odotopic representation. Evidence such as we presented in Figures 9 and 10 provided the impetus to explore the anatomical distribution of delay-tuned neu- rons in the FM-FM area. The first step in this mapping study was to determine how BDs and delay-tuning curves varied with cortical depth. We thus introduced our mi- croelectrodes perpendicular to the cortical surface and recorded BDs and curves at different depths (a compan- ion paper detailing the complex nontonotopic projections of stimulus frequency to the FM-FM area is in prepara- tion).
Target range in cm
II I A: PH,-EH, A6-7 A: PH,-EH, A6-7 ii: P-E .A&9 ii: P-E .A&9 lP6-29-793) I P6-29-79-l)
0 0 0 0 0 0 0 0 . . . .
RR:lO/sec RR:lO/sec
101 I I I I I I I I I I IV ii 0 2 4 6 8 10
Echo delay in msec
Figure 8. Isoimpulse count (isoresponse magnitude) contours of two delay-tuned neurons recorded from the same bat at lO/ sec. A, FM,-FM, neuron with BD of 3.6 msec; B, FM,-FM, neuron with BD of 7 msec. Each open (A) or closed (B) circle represents the values of the echo delay and amplitude used for 100 presentations of pairs of stimuli at lO/sec in order to count the number of impulses per paired stimulus. Contour lines are drawn connecting echo delay versus echo amplitude coordinates eliciting equivalent numbers of impulses. The numbers associ- ated with the contours indicate the average number of impulses per paired stimulus. For each neuron, the contours surround a tiny area of echo delay and amplitude values at which the respective neurons are excited maximally. The area of maxi- mum response is near 2 msec echo delay and 39 dB SPL amplitude for A and 7 msec and 39 dB SPL for B. The contours with the lowest response magnitude (e.g., 1.00 in A and 1.25 in B) correspond to the usual delay-tuning curves. Measurements were made 6 to 7 hr (A) and 8 to 9 hr (B) after administration of Innovar-vet. R.R., repetition rate of stimulation.

26 O’Neill and Suga Vol. 2, No. 1, Jan. 1982
Target range in cm
0 I I I I I I I
4 a 12
Echo delay in mrec
Figure 9. Delay-tuning curves of seven delay-tuned neurons measured at either 40/set (0) or lOO/sec (0) repetition rates. These curves were not all measured from a single animal but are simply drawn together here to demonstrate that populations of delay-tuned neurons can parcel out echo delays and, therefore, target ranges. The smaller the BD, the narrower are the delay- tuning curves.
Each perpendicular penetration was characterized by neurons tuned to the same essential components in the pulse and echo and having nearly the same delay sensi- tivity. Figure 11A illustrates the delay-tuning curves of four neurons encountered at 2OO+m intervals in a single perpendicular penetration. All were FM]-FM3 special- ized. BDs measured at 10 (a), 40 (b), and 100 (c)/set remained near 4 msec for three of the four neurons. The exception was rather broadly delay tuned and it’s BD was 2.5 msec at 10 and 40/set. Tuning in time (i.e., the boundaries of the delay-tuning curves) was much more consistent from neuron-to-neuron than was the tuning for echo amplitude as seen by the greater variation in the upper thresholds. This variation of amplitude sensi- tivity with depth requires further study. The BDs of all of these neurons varied by 1 msec or less at the three different repetition rates of stimulus pairs and thus met our operational definition for delay-tuned neurons.
Figure 11B illustrates the BDs of neurons encountered in three different penetrations. In the penetration of the right graph (P12-4-79-P9), BDs recorded from the cell nearest the surface were nearly the same at all three repetition rates. All other neurons recorded at 200~pm intervals throughout the depth of the cortex had BDs
which differed depending on repetition rate by more than 1 msec; i.e., they are clearly all tracking neurons. As is typical for most perpendicular penetrations, at each re- cording site, the BDs at each repetition rate vary only slightly from the average value for the entire sample. The penetration in the center graph (P12-14-78-P7) con- taining tracking neurons with a less extensive BD shift also shows good agreement within the column for the BD values. The neurons recorded in another penetration (P12-4-78-Pl in the left graph) are all delay tuned, and except for the neuron recorded at 800 pm, they all were tuned to about 4 msec echo delay. All such perpendicular penetrations indicated that BD is consistent throughout the cortical column at each repetition rate and that there are at least two types of columns representing either delay-tuned or tracking neurons.
Because delay-tuned columns are distinct from track- ing columns and nearly all neurons within such columns have similar BDs and delay- tuning curves, we then could make tangential penetrations to study the distribution of delay-tuned columns in the plane of the cortex. According to our definition, BDs had to vary 1 msec or less to qualify a neuron as delay tuned. All others were classified as tracking neurons.
The Journal of Neuroscience Target Range Representation in Bat Auditory Cortex
Best range in cm I I I
69 118 I I I
27 276 I
No. of neurons
0 F/$-FM, = 95
m FM,-FM, = 51
m FM,+,“,, = 4,
Tota I = 187
Best delay in msec
27
Figure 10. Distribution of BDs of 187 delay-tuned neurons with BDs of 0.4 to 18 msec. Ninety-five percent (95%) of the sample have BDs less than 10 msec.
The data from one bat collected in one such study (from a total of six mapped hemispheres) are shown in Figure 12. The numbers indicate the BD (average value at three repetition rates) of delay-tuned neurons encoun- tered beneath the place indicated by the solid circle on the drawing of cortical surface. T indicates the location of tracking neurons.
First, it should be noted that the area contained at least three distinct clusters within which are found the three types of facilitation neurons: FMI-FM2, FMI-FM3, and FM1-FM4. In nearly all bats, these clusters were elongated rostrocaudahy, as shown, although there were variations in their size and shape (Fig. 12B). The FM1- FM2 cluster was commonly the largest.
Within each cluster, BD increased systemically in the rostrocaudal direction as previously reported (Suga and O’Neill, 1979). BDs of the neurons sampled in the left hemisphere (LAO shown in Figure 12 varied from 0.5 to 18 msec. Those neurons tuned to delays less than 4 msec were actually found by making penetrations down into the bank of the temporal sulcus but are represented in an unfolded projection to the left of the shaded bar. Iso- BD contour lines drawn on the maps indicate a dispro- portionate amount of cortex occupied by neurons with BDs from 3 to 8 msec, in agreement with our pooled data already discussed (Fig. 10). Tracking neurons were rarely encountered, but in the right hemisphere (RAC) in the example shown in Figure 12, one tangential electrode pass encountered three such cells in the dorsalmost part of the FMI-FM3 cluster.
In the rostrocaudal direction, we have shown previ- ously a linear relationship between BD and the distance along the cortical surface for the range of echo delays between 1 and 8 msec (16 and 140 cm). In the area
containing longer BDs, the BD increased more rapidly with cortical distance (Suga and O’Neill, 1979). Although the maps of BD were dissimilar for the left and right cortical hemispheres of individual bats, the FM-FM area was always identifiable in both.
Discussion
We have presented further evidence for the existence of a large area of auditory cortex which is functionally organized to represent time interval information (i.e., target range) by the location of the activity of delay- tuned neurons. This FM-FM area contains no clear coch- leotopic projection (Suga et al., 1981; N. Suga and W. E. O’Neill, manuscript in preparation). Rather, the neurons are grouped into three major clusters according to their selectivity for particular FM harmonics in the echo, each of which has its own rostrocaudal axis representing echo delay. Within a given cluster, neurons differ widely in their selectivity for the timing of acoustic events and only slightly in selectivity for frequency. They are unique among all auditory neurons so far described in their requirement for combinations of sounds with complex spectral and temporal relationships rather than simple frequency-amplitude combinations.
Two major classes of FM1-FM, neurons are distin- guishable on the basis of the degree of constancy of their best delays and delay-tuning curves. One type, which we sampled relatively rarely, has labile BDs and delay-tun- ing curves. The BDs shorten and curves become sharper as repetition rates of pulse-echo pairs increase, simulating conditions during target approach and interception. Be- cause of this lack of constancy in the value of BD and the shape of the delay-tuning curve (Fig. 4), it is unlikely that these neurons play a role in encoding target range,

28 O’Neill and Suga Vol. 2, No. 1, Jan. 1982
A-
J c :lOO/se
iI only those delay-sensitive neurons whose BD varied 1 msec or less. The relative independence of these response
B
properties from variations in pulse-echo repetition rate and duration dissociates them from such features of the bat’s vocal behavior during target approach. They are,
/’ therefore, capable of encoding echo delay regardless of pulse rate and duration and, consequently, can be consid- ered range tuned.
Although there are neurons whose BD and delay-tun- ing curve features are somewhat intermediate between
0 4 8 0 4 8 0 4 the archetypical tracking and delay-tuned neuron, we, at Echo delay in msec present, feel justified in considering them to be two
B O Pn-4- different neuronal classes on the basis of BD constancy
zrP’ PlZ-14-7B-P7 PlZ-4-79-P9 PlZ-4-79-P9 alone. We made this decision first from the fact that
2 k-l O.A
i’ A
0 a
OAe o .A o .A I
delay-sensitive neurons with constant BDs (range tuned) also tended to have narrower delay-tuning curves whose shapes were independent of pulse-echo repetition rate. Secondly, in mapping the FM-FM area, we found clear rostrocaudal organization of the BD values of delay-
A
OeA A
0 4 0 4 8 12 0 4 8 12
Best delay in msec
Figure 11. Delay tuning as a function of cortical depth. A, Delay-tuning curves of four FMI-FM3 neurons measured at 200- e intervals in a single perpendicular penetration at repetition rates of lO/sec (a), 40/set (b), and lOO/sec (c). BD remains nearly the same in a, b, and c, but there are some changes in the curves, especially in c. Bandwidths of the curves are rela- tively similar at each repetition rate, while the lower and upper thresholds vary. B, BDs measured at three repetition rates for neurons recorded in three different orthogonal electrode pene- trations as a function of cortical depth. The penetration on the left is through a column of delay-tuned neurons. Penetrations depicted in the middle and right panels are through columns of tracking neurons. Note that, in each, BDs are generally the same for each neuron in the column. A, lO/sec; 0, 40/set; 0, lOO/sec.
although their response to echoes is clearly delay depen- dent. Their most interesting characteristic is the appar- ent ability to “track” an approaching target while simul- taneously “rejecting” echoes from more distant targets which also are approaching but are not the object of interest; hence the tentative label, tracking neuron, with the caveat that the function implied by such a name requires further, more detailed study.
The necessity of such a response for the bat’s successful Pl-10-79
orientation is not immediately obvious. At the very least, these neurons (and the delay-tuned neurons to be dis- Best delay in msec (BR=BDsl7.2cm)
cussed), represent a selective “gating” or “attention” mechanism tied both to a specific motor activity (vocal-
Figure 12. Distribution of BDs in the tangential plane of the FM-FM areas in both hemispheres of a single bat. The numbers
ization) and to the time course of incoming sensory refer to BDs measured at the locations indicated (solid circle) information. Delay-sensitive neurons could focus the by multiple rostrocaudal tangential penetrations. Three or four bat’s “view” mainly on the target while simultaneously clusters of neurons were found in the left &AC) and right reducing the effect of potentially confusing echo images (RAC, reversed) hemispheres, respectively, which contained
received from other obiects. exclusively FMI-FM3, FM,-FM4, or FM,-FM2 neurons. Iso-BD
The other type of delay-sensitive neuron, the delay- contours are drawn by interpolation between recording sites on
tuned neurons, comprised the large majority of neurons the maps to indicate how BD increases in the rostrocaudal
that we encountered in the FM-FM area. They are direction in each hemisphere and within each cluster. Samples
distinguished by the constancy of both BD and delay- taken to the left of the hatched bar were obtained by penetra-
tuning curves. Operationally, we included in this group tions made into the sulcal fold. Note the disproportionately large area representing BD from 2 to 8 msec. BR, best range.
A:LAC ,b H - u 4 , within , , ,q
Rest* \ B:RAC & - - - 6
Reversed ,q4*3 4.* 1l 8 vent.
/1 \&
T’\
6.0 - \ r’J0
The Journal of Neuroscience Target Range Representation in Bat Auditory Cortex 29
tuned neurons, while tracking neurons were found rarely (their locations require further study).
These response property differences have quite differ- ent consequences for echo processing during target ap- proach as well. Nearly all tracking neurons would be active regardless of the actual echo delay (target range) during the search and early approach stages. The U- shaped delay-tuning curves of tracking neurons are mod- ified by changes in repetition rate to maintain nearly maximum sensitivity to echoes occurring during a broad time period between emissions of the FM components of successive biosonar signals. In contrast, range-tuned neu- rons are only able to respond to echoes when the target is at or very near a particular distance corresponding to the BD. Thus, an individual range-tuned neuron would be activated only during a limited period of time during actual target pursuit. Feng et al. (1978) have found range- sensitive neurons in the nucleus intercollicularis (pericen- tral nucleus of the inferior colliculus) of the FM bat Eptesicus fuscus. Sullivan (1981) also has recently found range-sensitive neurons in the auditory cortex of the FM bat Myotis lucifugus. Therefore, target range information is processed eventually by range-sensitive neurons re- gardless of whether the biosonar signals employed are of the CF-FM or FM type.
Adaptations of FMI-FM,, neurons to range encoding. Many aspects of the response properties of FM,-FM, neurons illustrate adaptations for range processing. In regard to their frequency tuning, we have shown else- where (Suga et al., 1978) that the tuning curves for facilitation of these neurons are not sharp for either PFM, or the EFM component. For both components, the essential FM sweeps may vary over a fairly broad range and still elicit facilitation. Thus, the decoding of the range information contained in pulse-echo time intervals is at least partly protected from spectral variations in both the emitted pulses and returning echoes. During Doppler shift compensation, target range processing may continue without interference from irrelevant changes in pulse or echo frequency.
The spectral selectivity for FM, as the initial sound in a stimulus pair suggests that vocal self-stimulation by this component could act as a “primer” for subsequent response to an echo. A possible advantage for the use of the first harmonic component as a reference for measur- ing echo delays is the reduction of the possibility of jamming by the biosonar signals of nearby conspecifics. Sound spectrographs made in our laboratory indicate that the emitted H1 component is weak, usually 12 to 24 dB lower in amplitude than the predominant Hz com- ponent. Perhaps Hi is suppressed by vocal tract anti- resonance mechanisms. It is possible that HI is dissipated into the tissues and that the ears receive stimulation by H1 via bone conduction, while the pulses of other bats would reach the ears with insufficient H1 energy to stimulate the FMi-FM, neurons. The ranging mechanism would thereby be relatively immune to conspecific jam- ming (Suga and O’Neill, 1979). Circumstantial support for this hypothesis can be derived from the lack of any delay-sensitive neurons responding to echo FM, compo- nents, i.e., FMi-FM1 neurons. Detailed further studies of this problem are obviously necessary.
Another advantage that can be cited is related to the
suppression of Hi in the emitted sounds and the detect- ability of the bat by tympanate moths. Fenton and Ful- lard (1979) showed that many tympanate moths hear best at 20 to 30 kHz and that those species of bats emitting echolocation signals at higher frequencies than this have a theoretical advantage in approaching insect prey. By suppressing the 30-kHz fundamental, the mus- tached bat may be able to approach these prey species much more closely before being detected.
Effects of nonessential components on the shape of the delay-tuning curve. One would predict, on the basis of traditional masking studies, that stimuli consisting only of essential components for facilitation would pro- duce sharper delay-tuning curves than stimuli containing both essential and nonessential components. It was sur- prising to observe quite the contrary in our experiments on this issue (Fig. 7). Complete P-E pairs shrink both the dynamic range for echo amplitude and, to a lesser extent, the width of the delay-tuning curve. Total response mag- nitude of the neuron is normally reduced by the complete P-E stimulus, and this probably accounts for the increase in the unit’s time and amplitude selectivity. The lowered overall evoked activity may, in fact, be the result of masking of their echo counterparts by the loud HZ or HB components in the pulse. Doppler shifts in the echo and Doppler shift compensation would in any case minimize this masking in normal situations. This implies that our measurements of delay-tuning curves using only the es- sential pulse-echo components are conservative esti- mates of the true shape of the delay-tuning curve.
Target range resolution. Given that echo amplitude is within the response range of the neuron, the resolution of target range by individual range-tuned neurons de- pends on the temporal selectivity of the delay-tuning curve and the degree of change in response magnitude as a function of small changes of echo delay. By looking at delay-tuning curves of range-tuned neurons (e.g., Fig. 9), one can readily see that the selectivity decreases as a function of the BD. Temporal resolution by single neu- rons, therefore, is much better at close range. As a bat approaches a target, its estimate of target range should improve both because the echo is subjected to sharper delay-tuning curves and because the bat increases the number of range estimates per unit time by raising its pulse repetition rate. The behavioral data of Novick and Vaisnys (1964) on mustached bats indicate that the ap- proach phase to small objects may involve as few as two or three pulse emissions. The necessity for rapid range estimation is most obvious in these conditions, and an array of range-tuned “filters” is ideally suited to the task.
Along the odotopic axis of the cortex, we found a disproportionately large number of neurons tuned to echo delays between 3 and 8 msec. In a previous paper (Suga and O’Neill, 1979), we calculated that the maxi- mum resolution of distance at the single neuron level would be 2.0 cm; this corresponds to an average BD increment of 0.06 msec from one neuron to another in the rostrocaudal direction (interneuronal distance is about 20 pm). This assumes, of course, that range reso- lution is related to the increment in BD along the range axis. A calculated resolution of 2.0 cm correlates rather well with the older behavioral data obtained by Simmons (1971) for range discrimination in different species of long

30 O’Neill and Suga Vol. 2, No. 1, Jan. 1982
CF-FM and FM bats. It does not agree, however, with his more recent behavioral data (Simmons, 1979) from FM bats, which show range discrimination of only 0.1 mm (fully two orders of magnitude better than previous measurements of FM bats). We are unaware, at this time, of data from any level of the auditory system demonstrat- ing neural mechanisms which may account for this new estimate.
Implications of the repetition of the odotopic axis in each FM,-FM,, cluster. Novick (1977), in discussing the possible function of harmonics in biosonar signals, sug- gested that they might allow bats to exploit a wider variety of prey sizes. The independent clusters of FM,- FM2, FM]-FM:%, and FM,-FM4 neurons, each of which contains an odotopic axis, now provide us with neural evidence for such a possibility. In addition, signal theory suggests that FM signals with harmonics are capable of providing less ambiguous target range estimates. The mustached bat has, in effect, broadened the bandwidth of its signal by emitting multiple harmonics. The horse- shoe bat, in contrast, emits long CF-FM signals in a single harmonic (Hz), with an FM component bandwidth of only 10 to 12 kHz. Simmons (1971) found that horse- shoe bats do not discriminate range differences as well as bats using only broad band FM signals but that the performance was, in both cases, predicted by the FM bandwidth in the pulse. One wonders whether the mus- tached bat has overcome this apparent handicap of CF- FM bats by exploiting the multiple harmonics and would thereby discriminate range better than the horseshoe bat.
The processing of temporal information in the audi- tory system. For most animals, including man, the tem- poral sequence of meaningful sounds is critical to their recognition. The apparent existence of phonetic “boundaries” for the perception of certain consonant- vowel transitions in man (Liberman et al., 1967) and synthetic speech-like sounds in man (Miller et al., 1976) and in animals (Kuhl, 1976) has implied the operation of “feature detectors” acting as filters for certain temporal relationships in the spectra of such sounds. Recent evi- dence challenging the concept of strict laterality of speech processing in man is based on evidence that the processing of rapid changes in spectral features of speech sounds (e.g., frequency modulations or transitions) is carried out primarily in the left hemisphere, while pro- cessing of steady state sounds (e.g., vowels) shows no evidence of laterality (Schwartz and Tallal, 1980; Cutting, 1973).
The delay-sensitive neurons described here as well as those shown by Feng et al. (1978) and Suga et al. (1978) are the first examples of “temporal filters” existing at the single neuron level in the auditory system. In the mus- tached bat, these filters extract only the time interval information between 2 of the 16 spectral components (PFM] and EFM,) within a complex sound (P-E) for echo ranging. We have presented evidence elsewhere (Suga et al., 1979) that neurons in the CF/CF cortical area are sensitive to specific harmonic (but not temporal) relationships in complex sounds, and as such, they might be useful models for analyzing the formant or overtone content in complex sounds. Important time-dependent and overtone-dependent auditory perceptions may be
subserved by just such neurons in other species, e.g., in the bullfrog Rana catesbeiana (Mudry and Capranica, 1978). We respectfully suggest that future work in higher auditory centers incorporate complex, biologically sig- nificant stimuli capable of exciting these types of cells.
The representation of acoustic space in the auditory cortex: An example of nontonotopic functional organi- zation. Indirect evidence that tonotopic organization has functional significance is provided by the recent discov- ery of nontonotopically organized auditory areas in owls and bats. Knudsen and Konishi (1978) found that a portion of the auditory midbrain (MLD) of the barn owl (Tyto alba) is not tonotopically organized. Rather, neu- rons in this “space-mapped” region, by having spatially restricted receptive fields, are selective for the location of sounds around the 0~1)s head (Konishi and Knudsen, 1978). These neurons are organized into an orderly map of acoustic space so that a sound’s position is represented by the specific location of activity in the nucleus. Adja- cent to this region is another subdivision of the MLD which is clearly tonotopically organized. More impor- tantly, the space map is generated by neural interaction, not by the topography of the peripheral receptors.
The data that we have presented here demonstrate organization related to another cue for sound localization, namely range or depth perception. The neurons of the FM-FM area are so unique in their response properties that one cannot discuss their frequency selectivity in the usual terms. Pure tone stimuli are ineffective in driving these neurons, and no tonotopic axis is evident. The only clear organization discovered so far is the systematic change in delay tuning of neurons along the cortical surface. Here again, the brain represents, through a place mechanism, a map of auditory space. If these nontono- topic areas are functionally significant, then one may infer as a corollary that tonotopically organized areas also must have functional significance. The discovery of bands of aural dominance columns running perpendicular to isofrequency contours (Imig and Adrian, 1977; Middle- brooks et al., 1980) eventually may provide insight into the functional significance of tonotopic organization in cats. The significance of tonotopic organization in rela- tion to cat (and monkey) behavior unfortunately remains obscure despite the many studies already published. However, the significance of tonotopic organization in relation to target movement analysis is now recognized in the mustached bat (Suga and Jen, 1976) and horseshoe bat (Ostwald, 1980).
The coexistence of areas organized according to best frequency adjacent to areas organized according to some other parameter in both the barn owl and mustached bat is a significant discovery in the auditory system. This suggests that there are at least two, and probably more, subdivisions of the auditory system specialized for pro- cessing different aspects of sound. The idea of parallel, semi-independent “transmission lines” subserving differ- ent “processors” decoding incoming information is not new, since modern fiber tracing techniques have shown many separate pathways beginning at the level of the cochlear nuclei and ramifying throughout the higher auditory system. Strong electrophysiological evidence also supports this view of parallel processing in the auditory pathway. In hindsight, it is not surprising that

The Journal of Neuroscience Target Range Representation in Bat Auditory Cortex 31
this functional segregation exists, since it would be un- reasonable to suggest that an undifferentiated, tonotop- ically organized system is alone responsible for auditory perception because individual neurons do not appear able to decode even a few of the many different parameters associated with complex sounds. Rather, our evidence suggests that specific types of analyses are performed by discrete populations of neurons specialized for encoding only a small set of acoustic parameters. Our task, then, is to determine how different aspects of sound, which are individually analyzed in discrete regions of the brain, are integrated eventually into a perception of sound in space.
The behavioral specialization found in bats and owls has permitted correlation of the function of specific “processing areas” in their auditory systems with the animal’s behavior. As a consequence, we propose that the traditional approach to the study of the auditory system be modified. Emphasis should be placed on the search for areas organized for the analysis of more com- plex, behaviorally relevant acoustic parameters rather than just for areas analyzing pure tones, clicks, or noise bursts. It seems quite unlikely that the auditory systems of these two species are unique, and it is perhaps not too bold at this time to predict that specialized processing areas will be found in the auditory systems of other species as well.
References Cutting, J. E. (1973) A parallel between degree of encodedness
and the ear advantage: Evidence from an ear monitoring task. J. Acoust. Sot. Am. 53: 368.
Feng, A. S., J. A. Simmons, and S. A. Kick (1978) Echo detection and target-ranging neurons in the auditory system of the bat, Eptesicus fuscus. Science 202: 645-648.
Fenton, M. B., and J. H. Fullard (1979) The influence of moth hearing on bat echolocation strategies. J. Comp. Physiol. 132: 77-86.
Goldman, L. J., and 0. W. Henson (1977) Prey recognition and selection by the constant frequency bat, Pteronotus p. par- nellii. Behav. Ecol. Sociobiol. 2: 411-419.
Imig, T. J., and H. 0. Adrian (1977) Binaural columns in the primary field (Al) of cat auditory cortex. Brain Res. 138: 241-257.
Knudsen, E. I., and M. Konishi (1978) Space and frequency are represented separately in the auditory midbrain of the owl. J. Neurophysiol. 41: 870-884.
Konishi, M., and E. I. Knudsen (1978) Center-surround orga- nization of auditory receptive fields in the owl. Science 202: 778-780.
Kuhl, P. (1976) Speech perception by the chinchilla: Categorical perception of synthetic alveolar plosive consonants. J. Acoust. Sot. Am. 60: 5581 Abstr.
Liberman, A. M., F. S. Cooper, D. P. Shankweiler, and M. &udder&Kennedy (1967) Perception of the speech code. Psychol. Rev. 74: 431-461.
Middlebrooks, J. C., R. W. Dykes, and M. M. Merzenich (1980) Binaural response-specific bands in primary auditory cortex (AI) of the cat. Topographical organization orthogonal to isofrequency contours. Brain Res. 181: 31-48.
Miller, J., C. Weir, R. Pastore, W. Kelly, and R. Dooling (1976) Discrimination and labelling of noise-buzz sequences with varying noise-lead times: An example of categorical percep- tion. J. Acoust. Sot. Am. 60: 410-417.
Mudry, K. M., and R. R. Capranica (1978) Electrophysiological evidence for auditory responsive areas in the diencephalon and telencephalon of t,he bullfrog, kana catesbeiana. Sot. Neurosci. Abstr. 4: 101.
Novick, A. (1977) Acoustic orientation. In Biology of Bats, W. A. Wimsatt, ed., Vol. III, pp. 74-289, Academic Press, New York.
Novick, A., and R. Vaisnys (1964) Echolocation of flying insects by the bat, Chilonycterisparnellii. Biol. Bull. 128: 297-314.
O’NeiU, W. E., and N. Suga (1979) Target range-sensitive neurons in the auditory cortex of the mustached bat. Science 203: 69-73.
OstwaId, J. (1980) The functional organization of the auditory cortex in the CF-FM bat, Rhinolophus ferrumequinum. In Animal Sonar Systems, R. -G. Busnel and J. F. Fish, eds., pp. 953-956, Plenum, New York.
PoIIak, G. D. (1980) Organizational and encoding features of single neurons in the inferior colliculus of bats. In Animal Sonar Systems, R. -G. Busnel and J. F. Fish, eds., pp. 549- 587, Plenum, New York.
SchnitzIer, H. -U. (1970) Echoortung bei der Fledermaus Chi- lonycteris rubiginosa. Z. Vegl. Physiol. 68: 25-38.
Schnitzler, H. -U., and 0. W. Henson (1980) Performance of airborne animal sonar systems. I. Microchiroptera. In Animal Sonar Systems, R. -G. Busnel and J. F. Fish, eds., pp. 109- 182, Plenum, New York.
SchulIer, G. (1974) The role of overlap of echo with outgoing orientation sound in the bat Rhinolophus ferrumequinum. Naturwissenschaften 4: 171-172.
Schuller, G., and N. Suga (1976) Storage of Doppler-shift infor- mation in the echolocation system of the “CF-FM” bat Rhinolophus ferrumequinum. J. Comp. Physiol. 105: 9-14.
Schwartz, J., and P. Tallal (1980) Rate of acoustic change may underlie hemispheric specialization for speech perception. Science 207: 1380-1381.
Simmons, J. A. (1971) The sonar receiver of the bat. Ann. N. Y. Acad. Sci. 188: 161-174.
Simmons, J. A. (1973) The resolution of target range by echo- locating bats. J. Acoust. Sot. Am. 54: 157-173.
Simmons, J. A. (1979) Perception of echo phase information in bat sonar. Science 204: 1336-1338.
Smith, J. D. (1972) Systematics of the Chiropteran Family Mormoopidae, miscellaneous publication, University of Kan- sas, Museum of Natural History, No. 56, Lawrence, KS.
Suga, N., and P. H. -S. Jen (1976) Disproportionate tonotopic representation for processing CF-FM sonar signals in the mustached bat auditory cortex. Science 194: 542-544.
Suga, N., and P. H. -S. Jen (1977) Further studies on the peripheral auditory system of CF-FM bats specialized for fine frequency analysis of Doppler-shifted echoes. J. Exp. Biol. 69: 207-232.
Suga, N., and T. Manabe (1982) Neural basis of amplitude- spectrum representation in the auditory cortex of the mus- tached bat. J. Neurophysiol., in press.
Suga, N., and W. E. O’Neill (1979) Neural axis representing target range in the auditory cortex of the mustached bat. Science 206: 351-353.
Suga, N., W. E. O’Neill, and T. Manabe (1978) Cortical neurons sensitive to combinations of information-bearing elements of biosonar signals in the mustache bat. Science 200: 778-781.
Suga, N., W. E. O’NeiIl, and T. Manabe (1979) Harmonic- sensitive neurons in the auditory cortex of the mustached bat. Science 203: 270-274.
Suga, N., K. Kuzirai, and W. E. O’NeiIl (1981) How biosonar information is represented in the bat cerebrum. In Neuronal Mechanisms in Hearing, J. Syka, ed., pp. 197-220, Plenum, New York.
Sullivan, W. E., III (1981) Cortical representation of target distance information in the auditory system of the echolocat- ing bat, Myotis Zucifugus. Doctoral dissertation, Neurosci- ence Program, Washington University, St. Louis, MO.
von B6k6sy, G. (1960) Experiments in Hearing, McGraw-Hill, New York.
Related Documents