Journal of Chromatography A, 1363 (2014) 226–235 Contents lists available at ScienceDirect Journal of Chromatography A jo ur nal ho me pag e: www.elsevier.com/locate/chroma Enantiomeric fraction evaluation of pharmaceuticals in environmental matrices by liquid chromatography-tandem mass spectrometry Ana Rita Ribeiro a,b,c , Lúcia H.M.L.M. Santos d,e , Alexandra S. Maia a,b , Cristina Delerue-Matos d , Paula M.L. Castro b , Maria Elizabeth Tiritan a,c,∗ a CESPU, Instituto de Investigac ¸ ão e Formac ¸ ão Avanc ¸ ada em Ciências e Tecnologias da Saúde, Rua Central de Gandra, 1317, 4585-116 Gandra PRD, Portugal b CBQF - Centro de Biotecnologia e Química Fina–Laboratório Associado, Escola Superior de Biotecnologia, Universidade Católica Portuguesa/Porto, Rua Dr. António Bernardino Almeida, 4200-072 Porto, Portugal c Centro de Química Medicinal da Universidade do Porto (CEQUIMED-UP), Laboratório de Química Orgânica e Farmacêutica, Departamento de Ciências Químicas, Faculdade de Farmácia, Universidade do Porto, Rua de Jorge Viterbo Ferreira, 228, 4050-313 Porto, Portugal d REQUIMTE, Instituto Superior de Engenharia do Porto, Instituto Politécnico do Porto, Rua Dr. António Bernardino de Almeida, 431, 4200-072 Porto, Portugal e CIIMAR/CIMAR–Interdisciplinary Centre of Marine and Environmental Research, Laboratory of Environmental Toxicology, University of Porto, Rua dos Bragas, 289, 4050-123 Porto, Portugal a r t i c l e i n f o Article history: Received 7 April 2014 Received in revised form 19 June 2014 Accepted 30 June 2014 Available online 8 July 2014 Keywords: LC-MS/MS Chiral pharmaceuticals Enantiomeric fraction Macrocyclic antibiotic CSP Chirobiotic V a b s t r a c t The interest for environmental fate assessment of chiral pharmaceuticals is increasing and enantiose- lective analytical methods are mandatory. This study presents an enantioselective analytical method for the quantification of seven pairs of enantiomers of pharmaceuticals and a pair of a metabolite. The selected chiral pharmaceuticals belong to three different therapeutic classes, namely selective serotonin reuptake inhibitors (venlafaxine, fluoxetine and its metabolite norfluoxetine), beta-blockers (alprenolol, bisoprolol, metoprolol, propranolol) and a beta 2 -adrenergic agonist (salbutamol). The analytical method was based on solid phase extraction followed by liquid chromatography tandem mass spectrometry with a triple quadrupole analyser. Briefly, Oasis® MCX cartridges were used to preconcentrate 250 mL of water samples and the reconstituted extracts were analysed with a Chirobiotic TM V under reversed mode. The effluent of a laboratory-scale aerobic granular sludge sequencing batch reactor (AGS-SBR) was used to validate the method. Linearity (r 2 > 0.99), selectivity and sensitivity were achieved in the range of 20–400 ng L −1 for all enantiomers, except for norfluoxetine enantiomers which range covered 30–400 ng L −1 . The method detection limits were between 0.65 and 11.5 ng L −1 and the method quan- tification limits were between 1.98 and 19.7 ng L −1 . The identity of all enantiomers was confirmed using two MS/MS transitions and its ion ratios, according to European Commission Decision 2002/657/EC. This method was successfully applied to evaluate effluents of wastewater treatment plants (WWTP) in Portugal. Venlafaxine and fluoxetine were quantified as non-racemic mixtures (enantiomeric frac- tion / = 0.5). The enantioselective validated method was able to monitor chiral pharmaceuticals in WWTP effluents and has potential to assess the enantioselective biodegradation in bioreactors. Further applica- tion in environmental matrices as surface and estuarine waters can be exploited. © 2014 Elsevier B.V. All rights reserved. 1. Introduction Pharmaceuticals in the environment have been extensively investigated in the last two decades [1–6]. However, the concern ∗ Corresponding author at: Rua Central de Gandra, 1317, 4585-116 Gandra PRD, Portugal. Tel.: +351 224 157 204; fax: +351 224 157 102. E-mail addresses: [email protected], [email protected] (M.E. Tiritan). about the stereochemistry of chiral pharmaceuticals (CP) in the environment is more recent. The majority of publications con- cerning pharmaceuticals in the environment consider the pair of enantiomers as a unique molecular entity [7]. Enantiomers have different interactions with chiral molecules (e.g. enzymes) lead- ing to different biological responses, affecting differently living organisms. The enantioselectivity in ecotoxicity and biodegra- dation processes is evident and comparable to the events in medical/biomedical fields [7]. The degradation of CP can be enantioselective or enantiospecific and their occurrence in the environment may be as a single or as mixtures of the two http://dx.doi.org/10.1016/j.chroma.2014.06.099 0021-9673/© 2014 Elsevier B.V. All rights reserved.

Welcome message from author
This document is posted to help you gain knowledge. Please leave a comment to let me know what you think about it! Share it to your friends and learn new things together.
Transcript
Em
ACa
b
Ac
Qd
Pe
B
a
ARRAA
KLCEMC
1
i
P
(
h0
Journal of Chromatography A, 1363 (2014) 226–235
Contents lists available at ScienceDirect
Journal of Chromatography A
jo ur nal ho me pag e: www.elsev ier .com/ locate /chroma
nantiomeric fraction evaluation of pharmaceuticals in environmentalatrices by liquid chromatography-tandem mass spectrometry
na Rita Ribeiroa,b,c, Lúcia H.M.L.M. Santosd,e, Alexandra S. Maiaa,b,ristina Delerue-Matosd, Paula M.L. Castrob, Maria Elizabeth Tiritana,c,∗
CESPU, Instituto de Investigac ão e Formac ão Avanc ada em Ciências e Tecnologias da Saúde, Rua Central de Gandra, 1317, 4585-116 Gandra PRD, PortugalCBQF - Centro de Biotecnologia e Química Fina–Laboratório Associado, Escola Superior de Biotecnologia, Universidade Católica Portuguesa/Porto, Rua Dr.ntónio Bernardino Almeida, 4200-072 Porto, PortugalCentro de Química Medicinal da Universidade do Porto (CEQUIMED-UP), Laboratório de Química Orgânica e Farmacêutica, Departamento de Ciênciasuímicas, Faculdade de Farmácia, Universidade do Porto, Rua de Jorge Viterbo Ferreira, 228, 4050-313 Porto, PortugalREQUIMTE, Instituto Superior de Engenharia do Porto, Instituto Politécnico do Porto, Rua Dr. António Bernardino de Almeida, 431, 4200-072 Porto,ortugalCIIMAR/CIMAR–Interdisciplinary Centre of Marine and Environmental Research, Laboratory of Environmental Toxicology, University of Porto, Rua dosragas, 289, 4050-123 Porto, Portugal
r t i c l e i n f o
rticle history:eceived 7 April 2014eceived in revised form 19 June 2014ccepted 30 June 2014vailable online 8 July 2014
eywords:C-MS/MShiral pharmaceuticalsnantiomeric fractionacrocyclic antibiotic CSP
hirobiotic V
a b s t r a c t
The interest for environmental fate assessment of chiral pharmaceuticals is increasing and enantiose-lective analytical methods are mandatory. This study presents an enantioselective analytical methodfor the quantification of seven pairs of enantiomers of pharmaceuticals and a pair of a metabolite. Theselected chiral pharmaceuticals belong to three different therapeutic classes, namely selective serotoninreuptake inhibitors (venlafaxine, fluoxetine and its metabolite norfluoxetine), beta-blockers (alprenolol,bisoprolol, metoprolol, propranolol) and a beta2-adrenergic agonist (salbutamol). The analytical methodwas based on solid phase extraction followed by liquid chromatography tandem mass spectrometrywith a triple quadrupole analyser. Briefly, Oasis® MCX cartridges were used to preconcentrate 250 mLof water samples and the reconstituted extracts were analysed with a ChirobioticTM V under reversedmode. The effluent of a laboratory-scale aerobic granular sludge sequencing batch reactor (AGS-SBR)was used to validate the method. Linearity (r2 > 0.99), selectivity and sensitivity were achieved in therange of 20–400 ng L−1 for all enantiomers, except for norfluoxetine enantiomers which range covered30–400 ng L−1. The method detection limits were between 0.65 and 11.5 ng L−1 and the method quan-tification limits were between 1.98 and 19.7 ng L−1. The identity of all enantiomers was confirmed usingtwo MS/MS transitions and its ion ratios, according to European Commission Decision 2002/657/EC.
This method was successfully applied to evaluate effluents of wastewater treatment plants (WWTP)in Portugal. Venlafaxine and fluoxetine were quantified as non-racemic mixtures (enantiomeric frac-tion /= 0.5). The enantioselective validated method was able to monitor chiral pharmaceuticals in WWTPeffluents and has potential to assess the enantioselective biodegradation in bioreactors. Further applica-tion in environmental matrices as surface and estuarine waters can be exploited.. Introduction
Pharmaceuticals in the environment have been extensivelynvestigated in the last two decades [1–6]. However, the concern
∗ Corresponding author at: Rua Central de Gandra, 1317, 4585-116 Gandra PRD,ortugal. Tel.: +351 224 157 204; fax: +351 224 157 102.
E-mail addresses: [email protected], [email protected]. Tiritan).
ttp://dx.doi.org/10.1016/j.chroma.2014.06.099021-9673/© 2014 Elsevier B.V. All rights reserved.
© 2014 Elsevier B.V. All rights reserved.
about the stereochemistry of chiral pharmaceuticals (CP) in theenvironment is more recent. The majority of publications con-cerning pharmaceuticals in the environment consider the pair ofenantiomers as a unique molecular entity [7]. Enantiomers havedifferent interactions with chiral molecules (e.g. enzymes) lead-ing to different biological responses, affecting differently livingorganisms. The enantioselectivity in ecotoxicity and biodegra-
dation processes is evident and comparable to the events inmedical/biomedical fields [7]. The degradation of CP can beenantioselective or enantiospecific and their occurrence in theenvironment may be as a single or as mixtures of the two
atogr
eeeutrtctt[e
Lcgbmmeadsntwefseef[osintap[ibwRLtaTar
seutoccim(aEet
A.R. Ribeiro et al. / J. Chrom
nantiomers. Unlike abiotic degradation, biodegradation can benantioselective and as such accurate methods to measure thenantiomeric fraction (EF) in the environment are crucial tonderstand the biodegradation process and to estimate eco-oxicity of CP. The enantioselectivity in ecotoxicity has beeneported; as examples, (S)-fluoxetine ((S)-FLX) is more toxico Daphnia magna and Pimephales promelas than (R)-FLX [8];hronic responses of P. promelas to propranolol (PHO) enan-iomers supported the hypothesis of higher toxicity of (S)-PHO;he beta-blocker atenolol (ATE) was studied by De Andrés et al.9], who found that (R)-enantiomer is more toxic than the (S)-nantiomer.
The most used technique for environmental analyses of CP isC-MS/MS [10–14] using chiral stationary phases (CSPs). Somelasses of CP, such as proton pump inhibitors [15,16], antifun-als [17], Non Steroid Anti-Inflammatory Drugs (NSAID) [18–21],eta-blockers [10,12,22–31] as well as antidepressants and theiretabolites [11–13,28–34], have been reported in environmentalatrices, concerning its enantiomers. Regarding antidepressants,
nantioselective biodegradation of venlafaxine (VNF) was found in French river, with racemic VNF at the output of the main WWTPischarging into the river and with EF variation along the rivertretch [11]. Enantiomers of FLX and its demethylated metaboliteorfluoxetine (NFLX) were found in Sweden, with the concen-ration of (S)-FLX higher than (R)-FLX in both raw and treatedastewaters [13,33]. VNF was detected in all influent and efflu-
nt samples of four WWTP in United Kingdom with decreasing EFrom influent to effluent [34]. The same authors reported in anothertudy the increasing of EF of VNF and ATE from influent to efflu-nt, indicating the enrichment of the (R)-ATE and the first elutingnantiomer of VNF [30]. VNF, PHO and ATE were detected with dif-erences in EF between effluent and river waters in United Kingdom31]. Most of the reported methods were developed to quantify onlyne therapeutic class; MacLeod et al. (2007) developed a referencetudy of enantiomeric quantification of multiclass pharmaceut-cals in the environment, including some beta-blockers (ATE, MET,adolol, pindolol, PHO, and sotalol), two selective serotonin reup-ake inhibitors (citalopram and FLX) and one beta2-adrenergicgonist (salbutamol (SBT)), with EF variation for most of the targetharmaceuticals between the influent and the effluent of WWTP28]. Later, MacLeod and Wong (2010) studied ten pharmaceut-cals from different therapeutic classes and observed EF differencesetween WWTP for citalopram, ATE, sotalol and temazepam asell as temporal changes in EF for all drugs except for sotalol [29].ecently, another multiclass pharmaceutical study developed byópez-Serna et al. (2013) reported the stereoselective transforma-ion of ATE in two WWTP and the predominance of (S)-PHO, (S)-FLXnd E2 of SBT in influent, effluent and surface water samples [12].herefore, the assessment of EF to evaluate the environmental riskssessment, fate and effects of CP in the environment, is urgentlyequired [7] and demanded by the scientific community [35].
This work presents a validated analytical method based onolid-phase extraction (SPE) with MCX cartridges, followed bynantioselective LC–MS/MS with electrospray ionization (ESI)sing a triple quadrupole mass analyser, for the quantifica-ion of seven enantiomeric pairs of chiral pharmaceuticals andne pair of a metabolite using an eco-friendly mobile phaseonstituted by ethanol and ammonium acetate buffer. Theompounds (Table 1) belong to three different pharmacolog-cal classes as selective serotonin reuptake inhibitors and a
etabolite (VNF, FLX and its metabolite NFLX), beta-blockersalprenolol (ALP), bisoprolol (BSP), MET, PHO) and the beta2-
drenergic agonist SBT. This method was able to quantify theF of the target CP in effluents of WWTP in Portugal and inffluents of a laboratory scale aerobic granular sludge bioreac-or.. A 1363 (2014) 226–235 227
2. Experimental
2.1. Chemicals and materials
Ethanol and methanol (HPLC grade) were purchased fromFisher Scientific UK Limited (Leicestershire, UK). Ammoniumacetate, ammonium hydroxide 25% and formic acid were pur-chased from Merck (Darmstadt, Germany) and acetic acid 100%Chromanorm (HPLC grade) from VWR International (Fontenay-sous-Bois, France). Ultrapure water was supplied by a Milli-Q watersystem. HPLC grade solvents were filtered with 0.22 �m nylonmembrane filters (Membrane Solutions, La Plano, TX, USA).
Fluoxetine hydrochloride (FLX), (S)-(+)-fluoxetine hydrochlo-ride ((S)-FLX), norfluoxetine (NFLX), alprenolol hydrochloride(ALP), (−)-(S)-alprenolol L-tartrate hydrate ((S)-ALP), meto-prolol tartrate (MET), propranolol hydrochloride (PHO), (−)-(S)-propranolol ((S)-PHO), salbutamol hemisulfate (SBT), (R)-salbutamol hydrochloride ((R)-SBT), and bisoprolol hemifumarate(BSP) were purchased from Sigma-Aldrich (Steinhein, Germany).Venlafaxine hydrochloride (VNF), (S)-venlafaxine ((S)-VNF), (S)-metoprolol ((S)-MET) and (S)-norfluoxetine ((S)-NFLX) werepurchased from Santa Cruz Biotechnology, Inc. (Heidelberg,Germany). All reference standards were of >98% purity.
Stock solutions were prepared by dissolution of known amountsof standards in ethanol, to obtain a concentration of approximately1000 �g mL−1 of the enantiomeric mixtures and 500 �g mL−1 of theindividual enantiomers. All enantiomeric mixtures were racemic,excepted NFLX. The proportion of (R)- and (S)-enantiomers of NFLXof the standard was calculated, with 35% of the (R)-enantiomer and65% of the (S)-enantiomer, which corresponds to an EF of 0.65. Allstandard solutions were stored at −20 ◦C. A working standard solu-tion containing 400 ng mL−1 of each enantiomer was prepared bydilution in ethanol.
The cartridges used for SPE were Oasis® MCX (Mixed-modeCation exchange) (150 mg, 6 mL) purchased from Waters (Milford,Massachusetts, USA).
2.2. Fortified and blank samples
Water samples of the final effluent of the secondary clarifierof a WWTP located in the North of Portugal and water sam-ples of the effluent of a laboratory-scale aerobic granular sludgesequential batch reactor (AGS-SBR), previously fed with a range ofpharmaceuticals and other fluorinated compounds [40–42] wereevaluated as matrices within the method development. Due tothe absence of the most target pharmaceuticals, the syntheticeffluent from the AGS-SBR was chosen for method develop-ment and validation. FLX was the only compound found in thematrix.
2.3. Solid phase extraction
SPE was performed on Oasis® MCX 150 mg sorbent cartridgesusing a Varian vacuum extraction device. The optimized SPE pro-cedure was carried out accordingly to work published elsewhere[2,36]. Several sample volumes of a 220 ng L−1 spiked AGS-SBRsample were tested (25, 50, 100, 250, 500, 1000 mL) to determinethe adequate volume to achieve the highest recovery. Briefly, thecartridges were conditioned sequentially with 8 mL of methanoland 8 mL of ultrapure water, at a flow rate of 1 mL min−1. Theeffluent samples were filtered with 0.45 �m Glass microfiber fil-ters (WhatmanTM), acidified at pH 2, adjusted with sulphuric acid,
and then were percolated through the cartridges at a constantflow rate of 10 mL min−1 using a vacuum manifold system con-nected to a vacuum pump. Then, the wash step was performedwith 8 mL of aqueous solution of 2% formic acid. The cartridges
228 A.R. Ribeiro et al. / J. Chromatogr. A 1363 (2014) 226–235
Table 1Chemical structures, molecular formula, molecular weights (Mw) and pKa of the selected chiral pharmaceuticals and metabolite.
Compound Chemical structure Molecular formula/Mw pKa
R/S(±)-fluoxetine (FLX) C17H18F3NO/309.33 g mol−1 10.05 [36]
R/S(±)-norfluoxetine (NFLX) C16H16F3NO/295.30 g mol−1 9.05 [36]
R/S(±)-venlafaxine (VNF) C17H27F3NO2/277.40 g mol−1 10.09 [38]
R/S(±)-alprenolol (ALP) C15H23NO2/249.35 g mol−1 9.19 [37]
R/S(±)-bisoprolol (BSP) C18H31NO4/325.44 g mol−1 9.50 [37]
R/S(±)-metoprolol (MET) C15H25NO3/267.36 g mol−1 9.60 [37]
R/S(±)-propranolol (PHO) C16H21NO2/259.16 g mol−1 9.15 [37]
R/S(±)-salbutamol (SBT) C13H21NO3/239.31 g mol−1 9.30 [39]
wEwwobemmilU
ere dried under vacuum for 30 min to dry out residual water.lution was performed in two steps, both at 1 mL min−1, the firstith 8 mL of methanol to elute acids and neutrals, which wasasted. The second step of elution was performed with 8 mL
f methanolic solution of 5% ammonium hydroxide to elute theasic compounds, which included the target analytes. The latterxtracts were evaporated to dryness in a vacuum concentrator,odel Centrivap Centrifugal concentrator with cold trap (−50 ◦C
odel) (Labconco, Kansas City, USA). The residues were dissolvedn 1000 �L of ethanol and filtered by 0.22 �m Polytetrafluoroethy-ene (PTFE) syringe filters (Membrane Solutions, La Plano, TX,SA).
2.4. LC-MS/MS analysis
Chromatographic analysis were performed using a ShimadzuUHPLC Nexera System equipped with two Pumps LC-30AD, anAutosampler SIL-30AC, an Oven CTO-20AC, a Degasser DGU-20A5,a System Controller CBM-20A, a LC Solution Version 5.41SP1 (Shi-madzu Corporation, Tokyo, Japan) and a triple quadrupole massspectrometer detector Shimadzu LCMS-8030 coupled to the LC Sys-
tem.An electrospray ionization (ESI) source operating in positive ion-ization mode was used. The direct injection of each compound at a10,000 �g L−1 concentration was performed to select the precursor
A.R. Ribeiro et al. / J. Chromatogr. A 1363 (2014) 226–235 229
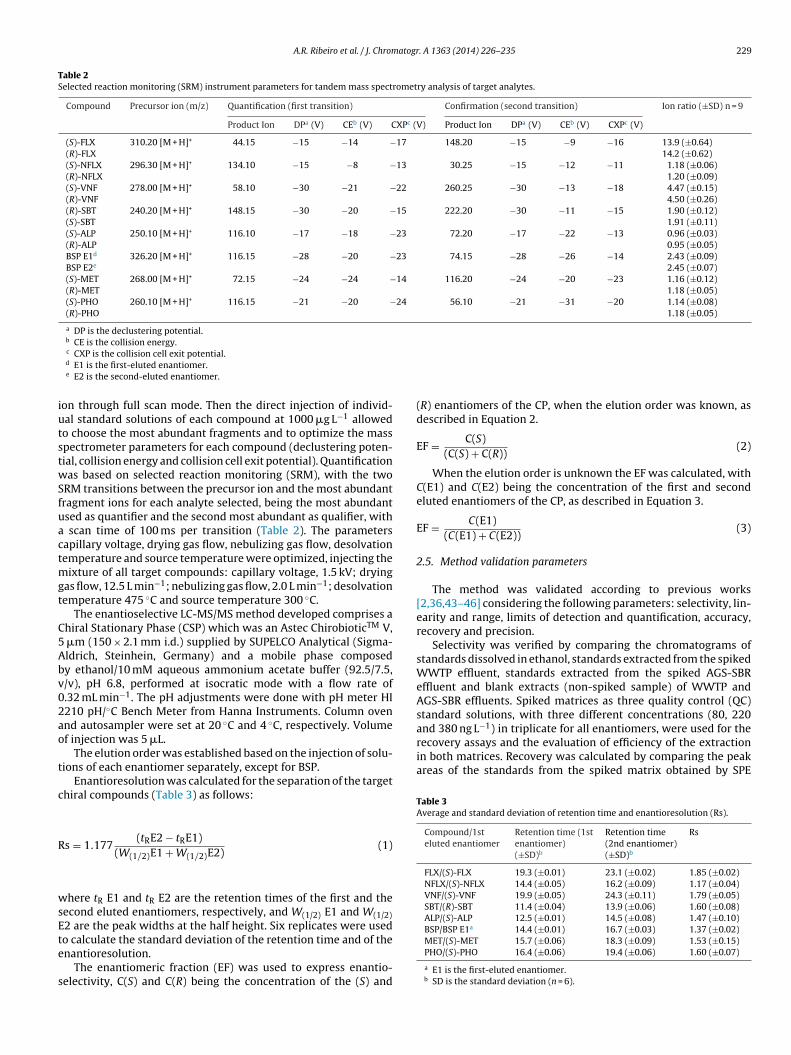
Table 2Selected reaction monitoring (SRM) instrument parameters for tandem mass spectrometry analysis of target analytes.
Compound Precursor ion (m/z) Quantification (first transition) Confirmation (second transition) Ion ratio (±SD) n = 9
Product Ion DPa (V) CEb (V) CXPc (V) Product Ion DPa (V) CEb (V) CXPc (V)
(S)-FLX 310.20 [M + H]+ 44.15 −15 −14 −17 148.20 −15 −9 −16 13.9 (±0.64)(R)-FLX 14.2 (±0.62)(S)-NFLX 296.30 [M + H]+ 134.10 −15 −8 −13 30.25 −15 −12 −11 1.18 (±0.06)(R)-NFLX 1.20 (±0.09)(S)-VNF 278.00 [M + H]+ 58.10 −30 −21 −22 260.25 −30 −13 −18 4.47 (±0.15)(R)-VNF 4.50 (±0.26)(R)-SBT 240.20 [M + H]+ 148.15 −30 −20 −15 222.20 −30 −11 −15 1.90 (±0.12)(S)-SBT 1.91 (±0.11)(S)-ALP 250.10 [M + H]+ 116.10 −17 −18 −23 72.20 −17 −22 −13 0.96 (±0.03)(R)-ALP 0.95 (±0.05)BSP E1d 326.20 [M + H]+ 116.15 −28 −20 −23 74.15 −28 −26 −14 2.43 (±0.09)BSP E2e 2.45 (±0.07)(S)-MET 268.00 [M + H]+ 72.15 −24 −24 −14 116.20 −24 −20 −23 1.16 (±0.12)(R)-MET 1.18 (±0.05)(S)-PHO 260.10 [M + H]+ 116.15 −21 −20 −24 56.10 −21 −31 −20 1.14 (±0.08)(R)-PHO 1.18 (±0.05)
a DP is the declustering potential.b CE is the collision energy.
iutstwSfuactmgt
C5Abv02ao
t
c
R
wsEte
s
and 380 ng L−1) in triplicate for all enantiomers, were used for therecovery assays and the evaluation of efficiency of the extractionin both matrices. Recovery was calculated by comparing the peakareas of the standards from the spiked matrix obtained by SPE
Table 3Average and standard deviation of retention time and enantioresolution (Rs).
Compound/1steluted enantiomer
Retention time (1stenantiomer)(±SD)b
Retention time(2nd enantiomer)(±SD)b
Rs
FLX/(S)-FLX 19.3 (±0.01) 23.1 (±0.02) 1.85 (±0.02)NFLX/(S)-NFLX 14.4 (±0.05) 16.2 (±0.09) 1.17 (±0.04)VNF/(S)-VNF 19.9 (±0.05) 24.3 (±0.11) 1.79 (±0.05)SBT/(R)-SBT 11.4 (±0.04) 13.9 (±0.06) 1.60 (±0.08)ALP/(S)-ALP 12.5 (±0.01) 14.5 (±0.08) 1.47 (±0.10)BSP/BSP E1a 14.4 (±0.01) 16.7 (±0.03) 1.37 (±0.02)
c CXP is the collision cell exit potential.d E1 is the first-eluted enantiomer.e E2 is the second-eluted enantiomer.
on through full scan mode. Then the direct injection of individ-al standard solutions of each compound at 1000 �g L−1 allowedo choose the most abundant fragments and to optimize the masspectrometer parameters for each compound (declustering poten-ial, collision energy and collision cell exit potential). Quantificationas based on selected reaction monitoring (SRM), with the two
RM transitions between the precursor ion and the most abundantragment ions for each analyte selected, being the most abundantsed as quantifier and the second most abundant as qualifier, with
scan time of 100 ms per transition (Table 2). The parametersapillary voltage, drying gas flow, nebulizing gas flow, desolvationemperature and source temperature were optimized, injecting the
ixture of all target compounds: capillary voltage, 1.5 kV; dryingas flow, 12.5 L min−1; nebulizing gas flow, 2.0 L min−1; desolvationemperature 475 ◦C and source temperature 300 ◦C.
The enantioselective LC-MS/MS method developed comprises ahiral Stationary Phase (CSP) which was an Astec ChirobioticTM V,
�m (150 × 2.1 mm i.d.) supplied by SUPELCO Analytical (Sigma-ldrich, Steinhein, Germany) and a mobile phase composedy ethanol/10 mM aqueous ammonium acetate buffer (92.5/7.5,/v), pH 6.8, performed at isocratic mode with a flow rate of.32 mL min−1. The pH adjustments were done with pH meter HI210 pH/◦C Bench Meter from Hanna Instruments. Column ovennd autosampler were set at 20 ◦C and 4 ◦C, respectively. Volumef injection was 5 �L.
The elution order was established based on the injection of solu-ions of each enantiomer separately, except for BSP.
Enantioresolution was calculated for the separation of the targethiral compounds (Table 3) as follows:
s = 1.177(tRE2 − tRE1)
(W(1/2)E1 + W(1/2)E2)(1)
here tR E1 and tR E2 are the retention times of the first and theecond eluted enantiomers, respectively, and W(1/2) E1 and W(1/2)2 are the peak widths at the half height. Six replicates were used
o calculate the standard deviation of the retention time and of thenantioresolution.The enantiomeric fraction (EF) was used to express enantio-electivity, C(S) and C(R) being the concentration of the (S) and
(R) enantiomers of the CP, when the elution order was known, asdescribed in Equation 2.
EF = C(S)(C(S) + C(R))
(2)
When the elution order is unknown the EF was calculated, withC(E1) and C(E2) being the concentration of the first and secondeluted enantiomers of the CP, as described in Equation 3.
EF = C(E1)(C(E1) + C(E2))
(3)
2.5. Method validation parameters
The method was validated according to previous works[2,36,43–46] considering the following parameters: selectivity, lin-earity and range, limits of detection and quantification, accuracy,recovery and precision.
Selectivity was verified by comparing the chromatograms ofstandards dissolved in ethanol, standards extracted from the spikedWWTP effluent, standards extracted from the spiked AGS-SBReffluent and blank extracts (non-spiked sample) of WWTP andAGS-SBR effluents. Spiked matrices as three quality control (QC)standard solutions, with three different concentrations (80, 220
MET/(S)-MET 15.7 (±0.06) 18.3 (±0.09) 1.53 (±0.15)PHO/(S)-PHO 16.4 (±0.06) 19.4 (±0.06) 1.60 (±0.07)
a E1 is the first-eluted enantiomer.b SD is the standard deviation (n = 6).

2 atogr
wtCmF2wiit6tsqtIip
ttiastd
2
wrt(fcaT(lM
2
oitaflWaflWp
net
3
3
t
30 A.R. Ribeiro et al. / J. Chrom
ith those of similar concentrations in ethanolic standard solu-ions. Non-spiked samples were also analysed and the levels ofP detected were subtracted from those obtained with the spikedatrix. The AGS-SBR samples presented only the enantiomers of
LX and were used for validation purposes. Spiked samples of50 mL were used for external matrix calibration standards andere prepared as described above for the SPE procedure. Linear-
ty and range were evaluated using calibration curves preparedn triplicate with a set of eight different standard concentra-ions of enantiomers in the spiked AGS-SBR samples: 20; 30; 40;0; 100; 200; 300; 400 ng L−1. Calibration curves were drawn byhe injection of 5 �L of the reconstituted 1000 �L extract dis-olved in ethanol. Instrument detection limits (IDL) and instrumentuantification limits (IQL) were calculated from spiked sampleshrough the signal-to-noise (S/N) ratio of 3.3 for IDL and 10 forQL. Method detection limits (MDL) and method quantification lim-ts (MQL) were assessed dividing, respectively IDL and IQL by there-concentration factor of 250.
Three QC standard solutions, with three different concentra-ions (80, 220 and 380 ng L−1) of all enantiomers, each one inriplicate, were prepared to assess the accuracy and intra- andnter-batch precision. The accuracy of the method was evaluateds the percentage of agreement between the concentrations of thetandards analysed in the SPE extracts and the nominal concen-ration [2,43,47]. Precision was expressed by the relative standardeviation (RSD) of the replicate measurements.
.6. Matrix effect evaluation
The post-extraction addition method to assess the matrix effectas based on a previous published work [43]. The method was car-
ied out on laboratory-scale AGS-SBR samples, by the injection ofwo extracted samples, spiked with all enantiomers (220 ng L−1)A). The areas obtained were compared with the areas obtainedor an ethanolic solution with all enantiomers at the same con-entration as the reconstituted spiked extracted samples (B). Twodditional non-spiked samples were also extracted and analysed.he matrix effect (ME) ratio was obtained by the equation: ME%) = A/B × 100 [43]. A value of 100% indicates the absence of abso-ute matrix effect; ME > 100% indicates an ionization enhancement;
E < 100% indicates an ionization suppression.
.7. Quantification in WWTP effluents
Water samples of the final effluent of the secondary clarifierf three WWTP located on the North of Portugal, were collectedn pre-rinsed amber glass bottles (2 L) and transported at 4 ◦C tohe laboratory. The WWTP1 combines an anoxic reactor and anctivated sludge treatment, serves 17,000 people with a maximumow of 34.7 L s−1 and receives 18.6% of industrial wastewater. TheWTP2 combines Light Expanded Clay Aggregate (LECA®) and an
ctivated sludge treatment, serves 46,000 people with a maximumow of 62.5 L s−1 and receives 39.1% of industrial wastewater. TheWTP3 only comprises an activated sludge treatment, serves a
opulation of 80,000 with a maximum flow of 208 L s−1.Upon reception, samples were vacuum filtered through 0.45 �m
ylon membrane filters (Whatman, UK) and stored at −20 ◦C untilxtraction as described in section 2.3, being 5 �L of the reconsti-uted extract analysed by LC-MS/MS.
. Results and discussion
.1. Enantiomeric resolution
Chromatographic enantioseparation was achieved using a mix-ure of ethanol and a 10 mM aqueous ammonium acetate buffer
. A 1363 (2014) 226–235
(92.5/7.5, v/v), pH 6.8, as mobile phase. An isocratic procedure wasachieved using the vancomycin-based CSP (ChirobioticTM V col-umn) with 150 × 2.1 mm i.d., with a flow rate of 0.32 mL min−1
and the column oven set at 20 ◦C. Several attempts were per-formed to achieve the best condition for enantiomeric resolution,as varying the proportion of ethanol, the column oven tempera-ture and the flow rate, in order to achieve enantioseparation for alltarget pharmaceuticals within the shortest elution time. The con-ditions established used ethanol as organic solvent as recommendby green chromatography method development directives [48].The enantioseparation of sixteen enantiomers of multi-therapeuticclasses using ethanol and ammonium acetate buffer with a low flowrate (0.32 mL min−1) was achieved in 30 minutes (Fig. 1). This canbe considered a great improvement when comparing with pub-lished enantioseparation for environmental application analyses[28,29,49], since MCX cartridges are more indicated for basic com-pounds, allowing to reduce the matrix effects. Furthermore, a shortelution time was achieved with ethanol in the mobile phase, whichis an eco-friendly solvent choice.
The injection of the single enantiomer standards (S)-FLX,(S)-NFLX, (S)-VNF, (S)-ALP, (S)-MET, (S)-PHO and (R)-SBT was per-formed to define the elution order of the enantiomers. Theseenantiomers were the first to elute in the chromatographic run. Theenantioresolutions (Rs) obtained in this work are generally higherthan 1.5, except for NFLX (1.17), BSP (1.37) and ALP (1.47) (Table 3).Lower elution time and better Rs values were observed compar-ing with those achieved in recent studies employing the same CSP[12]. The use of ethanol, an eco-friendly mobile phase in reversedelution mode presented better chromatographic parameters thanmethanol or tetrahydrofuran as a mobile phase [11,12,27,28,30,49].
3.2. LC-MS/MS optimization
First of all, single direct injection of each target CP was per-formed to select the precursor ion by full scan, and then the twomost abundant transitions for each compound were chosen. Theprotonated molecular ion of each compound was chosen as pre-cursor ion. The most abundant product ion from each precursorion (SRM1) was selected for quantification. The retention time andthe most abundant secondary transition (SRM2) were used for con-firmation purposes. The optimized mass spectrometer parametersincluding two SRMs, declustering potential (DP), collision energy(CE), collision cell exit potential (CXP) and ion ratio for each com-pound in positive ionization mode, are given in Table 2.
3.3. Method validation
The enantioselective method was validated according to inter-national criteria and work published elsewhere [2,36, 43–46]. Therecovery, accuracy, intra and inter-batch precision are presentedin Table 4. The best recovery values were achieved with 250 mLof sample. The breakthrough volume was determined by testingdifferent volumes (25, 50, 100, 250, 500, 1000 mL) of a 220 ng L−1
spiked AGS-SBR sample and correlating the volumes with the cor-responding chromatographic peak areas for all enantiomers. Theresults showed that the breakthrough volume was reached formost enantiomers above 250 mL, meaning that maximum extrac-tion efficiency was obtained for this sample volume and above itthe extraction efficiency declined, this phenomenon was previouslyobserved by Bielicka-Daszkiewicz et al. (2009) [50]. The recover-ies obtained with laboratory-scale AGS-SBR effluent were between47.6% and 109% (Table 4). Enantiomers of FLX were found in the
matrix and were subtracted for recovery rate calculation. ThreeQC standard solutions, with three different concentrations (80, 220and 380 ng L−1) of all enantiomers spiked in the effluent samplesof the laboratory AGS-SBR, each one in triplicate, were prepared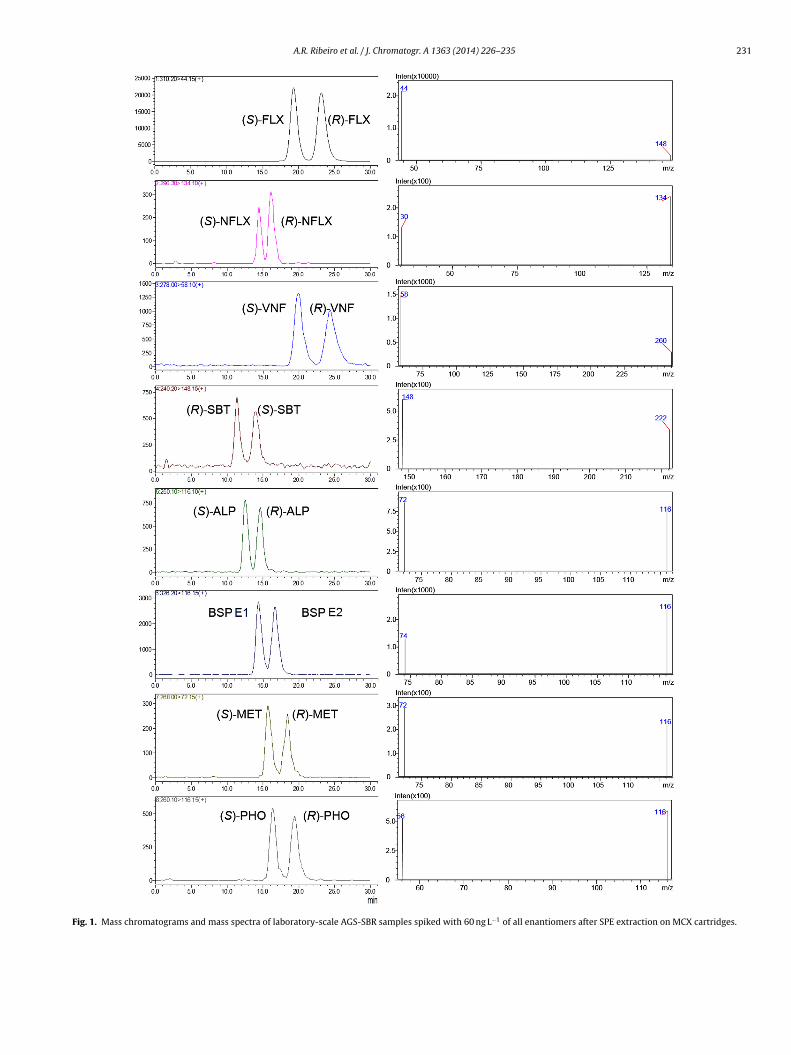
A.R. Ribeiro et al. / J. Chromatogr. A 1363 (2014) 226–235 231
Fig. 1. Mass chromatograms and mass spectra of laboratory-scale AGS-SBR samples spiked with 60 ng L−1 of all enantiomers after SPE extraction on MCX cartridges.
232 A.R. Ribeiro et al. / J. Chromatogr. A 1363 (2014) 226–235
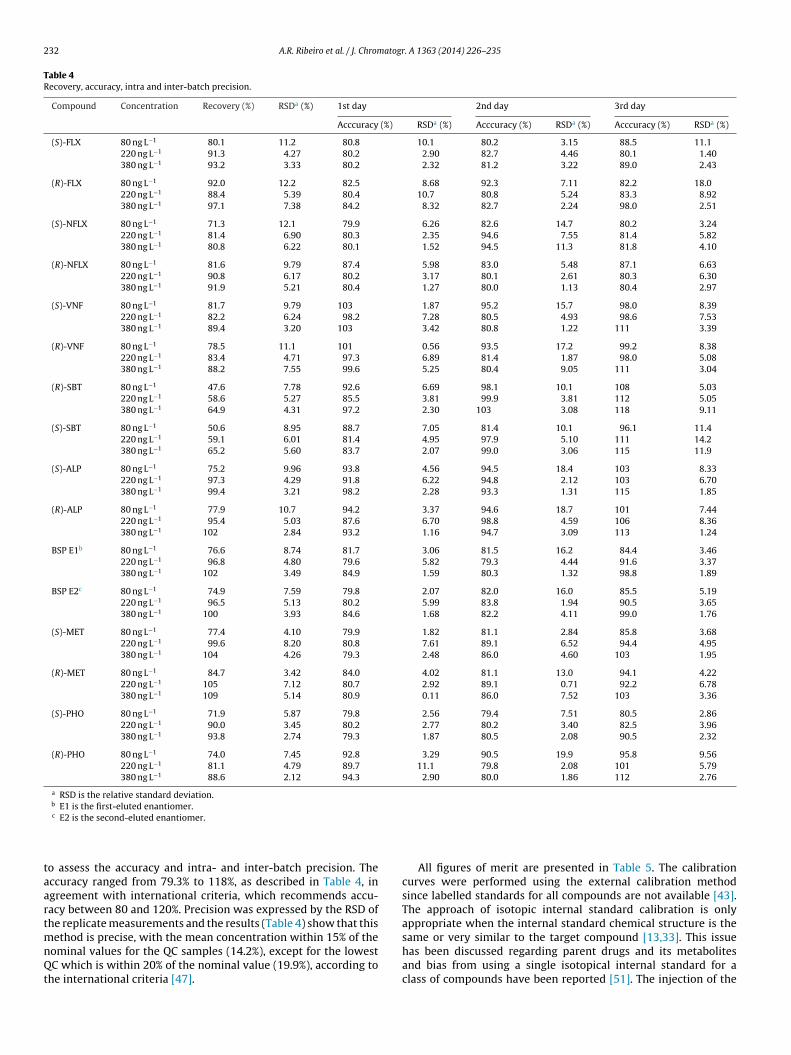
Table 4Recovery, accuracy, intra and inter-batch precision.
Compound Concentration Recovery (%) RSDa (%) 1st day 2nd day 3rd day
Acccuracy (%) RSDa (%) Acccuracy (%) RSDa (%) Acccuracy (%) RSDa (%)
(S)-FLX 80 ng L−1 80.1 11.2 80.8 10.1 80.2 3.15 88.5 11.1220 ng L−1 91.3 4.27 80.2 2.90 82.7 4.46 80.1 1.40380 ng L−1 93.2 3.33 80.2 2.32 81.2 3.22 89.0 2.43
(R)-FLX 80 ng L−1 92.0 12.2 82.5 8.68 92.3 7.11 82.2 18.0220 ng L−1 88.4 5.39 80.4 10.7 80.8 5.24 83.3 8.92380 ng L−1 97.1 7.38 84.2 8.32 82.7 2.24 98.0 2.51
(S)-NFLX 80 ng L−1 71.3 12.1 79.9 6.26 82.6 14.7 80.2 3.24220 ng L−1 81.4 6.90 80.3 2.35 94.6 7.55 81.4 5.82380 ng L−1 80.8 6.22 80.1 1.52 94.5 11.3 81.8 4.10
(R)-NFLX 80 ng L−1 81.6 9.79 87.4 5.98 83.0 5.48 87.1 6.63220 ng L−1 90.8 6.17 80.2 3.17 80.1 2.61 80.3 6.30380 ng L−1 91.9 5.21 80.4 1.27 80.0 1.13 80.4 2.97
(S)-VNF 80 ng L−1 81.7 9.79 103 1.87 95.2 15.7 98.0 8.39220 ng L−1 82.2 6.24 98.2 7.28 80.5 4.93 98.6 7.53380 ng L−1 89.4 3.20 103 3.42 80.8 1.22 111 3.39
(R)-VNF 80 ng L−1 78.5 11.1 101 0.56 93.5 17.2 99.2 8.38220 ng L−1 83.4 4.71 97.3 6.89 81.4 1.87 98.0 5.08380 ng L−1 88.2 7.55 99.6 5.25 80.4 9.05 111 3.04
(R)-SBT 80 ng L−1 47.6 7.78 92.6 6.69 98.1 10.1 108 5.03220 ng L−1 58.6 5.27 85.5 3.81 99.9 3.81 112 5.05380 ng L−1 64.9 4.31 97.2 2.30 103 3.08 118 9.11
(S)-SBT 80 ng L−1 50.6 8.95 88.7 7.05 81.4 10.1 96.1 11.4220 ng L−1 59.1 6.01 81.4 4.95 97.9 5.10 111 14.2380 ng L−1 65.2 5.60 83.7 2.07 99.0 3.06 115 11.9
(S)-ALP 80 ng L−1 75.2 9.96 93.8 4.56 94.5 18.4 103 8.33220 ng L−1 97.3 4.29 91.8 6.22 94.8 2.12 103 6.70380 ng L−1 99.4 3.21 98.2 2.28 93.3 1.31 115 1.85
(R)-ALP 80 ng L−1 77.9 10.7 94.2 3.37 94.6 18.7 101 7.44220 ng L−1 95.4 5.03 87.6 6.70 98.8 4.59 106 8.36380 ng L−1 102 2.84 93.2 1.16 94.7 3.09 113 1.24
BSP E1b 80 ng L−1 76.6 8.74 81.7 3.06 81.5 16.2 84.4 3.46220 ng L−1 96.8 4.80 79.6 5.82 79.3 4.44 91.6 3.37380 ng L−1 102 3.49 84.9 1.59 80.3 1.32 98.8 1.89
BSP E2c 80 ng L−1 74.9 7.59 79.8 2.07 82.0 16.0 85.5 5.19220 ng L−1 96.5 5.13 80.2 5.99 83.8 1.94 90.5 3.65380 ng L−1 100 3.93 84.6 1.68 82.2 4.11 99.0 1.76
(S)-MET 80 ng L−1 77.4 4.10 79.9 1.82 81.1 2.84 85.8 3.68220 ng L−1 99.6 8.20 80.8 7.61 89.1 6.52 94.4 4.95380 ng L−1 104 4.26 79.3 2.48 86.0 4.60 103 1.95
(R)-MET 80 ng L−1 84.7 3.42 84.0 4.02 81.1 13.0 94.1 4.22220 ng L−1 105 7.12 80.7 2.92 89.1 0.71 92.2 6.78380 ng L−1 109 5.14 80.9 0.11 86.0 7.52 103 3.36
(S)-PHO 80 ng L−1 71.9 5.87 79.8 2.56 79.4 7.51 80.5 2.86220 ng L−1 90.0 3.45 80.2 2.77 80.2 3.40 82.5 3.96380 ng L−1 93.8 2.74 79.3 1.87 80.5 2.08 90.5 2.32
(R)-PHO 80 ng L−1 74.0 7.45 92.8 3.29 90.5 19.9 95.8 9.56220 ng L−1 81.1 4.79 89.7 11.1 79.8 2.08 101 5.79380 ng L−1 88.6 2.12 94.3 2.90 80.0 1.86 112 2.76
a RSD is the relative standard deviation.b E1 is the first-eluted enantiomer.
taartmnQt
c E2 is the second-eluted enantiomer.
o assess the accuracy and intra- and inter-batch precision. Theccuracy ranged from 79.3% to 118%, as described in Table 4, ingreement with international criteria, which recommends accu-acy between 80 and 120%. Precision was expressed by the RSD ofhe replicate measurements and the results (Table 4) show that this
ethod is precise, with the mean concentration within 15% of theominal values for the QC samples (14.2%), except for the lowestC which is within 20% of the nominal value (19.9%), according to
he international criteria [47].
All figures of merit are presented in Table 5. The calibrationcurves were performed using the external calibration methodsince labelled standards for all compounds are not available [43].The approach of isotopic internal standard calibration is onlyappropriate when the internal standard chemical structure is the
same or very similar to the target compound [13,33]. This issuehas been discussed regarding parent drugs and its metabolitesand bias from using a single isotopical internal standard for aclass of compounds have been reported [51]. The injection of the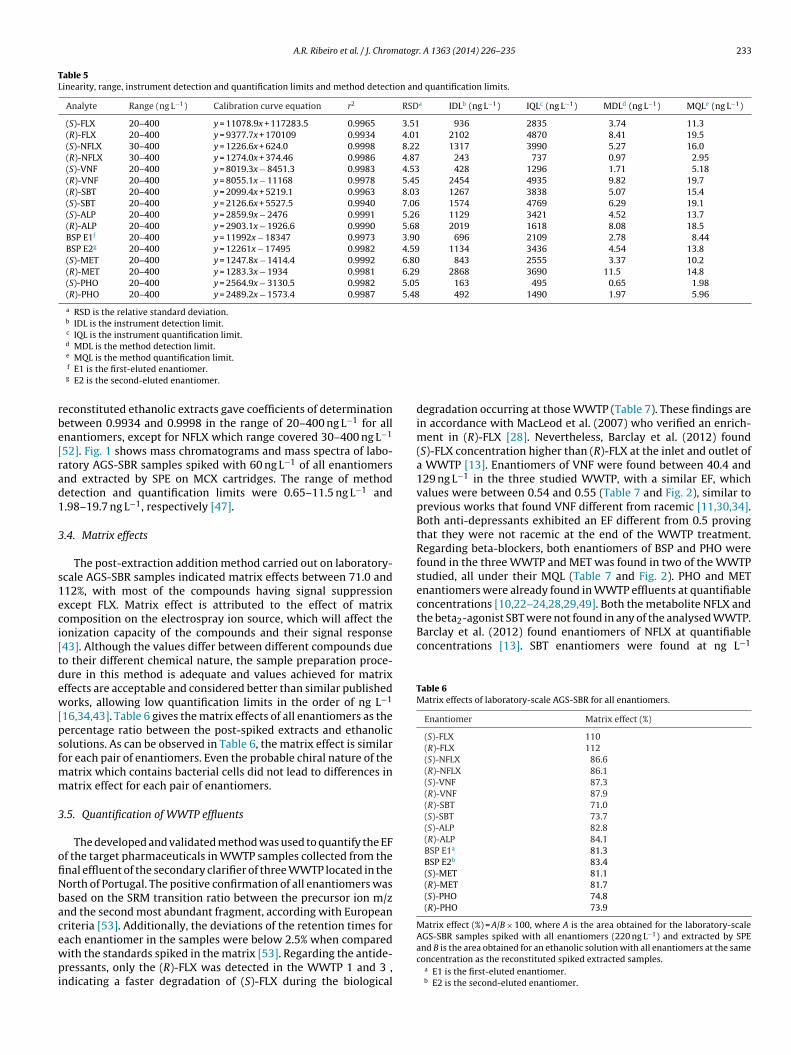
A.R. Ribeiro et al. / J. Chromatogr. A 1363 (2014) 226–235 233
Table 5Linearity, range, instrument detection and quantification limits and method detection and quantification limits.
Analyte Range (ng L−1) Calibration curve equation r2 RSDa IDLb (ng L−1) IQLc (ng L−1) MDLd (ng L−1) MQLe (ng L−1)
(S)-FLX 20–400 y = 11078.9x + 117283.5 0.9965 3.51 936 2835 3.74 11.3(R)-FLX 20–400 y = 9377.7x + 170109 0.9934 4.01 2102 4870 8.41 19.5(S)-NFLX 30–400 y = 1226.6x + 624.0 0.9998 8.22 1317 3990 5.27 16.0(R)-NFLX 30–400 y = 1274.0x + 374.46 0.9986 4.87 243 737 0.97 2.95(S)-VNF 20–400 y = 8019.3x − 8451.3 0.9983 4.53 428 1296 1.71 5.18(R)-VNF 20–400 y = 8055.1x − 11168 0.9978 5.45 2454 4935 9.82 19.7(R)-SBT 20–400 y = 2099.4x + 5219.1 0.9963 8.03 1267 3838 5.07 15.4(S)-SBT 20–400 y = 2126.6x + 5527.5 0.9940 7.06 1574 4769 6.29 19.1(S)-ALP 20–400 y = 2859.9x − 2476 0.9991 5.26 1129 3421 4.52 13.7(R)-ALP 20–400 y = 2903.1x − 1926.6 0.9990 5.68 2019 1618 8.08 18.5BSP E1f 20–400 y = 11992x − 18347 0.9973 3.90 696 2109 2.78 8.44BSP E2g 20–400 y = 12261x − 17495 0.9982 4.59 1134 3436 4.54 13.8(S)-MET 20–400 y = 1247.8x − 1414.4 0.9992 6.80 843 2555 3.37 10.2(R)-MET 20–400 y = 1283.3x − 1934 0.9981 6.29 2868 3690 11.5 14.8(S)-PHO 20–400 y = 2564.9x − 3130.5 0.9982 5.05 163 495 0.65 1.98(R)-PHO 20–400 y = 2489.2x − 1573.4 0.9987 5.48 492 1490 1.97 5.96
a RSD is the relative standard deviation.b IDL is the instrument detection limit.c IQL is the instrument quantification limit.d MDL is the method detection limit.
rbe[rad1
3
s1eci[tdew[psfmm
3
ofiNbacewpi
the beta2-agonist SBT were not found in any of the analysed WWTP.Barclay et al. (2012) found enantiomers of NFLX at quantifiableconcentrations [13]. SBT enantiomers were found at ng L−1
Table 6Matrix effects of laboratory-scale AGS-SBR for all enantiomers.
Enantiomer Matrix effect (%)
(S)-FLX 110(R)-FLX 112(S)-NFLX 86.6(R)-NFLX 86.1(S)-VNF 87.3(R)-VNF 87.9(R)-SBT 71.0(S)-SBT 73.7(S)-ALP 82.8(R)-ALP 84.1BSP E1a 81.3BSP E2b 83.4(S)-MET 81.1(R)-MET 81.7(S)-PHO 74.8(R)-PHO 73.9
Matrix effect (%) = A/B × 100, where A is the area obtained for the laboratory-scale
e MQL is the method quantification limit.f E1 is the first-eluted enantiomer.g E2 is the second-eluted enantiomer.
econstituted ethanolic extracts gave coefficients of determinationetween 0.9934 and 0.9998 in the range of 20–400 ng L−1 for allnantiomers, except for NFLX which range covered 30–400 ng L−1
52]. Fig. 1 shows mass chromatograms and mass spectra of labo-atory AGS-SBR samples spiked with 60 ng L−1 of all enantiomersnd extracted by SPE on MCX cartridges. The range of methodetection and quantification limits were 0.65–11.5 ng L−1 and.98–19.7 ng L−1, respectively [47].
.4. Matrix effects
The post-extraction addition method carried out on laboratory-cale AGS-SBR samples indicated matrix effects between 71.0 and12%, with most of the compounds having signal suppressionxcept FLX. Matrix effect is attributed to the effect of matrixomposition on the electrospray ion source, which will affect theonization capacity of the compounds and their signal response43]. Although the values differ between different compounds dueo their different chemical nature, the sample preparation proce-ure in this method is adequate and values achieved for matrixffects are acceptable and considered better than similar publishedorks, allowing low quantification limits in the order of ng L−1
16,34,43]. Table 6 gives the matrix effects of all enantiomers as theercentage ratio between the post-spiked extracts and ethanolicolutions. As can be observed in Table 6, the matrix effect is similaror each pair of enantiomers. Even the probable chiral nature of the
atrix which contains bacterial cells did not lead to differences inatrix effect for each pair of enantiomers.
.5. Quantification of WWTP effluents
The developed and validated method was used to quantify the EFf the target pharmaceuticals in WWTP samples collected from thenal effluent of the secondary clarifier of three WWTP located in theorth of Portugal. The positive confirmation of all enantiomers wasased on the SRM transition ratio between the precursor ion m/znd the second most abundant fragment, according with Europeanriteria [53]. Additionally, the deviations of the retention times for
ach enantiomer in the samples were below 2.5% when comparedith the standards spiked in the matrix [53]. Regarding the antide-ressants, only the (R)-FLX was detected in the WWTP 1 and 3 ,ndicating a faster degradation of (S)-FLX during the biological
degradation occurring at those WWTP (Table 7). These findings arein accordance with MacLeod et al. (2007) who verified an enrich-ment in (R)-FLX [28]. Nevertheless, Barclay et al. (2012) found(S)-FLX concentration higher than (R)-FLX at the inlet and outlet ofa WWTP [13]. Enantiomers of VNF were found between 40.4 and129 ng L−1 in the three studied WWTP, with a similar EF, whichvalues were between 0.54 and 0.55 (Table 7 and Fig. 2), similar toprevious works that found VNF different from racemic [11,30,34].Both anti-depressants exhibited an EF different from 0.5 provingthat they were not racemic at the end of the WWTP treatment.Regarding beta-blockers, both enantiomers of BSP and PHO werefound in the three WWTP and MET was found in two of the WWTPstudied, all under their MQL (Table 7 and Fig. 2). PHO and METenantiomers were already found in WWTP effluents at quantifiableconcentrations [10,22–24,28,29,49]. Both the metabolite NFLX and
AGS-SBR samples spiked with all enantiomers (220 ng L−1) and extracted by SPEand B is the area obtained for an ethanolic solution with all enantiomers at the sameconcentration as the reconstituted spiked extracted samples.
a E1 is the first-eluted enantiomer.b E2 is the second-eluted enantiomer.

234 A.R. Ribeiro et al. / J. Chromatogr. A 1363 (2014) 226–235
Table 7Average concentrations (ng L−1) and EF with the respective standard deviations of the target pharmaceuticals at the three WWTP.
Analyte WWTP1a WWTP2a WWTP3a
Concentration (ng L−1) EFb (SDc) Concentration (ng L−1) EFb (SDc) Concentration (ng L−1) EFb (SDc)
(S)-FLX <MDLd – <MQL – <MDL –(R)-FLX <MQLe <MQL <MQL(S)-VNF 129 (±11.5) 0.54 (±0.02) 125 (±13.0) 0.55 (±0.01) 48.6 (±3.02) 0.55 (±0.01)(R)-VNF 110 (±6.94) 102 (±7.94) 40.4 (±1.79)BSP E1f <MQL – <MQL – <MQL –BSP E2g <MQL <MQL <MQL(S)-MET <MQL – <MQL – <MDL –(R)-MET <MQL <MQL <MDL(S)-PHO <MQL – <MQL – <MQL –(R)-PHO <MQL <MQL <MQL
a WWTP is the wastewater treatment plant.b EF is the enantiomeric fraction.c SD is the standard deviation.d MDL is the method detection limit.e MQL is the method quantification limit.f E1 is the first-eluted enantiomer.g E2 is the second-eluted enantiomer.
nt sam
cemwc
Fig. 2. Mass chromatograms and mass spectra of WWTP2 efflue
oncentration in the effluents of WWTP [28,29,49]. As it was
xpected ALP was also not found in the WWTP, since this phar-aceutical is not sold in Portugal. Inclusion of ALP in the studyidens the application of the method to locations where it isommercialized.
ple, showing the enantiomers of FLX, VNF, BSP, MET and PHO.
4. Conclusions
A SPE-LC-MS/MS method with a triple quadrupole massanalyser was optimized and validated for the quantification ofenantiomers of three different therapeutic classes of CP, namely
atogr
sbwpflfetetpbbiade
A
eaaSepOPbCfT
R
[
[[
[
[[
[[
[[[[[[[[[[
[[[[
[
[
[
[
[
[
[
[[
[
[
[
[
[
[
[[
[
[[
[
A.R. Ribeiro et al. / J. Chrom
elective serotonin reuptake inhibitors and a metabolite, beta-lockers and one beta2-adrenergic agonist. The LC-MS/MS methodas developed with a ChirobioticTM V and an eco-friendly mobilehase constituted by ethanol and ammonium acetate buffer at lowow rate. The method quantification limits were below 19.7 ng L−1
or all enantiomers and allowed the successful quantification ofnantiomers from WWTP effluents. The confirmation of the enan-iomers found, (R)-FLX or both enantiomers of FLX and bothnantiomers of VNF, BSP, MET and PHO, was based in two SRMransitions, its ion ratios and retention times, according to Euro-ean Commission Decision 2002/657/EC. This method proved toe capable for monitoring enantiomers in WWTP effluents, and wille further used to assess degradation of CP in biodegradation stud-
es. It can also be straightforwardly adapted to monitoring surfacend estuarine waters. This study contributes for the urgent need ofevelopment of enantioselective methods for CP quantification innvironmental matrices.
cknowledgments
The work has been supported by Fundacão para a Ciência Tecnologia–FCT (PhD grant attributed to Ana Rita Ribeirond Alexandra S. Maia, respectively, SFRH/BD/64999/2009nd SFRH/BD/86939/2012), from QREN-POPH, Europeanocial Fund and MCTES. Authors also wish to acknowl-dge the support from national funds from FCT throughrojects FLUOROPHARMA, PTDC/EBB-EBI/111699/2009, PEst-E/EQB/LA0016/2013, CEQUIMED-PEst-OE/SAU/UI4040/2011 andEst-C/EQB/LA0006/2013. This research was partially supportedy the European Regional Development Fund (ERDF) through theOMPETE - Operational Competitiveness Programme and national
unds through FCT, under the project PEst-C/MAR/LA0015/2011.he authors thank Paula Paíga for her collaboration.
eferences
[1] T.V. Madureira, J.C. Barreiro, M.J. Rocha, E. Rocha, Q.B. Cass, M.E. Tiritan, Sci.Total Environ. 408 (2010) 5513.
[2] T.V. Madureira, M.J. Rocha, Q.B. Cass, M.E. Tiritan, J. Chromatogr. Sci. 48 (2010)176.
[3] L.H.M.L.M. Santos, P. Paíga, A.N. Araújo, A. Pena, C. Delerue-Matos, M.C.B.S.M.Montenegro, J. Chromatogr. B 930 (2013) 75.
[4] L.H.M.L.M. Santos, M. Gros, S. Rodriguez-Mozaz, C. Delerue-Matos, A. Pena, D.Barceló, M.C.B.S.M. Montenegro, Sci. Total Environ. 461–462 (2013) 302.
[5] K. Kümmerer, Chemosphere 75 (2009) 417.[6] K. Kümmerer, J. Environ. Manage. 90 (2009) 2354.[7] A.R. Ribeiro, P.M.L. Castro, M.E. Tiritan, Environ. Chem. Lett. 10 (2012) 239.[8] J.K. Stanley, A.J. Ramirez, C.K. Chambliss, B.W. Brooks, Chemosphere 69 (2007)
9.[9] F. De Andrés, G. Castaneda, Á. Ríos, Chirality 21 (2009) 751.
10] V.K.H. Barclay, N.L. Tyrefors, I.M. Johansson, C.E. Pettersson, J. Chromatogr. A1269 (2012) 208.11] Z. Li, E. Gomez, H. Fenet, S. Chiron, Chemosphere 90 (2013) 1933.12] R. López-Serna, A. Jurado, E. Vázquez-Suné, J. Carrera, M. Petrovic, D. Barceló,
Environ. Pollut. 174 (2013) 305.
[
. A 1363 (2014) 226–235 235
13] V.K.H. Barclay, N.L. Tyrefors, I.M. Johansson, C.E. Pettersson, J. Chromatogr. A1227 (2012) 105.
14] D.R. Baker, B. Kasprzyk-Hordern, Sci. Total Environ. 454–455 (2013) 442.15] J.C. Barreiro, K.L. Vanzolini, T.V. Madureira, M.E. Tiritan, Q.B. Cass, Talanta 82
(2010) 384.16] J.C. Barreiro, K.L. Vanzolini, Q.B. Cass, J. Chromatogr. A 1218 (2011) 2865.17] Q. Huang, K. Zhang, Z. Wang, C. Wang, X. Peng, Anal. Bioanal. Chem. 403 (2012)
1751.18] H.-R. Buser, T. Poiger, M.D. Muller, Environ. Sci. Technol. 33 (1999) 2529.19] V. Matamoros, M. Hijosa, J.M. Bayona, Chemosphere 75 (2009) 200.20] N.H. Hashim, S.J. Khan, J. Chromatogr. A 1218 (2011) 4746.21] N.H. Hashim, R.M. Stuetz, S.J. Khan, Chirality 25 (2013) 301.22] L.J. Fono, D.L. Sedlak, Environ. Sci. Technol. 39 (2005) 9244.23] L.J. Fono, E.P. Kolodziej, D.L. Sedlak, Environ. Sci. Technol. 40 (2006) 7257.24] U. Kunkel, M. Radke, Water Res. 46 (2012) 5551.25] S. Morante-Zarcero, I. Sierra, J. Pharm. Biomed. Anal. 62 (2012) 33.26] S. Morante-Zarcero, I. Sierra, Chirality 24 (2012) 860.27] L.N. Nikolai, E.L. McClure, S.L. MacLeod, C.S. Wong, J. Chromatogr. A 1131 (2006)
103.28] S.L. MacLeod, P. Sudhir, C.S. Wong, J. Chromatogr. A 1170 (2007) 23.29] S.L. MacLeod, C.S. Wong, Water Res. 44 (2010) 533.30] B. Kasprzyk-Hordern, D.R. Baker, Environ. Sci. Technol. 46 (2012) 1681.31] J.P. Bagnall, S.E. Evans, M.T. Wort, A.T. Lubben, B. Kasprzyk-Hordern, J. Chro-
matogr. A 1249 (2012) 115.32] G. Gasser, I. Pankratov, S. Elhanany, P. Werner, J. Gun, F. Gelman, O. Lev, Chemo-
sphere 88 (2012) 98.33] V.K.H. Barclay, N.L. Tyrefors, I.M. Johansson, C.E. Pettersson, J. Chromatogr. A
1218 (2011) 5587.34] B. Kasprzyk-Hordern, V.V.R. Kondakal, D.R. Baker, J. Chromatogr. A 1217 (2010)
4575.35] A.R. Ribeiro, A.S. Maia, Q.B. Cass, M.E. Tiritan, J. Chromatogr. B
doi:10.1016/j.jchromb.2014.02.049.36] A.R. Ribeiro, A.S. Maia, I.S. Moreira, C.M. Afonso, P.M.L. Castro, M.E. Tiritan,
Chemosphere 95 (2014) 589.37] A. Detroyer, Y. Vander Heyden, S. Carda-Broch, M.C. Garcııa-Alvarez-Coque, D.L.
Massart, J. Chromatogr. A 912 (2001) 211.38] http://pubchem.ncbi.nlm.nih.gov/summary/summary.cgi?cid=5656, accessed
on May 2014.39] http://www.drugbank.ca/drugs/DB01001, accessed on May 2014.40] C.L. Amorim, A.S. Maia, R.B.R. Mesquita, A.O.S.S. Rangel, M.C.M. van Loosdrecht,
M.E. Tiritan, P.M.L. Castro, Water Res. 50 (2014) 101.41] A.F. Duque, V.S. Bessa, M.F. Carvalho, M.K. de Kreuk, M.C.M. van Loosdrecht,
P.M.L. Castro, Water Res. 45 (2011) 6745.42] I.S. Moreira, C.L. Amorim, A.R. Ribeiro, R.B.R. Mesquita, A.O.S.S. Rangel, M.E.
Tiritan, P.M.L. Castro, Chemosphere 111 (2014) 103.43] T.V. Madureira, J.C. Barreiro, M.J. Rocha, Q.B. Cass, M.E. Tiritan, J. Chromatogr.
A 1216 (2009) 7033.44] A.S. Maia, A.R. Ribeiro, C.L. Amorim, J.C. Barreiro, Q.B. Cass, P.M.L. Castro, M.E.
Tiritan, J. Chromatogr. A 1333 (2014) 87.45] A.R. Ribeiro, C.M. Afonso, P.M.L. Castro, M.E. Tiritan, Ecotoxicol. Environ. Saf. 87
(2013) 108.46] A.R. Ribeiro, C.M. Afonso, P.M.L. Castro, M.E. Tiritan, Environ. Chem. Lett. 11
(2013) 83.47] FDA, U.S. Food and Drug Administration, 2001, p. 1.48] M. Farré, S. Pérez, C. Gonc alves, M.F. Alpendurada, D. Barceló, Trends Anal.
Chem. 29 (2010) 1347.49] R. López-Serna, B. Kasprzyk-Hordern, M. Petrovic, D. Barceló, Anal. Bioanal.
Chem. 405 (2013) 5859.50] K. Bielicka-Daszkiewicz, A. Voelkel, Talanta 80 (2009) 614.51] W. Jian, R.W. Edom, Y. Xu, J. Gallagher, N. Weng, J. Chromatogr. B 878 (2010)
3267.52] Guideline on Bioanalytical Method Validation, EMEA/CHMP/EWP/192217/
2009, European Medicines Agency, London, United Kingdom, 2011, p. 1.53] Commission Decision of 12 August 2002 Implementing Council Directive
96/23/EC Concerning the Performance of Analytical Methods and the Inter-pretation of Results, Official Journal of the European Communities, 2002,p. 8.
Related Documents