Enabling Profiling and Analysis Tools for Aurora Rashawn L. Knapp Intel, Software and Service Group (SSG) Technical Computing, Analyzers, and Runtimes Scalable Tools Workshop, Granlibakken Resort, Lake Tahoe, California August 3-6, 2015 [email protected]

Welcome message from author
This document is posted to help you gain knowledge. Please leave a comment to let me know what you think about it! Share it to your friends and learn new things together.
Transcript
Enabling Profiling and Analysis Tools for Aurora
Rashawn L. Knapp
Intel, Software and Service Group (SSG)
Technical Computing, Analyzers, and Runtimes
Scalable Tools Workshop, Granlibakken Resort, Lake Tahoe, CaliforniaAugust 3-6, 2015
2
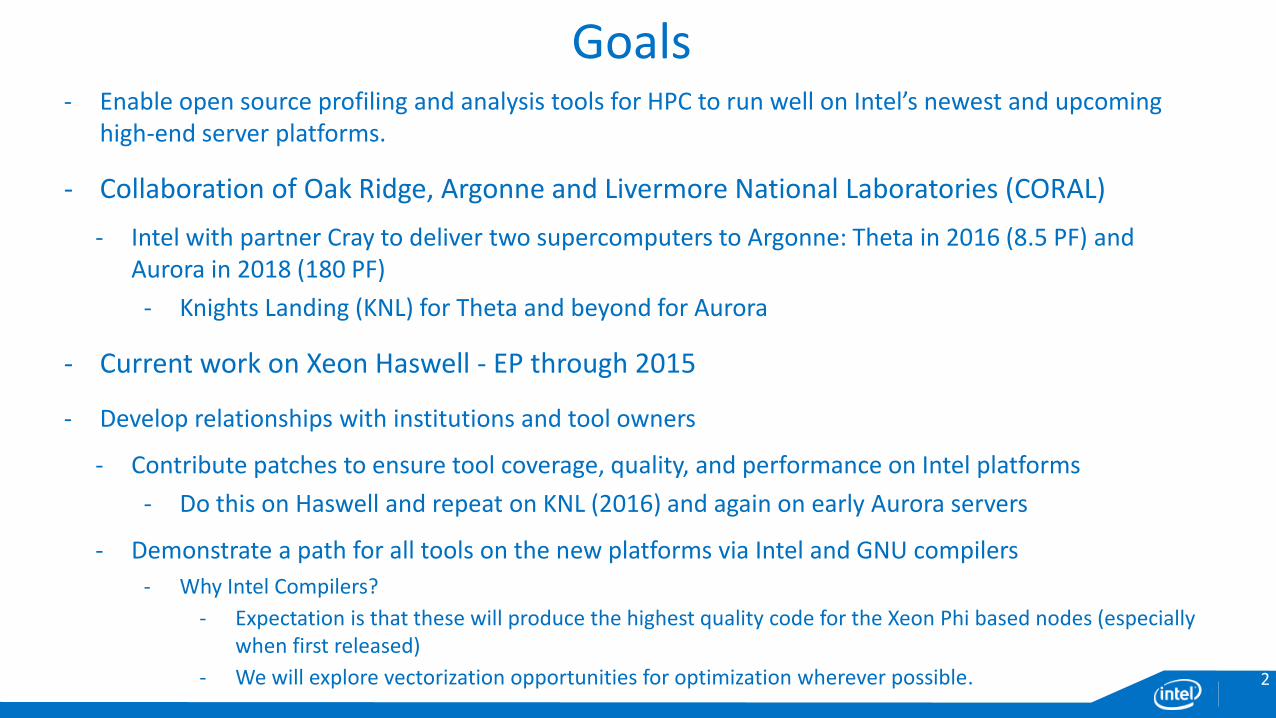
Goals‐ Enable open source profiling and analysis tools for HPC to run well on Intel’s newest and upcoming
high-end server platforms.
‐ Collaboration of Oak Ridge, Argonne and Livermore National Laboratories (CORAL)
‐ Intel with partner Cray to deliver two supercomputers to Argonne: Theta in 2016 (8.5 PF) and Aurora in 2018 (180 PF)
‐ Knights Landing (KNL) for Theta and beyond for Aurora
‐ Current work on Xeon Haswell - EP through 2015
‐ Develop relationships with institutions and tool owners
‐ Contribute patches to ensure tool coverage, quality, and performance on Intel platforms
‐ Do this on Haswell and repeat on KNL (2016) and again on early Aurora servers
‐ Demonstrate a path for all tools on the new platforms via Intel and GNU compilers
‐ Why Intel Compilers?
‐ Expectation is that these will produce the highest quality code for the Xeon Phi based nodes (especially when first released)
‐ We will explore vectorization opportunities for optimization wherever possible.
3
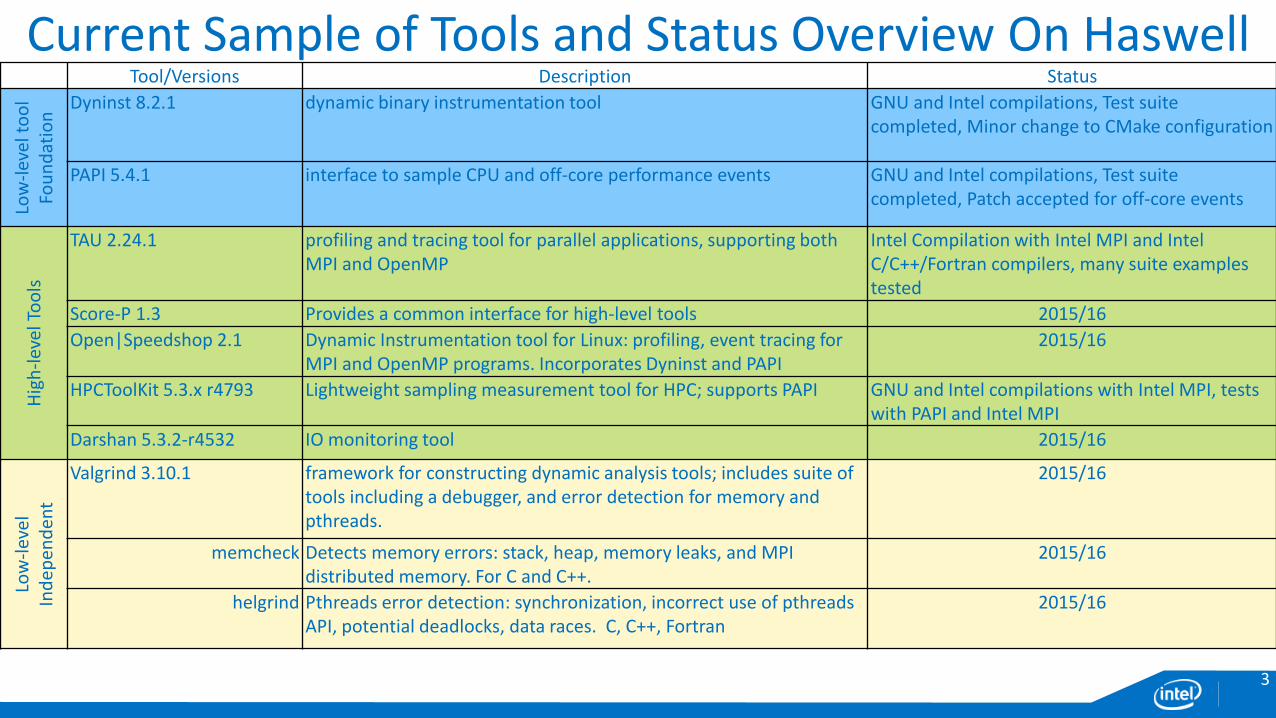
Current Sample of Tools and Status Overview On HaswellTool/Versions Description Status
Low
-lev
el t
oo
lFo
un
dat
ion
Dyninst 8.2.1 dynamic binary instrumentation tool GNU and Intel compilations, Test suite completed, Minor change to CMake configuration
PAPI 5.4.1 interface to sample CPU and off-core performance events GNU and Intel compilations, Test suite completed, Patch accepted for off-core events
Hig
h-l
evel
Too
ls
TAU 2.24.1 profiling and tracing tool for parallel applications, supporting both MPI and OpenMP
Intel Compilation with Intel MPI and Intel C/C++/Fortran compilers, many suite examples tested
Score-P 1.3 Provides a common interface for high-level tools 2015/16
Open|Speedshop 2.1 Dynamic Instrumentation tool for Linux: profiling, event tracing for MPI and OpenMP programs. Incorporates Dyninst and PAPI
2015/16
HPCToolKit 5.3.x r4793 Lightweight sampling measurement tool for HPC; supports PAPI GNU and Intel compilations with Intel MPI, tests with PAPI and Intel MPI
Darshan 5.3.2-r4532 IO monitoring tool 2015/16
Low
-lev
el
Ind
epen
den
t
Valgrind 3.10.1 framework for constructing dynamic analysis tools; includes suite of tools including a debugger, and error detection for memory and pthreads.
2015/16
memcheck Detects memory errors: stack, heap, memory leaks, and MPI distributed memory. For C and C++.
2015/16
helgrind Pthreads error detection: synchronization, incorrect use of pthreads API, potential deadlocks, data races. C, C++, Fortran
2015/16
4
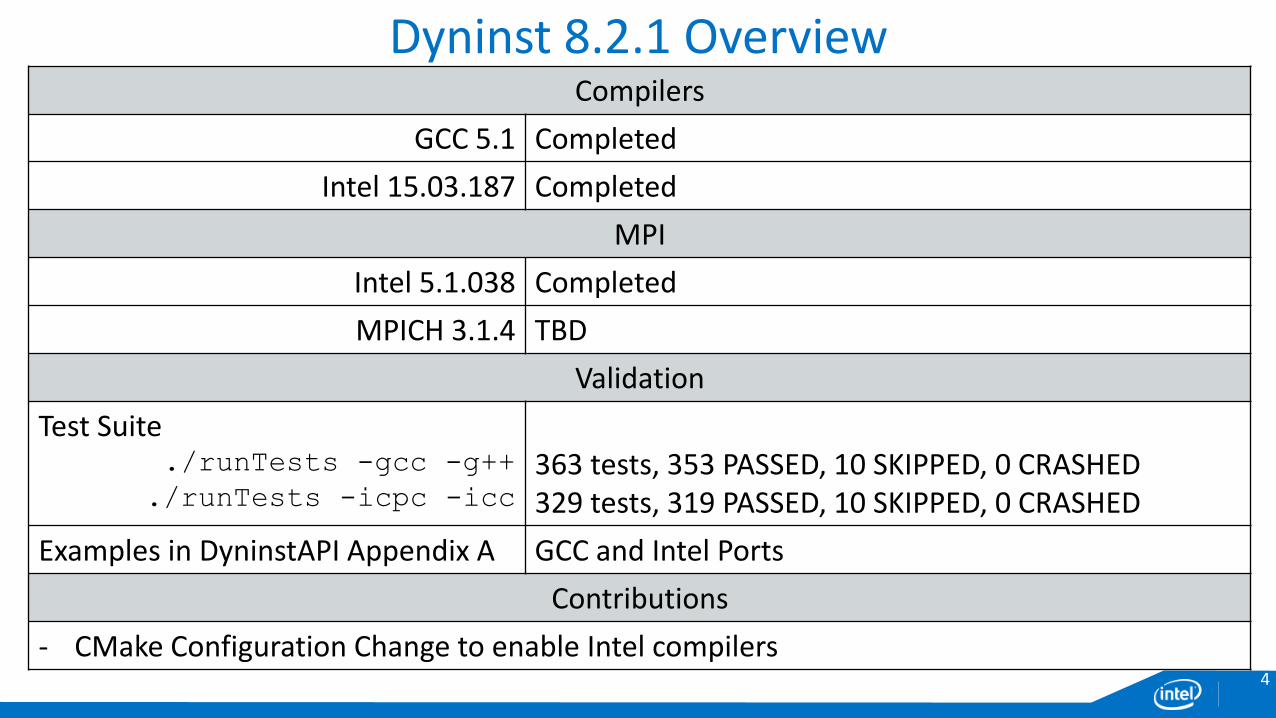
Dyninst 8.2.1 OverviewCompilers
GCC 5.1 Completed
Intel 15.03.187 Completed
MPI
Intel 5.1.038 Completed
MPICH 3.1.4 TBD
Validation
Test Suite./runTests -gcc -g++
./runTests -icpc -icc
363 tests, 353 PASSED, 10 SKIPPED, 0 CRASHED329 tests, 319 PASSED, 10 SKIPPED, 0 CRASHED
Examples in DyninstAPI Appendix A GCC and Intel Ports
Contributions
‐ CMake Configuration Change to enable Intel compilers
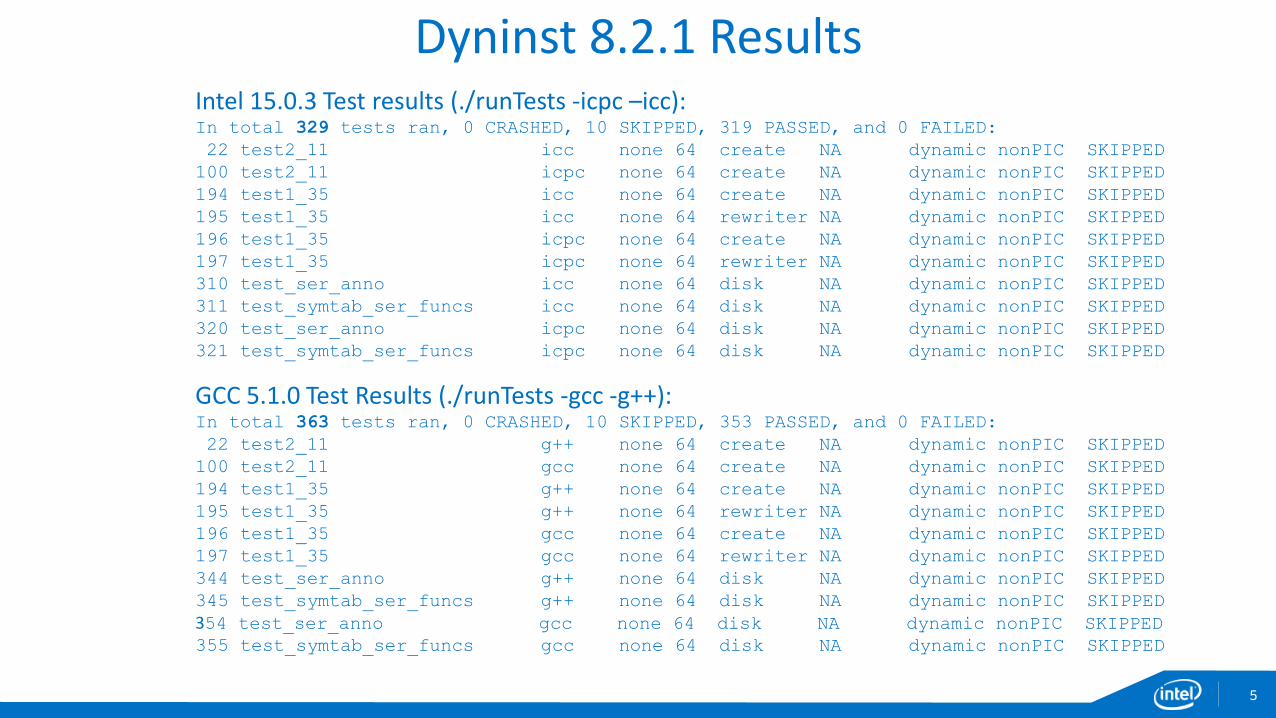
Dyninst 8.2.1 ResultsIntel 15.0.3 Test results (./runTests -icpc –icc):In total 329 tests ran, 0 CRASHED, 10 SKIPPED, 319 PASSED, and 0 FAILED:
22 test2_11 icc none 64 create NA dynamic nonPIC SKIPPED
100 test2_11 icpc none 64 create NA dynamic nonPIC SKIPPED
194 test1_35 icc none 64 create NA dynamic nonPIC SKIPPED
195 test1_35 icc none 64 rewriter NA dynamic nonPIC SKIPPED
196 test1_35 icpc none 64 create NA dynamic nonPIC SKIPPED
197 test1_35 icpc none 64 rewriter NA dynamic nonPIC SKIPPED
310 test_ser_anno icc none 64 disk NA dynamic nonPIC SKIPPED
311 test_symtab_ser_funcs icc none 64 disk NA dynamic nonPIC SKIPPED
320 test_ser_anno icpc none 64 disk NA dynamic nonPIC SKIPPED
321 test_symtab_ser_funcs icpc none 64 disk NA dynamic nonPIC SKIPPED
GCC 5.1.0 Test Results (./runTests -gcc -g++):In total 363 tests ran, 0 CRASHED, 10 SKIPPED, 353 PASSED, and 0 FAILED:
22 test2_11 g++ none 64 create NA dynamic nonPIC SKIPPED
100 test2_11 gcc none 64 create NA dynamic nonPIC SKIPPED
194 test1_35 g++ none 64 create NA dynamic nonPIC SKIPPED
195 test1_35 g++ none 64 rewriter NA dynamic nonPIC SKIPPED
196 test1_35 gcc none 64 create NA dynamic nonPIC SKIPPED
197 test1_35 gcc none 64 rewriter NA dynamic nonPIC SKIPPED
344 test_ser_anno g++ none 64 disk NA dynamic nonPIC SKIPPED
345 test_symtab_ser_funcs g++ none 64 disk NA dynamic nonPIC SKIPPED
354 test_ser_anno gcc none 64 disk NA dynamic nonPIC SKIPPED355 test_symtab_ser_funcs gcc none 64 disk NA dynamic nonPIC SKIPPED
5
6
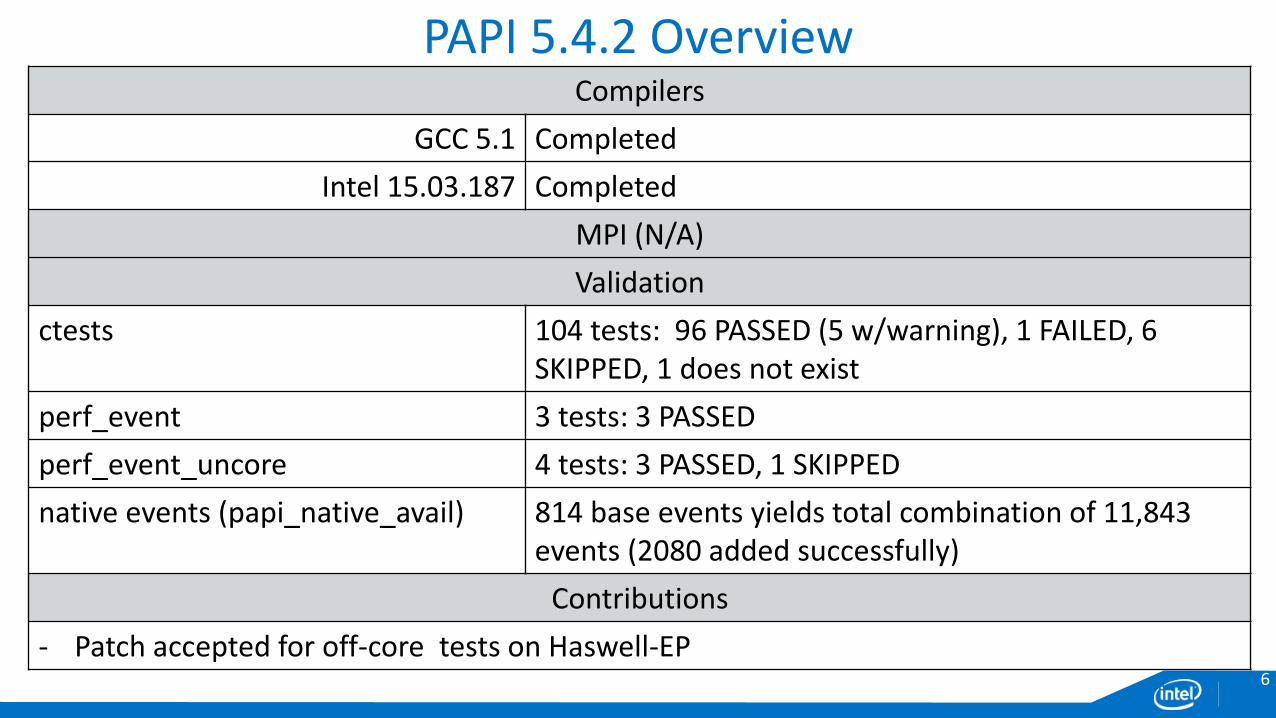
PAPI 5.4.2 OverviewCompilers
GCC 5.1 Completed
Intel 15.03.187 Completed
MPI (N/A)
Validation
ctests 104 tests: 96 PASSED (5 w/warning), 1 FAILED, 6SKIPPED, 1 does not exist
perf_event 3 tests: 3 PASSED
perf_event_uncore 4 tests: 3 PASSED, 1 SKIPPED
native events (papi_native_avail) 814 base events yields total combination of 11,843 events (2080 added successfully)
Contributions
‐ Patch accepted for off-core tests on Haswell-EP
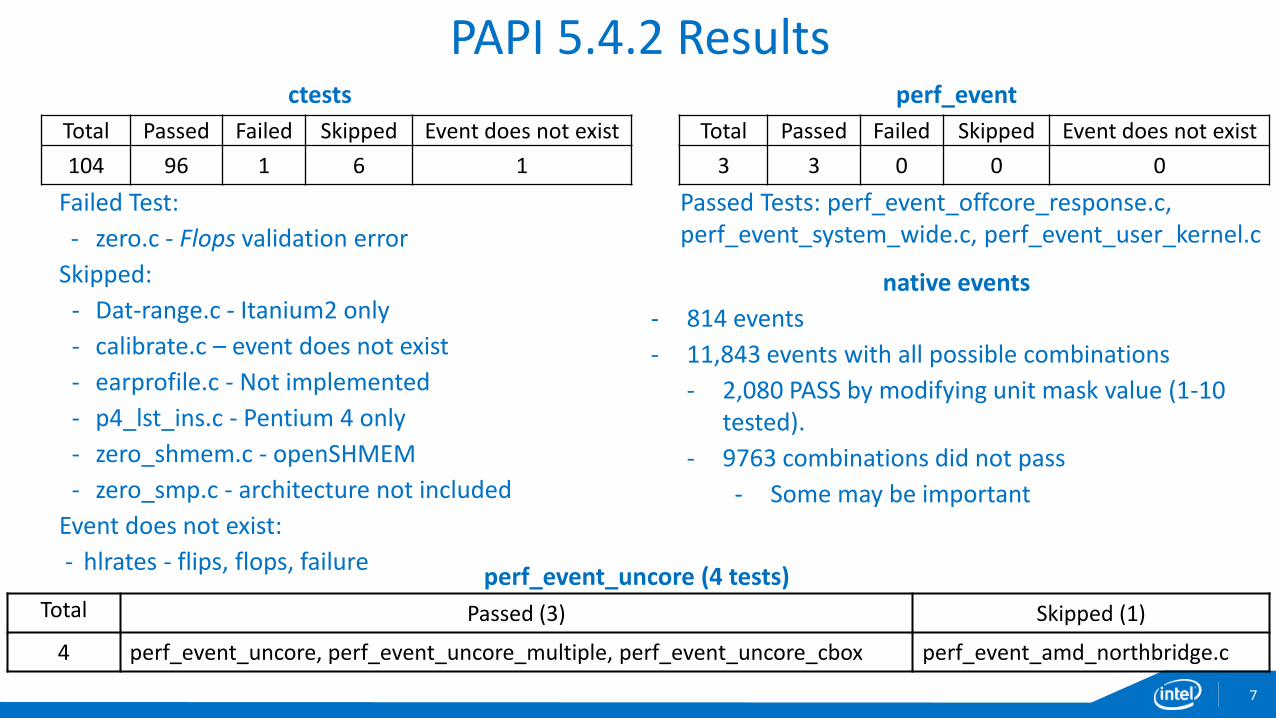
PAPI 5.4.2 Resultsctests
Failed Test:
‐ zero.c - Flops validation error
Skipped:
‐ Dat-range.c - Itanium2 only
‐ calibrate.c – event does not exist
‐ earprofile.c - Not implemented
‐ p4_lst_ins.c - Pentium 4 only
‐ zero_shmem.c - openSHMEM
‐ zero_smp.c - architecture not included
Event does not exist:
‐ hlrates - flips, flops, failure
Total Passed Failed Skipped Event does not exist
104 96 1 6 1
perf_event
Passed Tests: perf_event_offcore_response.c, perf_event_system_wide.c, perf_event_user_kernel.c
Total Passed Failed Skipped Event does not exist
3 3 0 0 0
native events
‐ 814 events
‐ 11,843 events with all possible combinations
‐ 2,080 PASS by modifying unit mask value (1-10 tested).
‐ 9763 combinations did not pass
‐ Some may be important
perf_event_uncore (4 tests)Total Passed (3) Skipped (1)
4 perf_event_uncore, perf_event_uncore_multiple, perf_event_uncore_cbox perf_event_amd_northbridge.c
7
8
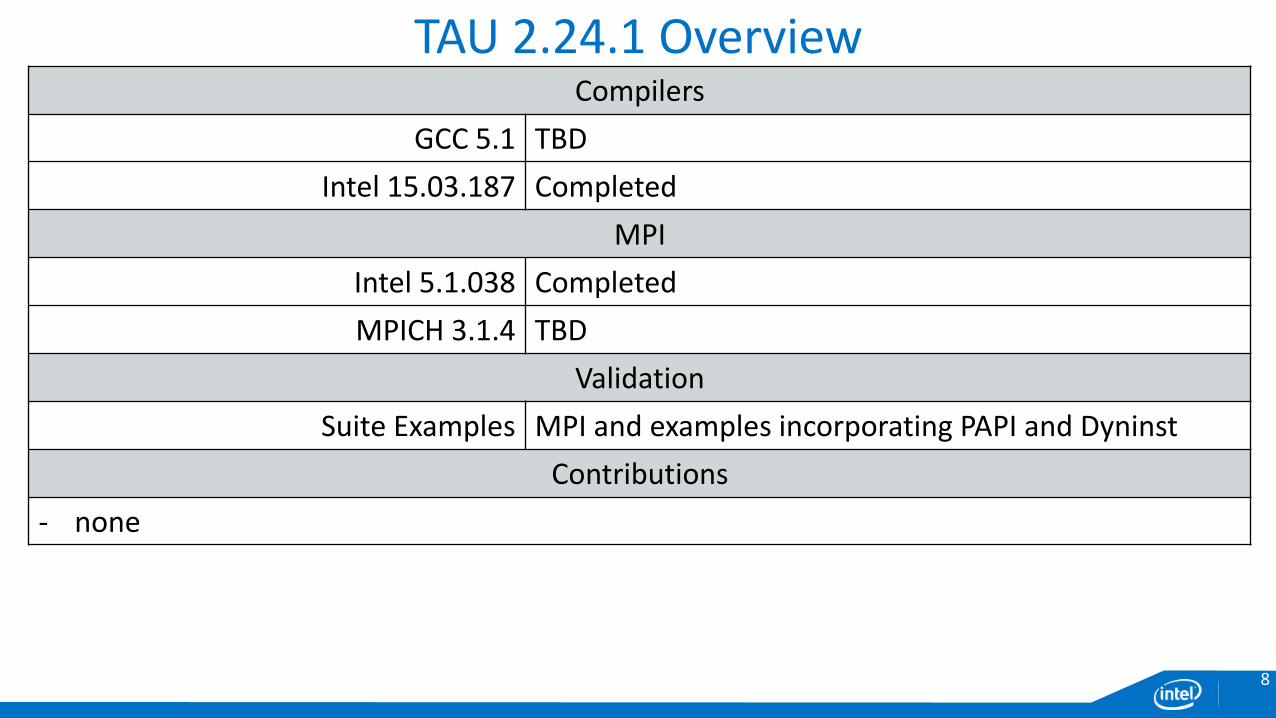
TAU 2.24.1 OverviewCompilers
GCC 5.1 TBD
Intel 15.03.187 Completed
MPI
Intel 5.1.038 Completed
MPICH 3.1.4 TBD
Validation
Suite Examples MPI and examples incorporating PAPI and Dyninst
Contributions
‐ none
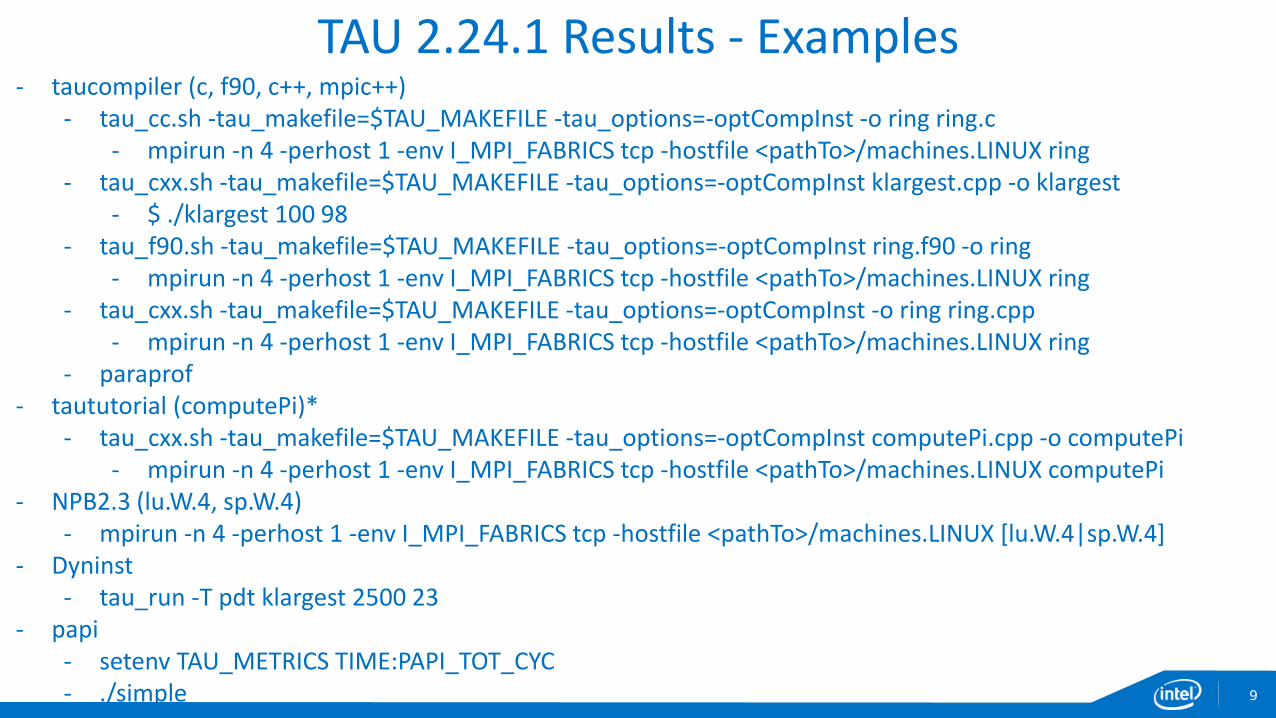
TAU 2.24.1 Results - Examples‐ taucompiler (c, f90, c++, mpic++)
‐ tau_cc.sh -tau_makefile=$TAU_MAKEFILE -tau_options=-optCompInst -o ring ring.c‐ mpirun -n 4 -perhost 1 -env I_MPI_FABRICS tcp -hostfile <pathTo>/machines.LINUX ring
‐ tau_cxx.sh -tau_makefile=$TAU_MAKEFILE -tau_options=-optCompInst klargest.cpp -o klargest‐ $ ./klargest 100 98
‐ tau_f90.sh -tau_makefile=$TAU_MAKEFILE -tau_options=-optCompInst ring.f90 -o ring‐ mpirun -n 4 -perhost 1 -env I_MPI_FABRICS tcp -hostfile <pathTo>/machines.LINUX ring
‐ tau_cxx.sh -tau_makefile=$TAU_MAKEFILE -tau_options=-optCompInst -o ring ring.cpp‐ mpirun -n 4 -perhost 1 -env I_MPI_FABRICS tcp -hostfile <pathTo>/machines.LINUX ring
‐ paraprof‐ taututorial (computePi)*
‐ tau_cxx.sh -tau_makefile=$TAU_MAKEFILE -tau_options=-optCompInst computePi.cpp -o computePi‐ mpirun -n 4 -perhost 1 -env I_MPI_FABRICS tcp -hostfile <pathTo>/machines.LINUX computePi
‐ NPB2.3 (lu.W.4, sp.W.4)‐ mpirun -n 4 -perhost 1 -env I_MPI_FABRICS tcp -hostfile <pathTo>/machines.LINUX [lu.W.4|sp.W.4]
‐ Dyninst‐ tau_run -T pdt klargest 2500 23
‐ papi‐ setenv TAU_METRICS TIME:PAPI_TOT_CYC‐ ./simple 9
11
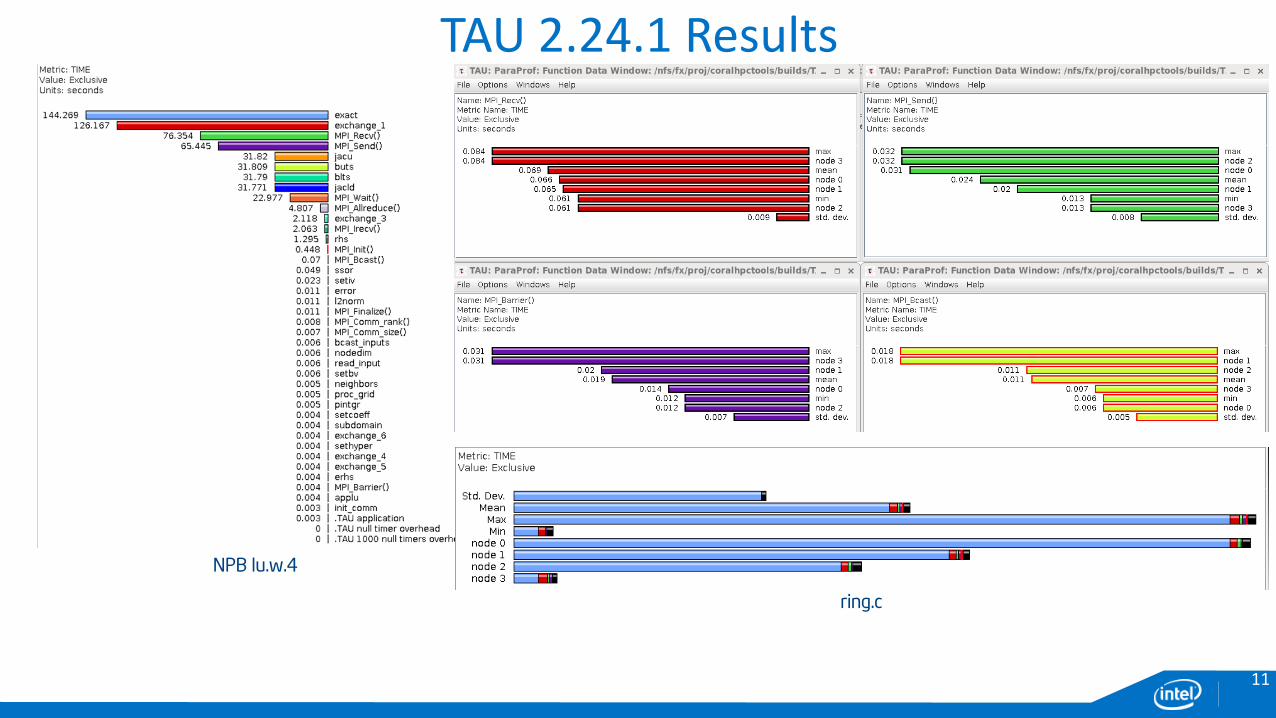
TAU 2.24.1 Results
NPB lu.w.4
ring.c
12
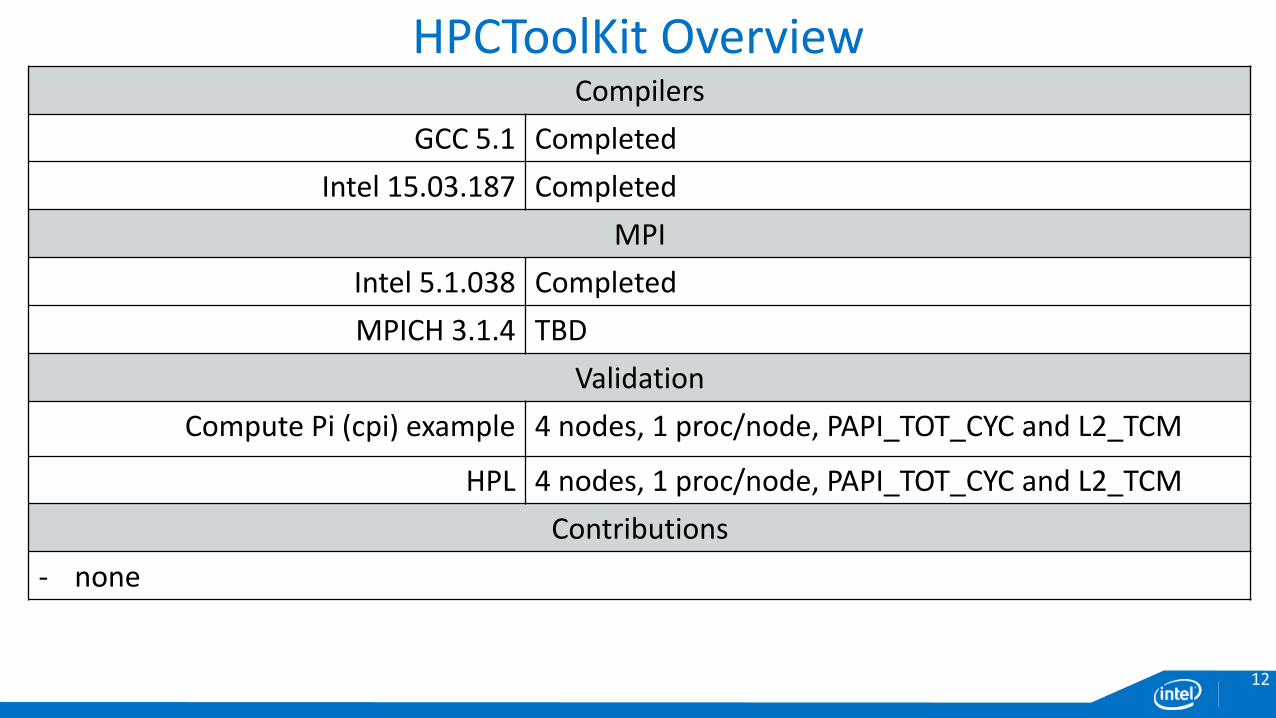
HPCToolKit OverviewCompilers
GCC 5.1 Completed
Intel 15.03.187 Completed
MPI
Intel 5.1.038 Completed
MPICH 3.1.4 TBD
Validation
Compute Pi (cpi) example 4 nodes, 1 proc/node, PAPI_TOT_CYC and L2_TCM
HPL 4 nodes, 1 proc/node, PAPI_TOT_CYC and L2_TCM
Contributions
‐ none
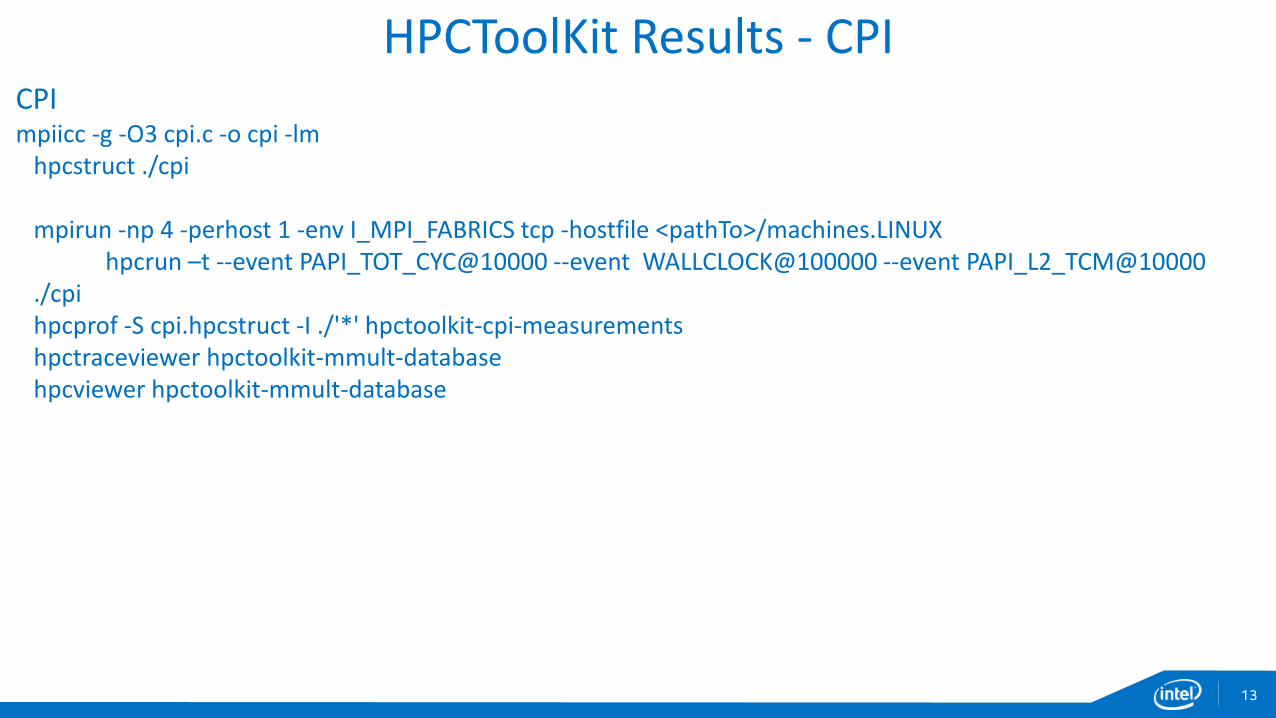
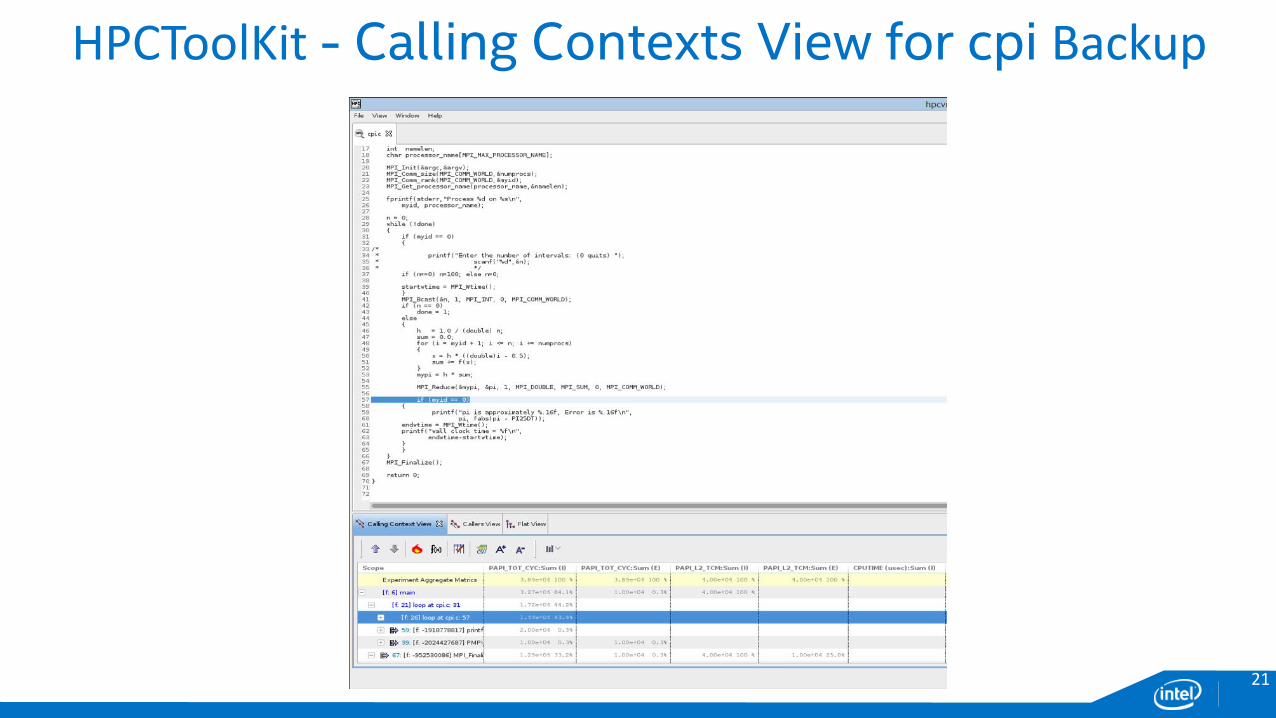
HPCToolKit Results - CPICPImpiicc -g -O3 cpi.c -o cpi -lm
hpcstruct ./cpi
mpirun -np 4 -perhost 1 -env I_MPI_FABRICS tcp -hostfile <pathTo>/machines.LINUX hpcrun –t --event PAPI_TOT_CYC@10000 --event WALLCLOCK@100000 --event PAPI_L2_TCM@10000
./cpihpcprof -S cpi.hpcstruct -I ./'*' hpctoolkit-cpi-measurementshpctraceviewer hpctoolkit-mmult-databasehpcviewer hpctoolkit-mmult-database
13
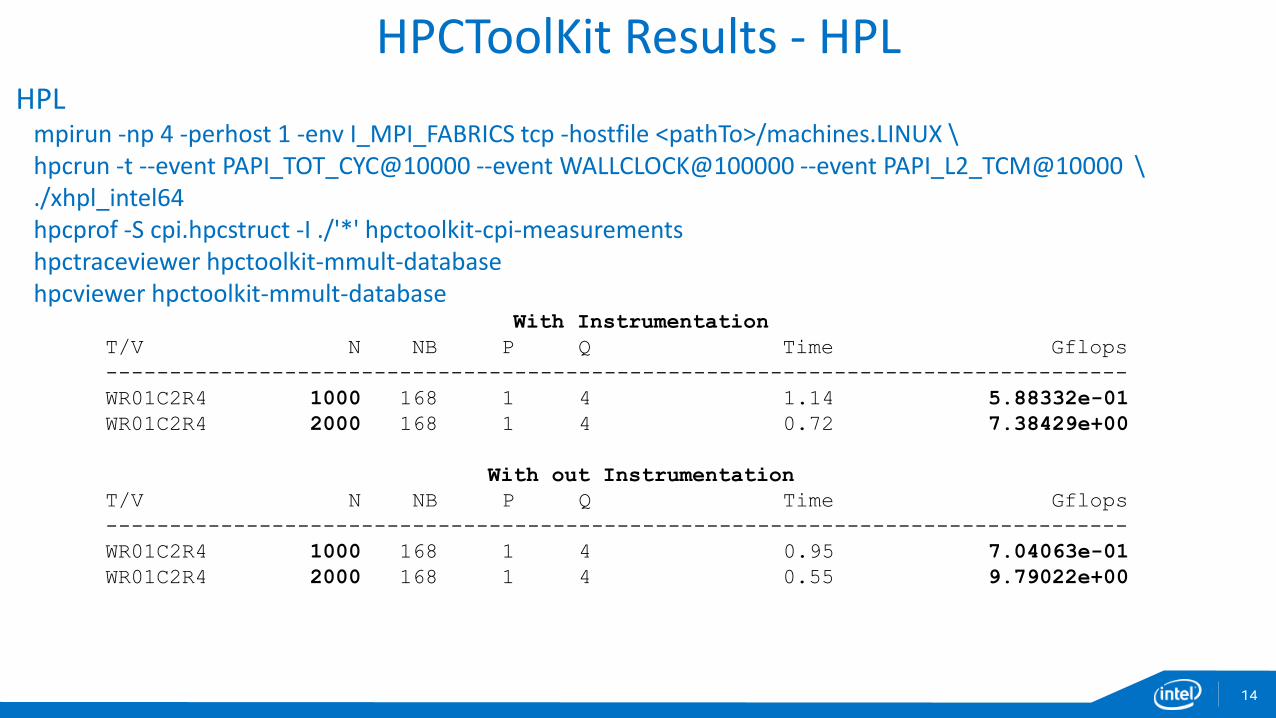
HPCToolKit Results - HPLHPL
mpirun -np 4 -perhost 1 -env I_MPI_FABRICS tcp -hostfile <pathTo>/machines.LINUX \hpcrun -t --event PAPI_TOT_CYC@10000 --event WALLCLOCK@100000 --event PAPI_L2_TCM@10000 \./xhpl_intel64hpcprof -S cpi.hpcstruct -I ./'*' hpctoolkit-cpi-measurementshpctraceviewer hpctoolkit-mmult-databasehpcviewer hpctoolkit-mmult-database
With Instrumentation
T/V N NB P Q Time Gflops
--------------------------------------------------------------------------------
WR01C2R4 1000 168 1 4 1.14 5.88332e-01
WR01C2R4 2000 168 1 4 0.72 7.38429e+00
With out Instrumentation
T/V N NB P Q Time Gflops
--------------------------------------------------------------------------------
WR01C2R4 1000 168 1 4 0.95 7.04063e-01
WR01C2R4 2000 168 1 4 0.55 9.79022e+00
14
15
Summary, Challenges, and Next Steps‐ Summary
‐ We have started and have a plan to ensure that these tools run well on the CORAL machines‐ We have conducted coverage studies up to this point; still need to conduct quality and performance studies‐ We welcome collaboration with the tool groups
‐ We will contribute patches as necessary‐ We started with the building block components of high level tools (e.g., Dyninst and PAPI), and we are now
incorporating these into the higher level tools (OpenSpeed|Shop, Score-P).
‐ Challenges‐ We are working on small clusters at this time, but will need to transition to larger clusters to complete the
performance studies
‐ Other open-source tools to consider for this contract?‐ STAT, MRNet
‐ New Technologies‐ Omni-Path network, NUMA technologies
16
AcknowledgmentsAll of the tool groups have been very responsive and helpful.
I want to thank Bill Williams from Dyninst who answered all of my questions regarding building, testing, and using.
Many thanks to the supportive PAPI team in guiding us through upgrading and testing.
And without my colleague, Preeti Suman, we would not have progressed to where we are.
17
ReferencesCORAL‐ http://insidehpc.com/2015/04/intel-build-coral-supercomputers-argonne-200-procurement/‐ http://www.hpcwire.com/2015/04/09/argonnes-200-million-supercomputing-award/‐ http://insidehpc.com/2015/05/interview-intels-alan-gara-discusses-the-180-petaflop-aurora-supercomputer/
New Technologies‐ http://www.intel.com/content/www/us/en/high-performance-computing-fabrics/omni-path-architecture-fabric-
overview.html‐ http://www.cnet.com/news/intel-and-micron-debut-3d-xpoint-storage-technology-thats-1000-times-faster-than-
existing-drives/

18
Legal Disclaimer & Optimization Notice
INFORMATION IN THIS DOCUMENT IS PROVIDED “AS IS”. NO LICENSE, EXPRESS OR IMPLIED, BY ESTOPPEL OR OTHERWISE, TO ANY
INTELLECTUAL PROPERTY RIGHTS IS GRANTED BY THIS DOCUMENT. INTEL ASSUMES NO LIABILITY WHATSOEVER AND INTEL DISCLAIMS
ANY EXPRESS OR IMPLIED WARRANTY, RELATING TO THIS INFORMATION INCLUDING LIABILITY OR WARRANTIES RELATING TO FITNESS FOR A PARTICULAR PURPOSE, MERCHANTABILITY, OR INFRINGEMENT OF ANY PATENT, COPYRIGHT OR OTHER INTELLECTUAL PROPERTY
RIGHT.
Software and workloads used in performance tests may have been optimized for performance only on Intel microprocessors. Performance
tests, such as SYSmark and MobileMark, are measured using specific computer systems, components, software, operations and functions.
Any change to any of those factors may cause the results to vary. You should consult other information and performance tests to assist you in fully evaluating your contemplated purchases, including the performance of that product when combined with other products.
Copyright © 2014, Intel Corporation. All rights reserved. Intel, Pentium, Xeon, Xeon Phi, Core, VTune, Cilk, and the Intel logo are trademarks
of Intel Corporation in the U.S. and other countries.
Optimization Notice
Intel’s compilers may or may not optimize to the same degree for non-Intel microprocessors for optimizations that are not unique to Intel microprocessors.
These optimizations include SSE2, SSE3, and SSSE3 instruction sets and other optimizations. Intel does not guarantee the availability, functionality, or
effectiveness of any optimization on microprocessors not manufactured by Intel. Microprocessor-dependent optimizations in this product are intended for
use with Intel microprocessors. Certain optimizations not specific to Intel microarchitecture are reserved for Intel microprocessors. Please refer to the
applicable product User and Reference Guides for more information regarding the specific instruction sets covered by this notice.
Notice revision #20110804
19
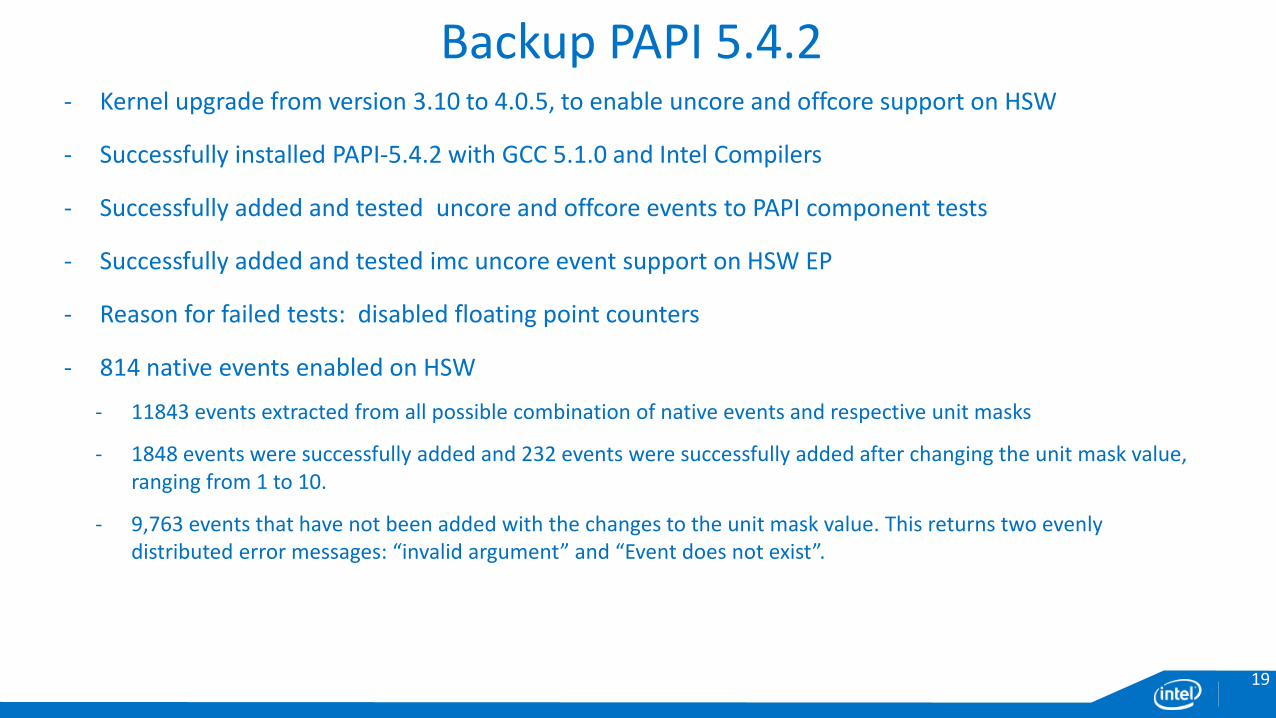
Backup PAPI 5.4.2‐ Kernel upgrade from version 3.10 to 4.0.5, to enable uncore and offcore support on HSW
‐ Successfully installed PAPI-5.4.2 with GCC 5.1.0 and Intel Compilers
‐ Successfully added and tested uncore and offcore events to PAPI component tests
‐ Successfully added and tested imc uncore event support on HSW EP
‐ Reason for failed tests: disabled floating point counters
‐ 814 native events enabled on HSW
‐ 11843 events extracted from all possible combination of native events and respective unit masks
‐ 1848 events were successfully added and 232 events were successfully added after changing the unit mask value, ranging from 1 to 10.
‐ 9,763 events that have not been added with the changes to the unit mask value. This returns two evenly distributed error messages: “invalid argument” and “Event does not exist”.
20
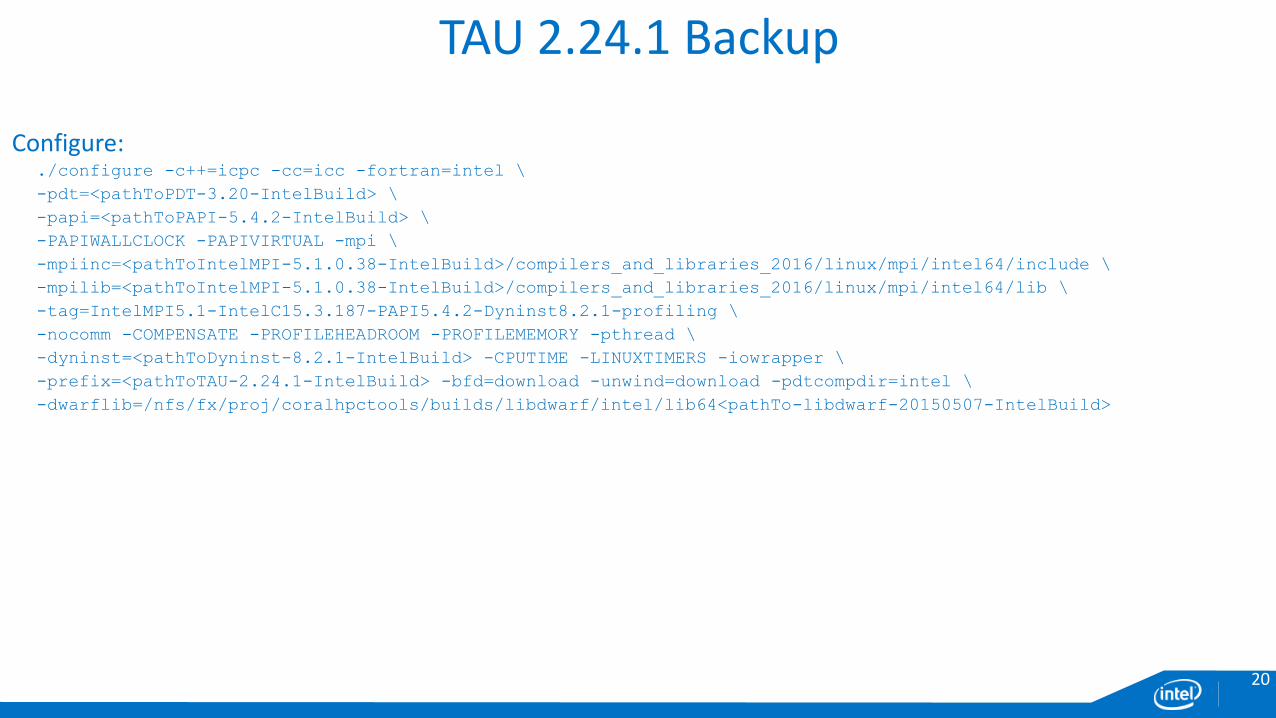
Configure:./configure -c++=icpc -cc=icc -fortran=intel \
-pdt=<pathToPDT-3.20-IntelBuild> \
-papi=<pathToPAPI-5.4.2-IntelBuild> \
-PAPIWALLCLOCK -PAPIVIRTUAL -mpi \
-mpiinc=<pathToIntelMPI-5.1.0.38-IntelBuild>/compilers_and_libraries_2016/linux/mpi/intel64/include \
-mpilib=<pathToIntelMPI-5.1.0.38-IntelBuild>/compilers_and_libraries_2016/linux/mpi/intel64/lib \
-tag=IntelMPI5.1-IntelC15.3.187-PAPI5.4.2-Dyninst8.2.1-profiling \
-nocomm -COMPENSATE -PROFILEHEADROOM -PROFILEMEMORY -pthread \
-dyninst=<pathToDyninst-8.2.1-IntelBuild> -CPUTIME -LINUXTIMERS -iowrapper \
-prefix=<pathToTAU-2.24.1-IntelBuild> -bfd=download -unwind=download -pdtcompdir=intel \
-dwarflib=/nfs/fx/proj/coralhpctools/builds/libdwarf/intel/lib64<pathTo-libdwarf-20150507-IntelBuild>
TAU 2.24.1 Backup
21
HPCToolKit - Calling Contexts View for cpi Backup
22
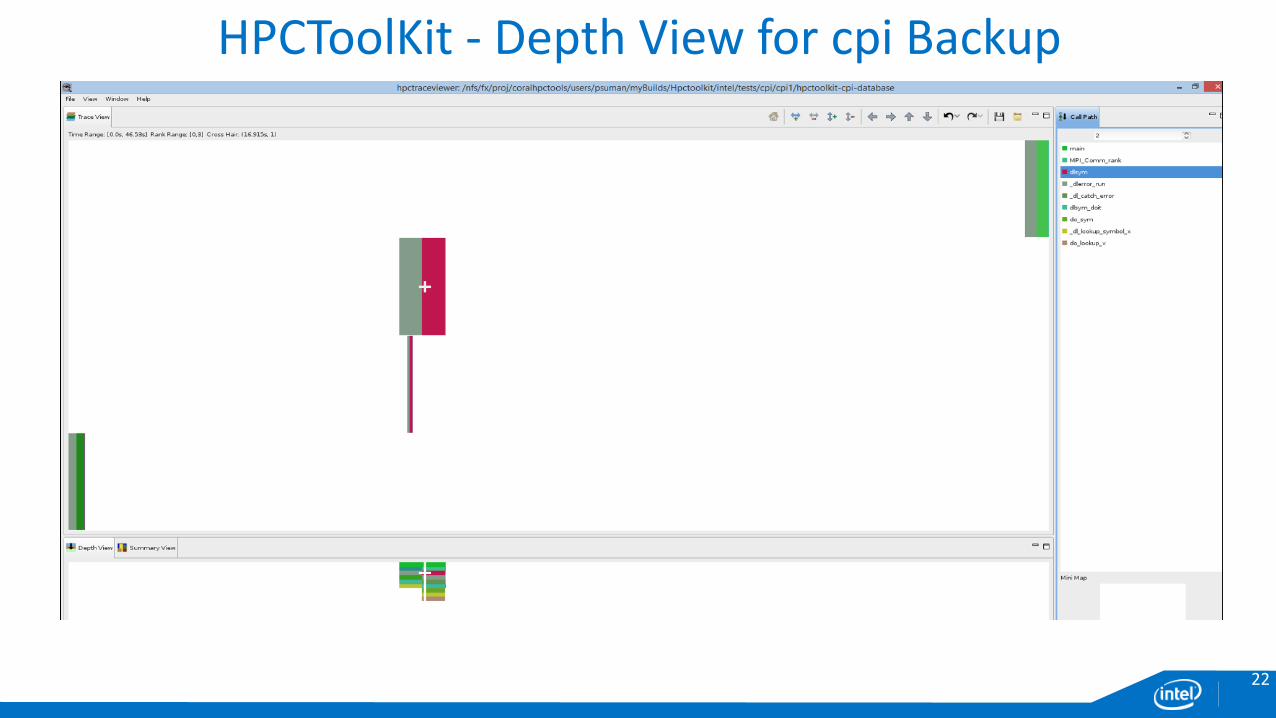
HPCToolKit - Depth View for cpi Backup
23
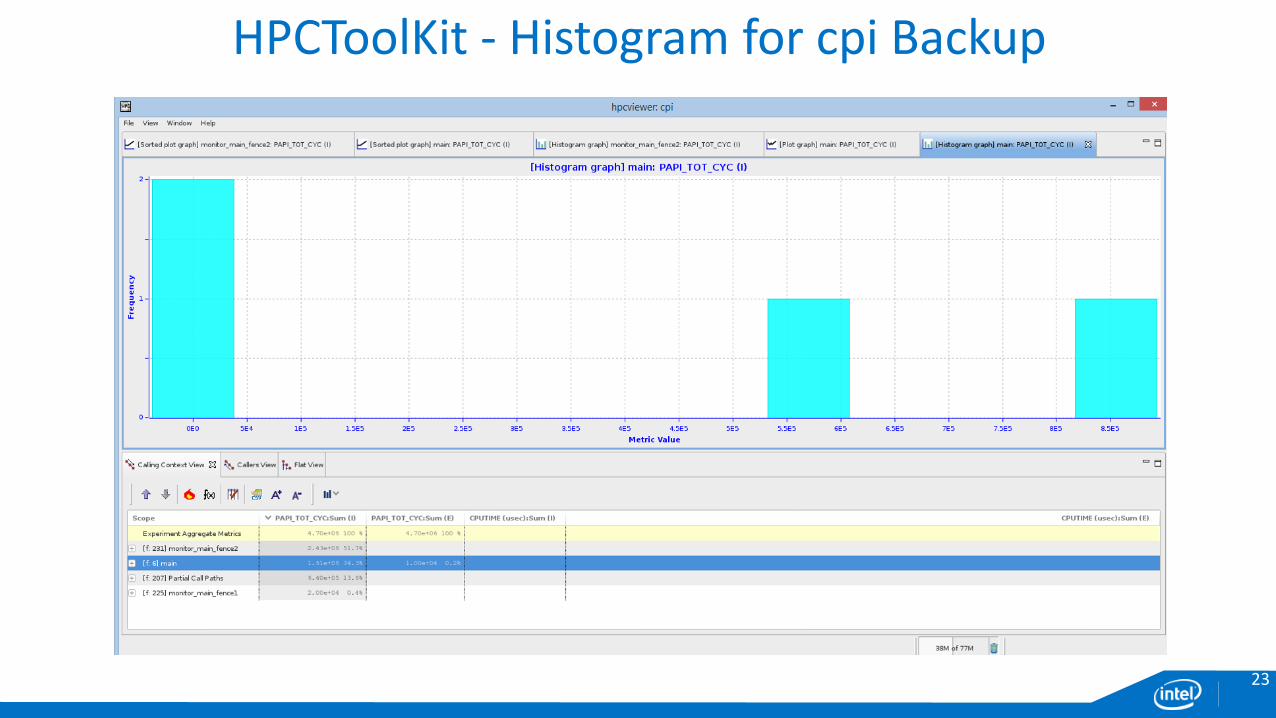
HPCToolKit - Histogram for cpi Backup
24
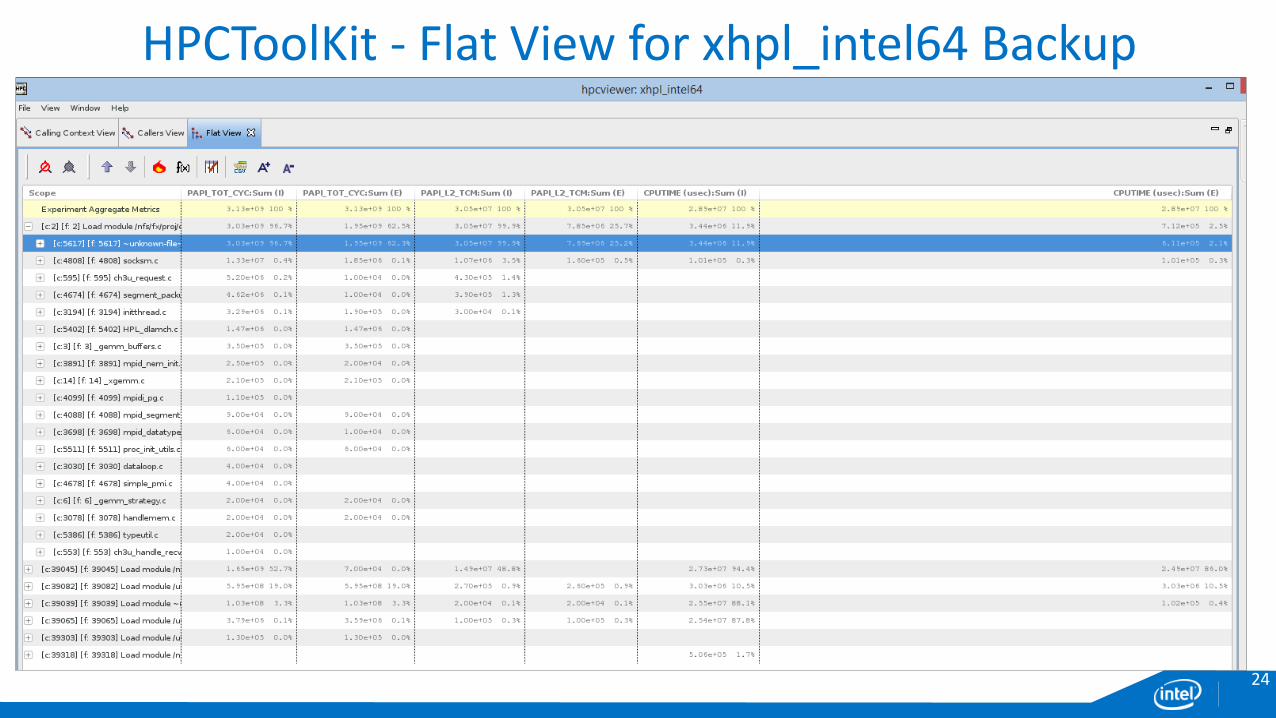
HPCToolKit - Flat View for xhpl_intel64 Backup

25
HPCToolKit - Depth View for xhpl_intel64 Backup
26
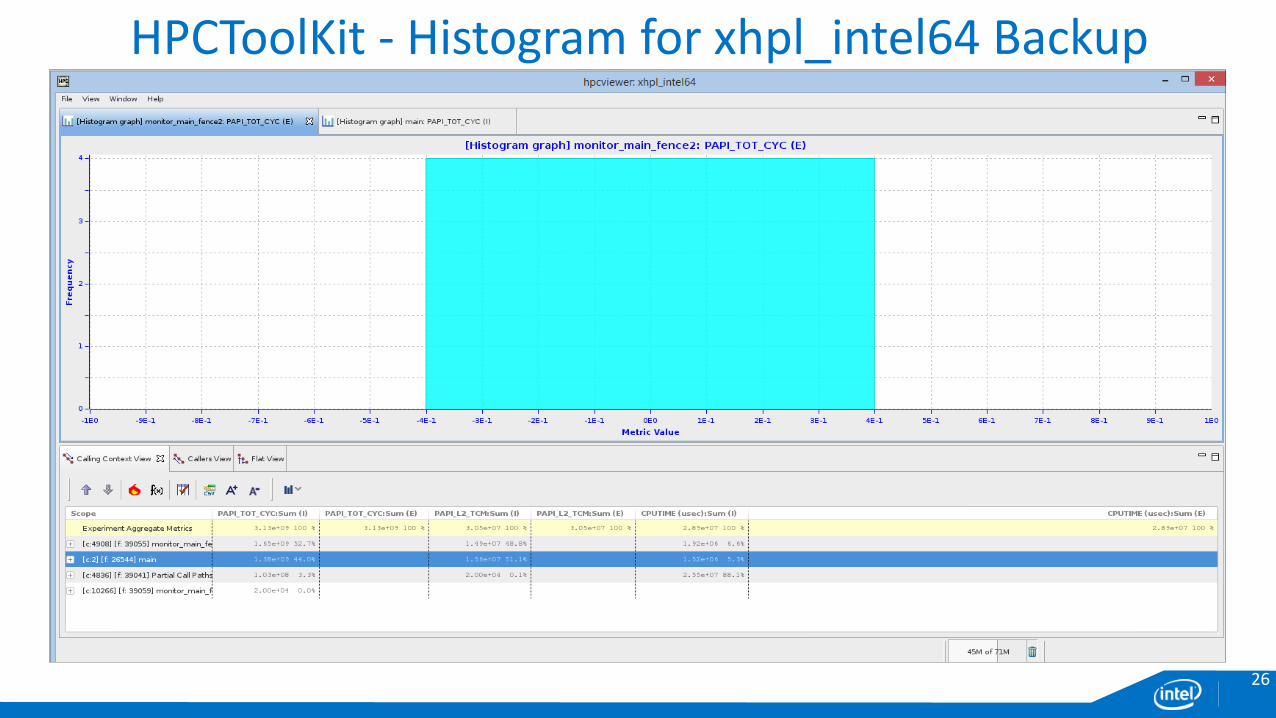
HPCToolKit - Histogram for xhpl_intel64 Backup
Related Documents