ENABLING CONDITIONS FOR EE/RE BASED EMPLOYMENT AND VALUE CREATION E GYPT Mohamed Salah ElSobki (Jr) Executive Chairman New and Renewable Energy Authority (NREA) Ministry of Electricity and Renewable Energy (MoE&RE) 1

Welcome message from author
This document is posted to help you gain knowledge. Please leave a comment to let me know what you think about it! Share it to your friends and learn new things together.
Transcript

ENABLING CONDITIONS FOR EE/RE
BASED EMPLOYMENT AND VALUE CREATION
EGYPT
Mohamed Salah ElSobki (Jr) Executive Chairman
New and Renewable Energy Authority (NREA) Ministry of Electricity and Renewable Energy (MoE&RE)
1

EE and RE as SAVIORS
High resources (multiple EE resources, Wind, Solar, Biomass, ……)
Short development durations
Mature technologies and declining investments
Limited O&M
Accepted environmentally (no fossil fuels, waste to energy)
2
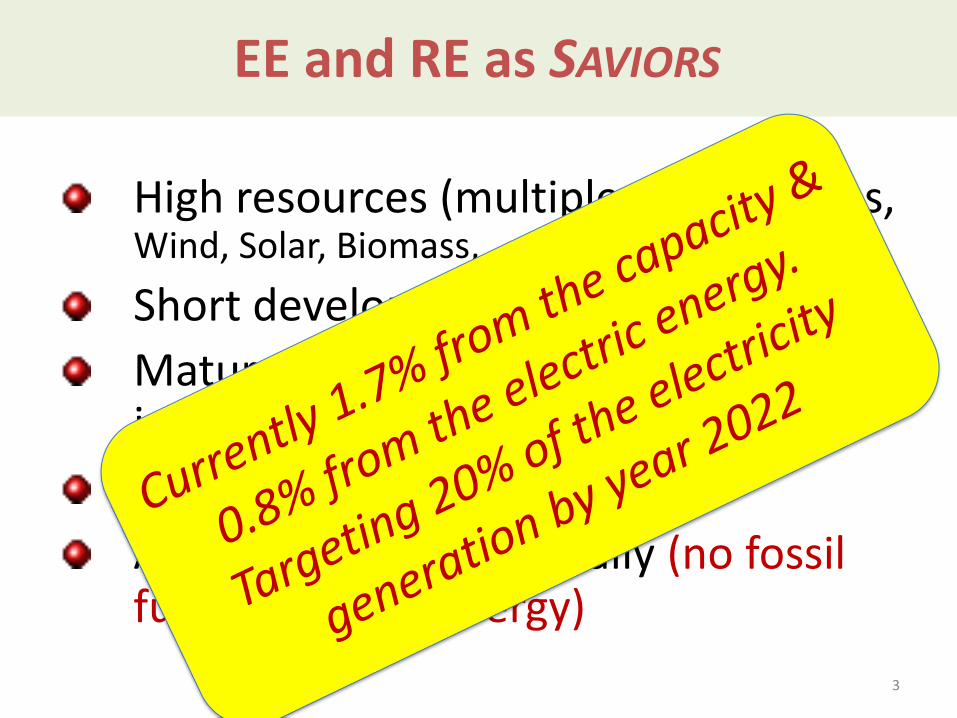
EE and RE as SAVIORS
High resources (multiple EE resources, Wind, Solar, Biomass, ……)
Short development durations
Mature technologies and declining investments
Limited O&M
Accepted environmentally (no fossil fuels, waste to energy)
3

EE & RE PLANS
EE to contribute by 8% reduction of needs by year 2022 equivalent to 20% of current usage).
RE contribution to electric energy mix by:
20% (2022)
30-40% (2035)
65% (2050)
4

Framework for RE Development Mechanisms
RENEWABLE ENERGY DEVELOPMENT SCHEMES
Renewable Energy Development Schemes in Egypt
Competitive Biding Fit/Quota
since 2014
Transmission (BOO) since 2009
Merchant IPP since 2012
New& Renewable Energy Authority (NERA)
(EPC contracts) since 1999
Thursday, September 10, 2015 5

Renewable Energy Plan until 2022 Plant Name
MW 2015 2016 2017 2018 2019 2020 2021 2022 2023
Existing Installed Capacities 890 (750 Wind+ 140 CSP) + 2800 Hydro
Wind Coop. with Italgen 120 200
Wind Gabal El Zayt (Japan) 220
Wind Coop. Spanish Gov. 120
Wind KfW, EIB, AFD, EU 200
Wind Masdar& NREA 200
Wind West Nile (Japan) 200
Wind AFD & KfW 200
WIND BOO G.Suez - 1 250
Wind BOO West Nile – 1a 250
Wind BOO West Nile – 1b 250
Wind Six projects (6x100MW) 600
6

Renewable Energy Plan until 2022(Cont.) Plant Name
MW 2015 2016 2017 2018 2019 2020 2021 2022 2023
PV Hurghada 20
PV Kom Ombo 20
PV-off grid (NREA-Masdar) 37
EETC PVs 200
EETC PVs 200
EETC CSP 50
FiT - Wind 250 1750
FiT - PV 1500 500
FiT - Rooftop 150 150
Siemens - Wind 180 250 250 300 350 350 320
Sub-Total 0 1687 2010 2600 1170 1150 350 350 320 Total (without Hydro) 9637 Total (with Hydro) 12307
7

Renewable Energy Plan until 2022(Cont.)
3217
1200
4300
920
0
500
1000
1500
2000
2500
3000
3500
4000
4500
5000
NREA (EPC contracts) EETC (BOO) Feed In Tariff IPP
MW
8

Renewable Energy Plan until 2022(Cont.)
0
1687
2010
2600
1170 1150
350 350 320
0
500
1000
1500
2000
2500
3000
2015 2016 2017 2018 2019 2020 2021 2022 2023
Capacity Added
MW
9

Renewable Energy Plan until 2022(Cont.)
Development
Mechanisms
Capacity
(MW)
Investment Cost
(Million US$)
NREA (EPC contracts) 3217 4200
EETC (BOO) 1200 1650
Feed In Tariff 4300 6450
IPP 920 1200
Total 9637 13500
10

Environmental Impacts
The expected electricity generation about
49 TWh/year by 2022/2023 (including
hydro) .
Fuel Saving about 9.7 million TOE/year .
CO2 emission reduction 25.3 TCO2/year
11

Socio-Economic Effects
12
Socio-economic effects can be measured along the different segments of the value chain, including :
project planning, manufacturing, installation, grid connection, operation and maintenance decommissioning.

Local Manufacturing (1-3)
Egypt’s key strengths for EE and RE industries development are:
Government’s commitment and support,
Availability of raw materials in the country,
Cost of energy is approaching real cost,
Relevant technological,
13

Local Manufacturing (2-3)
Egypt’s key strengths for EE and RE industries development are:
Manufacturing ability,
Ease of getting credit (financial risk competitiveness parameter),
qualified labor force available for: engineering, technical and management Knowledge and base capacities exist, but specifics for installation and maintenance shall be built.
14

Local Manufacturing (local content)
• local content in the existing wind farm reached:
–25-30% (towers, cables, transformers, civil & electrical works)
– reached to 50% (the solar portion).
• preferential procurement
• New factory for blade manufacturing is under implementation by Siemens Company and will be operated in August. 2017.
• A number of PV modules Assembly Factories
15

Jobs Creation
0
8435
10050
13000
5850 5750
1750 1750 1600
0
843 1005 1300
585 575 175 175 160
0
2000
4000
6000
8000
10000
12000
14000
2015 2016 2017 2018 2019 2020 2021 2022 2023
Indirect Employment Direct Employment
Total
About 48200 indirect jobs (5 jobs/ MW) .
About 4800 direct jobs (0.5 jobs/ MW)
16

Related Documents