Numbers Total Rev 0 1,000 COGS 705 295 Gross 0 705 Ex 1 555 150 Ex 2 443 112 Ex 3 343 100 Ex 4 248 95 Ex 5 213 35 Profit 0 213 1) Page 628 in the book "Learn E 2) 3) Expenses Eating Away At Profit The Trick is to create a Stacked Co the color of one of the data The idea for the second set of da Eating Away At Revenues", is to p numbers (No expenses Eating Away), amounts to show what is be

EMT246-251
Oct 27, 2014
Welcome message from author
This document is posted to help you gain knowledge. Please leave a comment to let me know what you think about it! Share it to your friends and learn new things together.
Transcript

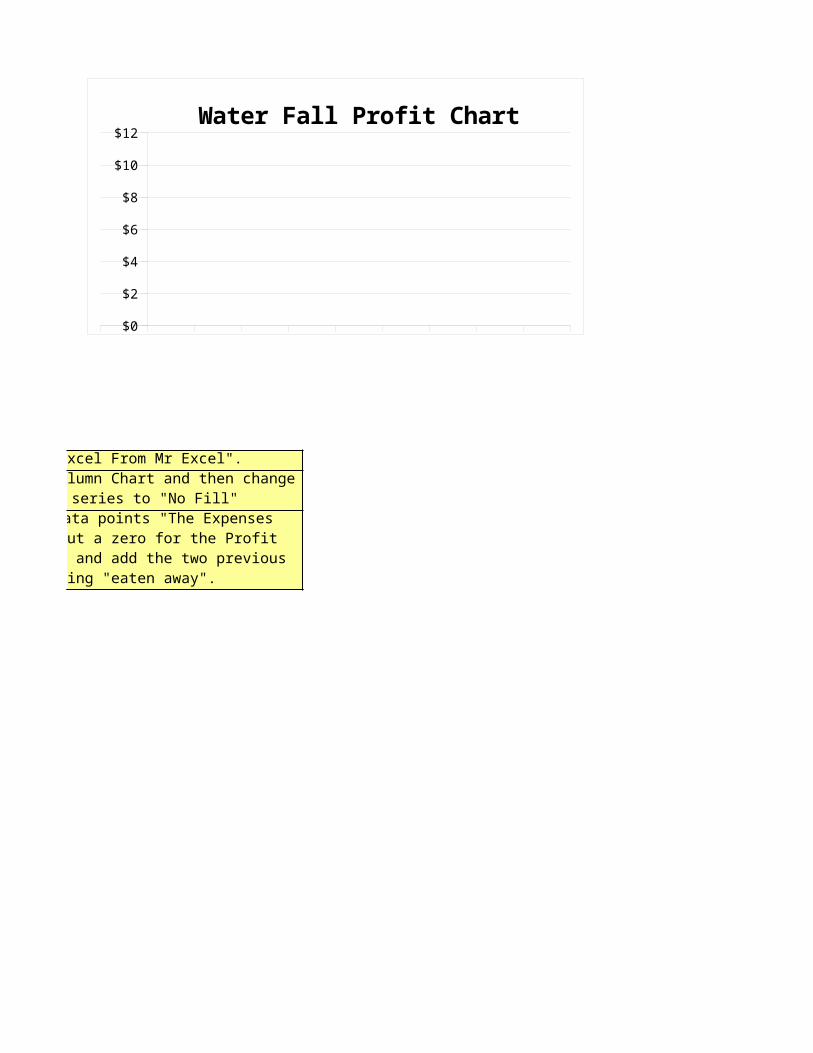
NumbersTotal Rev 0 1,000 COGS 705 295 Gross 0 705 Ex 1 555 150 Ex 2 443 112 Ex 3 343 100 Ex 4 248 95 Ex 5 213 35 Profit 0 213
1) Page 628 in the book "Learn Excel From Mr Excel".
2)
3)
Expenses Eating Away At Profit
The Trick is to create a Stacked Column Chart and then change the color of one of the data series to "No Fill"
The idea for the second set of data points "The Expenses Eating Away At Revenues", is to put a zero for the Profit numbers (No expenses Eating
Away), and add the two previous amounts to show what is being "eaten away".
$0
$2
$4
$6
$8
$10
$12Water Fall Profit Chart
Page 628 in the book "Learn Excel From Mr Excel".
The Trick is to create a Stacked Column Chart and then change the color of one of the data series to "No Fill"
The idea for the second set of data points "The Expenses Eating Away At Revenues", is to put a zero for the Profit numbers (No expenses Eating
Away), and add the two previous amounts to show what is being "eaten
$0
$2
$4
$6
$8
$10
$12Water Fall Profit Chart

1) Add leading Zeroes With Formula
2)3) The LEN function counts how many characters there are in a text siring4) The MAX function finds the biggest value amongst a list of values5) The REPT function repeats a text string a specified number of times6) Array Formulas are entered with the key strokes: Ctrl + Shift + Enter.
7) Leeroy from YouTube gave us this video: {=REPT(0,MAX(LEN(B$9:B$13))-LEN(B9))&B9}old formula Much Better formula from Leeroy
113th 113th 113th =REPT(0,MAX(LEN(B$9:B$13))-LEN(B9))&B911th 011th 011th1st 001st 001st77th 077th 077th7th 007th 007th
The IF function can put one of two things in a cell based on a logical test which evaluates to TRUE or FALSE

=REPT(0,MAX(LEN(B$9:B$13))-LEN(B9))&B9
No.
1 13 Min 02 13 1st 0.13 13 2nd 0.24 20 3rd 0.35 26 4th 0.46 27 5th 0.57 31 6th 0.68 34 7th 0.79 34 8th 0.8
10 34 9th 0.911 35 Max 112 35
13 36
14 37
15 38
16 41
17 4118 4119 4520 4721 4722 4723 5024 5125 5326 5427 5628 6229 6730 82
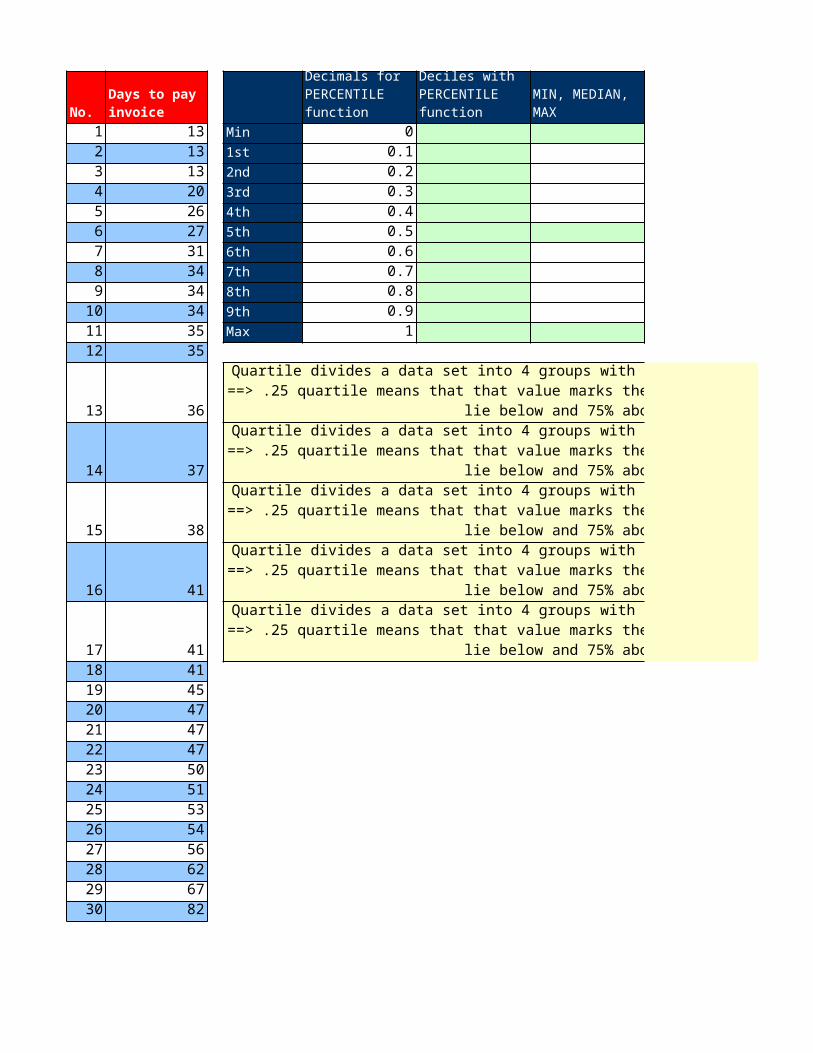
Days to pay invoice
Decimals for PERCENTILE function
Deciles with PERCENTILE function
MIN, MEDIAN, MAX
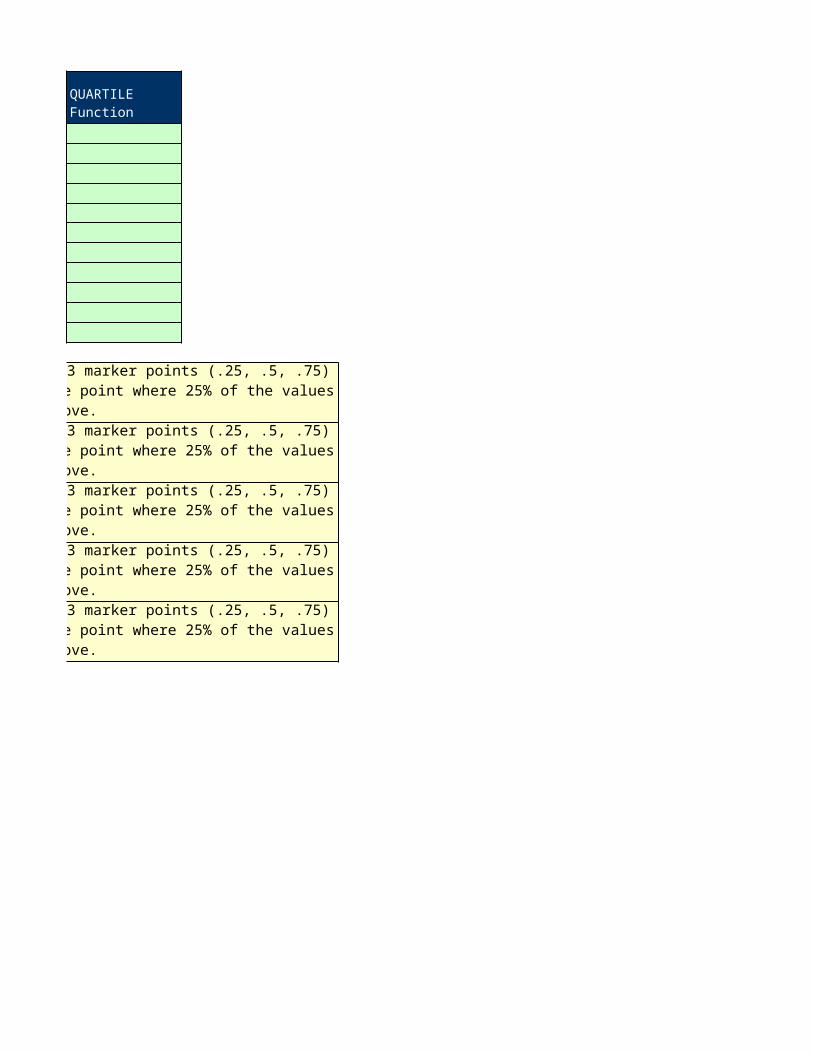
QUARTILE Function
Quartile divides a data set into 4 groups with 3 marker points (.25, .5, .75) ==> .25 quartile means that that value marks the point where 25% of the values lie below and 75% above.
Quartile divides a data set into 4 groups with 3 marker points (.25, .5, .75) ==> .25 quartile means that that value marks the point where 25% of the values lie below and 75% above.
Quartile divides a data set into 4 groups with 3 marker points (.25, .5, .75) ==> .25 quartile means that that value marks the point where 25% of the values lie below and 75% above.
Quartile divides a data set into 4 groups with 3 marker points (.25, .5, .75) ==> .25 quartile means that that value marks the point where 25% of the values lie below and 75% above.
Quartile divides a data set into 4 groups with 3 marker points (.25, .5, .75) ==> .25 quartile means that that value marks the point where 25% of the values lie below and 75% above.
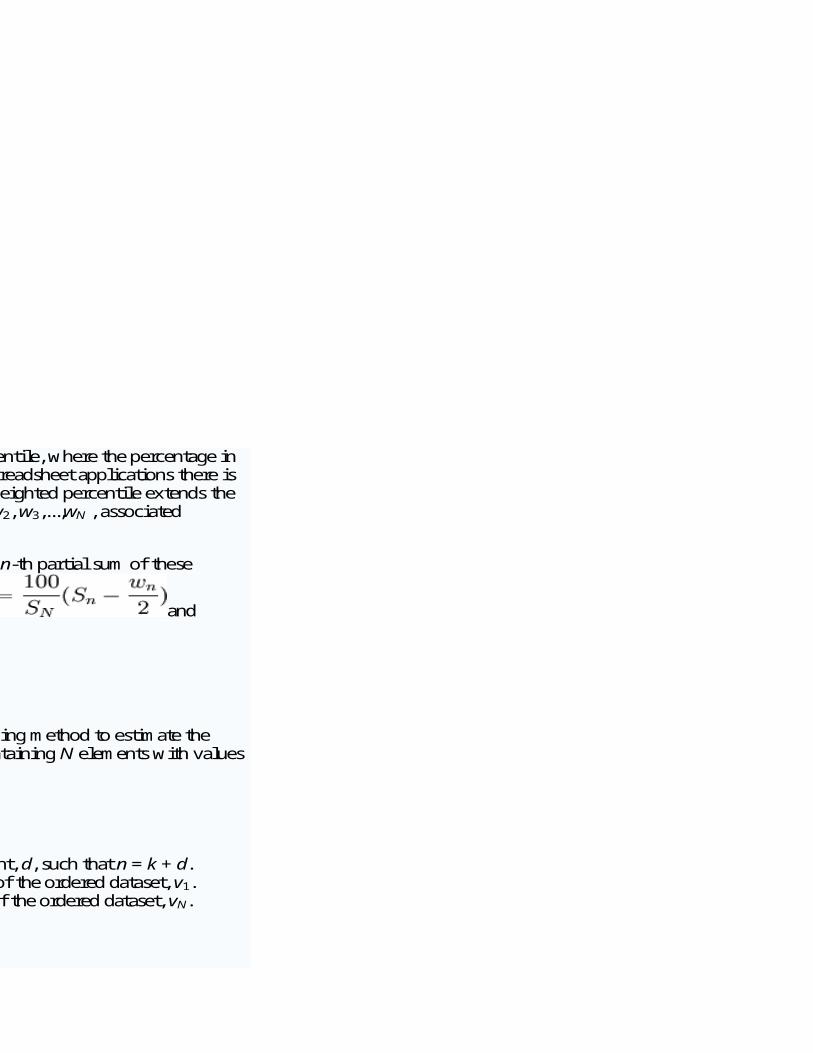
Linked with the percentile function, there is also a weighted percentile, where the percentage in the total weight is counted instead of the total number. In most spreadsheet applications there is no standard function for a weighted percentile. One method for weighted percentile extends the method described above. Suppose we have positive weights w1, w2, w3,...,wN , associated
respectively with our N sample values. Let be the n-th partial sum of these
weights. Then the formulae above are generalized by taking and
[edit] Alternative methods
Many software packages, such as Microsoft Excel, use the following method to estimate the value, vp, of the pth percentile of an ascending ordered dataset containing N elements with values v1,v2,...,vN;
n is then split into its integer component, k and decimal component, d, such that n = k + d. If k = 0, then the value for that percentile, vp, is the first member of the ordered dataset, v1. If k = N, then the value for that percentile, vp, is the Nth member of the ordered dataset, vN. Otherwise, 1 < k < N and vp = vk + d(vk + 1 − vk).
An alternative method is as above, with n calculated as

Quartile divides a data set into 4 groups with 3 marker points (.25, .5, .75) ==> .25 quartile means that that value marks the point where 25% of the values lie below and 75% above.
Quartile divides a data set into 4 groups with 3 marker points (.25, .5, .75) ==> .25 quartile means that that value marks the point where 25% of the values lie below and 75% above.
Quartile divides a data set into 4 groups with 3 marker points (.25, .5, .75) ==> .25 quartile means that that value marks the point where 25% of the values lie below and 75% above.
Quartile divides a data set into 4 groups with 3 marker points (.25, .5, .75) ==> .25 quartile means that that value marks the point where 25% of the values lie below and 75% above.
Quartile divides a data set into 4 groups with 3 marker points (.25, .5, .75) ==> .25 quartile means that that value marks the point where 25% of the values lie below and 75% above.

Linked with the percentile function, there is also a weighted percentile, where the percentage in the total weight is counted instead of the total number. In most spreadsheet applications there is no standard function for a weighted percentile. One method for weighted percentile extends the method described above. Suppose we have positive weights w1, w2, w3,...,wN , associated
respectively with our N sample values. Let be the n-th partial sum of these
weights. Then the formulae above are generalized by taking and
[edit] Alternative methods
Many software packages, such as Microsoft Excel, use the following method to estimate the value, vp, of the pth percentile of an ascending ordered dataset containing N elements with values v1,v2,...,vN;
n is then split into its integer component, k and decimal component, d, such that n = k + d. If k = 0, then the value for that percentile, vp, is the first member of the ordered dataset, v1. If k = N, then the value for that percentile, vp, is the Nth member of the ordered dataset, vN. Otherwise, 1 < k < N and vp = vk + d(vk + 1 − vk).
An alternative method is as above, with n calculated as
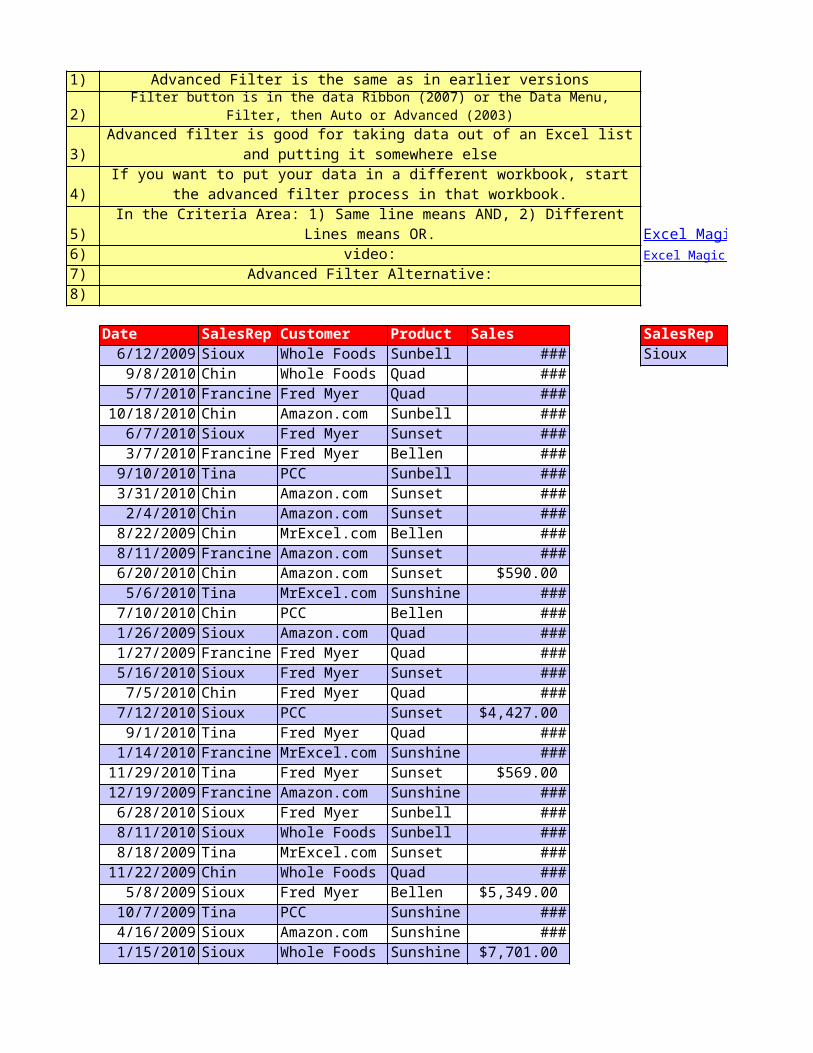
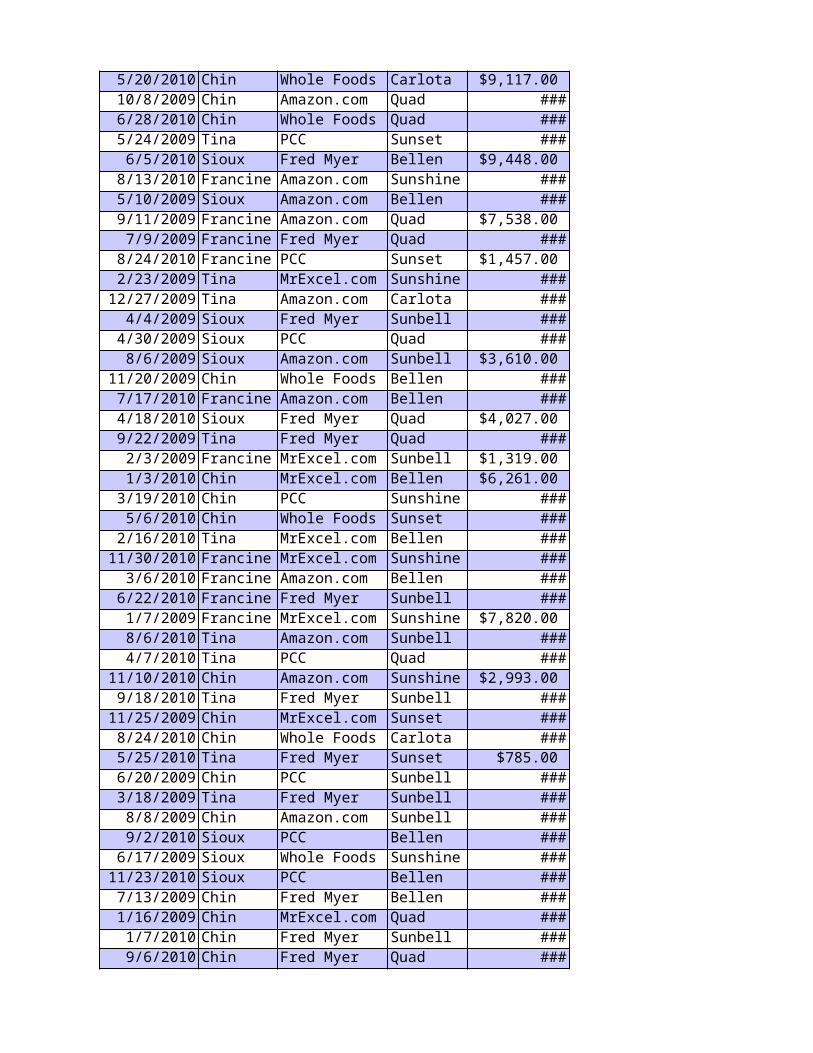
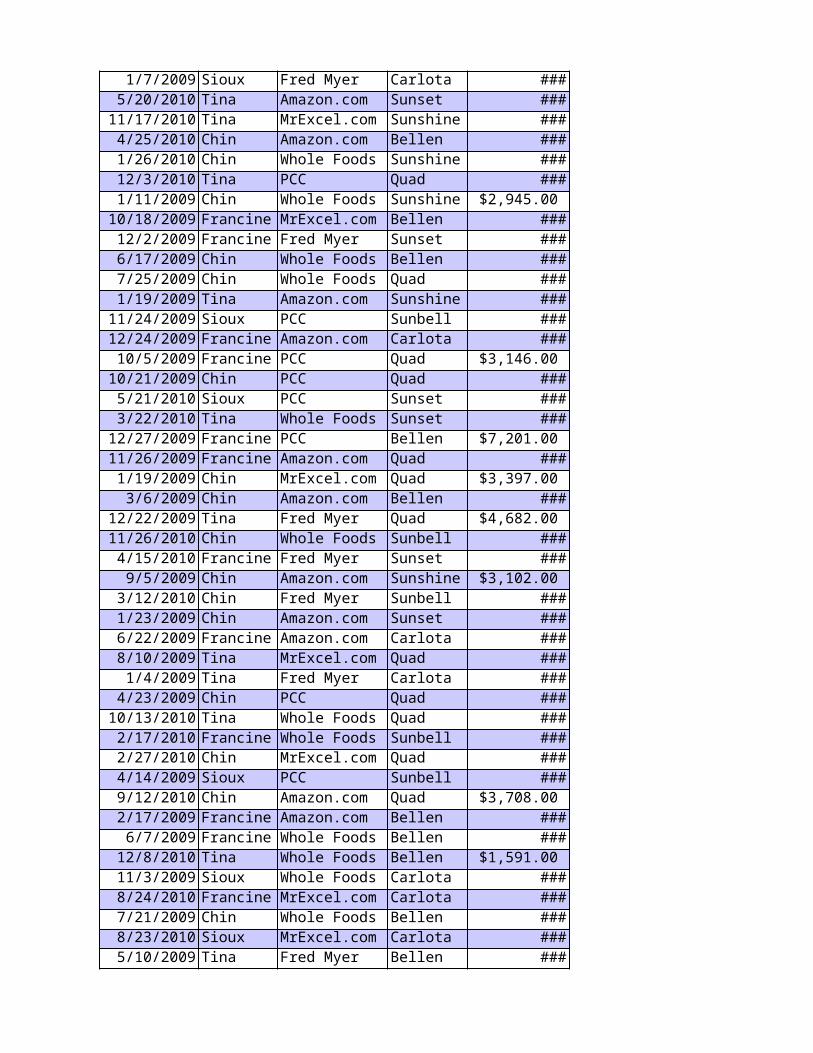
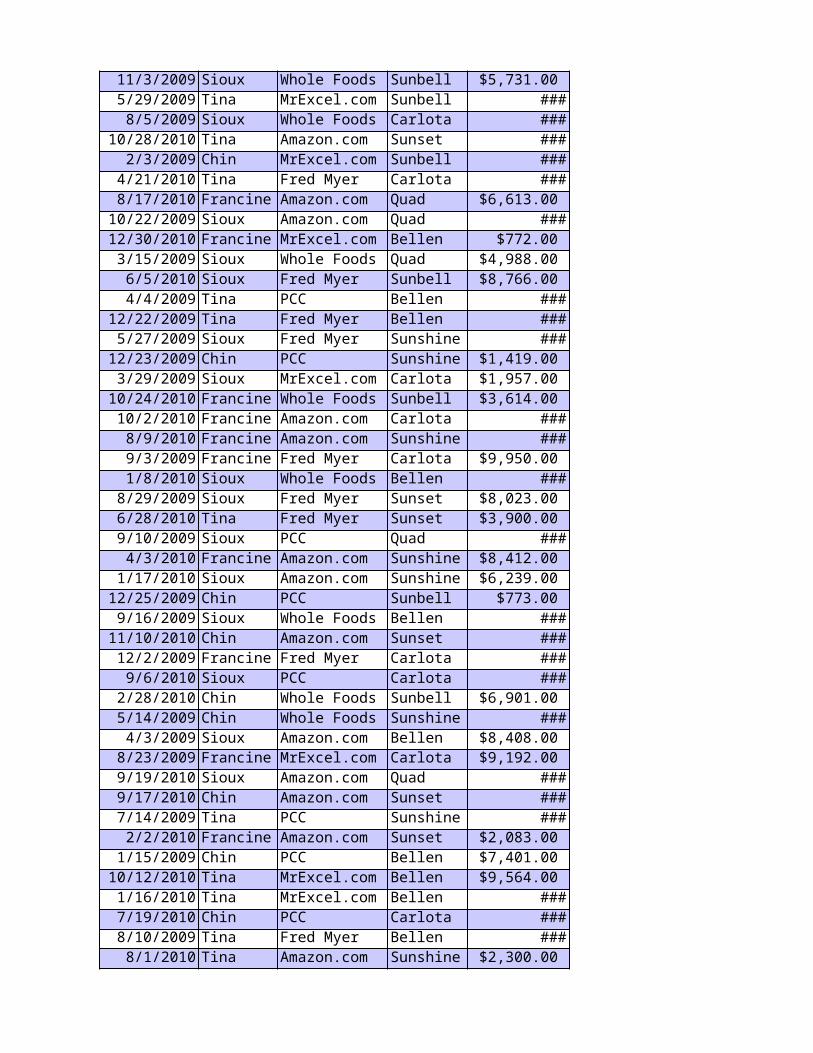
1) Advanced Filter is the same as in earlier versions
2)
3)
4)
5) In the Criteria Area: 1) Same line means AND, 2) Different Lines means OR.6) For more about Advanced Filter Record Extraction, see this video:7) Advanced Filter Alternative:8)
Date SalesRep Customer Product Sales SalesRep6/12/2009 Sioux Whole Foods Sunbell $10,634.00 Sioux
9/8/2010 Chin Whole Foods Quad $37,368.00 5/7/2010 Francine Fred Myer Quad $49,667.00
10/18/2010 Chin Amazon.com Sunbell $20,404.00 6/7/2010 Sioux Fred Myer Sunset $32,294.00 3/7/2010 Francine Fred Myer Bellen $11,477.00
9/10/2010 Tina PCC Sunbell $42,938.00 3/31/2010 Chin Amazon.com Sunset $15,261.00
2/4/2010 Chin Amazon.com Sunset $18,486.00 8/22/2009 Chin MrExcel.com Bellen $42,547.00 8/11/2009 Francine Amazon.com Sunset $25,966.00 6/20/2010 Chin Amazon.com Sunset $590.00
5/6/2010 Tina MrExcel.com Sunshine $21,986.00 7/10/2010 Chin PCC Bellen $24,148.00 1/26/2009 Sioux Amazon.com Quad $37,701.00 1/27/2009 Francine Fred Myer Quad $47,953.00 5/16/2010 Sioux Fred Myer Sunset $36,603.00
7/5/2010 Chin Fred Myer Quad $14,829.00 7/12/2010 Sioux PCC Sunset $4,427.00
9/1/2010 Tina Fred Myer Quad $49,912.00 1/14/2010 Francine MrExcel.com Sunshine $31,217.00
11/29/2010 Tina Fred Myer Sunset $569.00 12/19/2009 Francine Amazon.com Sunshine $25,568.00
6/28/2010 Sioux Fred Myer Sunbell $37,146.00 8/11/2010 Sioux Whole Foods Sunbell $30,649.00 8/18/2009 Tina MrExcel.com Sunset $10,794.00
11/22/2009 Chin Whole Foods Quad $24,200.00 5/8/2009 Sioux Fred Myer Bellen $5,349.00
10/7/2009 Tina PCC Sunshine $46,959.00 4/16/2009 Sioux Amazon.com Sunshine $11,193.00 1/15/2010 Sioux Whole Foods Sunshine $7,701.00 2/24/2010 Sioux Whole Foods Sunset $40,397.00 6/14/2010 Francine Whole Foods Carlota $18,483.00 11/4/2010 Chin Amazon.com Sunset $12,075.00
12/28/2010 Sioux Fred Myer Carlota $26,919.00
Filter button is in the data Ribbon (2007) or the Data Menu, Filter, then Auto or Advanced (2003)
Advanced filter is good for taking data out of an Excel list and putting it somewhere else
If you want to put your data in a different workbook, start the advanced filter process in that workbook.
Excel Magic Trick #81: Advanced Filter AND OR Data ExtractExcel Magic Trick 185.5 Advanced Filter Data Extract 1criter

7/4/2009 Chin Amazon.com Sunshine $10,596.00 2/18/2009 Tina Amazon.com Sunset $2,318.00 8/15/2010 Chin Whole Foods Sunset $8,581.00
10/31/2010 Sioux Fred Myer Carlota $24,116.00 8/19/2009 Francine Amazon.com Quad $5,653.00 1/30/2009 Sioux Fred Myer Sunset $17,422.00 11/9/2010 Chin Whole Foods Sunset $1,305.00
8/2/2009 Tina Amazon.com Sunbell $39,814.00 4/2/2010 Sioux PCC Carlota $6,386.00
7/23/2009 Tina PCC Sunshine $7,867.00 4/9/2010 Chin Amazon.com Carlota $25,013.00
6/22/2010 Tina PCC Sunshine $21,075.00 3/26/2009 Chin Amazon.com Quad $22,378.00 5/30/2009 Sioux MrExcel.com Sunbell $17,229.00 3/24/2010 Sioux Amazon.com Sunset $39,119.00
11/22/2010 Tina Whole Foods Sunbell $19,152.00 8/17/2010 Sioux Whole Foods Carlota $33,404.00
8/8/2010 Francine Fred Myer Sunset $29,791.00 10/16/2009 Chin Whole Foods Bellen $2,664.00
1/13/2010 Tina Whole Foods Bellen $19,505.00 3/7/2009 Tina Amazon.com Sunshine $30,797.00 5/9/2009 Chin MrExcel.com Sunbell $43,806.00
8/17/2010 Francine MrExcel.com Sunset $46,767.00 3/15/2010 Chin Whole Foods Sunshine $41,208.00
7/4/2009 Francine PCC Sunbell $18,459.00 5/25/2009 Chin PCC Sunshine $11,853.00 3/14/2010 Chin MrExcel.com Bellen $34,773.00 8/29/2009 Sioux PCC Carlota $3,692.00
2/7/2009 Tina PCC Sunshine $15,100.00 9/12/2009 Tina MrExcel.com Sunbell $46,669.00 6/15/2010 Sioux MrExcel.com Carlota $5,494.00
12/19/2009 Sioux Whole Foods Bellen $41,310.00 3/16/2009 Tina MrExcel.com Sunbell $36,382.00
6/3/2009 Chin MrExcel.com Quad $24,334.00 8/11/2010 Francine Fred Myer Sunshine $15,389.00 11/4/2010 Francine PCC Bellen $13,465.00 9/24/2010 Francine Amazon.com Carlota $30,043.00
6/8/2009 Chin Amazon.com Bellen $47,842.00 5/14/2009 Francine Amazon.com Sunset $12,400.00 9/26/2009 Francine MrExcel.com Carlota $28,324.00 9/14/2009 Tina PCC Carlota $16,277.00 3/25/2010 Tina PCC Quad $25,241.00
6/8/2010 Tina Amazon.com Carlota $10,427.00 10/20/2009 Francine Fred Myer Sunshine $24,214.00 10/12/2009 Sioux Whole Foods Sunset $27,066.00
10/5/2009 Sioux Amazon.com Quad $6,363.00 12/31/2009 Tina PCC Sunbell $43,968.00
6/8/2009 Tina Amazon.com Sunset $8,439.00
1/28/2010 Chin Whole Foods Sunset $33,536.00 1/17/2009 Tina Amazon.com Sunbell $33,776.00 1/20/2009 Sioux Fred Myer Bellen $31,935.00 11/3/2010 Chin MrExcel.com Quad $35,702.00 6/11/2010 Chin Amazon.com Sunset $4,984.00 3/22/2009 Francine Amazon.com Sunshine $26,881.00
3/2/2010 Chin Amazon.com Sunbell $32,999.00 4/20/2010 Francine PCC Carlota $23,149.00
12/14/2010 Sioux MrExcel.com Sunshine $41,433.00 3/30/2009 Chin PCC Bellen $14,639.00
6/3/2009 Tina PCC Carlota $2,188.00 12/7/2009 Tina Whole Foods Quad $817.00 7/25/2009 Tina PCC Quad $23,147.00
10/16/2009 Tina PCC Sunshine $6,713.00 2/8/2010 Tina Whole Foods Sunset $18,115.00 3/5/2010 Chin Amazon.com Quad $14,555.00 5/7/2010 Francine PCC Sunshine $25,758.00
10/27/2009 Tina Whole Foods Carlota $28,116.00 4/9/2010 Tina Amazon.com Quad $12,054.00
12/18/2010 Tina PCC Sunshine $28,317.00 12/3/2010 Tina MrExcel.com Carlota $48,359.00 9/27/2009 Chin MrExcel.com Sunshine $14,760.00
6/6/2010 Tina PCC Sunset $25,473.00 7/18/2009 Tina Whole Foods Bellen $27,847.00 3/16/2009 Francine MrExcel.com Sunset $20,568.00
2/7/2010 Tina Fred Myer Sunbell $12,304.00 8/2/2010 Francine Whole Foods Sunset $32,410.00
6/10/2009 Chin Whole Foods Sunshine $44,067.00 1/14/2009 Tina Whole Foods Sunset $13,778.00 9/30/2010 Tina Fred Myer Bellen $21,363.00 2/25/2010 Francine Whole Foods Bellen $40,134.00
11/19/2010 Francine Amazon.com Carlota $36,381.00 8/25/2010 Chin Whole Foods Sunshine $30,618.00 12/8/2009 Francine Whole Foods Sunset $37,926.00
10/14/2009 Sioux Whole Foods Sunshine $21,376.00 5/17/2010 Tina Amazon.com Bellen $37,771.00
7/9/2010 Tina PCC Carlota $25,090.00 12/8/2010 Chin PCC Bellen $27,574.00 10/7/2010 Tina PCC Sunshine $711.00 11/5/2010 Francine PCC Bellen $8,939.00
12/19/2009 Sioux Fred Myer Quad $48,873.00 12/5/2009 Francine Fred Myer Bellen $45,400.00 1/26/2010 Francine MrExcel.com Sunbell $43,122.00
10/14/2010 Chin Fred Myer Carlota $23,327.00 1/25/2010 Francine MrExcel.com Sunset $46,841.00 7/10/2010 Sioux Fred Myer Quad $22,606.00
5/6/2010 Tina MrExcel.com Sunshine $12,379.00 5/20/2009 Sioux Fred Myer Carlota $46,265.00

11/28/2009 Francine Whole Foods Sunset $11,279.00 10/8/2010 Chin Whole Foods Sunshine $4,868.00 9/28/2009 Chin Amazon.com Sunshine $34,165.00
5/1/2009 Francine Fred Myer Bellen $45,581.00 3/14/2009 Chin Fred Myer Sunbell $43,546.00 7/15/2009 Francine PCC Carlota $3,327.00
5/5/2009 Sioux Whole Foods Carlota $45,582.00 5/26/2010 Francine Fred Myer Quad $5,460.00 1/10/2009 Tina Whole Foods Sunset $32,663.00 9/17/2010 Francine Amazon.com Bellen $7,361.00
12/15/2009 Tina Whole Foods Sunset $35,439.00 5/27/2009 Francine PCC Sunshine $41,597.00 9/12/2009 Chin Amazon.com Sunshine $46,108.00 8/28/2009 Chin MrExcel.com Sunset $31,253.00 7/19/2009 Sioux PCC Sunshine $22,436.00 9/24/2009 Sioux PCC Bellen $36,701.00
3/3/2010 Chin Amazon.com Sunbell $13,076.00 11/29/2009 Sioux MrExcel.com Sunshine $21,461.00
3/20/2010 Sioux MrExcel.com Sunset $18,488.00 9/15/2010 Sioux MrExcel.com Carlota $31,165.00 4/30/2009 Sioux Fred Myer Sunbell $4,130.00 7/28/2010 Chin MrExcel.com Sunshine $43,806.00 4/11/2010 Tina Fred Myer Sunshine $9,732.00 2/20/2009 Sioux Whole Foods Sunshine $24,226.00
2/4/2010 Chin Fred Myer Sunshine $34,739.00 12/26/2010 Chin Fred Myer Bellen $2,129.00
9/15/2010 Tina Fred Myer Sunshine $21,574.00 6/5/2009 Tina MrExcel.com Sunbell $8,615.00
4/28/2010 Sioux PCC Carlota $29,595.00 1/6/2009 Sioux Amazon.com Sunset $28,917.00
7/17/2009 Sioux Amazon.com Carlota $13,632.00 3/5/2009 Chin Amazon.com Quad $46,269.00 4/4/2010 Sioux PCC Sunshine $12,913.00
3/11/2010 Sioux Fred Myer Carlota $16,838.00 12/7/2010 Tina PCC Sunset $45,206.00 9/14/2010 Sioux Amazon.com Quad $27,758.00 5/15/2010 Francine Whole Foods Sunbell $32,690.00 4/19/2009 Tina MrExcel.com Bellen $35,226.00 1/24/2009 Tina PCC Sunbell $9,236.00 8/13/2010 Tina Amazon.com Carlota $26,869.00 8/17/2010 Tina Amazon.com Bellen $43,453.00 5/13/2010 Tina PCC Bellen $31,431.00
11/20/2009 Tina MrExcel.com Bellen $22,470.00 5/27/2009 Francine Whole Foods Bellen $5,185.00
9/3/2009 Tina Fred Myer Bellen $18,954.00 6/28/2009 Francine Fred Myer Sunset $36,995.00
9/4/2009 Sioux Amazon.com Sunbell $48,743.00 8/22/2010 Francine Amazon.com Sunbell $3,609.00
7/20/2010 Francine Fred Myer Carlota $14,886.00 4/25/2010 Tina Whole Foods Sunbell $32,331.00 11/1/2009 Francine MrExcel.com Quad $11,203.00 10/3/2010 Tina Amazon.com Sunset $49,893.00 8/15/2010 Francine Whole Foods Carlota $21,137.00
6/6/2010 Francine Amazon.com Sunset $12,336.00 7/13/2009 Sioux MrExcel.com Carlota $32,194.00 3/30/2010 Sioux MrExcel.com Sunbell $15,381.00 4/21/2009 Chin Amazon.com Sunbell $40,024.00 5/15/2009 Tina Whole Foods Quad $37,610.00
1/6/2009 Tina Amazon.com Sunbell $39,465.00 9/29/2010 Chin Amazon.com Carlota $13,361.00 5/13/2010 Tina MrExcel.com Sunset $20,939.00 12/9/2009 Francine Fred Myer Sunshine $39,673.00
4/9/2010 Chin PCC Sunset $35,462.00 11/15/2010 Chin PCC Sunbell $14,523.00
9/8/2009 Sioux Amazon.com Sunshine $41,589.00 10/5/2009 Sioux Fred Myer Carlota $37,289.00
4/4/2009 Francine PCC Carlota $36,157.00 4/12/2010 Francine Fred Myer Quad $27,444.00 3/14/2010 Sioux Fred Myer Quad $36,439.00 4/18/2009 Francine Amazon.com Quad $24,797.00
5/4/2009 Francine MrExcel.com Sunset $11,869.00 10/3/2010 Francine MrExcel.com Quad $19,171.00 7/25/2009 Francine Whole Foods Bellen $7,391.00
7/3/2009 Tina Fred Myer Quad $39,506.00 5/11/2009 Sioux Whole Foods Bellen $48,256.00 11/6/2010 Tina MrExcel.com Sunbell $10,007.00 4/19/2009 Sioux Amazon.com Quad $24,638.00
12/23/2010 Francine PCC Sunset $26,807.00 12/16/2010 Tina Whole Foods Sunbell $35,595.00 12/12/2010 Tina Fred Myer Sunset $46,141.00 10/29/2010 Sioux MrExcel.com Sunbell $3,492.00 12/22/2009 Chin PCC Sunset $11,934.00 12/12/2009 Francine MrExcel.com Sunbell $4,488.00
9/30/2009 Francine Amazon.com Sunset $41,820.00 10/21/2009 Francine Fred Myer Bellen $1,092.00
9/7/2009 Francine MrExcel.com Carlota $1,718.00 3/22/2009 Sioux PCC Sunset $42,927.00 8/26/2009 Tina Whole Foods Bellen $9,125.00 9/28/2009 Tina Whole Foods Carlota $4,334.00 6/24/2009 Francine Fred Myer Sunbell $4,349.00
9/8/2010 Francine PCC Sunbell $39,169.00 12/30/2009 Chin Whole Foods Quad $25,367.00
3/8/2009 Chin MrExcel.com Carlota $26,722.00 5/11/2010 Francine Amazon.com Sunbell $27,563.00 5/21/2010 Chin Whole Foods Sunshine $26,160.00
3/1/2009 Chin Whole Foods Quad $8,452.00

12/26/2010 Tina PCC Sunshine $9,907.00 7/24/2009 Francine Fred Myer Quad $26,901.00 4/24/2009 Francine MrExcel.com Bellen $32,081.00 7/14/2010 Chin MrExcel.com Sunbell $46,640.00 12/8/2009 Sioux MrExcel.com Sunshine $39,142.00
11/20/2009 Tina PCC Sunshine $38,727.00 6/1/2010 Francine PCC Sunset $9,086.00
3/20/2010 Tina Amazon.com Quad $11,198.00 2/20/2009 Francine MrExcel.com Quad $3,947.00 2/14/2009 Tina Amazon.com Sunshine $22,683.00 6/30/2009 Chin MrExcel.com Carlota $46,054.00
8/2/2010 Sioux Whole Foods Sunbell $48,195.00 5/5/2009 Tina PCC Sunshine $33,297.00 2/6/2010 Sioux Whole Foods Sunset $43,192.00
12/21/2010 Chin Amazon.com Bellen $7,680.00 2/16/2009 Francine PCC Sunset $39,735.00
6/9/2010 Sioux MrExcel.com Quad $7,936.00 6/10/2009 Sioux Fred Myer Bellen $38,646.00 3/27/2010 Francine Fred Myer Bellen $24,534.00 6/17/2009 Chin Amazon.com Sunshine $7,630.00
8/1/2010 Sioux Whole Foods Sunbell $860.00 9/11/2009 Tina Fred Myer Quad $35,728.00
10/14/2010 Sioux Whole Foods Carlota $34,056.00 6/3/2009 Francine Whole Foods Carlota $37,719.00 3/7/2010 Sioux Fred Myer Carlota $22,362.00
4/14/2010 Sioux Whole Foods Quad $43,955.00 5/4/2009 Chin Fred Myer Sunset $17,957.00
7/10/2009 Sioux Fred Myer Sunset $15,378.00 12/13/2009 Tina PCC Sunset $35,624.00
5/20/2010 Chin Whole Foods Carlota $9,117.00 10/8/2009 Chin Amazon.com Quad $39,615.00 6/28/2010 Chin Whole Foods Quad $17,656.00 5/24/2009 Tina PCC Sunset $15,915.00
6/5/2010 Sioux Fred Myer Bellen $9,448.00 8/13/2010 Francine Amazon.com Sunshine $29,954.00 5/10/2009 Sioux Amazon.com Bellen $18,116.00 9/11/2009 Francine Amazon.com Quad $7,538.00
7/9/2009 Francine Fred Myer Quad $42,799.00 8/24/2010 Francine PCC Sunset $1,457.00 2/23/2009 Tina MrExcel.com Sunshine $36,855.00
12/27/2009 Tina Amazon.com Carlota $39,206.00 4/4/2009 Sioux Fred Myer Sunbell $42,434.00
4/30/2009 Sioux PCC Quad $25,112.00 8/6/2009 Sioux Amazon.com Sunbell $3,610.00
11/20/2009 Chin Whole Foods Bellen $22,820.00 7/17/2010 Francine Amazon.com Bellen $44,931.00 4/18/2010 Sioux Fred Myer Quad $4,027.00 9/22/2009 Tina Fred Myer Quad $47,641.00
2/3/2009 Francine MrExcel.com Sunbell $1,319.00 1/3/2010 Chin MrExcel.com Bellen $6,261.00
3/19/2010 Chin PCC Sunshine $37,308.00 5/6/2010 Chin Whole Foods Sunset $43,568.00
2/16/2010 Tina MrExcel.com Bellen $25,574.00 11/30/2010 Francine MrExcel.com Sunshine $46,904.00
3/6/2010 Francine Amazon.com Bellen $37,374.00 6/22/2010 Francine Fred Myer Sunbell $49,191.00
1/7/2009 Francine MrExcel.com Sunshine $7,820.00 8/6/2010 Tina Amazon.com Sunbell $35,677.00 4/7/2010 Tina PCC Quad $21,067.00
11/10/2010 Chin Amazon.com Sunshine $2,993.00 9/18/2010 Tina Fred Myer Sunbell $35,191.00
11/25/2009 Chin MrExcel.com Sunset $46,825.00 8/24/2010 Chin Whole Foods Carlota $39,068.00 5/25/2010 Tina Fred Myer Sunset $785.00 6/20/2009 Chin PCC Sunbell $37,378.00 3/18/2009 Tina Fred Myer Sunbell $24,352.00
8/8/2009 Chin Amazon.com Sunbell $27,934.00 9/2/2010 Sioux PCC Bellen $36,710.00
6/17/2009 Sioux Whole Foods Sunshine $17,078.00 11/23/2010 Sioux PCC Bellen $18,485.00
7/13/2009 Chin Fred Myer Bellen $40,348.00 1/16/2009 Chin MrExcel.com Quad $22,591.00
1/7/2010 Chin Fred Myer Sunbell $31,239.00 9/6/2010 Chin Fred Myer Quad $29,497.00 1/7/2009 Sioux Fred Myer Carlota $29,289.00
5/20/2010 Tina Amazon.com Sunset $20,439.00 11/17/2010 Tina MrExcel.com Sunshine $47,009.00
4/25/2010 Chin Amazon.com Bellen $15,452.00 1/26/2010 Chin Whole Foods Sunshine $30,308.00 12/3/2010 Tina PCC Quad $42,348.00 1/11/2009 Chin Whole Foods Sunshine $2,945.00
10/18/2009 Francine MrExcel.com Bellen $40,793.00 12/2/2009 Francine Fred Myer Sunset $17,139.00 6/17/2009 Chin Whole Foods Bellen $15,455.00 7/25/2009 Chin Whole Foods Quad $38,303.00 1/19/2009 Tina Amazon.com Sunshine $45,611.00
11/24/2009 Sioux PCC Sunbell $31,086.00 12/24/2009 Francine Amazon.com Carlota $19,541.00
10/5/2009 Francine PCC Quad $3,146.00 10/21/2009 Chin PCC Quad $25,787.00
5/21/2010 Sioux PCC Sunset $27,120.00 3/22/2010 Tina Whole Foods Sunset $48,307.00
12/27/2009 Francine PCC Bellen $7,201.00 11/26/2009 Francine Amazon.com Quad $19,905.00
1/19/2009 Chin MrExcel.com Quad $3,397.00 3/6/2009 Chin Amazon.com Bellen $31,337.00
12/22/2009 Tina Fred Myer Quad $4,682.00 11/26/2010 Chin Whole Foods Sunbell $30,472.00
4/15/2010 Francine Fred Myer Sunset $47,399.00 9/5/2009 Chin Amazon.com Sunshine $3,102.00
3/12/2010 Chin Fred Myer Sunbell $15,941.00 1/23/2009 Chin Amazon.com Sunset $36,283.00 6/22/2009 Francine Amazon.com Carlota $32,964.00 8/10/2009 Tina MrExcel.com Quad $49,373.00
1/4/2009 Tina Fred Myer Carlota $16,963.00 4/23/2009 Chin PCC Quad $17,747.00
10/13/2010 Tina Whole Foods Quad $14,050.00 2/17/2010 Francine Whole Foods Sunbell $37,923.00 2/27/2010 Chin MrExcel.com Quad $19,481.00 4/14/2009 Sioux PCC Sunbell $12,493.00 9/12/2010 Chin Amazon.com Quad $3,708.00 2/17/2009 Francine Amazon.com Bellen $21,239.00
6/7/2009 Francine Whole Foods Bellen $39,190.00 12/8/2010 Tina Whole Foods Bellen $1,591.00 11/3/2009 Sioux Whole Foods Carlota $34,347.00 8/24/2010 Francine MrExcel.com Carlota $33,809.00 7/21/2009 Chin Whole Foods Bellen $19,125.00 8/23/2010 Sioux MrExcel.com Carlota $14,594.00 5/10/2009 Tina Fred Myer Bellen $10,052.00 11/3/2009 Sioux Whole Foods Sunbell $5,731.00 5/29/2009 Tina MrExcel.com Sunbell $18,773.00
8/5/2009 Sioux Whole Foods Carlota $48,886.00 10/28/2010 Tina Amazon.com Sunset $29,458.00
2/3/2009 Chin MrExcel.com Sunbell $27,443.00 4/21/2010 Tina Fred Myer Carlota $16,259.00 8/17/2010 Francine Amazon.com Quad $6,613.00
10/22/2009 Sioux Amazon.com Quad $34,487.00 12/30/2010 Francine MrExcel.com Bellen $772.00
3/15/2009 Sioux Whole Foods Quad $4,988.00 6/5/2010 Sioux Fred Myer Sunbell $8,766.00 4/4/2009 Tina PCC Bellen $21,524.00
12/22/2009 Tina Fred Myer Bellen $46,112.00 5/27/2009 Sioux Fred Myer Sunshine $38,508.00
12/23/2009 Chin PCC Sunshine $1,419.00 3/29/2009 Sioux MrExcel.com Carlota $1,957.00
10/24/2010 Francine Whole Foods Sunbell $3,614.00 10/2/2010 Francine Amazon.com Carlota $45,001.00
8/9/2010 Francine Amazon.com Sunshine $27,288.00 9/3/2009 Francine Fred Myer Carlota $9,950.00 1/8/2010 Sioux Whole Foods Bellen $12,199.00
8/29/2009 Sioux Fred Myer Sunset $8,023.00 6/28/2010 Tina Fred Myer Sunset $3,900.00 9/10/2009 Sioux PCC Quad $26,842.00
4/3/2010 Francine Amazon.com Sunshine $8,412.00
1/17/2010 Sioux Amazon.com Sunshine $6,239.00 12/25/2009 Chin PCC Sunbell $773.00
9/16/2009 Sioux Whole Foods Bellen $34,033.00 11/10/2010 Chin Amazon.com Sunset $21,052.00
12/2/2009 Francine Fred Myer Carlota $18,967.00 9/6/2010 Sioux PCC Carlota $49,332.00
2/28/2010 Chin Whole Foods Sunbell $6,901.00 5/14/2009 Chin Whole Foods Sunshine $33,638.00
4/3/2009 Sioux Amazon.com Bellen $8,408.00 8/23/2009 Francine MrExcel.com Carlota $9,192.00 9/19/2010 Sioux Amazon.com Quad $28,936.00 9/17/2010 Chin Amazon.com Sunset $17,046.00 7/14/2009 Tina PCC Sunshine $41,953.00
2/2/2010 Francine Amazon.com Sunset $2,083.00 1/15/2009 Chin PCC Bellen $7,401.00
10/12/2010 Tina MrExcel.com Bellen $9,564.00 1/16/2010 Tina MrExcel.com Bellen $43,707.00 7/19/2010 Chin PCC Carlota $23,684.00 8/10/2009 Tina Fred Myer Bellen $43,896.00
8/1/2010 Tina Amazon.com Sunshine $2,300.00 5/18/2010 Tina Amazon.com Quad $10,440.00 9/10/2010 Sioux MrExcel.com Sunset $15,257.00
4/5/2010 Tina PCC Sunshine $27,665.00 12/2/2010 Chin Amazon.com Bellen $23,046.00 3/25/2009 Sioux PCC Quad $1,681.00
Excel Magic Trick #81: Advanced Filter AND OR Data ExtractExcel Magic Trick 185.5 Advanced Filter Data Extract 1criter
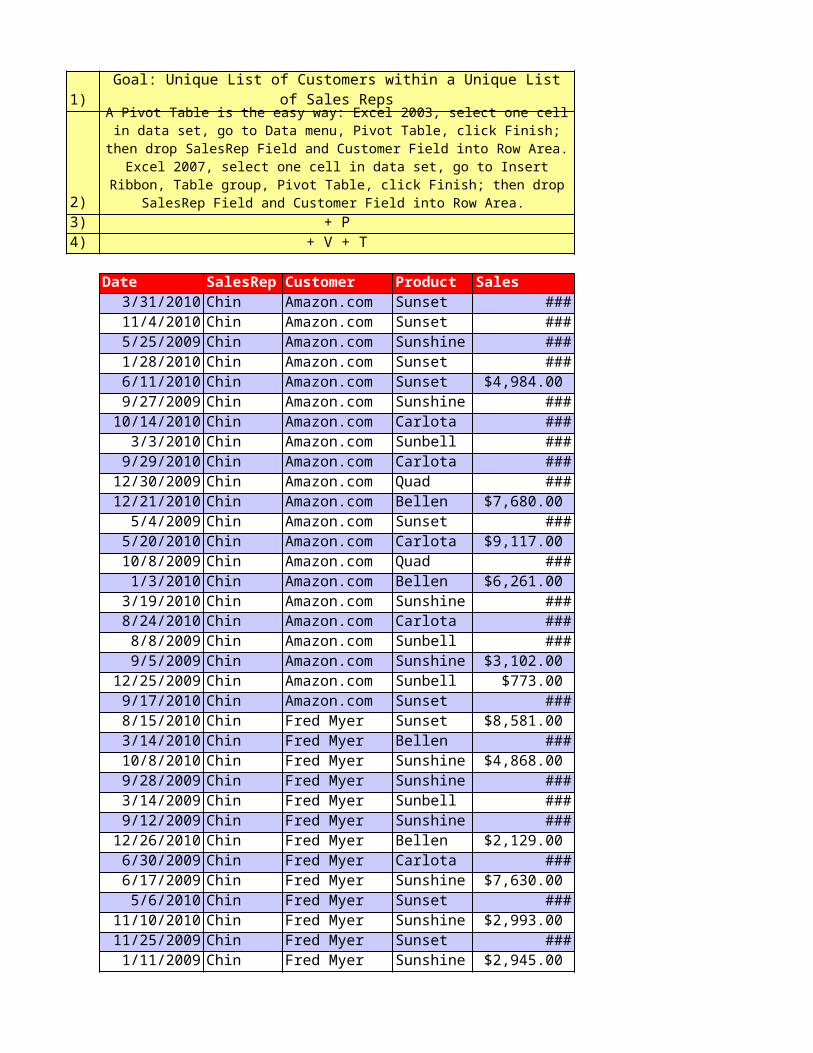
1) Goal: Unique List of Customers within a Unique List of Sales Reps
2)3) Excel 2003 Keyboard shortcut for Pivot Table: Alt + D + P4) Excel 2007 Keyboard shortcut for Pivot Table: Alt + N + V + T
Date SalesRep Customer Product Sales3/31/2010 Chin Amazon.com Sunset $15,261.00 11/4/2010 Chin Amazon.com Sunset $12,075.00 5/25/2009 Chin Amazon.com Sunshine $11,853.00 1/28/2010 Chin Amazon.com Sunset $33,536.00 6/11/2010 Chin Amazon.com Sunset $4,984.00 9/27/2009 Chin Amazon.com Sunshine $14,760.00
10/14/2010 Chin Amazon.com Carlota $23,327.00 3/3/2010 Chin Amazon.com Sunbell $13,076.00
9/29/2010 Chin Amazon.com Carlota $13,361.00 12/30/2009 Chin Amazon.com Quad $25,367.00 12/21/2010 Chin Amazon.com Bellen $7,680.00
5/4/2009 Chin Amazon.com Sunset $17,957.00 5/20/2010 Chin Amazon.com Carlota $9,117.00 10/8/2009 Chin Amazon.com Quad $39,615.00
1/3/2010 Chin Amazon.com Bellen $6,261.00 3/19/2010 Chin Amazon.com Sunshine $37,308.00 8/24/2010 Chin Amazon.com Carlota $39,068.00
8/8/2009 Chin Amazon.com Sunbell $27,934.00 9/5/2009 Chin Amazon.com Sunshine $3,102.00
12/25/2009 Chin Amazon.com Sunbell $773.00 9/17/2010 Chin Amazon.com Sunset $17,046.00 8/15/2010 Chin Fred Myer Sunset $8,581.00 3/14/2010 Chin Fred Myer Bellen $34,773.00 10/8/2010 Chin Fred Myer Sunshine $4,868.00 9/28/2009 Chin Fred Myer Sunshine $34,165.00 3/14/2009 Chin Fred Myer Sunbell $43,546.00 9/12/2009 Chin Fred Myer Sunshine $46,108.00
12/26/2010 Chin Fred Myer Bellen $2,129.00 6/30/2009 Chin Fred Myer Carlota $46,054.00 6/17/2009 Chin Fred Myer Sunshine $7,630.00
5/6/2010 Chin Fred Myer Sunset $43,568.00 11/10/2010 Chin Fred Myer Sunshine $2,993.00 11/25/2009 Chin Fred Myer Sunset $46,825.00
1/11/2009 Chin Fred Myer Sunshine $2,945.00 11/26/2010 Chin Fred Myer Sunbell $30,472.00
4/23/2009 Chin Fred Myer Quad $17,747.00 2/27/2010 Chin Fred Myer Quad $19,481.00
A Pivot Table is the easy way: Excel 2003, select one cell in data set, go to Data menu, Pivot Table, click Finish; then drop
SalesRep Field and Customer Field into Row Area. Excel 2007, select one cell in data set, go to Insert Ribbon, Table group, Pivot Table, click Finish; then drop SalesRep Field and Customer Field
into Row Area.

11/10/2010 Chin Fred Myer Sunset $21,052.00 9/8/2010 Chin FruitFun Quad $37,368.00 2/4/2010 Chin FruitFun Sunset $18,486.00
7/10/2010 Chin FruitFun Bellen $24,148.00 11/9/2010 Chin FruitFun Sunset $1,305.00 3/26/2009 Chin FruitFun Quad $22,378.00
6/8/2009 Chin FruitFun Bellen $47,842.00 2/4/2010 Chin FruitFun Sunshine $34,739.00 3/5/2009 Chin FruitFun Quad $46,269.00 3/1/2009 Chin FruitFun Quad $8,452.00
7/14/2010 Chin FruitFun Sunbell $46,640.00 7/13/2009 Chin FruitFun Bellen $40,348.00 7/25/2009 Chin FruitFun Quad $38,303.00
2/3/2009 Chin FruitFun Sunbell $27,443.00 5/14/2009 Chin FruitFun Sunshine $33,638.00 1/15/2009 Chin FruitFun Bellen $7,401.00
10/18/2010 Chin PCC Sunbell $20,404.00 8/22/2009 Chin PCC Bellen $42,547.00 6/20/2010 Chin PCC Sunset $590.00
7/4/2009 Chin PCC Sunshine $10,596.00 10/16/2009 Chin PCC Bellen $2,664.00
5/9/2009 Chin PCC Sunbell $43,806.00 3/15/2010 Chin PCC Sunshine $41,208.00 11/3/2010 Chin PCC Quad $35,702.00
3/2/2010 Chin PCC Sunbell $32,999.00 3/30/2009 Chin PCC Bellen $14,639.00 6/10/2009 Chin PCC Sunshine $44,067.00 8/25/2010 Chin PCC Sunshine $30,618.00 12/8/2010 Chin PCC Bellen $27,574.00
4/9/2010 Chin PCC Sunset $35,462.00 3/8/2009 Chin PCC Carlota $26,722.00
5/21/2010 Chin PCC Sunshine $26,160.00 6/28/2010 Chin PCC Quad $17,656.00
11/20/2009 Chin PCC Bellen $22,820.00 1/7/2010 Chin PCC Sunbell $31,239.00 9/6/2010 Chin PCC Quad $29,497.00
10/21/2009 Chin PCC Quad $25,787.00 1/19/2009 Chin PCC Quad $3,397.00 3/12/2010 Chin PCC Sunbell $15,941.00 1/23/2009 Chin PCC Sunset $36,283.00 9/12/2010 Chin PCC Quad $3,708.00 2/28/2010 Chin PCC Sunbell $6,901.00
7/5/2010 Chin TRUS Quad $14,829.00 11/22/2009 Chin TRUS Quad $24,200.00
4/9/2010 Chin TRUS Carlota $25,013.00 6/3/2009 Chin TRUS Quad $24,334.00 3/5/2010 Chin TRUS Quad $14,555.00
8/28/2009 Chin TRUS Sunset $31,253.00
7/28/2010 Chin TRUS Sunshine $43,806.00 4/21/2009 Chin TRUS Sunbell $40,024.00
11/15/2010 Chin TRUS Sunbell $14,523.00 12/22/2009 Chin TRUS Sunset $11,934.00
6/20/2009 Chin TRUS Sunbell $37,378.00 1/16/2009 Chin TRUS Quad $22,591.00 4/25/2010 Chin TRUS Bellen $15,452.00 1/26/2010 Chin TRUS Sunshine $30,308.00 6/17/2009 Chin TRUS Bellen $15,455.00
3/6/2009 Chin TRUS Bellen $31,337.00 7/21/2009 Chin TRUS Bellen $19,125.00
12/23/2009 Chin TRUS Sunshine $1,419.00 7/19/2010 Chin TRUS Carlota $23,684.00 12/2/2010 Chin TRUS Bellen $23,046.00 7/24/2009 Francine Amazon.com Quad $26,901.00 8/19/2009 Francine B&N Quad $5,653.00 7/20/2010 Francine B&N Carlota $14,886.00
12/12/2009 Francine B&N Sunbell $4,488.00 9/11/2009 Francine B&N Quad $7,538.00
7/9/2009 Francine B&N Quad $42,799.00 12/27/2009 Francine B&N Bellen $7,201.00
4/15/2010 Francine B&N Sunset $47,399.00 2/17/2010 Francine B&N Sunbell $37,923.00
8/8/2010 Francine BCC Sunset $29,791.00 4/20/2010 Francine BCC Carlota $23,149.00
5/7/2010 Francine BCC Sunshine $25,758.00 2/16/2009 Francine BCC Sunset $39,735.00
4/3/2010 Francine BCC Sunshine $8,412.00 8/11/2009 Francine Big Al's Sunset $25,966.00
8/2/2010 Francine Big Al's Sunset $32,410.00 12/5/2009 Francine Big Al's Bellen $45,400.00 5/27/2009 Francine Big Al's Sunshine $41,597.00 7/25/2009 Francine Big Al's Bellen $7,391.00 7/17/2010 Francine Big Al's Bellen $44,931.00
6/7/2009 Francine Big Al's Bellen $39,190.00 9/24/2010 Francine CCC Carlota $30,043.00
5/4/2009 Francine CCC Sunset $11,869.00 10/18/2009 Francine CCC Bellen $40,793.00
8/17/2010 Francine Citi Sunset $46,767.00 4/4/2009 Francine Citi Carlota $36,157.00
4/12/2010 Francine Citi Quad $27,444.00 4/18/2009 Francine Citi Quad $24,797.00 6/22/2009 Francine Citi Carlota $32,964.00 2/17/2009 Francine Citi Bellen $21,239.00 8/11/2010 Francine Coke Sunshine $15,389.00 7/15/2009 Francine Coke Carlota $3,327.00
12/23/2010 Francine Coke Sunset $26,807.00 9/30/2009 Francine Coke Sunset $41,820.00
10/24/2010 Francine Coke Sunbell $3,614.00 11/19/2010 Francine Costco Carlota $36,381.00
5/1/2009 Francine Costco Bellen $45,581.00 1/7/2009 Francine Costco Sunshine $7,820.00
8/23/2009 Francine Costco Carlota $9,192.00 2/2/2010 Francine Costco Sunset $2,083.00
3/16/2009 Francine Economist Sunset $20,568.00 2/25/2010 Francine Economist Bellen $40,134.00 11/5/2010 Francine Economist Bellen $8,939.00
11/28/2009 Francine Economist Sunset $11,279.00 5/27/2009 Francine Economist Bellen $5,185.00 3/27/2010 Francine Economist Bellen $24,534.00
12/30/2010 Francine Economist Bellen $772.00 1/27/2009 Francine Evergreen Quad $47,953.00
6/1/2010 Francine Evergreen Sunset $9,086.00 6/22/2010 Francine Evergreen Sunbell $49,191.00 2/20/2009 Francine Fred Myer Quad $3,947.00
6/3/2009 Francine Fred Myer Carlota $37,719.00 10/2/2010 Francine Fred Myer Carlota $45,001.00 6/14/2010 Francine HCC Carlota $18,483.00 11/4/2010 Francine HCC Bellen $13,465.00 5/14/2009 Francine HCC Sunset $12,400.00 6/28/2009 Francine HCC Sunset $36,995.00 8/24/2010 Francine HCC Sunset $1,457.00 9/26/2009 Francine Microsoft Carlota $28,324.00
10/20/2009 Francine Microsoft Sunshine $24,214.00 4/24/2009 Francine Microsoft Bellen $32,081.00 8/13/2010 Francine Microsoft Sunshine $29,954.00
12/24/2009 Francine Microsoft Carlota $19,541.00 1/25/2010 Francine MrExcel.com Sunset $46,841.00 8/24/2010 Francine MrExcel.com Carlota $33,809.00 8/17/2010 Francine MrExcel.com Quad $6,613.00 12/2/2009 Francine MrExcel.com Carlota $18,967.00
5/7/2010 Francine NCC Quad $49,667.00 7/4/2009 Francine NCC Sunbell $18,459.00
11/30/2010 Francine NCC Sunshine $46,904.00 12/19/2009 Francine Oly Co-op Sunshine $25,568.00
1/26/2010 Francine Oly Co-op Sunbell $43,122.00 5/26/2010 Francine Oly Co-op Quad $5,460.00 8/22/2010 Francine Oly Co-op Sunbell $3,609.00
9/7/2009 Francine PCC Carlota $1,718.00 5/11/2010 Francine PCC Sunbell $27,563.00
3/7/2010 Francine Rite Aid Bellen $11,477.00 1/14/2010 Francine Rite Aid Sunshine $31,217.00 12/8/2009 Francine Rite Aid Sunset $37,926.00
10/21/2009 Francine Rite Aid Bellen $1,092.00 11/26/2009 Francine Rite Aid Quad $19,905.00
8/9/2010 Francine Rite Aid Sunshine $27,288.00

3/22/2009 Francine SSCC Sunshine $26,881.00 11/1/2009 Francine SSCC Quad $11,203.00 8/15/2010 Francine SSCC Carlota $21,137.00 9/17/2010 Francine Starbucks Bellen $7,361.00 6/24/2009 Francine Starbucks Sunbell $4,349.00 10/5/2009 Francine Starbucks Quad $3,146.00
6/6/2010 Francine Walgreen's Sunset $12,336.00 10/3/2010 Francine Walgreen's Quad $19,171.00
9/8/2010 Francine Walgreen's Sunbell $39,169.00 2/3/2009 Francine Walgreen's Sunbell $1,319.00 3/6/2010 Francine Walgreen's Bellen $37,374.00
12/2/2009 Francine Walgreen's Sunset $17,139.00 9/3/2009 Francine Walgreen's Carlota $9,950.00
5/15/2010 Francine Whole Foods Sunbell $32,690.00 12/9/2009 Francine Whole Foods Sunshine $39,673.00 8/11/2010 Sioux Amazon.com Sunbell $30,649.00 1/15/2010 Sioux Amazon.com Sunshine $7,701.00 8/29/2009 Sioux Amazon.com Carlota $3,692.00
10/12/2009 Sioux Amazon.com Sunset $27,066.00 10/14/2009 Sioux Amazon.com Sunshine $21,376.00
9/24/2009 Sioux Amazon.com Bellen $36,701.00 3/20/2010 Sioux Amazon.com Sunset $18,488.00
4/4/2010 Sioux Amazon.com Sunshine $12,913.00 9/4/2009 Sioux Amazon.com Sunbell $48,743.00 8/1/2010 Sioux Amazon.com Sunbell $860.00 4/4/2009 Sioux Amazon.com Sunbell $42,434.00
4/18/2010 Sioux Amazon.com Quad $4,027.00 1/7/2009 Sioux Amazon.com Carlota $29,289.00
9/10/2009 Sioux Amazon.com Quad $26,842.00 1/17/2010 Sioux Amazon.com Sunshine $6,239.00 9/10/2010 Sioux Amazon.com Sunset $15,257.00 3/25/2009 Sioux Amazon.com Quad $1,681.00 6/12/2009 Sioux Fred Myer Sunbell $10,634.00
6/7/2010 Sioux Fred Myer Sunset $32,294.00 7/12/2010 Sioux Fred Myer Sunset $4,427.00 2/24/2010 Sioux Fred Myer Sunset $40,397.00
10/31/2010 Sioux Fred Myer Carlota $24,116.00 10/5/2009 Sioux Fred Myer Quad $6,363.00 1/20/2009 Sioux Fred Myer Bellen $31,935.00 7/10/2010 Sioux Fred Myer Quad $22,606.00 7/19/2009 Sioux Fred Myer Sunshine $22,436.00 4/28/2010 Sioux Fred Myer Carlota $29,595.00 3/11/2010 Sioux Fred Myer Carlota $16,838.00 7/13/2009 Sioux Fred Myer Carlota $32,194.00
9/8/2009 Sioux Fred Myer Sunshine $41,589.00 4/19/2009 Sioux Fred Myer Quad $24,638.00
2/6/2010 Sioux Fred Myer Sunset $43,192.00 6/10/2009 Sioux Fred Myer Bellen $38,646.00

10/14/2010 Sioux Fred Myer Carlota $34,056.00 8/6/2009 Sioux Fred Myer Sunbell $3,610.00 9/2/2010 Sioux Fred Myer Bellen $36,710.00
4/14/2009 Sioux Fred Myer Sunbell $12,493.00 6/5/2010 Sioux Fred Myer Sunbell $8,766.00
5/27/2009 Sioux Fred Myer Sunshine $38,508.00 1/26/2009 Sioux MrExcel.com Quad $37,701.00 6/28/2010 Sioux MrExcel.com Sunbell $37,146.00
12/28/2010 Sioux MrExcel.com Carlota $26,919.00 1/30/2009 Sioux MrExcel.com Sunset $17,422.00 3/24/2010 Sioux MrExcel.com Sunset $39,119.00
5/5/2009 Sioux MrExcel.com Carlota $45,582.00 9/15/2010 Sioux MrExcel.com Carlota $31,165.00 2/20/2009 Sioux MrExcel.com Sunshine $24,226.00 9/14/2010 Sioux MrExcel.com Quad $27,758.00 3/14/2010 Sioux MrExcel.com Quad $36,439.00 4/30/2009 Sioux MrExcel.com Quad $25,112.00 6/17/2009 Sioux MrExcel.com Sunshine $17,078.00 11/3/2009 Sioux MrExcel.com Sunbell $5,731.00
1/8/2010 Sioux MrExcel.com Bellen $12,199.00 9/16/2009 Sioux MrExcel.com Bellen $34,033.00
4/3/2009 Sioux MrExcel.com Bellen $8,408.00 9/19/2010 Sioux MrExcel.com Quad $28,936.00 5/16/2010 Sioux PCC Sunset $36,603.00 4/16/2009 Sioux PCC Sunshine $11,193.00
4/2/2010 Sioux PCC Carlota $6,386.00 6/15/2010 Sioux PCC Carlota $5,494.00
12/14/2010 Sioux PCC Sunshine $41,433.00 11/29/2009 Sioux PCC Sunshine $21,461.00
1/6/2009 Sioux PCC Sunset $28,917.00 3/30/2010 Sioux PCC Sunbell $15,381.00 10/5/2009 Sioux PCC Carlota $37,289.00 5/11/2009 Sioux PCC Bellen $48,256.00
8/2/2010 Sioux PCC Sunbell $48,195.00 6/5/2010 Sioux PCC Bellen $9,448.00
5/10/2009 Sioux PCC Bellen $18,116.00 11/23/2010 Sioux PCC Bellen $18,485.00 11/24/2009 Sioux PCC Sunbell $31,086.00
5/21/2010 Sioux PCC Sunset $27,120.00 8/23/2010 Sioux PCC Carlota $14,594.00 3/15/2009 Sioux PCC Quad $4,988.00 3/29/2009 Sioux PCC Carlota $1,957.00
9/6/2010 Sioux PCC Carlota $49,332.00 5/8/2009 Sioux Whole Foods Bellen $5,349.00
5/30/2009 Sioux Whole Foods Sunbell $17,229.00 8/17/2010 Sioux Whole Foods Carlota $33,404.00
12/19/2009 Sioux Whole Foods Bellen $41,310.00 12/19/2009 Sioux Whole Foods Quad $48,873.00

5/20/2009 Sioux Whole Foods Carlota $46,265.00 4/30/2009 Sioux Whole Foods Sunbell $4,130.00 7/17/2009 Sioux Whole Foods Carlota $13,632.00
10/29/2010 Sioux Whole Foods Sunbell $3,492.00 3/22/2009 Sioux Whole Foods Sunset $42,927.00 12/8/2009 Sioux Whole Foods Sunshine $39,142.00
6/9/2010 Sioux Whole Foods Quad $7,936.00 3/7/2010 Sioux Whole Foods Carlota $22,362.00
4/14/2010 Sioux Whole Foods Quad $43,955.00 7/10/2009 Sioux Whole Foods Sunset $15,378.00 11/3/2009 Sioux Whole Foods Carlota $34,347.00
8/5/2009 Sioux Whole Foods Carlota $48,886.00 10/22/2009 Sioux Whole Foods Quad $34,487.00
8/29/2009 Sioux Whole Foods Sunset $8,023.00 9/10/2010 Tina Amazon.com Sunbell $42,938.00
9/1/2010 Tina Amazon.com Quad $49,912.00 10/7/2009 Tina Amazon.com Sunshine $46,959.00
11/22/2010 Tina Amazon.com Sunbell $19,152.00 7/9/2010 Tina Amazon.com Carlota $25,090.00
8/13/2010 Tina Amazon.com Carlota $26,869.00 1/19/2009 Tina Amazon.com Sunshine $45,611.00 1/24/2009 Tina B&N Sunbell $9,236.00 3/18/2009 Tina B&N Sunbell $24,352.00
11/17/2010 Tina B&N Sunshine $47,009.00 4/4/2009 Tina B&N Bellen $21,524.00 5/6/2010 Tina BCC Sunshine $12,379.00
12/13/2009 Tina BCC Sunset $35,624.00 9/22/2009 Tina BCC Quad $47,641.00
4/5/2010 Tina BCC Sunshine $27,665.00 3/16/2009 Tina Big Al's Sunbell $36,382.00
12/18/2010 Tina Big Al's Sunshine $28,317.00 1/14/2009 Tina Big Al's Sunset $13,778.00 2/23/2009 Tina Big Al's Sunshine $36,855.00 5/15/2009 Tina CCC Quad $37,610.00 9/28/2009 Tina Citi Carlota $4,334.00
11/20/2009 Tina Citi Sunshine $38,727.00 12/8/2010 Tina Citi Bellen $1,591.00 9/18/2010 Tina Coke Sunbell $35,191.00 12/3/2010 Tina Coke Quad $42,348.00
12/22/2009 Tina Coke Quad $4,682.00 4/21/2010 Tina Coke Carlota $16,259.00 7/14/2009 Tina Coke Sunshine $41,953.00 5/13/2010 Tina Costco Sunset $20,939.00 2/16/2010 Tina Costco Bellen $25,574.00 5/25/2010 Tina Costco Sunset $785.00
4/9/2010 Tina Economist Quad $12,054.00 6/5/2009 Tina Economist Sunbell $8,615.00
3/20/2010 Tina Economist Quad $11,198.00
5/6/2010 Tina Evergreen Sunshine $21,986.00 3/7/2009 Tina Evergreen Sunshine $30,797.00
7/25/2009 Tina Evergreen Quad $23,147.00 5/17/2010 Tina Evergreen Bellen $37,771.00 2/14/2009 Tina Evergreen Sunshine $22,683.00
11/29/2010 Tina Fred Myer Sunset $569.00 7/23/2009 Tina Fred Myer Sunshine $7,867.00
2/7/2009 Tina Fred Myer Sunshine $15,100.00 6/8/2009 Tina Fred Myer Sunset $8,439.00
10/3/2010 Tina Fred Myer Sunset $49,893.00 12/16/2010 Tina Fred Myer Sunbell $35,595.00
4/7/2010 Tina Fred Myer Quad $21,067.00 8/18/2009 Tina HCC Sunset $10,794.00
10/27/2009 Tina HCC Carlota $28,116.00 10/7/2010 Tina HCC Sunshine $711.00 5/13/2010 Tina HCC Bellen $31,431.00 8/10/2009 Tina HCC Quad $49,373.00 5/18/2010 Tina HCC Quad $10,440.00 1/13/2010 Tina Microsoft Bellen $19,505.00 6/28/2010 Tina Microsoft Sunset $3,900.00 6/22/2010 Tina MrExcel.com Sunshine $21,075.00 3/25/2010 Tina MrExcel.com Quad $25,241.00
1/6/2009 Tina MrExcel.com Sunbell $39,465.00 12/12/2010 Tina MrExcel.com Sunset $46,141.00
4/11/2010 Tina NCC Sunshine $9,732.00 9/15/2010 Tina NCC Sunshine $21,574.00
10/13/2010 Tina NCC Quad $14,050.00 5/10/2009 Tina NCC Bellen $10,052.00
6/3/2009 Tina Oly Co-op Carlota $2,188.00 9/3/2009 Tina Oly Co-op Bellen $18,954.00
12/26/2010 Tina Oly Co-op Sunshine $9,907.00 5/5/2009 Tina Oly Co-op Sunshine $33,297.00
5/20/2010 Tina Oly Co-op Sunset $20,439.00 7/18/2009 Tina PCC Bellen $27,847.00 9/30/2010 Tina PCC Bellen $21,363.00
12/15/2009 Tina PCC Sunset $35,439.00 11/6/2010 Tina PCC Sunbell $10,007.00
1/4/2009 Tina PCC Carlota $16,963.00 8/2/2009 Tina Rite Aid Sunbell $39,814.00
1/17/2009 Tina Rite Aid Sunbell $33,776.00 1/10/2009 Tina Rite Aid Sunset $32,663.00 4/19/2009 Tina Rite Aid Bellen $35,226.00
11/20/2009 Tina Rite Aid Bellen $22,470.00 10/12/2010 Tina Rite Aid Bellen $9,564.00
9/12/2009 Tina SSCC Sunbell $46,669.00 10/16/2009 Tina SSCC Sunshine $6,713.00
6/6/2010 Tina SSCC Sunset $25,473.00 2/7/2010 Tina SSCC Sunbell $12,304.00
12/27/2009 Tina SSCC Carlota $39,206.00 1/16/2010 Tina SSCC Bellen $43,707.00
2/8/2010 Tina Starbucks Sunset $18,115.00 4/25/2010 Tina Starbucks Sunbell $32,331.00 8/26/2009 Tina Starbucks Bellen $9,125.00 9/11/2009 Tina Starbucks Quad $35,728.00 5/24/2009 Tina Starbucks Sunset $15,915.00
10/28/2010 Tina Starbucks Sunset $29,458.00 8/10/2009 Tina Starbucks Bellen $43,896.00 12/3/2010 Tina Walgreen's Carlota $48,359.00 12/7/2010 Tina Walgreen's Sunset $45,206.00 8/17/2010 Tina Walgreen's Bellen $43,453.00
8/6/2010 Tina Walgreen's Sunbell $35,677.00 12/22/2009 Tina Walgreen's Bellen $46,112.00
2/18/2009 Tina Whole Foods Sunset $2,318.00 9/14/2009 Tina Whole Foods Carlota $16,277.00
6/8/2010 Tina Whole Foods Carlota $10,427.00 12/31/2009 Tina Whole Foods Sunbell $43,968.00
12/7/2009 Tina Whole Foods Quad $817.00 7/3/2009 Tina Whole Foods Quad $39,506.00
3/22/2010 Tina Whole Foods Sunset $48,307.00 5/29/2009 Tina Whole Foods Sunbell $18,773.00
8/1/2010 Tina Whole Foods Sunshine $2,300.00

1) Goal: Unique List of Customers within a Unique List of Sales Reps
2)3) Excel 2003 Keyboard shortcut for Pivot Table: Alt + D + P
4) Excel 2007 Keyboard shortcut for Pivot Table: Alt + N + V + T
5)6)
7)8)
Date SalesRep Customer Product Sales3/31/2010 Chin Amazon.com Sunset $15,261.00 11/4/2010 Chin Amazon.com Sunset $12,075.00 5/25/2009 Chin Amazon.com Sunshine $11,853.00 1/28/2010 Chin Amazon.com Sunset $33,536.00 6/11/2010 Chin Amazon.com Sunset $4,984.00 9/27/2009 Chin Amazon.com Sunshine $14,760.00
10/14/2010 Chin Amazon.com Carlota $23,327.00 3/3/2010 Chin Amazon.com Sunbell $13,076.00
9/29/2010 Chin Amazon.com Carlota $13,361.00 12/30/2009 Chin Amazon.com Quad $25,367.00 12/21/2010 Chin Amazon.com Bellen $7,680.00
5/4/2009 Chin Amazon.com Sunset $17,957.00 5/20/2010 Chin Amazon.com Carlota $9,117.00 10/8/2009 Chin Amazon.com Quad $39,615.00
1/3/2010 Chin Amazon.com Bellen $6,261.00 3/19/2010 Chin Amazon.com Sunshine $37,308.00 8/24/2010 Chin Amazon.com Carlota $39,068.00
8/8/2009 Chin Amazon.com Sunbell $27,934.00 9/5/2009 Chin Amazon.com Sunshine $3,102.00
12/25/2009 Chin Amazon.com Sunbell $773.00 9/17/2010 Chin Amazon.com Sunset $17,046.00 8/15/2010 Chin Fred Myer Sunset $8,581.00 3/14/2010 Chin Fred Myer Bellen $34,773.00 10/8/2010 Chin Fred Myer Sunshine $4,868.00 9/28/2009 Chin Fred Myer Sunshine $34,165.00
A Pivot Table is the easy way: Excel 2003, select one cell in data set, go to Data menu, Pivot Table, click Finish; then drop
SalesRep Field and Customer Field into Row Area. Excel 2007, select one cell in data set, go to Insert Ribbon, Table group, Pivot Table, click Finish; then drop SalesRep Field and Customer Field
into Row Area.
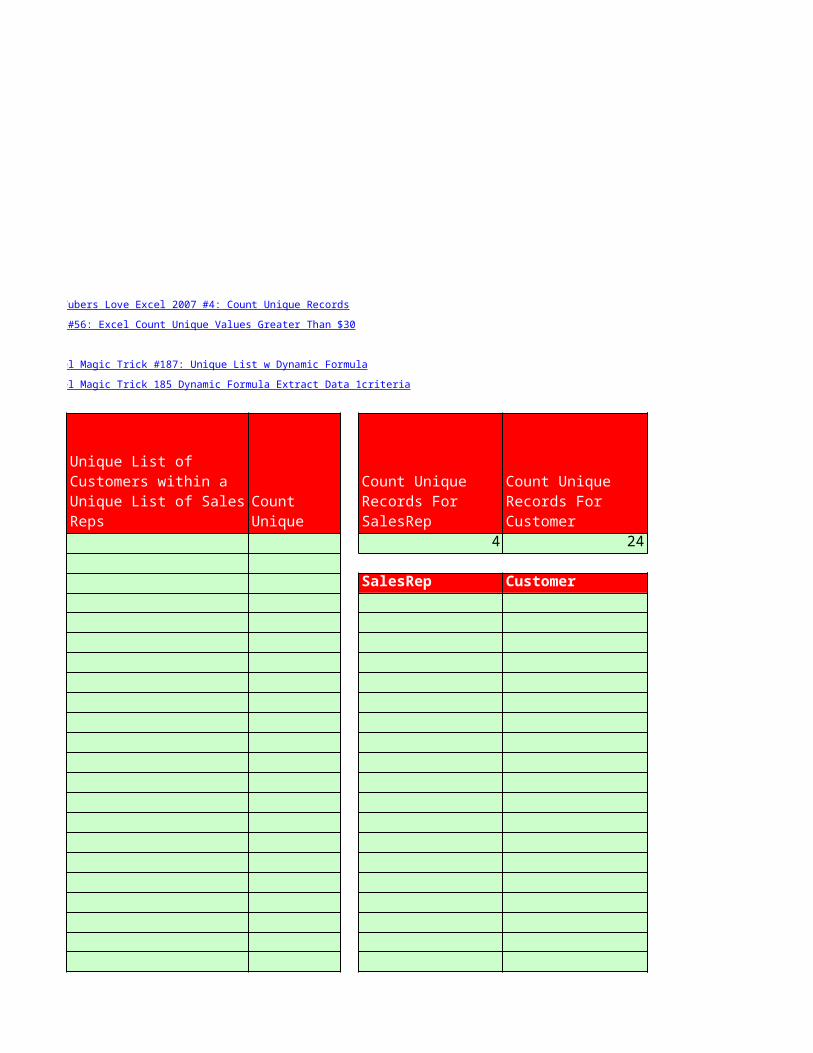
For 2 videos that show more detail on counting unique records, see these: YouTubers Love Excel 2007 #4: Count Unique Records
YTLE#56: Excel Count Unique Values Greater Than $30
For 2 videos that show more details about extracting records with formulas, see these: Excel Magic Trick #187: Unique List w Dynamic Formula
Excel Magic Trick 185 Dynamic Formula Extract Data 1criteria
Unique List of Customers within a Unique List of Sales Reps

3/14/2009 Chin Fred Myer Sunbell $43,546.00 9/12/2009 Chin Fred Myer Sunshine $46,108.00
12/26/2010 Chin Fred Myer Bellen $2,129.00 6/30/2009 Chin Fred Myer Carlota $46,054.00 6/17/2009 Chin Fred Myer Sunshine $7,630.00
5/6/2010 Chin Fred Myer Sunset $43,568.00 11/10/2010 Chin Fred Myer Sunshine $2,993.00 11/25/2009 Chin Fred Myer Sunset $46,825.00
1/11/2009 Chin Fred Myer Sunshine $2,945.00 11/26/2010 Chin Fred Myer Sunbell $30,472.00
4/23/2009 Chin Fred Myer Quad $17,747.00 2/27/2010 Chin Fred Myer Quad $19,481.00
11/10/2010 Chin Fred Myer Sunset $21,052.00 9/8/2010 Chin FruitFun Quad $37,368.00 2/4/2010 Chin FruitFun Sunset $18,486.00
7/10/2010 Chin FruitFun Bellen $24,148.00 11/9/2010 Chin FruitFun Sunset $1,305.00 3/26/2009 Chin FruitFun Quad $22,378.00
6/8/2009 Chin FruitFun Bellen $47,842.00 2/4/2010 Chin FruitFun Sunshine $34,739.00 3/5/2009 Chin FruitFun Quad $46,269.00 3/1/2009 Chin FruitFun Quad $8,452.00
7/14/2010 Chin FruitFun Sunbell $46,640.00 7/13/2009 Chin FruitFun Bellen $40,348.00 7/25/2009 Chin FruitFun Quad $38,303.00
2/3/2009 Chin FruitFun Sunbell $27,443.00 5/14/2009 Chin FruitFun Sunshine $33,638.00 1/15/2009 Chin FruitFun Bellen $7,401.00
10/18/2010 Chin PCC Sunbell $20,404.00 8/22/2009 Chin PCC Bellen $42,547.00 6/20/2010 Chin PCC Sunset $590.00
7/4/2009 Chin PCC Sunshine $10,596.00 10/16/2009 Chin PCC Bellen $2,664.00
5/9/2009 Chin PCC Sunbell $43,806.00 3/15/2010 Chin PCC Sunshine $41,208.00 11/3/2010 Chin PCC Quad $35,702.00
3/2/2010 Chin PCC Sunbell $32,999.00 3/30/2009 Chin PCC Bellen $14,639.00 6/10/2009 Chin PCC Sunshine $44,067.00 8/25/2010 Chin PCC Sunshine $30,618.00 12/8/2010 Chin PCC Bellen $27,574.00
4/9/2010 Chin PCC Sunset $35,462.00 3/8/2009 Chin PCC Carlota $26,722.00
5/21/2010 Chin PCC Sunshine $26,160.00 6/28/2010 Chin PCC Quad $17,656.00
11/20/2009 Chin PCC Bellen $22,820.00 1/7/2010 Chin PCC Sunbell $31,239.00 9/6/2010 Chin PCC Quad $29,497.00
10/21/2009 Chin PCC Quad $25,787.00 1/19/2009 Chin PCC Quad $3,397.00 3/12/2010 Chin PCC Sunbell $15,941.00 1/23/2009 Chin PCC Sunset $36,283.00 9/12/2010 Chin PCC Quad $3,708.00 2/28/2010 Chin PCC Sunbell $6,901.00
7/5/2010 Chin TRUS Quad $14,829.00 11/22/2009 Chin TRUS Quad $24,200.00
4/9/2010 Chin TRUS Carlota $25,013.00 6/3/2009 Chin TRUS Quad $24,334.00 3/5/2010 Chin TRUS Quad $14,555.00
8/28/2009 Chin TRUS Sunset $31,253.00 7/28/2010 Chin TRUS Sunshine $43,806.00 4/21/2009 Chin TRUS Sunbell $40,024.00
11/15/2010 Chin TRUS Sunbell $14,523.00 12/22/2009 Chin TRUS Sunset $11,934.00
6/20/2009 Chin TRUS Sunbell $37,378.00 1/16/2009 Chin TRUS Quad $22,591.00 4/25/2010 Chin TRUS Bellen $15,452.00 1/26/2010 Chin TRUS Sunshine $30,308.00 6/17/2009 Chin TRUS Bellen $15,455.00
3/6/2009 Chin TRUS Bellen $31,337.00 7/21/2009 Chin TRUS Bellen $19,125.00
12/23/2009 Chin TRUS Sunshine $1,419.00 7/19/2010 Chin TRUS Carlota $23,684.00 12/2/2010 Chin TRUS Bellen $23,046.00 7/24/2009 Francine Amazon.com Quad $26,901.00 8/19/2009 Francine B&N Quad $5,653.00 7/20/2010 Francine B&N Carlota $14,886.00
12/12/2009 Francine B&N Sunbell $4,488.00 9/11/2009 Francine B&N Quad $7,538.00
7/9/2009 Francine B&N Quad $42,799.00 12/27/2009 Francine B&N Bellen $7,201.00
4/15/2010 Francine B&N Sunset $47,399.00 2/17/2010 Francine B&N Sunbell $37,923.00
8/8/2010 Francine BCC Sunset $29,791.00 4/20/2010 Francine BCC Carlota $23,149.00
5/7/2010 Francine BCC Sunshine $25,758.00 2/16/2009 Francine BCC Sunset $39,735.00
4/3/2010 Francine BCC Sunshine $8,412.00 8/11/2009 Francine Big Al's Sunset $25,966.00
8/2/2010 Francine Big Al's Sunset $32,410.00 12/5/2009 Francine Big Al's Bellen $45,400.00 5/27/2009 Francine Big Al's Sunshine $41,597.00 7/25/2009 Francine Big Al's Bellen $7,391.00 7/17/2010 Francine Big Al's Bellen $44,931.00
6/7/2009 Francine Big Al's Bellen $39,190.00 9/24/2010 Francine CCC Carlota $30,043.00

5/4/2009 Francine CCC Sunset $11,869.00 10/18/2009 Francine CCC Bellen $40,793.00
8/17/2010 Francine Citi Sunset $46,767.00 4/4/2009 Francine Citi Carlota $36,157.00
4/12/2010 Francine Citi Quad $27,444.00 4/18/2009 Francine Citi Quad $24,797.00 6/22/2009 Francine Citi Carlota $32,964.00 2/17/2009 Francine Citi Bellen $21,239.00 8/11/2010 Francine Coke Sunshine $15,389.00 7/15/2009 Francine Coke Carlota $3,327.00
12/23/2010 Francine Coke Sunset $26,807.00 9/30/2009 Francine Coke Sunset $41,820.00
10/24/2010 Francine Coke Sunbell $3,614.00 11/19/2010 Francine Costco Carlota $36,381.00
5/1/2009 Francine Costco Bellen $45,581.00 1/7/2009 Francine Costco Sunshine $7,820.00
8/23/2009 Francine Costco Carlota $9,192.00 2/2/2010 Francine Costco Sunset $2,083.00
3/16/2009 Francine Economist Sunset $20,568.00 2/25/2010 Francine Economist Bellen $40,134.00 11/5/2010 Francine Economist Bellen $8,939.00
11/28/2009 Francine Economist Sunset $11,279.00 5/27/2009 Francine Economist Bellen $5,185.00 3/27/2010 Francine Economist Bellen $24,534.00
12/30/2010 Francine Economist Bellen $772.00 1/27/2009 Francine Evergreen Quad $47,953.00
6/1/2010 Francine Evergreen Sunset $9,086.00 6/22/2010 Francine Evergreen Sunbell $49,191.00 2/20/2009 Francine Fred Myer Quad $3,947.00
6/3/2009 Francine Fred Myer Carlota $37,719.00 10/2/2010 Francine Fred Myer Carlota $45,001.00 6/14/2010 Francine HCC Carlota $18,483.00 11/4/2010 Francine HCC Bellen $13,465.00 5/14/2009 Francine HCC Sunset $12,400.00 6/28/2009 Francine HCC Sunset $36,995.00 8/24/2010 Francine HCC Sunset $1,457.00 9/26/2009 Francine Microsoft Carlota $28,324.00
10/20/2009 Francine Microsoft Sunshine $24,214.00 4/24/2009 Francine Microsoft Bellen $32,081.00 8/13/2010 Francine Microsoft Sunshine $29,954.00
12/24/2009 Francine Microsoft Carlota $19,541.00 1/25/2010 Francine MrExcel.com Sunset $46,841.00 8/24/2010 Francine MrExcel.com Carlota $33,809.00 8/17/2010 Francine MrExcel.com Quad $6,613.00 12/2/2009 Francine MrExcel.com Carlota $18,967.00
5/7/2010 Francine NCC Quad $49,667.00 7/4/2009 Francine NCC Sunbell $18,459.00
11/30/2010 Francine NCC Sunshine $46,904.00

12/19/2009 Francine Oly Co-op Sunshine $25,568.00 1/26/2010 Francine Oly Co-op Sunbell $43,122.00 5/26/2010 Francine Oly Co-op Quad $5,460.00 8/22/2010 Francine Oly Co-op Sunbell $3,609.00
9/7/2009 Francine PCC Carlota $1,718.00 5/11/2010 Francine PCC Sunbell $27,563.00
3/7/2010 Francine Rite Aid Bellen $11,477.00 1/14/2010 Francine Rite Aid Sunshine $31,217.00 12/8/2009 Francine Rite Aid Sunset $37,926.00
10/21/2009 Francine Rite Aid Bellen $1,092.00 11/26/2009 Francine Rite Aid Quad $19,905.00
8/9/2010 Francine Rite Aid Sunshine $27,288.00 3/22/2009 Francine SSCC Sunshine $26,881.00 11/1/2009 Francine SSCC Quad $11,203.00 8/15/2010 Francine SSCC Carlota $21,137.00 9/17/2010 Francine Starbucks Bellen $7,361.00 6/24/2009 Francine Starbucks Sunbell $4,349.00 10/5/2009 Francine Starbucks Quad $3,146.00
6/6/2010 Francine Walgreen's Sunset $12,336.00 10/3/2010 Francine Walgreen's Quad $19,171.00
9/8/2010 Francine Walgreen's Sunbell $39,169.00 2/3/2009 Francine Walgreen's Sunbell $1,319.00 3/6/2010 Francine Walgreen's Bellen $37,374.00
12/2/2009 Francine Walgreen's Sunset $17,139.00 9/3/2009 Francine Walgreen's Carlota $9,950.00
5/15/2010 Francine Whole Foods Sunbell $32,690.00 12/9/2009 Francine Whole Foods Sunshine $39,673.00 8/11/2010 Sioux Amazon.com Sunbell $30,649.00 1/15/2010 Sioux Amazon.com Sunshine $7,701.00 8/29/2009 Sioux Amazon.com Carlota $3,692.00
10/12/2009 Sioux Amazon.com Sunset $27,066.00 10/14/2009 Sioux Amazon.com Sunshine $21,376.00
9/24/2009 Sioux Amazon.com Bellen $36,701.00 3/20/2010 Sioux Amazon.com Sunset $18,488.00
4/4/2010 Sioux Amazon.com Sunshine $12,913.00 9/4/2009 Sioux Amazon.com Sunbell $48,743.00 8/1/2010 Sioux Amazon.com Sunbell $860.00 4/4/2009 Sioux Amazon.com Sunbell $42,434.00
4/18/2010 Sioux Amazon.com Quad $4,027.00 1/7/2009 Sioux Amazon.com Carlota $29,289.00
9/10/2009 Sioux Amazon.com Quad $26,842.00 1/17/2010 Sioux Amazon.com Sunshine $6,239.00 9/10/2010 Sioux Amazon.com Sunset $15,257.00 3/25/2009 Sioux Amazon.com Quad $1,681.00 6/12/2009 Sioux Fred Myer Sunbell $10,634.00
6/7/2010 Sioux Fred Myer Sunset $32,294.00 7/12/2010 Sioux Fred Myer Sunset $4,427.00 2/24/2010 Sioux Fred Myer Sunset $40,397.00

10/31/2010 Sioux Fred Myer Carlota $24,116.00 10/5/2009 Sioux Fred Myer Quad $6,363.00 1/20/2009 Sioux Fred Myer Bellen $31,935.00 7/10/2010 Sioux Fred Myer Quad $22,606.00 7/19/2009 Sioux Fred Myer Sunshine $22,436.00 4/28/2010 Sioux Fred Myer Carlota $29,595.00 3/11/2010 Sioux Fred Myer Carlota $16,838.00 7/13/2009 Sioux Fred Myer Carlota $32,194.00
9/8/2009 Sioux Fred Myer Sunshine $41,589.00 4/19/2009 Sioux Fred Myer Quad $24,638.00
2/6/2010 Sioux Fred Myer Sunset $43,192.00 6/10/2009 Sioux Fred Myer Bellen $38,646.00
10/14/2010 Sioux Fred Myer Carlota $34,056.00 8/6/2009 Sioux Fred Myer Sunbell $3,610.00 9/2/2010 Sioux Fred Myer Bellen $36,710.00
4/14/2009 Sioux Fred Myer Sunbell $12,493.00 6/5/2010 Sioux Fred Myer Sunbell $8,766.00
5/27/2009 Sioux Fred Myer Sunshine $38,508.00 1/26/2009 Sioux MrExcel.com Quad $37,701.00 6/28/2010 Sioux MrExcel.com Sunbell $37,146.00
12/28/2010 Sioux MrExcel.com Carlota $26,919.00 1/30/2009 Sioux MrExcel.com Sunset $17,422.00 3/24/2010 Sioux MrExcel.com Sunset $39,119.00
5/5/2009 Sioux MrExcel.com Carlota $45,582.00 9/15/2010 Sioux MrExcel.com Carlota $31,165.00 2/20/2009 Sioux MrExcel.com Sunshine $24,226.00 9/14/2010 Sioux MrExcel.com Quad $27,758.00 3/14/2010 Sioux MrExcel.com Quad $36,439.00 4/30/2009 Sioux MrExcel.com Quad $25,112.00 6/17/2009 Sioux MrExcel.com Sunshine $17,078.00 11/3/2009 Sioux MrExcel.com Sunbell $5,731.00
1/8/2010 Sioux MrExcel.com Bellen $12,199.00 9/16/2009 Sioux MrExcel.com Bellen $34,033.00
4/3/2009 Sioux MrExcel.com Bellen $8,408.00 9/19/2010 Sioux MrExcel.com Quad $28,936.00 5/16/2010 Sioux PCC Sunset $36,603.00 4/16/2009 Sioux PCC Sunshine $11,193.00
4/2/2010 Sioux PCC Carlota $6,386.00 6/15/2010 Sioux PCC Carlota $5,494.00
12/14/2010 Sioux PCC Sunshine $41,433.00 11/29/2009 Sioux PCC Sunshine $21,461.00
1/6/2009 Sioux PCC Sunset $28,917.00 3/30/2010 Sioux PCC Sunbell $15,381.00 10/5/2009 Sioux PCC Carlota $37,289.00 5/11/2009 Sioux PCC Bellen $48,256.00
8/2/2010 Sioux PCC Sunbell $48,195.00 6/5/2010 Sioux PCC Bellen $9,448.00
5/10/2009 Sioux PCC Bellen $18,116.00

11/23/2010 Sioux PCC Bellen $18,485.00 11/24/2009 Sioux PCC Sunbell $31,086.00
5/21/2010 Sioux PCC Sunset $27,120.00 8/23/2010 Sioux PCC Carlota $14,594.00 3/15/2009 Sioux PCC Quad $4,988.00 3/29/2009 Sioux PCC Carlota $1,957.00
9/6/2010 Sioux PCC Carlota $49,332.00 5/8/2009 Sioux Whole Foods Bellen $5,349.00
5/30/2009 Sioux Whole Foods Sunbell $17,229.00 8/17/2010 Sioux Whole Foods Carlota $33,404.00
12/19/2009 Sioux Whole Foods Bellen $41,310.00 12/19/2009 Sioux Whole Foods Quad $48,873.00
5/20/2009 Sioux Whole Foods Carlota $46,265.00 4/30/2009 Sioux Whole Foods Sunbell $4,130.00 7/17/2009 Sioux Whole Foods Carlota $13,632.00
10/29/2010 Sioux Whole Foods Sunbell $3,492.00 3/22/2009 Sioux Whole Foods Sunset $42,927.00 12/8/2009 Sioux Whole Foods Sunshine $39,142.00
6/9/2010 Sioux Whole Foods Quad $7,936.00 3/7/2010 Sioux Whole Foods Carlota $22,362.00
4/14/2010 Sioux Whole Foods Quad $43,955.00 7/10/2009 Sioux Whole Foods Sunset $15,378.00 11/3/2009 Sioux Whole Foods Carlota $34,347.00
8/5/2009 Sioux Whole Foods Carlota $48,886.00 10/22/2009 Sioux Whole Foods Quad $34,487.00
8/29/2009 Sioux Whole Foods Sunset $8,023.00 9/10/2010 Tina Amazon.com Sunbell $42,938.00
9/1/2010 Tina Amazon.com Quad $49,912.00 10/7/2009 Tina Amazon.com Sunshine $46,959.00
11/22/2010 Tina Amazon.com Sunbell $19,152.00 7/9/2010 Tina Amazon.com Carlota $25,090.00
8/13/2010 Tina Amazon.com Carlota $26,869.00 1/19/2009 Tina Amazon.com Sunshine $45,611.00 1/24/2009 Tina B&N Sunbell $9,236.00 3/18/2009 Tina B&N Sunbell $24,352.00
11/17/2010 Tina B&N Sunshine $47,009.00 4/4/2009 Tina B&N Bellen $21,524.00 5/6/2010 Tina BCC Sunshine $12,379.00
12/13/2009 Tina BCC Sunset $35,624.00 9/22/2009 Tina BCC Quad $47,641.00
4/5/2010 Tina BCC Sunshine $27,665.00 3/16/2009 Tina Big Al's Sunbell $36,382.00
12/18/2010 Tina Big Al's Sunshine $28,317.00 1/14/2009 Tina Big Al's Sunset $13,778.00 2/23/2009 Tina Big Al's Sunshine $36,855.00 5/15/2009 Tina CCC Quad $37,610.00 9/28/2009 Tina Citi Carlota $4,334.00
11/20/2009 Tina Citi Sunshine $38,727.00

12/8/2010 Tina Citi Bellen $1,591.00 9/18/2010 Tina Coke Sunbell $35,191.00 12/3/2010 Tina Coke Quad $42,348.00
12/22/2009 Tina Coke Quad $4,682.00 4/21/2010 Tina Coke Carlota $16,259.00 7/14/2009 Tina Coke Sunshine $41,953.00 5/13/2010 Tina Costco Sunset $20,939.00 2/16/2010 Tina Costco Bellen $25,574.00 5/25/2010 Tina Costco Sunset $785.00
4/9/2010 Tina Economist Quad $12,054.00 6/5/2009 Tina Economist Sunbell $8,615.00
3/20/2010 Tina Economist Quad $11,198.00 5/6/2010 Tina Evergreen Sunshine $21,986.00 3/7/2009 Tina Evergreen Sunshine $30,797.00
7/25/2009 Tina Evergreen Quad $23,147.00 5/17/2010 Tina Evergreen Bellen $37,771.00 2/14/2009 Tina Evergreen Sunshine $22,683.00
11/29/2010 Tina Fred Myer Sunset $569.00 7/23/2009 Tina Fred Myer Sunshine $7,867.00
2/7/2009 Tina Fred Myer Sunshine $15,100.00 6/8/2009 Tina Fred Myer Sunset $8,439.00
10/3/2010 Tina Fred Myer Sunset $49,893.00 12/16/2010 Tina Fred Myer Sunbell $35,595.00
4/7/2010 Tina Fred Myer Quad $21,067.00 8/18/2009 Tina HCC Sunset $10,794.00
10/27/2009 Tina HCC Carlota $28,116.00 10/7/2010 Tina HCC Sunshine $711.00 5/13/2010 Tina HCC Bellen $31,431.00 8/10/2009 Tina HCC Quad $49,373.00 5/18/2010 Tina HCC Quad $10,440.00 1/13/2010 Tina Microsoft Bellen $19,505.00 6/28/2010 Tina Microsoft Sunset $3,900.00 6/22/2010 Tina MrExcel.com Sunshine $21,075.00 3/25/2010 Tina MrExcel.com Quad $25,241.00
1/6/2009 Tina MrExcel.com Sunbell $39,465.00 12/12/2010 Tina MrExcel.com Sunset $46,141.00
4/11/2010 Tina NCC Sunshine $9,732.00 9/15/2010 Tina NCC Sunshine $21,574.00
10/13/2010 Tina NCC Quad $14,050.00 5/10/2009 Tina NCC Bellen $10,052.00
6/3/2009 Tina Oly Co-op Carlota $2,188.00 9/3/2009 Tina Oly Co-op Bellen $18,954.00
12/26/2010 Tina Oly Co-op Sunshine $9,907.00 5/5/2009 Tina Oly Co-op Sunshine $33,297.00
5/20/2010 Tina Oly Co-op Sunset $20,439.00 7/18/2009 Tina PCC Bellen $27,847.00 9/30/2010 Tina PCC Bellen $21,363.00
12/15/2009 Tina PCC Sunset $35,439.00
11/6/2010 Tina PCC Sunbell $10,007.00 1/4/2009 Tina PCC Carlota $16,963.00 8/2/2009 Tina Rite Aid Sunbell $39,814.00
1/17/2009 Tina Rite Aid Sunbell $33,776.00 1/10/2009 Tina Rite Aid Sunset $32,663.00 4/19/2009 Tina Rite Aid Bellen $35,226.00
11/20/2009 Tina Rite Aid Bellen $22,470.00 10/12/2010 Tina Rite Aid Bellen $9,564.00
9/12/2009 Tina SSCC Sunbell $46,669.00 10/16/2009 Tina SSCC Sunshine $6,713.00
6/6/2010 Tina SSCC Sunset $25,473.00 2/7/2010 Tina SSCC Sunbell $12,304.00
12/27/2009 Tina SSCC Carlota $39,206.00 1/16/2010 Tina SSCC Bellen $43,707.00
2/8/2010 Tina Starbucks Sunset $18,115.00 4/25/2010 Tina Starbucks Sunbell $32,331.00 8/26/2009 Tina Starbucks Bellen $9,125.00 9/11/2009 Tina Starbucks Quad $35,728.00 5/24/2009 Tina Starbucks Sunset $15,915.00
10/28/2010 Tina Starbucks Sunset $29,458.00 8/10/2009 Tina Starbucks Bellen $43,896.00 12/3/2010 Tina Walgreen's Carlota $48,359.00 12/7/2010 Tina Walgreen's Sunset $45,206.00 8/17/2010 Tina Walgreen's Bellen $43,453.00
8/6/2010 Tina Walgreen's Sunbell $35,677.00 12/22/2009 Tina Walgreen's Bellen $46,112.00
2/18/2009 Tina Whole Foods Sunset $2,318.00 9/14/2009 Tina Whole Foods Carlota $16,277.00
6/8/2010 Tina Whole Foods Carlota $10,427.00 12/31/2009 Tina Whole Foods Sunbell $43,968.00
12/7/2009 Tina Whole Foods Quad $817.00 7/3/2009 Tina Whole Foods Quad $39,506.00
3/22/2010 Tina Whole Foods Sunset $48,307.00 5/29/2009 Tina Whole Foods Sunbell $18,773.00
8/1/2010 Tina Whole Foods Sunshine $2,300.00
4 24
SalesRep Customer
YouTubers Love Excel 2007 #4: Count Unique Records
YTLE#56: Excel Count Unique Values Greater Than $30
Excel Magic Trick #187: Unique List w Dynamic Formula
Excel Magic Trick 185 Dynamic Formula Extract Data 1criteria
Count Unique
Count Unique Records For SalesRep
Count Unique Records For Customer
Count Unique Records For Unique List of Customers within a Unique List of Sales Reps


Related Documents