Employment Integration of Nursing Graduates: Evaluation of a Provincial Policy Strategy Nursing Graduate Guarantee 2014-2015 Nursing Health Services Research Unit Health Human Resources Series 44 May 2016 Andrea Baumann, RN, PhD Mabel Hunsberger, RN, PhD Mary Crea-Arsenio, MSc

Welcome message from author
This document is posted to help you gain knowledge. Please leave a comment to let me know what you think about it! Share it to your friends and learn new things together.
Transcript

Employment Integration of Nursing Graduates:
Evaluation of a Provincial Policy Strategy Nursing Graduate Guarantee 2014-2015
Nursing Health Services Research Unit
Health Human Resources Series 44
May 2016
Andrea Baumann, RN, PhDMabel Hunsberger, RN, PhDMary Crea-Arsenio, MSc
1
Employment Integration of Nursing Graduates: Evaluation of a Provincial Policy Strategy
Nursing Graduate Guarantee 2014-2015
Number 44
Andrea Baumann, RN, PhD, Associate Vice President, Global Health, Faculty of Health Sciences & Scientific Director, Nursing Health Services Research Unit (McMaster University site)
Mabel Hunsberger, RN, PhD, Associate Professor, School of Nursing & Research Associate, Nursing Health Services Research Unit (McMaster University site)
Mary Crea-Arsenio, MSc, Research Coordinator, Nursing Health Services Research Unit (McMaster University site)
Contact Andrea Baumann Phone (905) 525-9140, ext. 22581 Email [email protected] Website www.nhsru.com
This research has been generously funded by a grant from the Government of Ontario. The views expressed in this report do not necessarily reflect those of the Government of Ontario.
2
TABLE OF CONTENTS
EXECUTIVE SUMMARY ............................................................................................................ 6
INTRODUCTION .......................................................................................................................... 8
Background to the Nursing Graduate Guarantee ...................................................................................... 8 CONTEXT ...................................................................................................................................... 9
Overview of Nurse Supply in Ontario ...................................................................................................... 9 The New Supply: RNs and RPNs in Ontario .......................................................................................... 11 Data on New Member Nurses ................................................................................................................. 13 Profile of Healthcare Employment in Ontario ........................................................................................ 14
HEALTH HUMAN RESOURCE PLANNING: NURSING STRATEGIES .............................. 15
NGG: Integrating New Graduates Into The Workforce ......................................................................... 15 EVALUATION OF THE NGG 2014-2015 .................................................................................. 16
Aim and Objectives ................................................................................................................................. 16 Methods................................................................................................................................................... 17
RESULTS ..................................................................................................................................... 18
NGG Participation by NGNs .................................................................................................................. 18 Employer NGG Participation .................................................................................................................. 19 Survey and Interview Sample ................................................................................................................. 20 Demographic Characteristics of Survey Respondents ............................................................................ 21
New Graduate Nurses ................................................................................................................................. 21 Union Representatives ................................................................................................................................ 24
Registered Nurse and Registered Practical Nurse Employment ............................................................. 25 Characteristics of Participating and Non-participating NGNs ................................................................ 25 Employment Status ................................................................................................................................. 29 New Graduate Preference for Full-Time ................................................................................................ 31 Comparison to CNO New Member Employment Data .......................................................................... 31
Stakeholder Perceptions of the NGG ............................................................................................ 33
Promotion of the NGG: How Employers and NGNS Were Informed ................................................... 33 Website Design and Functionality: Employer and New Graduate Ratings ............................................ 33 Facilitating NGN Transition to Work: Mentoring and Support for New Graduates .............................. 34

3
Benefits ....................................................................................................................................................... 34 Mentorship .................................................................................................................................................. 34 Orientation .................................................................................................................................................. 35 Full-Time Employment ............................................................................................................................... 35 Retention ..................................................................................................................................................... 36 Challenges and Areas for Improvement ..................................................................................................... 36 Bargaining Unit and Employer Collaboration: Where are the Gaps? ........................................... 37
Overall Impact of the Nursing Graduate Guarantee ..................................................................... 38
CONCLUSION ............................................................................................................................. 38
REFERENCES ............................................................................................................................. 40
APPENDIX A. OVERVIEW OF NURSE EDUCATION IN ONTARIO ................................... 47
APPENDIX B. LITERATURE REVIEW .................................................................................... 49
APPENDIX C. ONTARIO GOVERNMENT INVESTMENTS ................................................. 52
APPENDIX D. METHODOLOGY AND ANALYSIS ............................................................................. 53
4
LIST OF FIGURES
Figure 1. College of Nurses of Ontario RN Renewals and Employment 1994-2015 ................... 10
Figure 2. College of Nurses of Ontario RPN Renewals and Employment 1994-2015 ................. 11
Figure 3. Enrolment and Graduation of Ontario RNs 1999-2014 ................................................ 12
Figure 4. Enrolment and Graduation of Ontario RPNs 1998/1999-2013/2014 ............................ 13
Figure 5. New Member RNs and RPNs by Location of Nursing Education 1996-2014 .............. 14
Figure 6. New Graduate Nurses (RNs/RPNs) Participating in the NGG 2007-2014 ................... 18
Figure 7. New Graduate Nurses' Preferences for Full-Time Employment 2008-2014 ................ 31

5
LIST OF TABLES
Table 1. Summary of Methods Triangulation for Stakeholder Groups ........................................ 17
Table 2. New Graduate Nurse (RN/RPN) Matches by Sector of Employment 2007/2008-
2014/2015 ..................................................................................................................................... 19
Table 3. Cross-Sector Employer Participation in the NGG 2007/2008-2014/2015 ..................... 19
Table 4. Within Sector Employer Participation in the NGG 2007/2008-2014/2015 .................... 20
Table 5. Survey Response Rates ................................................................................................... 21
Table 6. New Graduate Nurse Respondents' Gender .................................................................... 21
Table 7. New Graduate Nurse Respondents' Age Distribution .................................................... 22
Table 8. New Graduate Nurse Respondents' Employment Status ................................................ 22
Table 9. New Graduate Nurse Respondents' Employment by Sector ........................................... 23
Table 10. New Graduate Nurse Respondents' Employment by Practice Area ............................. 23
Table 11. New Graduate Nurse Respondents' Employment by Geographic Region .................... 24
Table 12. Number and Percent of Respondents by NGG Participation 2014-2015 ..................... 25
Table 13. Distribution of NGG and Non-NGG Nurses Across Five Age Groups ........................ 26
Table 14. Distribution of NGG and Non-NGG Nurses Across Sectors 2007-2014 ..................... 28
Table 15. Employment Status of NGG and Non-NGG Nurses Across Employment Sectors ...... 30
Table 16. CNO RN New Member Working Status 2005-2015 .................................................... 32
Table 17. CNO RPN New Member Working Status 2005-2015 .................................................. 32

6
EXECUTIVE SUMMARY In 2007, the Ontario Ministry of Health and Long-Term Care launched the Nursing
Graduate Guarantee (NGG), an employment policy incentive intended to stabilize the nursing
workforce. The NGG provides funds for employers to hire new nurses including registered
nurses (RNs) and registered practical nurses (RPNs), into temporary supernumerary full-time
(FT) positions for three to six months. The impact of the policy on nurse employment has been
analyzed annually using outcome measures such as nurse preferences, FT employment rates and
transition to work. This report presents the results of the 2014-2015 NGG evaluation.
The 2014-2015 analysis demonstrates that the trend in FT and part-time employment for
RNs and RPNs is similar to previous years. The supply of RNs has increased over time and the
rate of FT has stabilized, while RPNs continue to have lower rates of FT employment. For both
nurse categories, the preference for FT has remained high. Participating employers continue to
be predominantly acute care hospitals in large urban centres across the province. While there has
been a slight increase in participation in the long-term care sector, participation by community
care has remained low.
In addition to employment outcomes, the employment portal and the extended orientation
and mentorship component of the NGG were evaluated. Based on the findings, satisfaction with
the Nurses' Career Start Gateway has improved. Results of the current evaluation have been
integrated into an eight-year new graduate employment database that demonstrates the NGG has
significantly affected integration and retention and influenced key dimensions of care delivery
(e.g., decision-making, communication, care management, system integration and commitment).
In 2014-2015, some organizations transitioned new graduate nurses (NGNs) into nursing
resource teams until FT positions became available. Longitudinal analysis highlighted various
reasons why organizations were not able to immediately place graduates into FT positions. For

7
example, NGNs choosing to remain in a preferred area of clinical practice and being placed into
a PT position until a FT job became available. Longitudinal analysis also showed a higher rate of
FT employment among nurses who participated in the NGG compared to those who did not.
Participants reported receiving FT employment within two years of entering the nursing
workforce. Data confirm that the retention rate among NGG participants was higher compared to
non-participants. Employers and NGNs reinforced the importance of continued investment in the
policy to support transition to work for future graduates.
RECOMMENDATIONS
1. Design a communication plan that promotes employer participation across sectors and
regions.
2. Conduct an in-depth analysis of RPNs in the healthcare workforce to better understand their
participation, preferences and experiences in the NGG.
3. Examine the effect of employment saturation and actual job availability in Ontario.
4. Analyze nursing employment trends and expand the evaluation framework to include the
impact of the NGG on new graduate retention and quality of patient care.
5. Conduct a longitudinal analysis of the FT nursing workforce across regions in Ontario.
6. Identify best practices that integrate and retain new graduates in the nursing workforce.
7. Investigate and compare the impact of the NGG on selected healthcare organizations.
8. Link NGG data with available information on patient outcomes
8
INTRODUCTION
In the past decade, the Ontario government has made significant investments in health human
resources planning. A number of policies and strategies were formulated based on evidence that
showed maldistribution of nurses and care providers to meet the growing demand for service.
The Ministry of Health and Long-Term Care (MOHLTC) developed the Nursing Graduate
Guarantee (NGG) to encourage full-time (FT) employment of new graduate nurses (NGNs) in
Ontario. New graduate nurses include registered nurses (RNs) and registered practical nurses
(RPNs). The policy has been evaluated annually since its introduction in 2007. This report
presents the results of the 2014-2015 evaluation. It includes background information on the
NGG, describes the policy, reports recent findings and offers conclusions and recommendations.
An overview of nurse education in Ontario is provided in Appendix A.
BACKGROUND TO THE NURSING GRADUATE GUARANTEE
Non-standard work arrangements in the private and public sector are on the rise. The trend
toward precarious employment—jobs with a higher than normal uncertainty around pay, hours
and job security—and its potential negative effect on the health workforce and delivery of care
has become a concern for the Ontario government (Burleton, Goulati, McDonald, & Scarfone,
2013; Lewchuk & Lafleche, 2014).
Healthcare restructuring in the 1990s led to an increase in part-time (PT) and casual
employment of nurses province-wide. The Severe Acute Respiratory Syndrome outbreak in 2003
demonstrated the lack of surge capacity to respond to the epidemic and highlighted the issue of
PT and casual nursing staff throughout the province (Baumann, Keatings, Holmes, Oreschina, &
Fortier, 2006b; Walker, 2004). The long-term effect of institutional downsizing is a destabilized
9
workforce that is often slow to recover post-recession (Alameddine, Baumann, Laporte, &
Deber, 2012). During economic fluctuations, and especially during recessions, precarious
employment is further exacerbated (Caldbick, Labonte, Mohindra, & Ruckert, 2014). Appendix
B provides additional information on labour market trends and factors affecting job availability
for NGNs.
The NGG was launched at a time when 75% of NGNs were seeking FT positions, but
only 35% had FT employment (Baumann, Blythe, Cleverley, & Grinspun, 2006a). It is intended
to fund temporary supernumerary (above staff complement) FT nursing positions for up to six
months. As part of the HealthForceOntario (HFO) health human resources strategy, the goal of
the NGG has been to "provide every New Graduate Nurse with the opportunity to obtain full
time employment in Ontario" (MOHLTC, 2011 p. 4). Ongoing evaluation of the policy provides
evidence of its effectiveness over time.
CONTEXT
OVERVIEW OF NURSE SUPPLY IN ONTARIO
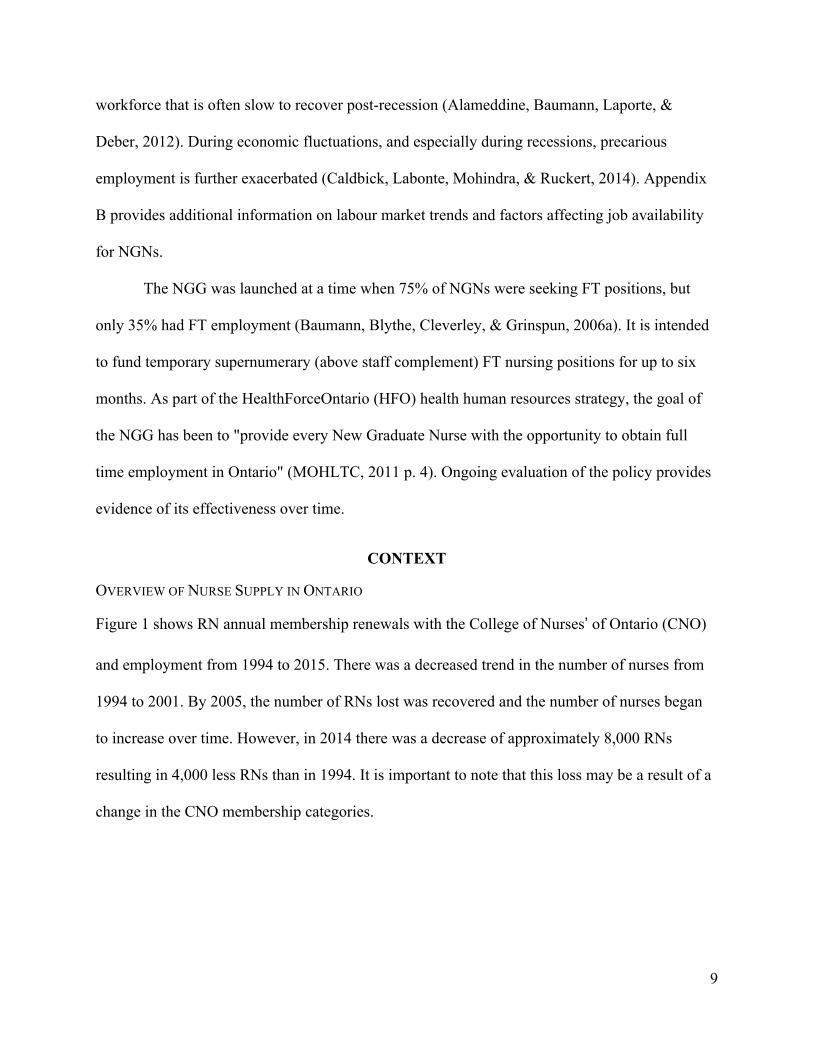
Figure 1 shows RN annual membership renewals with the College of Nurses’ of Ontario (CNO)
and employment from 1994 to 2015. There was a decreased trend in the number of nurses from
1994 to 2001. By 2005, the number of RNs lost was recovered and the number of nurses began
to increase over time. However, in 2014 there was a decrease of approximately 8,000 RNs
resulting in 4,000 less RNs than in 1994. It is important to note that this loss may be a result of a
change in the CNO membership categories.

10
Figure 1. College of Nurses of Ontario RN Renewals and Employment 1994-2015
Source: College of Nurses of Ontario (2015) Membership Statistics Report.
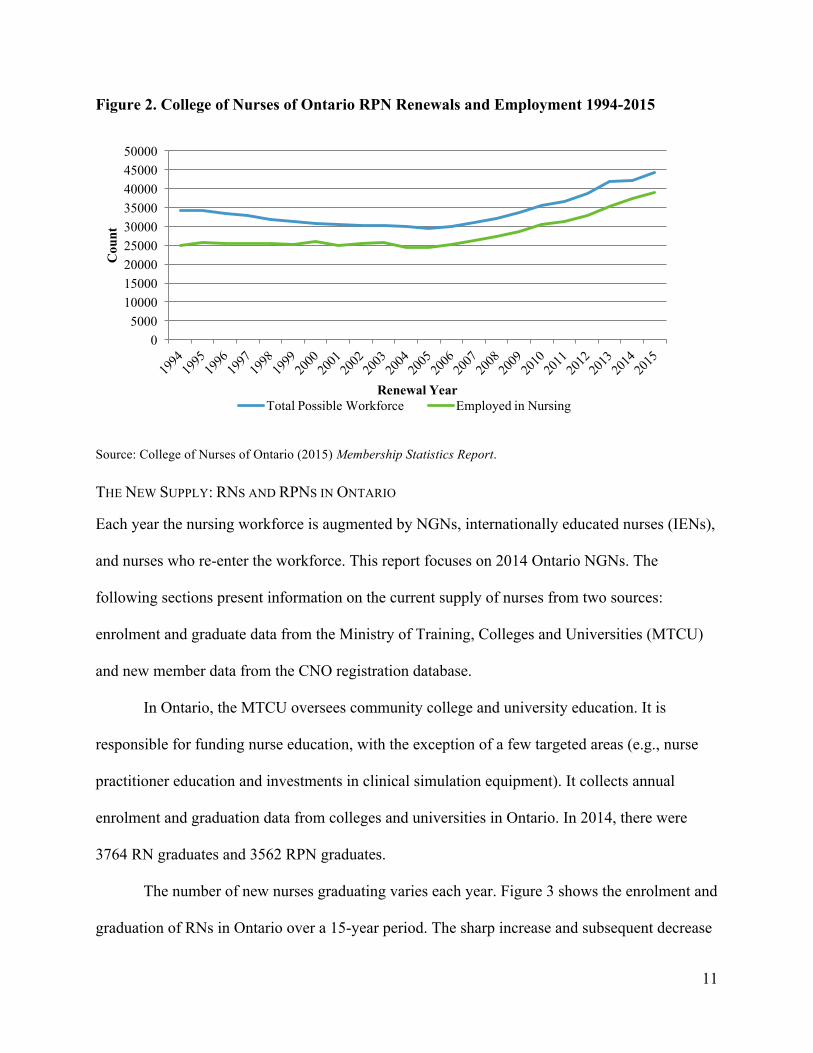
In contrast, RPN supply in Ontario has been slower to recover from healthcare system
restructuring (College of Nurses of Ontario [CNO], 2015). Figure 2 shows RPN renewals and
employment from 1994 to 2015. There was a decreased trend from 1994 to 2005, resulting in a
14% loss of RPNs from the workforce. By 2010, the number of RPNs lost was recovered and has
increased to more than the number in 1994.
30000
50000
70000
90000
110000
130000
150000
1994
1995
1996
1997
1998
1999
2000
2001
2002
2003
2004
2005
2006
2007
2008
2009
2010
2011
2012
2013
2014
2015
Cou
nt
Renewal Year
Total Possible Workforce Employed in Nursing
11
Figure 2. College of Nurses of Ontario RPN Renewals and Employment 1994-2015
Source: College of Nurses of Ontario (2015) Membership Statistics Report.
THE NEW SUPPLY: RNS AND RPNS IN ONTARIO
Each year the nursing workforce is augmented by NGNs, internationally educated nurses (IENs),
and nurses who re-enter the workforce. This report focuses on 2014 Ontario NGNs. The
following sections present information on the current supply of nurses from two sources:
enrolment and graduate data from the Ministry of Training, Colleges and Universities (MTCU)
and new member data from the CNO registration database.
In Ontario, the MTCU oversees community college and university education. It is
responsible for funding nurse education, with the exception of a few targeted areas (e.g., nurse
practitioner education and investments in clinical simulation equipment). It collects annual
enrolment and graduation data from colleges and universities in Ontario. In 2014, there were
3764 RN graduates and 3562 RPN graduates.
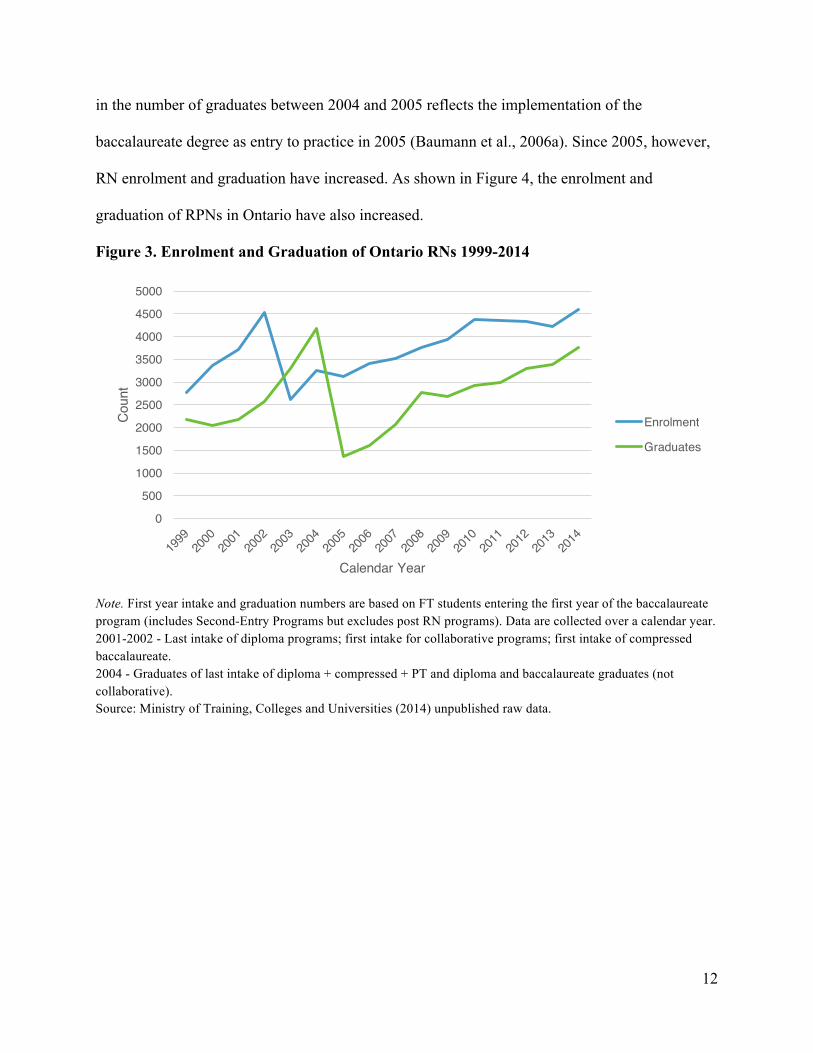
The number of new nurses graduating varies each year. Figure 3 shows the enrolment and
graduation of RNs in Ontario over a 15-year period. The sharp increase and subsequent decrease
05000
100001500020000250003000035000400004500050000
Cou
nt
Renewal YearTotal Possible Workforce Employed in Nursing
12
in the number of graduates between 2004 and 2005 reflects the implementation of the
baccalaureate degree as entry to practice in 2005 (Baumann et al., 2006a). Since 2005, however,
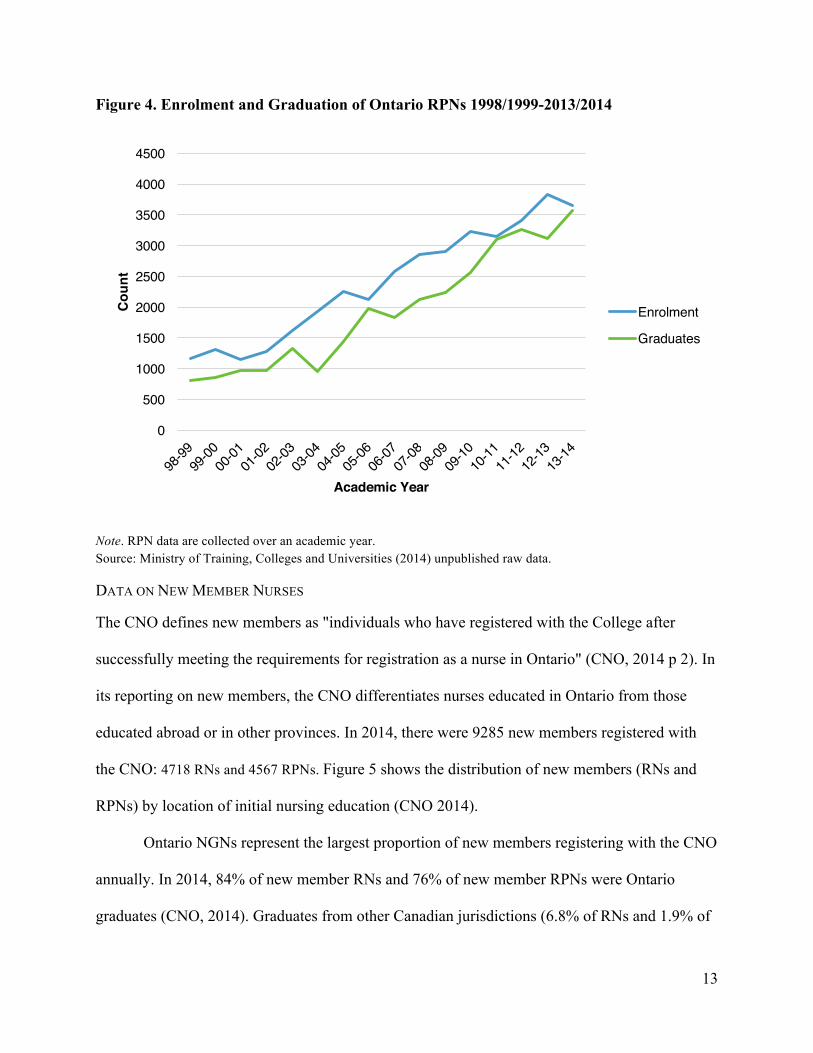
RN enrolment and graduation have increased. As shown in Figure 4, the enrolment and
graduation of RPNs in Ontario have also increased.
Figure 3. Enrolment and Graduation of Ontario RNs 1999-2014
Note. First year intake and graduation numbers are based on FT students entering the first year of the baccalaureate program (includes Second-Entry Programs but excludes post RN programs). Data are collected over a calendar year. 2001-2002 - Last intake of diploma programs; first intake for collaborative programs; first intake of compressed baccalaureate. 2004 - Graduates of last intake of diploma + compressed + PT and diploma and baccalaureate graduates (not collaborative). Source: Ministry of Training, Colleges and Universities (2014) unpublished raw data.
0
500
1000
1500
2000
2500
3000
3500
4000
4500
5000
Coun
t
Calendar Year
Enrolment
Graduates
13
Figure 4. Enrolment and Graduation of Ontario RPNs 1998/1999-2013/2014
Note. RPN data are collected over an academic year. Source: Ministry of Training, Colleges and Universities (2014) unpublished raw data.
DATA ON NEW MEMBER NURSES
The CNO defines new members as "individuals who have registered with the College after
successfully meeting the requirements for registration as a nurse in Ontario" (CNO, 2014 p 2). In
its reporting on new members, the CNO differentiates nurses educated in Ontario from those
educated abroad or in other provinces. In 2014, there were 9285 new members registered with
the CNO: 4718 RNs and 4567 RPNs. Figure 5 shows the distribution of new members (RNs and
RPNs) by location of initial nursing education (CNO 2014).
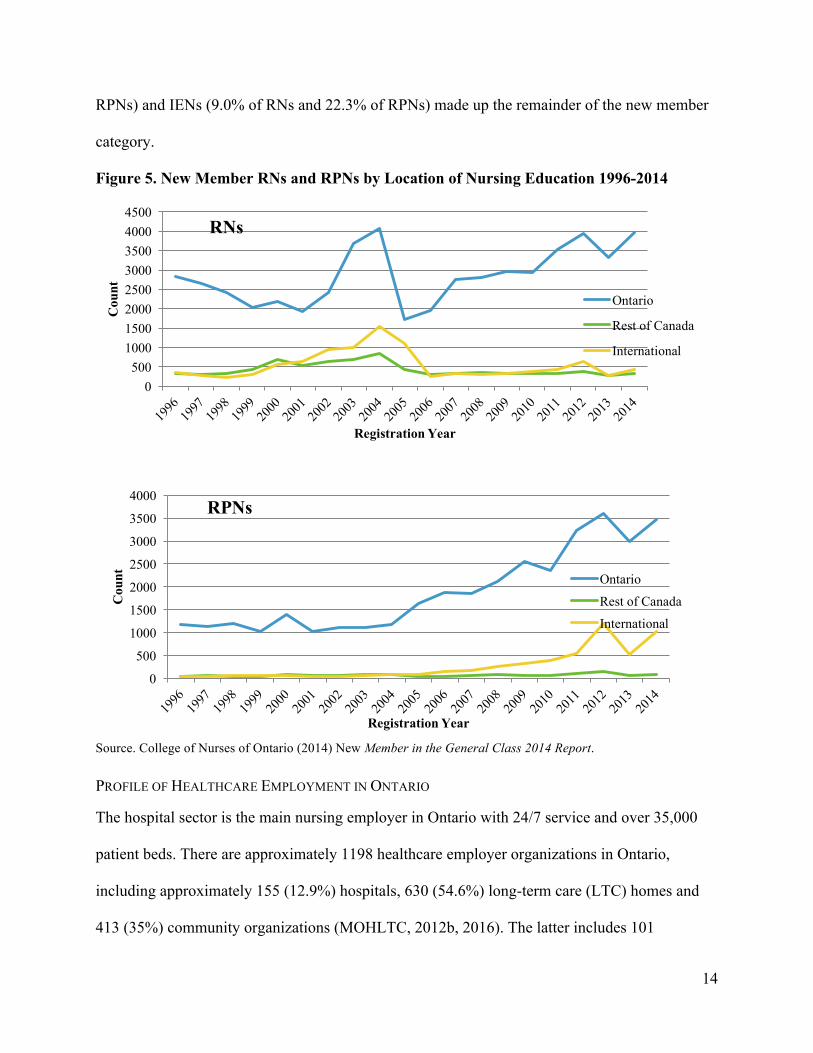
Ontario NGNs represent the largest proportion of new members registering with the CNO
annually. In 2014, 84% of new member RNs and 76% of new member RPNs were Ontario
graduates (CNO, 2014). Graduates from other Canadian jurisdictions (6.8% of RNs and 1.9% of
0
500
1000
1500
2000
2500
3000
3500
4000
4500
Coun
t
Academic Year
Enrolment
Graduates
14
RPNs) and IENs (9.0% of RNs and 22.3% of RPNs) made up the remainder of the new member
category.
Figure 5. New Member RNs and RPNs by Location of Nursing Education 1996-2014
Source. College of Nurses of Ontario (2014) New Member in the General Class 2014 Report.
PROFILE OF HEALTHCARE EMPLOYMENT IN ONTARIO
The hospital sector is the main nursing employer in Ontario with 24/7 service and over 35,000
patient beds. There are approximately 1198 healthcare employer organizations in Ontario,
including approximately 155 (12.9%) hospitals, 630 (54.6%) long-term care (LTC) homes and
413 (35%) community organizations (MOHLTC, 2012b, 2016). The latter includes 101
0500
10001500200025003000350040004500
Cou
nt
Registration Year
RNs
Ontario
Rest of Canada
International
0
500
1000
1500
2000
2500
3000
3500
4000
Cou
nt
Registration Year
RPNs
Ontario
Rest of Canada
International

15
Community Health Centres, 36 public health units, 14 Community Care Access Centres and 262
other organizations. According to the CNO (2015), there are currently 135,118 nurses (96,007
RNs and 39,111 RPNs) employed in nursing in Ontario.
HEALTH HUMAN RESOURCE PLANNING: NURSING STRATEGIES
The nursing labour market is sensitive to government investments and policy decisions. Starting
in 1999, in an attempt to reverse the attrition of nurses, the Ontario government led multiple
initiatives to increase the FT employment of nurses working in acute care hospitals and LTC
homes (MOHLTC, 2012a). Organizations were provided with base funding to support the hiring
of new nurses and the conversion of casual and PT nurses into FT staff.
Between 2004 and 2006, the government invested 30.4 million targeting NGNs
(MOHLTC, 2006b). An additional $17.7 million was invested in fiscal year 2004-2005, $12.7
million was invested in fiscal year 2005-2006 and $26.7 million was invested in fiscal year 2006-
2007 (MOHLTC, 2006a, 2008). The NGG was launched in 2007 with an initial investment of
$89 million (MOHLTC, 2007). The 2014-2015 investment was $84.6 million. Appendix C
provides further information on Ontario government investments.
NGG: INTEGRATING NEW GRADUATES INTO THE WORKFORCE
The MOHLTC offers employers funding to hire NGNs into temporary supernumerary FT
positions for up to six months (MOHLTC, 2014). The NGG uses an online employment portal,
the Nurses' Career Start Gateway, to link NGNs with employers who post available NGG
positions (HFO, 2013). Employers and NGNs must register on the portal to participate.
After a minimum period of 12 weeks but within 26 weeks, the MOHLTC expects
employers to transition NGNs into permanent FT positions (MOHLTC, 2014). Employers
commit to providing an additional six weeks of self-funded supernumerary FT employment for
16
NGNs if they are unable to bridge them into permanent FT positions within 26 weeks. The goals
of the NGG are as follows:
• Provide every NGN with the opportunity to obtain experience in nursing through FT
temporary positions.
• Promote the availability of permanent FT positions for NGNs.
• Enable matching between NGNs and employers.
• Create bridging positions for NGNs.
• Support Ontario NGNs as they transition to practice.
• Improve workforce integration of NGNs
• Facilitate recruitment in all sectors.
• Encourage employers to maximize availability of FT nursing positions.
• Increase the total supply of nurses by providing temporary FT employment opportunities to
nurses who choose to make Ontario their home.
EVALUATION OF THE NGG 2014-2015
AIM AND OBJECTIVES
The overall aim was to determine the impact of the NGG on the FT employment and transition to
work of NGNs in Ontario. The objectives were as follows:
• Identify demographics, employment status and employment status preferences of NGNs;
• Examine trends in NGN employment status over time;
• Describe stakeholder perceptions (i.e., employers, NGNs, mentors) of the NGG, including
barriers and facilitators to participation; and
• Analyze the effect of the extended orientation and mentorship component of the NGG on the
transition to work of NGNs.
17
METHODS
A mixed methods approach was used (Tashakkori & Teddlie, 2003). The use of quantitative and
qualitative methods to evaluate policy ensures that a study is well contextualized and policy
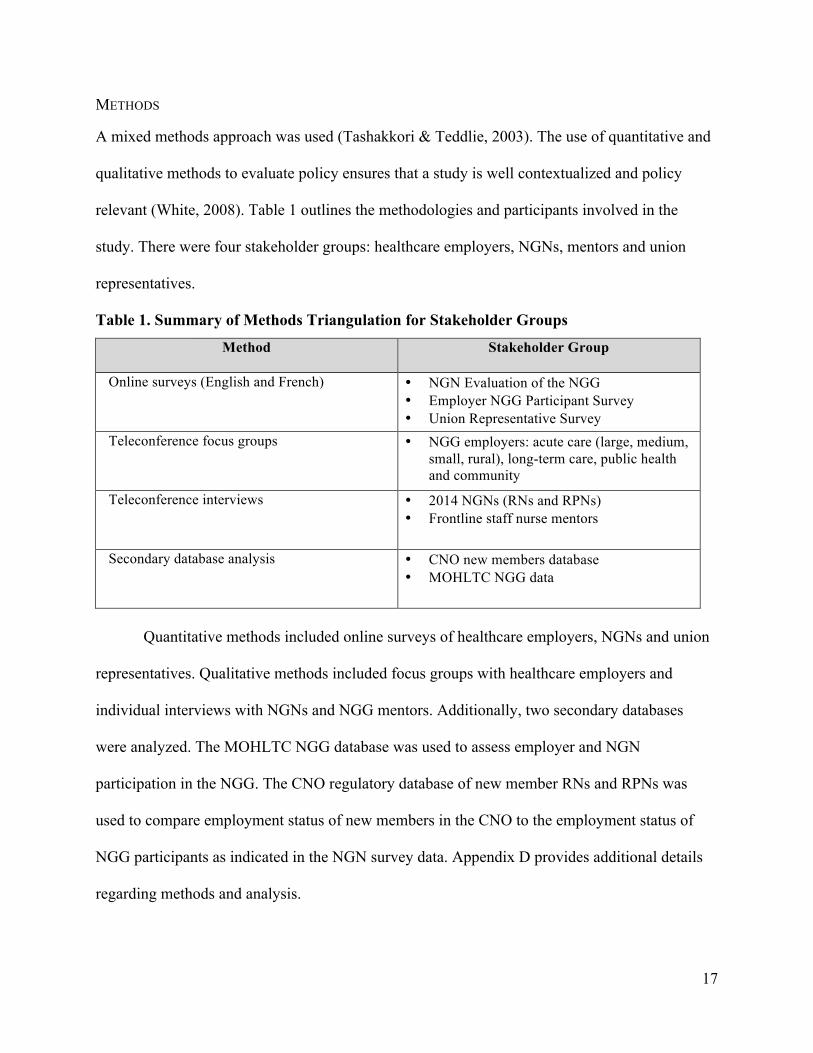
relevant (White, 2008). Table 1 outlines the methodologies and participants involved in the
study. There were four stakeholder groups: healthcare employers, NGNs, mentors and union
representatives.
Table 1. Summary of Methods Triangulation for Stakeholder Groups
Method Stakeholder Group
Online surveys (English and French) • NGN Evaluation of the NGG • Employer NGG Participant Survey • Union Representative Survey
Teleconference focus groups • NGG employers: acute care (large, medium, small, rural), long-term care, public health and community
Teleconference interviews • 2014 NGNs (RNs and RPNs) • Frontline staff nurse mentors
Secondary database analysis • CNO new members database • MOHLTC NGG data
Quantitative methods included online surveys of healthcare employers, NGNs and union
representatives. Qualitative methods included focus groups with healthcare employers and
individual interviews with NGNs and NGG mentors. Additionally, two secondary databases
were analyzed. The MOHLTC NGG database was used to assess employer and NGN
participation in the NGG. The CNO regulatory database of new member RNs and RPNs was
used to compare employment status of new members in the CNO to the employment status of
NGG participants as indicated in the NGN survey data. Appendix D provides additional details
regarding methods and analysis.
18
RESULTS
This section focuses on the results of the NGG evaluation for 2014-2015. It includes findings
from the surveys, interviews, focus groups and secondary database analysis.
NGG PARTICIPATION BY NGNS
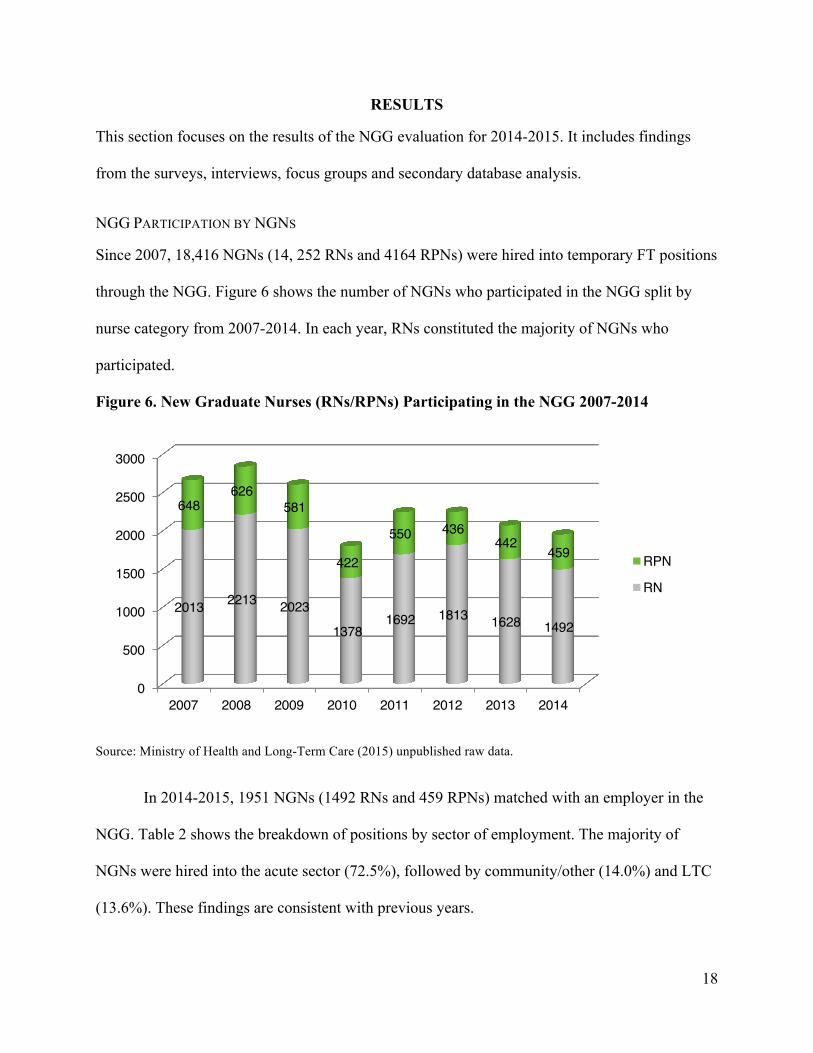
Since 2007, 18,416 NGNs (14, 252 RNs and 4164 RPNs) were hired into temporary FT positions
through the NGG. Figure 6 shows the number of NGNs who participated in the NGG split by
nurse category from 2007-2014. In each year, RNs constituted the majority of NGNs who
participated.
Figure 6. New Graduate Nurses (RNs/RPNs) Participating in the NGG 2007-2014
Source: Ministry of Health and Long-Term Care (2015) unpublished raw data.
In 2014-2015, 1951 NGNs (1492 RNs and 459 RPNs) matched with an employer in the
NGG. Table 2 shows the breakdown of positions by sector of employment. The majority of
NGNs were hired into the acute sector (72.5%), followed by community/other (14.0%) and LTC
(13.6%). These findings are consistent with previous years.
0
500
1000
1500
2000
2500
3000
2007 2008 2009 2010 2011 2012 2013 2014
2013 2213 2023
13781692 1813 1628 1492
648626
581
422
550 436442
459 RPN
RN

19
Table 2. New Graduate Nurse (RN/RPN) Matches by Sector of Employment 2007/2008-
2014/2015
Sector N(%) 2007-2008
2008-2009
2009-2010
2010-2011
2011-2012
2012-2013
2013-2014
2014-2015
Acute Care 2269(85) 2566(90) 2204(85) 1435(80) 1874(84) 1889(84) 1596(77) 1414(73)
Long-Term Care
209(8) 132(5) 231(9) 253(14) 287(13) 264(12) 284(14) 265(14)
Community/ Other
183(7) 141(5) 169(6) 112(6) 81(3) 96(4) 190(9) 272(14)
Total 2661(100) 2839(100) 2604(100) 1800(100) 2242(100) 2249(100) 2070(100) 1951(100)
Source: Ministry of Health and Long-Term Care (2015) unpublished raw data.
EMPLOYER NGG PARTICIPATION
Employer participation is defined as posting, matching and hiring an NGN through the Nurses'
Career Start Gateway. In 2014-2015, 219 employers participated in the NGG. Of these, 87 (40%)
were from the acute care sector, 89 (41%) were from LTC and 43 (19%) were from the
community (see Table 3).
Table 3. Cross-Sector Employer Participation in the NGG 2007/2008-2014/2015
Sector N(%) 2007-2008
2008-2009
2009-2010
2010-2011
2011-2012
2012-2013
2013-2014
2014-2015
Acute Care 97(44) 91(52) 106(47) 104(45) 96(45) 103(48) 97(41) 87(40)
Long-Term Care
87(39) 64(37) 86(38) 99(43) 94(44) 82(38) 94(40) 89(41)
Community/ Other
38(17) 20(11) 32(13) 27(11) 22(10) 29(14) 45(19) 43(19)
Total 222(100) 175(100) 224(100) 230(100) 212(100) 214(100) 236(100) 219(100)
Note. All totals as of November 24, 2015. Source: Ministry of Health and Long-Term Care (2015) unpublished raw data.
20
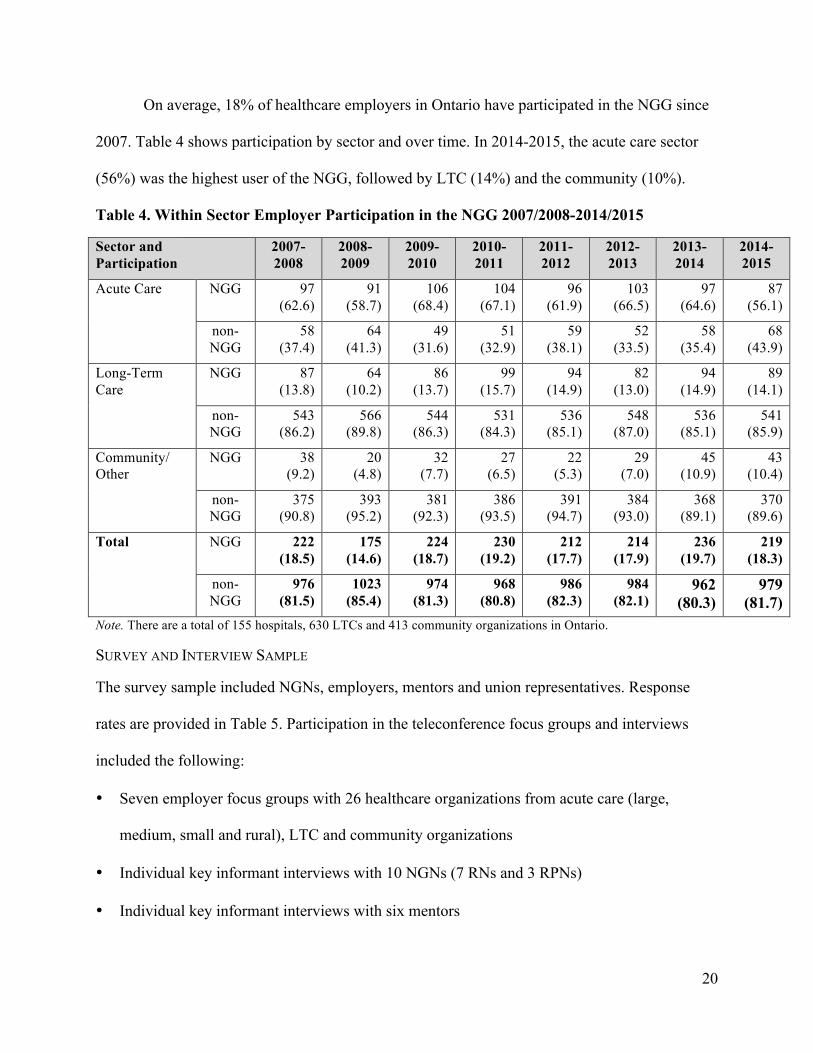
On average, 18% of healthcare employers in Ontario have participated in the NGG since
2007. Table 4 shows participation by sector and over time. In 2014-2015, the acute care sector
(56%) was the highest user of the NGG, followed by LTC (14%) and the community (10%).
Table 4. Within Sector Employer Participation in the NGG 2007/2008-2014/2015
Sector and Participation
2007-2008
2008-2009
2009-2010
2010-2011
2011-2012
2012-2013
2013-2014
2014-2015
Acute Care NGG 97 (62.6)
91 (58.7)
106 (68.4)
104 (67.1)
96 (61.9)
103 (66.5)
97 (64.6)
87 (56.1)
non-NGG
58 (37.4)
64 (41.3)
49 (31.6)
51 (32.9)
59 (38.1)
52 (33.5)
58 (35.4)
68 (43.9)
Long-Term Care
NGG 87 (13.8)
64 (10.2)
86 (13.7)
99 (15.7)
94 (14.9)
82 (13.0)
94 (14.9)
89 (14.1)
non-NGG
543 (86.2)
566 (89.8)
544 (86.3)
531 (84.3)
536 (85.1)
548 (87.0)
536 (85.1)
541 (85.9)
Community/ Other
NGG 38 (9.2)
20 (4.8)
32 (7.7)
27 (6.5)
22 (5.3)
29 (7.0)
45 (10.9)
43 (10.4)
non-NGG
375 (90.8)
393 (95.2)
381 (92.3)
386 (93.5)
391 (94.7)
384 (93.0)
368 (89.1)
370 (89.6)
Total NGG 222 (18.5)
175 (14.6)
224 (18.7)
230 (19.2)
212 (17.7)
214 (17.9)
236 (19.7)
219 (18.3)
non-NGG
976 (81.5)
1023 (85.4)
974 (81.3)
968 (80.8)
986 (82.3)
984 (82.1)
962 (80.3)
979 (81.7)
Note. There are a total of 155 hospitals, 630 LTCs and 413 community organizations in Ontario.
SURVEY AND INTERVIEW SAMPLE
The survey sample included NGNs, employers, mentors and union representatives. Response
rates are provided in Table 5. Participation in the teleconference focus groups and interviews
included the following:
• Seven employer focus groups with 26 healthcare organizations from acute care (large,
medium, small and rural), LTC and community organizations
• Individual key informant interviews with 10 NGNs (7 RNs and 3 RPNs)
• Individual key informant interviews with six mentors

21
Table 5. Survey Response Rates
Survey Number of Surveys Sent
Number of Respondents
Response Rate
NGN survey (English and French)
4230 981 23%
Participating employer survey (English and French)
156 137 88%
Union representative survey (English)
400 46 12%
Note: The NGN survey and participating employer survey focus on 2014-2015, the union representative survey focuses on 2014-2015.
DEMOGRAPHIC CHARACTERISTICS OF SURVEY RESPONDENTS
The 2014-2015 survey data are discussed in the sections below. Comparisons are made with the
CNO registration database where appropriate.
New Graduate Nurses
A total of 463 RNs and 518 RPNs responded to the survey. The majority of RN (91.4%) and
RPN (85.8%) respondents were female (see Table 6). Three-quarters of the RNs (75.8%) and
half of the RPNs (51.0%) were under 30 years of age (see Table 7).
Table 6. New Graduate Nurse Respondents' Gender
Gender Registered Nurse Registered Practical
Nurse
Total
Female 415(91.4) 440(85.8) 855(88.4)
Male 39(8.6) 73(14.2) 112(11.6)
Total 454(100.0) 513(100.0) 967(100.0)
Note: Missing responses N=14.

22
Table 7. New Graduate Nurse Respondents' Age Distribution
Age Registered Nurse Registered Practical Nurse
Total
24 or under 213(46.4) 132(26.6) 345(35.4) 25 to 29 135(29.4) 126(24.4) 261(26.8) 30 to 34 54(12.8) 68(13.2) 122(12.5) 35 to 39 32(7.0) 85(16.5) 117(12.0) 40 or more 25(5.4) 105(20.3) 130(13.3) Total 459(100.0) 516(100.0) 975(100.0) Note: Missing responses N= 6. Table 8 shows the employment status of NGN respondents at the time of survey. A
higher percentage of RNs (83.0%) were employed in nursing positions compared to RPNs
(48.8%). Of those not employed in nursing, 94.9% of RNs and 98.5% of RPNs were seeking
employment in nursing.
Table 8. New Graduate Nurse Respondents' Employment Status
Status Registered Nurse Registered Practical Nurse
Total
Employed in nursing 382(83.0) 252(48.8) 634(65.0) Not employed in nursing 78(17.0) 264(51.2) 342(35.0) Seeking 74 260 334 Not seeking 5 3 8 Total 460(100.0) 516(100.0) 976(100.0) Note. Missing responses N=5. More than half (55.8%) of respondents reported employment in the hospital sector (see
Table 9). However, analysis by nurse category demonstrated that RNs were primarily employed
in the hospital sector (70.7%) and RPNs were primarily employed in LTC (43.4%). Across areas
of clinical practice, RNs were distributed more evenly than RPNs (see Table 10). The most
common areas for RNs were geriatrics (12.5%) and medicine (12.3%). The most common area
for RPNs was geriatric nursing (40.5%).

23
Table 9. New Graduate Nurse Respondents' Employment by Sector
Sector Registered Nurse Registered Practical Nurse
Total
Hospital 256(70.7) 82(33.6) 338(55.8) Long-Term Care 45(12.4) 106(43.4) 151(24.9) Community 50(13.8) 49(20.1) 99(16.3) Other 11(3.0) 7(2.9) 18(3.0) Total 362(100.0) 244(100.0) 606(100.0) Note: Missing responses N=28. Table 10. New Graduate Nurse Respondents' Employment by Practice Area
Area of Practice Registered Nurse Registered Practical Nurse
Total
Geriatrics 45(12.5) 98(40.5) 143(23.8) Medicine 44(12.3) 27(11.2) 71(11.8) Surgery 31(8.6) 7(2.9) 38(6.3) Paediatrics 29(8.1) 6(2.5) 35(5.8) Visiting Nurse 17(4.7) 18(7.4) 35(5.8) Emergency Care/Emergency 28(7.8) 2(0.8) 30(5.0) Mental Health/Psychiatric/Addiction
18(5.0) 10(4.1) 28(4.7)
Complex Continuing Care 11(3.1) 11(4.5) 22(3.7) Acute Care 15(4.2) 6(2.5) 21(3.5) Cardiac Care 15(4.2) 5(2.1) 20(3.3) Maternal/Newborn 16(4.5) 3(1.2) 19(3.2) Rehabilitation 7(1.9) 4(1.7) 11(1.8) Critical Care 10(2.8) 0(0.0) 10(1.7) Public Health 8(2.2) 2(0.8) 10(1.7) Palliative Care 4(1.1) 5(2.1) 9(1.5) Primary Care 4(1.1) 5(2.1) 9(1.5) Cancer Care 5(1.4) 3(1.2) 8(1.3) Nephrology 3(0.8) 2(0.8) 5(0.8) Chronic Care 1(0.3) 3(1.2) 4(0.7) Administration 1(0.3) 1(0.4) 2(0.3) Case Management 2(0.6) 0(0.0) 2(0.3) Perioperative Care 1(0.3) 1(0.4) 2(0.3) Telehealth 0(0.0) 2(0.8) 2(0.3) Diabetes Care 1(0.3) 0(0.0) 1(0.2) Education 0(0.0) 1(0.4) 1(0.2) Sales 1(0.3) 0(0.0) 1(0.2) Other - Please specify (e.g., Combined Medical/Surgical Unit)
42(11.7) 20(8.3) 62(10.3)
Total 359(100.0) 242(100.0) 601(100.0) Note: Missing values N=33.

24
As shown in Table 11, there were differences in region of employment. One-fifth of
respondents were employed in LHIN 7 (20.2%). Registered nurses were primarily employed in
LHINs 2, 7, 8 and 11, while RPNs were primarily employed in LHINs 4, 6, 8 and 9.
Table 11. New Graduate Nurse Respondents' Employment by Geographic Region
Region Registered Nurse Registered
Practical Nurse
Total
LHIN 1 – Erie St. Clair 10(2.8) 17(6.9) 27(4.4) LHIN 2 – South West 35(9.6) 11(4.5) 46(7.5) LHIN 3 – Waterloo Wellington 12(3.3) 15(6.1) 27(4.4) LHIN 4 – Hamilton Niagara Haldimand Brant
25(6.9) 36(14.6) 61(10.0)
LHIN 5 – Central West 16(4.4) 9(3.6) 25(4.1) LHIN 6 – Mississauga Halton 29(8.0) 26(10.5) 55(9.0) LHIN 7 – Toronto Central 100(27.5) 23(9.3) 123(20.2) LHIN 8 – Central 35(9.6) 26(10.5) 61(10.0) LHIN 9 – Central East 14(3.9) 28(11.3) 42(6.9) LHIN 10 – South East 16(4.4) 8(3.2) 24(3.9) LHIN 11 – Champlain 37(10.2) 18(7.3) 55(9.0) LHIN 12 – North Simcoe Muskoka 11(3.0) 13(5.3) 24(3.9) LHIN 13 – North East 21(5.8) 15(6.1) 36(5.9) LHIN 14 – North West 2(0.6) 2(0.8) 4(0.7) Total 363(100.0) 247(100.0) 610(100.0) Note: Missing values N=24.
Union Representatives
The union survey was sent to all union representatives (413) across Ontario regardless of NGG
involvement. The Ontario Nurses Association (ONA) administers the survey via email each year.
Data were collected between April 2015 and June 2015. Upon completion of data collection,
cleaning and refinement, 43 valid responses remained in the database.
25
REGISTERED NURSE AND REGISTERED PRACTICAL NURSE EMPLOYMENT
The following sections report on employment data for NGNs collected through yearly
evaluations of the NGG, beginning in 2007. Comparisons are made between NGNs who
participated in the NGG and those who did not. Trends in select demographic and employment
characteristics are also examined. In addition, survey-based estimates of RN and RPN
employment status are compared to known population totals obtained from the CNO new
member data to assess the representativeness of the sample.
CHARACTERISTICS OF PARTICIPATING AND NON-PARTICIPATING NGNS
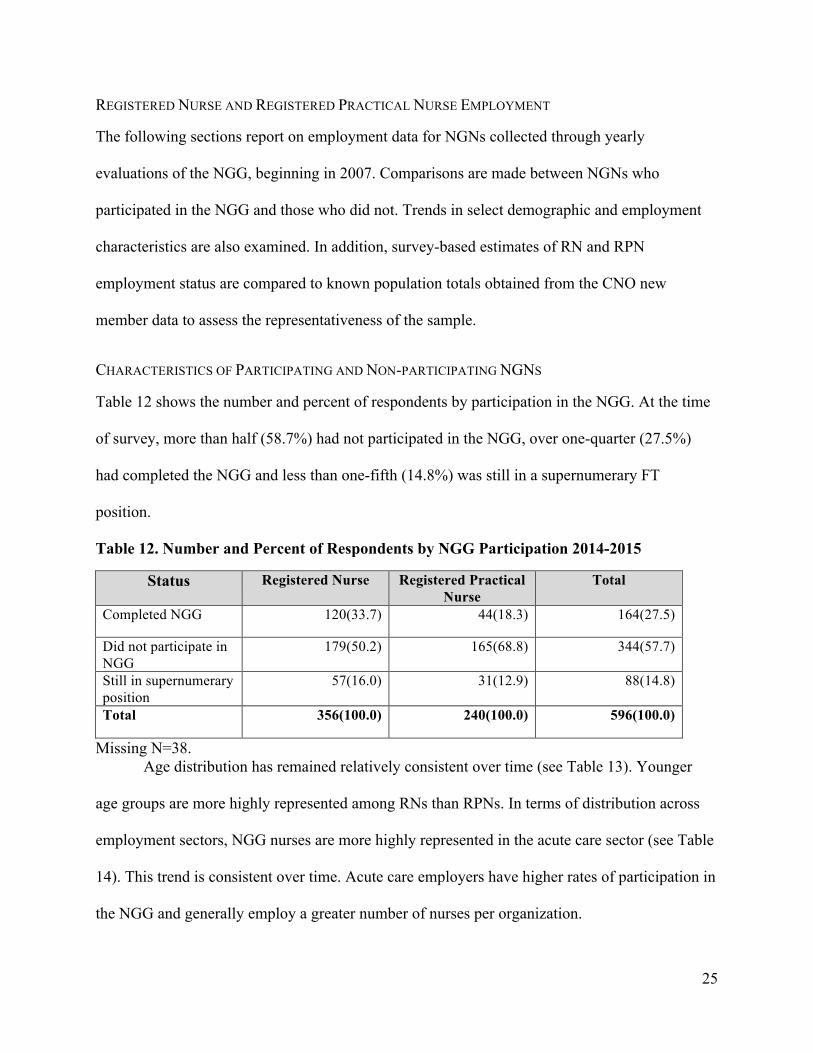
Table 12 shows the number and percent of respondents by participation in the NGG. At the time
of survey, more than half (58.7%) had not participated in the NGG, over one-quarter (27.5%)
had completed the NGG and less than one-fifth (14.8%) was still in a supernumerary FT
position.
Table 12. Number and Percent of Respondents by NGG Participation 2014-2015
Status Registered Nurse Registered Practical Nurse
Total
Completed NGG 120(33.7) 44(18.3) 164(27.5)
Did not participate in NGG
179(50.2) 165(68.8) 344(57.7)
Still in supernumerary position
57(16.0) 31(12.9) 88(14.8)
Total 356(100.0) 240(100.0) 596(100.0)
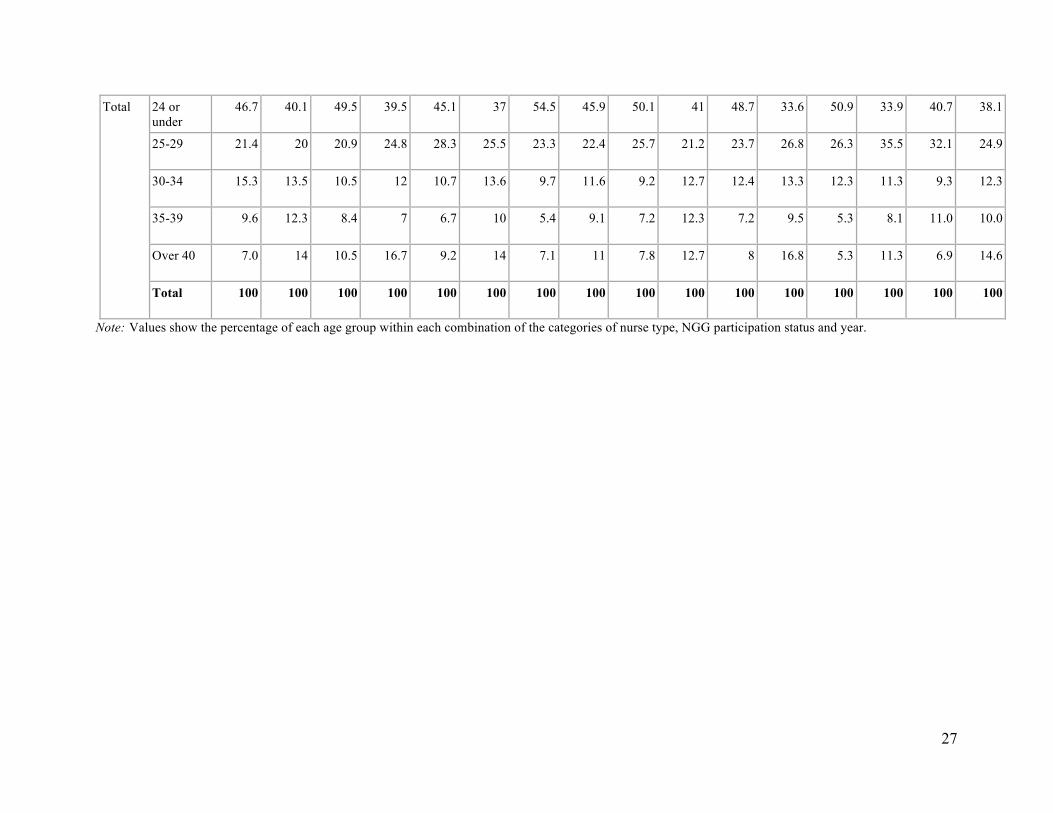
Missing N=38. Age distribution has remained relatively consistent over time (see Table 13). Younger
age groups are more highly represented among RNs than RPNs. In terms of distribution across
employment sectors, NGG nurses are more highly represented in the acute care sector (see Table
14). This trend is consistent over time. Acute care employers have higher rates of participation in
the NGG and generally employ a greater number of nurses per organization.

26
Table 13. Distribution of NGG and Non-NGG Nurses Across Five Age Groups
Group Age 2007 2008 2009 2010 2011 2012 2013 2014
NGG Non-NGG
NGG Non-NGG
NGG Non-NGG
NGG Non-NGG
NGG Non-NGG
NGG Non-NGG
NGG Non-NGG
NGG Non-NGG
RN 24 or under
54.6 50.5 54.5 43.8 49.4 43.9 58.6 56.2 57.8 55.2 53.6 46.3 60.9 45.0 46.6 48.6
25-29 22.6 20.8 22.6 30.2 30.6 28.5 24.9 24.4 26.5 24.3 25.5 27.9 26.1 37.5 32.8 23.2
30-34 13.4 11.9 8.2 10.7 8.7 14.8 7.6 10 7.3 8.5 11.3 11.9 8.7 10 9.8 13.8
35-39 5.7 8.4 7.6 8.9 6.1 6.6 4.6 5 5.3 5 5.2 6 2.2 2.5 8.0 7.2
Over 40 3.7 8.4 7.2 6.5 5.2 6.2 4.3 4.3 3.2 6.9 4.4 8 2.2 5 2.9 7.2
Total 100 100 100 100 100 100 100 100 100 100 100 100 100 100 100 100
RPN 24 or under
32.4 29.9 34.4 31.5 33.8 27.6 43 32.5 27.5 24.4 31.2 18.5 9.1 13.6 26.4 26.8
25-29 19.2 19.1 16 14.6 22.2 21.3 19 19.7 23.5 17.6 17.2 25.6 27.3 31.8 30.6 26.8
30-34 18.9 15.2 17.8 14.6 15.9 12 15.5 13.6 14.8 17.6 16.4 14.9 27.3 13.6 8.3 10.7
35-39 16.7 16.2 11 3.4 8.2 14.7 7.7 14.5 12.8 20.8 14.1 13.7 18.2 18.2 18.1 13.1
Over 40 12.8 19.6 20.9 36 19.8 24.4 14.8 19.7 21.5 19.5 21.1 27.4 18.2 22.7 16.7 22.6
Total 100 100 100 100 100 100 100 100 100 100 100 100 100 100 100 100
27
Total 24 or under
46.7 40.1 49.5 39.5 45.1 37 54.5 45.9 50.1 41 48.7 33.6 50.9 33.9 40.7 38.1
25-29 21.4 20 20.9 24.8 28.3 25.5 23.3 22.4 25.7 21.2 23.7 26.8 26.3 35.5 32.1 24.9
30-34 15.3 13.5 10.5 12 10.7 13.6 9.7 11.6 9.2 12.7 12.4 13.3 12.3 11.3 9.3 12.3
35-39 9.6 12.3 8.4 7 6.7 10 5.4 9.1 7.2 12.3 7.2 9.5 5.3 8.1 11.0 10.0
Over 40 7.0 14 10.5 16.7 9.2 14 7.1 11 7.8 12.7 8 16.8 5.3 11.3 6.9 14.6
Total 100 100 100 100 100 100 100 100 100 100 100 100 100 100 100 100
Note: Values show the percentage of each age group within each combination of the categories of nurse type, NGG participation status and year.

28
Table 14. Distribution of NGG and Non-NGG Nurses Across Sectors 2007-2014
Group Sector 2007 2008 2009 2010 2011 2012 2013 2014
NGG Non-
NGG
NGG Non-
NGG
NGG Non-
NGG
NGG Non-
NGG
NGG Non-
NGG
NGG Non-
NGG
NGG Non-
NGG
NGG Non-
NGG
RN Hospital 88.1 77.6 92.2 78.5 88.6 68.8 90.6 64.5 89.1 74 91.3 71.8 89.1 70.0 82.8 59.9
Long-Term Care 1.0 2.7 0.2 3.4 2.1 11.2 4.8 10 4.1 7.3 3.9 8.9 4.3 15 9.8 15.4
Community/Other 10.9 19.7 7.6 18.1 9.4 20.1 4.6 25.6 6.8 18.7 4.8 19.3 6.5 15 8.0 24.7
Total 100 100 100 100 100 100 100 100 100 100 100 100 100 100 100 100
RPN Hospital 54.9 45 63.9 47 54.8 29.7 53.5 25.9 52.3 35.7 48.8 37.3 54.5 4.5 47.2 28.0
Long-Term Care 28 36.6 20.3 42.4 31 51.6 37.3 52.2 30.9 45.7 41.1 42 27.3 59.1 43.1 42.9
Community/Other 17.2 18.3 15.8 10.6 14.2 18.7 9.2 21.9 16.8 18.6 10.1 20.7 18.2 36.4 9.7 29.2
Total 100 100 100 100 100 100 100 100 100 100 100 100 100 100 100 100
Total Hospital 76.4 62.2 85.4 68.8 79.5 52.8 80.8 47.8 79.8 56.5 82 56.1 82.5 46.8 72.0 44.6
Long-Term Care 10.5 18.7 5 15.3 9.8 27.7 13.4 28.2 10.8 24.8 12.1 24 8.8 30.6 19.5 28.6
Community/Other 13.1 19.1 9.6 15.8 10.7 19.5 5.8 24 9.3 18.6 5.9 19.9 8.8 22.6 8.5 26.9
Total 100 100 100 100 100 100 100 100 100 100 100 100 100 100 100 100
Note: Values show the percentage of nurses in each employment sector group within each combination of the categories of nurse type, NGG participation status and year of graduation.
29
EMPLOYMENT STATUS
The following section reports on NGN employment status according to participation in the NGG.
Nurses in the NGG category had matched to an employer and completed their NGG position at
the time of survey. Nurses in the non-NGG category did not match to an employer. The data
excludes those respondents who had matched to an employer and who were in an NGG position
at the time of survey.
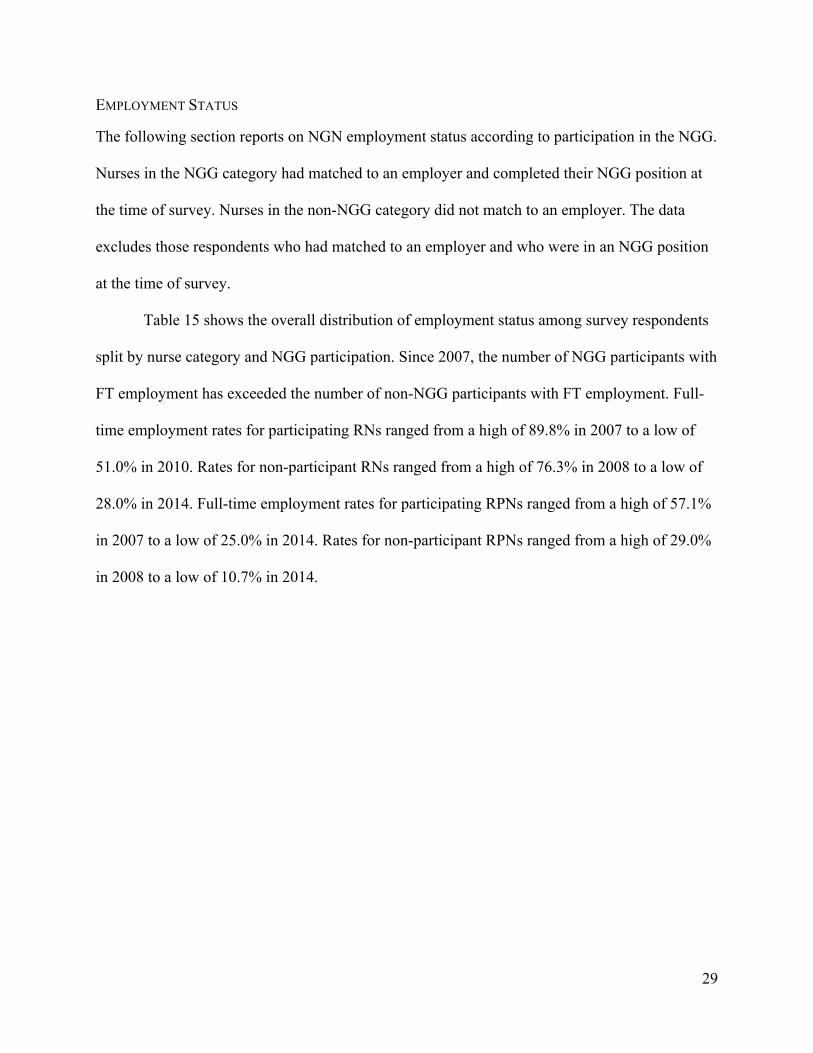
Table 15 shows the overall distribution of employment status among survey respondents
split by nurse category and NGG participation. Since 2007, the number of NGG participants with
FT employment has exceeded the number of non-NGG participants with FT employment. Full-
time employment rates for participating RNs ranged from a high of 89.8% in 2007 to a low of
51.0% in 2010. Rates for non-participant RNs ranged from a high of 76.3% in 2008 to a low of
28.0% in 2014. Full-time employment rates for participating RPNs ranged from a high of 57.1%
in 2007 to a low of 25.0% in 2014. Rates for non-participant RPNs ranged from a high of 29.0%
in 2008 to a low of 10.7% in 2014.

30
Table 15. Employment Status of NGG and Non-NGG Nurses Across Nurse Groups 2007-2015.
Group Status 2007 2008 2009 2010 2011 2012 2013 2014
NGG Non-NGG
NGG Non-NGG
NGG Non-NGG
NGG Non-NGG
NGG Non-NGG
NGG Non-NGG
NGG Non-NGG
NGG Non-NGG
RN Full-time
89.8 66.4 82.2 76.3 67.4 49.5 51 39.3 66.7 43.3 61.8 38.3 54.8 36.8 63.2 28.0
Part-time
10.2 21.7 14.4 16.3 23.3 39 40.6 43.1 30.6 48 34.2 50.8 35.5 57.9 32.5 53.6
Casual 0 11.9 3.4 7.4 9.3 11.4 8.4 17.6 2.8 8.7 4 10.9 9.7 5.3 4.4 18.5
Total 100 100 100 100 100 100 100 100 100 100 100 100 100 100 100 100
RPN Full-time
57.1 28.1 50 29 55.5 22.2 53.3 23.8 50 24 50 16.9 25 20 36.6 10.7
Part-time
34.1 46.1 36.2 54.8 30.3 60.4 35.6 54.2 39.6 58.5 33.3 49.4 75 40 43.9 52.8
Casual 8.8 25.8 13.8 16.1 14.3 17.4 11.1 22 10.4 17.5 16.7 33.8 0 40 19.5 36.5
Total 100 100 100 100 100 100 100 100 100 100 100 100 100 100 100 100
Total Full-time
82.6 48.3 75.9 61.4 64.6 38.4 51.6 32.7 62.9 34.7 59.4 28.6 48.7 31 56.1 19.6
Part-time
15.5 33.2 18.7 28.4 24.9 47.7 39.4 47.8 32.6 52.7 34 50.1 43.6 51.7 35.5 53.2
Casual 1.9 18.5 5.4 10.2 10.5 13.8 9 19.4 4.5 12.6 6.6 21.2 7.7 17.2 8.4 27.2
Total 100 100 100 100 100 100 100 100 100 100 100 100 100 100 100 100
Note: Values show the percentage of nurses in each employment status group within each combination of the categories of nurse type, NGG participation status and year of graduation.

31
NEW GRADUATE PREFERENCE FOR FULL-TIME
The majority of NGNs prefer FT employment. However, more RNs (79%) preferred FT
employment compared to RPNs (54%) in 2014-2015 (see Figure 7). Note that preference data
were not collected during the 2007-2008 evaluation.
Figure 7. New Graduate Nurses' Preferences for Full-Time Employment 2008-2014
Note. Preference data calculated based on respondents who indicated they were not employed in their preferred employment status and those seeking employment.
COMPARISON TO CNO NEW MEMBER EMPLOYMENT DATA
Results from the NGN survey were compared to the CNO registration database of general class
new member RNs and RPNs. However, the comparisons do not represent similar points in time.
The CNO collects data at the end of a calendar for the following practice year, NGN
employment data are collected at a point-in time.
The CNO (2015) new member RN employment data are shown in Table 16. According to
CNO pre-policy (2005) data, 39% of new member RNs were employed in FT positions. In each
year following (2006-2015), the percentage of FT employment was significantly higher than the
pre-policy level. In 2015, FT employment for new member RNs was 47%, a 7% decrease
compared to the previous year.
0%10%20%30%40%50%60%70%80%90%
100%
2008 2009 2010 2011 2012 2013 2014
% P
refe
rring
FT
Year of Graduation
RN
RPN

32
Table 16. CNO RN New Member Working Status 2005-2015
Working Status
N(%) 2005 2006 2007 2008† 2009 2010 2011 2012 2013 2014 2015
Full-time 1700(39) 1116(47)* 1231(59)* 2294(76)* 2456(79)* 2236(71)* 1644(58)* 2010(61)* 2049(56)* 1667(54)* 1759(47)* Part-time 1947(44) 966(40)* 702(34)* 624(21)* 509(16)* 706(23)* 948(33)* 1041(32)* 1343(37)* 1164(38)* 1598(43) Casual 773(17) 318(13)* 158(8)* 114(4)* 133(4)* 196(6)* 254(9)* 245(7)* 287(8)* 228(8)* 351(9) Total 4420(100) 2400(100) 2091(100) 3032(100) 3098(100) 3138(100) 2846(100) 3296(100) 3679(100) 3059(100) 3708(100) †First cohort of NGG new member RNs. *Statistically significant at p<.05 level based on chi-square. All testing in reference to 2005 pre-policy survey employment data. Source: Baumann et al. (2013); College of Nurses of Ontario (2015).
For new member RPNs, pre-policy employment data (2007) showed 24% were employed in FT positions (see Table 17). For
the years 2008 to 2013, there was a significant increase in the percentage of FT employment compared to the pre-policy level. In 2014
and 2015, no differences were found regarding FT employment for new member RPNs. In 2015, 25% of new member RPNs reported
working FT, a 1% decrease compared to the previous year.
Table 17. CNO RPN New Member Working Status 2005-2015
†First NGG cohort of new member RPNs. *Statistically significant at p<.05 level based on chi-square. All testing in reference to 2005 pre-policy survey employment data. Source: Baumann et al. (2013); College of Nurses of Ontario (2015).
Working Status
N(%) 2005 2006 2007 2008† 2009 2010 2011 2012 2013 2014 2015
Full-time 255(23) 335(21) 439(24) 623(34)* 896(41)* 883(36)* 780(36)* 971(35)* 919(30)* 625(26) 722(25) Part-time 630(56) 914(59) 1034(57) 905(49)* 1018(46)* 1208(49)* 1006(47)* 1311(48)* 1568(51)* 1215(51) 1421(50)
Casual 238(21) 313(20) 347(19) 303(17) 294(13)* 371(15)* 358(17) 477(17)* 596(19) 552(23) 723(25) Total 1123(100) 1562(100) 1820(100) 1831(100) 2208(100) 2462(100) 2144(100) 2759(100) 3083(100) 2392(100) 2866(100)

33
Analysis indicates that the percentage of FT employment increased during the funded
supernumerary period, but it does not demonstrate a causal relationship. It is recognized that
other factors can influence FT employment. For example, economic changes, revised educational
requirements for health professionals and workforce saturation. Nonetheless, results from this
study demonstrate that the NGG has been successful in creating FT job opportunities for NGNs.
STAKEHOLDER PERCEPTIONS OF THE NGG
The following sections report on perceptions and experiences of the NGG from the four
stakeholder groups: employers, NGNs, union representatives and mentors. Survey responses are
aligned with interview findings where appropriate.
PROMOTION OF THE NGG: HOW EMPLOYERS AND NGNS WERE INFORMED
Employers were asked how they heard about the NGG for 2014-2015. Three-quarters (77%)
indicated they had previously participated. New graduate nurses learned about the NGG from
two main sources: teachers/professors at school (55%) and other students (46%). These findings
are consistent with previous years.
WEBSITE DESIGN AND FUNCTIONALITY: EMPLOYER AND NEW GRADUATE RATINGS
Employers were asked to evaluate their experience using the Nurses' Career Start Gateway using
a five-point Likert scale where 1=poor and 5= excellent. Similar to previous years, the majority
of employers (84%) in 2014-2015 rated their overall experience as good, very good, or excellent
and provided high ratings for the clarity of instructions for posting positions (84%).
Additionally, 82% of employers indicated that it took the expected amount of time or less
to register and post positions. When asked if they would use the Nurses' Career Start Gateway
again, 99% of employers indicated they would. New graduate nurses were also asked to evaluate
their experiences with the Nurses' Career Start Gateway using the same Likert scale. Over 40%
rated their experience as excellent, very good or good.

34
FACILITATING NGN TRANSITION TO WORK: MENTORING AND SUPPORT FOR NEW GRADUATES
Benefits
Many NGN participants indicated the NGG provided them with the opportunity to develop their
skills in the practice environment with the support and supervision of an experienced nurse. They
noted that the policy helped them integrate into the healthcare team and organization and learn
how to manage their time. It also bridged the gap between student nurse and the reality of the
workplace thereby reducing stress and increasing confidence and retention.
Several employers reported that the NGG helped NGNs transition to nursing practice.
They cited the impact of the policy on quality of care, acquisition of new skills, retention and
recruitment, NGN confidence and team dynamics. They emphasized that the NGG provides vital
funding and an end to the policy would significantly affect the number of NGNs they could take
into their organizations. One manager enthused,
I think they [NGNs] are great. I think it's an awesome way to learn and I think it's really,
really an excellent program. . . . [It] should definitely continue. . . . The way nursing is
and the stresses of nursing, I think if people can be sort of smoothly put in the system like
that, it's great because by the end of their four to six months, they are really a part of the
team.
Mentorship
In most organizations, NGNs were typically paired with one mentor. There was consensus
among the NGNs that their mentors provided support and facilitated transition. The majority of
mentors had preceptorship experience and some had been mentors in previous years of the NGG.
One NGN said, "If I feel insecure about something or if I am not sure about something, I know I
can go to my mentor and ask and I'm not going to be judged or treated like I should know."

35
Orientation
Orientation models varied. Some included in-class orientation, computer training or unit-specific
orientation. Many employers commented on the use of NGN learning plans to ensure gaps were
addressed. While most employers agreed that 12 to 26 weeks of orientation was adequate, there
were concerns that the time was not sufficient for all units. Some employers and mentors
indicated that the length of the NGG was difficult for the mentor-NGN relationship and
contributed to mentor burnout. Many mentors felt their workload increased at the beginning of
the NGG but decreased over the supernumerary period as NGNs progressed in their learning.
One mentor explained,
I would say that . . . it is a lot of work. The first couple of months, the first probably six
weeks, it's a lot of work. It's time consuming. Like if you have to hang a med, it takes you
twice as long to do everything. . . . Then you see them, their independence towards the
end and . . . . [realize] all that hard work we did is kind of paying off.
Full-Time Employment
Most organizations were unable to directly transition NGNs into a FT position. However, some
organizations were able to directly transition NGNs into a FT position on a Nurse Resource
Team. A number of NGNs had difficulty finding a job upon completion of the NGG. Mentors
and employers agreed it could take time to obtain a FT position. One mentor commented,
"There's not a whole lot of full-time work. No, there isn't enough. . . . It's not surprising some
people have waited a year or two to get a . . . permanent full-time [position]." An employer
remarked, "[We] post everything internally. Full-time jobs are very sought after here, so they
would go to—based on seniority—probably an existing staff member. We do sometimes hire
them [NGNs] into full-time positions, but it's very rare.

36
Retention
Many employers commented that they had a good retention rates. However, some of the rural
hospitals found it difficult to retain NGNs who were not local residents. One employer observed
that rural hospitals were losing NGNs to organizations that were able to offer FT positions.
Challenges and Areas for Improvement
Employers made two suggestions that could improve implementation of the NGG: (i) develop a
webinar that provides a step-by-step explanation of the administration portion of the policy and
(ii) create a standardized evaluation tool for mentors and NGNs. They noted that the reporting
systems were "onerous" and time consuming:
I think the HealthForceOntario portal as well as the technology that they poured into it
oftentimes feels like an encumbrance. It's difficult to process. It's not streamlined. It's not
clear for hires, or for administrators or the organizations that are posting positions on
there. And that goes not just to the outward-facing piece for the alignment of the new
grads with the roles, but also on the financial side of things with the reporting process and
the budget submission.
New graduates also reported on areas that could be improved. For example, providing
additional resources, offering feedback during the NGG, increasing availability of positions,
including the NGG guidelines as part of the orientation package, creating structured orientation
formats and having well-trained mentors. Mentors likewise provided suggestions for
improvement. They included the opportunity to provide more feedback about the NGG,
increasing the number of mentors and the amount of information about the NGG and more tools
and strategies to encourage NGN independence.

37
BARGAINING UNIT AND EMPLOYER COLLABORATION: WHERE ARE THE GAPS?
An online survey was used to examine the union perspective on the NGG and its
effectiveness. The following sections outline the results of the Union Representative Survey
2014–2015. Comparisons are made to previous years where applicable. It is important to note
there was a low response rate to the union survey. Percentages are not representative of all union
representatives nor should they be generalized to the larger population.
Successful implementation of the NGG requires ongoing collaboration and
communication between employers and bargaining units throughout the entire process of the
NGG. Union representative survey respondents were asked if they were consulted during the
following phases of the NGG: prior to participation, prior to posting a position on the Gateway,
in the decision to bridge the NGN, and prior to sign-off of the final report.
When asked about communication prior to participation in the NGG, 57% of union
representatives survey respondents indicated that employers communicated with the union. This
rate has decreased by 13% since 2013 (70%). When asked if employers consulted the union prior
to posting a position on the NGG website, 47% of union representatives indicated they had. This
percentage is consistent with previous years.
In the decision to bridge the NGN, only 22% of union representatives indicated they were
involved in this decision process. When asked if employers had contacted them before the final
sign-off, 36% of union representatives indicated they had. This represented an 13% decrease
since 2013.When asked how they would rate the overall efforts of employers to collaborate with
the union, 68% rated it as poor or fair and 18% rated it as very good or excellent.

38
OVERALL IMPACT OF THE NURSING GRADUATE GUARANTEE
Majority of employers rated the responsiveness of stakeholders within their organizations
as very receptive to the NGG. Employers provided their views regarding differences between
NGG participants and non-participants. Many employers reported the NGG helps NGNs improve
their team engagement and nursing skills and identify gaps in their practice. It also builds their
confidence and allows them to grow and develop. Additionally, employers indicated that NGG
participants would get a job sooner than non-participants because they have additional
experience.
CONCLUSION
Since the introduction of the NGG in 2007, the impact of the policy has been tracked by
analyzing nurse employment preferences, trends in FT employment and transition to work. This
report presents the results of the 2014-2015 NGG evaluation with a focus on key outcomes,
including NGN and employer participation rates, FT employment for NGNs and a stakeholder
analysis of the benefits and challenges of participating in the NGG. The evaluation demonstrates
that the NGG has had an impact on new graduate employment and transition to work.
Stakeholder groups believed that the NGG is vital to the successful and effective integration of
NGNs into the provincial healthcare system.
RECOMMENDATIONS
1. Design a communication plan that promotes employer participation across sectors and
regions.
2. Conduct an in-depth analysis of RPNs in the healthcare workforce to better understand
their participation, preferences and experiences in the NGG.

39
3. Examine the effect of employment saturation and actual job availability in Ontario.
4. Analyze nursing employment trends and expand the evaluation framework to include the
impact of the NGG on new graduate retention and quality of patient care.
5. Conduct a longitudinal analysis of the FT nursing workforce across regions in Ontario.
6. Identify best practices that integrate and retain new graduates in the nursing workforce.
7. Investigate and compare the impact of the NGG on selected healthcare organizations.
8. Link NGG data with available information on patient outcomes.

40
REFERENCES
Alameddine, M., Baumann, A., Laporte, A., O’Brien-Pallas, L., Levinton, C., Onate, K., &
Deber, R. (2009). Is there life after hospitals? An analysis of the career trajectory of
Ontario nurses leaving the hospital sector (1993-2004). Journal of Advanced Nursing,
65(5), 1044-1053.
Alameddine, M., Laporte, A., Baumann, A., O’Brien-Pallas, L., Mildon, B., & Deber, R. (2006).
Stickiness and inflow as proxy measures of the relative attractiveness of various sub-
sectors of employment. Social Science and Medicine 63 (9), 2310-2319.
Alameddine, M., Baumann, A., Laporte, A., Mourad, Y., Onate, K., & Deber, R. (2014)
Measuring the job stickiness of community nurses in Ontario (2004-2010): Implications
for policy and practice. Health Policy, 114 (2-3): 147-155.
Alameddine, M., Baumann, A., Laporte, A., & Deber, R. (2012). A narrative review on the
effect of economic down turns on the nursing labour market: Implications for policy and
planning. Human Resources for Health, 10(23).
Alameddine, M., Baumann, A., Onate, K., & Deber, R. (2011). Career transitions of inactive
nurses: A registration database analysis (1993-2006). International Journal of Nursing
Studies, 48(2), 184-192.
Alameddine, M., Laporte, A., Baumann, A., O’Brien-Pallas, L., Croxford, R., Mildon, B., …
Deber, R. (2006). Where are nurses working? Employment patterns by sub-sector in
Ontario, Canada. Healthcare Policy, 1(3), 65-86.
Batch, M., Barnard, A., & Windsor, C. (2009). Who's talking? Communication and the
casual/part-time nurse: A literature review. Contemporary Nurse, 33(1), 20–29.

41
Baumann, A., & Blythe, J. (2003). Restructuring, reconsidering, reconstructing: Implications for
health human resources. International Journal of Public Administration, 26(14), 1561–
1579.
Baumann, A., Blythe, J., Cleverley, K., & Grinspun, G. (2006a). Health Human Resource Series
Number 2. Educated and underemployed: The paradox for nursing graduands. Hamilton,
Ontario: Nursing Health Services Research Unit, McMaster University.
Baumann, A., Hunsberger, M., & Crea-Arsenio, M. (2012a). Full-time work for nurses:
Employers' perspectives. Journal of Nursing Management, 21(2), 359–367.
doi:10.1111/j.1365-2834.2012.01391.x
Baumann, A., Hunsberger, M., & Crea-Arsenio, M. (2012b). Impact of public policy on nursing
employment. Canadian Public Policy, 38(2), 167–179.
Baumann, A., Hunsberger, M., & Crea-Arsenio, M. (2013). Health Human Resources Series
Number 38. Employment integration of nursing graduates: Evaluation of a provincial
policy strategy Nursing Graduate Guarantee 2012–2013. Hamilton, Ontario: Nursing
Health Services Research Unit, McMaster University.
Baumann, A., Keatings, M., Holmes, G., Oreschina, E., & Fortier, V. (2006b). Health Human
Resources Series 4. Better data, better decisions: A profile of the nursing workforce at
Hamilton Health Sciences Corporation 2002–2003. Hamilton, Ontario: Nursing Health
Services Research Unit, McMaster University.
Benjamin, D., Gunderson, M., & Riddell, W. C. (2002). Labour market economics: Theory,
evidence, and policy in Canada. Toronto, Ontario: McGraw-Hill Ryerson.
Blythe, J., Baumann, A., Zeytinoglu, I., Denton, M., & Higgins, A. (2005). Full-time or part-time
work in nursing: Preferences, tradeoffs and choices. Healthcare Quarterly, 8(3), 69–77.

42
Boyatzis, R. (1998). Transforming qualitative information: Thematic analysis and code
development. Thousand Oaks, CA: Sage.
Bratt, M. M., & Felzer, H. M. (2012). Predictors of new graduate nurses' organizational
commitment during a nurse residency program. Journal for Nurses in Staff Development,
28(3), 108-19. doi:10.1097/NND.0b013e31825515c4.
Buerhaus, P. (2009). The recession and the nursing shortage. OR Manager, 41(8), 5–6.
Burleton, D., Goulati, S., McDonald, C., & Scarfone, S. (2013). Jobs in Canada: Where, what
and for whom? Toronto, ON: TD Economics.
Caldbick, S., Labonte, R., Mohindra, K. S., & Ruckert, A. (2014). Globalization and the rise of
precarious employment: The new frontier for workplace health promotion. Global Health
Promotion, 21(2), 23–31.
College of Nurses of Ontario. (2005). Membership statistics highlights 2005. Toronto, Ontario:
Author.
College of Nurses of Ontario. (2014). New Members in the General Class 2014. Toronto,
Ontario: Author.
College of Nurses of Ontario. (2015). Membership statistics highlights 2015. Toronto, Ontario:
Author.
Cummings, K, J., & Kreiss, K. (2008). Contingent workers and contingent health: Risks of a
modern economy. The Journal of the American Medical Association, 299(4), 448–450.
Duchscher, J. E. (2009).Transition shock: The initial stage of role adaptation for newly graduated
registered nurses. Journal of Advanced Nursing, 65(5), 1103–1113.

43
Galarneau, D. (2010). Temporary employment in the economic downturn. Perspectives on
Labour and Income, 11(11), 5–17.
Grinspun, D. (2003). Part-time and casual nursing work: The perils of health-care restructuring.
International Journal of Sociology and Social Policy, 23(8/9), 54–70.
HealthForceOntario. (2013). Nursing graduate guarantee overview: The new
HealthForceOntario Nurses' Career Start Gateway. Retrieved February 3, 2016 from
http://www.healthforceontario.ca/Work/InsideOntario/OntarioNurses/NursingGradGuara
ntee/Overview.aspx
Heery, E., & Salmon, J. (2000). The insecure workforce. London: Routledge.
Hunsberger, M., Baumann, A., & Crea-Arsenio, M. (2013). The road to providing quality care:
Orientation and mentorship for new graduate nurses. Canadian Journal of Nursing
Research, 45(4), 72–87.
Joyce, K., Pabayo, R., Critchley, J.A., & Bambra, C. (2010). Flexible working conditions and
their effects on health and wellbeing. Cochrane Database of Systematic Reviews, 17(2),
CD008009.
Lewchuk, W., & Lafleche, M. (2014). Precarious employment and social outcomes. Just Labour:
A Canadian Journal of Work and Society, 22, 45–50.
Ministry of Health and Long-Term Care. (2004a). Hospital allocations announcement St.
Michael's Hospital (2004, July 26, News Media). Retrieved April 17, 2008 from
http://www.health.gov.on.ca/english/ media/speeches/archives/sp_04/sp_072604.html
Ministry of Health and Long-Term Care. (2004b). McGuinty government improving health
services by investing in better quality nursing care (2004, December 8, Archived News
Release). Retrieved February 4, 2016 from
44
http://news.ontario.ca/archive/en/2004/12/08/McGuinty-government-improving-health-
services-by-investing-in-better-quality-nur.html
Ministry of Health and Long-Term Care. (2004c). McGuinty government invests in nurses'
health and safety (2004, February 24, Archived News Release). Retrieved February 4,
2016 from http://news.ontario.ca/archive/en/2004/02/10/McGuinty-government-invests-
in-nurses039-health-and-safety.html
Ministry of Health and Long-Term Care. (2005). Laying the foundation for change. A progress
report on Ontario's health human resources initiatives. Retrieved February 5, 2016 from
http://www.health.gov.on.ca/en/common/ministry/publications/reports/hhr_05/hhr_05.as
px
Ministry of Health and Long-Term Care. (2006a). McGuinty government improving health
services by investing in better quality nursing care (2006, December 8, Archived News
Release). Retrieved February 3, 2016 from
http://news.ontario.ca/archive/en/2004/12/08/McGuinty-government-improving-health-
services-by-investing-in-better-quality-nur.html
Ministry of Health and Long-Term Care. (2006b). McGuinty government investing in quality
nursing care (2006, January 26, Archived News Release). Retrieved February 3, 2016
from http://news.ontario.ca/archive/en/2006/01/26/McGuinty-Government-Investing-In-
Quality-Nursing-Care.html
Ministry of Health and Long-Term Care. (2007). McGuinty government offers full-time job
opportunity for every Ontario nursing graduate (2007, February 27, Archived News
Release). Retrieved February 5, 2016 from

45
http://news.ontario.ca/archive/en/2007/02/27/McGuinty-Government-Offers-FullTime-
Job-Opportunity-For-Every-Ontario-Nursing-Gr.html
Ministry of Health and Long-Term Care, Nursing Secretariat. (2008). [New graduate initiative
investment]. Unpublished raw data. Toronto, Ontario: Author.
Ministry of Health and Long-Term Care. (2012a). Good nursing, good health: An investment for
the 21st century. Retrieved February 4, 2016 from
http://www.health.gov.on.ca/en/common/ministry/publications/reports/nurserep99/nurse_
rep.aspx
Ministry of Health and Long-Term Care. (2012b). Health services in your community. Retrieved
October 16, 2015 from
http://www.health.gov.on.ca/english/public/contact/contact_mn.html
Ministry of Health and Long-Term Care. (2014). Guidelines for participation in the nursing
graduate guarantee for new graduate nurses. Retrieved April 15, 2016 from
https://www.healthforceontario.ca/UserFiles/file/Nurse/Inside/ngg-participation-
guidelines-jan-2011-en.pdf
Ministry of Health and Long-Term Care. (2015). [Nursing graduate guarantee participation].
Unpublished raw data. Toronto, Ontario: Author.
Ministry of Health and Long-Term Care. (2016). Ontario renovating more than 300 long-term
care homes (2016, April 4, News Release). Retrieved April 19, 2016 from
https://news.ontario.ca/mohltc/en/2016/04/ontario-renovating-more-than-300-long-term-
care-homes.html
46
Ministry of Training, Colleges and Universities. (2014). [Registered nurse and registered
practical nurse intake and graduation numbers]. Unpublished raw data. Toronto, Ontario:
Author.
O'Brien-Pallas, L., Tomblin Murphy G., Shamian, J., Li, X., & Hayes, L. J. (2010). Impact and
determinants of nurse turnover: A pan-Canadian study. Journal of Nursing Management,
18(8) 1073–1086.
Romyn, D. M., Linton, N., Giblin, C., Hendrickson, B., Limacher, L.H., . . . Zimmel, C. M.
(2009). Successful transition of the new graduate nurse. International Journal of Nursing
Education Scholarship, 6(1), 1802–1821.
Standing, G. (2008). Economic insecurity and global casualisation: Threat or promise? Social
Indicators Research, 88(1), 15–30.
Tashakkori, A., & Teddlie, C. (2003). Handbook of mixed methods in social and behavioural
research. Thousand Oaks, CA: Sage Publications.
Walker, D. (2004). For the public's health: A plan of action, final report. Expert Panel on SARS
and Infectious Disease Control. Toronto: Ministry of Health and Long-Term Care.
White, H. (2008). Network of Networks on Impact Evaluation (NONIE). Working Paper No. 7.
Of probits and participation: The use of mixed methods in quantitative impact evaluation.
Retrieved February 3, 2016 from
http://dmeforpeace.org/sites/default/files/White_Probits%20and%20Participation.pdf
Wolff, A. C., Pesut, B., Regan, S., & Black, J. (2010). Ready for what? An exploration of the
meaning of new graduate nurses' readiness for practice. International Journal of Nursing
Education Scholarship, 7(1), article 7.

47
APPENDIX A. OVERVIEW OF NURSE EDUCATION IN ONTARIO
Three main events have affected the supply of NGNs in Ontario. First, in 2001, practical nursing
programs altered their curricula in preparation for the two-year diploma program requirement in
2005. In addition, the MTCU announced that effective January 2001, enrolment quotas on
practical nursing programs would be lifted. Second, in 2003, Ontario reduced secondary
education to four years, temporarily increasing the number of potential applicants to nursing
programs. The increase occurred from 2003 to 2005, before numbers stabilized again in 2006.
Third, on January 1, 2005, the CNO changed its educational requirements for registration in the
general class to a degree for RNs and a diploma for RPNs.
The new requirements resulted in changes to nursing degree education and practical
nursing education in Ontario. In response, enrolment in RN nursing diploma programs increased
substantially in the last year they were offered (2001). New entry to practice legislation specified
that baccalaureate degrees were required for RNs as of January 1, 2005. The result was the
establishment of collaborative four-year baccalaureate nursing programs through partnerships
between universities and colleges, leading to a baccalaureate degree in nursing.
To facilitate the baccalaureate degree requirement for entry to practice for RNs, the
MTCU made additional funding available to support enrolment growth in the new collaborative
programs. It also provided funding for compressed degree programs in universities and the final
college intake of diploma RN students. The intention was to boost the number of RN graduates
in 2003-2004, the year in which reduced numbers were anticipated due to the elimination of the
three-year college diploma for RNs.
The number of nurses entering the workforce has traditionally been supply driven. With
the introduction of the baccalaureate entry to practice requirement, the government of Ontario
committed to funding an intake of 4000 first-year nursing degree students per annum

48
(MOHLTC, 2005). This was intended to bring nursing graduate levels to those produced in the
1990s prior to restructuring. This target was met in 2009-2010 and it has continued to grow.
The MTCU has also committed to funding nursing program enrolment with no caps on
nursing degree and practical nursing education intake. In addition to the time-limited funding for
compressed degrees announced in 2001, the MTCU approved Second-Entry Programs, which
began in 2005-2006. These programs were designed for students with previous post-secondary
education. The initiative was intended to increase the intake of nursing students in RN programs.
49
APPENDIX B. LITERATURE REVIEW
LABOUR MARKET TRENDS
Economic insecurity and casualization have negative implications for workers, both nationally
and internationally (Baumann, Hunsberger, & Crea-Arsenio, 2012b; Standing, 2008). Labour
markets are influenced by escalating costs, reduced supply, job substitution and growth or
decline in particular subsectors. With the economic "bust" in 2008, budget constraints and fiscal
accountabilities increased, resulting in fewer job opportunities for workers (Batch, Bernard, &
Windsor, 2009). The most notable change in employment trends was an increase in PT and
casual staff. In 2009, one in every eight employed Canadians was in a temporary position; most
were young professional workers (Galarneau, 2010).
During recent decades, there has been a movement towards flexible, non-standardized
work and increased casualization (Baumann & Blythe, 2003). The notion of "casual labour"
(Standing, 2008, p. 15) is situated within a universal movement fuelled by rising competition
among industries and the need to reduce labour costs (Batch et al., 2009). In Canada,
casualization of the workforce has affected the public and private sectors. In the public sector,
the fields of education, public administration and health have simultaneously experienced a high
rate of temporary employment and the fastest growth in absolute terms (Galarneau, 2010; Heery
& Salmon, 2000).
A notable outcome is the poor labour market conditions for NGNs compared to their
older counterparts. During an economic downturn, NGNs are usually the first to face layoffs
because of their low position in a unionized environment (Benjamin, Gunderson, & Riddel,
2002). Furthermore, the availability of positions for NGNs may be impacted by an increased
supply of nurses and a decreased demand for their services (Alameddine et al., 2012). As
families struggle financially, veteran nurses may return to the workforce or remain committed to

50
their current jobs, limiting openings for NGNs (Buerhaus, 2009). The situation is exacerbated by
the reduced financial ability of organizations to maintain an adequate level of health human
resources (Alameddine et al., 2012).
Some PT nurses voluntarily choose their PT status and prefer it, but research evidence
suggests most favour FT over PT status (Baumann et al., 2012b; Blythe, Baumann, Zeytinoglu,
Denton, & Higgins, 2005; Grinspun, 2003). Studies have explored the impact of new types of
work arrangements on employee health and the decline of standard FT jobs (Cummings &
Kreiss, 2008; Joyce, Pabayo, Critchley, & Bambra, 2010).
FACTORS AFFECTING JOB AVAILABILITY FOR NEW GRADUATE NURSES
An organization's ability to provide employment for NGNs changes over time and is influenced
by numerous variables (Baumann, Hunsberger, & Crea-Arsenio, 2012a). Identifying and
quantifying capacity to employ NGNs is a challenge for researchers because availability of jobs
cannot be estimated by counting vacancies or job postings. Organizations define vacancies in
various ways. Some organizations do not distinguish internal vacancies from external vacancies.
Internal vacancies are created by workers transferring within an organization, while external
vacancies are created when workers leave an organization. Internal vacancies do not represent
employment opportunities for new applicants.
Posted vacancies are not necessarily new job opportunities. Vacancies are not always
associated with funded positions and often remain unfilled because related work hours are
covered by overtime or casual hours (Baumann et al., 2006b). Part-time and casual jobs are not
always advertised; consequently, jobs exist but not specific positions. Even posted jobs
representing funded positions may not be available for NGNs because they are not suited to a
51
new nurse or seniority within the organization precludes an NGN from being offered the job.
This is particularly the case with FT employment.
Factors that influence where a nurse seeks employment include the number of potential
employers in a given area. Nurses graduating from schools in Toronto, for example, have more
employment opportunities than those educated in Windsor. Lack of local employment
opportunities encourages graduate mobility. Hiring cycles are another factor. An organization
that hires heavily one year will not do so the next, unless it has a low rate of retention or is
expanding its services.
Smaller organizations are likely to have more unpredictable hiring cycles than larger
ones. There is a direct relationship between new job hires and an organization's financial
situation. The timing of graduation may also be a factor, with the majority of nurses entering the
workforce at one time. An additional factor is the effect of unionized environments and
employment policies on the availability of FT employment for graduating nurses.
When NGNs enter the workforce, they may experience "transition shock" as the
discrepancies between nursing education and the real world become evident (Duchscher, 2009).
This shock can cause stress, anxiety and burnout, which ultimately increases turnover (Bratt &
Felzer, 2012). Poor retention of NGNs has financial implications and consequences for patient
safety (O'Brien-Pallas, Tomblin Murphy, Shamian, Li, & Hayes, 2010). There is a wealth of
research documenting the gap between nursing education and entering the workforce (Romyn et
al., 2009; Wolff, Pesut, Regan, & Black, 2010). To address this gap and increase the retention of
NGNs, two strategies for integration have been identified: orientation and mentorship programs.
Both of which are designed to help NGNs transition into their professional practice role
(Hunsberger, Baumann, & Crea-Arsenio, 2013).

52
APPENDIX C. ONTARIO GOVERNMENT INVESTMENTS
In 1999, the MOHLTC began investing in initiatives to create new nursing positions in the
province. In 2004, the MOHLTC announced a policy for hospitals to increase FT employment of
nurses towards a goal of 70%. The government's commitment to create new nursing positions in
hospitals includes the following (MOHLTC, 2004a, 2004b):
● 1999-2000: $130 million new base funding annually to hospitals to create 3300 new nursing
positions
● 2003-2004: $25 million annually provided to 33 hospitals (with operating budgets greater
than $100 million) to hire new FT nurses and convert casual and PT nurses into FT staff; 664
new FT nursing positions have been created with this investment
● 2004-2005: $25 million annually provided to remaining hospitals in the province (with
operating budgets under $100 million) to create FT nursing positions; 538 new FT positions
have been created with this investment
● 2006: $40 million held in trust for hospitals to orient and train RNs who were interested in
working in other clinical areas or nursing roles within existing vacancies (MOHLTC, 2006b)
In May 2004, the provincial government announced an additional investment of $191 million to
hire 2000 new healthcare staff, including 600 nurses. The main objective was to ensure all long-
term care and acute care residents have 24-hour access to an RN seven days a week. The money
was rolled out over a two-year period (MOHLTC, 2004c).
53
APPENDIX D. METHODOLOGY AND ANALYSIS
INSTRUMENT DEVELOPMENT
Online surveys were developed for NGNs, employers and union representatives to determine
their perceptions of the NGG, particularly the benefits of participating in the policy, mentorship,
orientation, FT employment, retention, challenges and areas for improvement.
Semistructured interview guides were developed for the employer focus groups and
interviews with NGNs and staff nurse mentors. The questions in the semistructured interview
guides were sequenced according to the NGG process: hearing about the NGG; using the
employment portal; hiring into the NGG; orientation and mentorship; and transitioning into
permanent jobs. The employer and NGN interview guides were aligned to capture the views of
both groups on similar questions. Nursing mentors were asked additional questions about their
experiences in mentoring NGNs through the NGG.
The surveys and semistructured guide for the focus groups and interviews were
developed with input from expert senior researchers at the Nursing Health Services Research
Unit and senior policy analysts from the MOHLTC. A grey literature search of media releases
and news bulletins was conducted to collect all information related to the NGG.
ETHICS
The purpose of the study was explained to all participants in advance. An information and
consent form was provided at the beginning of the survey. All research instruments underwent
the necessary ethics review process and received final approval from the Hamilton Health
Sciences Research Ethics Board. The research team obtained the participants' consent to publish
findings from the survey and interviews. Participants were guaranteed anonymity and assured
that no personal identifiers would be associated with responses to the questions.
54
ANALYSIS
Trends in NGN and employer participation in the NGG were analyzed using the MOHLTC NGG
database. The database holds count data about the total population of NGG participants (NGNs
and employers) across all years of the policy. Data are analyzed as a snapshot in time each year
and then compared to previous years to examine overall trends.
Survey data were entered into R version 2.15.2 (R Core Team, Vienna, Austria).
Responses to each item were summarized using descriptive statistics. Frequency distributions
were calculated on demographics and employment data. Survey data of NGN employment status
were compared to the CNO database of general class new member RNs and RPNs. Chi-square
tests were conducted to compare employment status pre-policy (reference year) for RNs and
RPNs in each year of the NGG (2007-2008 to 2012-2013). The reference year was 2004 for RNs
and 2006 for RPNs. The null hypothesis for each comparison was no difference between the
reference year and each year of the NGG. An alpha level of .05 was used for all statistical
testing.
The employer focus groups and individual interviews were conducted by telephone,
audiotaped and transcribed verbatim. The research team followed a sequence of interview,
transcription, analysis, reflection and modification. Interviews were coded into QSR NVivo
version 10.0 (QSR International Pty Ltd, Doncaster, Victoria, Australia). Texts were then
interpreted through thematic analysis (Boyatzis, 1998). During preliminary coding, each member
of the research team coded several texts independently. Team members then collaborated to
develop a refined scheme to code the texts. Additional codes were assigned as new themes
emerged. Major themes were highlighted, and key findings were categorized appropriately under
each thematic heading.
Related Documents