EMPLOYMENT and pay rolls DETAILED REPORT JUNE 1950 UNITED STATES DEPARTMENT OF LABOR Maurice J. Tobin * Secretary BUREAU OF LA80R STATISTICS Ewan Clague - Commissioner Digitized for FRASER http://fraser.stlouisfed.org/ Federal Reserve Bank of St. Louis

Welcome message from author
This document is posted to help you gain knowledge. Please leave a comment to let me know what you think about it! Share it to your friends and learn new things together.
Transcript
EMPLOYMENTand pay rolls
DETAILED REPORT
JUNE 1950
UNITED STATES DEPARTMENT OF LABOR Maurice J. Tobin * SecretaryBUREAU OF LA80R STATISTICS Ewan Clague - Commissioner
Digitized for FRASER http://fraser.stlouisfed.org/ Federal Reserve Bank of St. Louis

I H P 0 a T A i! T H O T ! C E
The following new and revised series are now available:
Revised Estimates of Mining Enralo.rmcnt. 1943 to Date
Employment data for selected mining industries are shown in t’JLs report on a revised basis. Both the all-enployeo and production-worlcer scries for iron mining, copier mining, total metal mining, and bituminous coal mining were revised from January 1947 to date. Production-worker data for lead and zinc nining were revised for 1943-46* Because those revisions were compensating, no chance was necessary in the mining division series on total employment. The hours and earnings series likewise wore not affected Sy these revisions. Suiiaary sheets shotting the revised series nonthly fron 1939 through April 1950 are available upon rccuert.
Employment in Nonapricultural ;jata.Hlidinent.«i Revised in Trade and ServiceD'ivi sions. 1939-46
A revised suiarary sheet of employment in nonagricultural establishments by industry division nonthly fron 1939 through April 1950 is now available. The data show the automotive repair service industry in the service division throughout the period. In former summaries it was shown as part of the trade division prior to 1947* The shift did not affect the nonagricultural employment total.
Employment on Boatbuilding and Hcmirine. 19Z.7 to Date. Kow Series
With tliis issue da', a are published for the : irst tine on total and production-worker employment in the boatbuilding and repairing industry (SIC industry 3732)# The new scries appear in table 2, page Ato. They were prepared in the same way as other data in this table and as described in the explanatory notes. Data for this industry will be published in this report regularly hereafter. Hours and earnings data for this industry also appear for the first tine in the June Hours and Eaminrs IndustryI.enort. Summary sheets showing employment, hours, and earnings series for this industry monthly from January 1947 through April 1950 arc available upon request.
Nonagricultural Employment by State. 19A7-4&-49
A summary report has just been issued under the above title giving employment in nonagricultural establishments in each of 32 States for which data are available,nonthly for the period shown. The data, which are given by industry division, incorporate the most recent revisions of the series. The summary serves as a recap for recent years of data appearing currently in table 6 of this report. Tho summary is available upon request.
NOTE: Personnel and Pay of the Military Branch of the Federal Government, shown in former issues of this report, are now omitted for security reasons.
Digitized for FRASER http://fraser.stlouisfed.org/ Federal Reserve Bank of St. Louis

U. S. DEPARTMENT OF LABORBureau of Labor Statistics Executive 2/f20
August 23, 1950 Washington 25, D. C. Ext. 351
EMPLOYMENT AND PAY ROLLS
Detailed Report
Juno 1950
CONTENTS PAGE
Enploynent Trends In Selected Industries
Synthetic Fibers........... .................... 2
Railroad Equipnent............... ............... 6
Enploynent and Pay Rolls Statistical Data.......... A si
Explanatory Motes............ .............. i
Glossary............. ...... ..................... v
Prepared by
Division of Enploynent Statistics
Sanuel Weiss, Chief
Digitized for FRASER http://fraser.stlouisfed.org/ Federal Reserve Bank of St. Louis

2
.... Shipments ot Record High
Substantial toxtilo rccovory through rdd-1950 and continued high output of rayon tiro-type fibers havo placcd June’s 54>100 production work-forco in the synthetic fibor industry at the highest level in 1,5 months. By contrast, the 1949 employment trend was downward to a post war low of 47,700 workers in July, general layoffs resulting frov. excessive inventories. The average workweek in June was 39.3 hours, morethan one hour longer than the workweek in nid-Jun© of last year and almost 2 hours greater than the postwar hourly low in April 1949•
Donestic deliveries of rayon (about 92 percent of all synthetics) for the 6-nont& period through June 1950 v/ero aliaoat half-again as largo as shipments in tho corresponding period of the previous year. Tho recovery was attributed nainly to textile- type rayon; tire-typo rayon fiber output remained stable. In fact, in the declining 1949 period, when output of rayon droppod 12 percont, deliveries of tire-type rayon filaments rose.
Tho synthetic fibor industry is currently producing greater poundage than in the high 1943 period despite a substantial decline in employment since that time. Although the procise reasons for such lowered monhour requirements since 1942 aro not known, they m y bo accounted for by a combination of the following factors: differing product output, such as larger proportions of coarse rather than fine fibers, possibly roduced r.tanhours utilization in newer non-celluloso synthetics, technological inprovouents, find inproved worker efficiency.
* Tho synthetic fiber industry (SIC 2825) is conprised of establishments primarily engaged in manufacturing rayon, nylon, and other synthetic fibers, except glass, to be used as material for further manufacturing.
Digitized for FRASER http://fraser.stlouisfed.org/ Federal Reserve Bank of St. Louis
Synthetics Recover High Level
Juno rayon shipnonts of 103 nillion pounds continued the high level which has characterized 1950, according to the Textile Economics Bureau. For the first 6-nonths a half-yearly record was attained as 605 million pounds of rayon were delivered including the all-tine nonthly peak of 106 nillion pounds in March.This recovery followed a 1949 downtrend when rayon output dipped 12 percent, the first decline in an otherwise uninterrupod 10- year clinb.
High autonobile output in 1949 stimulated a 10 percent gain in tire-type rayon over the previous year. In 1950 these sane yarns were averaging 25 nillion pounds nonthly, approximately the sane output as in 1949, but a tremendous gain fron the less than one nillion pounds produced nonthly in the prowar period. Likewise, textile denand was improving. Rayon textile-type deliveries rose 67 percent for the first 6-nonths of 1950 conparod with tho sano period last year, reflecting increasing use in non*a suitings, woncn’s wear and other textile products.
Despite the 1949 reduction in rayon, production of the newer nylon and other non-cellulose synthetic fibers in that year increased one-fifth to an output of 91 nillion pounds. In 1949, those new fibers accounted for about one-tenth of all sysithetics whereas prior to tho war, they were produced only in nominal quantities. An illustration of the constant change anong the various synthetic segnonts is afforded by an intra-industry shift in wonenTs hosiery which has soon low denier nylon practically replacing rayon.
In April of last year, rayon producers* inventories totaled 63 nillion pounds, which were groator than deliveries in that nonth. This contrasts sharply with end-of"April stocks in other postwar years which averaged only about one-sixth of nonthly shipnents* It was not until early 1950 that inventories returned to a nore nornal balance.
Uso of synthetics and blonds of synthetics and natural fibers has grown so rapidly that between 1939 and 1949, the proportion of total cotton, wool, silk and.synthetic fiber consumption accounted for by synthetics increased fron. 10 percent to 20 percent of the total, according to the Textilo Economics Bureau. Extrenely important factors in the sensational growth of rayon (in cor* .ci'cial product! oh in U. S. since 1909) have been its relatively low price as conparod with that of the natural fibers, as well as the possiblity of greater product control and the chenical uniformity of synthetics.
Digitized for FRASER http://fraser.stlouisfed.org/ Federal Reserve Bank of St. Louis

Enploynent Stable Tills Year
Juno’s 54,100 production workers in tho synthetic fiber industry was only 400 onployocs above the May level, but 5,700 workers nore than in June 1949* Fron a high of 60,600 production workers in October 1948, layoffs brought enploynent to a postwar low of 47,700 in July of 1949. Starting with August, however, there was a steady upward trend until the end of 1949 when cnploy- ncnt stabilized at current levels.
The June'hiring and separation rates of 1,9 and 0,8 percent respectively, stamp the industry’s workforce as one of tho aost stable in all manufacturing. Accessions for all soft goods factory workers in Juno averaged 3.9 percent and separations 2,6 percent.
State Yoar-to-Year Trend Upward
Tho South contains about three-fourths of the industry’s enploynentj Virginia and Tennessee accounting for one-fourth and one-fifth respectively, of tho United States total, Enploynent in the industry as a whole rose 12 percent fron June 1949 to June 1950, with an unusually large gain of 16 percent reported in Tennessee,
Table I
Enploynent Index l/, 1949-1950, Hours and Earnings for Production Workers, June 1950, in the Synthetic Fibers Industry
: Enploynent Index : : (Juno 1949 » 100) :
Average Hoiirs and Earnings June, 1950
:
* June
*
_____125?___;_Ita.; Juno:
Wcok.lyEarnings
• • • •; Weekly : j Hours :
Hourly Earning s
Total U. S. 100,0 111.0 111.8 #57.73 39.3 $1,469
South 100,0 110,2 111.1 57.25 39.4 1.453Virginia 100,0 103,3 103.7 58.48 39.7 1.473Tennessee 100,0 112.5 115.6 57.11 39.a 1.435North 100.0 114.1 114.4 59.12 39.1 1.512
1/ Data are based on a sanplo group of establishments, conprising 80 percent of tho industry. For U, S, totals see Table II, State totals are not available.
Digitized for FRASER http://fraser.stlouisfed.org/ Federal Reserve Bank of St. Louis

Hours up fron Last YearThe average workweek in Juno 1950 was 39.3 hours, about
one hour ahead of last June and considerably higher than the low of 37.5 hours in April 1949. The June workweek is about tho sane as tho 1947 and 1948 annual averages. Regional figures indicate that sone overtine was being worked particularly in Tennessee and Virginia.
Hourly earnings in June average $1,47 chewing little change over the past year. The current level however is 20 cents above June 1947. Average weekly earnings of $57.73 wore at an all-tine high. Northern earnings in June were alnost $2.00 per week higher' than those in Southern plants, despite a sonewhat shorter workweek in tho North.
Table II *
Enploynent, Hours and Earnings of Production Workers in the Synthetic Fiber Industry, by Month 1949-1950
YearandMonth
••: Nunber •*
: Average : Weekly :Earninss
: Average : : Weekly : : Hours :
AverageHourlyEnrninss
Average 1947
(thousands)
57i9 149.02 39.5 $1,2411943 59.9 53.05 39.5 1.3431949 52.7 55.20 38.6 1.430
i m
January 60*0 55.55 39.2 1.417April 51.a 53.63 37.5 1.430July 47.7 55.13 38.1 1.447October 52.1 55.63 38.9 1.430
1950
January 53.5 56.45 39.2 1.440February 53.5 55.99 39.1 1.432March 53.6 55.97 39.0 1.435April 53.8 56.52 38.9 1.453May 53.7 57.35 39.5 1.452June 54.1 57.73 39.3 1.469
* Data are based upon reports fron cooperating establishments covering both full-and part-tine enployees who worked during or received pay for the pay period ending nearest the 15th of the nonth
Digitized for FRASER http://fraser.stlouisfed.org/ Federal Reserve Bank of St. Louis
6,
Employment in the railroad equipment industries i/ increased during tho socond quarter of 1950, and thus reversed a decline which had prevailed for more than a year. The increase reflected higher locomotive and freight car production. Underlying the latter movement were the substantial ordors resulting fron tho continued replacement of steam locomotives by Diesel units and the purchase of freight cars by the Sqvitcblc Life Ascm-r.icc Society for leasing to several railroads.
Further orders for rolling stock may appear as a result of the current negotiations for additional orders of freight cars and locomotives based on leasing arrangements* the rising level of business activity, and the high rate of railroad car retirements so far this year. Railroad cix retirements are now averaging aboiit 6,000 per month. In addition, the industry will probably benefit from orders for special equipment to fill defense needs. During World War II, the industry built tanks, prime movers, and special railroad cars designed for troop movements.
Between the two World Warn, this industry was characterized by a long-term employment decline. World War II and the immediate postwar boom reversed this trend. The re- appearance of the downward trend was suggested in 1949 when railroad car orders dropped to insignificant levels, but in 1950 orders once more turned upward.
1/ These are the locomotive and parts manufacturing (SIC 3741) and the railroad and street car manufacturing industries (SIC 3742), Similar manufacturing activities which occur in railroad owned shops are excluded*
Digitized for FRASER http://fraser.stlouisfed.org/ Federal Reserve Bank of St. Louis

Railroad and Street Cars 2/The independent railroad car building industry added
appropriately 6,000 production workers to its workforce in the second quarter of 1950 as a rise in freight car orders stimulated production. Employment in June totaled 30,000 ^/, a drop of about 4-0 percent from average employment in 1947 and 1948 (see Table II p. ).
The stream of new orders reflected primarily a novel plan for the financing of freight car production. Under this plan, the Equitable Life Assurance Socioty purchases new freight cars and leases thorn to the railroads. The roads will thereby receive the immediate benefits of reduced repair costs and improved rolling stock while their working capital remains untapped.
Though orders of freight cars to independentshops in the first six Kontha of 1950 wore substantially above the total of about 3,000 rado ill the first half of 1949, they were only a bit more than ono-half tho number ordered in the like period of 1947. Orders received in 1947 and 1948 covered the backlog of domestic demand and tho emergency needs of foreign countries (see Table I below). Widespread currency devaluation abroad has since made the prospects of further large foreign sales rather dubious.
Table I
Year: ::Domestic Orders: Deliveries• * • • Domestic : ExDort
1946 48,000 32,000 13,0001947 93,000 53,000 28,0001948 58,000 83,000 2,000.1949 4,000 63,000 3,0001950 (6 nos.) 27,000 7,000 200
Source: American 'Railway Car Institute
27 Tho analysis is limited to freight car production since it constitutes by far the most important product of the industry. In 1949, the industry produced 63,000 freight cars, 1,045 passenger train cars, 684 transit cars, and 1,430 trolley coaches,
2/ Workers tjpployod in railroad owned shops are excluded.
Digitized for FRASER http://fraser.stlouisfed.org/ Federal Reserve Bank of St. Louis

The declinc of orders in 194-9 signified a temporary reassertion of the lon£~tona downward trend in tbo 3 evol of tho industry*3 operations* Thi3 trend is illustrated by tho reduction of tho production-worker force fron 30,000 in 1923 to 24,000 in 1939> and restjTbs fron tho dependence of tho car manufacturing industry on ono m i or customer-the Nation* s railroads*
Table II
Production Worker Employment in tho Railroad and Street Oar Manufacturing Industry,
by Month, 1947 - 1950
/ Month ! h •.... • 1947 ! 1948 ; 1949 ; 1950 •
Average 50.3
...... ... n.v rr._....... r) B
51.2 43.3
January 46.9 51.9 52.9 28.4February 48.8 50.3 53.1 27.0Jferch 49.7 50.6 52.2 25.9April 50.9 50.0 49*6 24,7Mhy 50.4 50.1 48.7 28.4June 50.5 51.6 47.2 30.8July 50.2 51.4 43.5August 49.9 51.1 39.7September 51.0 51.1 37.7October 50.8 50.8 34.2November 52.2 52.4 31.1December 52.4 52.8 30.2
Locomotive .and Parts Industry
The locomotive manufacturing industry responded to the spurt in orders during the first half of 1950 by lengthening the workweek rather sharply. Average weekly hours in January 1950 were 39*Oj by May 1950, they had risen to 40.9* In Juno weekly hours dropped to 39*5 reflecting the working down of order backlogs and a slight enlargement of the workforce,
Tho industry added 600 workers in the second quarter of 1950. Juno employment totaled 20,400, about 20 percent bolow tho 1948 average of 25,800 (see Table IV p.io), but more than double tho 1939 level of 6,000. Between 19?-3 and 1939 employment fell from 30,000 to 6,000.
Digitized for FRASER http://fraser.stlouisfed.org/ Federal Reserve Bank of St. Louis

9.
The number of loconotives ordered in the first six nonths of 1950 was approximately double that for the comparable period a year ago. However, unfilled orders, on January 1950 were about 50 percent below the level of January 1, 1949.
•The peak in postwar loconotive orders was reached in 1948. The following year a rather sharp reduction in denand fron both domestic and foreign sources occurred (see Table III bolow). Data for the first six nonths of 1950 indicate that the decline in this segnent of railroad equipnent nanufacturing is not following as drastic a d6wntrend as the carbuilding industry.
Table III
Loconotive Orders
Icar * •
•
Donestic * •
Foreign
19461947194819491950 (6 nos.)
1,0522.229 2,717 1,8081.229
6296554351151/
1/ Not available* Source: Railway Age
The limited decline in loconotive orders reflects continuation of the Dieselization program whereby railroads have been achieving greater economics of operation than with stean loconotives. In 1949# 1,865 new loconotives were installed, only 57 of which were stean. Today Diesel lcco- notives provide a m j or share of railroad service.
Diesel Service as Percent of Total Service, 1940 and 1949
•
Passenger Service *♦
•
Freight Service * •
Yard Service
1940 5.2 .05 9.4
1949 49.3 34.9 50.8
Digitized for FRASER http://fraser.stlouisfed.org/ Federal Reserve Bank of St. Louis

1 0
Table 17Production Worker Employment in the Locomotive and Parts
Manufacturing Industry, by Month, 1947 - 1950
Month 1947 : 1948 : 1949 : 1950
Average 25.4 25.8 22.7
January 26,6 26.5 25,7 19.6February 27,0 26,6 25.8 19.9March 26,0 26.8 25.8 19.6April 25,1 26.7 25.1 20.0.May 23.8 26,5 24.4 20.5June 24.3 26.4 23,8 20.4
July 23.7 26,4 22,6August 24 »4 17.7 12,2September 25.I 27.0 22,1October 25.9 26.4 21.9November 26.1 26.4 21.7December 26,4 26.5 21*7
Hours and Earnings in tho Equipment Indttstry
Hourly earnings in the locomotive building industry in June 1950 were $1,72. This was higher than the figures for carbuilding ($1,576) and for all manufacturing ($1,719) (see Table V p. il) and is explained primarily by the highly skilled work required in loconotivo nanufacturing,
As stated above weekly hours in loconotivo manufacturing during June were 39.5, and in carbuilding 38.7* The average for all durable goods industries, however, was 41*4* Thus, the two equipment industries are part of a group in durable goods manufacturing where overtime can bo expanded substantially to meet any defense orders*
Digitized for FRASER http://fraser.stlouisfed.org/ Federal Reserve Bank of St. Louis

Table V
Hours and Earnings, June 1950
••
••
•»
Average : Weekly Earnings :
AverageWeeklyHours
: Average Hourly
: Earnings
All manufacturing $58.89 40.5 11.454
Railroad and street ears 60.99 38.7 1.576
Locomotives and parts 67.90 39.5 1.719
Eauiment Manuf ac trring and tho Railroads
The level of employment in the railroad equipment industries reflects the size of orders placed by the Nation*s railroads. Thus, in 1948, enployncnt in tho equipment industries registered 24-yoar rocord highs as the result of large postwar orders placed by tho roads. These orders reflected the progran for replacing obsolete stock and for neeting war deferred needs which was facilitated by tho high level railroad earnings during the war and inmediate postwar periods. Prospects of lowered earnings in 1949 as well as the filling of deferred needs explain the subsequent drastic reduction in orders and the resulting enploynent decline in the equipnent industries. Possible defense orders and a generally high level of economic activity nay change this picture.
Over the past quarter of a century, however, the trend of employment in the equipment industries has been steadily downward. Underlying the reduction are two major factors* the relative decline of railroads as a transportation medium and the improvement and more efficient use of railroad equipment.
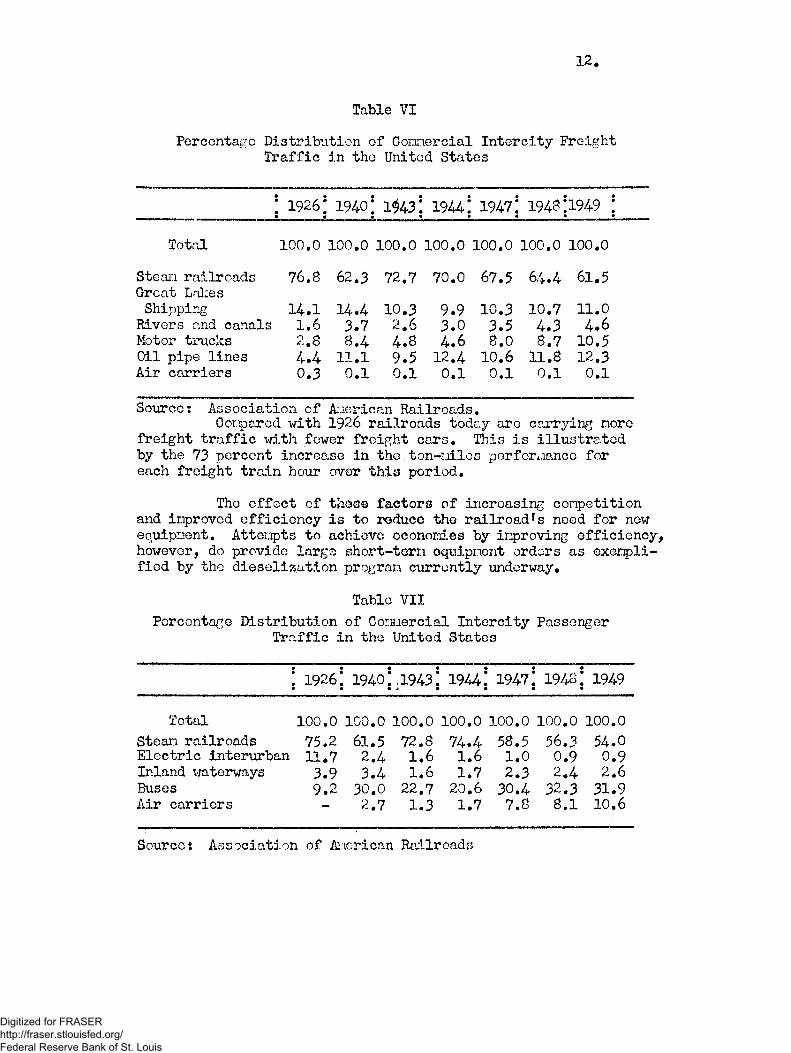
In 1926, the railroads carried 77 percent of connercial inter-city freight trafficj by 1949 this had fallen to 62 percent (see table VI p. 12). The decline has been even noro marked in the field of passenger trafficj in 1926 the railroads carried 75 percent of connercial inter-city passenger traffic, in 1949 only 54 percent. Table VII page 12 which describes the percentage distribution of passenger traffic does not show the depressing impact of increased automobile usage on total commercial traffic.
Digitized for FRASER http://fraser.stlouisfed.org/ Federal Reserve Bank of St. Louis
12.
Percentage Distribution of Comercial Intercity Freight Traffic in tho United States
Table VI
! 1926: • • 1940; 1^43! « 1944!• 1947!• 1948:1949 : •
Total 100.0 100.0 100.0 100.0 100.0 100.0 100.0
Steal:i railroads Great Lakes
76.8 62.3 72.7 70.0 67.5 64.4 61.5
Shipping 14.1 14.4 10.3 9.9 10.3 10.7 11.0Rivers and canals 1.6 3.7 2.6 3.0 3.5 4.3 4.6Motor trucks 2.8 8.4 4.8 4.6 8.0 8.7 10.5Oil pipe lines 4.4 11.1 9.5 12.4 10.6 11.8 12.3Air carriers 0.3 0.1 0.1 0.1 0.1 0.1 0.1
Source: Association of American Railroads.Oonpared with 1926 railroads today are carrying more
freight traffic with fewer freight cars. This is illustrated by the 73 percent increase in the ton-uilcs performance for each freight train hour over this period.
The effect of thaa© factors of .increasing competition and improved efficiency is to reduce the; railroad’s need for new equipment. Attempts to achieve economies by improving efficiency, however, do provide large short-tern oquipnent orders as exemplified by tho dieselization progran currently underway.
Table VII
Percentage Distribution of Comercial Intercity Passenger Traffic in the United States
4444: 1926: » • 1940 i • .1943!j • 1944.*• 1947!« 19481 • 1949
Total 100.0 100.0 100.0 100.0 100.0 100.0 100.0
Stean railroads 75.2 61.5 72.8 74.4 58.5 56.3 54.0Electric interurban 11.7 2.4 1.6 1.6 1.0 0.9 0.9Inland waterways 3.9 3.4 1.6 1.7 2.3 2.4 2.6Buses 9.2 30.0 22.7 20.6 30.4 32.3 31.9Air carriers - 2.7 1.3 1.7 7.8 8.1 10.6
Sources Association of American Railroads
Digitized for FRASER http://fraser.stlouisfed.org/ Federal Reserve Bank of St. Louis

EMPLOYMENT AND PAY ROLLS
Detailed Report
Asl
June 1950
TABLE CONTENTS PAGE'
1 Employees In Nonagricultural Establishments, by Industry Division
and Group................... ............................................... A:2
2 All Employees and Production Workers in Mining and Manufacturing
Industries. ........................................ ........................ A: 4
3 Indexes of Production-Lorker Employment and Weekly Pay Rolls in
Manufacturing Industries.........................................A: 9
H Employees in Private and (J. S; Navy Shipyards, by Region.............. A:10
5 Federal Civilian Employment and Pay Rolls in All Areas and in
Continental United States, and Total Civilian Government Employment
and Pay Rolls in Wasiiinguon, D. C . . A * 11
6 Employees in Nonagricultural Establishments, by Industry Division,
by State............................. ..... ............... .......... A:12
7 Employees in Nonagricultural 'Establishments by Industry Division, in
Selected Areas.......... ......................... • .................... A;l6
8 Production Workers in Selected Manufacturing Industries................ As-19
Data for the 2 most recent months I
shown are subject to revision i* * * * * * * * * * t
Explanatory notes outlining briefly the .
jconcepts, methodology, and sources used j
jin preparing data presented in this re-
Sport appear in the appendix. See pages j
___ ______ __ ___________________j
Digitized for FRASER http://fraser.stlouisfed.org/ Federal Reserve Bank of St. Louis

A;2
?A31E lj rn^loyees in Hcn&crlcultural Establishments, by Incustry
Division and Group*
(In thousands)
Industry division and group1 June May { April j* June Kay
TOTAL 43,969 ! 43,330 42,926!
i 42.835|
I:
|- 42,731
MINING** 944 939 939 ; 968i
974
Metal mining 101.8 100.4 98.5
I
■ I 107.0 108.2Anthracite i 75.3 76.2 75.3 ! 77.i 77.0Bituminous-coal .j 411.2 412.6 419.0 i 424.5 431.6Crude petroleum and natural gas production j 255 .8 252.1 251.4 ! 261.9 260.1Nonmetallic mining and quarrying 99.6 97.5 1 9^.5 98.0
j97.5
CONTRACT CONSTRUCTION 2.413 2,242 2,076 ,j 2,205 2,137
MANUFACTURING I14,681. 14,421 14,162
i
i 13,884 15,877
iDURABLE GOODS 7.971 7,813 7,548 7,392 7,441
Ordnance and accessories , 23.5 23.2 22.8 25.3 26.1Lumber and wood products (except furniture) j 805 785 1 753 747 733
Furniture and fixtures !. 349 348 347 j 298 301Stone, clay, and glass products i 511 501 487 478 482
Primary metal industries \1Fabricated metal products (except.ordnance, j
1,217 1,190 = 1,171 1,135 1.158
machinery, and transportation equipment) 1 924 896 876 836 . 843
Machinery (except electrical) j 1,342 1,328 1,307 1.285 1.327
Electrical machinery .8.09 . 800 791 725 746
Transportation equipment I 1,307 1,269 1,122 1,224 1.183
Instruments and related products j 243 239 236 236 238Miscellaneous manufacturing industries i1
440 434 435 403 404
1NONDURABLE GOODS j
!6,710 6,608 6 ,6l4 6.492 ; 6,436
jF^od and kindred products j 1,519 1,462 1,432 1,501 5 1,436
Tobacco manufactures 82 83 83 91 90
Textile-mill products ! 1,264 1,252 l,26l 1.170 1,175
Apparel and other finished textile products ; 1,094 1,093 1,119 1,073 1,070Paper and allied products j 468 459 458 434 437Printing, publishing, and allied industries 742 737 735 725 722
Chemicals and allied products ; 672 670 675 642 j 654Products of petroleum and soal 240 236 234 j 246 246
Rubber products ! 247 242 238 i 230 233Leather and leather products j 382 374 379 380 373
See explanatory notes, sections A-G* and the glossary for definitions.
* Employment series, beginning January 1939 to date, incorporating revised data for the trade and
service divisions, I939-I946 inclusive, are available upon request. See Introductory notice, **See footnote, table 2, page A:8.
Digitized for FRASER http://fraser.stlouisfed.org/ Federal Reserve Bank of St. Louis

TABLE 1: Employees in Nonagricultural Establishments, by Industry
Division and Group (Continued)
(In thousands)
Industry division and group .1250. JL912.TRANSPORTATION AND PUBLIC UTILITIES
; nunc
;4,023
r may3., 888
J.J. j
3,928
O UX1C
4,031 ;4,021
Transportation .2,813 2,688 2,733 2,800 2,792Interstate railroads 1,407 1,299 1,356 1,410 l,4l6
Class I railroads :1,240 1,135 1,188 1,230 1,237Local railways and bus lines 14? 149 150 159 159Trucking and warehousing 576 562 554 540 532
Other transportation and services 683 678 673 691 685
Communication 662 659 657 691 695
Telephone 614.4 610.7 609.2 636.6 639.1
Telegraph 46.7 46.9 46.9 53.1 54.5
Other public utilities 548 541 538 540 534
Gas and electric utilities 522.2 515.8 512.5 515.2 509.3
Local utilities 25.5 2 5.O 25.3 24.8 24.4
TRADE 9,424 9,338 9,346 9,336 9,342
Wholesale trade 2,498 2,477 ! 2 ,477 2 ,491 2 ,482
Retail trade 6,926 6,861 6,869 6,845 6,860
General merchandise stores 1,432 1,432 1,466 1,401 1,434
Pood and liquor stores 1,206 1,205 1,200 1,208 1,203Automotive and accessories dealers 731 714 706 670 661
Apparel and accessories stores 533 530 545 553 564
Other retail trade 3,024 2,980 2,952 3,013 2,998
FINANCE 1,826 : 1,812 1,803 1,774 1,763
Banks and trust companies 427 421 420 417 413
Security dealers and exchanges 60.0 59.2 58.2 |i .55.3 55.3
Insurance carriers and agents 645 640 639 616 612Other finance agencies and real estate 694 692 686 ' 686 683
SERVICE 4,826 4,790 4,757 4,834 4,804
Hotels and lodging places 475 451 441 487 464
Laundries 362.0 353.3 347.4 iI 361.0 352.6
Cleaning and dyeing plants 155.9 150.2 146.1 154.1i
153.1
Motion pictures 237 236 236 240 238
GOVERNMENT 5,832 5,900 5,915 : 5,803 5.813
Federal 1,851 1,890 1,939 1,909 1,898State and local 3,981 4,010 3,976 !! 3,894 3,915
See explanatory notes, sections A-G, and the glossary for definitions.
Digitized for FRASER http://fraser.stlouisfed.org/ Federal Reserve Bank of St. Louis

A si*
TABLE 2: All Employees and Production Workers In Mining and Manufacturing Industries
(In thousands)
Industry group and industryAl l employees
1950
Production workers
! June 1! May ! April ' Juno | May ' , A pril
MINING**
r — 1— -'
944 939 939 | ! !
METAL MINING 101.8 100.4 98.5; 90.3 89.0 87.2
Iron mining 56.0 35.9 33.8 , 32.5 32.5 30.3
Copper mining 28.1 27.9 28.0 | 24.8 24.8 24.8
Lead and zinc mining 20.0 19.2 1 9 . 1 ;i
17.4 16,6 16.6
ANTHRACITE 75.3 76.2I
75.3 j 70.8 71.6 70.7
BITUMIN OUS- COAL 411.2 412.61
419.0 ; 385.3 387.5 393.8
CRUDE PETROLEUM AND NATURAL GAS PRODUCTION 255.8 252.1 251.4 ■ - -
Petroleum and n atural gas productioiji — *" ~ i 127.8 124.1 123.5
NONMETALLIC MINING AND QUARRYINGi
i 99.6j
97.3 94.5|: j
87.3 84.9 82.4
MANUFACTURING1
il4,68l 14,421 14,162 |>. j
12,072 11,840 11,597
DURABLE GOODS 7,971
j
7,813 ;1 7,548 j 6,598 6,452 ! 6,195NONDURABLE GOODS ! 6,710 6,608 6,614 | 5,474 5,388 i 5,402
ORDNANCE AND ACCESSORIES j 23.5i
23.2 i 22.8; 18.9 18.6 18.3
FOOD AND KINDRED PRODUCTS 1,519 1,462|
1,432 j 1,142 1,090 1 ,0 6 5 .
Meat products 292.9 286.9 282.7 ; 232.3 227.2 223.3
Dairy products 156.6 148,8 : 141.4 | 114.5 108.3 102.8
Canning and preserving 174.5 151.5 ; 144.9 1 149.0 126.4 119.9
G rain-m ill products 125.2 121.5 | 120.2 I 95.3 92.4 91.4
Bakery products 284.9 287 .1 ' 284.6 j 190.9 1.92.7 191.0
Sugar 29.7 29.1 i 27. Oj 24.9 24.4 22.6
Confectionery and rela ted products 90.2 8 3.7 ; 90.6! 73.8 72.7 74.6
Beverages 226.0 213.1 j
O'OO04 157.5 146.6 140.9
M iscellaneous food products j 139.1 135.0 ! 134.1,1
103.3 99.4 98.4
TOBACCO MANUFACTURES 82 83 i 83 | 75 76 76
C igarettes 25.4 25.5 1 25.5: 22.8 22.8 22.9
Cigars 39.5 39.7: 39.3 j 37.4 37.6 37.2
Tobacco and snuff 12.0 12.1: 12.4 j 10.5 10.6 11. 0Tobacco stemming and redrying
1 "
5.7 = 5.5! 4.2 4.9 4.7
See explanatory notes, sections A~G, and the glossary for definitions.
Digitized for FRASER http://fraser.stlouisfed.org/ Federal Reserve Bank of St. Louis

A;p
TABLE Zx All Employees and Production Workers in Mining and Manufacturing Industries (Continued)
(In thousands)
.. I 43*1 employee?5 ■.-. .
Production workersIndustry group and industry j
i ' -135P _ 1950
... II j. , j* June * May j April :1 June !1 Hay April
TEXTILE-MILL PRODUCTS 1 *261; ]| 1.252;
l,2ol 1,174 1,163 1,172
¥arn and thread mills;
155.9 !
:
153.2 154.7 145.9 143.0 144.5Broad-Wov^n fabric mills ' 611.9 i 603.3 602.8 581.3 573.1 j 572.7Knitting mills i 2J0.2 i 231.7 236.1 210.9 212.7 217.9Dyeing' and finishing textiles 86.3 | 86.2 08.3 7 6.6 76.7 1 78.8tarpets, rugs, other floor coverings 60.2 | 60.2 60.9 52.8 52.7 53.6Other tsxtile-mlll products 119.1 : 117.8 117.8 j 106.1
j104.6 1^4.5
APPAREL AKB OTHER FINISHED TEXTILEPRODUCTS 1.094 1,093 1,119 976 97S 1,003
.Men1s and boys1 suits and coats Men1s and boys1 furnishings and work!
148.9 11*3.1 li*6. t 134.9 128.9 131.7
clothing | 254.0 255.9 258.6' 236.7 238.2 241.3VIomen1 s out erwear j 279.9 286.2 305.2 246.0 254.1 271.6Womens, children^ under garments I 99-7 102.2 105.5 89.7 92, e 95.4Millinery 17.5 j 18.7 2©.7 15.1 16.3 18.OChildren’s outerwear i 65.1 62.8 63.6 59.0 57.2 58.0Fur goods and miscellaneous apparel j1 38.6 11 85.3 82.6 77.2 74.2 71.8Other fabricated textile products j 139.0 138,6 136.9 117.7 116.6 115.4
yjMBEF. AJ05 WOOD PRODUCTS (EXCEPT j !
78$5'UR*aroRiS) 305 753 743 723 692
Logging .smps and contractors 71.9 ] 67.1* 59.2 67.3 62.8 54.7
S a f a r i t*\\? planing mills 471.7 !*6o ,3 **39.8 441.5 430.3 409.9
M5.3 o'* •p.-io , 'ind prefabricatedSt' Wv’* U. i products 121*. 1 121.7 120.2 108.1 105.9 104.4
>Toedi:n 77.5 75.3 7M-.1* 72.1 69.7 69.1
Mlcc<?.;Lluvi ous wood products 59.6 60.0 59.8 53.5 53.9 54.0
rTlT^ITWE AND FIXTURES 349 31*8 347 302 302 303
Household furniture 21*9.0 248.5 21*8.8 221.9 221.4 222.0
Other furniture and fixtures 99.7t
i
99.5 98.6 80.4 81.0 80.7
See explanatory^nctes, sections A-G, and the glossary for definitions,
Digitized for FRASER http://fraser.stlouisfed.org/ Federal Reserve Bank of St. Louis

A: 6
TABLE 2: All Employees and Production Workers in Mining-and Manufacturing Industries (Continued)
(In thpusands)
Industry group and industryAll er.ployees Production workers
1950 2m .-..-..............- ______ ____________ !' June f ■ May f April f June ? May * April
i
PAPER AND ALLIED PRODUCTS \ 4-68 459 | 458\ ' '
! 400 !
i 392 ! 391
Pulp, paper, and paperboard mills j 235.5 i 231.7 230.6 | 204.9 j■ 201.6 i 200..7Paperboard containers and boxes 1 124.5 ■ 121.4 121.3 ! 105.9- 1 103.3 . ! 103.4
Other paper and allied products • \ 107.5- ; 105.8 105.6 ; 88.7j
| 86.8 1 86.6
PRINTING, PUBLISHING, AND ALLIED
INDUSTRIES 74-2 ' 737 735
t
! 501 j 433. ! 497I
Newspapers 1 293.2 296.2 293.5
Il 150.3 : 149.3 = 147.7.
Periodicals ! • 51.2 51.3 51.5 1 33.8 34.5 35.0
Books ; 45.5 i 45.4 45.3 35.0 34.7 ( 34.9
Commercial printing 199.8 197.6 198.9 !■ 166.0 164.0 164.9
Lithographing 40.0 40.0 39.9 ; 31.1 31.0 30.9
Other printing and publishing j1
107.2 106.8 105.7 I 84.4 84.1 83.2!
CHEMICALS AND ALLIED PRODUCTS !i
672 670 675
K\00 ,485 : 490
Industrial inorganic chemicals ; 73.5 71.8 • 70.5 ! 54.5 53.6 52.8Industrial organic chemicals 199.0 196.0 194.1 I 150.0 147.8 146 .0 .Drugs and medicines 1 9’K 5 93.4 93.4 i 6 1.8 . 61.0 60.6.Paints, pigments, and fillers 72.5 ! 69.3 69.1 I 47.6 45.5 45.1Fertilizers : 29.9 ! 35.9 41.6 23.9 29.8 35.6Vegetable and animal oils and fats j 48.1 : 50.0 53.2 3 7 . 7 39.8 42.7
Other chemicals and allied products j 154.6 154.0 153.4 107.9 107.3 106.9
!PRODUCTS OF PETROLEUM AND COAL j 240 ' 236 234 181 177 176
Petroleum refining 188.3 187.0 185.7 1 3 8.0- 136.1 135.6
Coke and byproducts \ 21.1 20.7 20.5 18.5 18 .1 17.9Other petroleum and coal products 30.1 28.6 27.8 24.5 23.2 22.3
i
RUBBER PRODUCTS I 247 242 238 199 I. 194 ■ 191
Tires and inner tubes j 110.0 108/4 106.6 87.5 8 5.7 i 84.0 .
Rubber footwear ; 24; 2 23.9 24.1 19.2 | .1 9 . 1 19.3
Other rubber products 1 113.1 109.4 10 7.4 92.2 ; 89.1 87.2
LEATHER AND LEATHER PRODUCTS (i
382 374 379 343 335 | 341
ILeather j 49.6 49.4 49.5 45.0 44.9 45.0
Footwear (except rubber) , 247.3 240.6 244.3 224.0 2 1 7.7 221.5
Other leather products ' 84.8 83.8 85.4 73,7 72.8 ; 74.6
See explanatory notes, sections A-G, and the glossary for definitions.
Digitized for FRASER http://fraser.stlouisfed.org/ Federal Reserve Bank of St. Louis

As7TABLE 2: All Employees arid Production Workers In Mining and Manufacturing Industries (Continued)
(In thousands)
-----—..... .. - — — TAll employees i Production workers
Industry group and industry _ - .195.0...!
1950
June 11 May > ' April !1 June . May !1 ... April
STOKE, CUY, AND GLASS PRODUCTS
i
511 501
1.. ,, „"f„ 1 rt j 1
487 5 441 431 419
Glass and glass products 134.5 131.7 128.8 ! 118.2 !•-116.0 112.8Cement, hydraulic 42.7 42.1 41.5 36.5 36.0 35.4
Structural clay products 82.8 79.9 76.0 75.6 72.9 68.6Pottery and related products 56.3 57.6 57.6 50.8 52.2 52.3'Concrete, gypsum, and plaster
products 92.9 89.7 86.4 1 79.6 76.0 73.5Other stone, clay, and glass product i 101.7 100.0 97.1 79.8 78.3 75.9
PRIMARY METAL INDUSTRIES 1,217 1,190 |i»l71 :1,050 ;1,025 1,007
Blast furnaces, steel works, and
rolling mills 616.3 606.4
1
599.2 538.0 529.4 522.5
Iron and steel foundries 227.9 220.3 215.7 200.1 } 193.0 188.1Primary smelting and refining of
nonferrous metals 55.2 54.6 54,2 i! 46.0 45.5 : 45.2
Rolling, drawing, and alloying of
nonferrous metals ’ 96.0 94.9
• 1
93.2 80.2 78.9 ■77.1Nonferrous foundries 91.8 87.4 84.3 77,?- 73.6 70.7Other primary metal industries || 129.6 126.1 124.1 108.3 105.0 103.3
FABRICATED METAL PRODUCTS (EXCEPT
ORDNANCE,*MACHINERY, AND
TRANSPORTATION EQUIPMENT)
I
924 896 87 6 1! 7 69 742 722
Tin cans and other tinware i 48.6 45.6 44.6 jj 1*3.1 39.8 39.0Cutlery, hand tocrls, and hardware •156.4 154.4 152.5 !! 132.8 130.8 129.2Heating apparatus (except electric)
and plumbers1 supplies • 149.0 145.4
1
143.9
1
122,3 119.1 117.7Fabricated structural metal products i| 198.4 192.4 ! 190.3 J! 15^.3 148.3 145.8Metal stamping, coating, and
engravingi1 170.5 162.2 : 156.3
i ’!148.0 140.2 134.4
Other fabricated metal products 1 200.6 195.6 188.0 • 168.1j
163.9 155.6
MACHINERY (EXCEPT 'ELECTRICAL) jl.342 1,328 |1,307 | 1,034 ; 1,022 1,003
Engines and turbines 73.5 7-3 > 6- -'(4.9 • 1 55.^ j 56.0 53.4Agricultural machinery and tractors 180.3 180.6 180.5 141.0 '■]! 141.4 142.4Construction and mining machinery 97.8 : 95.9 95.4 70.4 68.4 • 68.3Metalworking machinery 212.3 207.2 204.5 162.7 158.1 155.4Speclal-irldustry machinery (except
metalworking machinery) 165.1 162.6 160.8 124.3 122.6 120.9General industrial machinery 183.7 181.3 ■178.8 ' 130.5 128,7 125.9Office and store machines and device* 1 89.4 88.4 88.0 | 74.4. • = 73.5 •73.2
Service-industry and household
machines l8l.O 181,8 ! 175,6 : 148.2 , .148.9 143.3
Miscellaneous machinery parts 158.8 156.6 152.6 :i 120.7 j 124.3 120.4
See explanatory notes, sections A-G, and the glossary for definitions.
Digitized for FRASER http://fraser.stlouisfed.org/ Federal Reserve Bank of St. Louis

A:8
1VU3LE 2; jij.} Employees ana rroauction Workers in Mining and Manufacturing Xnaustries (Continuea)
(In thousands)
All employees Production workersIndustry group and industry ■ 1:950 1950 _
June ) May !! April 1 June ! - Kay ..1 April
ELECTRICAL MACHINERY
ON0CO 800 I! 791 6l4 605 595
Electrical generating, transmission,
distribution, and industrial
apparatus 307.3 : 307.3
i
303.3 221.9 221.9 217.1Electrical equipment for vehicles 69.6 ! 67.8 66.6 55.9 53.8 52.5Communication equipment i 295.0 ; 288.6 287.6 225.9 219.3 217.2Electrical appliances, lamps, and
miscellaneous products 136.2 j 136.2 133.7 110.4 110.4 108.1
TRANSPORTATION EQUIPMENT 1,307 1.269 | 1,122 1,078 1,046 899
Automobiles 894.2 ! 862.4 720.3 764.0 736.3 • | 595.3Aircraft and parts 257.2 1 254.4,; 253.3 187.3 I 185.6 j 184.9
Aircraft 170.7 ! 169.3 1 167,9 125.1 124.4 : 123.4
Aircraft engines and parts 52.1 - 50.8 j 50.7 37.2 | 36.2 1 36.1
Aircraft propellers and parts 7.8 7.9 ]i 7.9 5.8- 5.3 1 5.3
Other aircraft parts and equipment 26.6 26.4 jI 26.8 19.8 " 19.7 | 20,1
Ship and boat building and repairing 81.0 80 ;1 j 79.9 68.6 67.2 i 66.6
Ship building and repairing 66 .5 66.3 ! 66.7 55.9 55.2 | 55.4
Boat building and repairing*** 1H .5 13.8>• 15*2 12.7 12.0 | 11.2
Railroad equipment 63.7 61.8 58.4 49.0 47.-6 1 43,5
Other transportation equipment 11.1 | 10.7 10.1 9.4 9.1 !i|
8,6
INSTRUMENTS AND RELATED PRODUCTS 2^3 239 236 181 176 | 174
Ophthalmic goods 24.9 | 25.0 25.0 20.1 20.-2 j 20.2Photographic apparatus 50.1 49.1 48.5 36.5 35-4 \ 34.8Watches and clocks 28.1 28.0 28.5 23.6 23 *6 1 24.1Professional and scientific
instruments 139.4 137.1
|
133.7"
1
j 100.3. 97.0 | 94.8
MISCELLANEOUS MANUFACTURING INDUSTRIES W o 434 435- 367 36l- .jj
363
Jewelry, silverware, and plated ware 52.5 1 52.7 i 52.7 42.5 42.1 1 42i0
Toys and sporting goods 71.3 i 69.7 69.5 62.1 60.7 j 60.6Costume Jewelry, buttons, notions 52.8 j 5 1.5' 53.1 44.3 42.9 | 44.7Other miscellaneous manufacturing
Industries 263.1 259.8 259.8 1.. 217.9 . 215.6:1 . 215,4...
See explanatory notes, sections A-G, and the glossary for definitions,
** Employment data for some of the mining industries have been revised. Metal mining, iron
mining, coppefr mining, and bituminous-coal mining employment data were revised from January 1947 forward. Lead and zinc mining production-worker data were revised for I943-I94S inclusive# The
..iinin,' division total:employment and the hours and earnings data were fiat affected by this re
vision, Summary sheets showing employment, hours, and earning*-'*iata, frcm January :1939 forward,
are available upon request ♦
*** Summary sheets Shoving employment, hours, and earnings data, from January 1947 forward, are available upon requestt
Digitized for FRASER http://fraser.stlouisfed.org/ Federal Reserve Bank of St. Louis

TABLE 3s Indexes of Production-Worker Employment and Weekly Pay Rolls in
Manufacturing Industries
(1939 Average *» 100)
Period •• Production-worker •• Production- worker
• employment index • pay-roll index
Annual average:
1939 100.0 100.0
1940 107.5 113.61941 132.8 164.91942 156.9 241.5
1943 183.3 331.1
1944 178.3 343.71945 157.0 293.51946 147.8 271.7
1947 156.2 326.91948 155.2 351.4
1949 141.6 325.3
2242April 141.8 319.2May 138.2 312.8June 133.4 315.7
July 136.9 312.8August 141.1 323.0September 143.7 335*1October 138.8 320.9November 137.8 313.9December 140.4 32$.3
1950
January 139.8 329.2February 139.9 330.0March 141.0 333.5April 141.6 337.2May 144.5 348.8June 147.4 362.2
See explanatory notes, section D, and the. glossary for definitions*
Digitized for FRASER http://fraser.stlouisfed.org/ Federal Reserve Bank of St. Louis

At 10
TABLE 4: Employees In Private and U. S # Navy Shipyards, by Region 1/
(In thousands)
Region
!1950 1 9 4 9 ..........
1 June • * May ' ' A p r i l . * June S May
ALL REGIONS1 ;
;.134.9i 132.5 133.9 176.5 | 183,5
PRIVATE|
66.5i 66.3 66.7 91.3 i 95.1
NAVY * 68.4ij
66.2 67.2 85.2 j 38.4
NORTH ATLANTIC 68.1 65.8 65.5 87.0 1 89.3
Private 37,1 35.7 35.5 49.4 ! 50.5Navy 31.0 30,1 30.0 37.6 : 38.8
SOUTH ATLANTIC 22.8 22.8 22.2 ' 28.4 1 29.2
Private 1 7-9 . 8.5 8.4 11.9 12.1Navy j 14.9 14.3 13.8 16.5 17.1
GULF:!
Private | 9.3 8.9 9.0 13.9 14.7
PACIFIC 28.5 28.5 29.8 40.1 43.0
Private ! 6.0 6.7 : 6.4 9.0 10.5Navy 22.5 • 21.8 ! 23.4 31.1 32.5
GREAT LAKES:
Private'
2.1!
2.4 3.4 2.5 2.7!
INLAND: j 1i ;
Private ji!
4.i j 4.1 4.0 1 4.61 4.6
1 / The North Atlantic region includes all yards bordering on the Atlantic
in the following states: Connecticut, Delaware, Maine, Maryland, Massachusetts,
New Hampshire, New Jersey, New York, Pennsylvania, Rhode Island, and Vermont*
The South Atlantic region includes all yards bordering on the Atlantic
in the following states: Georgia, Virginia, North Carolina, and South Carolina.
The Gulf region includes all yards bordering on the Gulf of Mexico in the
following states: Alabama, Florida, Louisiana, Mississippi, and Texas.
The Pacific region includes all yards in California, Oregon, and Washington.
The Great Lakes region includes all yards bordering on the Great Lakes
in the fpllowing states: Illinois, Michigan, Minnesota, New York, Ohio,
Pennsylvania, and Wisconsin.
The Inland region includes all other yards.
Digitized for FRASER http://fraser.stlouisfed.org/ Federal Reserve Bank of St. Louis

A: 11
TABL2 5: Federal Civilian Employment and Pay Rolls in All Areas and in Continental United States,
and Total Civilian Government Employment and Fay Rolls in Washington, D. C. 1/
(In thousands)
Area and branch
Employment
i (as of first of month)
Pay rolls
(total for month)
! 1950 I 1950
r . June May ! April j1 June ! May ^ April
All" Areas
T*i
I
1(
TOTAL FEDERAL
Executive
Defense agencies
Post Office Department
Other agencies 2 / Legislative*
Judicial
2.022.22.010.3
780.6
497.4732.3
8.1
3.8
2,061.9
2,050.1
775.8
501.9 772-4
8-.0
3'. 8
2,110.9
2,099.0
773.7
503.9821.4
8.1
3.8
j$551.574
1 546,748
210,416
129,051 207,281
3,270
1.-556
. $577,915 ,573,-026
220,044
130,361
! 222,621
3,246
1,643
$539,71©535,057.
192,199"
131,117211,721
3,-232
1,441
Continental
United States
1
TOTAL FEDERAL
Executive
Defense agencies
Post Office Department
Other agencies 2 / Legislative
Judicial
1,871.2
1,859.4 6"4.6
495.5
689.3 < i 8.1 ; 3.7
1,910.21,898.5
670.1
50Q.0
728.4
8.0
3*7
1,959.8
1,948.0
668.2 502.0 777.8
8.1 5.7
; i
i 517,089
512,305
188^569128,528195.209
3,2701.513
541,195 :
536,351 , 196,249 :
129,841
210,261 3.246
1,598 ;
506,984502,351171,555130,629
200,1673,232
1,401
Washington, D. C.
1;' 1i
TOTAL GOVERNMENT
D. C. government
Federal
Executive
Defense agencies
Post Office Department
Other agencies
Legislative
Judicial
238.7 20.0
2 1 8 .7' ; 209.9 .j' 64.8
j 7.7- ! 137.4'
j 8.1
.7,'
240.0
20.2
219.82 U . 1
65.67.8
137.78.0
.7
239.8 20.0
219.8 | 21*1.0
65 .4 1 7.9
137.7 !
8.1-j
.7 ii
81,026
5,566 75’, 460
71,917 .
21,775 2,829
47,313 3,270
273
84,018 |
5,705'
78,3 1 3 :
74,785 i 22,607
2,872 j 49,3 0 61
3,246!
2 8 2 j
74,5195,0?0
69,48965,99320,416
2,78642,7913,232
264
See the glossary for definitions.
1/ Data for Central Intelligence Agency are excluded.
2 / Includes’131,800 Census enumerators in.April, 8*1',800 in May, in the continental United States
only.
Digitized for FRASER http://fraser.stlouisfed.org/ Federal Reserve Bank of St. Louis

k x l ZTABLE 6: *Emjvl<$yees . in N o n a g r i c u l t u r a l E s t a b l i s h m e n t s by I n d u s t r y Divi s i o n ,
by State(in t h o u s a n d s7
i..... . .. Total Minins Contract construction^State ....... 19^0______ 1349 19^0 1949. 1950 1949
June ^ay.. . June June May. June June May June
AlabamaArizona
ij
283.3152.8 150.2
23.412.6 '
24,512,3
27.813.4 11.3 11,6 10.3
Arkansas 286.2 277.5 5.2 4 .7 7 .° 18.9 17.0 14.4California * 3,077.6 3,042.5 3,008.1 32.0 31.7 34.1 181.4.. 174.6 l8l.8Colorado 337.5 327.9 336.3 8 .4 8.1 10,2 22.8 18,4 19.9Connecticut 742,0 73H.1 N.A. 1/ 2/ N.A. 2/ 36.1 2/ 34,1 N.A.Delaware *Dist* of Col« JL/ F U r ’ida
74-1.5
2J5.1 58.0
44.05^.7 46,7
Georgia 763.8. 763.3 4.1 4 ,1 4 .4 40,3 34.9
Idaho 129.0 123*1 128.9 5.7 5.6 , 5.9 13,2 10,8 10.5I l l i n o i s * N • A • . pr.A. 3,065.2 l i . k . N . A , 47.1 N.A. N«A» 119.8Indiana !l, 231.0 1,205.9 1,156.1 14.6 14.1 15.2 53.0 4-9 .3 52.7Iowa 600.3 596.1 579.^ 2.3 2.2 2 .3 36.7 32.3 29.6Kansas 4^9 .1 452.3 452.0 16.9 16.7 17.4 32.3 2.3,0 29.6Kentucky l /LouisianaMaine 258.3 248.8 257.4
26.0
.725.5
.726.5
♦O4 : 3 -
9 .0 9 .9Maryland * 699.7 686,2 681.3 1.9 1.9, 2.8 ‘.'4,7 45.6Massachusetts [1,539.0 1,614.8 1,632.2 i/ 2J 62.4 -6,9 57.6
Michigan 1 Minnesota
i
| 783.3 77^.3 778.6 17.2 15.7 17.5 40.5 36.5 38.7MississippiMissouri
1
| N.A. i , H 3.9 1,120.6 N.A. 9.3 9 .0 N.A. ^5.9 46.9Montana \j 155.0
'308.7152.li 150.9 10.9 10.9 10.0 13.5 12.1 12.2
Nebraska 303.1 310; 6 3 / 3 / i / 17.1 15.3 18.7Nevada 55.6 52 v° 1 53.7 2.9 2,5 3.2 6.2 4 .6 4.6New Hampshire 107.3 I63 , -4 163.5 • *3 • 3 .3 8 -2 8,0 8.3New Jersey j! i ,585 .9 1,560.5 1,558.9 3.8 3.7 4.3 79.8 74.8 71.8New Mexico j1 1 7 .9 146.4 142,6 11.1 10.5 11.6 17.6 17.5 16,0
New York j5 ,522#2 5,496,3 5,479.0 11.0 10.7 11,6 230.3 220.6 216,4North Carolina j North Dakota \ 113.4 109.2 111.4
3.6.9 H .8 %J 9.6 6.9 9 .9Ohi# ‘ j
Oklahoma j 464.1 458,7 461.4 43.1 42.8 43,8 27.5 25,5 25.3Oregon !' *+37.5 422.3 430.1 1.7 1.7 1.7 28.4 24.7 25.5Pennsylvania j 3,54-9-5 3 ^ 6 9 , 9 3,490.1 191.8 192.7 200t9 162.5 150.2 152.2Hhode Island | 280.0 274.6 265.4 i / i/ $ / 13.0 11.4 9.2South Carolina { South Dakota j
ITennessee 707.7 702,3 693.9
1.22.6
11.6
1.22 .5
12.0
1.12 .4
13.3 39.9 38.9 . 35*7Texas Utah l/ 186.0 180.3 18^.4
103,012.7
100.0
12,5102,313.3 15.0 12*5 12,0Vermont 95.5 94.0 95.1 1.0 1.0 1,1 4 .i 3.8 5.1Virginia
-Washington i 668.3 56i.o 679.8 3.2 3.2- 2.3 48,2 4-5.5 46,2West Virginia j Wisconsin i
n i ' 8 986.4 974.0126.8
3*5128.1
3.3135.3
3,6 43.5 39.4 42.5Wyoming !1
88.5 63.7 82.2 10.8 11.1 9 .3 12,2 10,6 8 .3
See f o o t n o t e s at end of table and e x p l a n a t o r y nates, s e c tions G and H #
Digitized for FRASER http://fraser.stlouisfed.org/ Federal Reserve Bank of St. Louis

A:13T A B L E 6: E m p loyees in N o n a g r i c u l t u r a l E s t a b l i s h m e n t s by I n d u s t r y D i v i s i o n ,
by State(in thousands)
Man afacturing Trans, Sc pub . ut* TradeState 1950 19 4q 19 50 1 19% I 19'56 1949
June May Jane t Jape May June June May June
Alabama 208,8 206.2 200.9. 51.3 50.5 51.7 118.3 118.3 114.6Arizona 15.7 15.6. 15.4 20.7 20.6 20.6 37.8 37.6 36.9Arkansas 72.3 71.1 68.4 32.0 31.3 3 0 a 68.6 69.6 67.3California 734.8 722.0 699.6 308.7 3?7 .3 313.5 777.9
S7.7765.6 73^.5
Colorado 54.3 53.4 53.0 41.9 41.0 42 .4 86.2 88.8Connecticut 362.6 359*5. N.A. 40.5 4o.o N.A. 124.5 122.9 N.A.DelawareDist* of Columbia
1+6.516. i+
44.816.3
44.616.3 29.4 28.9 31.0 90 .3 90.1 91.2
FloridaGeorgia
86.5265.3
88.7266*0
81.9250.6
66.665.6 11:1
64.466.7 167.0 167.8 I65.9
Idaho 20.8 17.9. 22.6 16.3 15.8 16.1 32.1 31.8 32.8Illinois N.a . N • A» 1 ,117.0 N.A, N.A. 294.2 N.A. N.A. 641.1Indiana
•557.1 509.2 IO8.5 100.8 102.0 233.8
I65.0231,0 227.9
Iowa 147.7 140.7 61.8 60.9 0O.5 I6b,l 164.9Kansas 90.0 88.3 88.0 62.4 6o .4 62.7 118.1 118.1 116.8KentuckyLouisiana
135.0132.4
131.3132.4
126,6133.2 76.7 76.0 79.5 136.7 136.8 138.6
Maine 108.3 101.6 106.4 19.3 18.6 19.5 49.9 48.7 49.7Maryland 213.5
64*+. 5209.3. 211.1 73.9 70.0 73.3 119.8 119.6 119.8
Massachusetts 632.8. 629.3 137.0 134.5 137.6 310.7 305.8 326.1
MichiganMinnesota
1,103.1+190.5
1,069.1 976.6184.8 87.7 87 .1 87.8 206.7 205.3 209.3
Miss iss ippi Missouri
83 .7N . A .
80.8334.6
75.0
3 l $ : lN.A. 120.9 122.9 N.A. 287.9 292.0
Montana 18.7 18.5 22.9 22.3 22.4 37.8 37.6 37.9Nebraska *+8.3 46.6 48.8 40.7 39.4 40.3 89.2 8 8 .4 90.«Nevada 3.1 3.1 3.1 8.5 8 .3 8.1 11.5 10.8 11.4New Hampshire 75.7 74.5 72.9 10.5 10.4 10.5 28.8 28.5 28.3New Jersey .709.3 696.6 686.3 133.4 131.6 136.2 270.5 266.7 272.9New Mexico 11.8 11.7 11.3 15.2 14.7 15.1 33-5 33.7 31.4New York 1 ,744.3 1 ,739.0 1,702.1 502.6 '499.3 51^.3 1,217.4 1,212 .7 1,241.1North 'Carolina 392.0 391.2 366.5 51.8 52.8 51.6 157.5 157.2 156.2North Dakota * .8 5.5 6.0 14.2 13.6 14.1 37.1 36.2 36.4OhioOklahoma
1,150.666.0
1,131.265.0
1,090.764.4 48.2 47.1 *49.6 122.1 119.9 119.9
Oregon 137.6 129.0 137.1 44.9 43.8 4\>. 3 101.8 100.5 99.8Pennsylvani a 1,379.2 1,362.1 1,350.3 337.9 294,9 325.3 668.3 662.6 6^9.0Khode Island 134.5 131.6 123.2 -16.0 16.0 17.0 50.8 5O.5 49.8oouth Carolina South Dakota
200.611.4
199.610.9
196.611.4
25.911.4
26.011.1
25.211.4 36.8 36.9 37.5
Tennessee 242.1 . 237.4 232.2 ■ 55.8 55.6 56.2 153.1 153.2 155.6Texas 337.4 337.0 328.7 226.1 224.3 217.1 507,0 504.3 491.2Utah 27.1 . 26.2 27.1 . 20.0 19.8 21.3 44.1 43.1 43.0Vermont 34.1+ . 33.9 3 3 .4 • 9.2 9.2 9-3 18,0 17.7 18.3VirginiaWashington
213.3109.6
211.4. 169.4
211.9180.5 64.4 62.9 65.1
5^.4156.1 154.1 157.9
West Virginia 131.4 129.6 125.9 51.5 50.2 84.9 84.2 84.2YJisconsin 4l8 .4 4ii.o 402.9 . .76.4 74.4 77.6 20?. 3 206.7 206.7Wyoming 5.7 . 5.5 6.5 ■ 15.1 14.4 13.4 17.5 16.6 17.6
~ee f o o tnotes at end of table and e x p l a n a t o r y notes, sections G and H*
Digitized for FRASER http://fraser.stlouisfed.org/ Federal Reserve Bank of St. Louis

/ hy State (in thousands.)
A : l 4TABLE 6: Employees in N o n a g r i c u l t u r a l E s t a b l i s h m e n t s by I n d u s t r y Division,
Finance Service Governmen tState 1950 ! 19^9 1950 . ■ 19^9 . 1950 . .1949. ..
June May j June June May June June May June
Alabama ■11 h 36.9 1 16.5 52.4 52.5 52.8 . 96.0. 97.4 94.6Arizona *4.0 4 .8 4.4 17.3 17.8 18.0 32.7 32.5 31.2Arkansas 7 .3 1 .3 35.2 35.1 33.7 48.7 50.1 49.3California lM-5.6 145.4 144.3 384.0 380.0 376.6 513.2 515.9 523.7Colorado 13.2 13.0 13.0 46.7 . 45.3 47.6 62.5 62.5 61.5Connecti cut 36.4 36.3 N.A. 76.9 75.7' N.A. 65.0 65.6 N.A.DelawareDist# of Columbia 21.8 21.3 2’1.3 < 00 • 2 J 5 8 . 2’,2/ 60.0 237.7
116,2
243.9FloridaGeorgia
32.624. 3
32.224.1
26.5'24.0 78.7 78.5 8O.6
.113.6114.8
112.2114.4
Idaho '3.? 3.6 > 4 14.2 i4 a 14.6. 23.2 23.6 23.1Illinois ■n : a . , N.A. 160.2 N.A. N.A. 365.4 N.A. N.A. 3 2 0 .6Indiana 3^.2 33.6 34.2 90.7 90.6 90.9 126.4 129.3 124.1Iowa 23.1 22.6 23.2 69.4 69.3 68.3 92.6 95.2 90.0Kansas l'6.l 15.9 15.5 46.6 46.9 46 .9 76.7 78.0 75*1KentuckyLouisiana 17.5 17'. 5 17.1 63.9 54.2 64.3 90 .4 91.6 90.2Maine- 6.7 6; 7 ■6.5 , 25.2 24.7 25.7 38.3 38.8 39.1Maryland % • ? 30.9 . 29.9 109.1 108.0 . 107.2 -91.7 91.8 91.5Massachusetts 78.6 77.8 77.3 3/ 199.4 i/201.3 2/202.1 206.4 205.7 202.2
Michigan Minneso ta 35.8 35.6 34.9 96.5 95.8 ' 97.0 108.5 111.3 108.5'MississippiMissouri ' N.A. 5°‘«5 ■51.9 N.A. 127.0 129.0 . N.A. 137.8 135.0Montana ? .9
16.23*.o 3.7 19.9 19.6 .27 .4 27.6 26.7
Nebraska 15i9 15.7 39.1 38.0 39.2 58.1 59.0 58.0Nevada 1.1 i;i 1.1 ' 12 . 0 11.2 12.0 .10.5 10.5 10.3New Hampshire« 4 .4 4 ;4 4 .4 19*9 17.7 19*7 19.4 19.7 19.1New Jersey 56.9 •56 iQ 57.7 164.9 161.5 165.8 167.3 169.6 163.9New Mexico 3.8 - 3i7 3-5 23.5 23.1 23.3 31.5 31.8 30.5,New York 383.7 384:0 382.0 774.8 769.7 . 766.6 658.1 660.3 643.0North Carolina North.Dakota
19.8
3.919 .‘4
3.820.0
3-4 13.2 13.1 12.9101.428.7
103.029.4
100.928.0
Ohi*Oklahoma 16,8 l6.-*>' 16*. 7 : '49-9 .50.1. 52.3 90.5 91.8 89 .4Oregon . l4 *2 14 ;0 i4.o ”46.9 46.0 46.6 .62.0 62.6 60.1.Pennsylvania 117.6 116 .-0 H 5.5 ,358.9 . :355*2 333-4 337.5 331 .;7Rhode ,Island . 10.5 10.4 io-. a 2 / 2 5 . 5 2/ 26.5 29.7 30.1 29.7South Carolina South JDakota 4.1 4.-0 4.0 '13.6 13.7 13.8
-59.030.6
60,530.9
61.-129*7
Tennessee • 22 ,4 22.1 22.2 ■78.0 77.7 77.5 104,8 105.4 101.2Texas 70.0 68.2 66.1 231.3 228 .6 232.1 266.8 270.3 264.7U tah 6-.1 6.-0 •5.8 19.0 18.1 . 19.I 42.0 42.1 43.8Vermont 2.9 2.8 2'. 8 H . O 10.6 10.9 .14.8 15.0 l4.2Virginia Washington 25.8 25.5 25.2 78.0 77.0 78.1 123.1 123.6 :124.7West Virginia 9*5 9 .^ 9.3 40.3 40.2 4i.i 55-7 57.2 55 .2Wiscons in 3l»^ 31.5 31.1 54.7 '95.6 91.3 122.3 124.3 118.2Wyoming. 1'.9 1*9 i»7' I0.8 9.1; 11.5. 14.5 14.5 14.0
See footnotes at end of table and e x p l a n a t o r y notes, sections G and H #
Digitized for FRASER http://fraser.stlouisfed.org/ Federal Reserve Bank of St. Louis

A : 15TABLii 6: Employees in N o n a g r i c u l t u r a l E s t a b l ishments, by Industry Division,
by State
See explanatory notes, sections G and H #
* The manufacturing series for taese. States are based on the SocialSecurity Bpard Classification (others are on the 19*+5 Standard Industrial Classifi cati on ) *
1/ Revised series; not strictly- comparable with previously published data#
2J Mining combined with contract construction*
3/ Mining combined with service*
N.A* - Not available*
Digitized for FRASER http://fraser.stlouisfed.org/ Federal Reserve Bank of St. Louis

AueTABLE 7t En^lcyees in Nomgricultuml Establishments “by Industry Division* Selected Areas
___ (in tbausaaods) _______ ___________ __
dumber of Employees Number of Employees'
1950 1 1949 1950 1949Jur*e Juw June , **«... J June
AHIZOrA C0r^T,TIOT (Contfd*)Phoenix Nor Britain (Contfd.)Mining • 1 *1 N.A* finance .5 .5 . 5fofcnufacturing 9.2 9.1 N*A* ‘ Service 1*1 1.1 1.1Trans* & Pub* Ut* JLj 6*9 7*1 N.A.Trade 19*7 19*7 N.A* New Ife,venFinance 3*1 3*2 N.A* Cent* Const* 2 ] N.A. N.A. 5.3Service 8*3 8.8 N.A. Jfenu&cturing 40.7 40.0 38*7
Trans* & Pub* Ut. IT. A* N.A. 13.2Tucson Trade N.A. SU. 19*9Mining 1*4 1.4 ' HA* Finance N.A. N.A. 4*7l&nnfacturing 1.6 1*7 N.A. Service H*A. N.A* 8*3Trans* & Pub* Ut* 1J 1*7 1*8 N.A*^rado 8*1 6.1 SUL WaterburyFinance *9 1.0 ,. tf»A* Cont* Const, 2 j N.A. N.A. 1*7Service 4*2 4*5 N.A. Manufacturing H.A. 39*2 35*5
Trans. & Pub* Ut# IT. A. IT. A. o* 5jm ^ s k s Trade N.A* N.A. 8*4Little Bock Hmnce N.A. N.A. 1.1Total 63*4 62*7 61*0 Service N.A. N.A. 2*2Cent* Const* 5*6 5.0 4*6Ifomfacturing 11.1 10.9 10.3 GEORGIATrans* & Pub* Ut* 6*8 6.8 6*7 AtlantaTrade 17*9 17*7 17*0 Manufacturing „ 57*9 58.6 56.3Fimnce 3*3 3*3 3.2Service 2 f 8*4 8*6 8*6 SavannahGrovaniiDent 10.6 10.6 10.8 Manufacturing 12.6 12*7 10,8
COlvltBJCTICUT i c m
. Bridgeport Des MoinesCont* Const* 2] N.A. N,A« 3*8 Manufacturing 19*2 18.8 18*2Wanufac tur ing 55.6 54*9 49*6Trans* & Pub* Ut* N.A* N.A. 4*9 KANSASTradu N.A. N.A. 16# 6 Topeka.^inancq N.A* N.A. 2*1 Totol 3&*0 37*0 38*8Service N.A* N.A. 5.3 Mining *1 *1 *1
Cont* Const* 1.6 *9 2*0Hertford Manufacturing 6*5 6.4 6.6Cont* Const* 2/ N.A* N.A* 7.1 Tmias* 4 Pub. Ut* 6*9 6.7 7.0Ifemfa ctur ing 60.7 60.3 57*9 Tmde 8*2 8*0 8*2Trsns* & Pub* Ut* N.A* N.A. 6*9 Finance 1*9 2.0 1.9^mde N.A. tf.A. 35*7 Service 4*4 4*4 4*5Finance N.A* N.A. 23*2 G-oVemiasnt 8*6 8*6 8.7Service N*A. N..W 9*9
WichitaNbir Britain Total 78*4 77*2 77.7Cont* Const* 2 f 1.0 1.0 1*0 Mining 1.3 1.3 1*4Manufacturing 25*1 24*4 22.7 Cont* Const. 5*0 4.7 4.7Trans, & Pub* Ut* 1*2 1*2 1.2 Mknufacturing 24*7 24.4 24.3Trade 4*3 4.3 4*4 Trans* & Pub. Ut* 6.8 6.7 7*3
See footnotes at end of table and explanatoiy notes, sections G, H, and I*
Digitized for FRASER http://fraser.stlouisfed.org/ Federal Reserve Bank of St. Louis

A:17
TABLE 7s Employees in Nonagricultural Establi shunts by Industry Division, Selected Areas
• ' (in thousands) -
Number of Employees Number of Eraployees1950 1949 1950 1949
June Mr*y. June Jttt*3 [ iks JuneKMTSVS "(Cont’d.) MISSOURI (Cont1 A*) iWichita (Cont’ d.) Kansas City (Cent* d* )
Tride 21*5 21* 3 21*3 ixsans* & Pub* Ut# ; 40*3 | 39*9 39.3Finance 3*7 3*6 3.5 Tirade 92*8 I 9 i a 89*9Service 8,7 8*6 8.S limnce 18*5 j 18*6 18*5Governck-at 6*8 6*7 6*5 Sbrvice ‘10.1 j 40*0 40*5
Government 20*6 | .20.6 20*8Louisiana |
New Orleans St* Louisi\
Manufacturing 47*8 47*4 48.2 J&jaufacturiag 3j 197,3 195*8 191.5
MNI-TESOTA. m t »
1
Dulutri BenoTotal 41,8 41.1 41.1 1! Mining i3 .3 *1Cont. Const* 2.2 2*0 25.1 Cont, Const, 2*7 1 .5 1*5Manufacturing 11*3 11*3 10. 5 Mmufac. tur ing 1.4 1*4 1*3Trans* & Pub* Ut* 7.1 6*9 7*0 Trans. & Pub. Ut* 1J l.l 1.1 1*2Trade 11* 5 10*3 10.7 Txnde 5*3 5.1 5.4Finance . 1.4 I*4 1*4 Finance •8 .8 *7
Service 2 / 5*2 5.0 5*3 Service . 5,3 5.1 '5*2Government 4*1 4*1 4*0
NEST JERSEYMinneapolis i Trenton
Total 2454 6 244*3 241*0 ji Manufacturing 44,5 43.6 40.3Cont, Const* 13*9 12.5 12*8Manufacturing 66*0 64*2 61*3 s m i m i o oTrans. & Pub* Ut* 24*7 25*4 24*9 AlbucruerqueTrade 75*0 75*0 76*3 Cont* Const* 6*2 6.2 5.6finance 16*1 16*1 15.9 %n.ufacturing 4*9 4.7 4.0Service 2 j 28*2 ' 28*1 ’ 28.7 Tinns. & Pub. Ut* i f 2*8 2*7 ' 2.4Government 21*8 23*1 a a Trade 11*1 11*1 9*6.
Finance 2*3 2*1 1.7St. Paul Service 2] 6*3 6*3 6.1
Total 140*2 139*4 136*0 *Cont. Const* 7*2 6*9 6.6 METC YC2E1'feufacturing 40*0 40.4 38*8 Albany «*Sch.etiect; vdy-TroyTrans* & Pub* t?t* 19*9 19*8 19*8 Mmufacti iv ing ?5i2 75*3 77.9is-tde 34i 5 33.9 33.2
Finance 8.4 8l3 8*3 B inghamt on«Er,d 1 cot t -Service zf 14.2 1440 14*2 Johnson CityGovernment 15*9 16.2 15* 2 Manufacturing zj 35.9 35.7 3548
MISSOURI BuffaloKansas City (including Uk m f'a c tur iiig 180*6 178.8 167.7feisas City, l&msas)total 319.3 314,1 310.2 ElmiraMinitig *9 *8 .7 Itonfacturing zj 14*8 14.5 13*1Sent* Const* 16*3 16.0 16.3Manufacturing Zj 89*9 87*3 84* 3
Sea footnotes nt end of table fttjd explanatory notes» Actions G» Hf and I*
Digitized for FRASER http://fraser.stlouisfed.org/ Federal Reserve Bank of St. Louis

A:l8TABLE 7: Employees in Nomgri cultural Establishments by Industry'Division, Selected Areas
(in thousands)
Number of Employees Kunioer of Eroployees1950 1S49 1950 1949
’ June Miy Juno . ‘ Juno May Jura-jIW YGBK (Caat*d.) * 5¥21NEStJEE (Coat'd.)King.ston~Newburgh~ Kpoxville (Coiit’d .)Poughkeepsie Finance 1.9 1.9 ■ 1 .8 .Manufacturing 34# 0 33.8.. 33.0 Service 8.1 8.1 ■ 8.2
Government 9.8 9.8 9.9New York CityManufacturing 935.7 9 4 2 .5 ’ 915.4 Memphis
Mining , .4 #4 .4Bachester Manufacturing 39.3 38.5 38.2Manufacturing 97.7 95.3 99# 4 ^irras. & Pub. Ut. 17.1 17.2 16.5
; Trade 39.0 ■ 39.1 39.9Syracuse FiniutcB 5# 5 5.4 5.3Manufacturing- 52.4* 51.5 48.5 Service 22.2 . 22.3 22.7
Government 13*4 13.4 14.1’ U t ica~Bo me ~He rki me r L ittle Falls, 'SishvilleManufacturing.. 42.9 42*7 ' 40.3 Manufacturing 32.5 33.2 30.4
NDBTH CABOLIWx m s -UNGTONCharlotte SeattleMtnufa ctur ing 20.1 19.9 19.3 Total 241.8 240# 5 248.3
Cent. Const# 13.9 13.0 13.3OlttAHCm Manufacturing 58.0 58.1 64.8
Oklahoma City Tmns. & Pub. Ut* 26.1 26.1 26.0Manufacturing 14.2 14.1 &A* Trade 64*6 64.6 63.5
finance 13.7 13. 5 13.9^ulsa •Service 2j 33.7 33.4 33.6!'4tnufactur ing . 17.2 IS. 7* N.A. Government 31.7 31.8 33.3
SOUTH GftPOLim. SpokaneCharleston ^otal 64*2 63.4 64.4Manufacturing 8.3 8.6 8.9 Cent. Const# 4.3 4.3 4.9
Muiufac tur ing 12.5 12.3 11.9TENNESSEE Trans. & Pub. Ut# 10.6 10.3 10.7
Qhattfinooga Trade 18.0 17.6 17.4Mining .2 ♦ 3 4. Finance 2.9 2.8 2.8Manufacturing 38.7 38.3 35.8 Service 2j 9.3 9.3 9.4Tians, & Pub. Ut. 5.2 5.1 5.0 Government 6.7 6.7 7.4Trade 14.6 15.0 13,6Finance 2.3 2.3 2.5 Tf;'C0TT).Service 9.7 9.5 9.4 Total 66.0 64.5 64*7Government 7.9 7.7 7.1 Cont. Const# 4*1 3.8 4.0
Minufac tur ing 19.3 i 18.4 17.8Knoxville Trans. & Pub. Ut. 6 .5 6.5 6 .4Mining 1.2 1.2 1.3 Tm-de 13.9 13.8 13.9Manufacturing 27.7 27.6 26.1 Finance 2# 3 2.3 2.2Trans. & Pub. Ut. S« 5 6.5 6.8 Service 2j S. 7 6.7 6.8'^nde 14# 4 14,4 14.5 Government 13.2 |! 13,1 13.7
1J Excludes interstate railroads*2j Includes mining and quarrying*Zj Bevised series; not stric tly comparable with previously published data# N#A. ~ Hot available.
See explanatory notes s, sections G, H and I.
Digitized for FRASER http://fraser.stlouisfed.org/ Federal Reserve Bank of St. Louis
A; 19
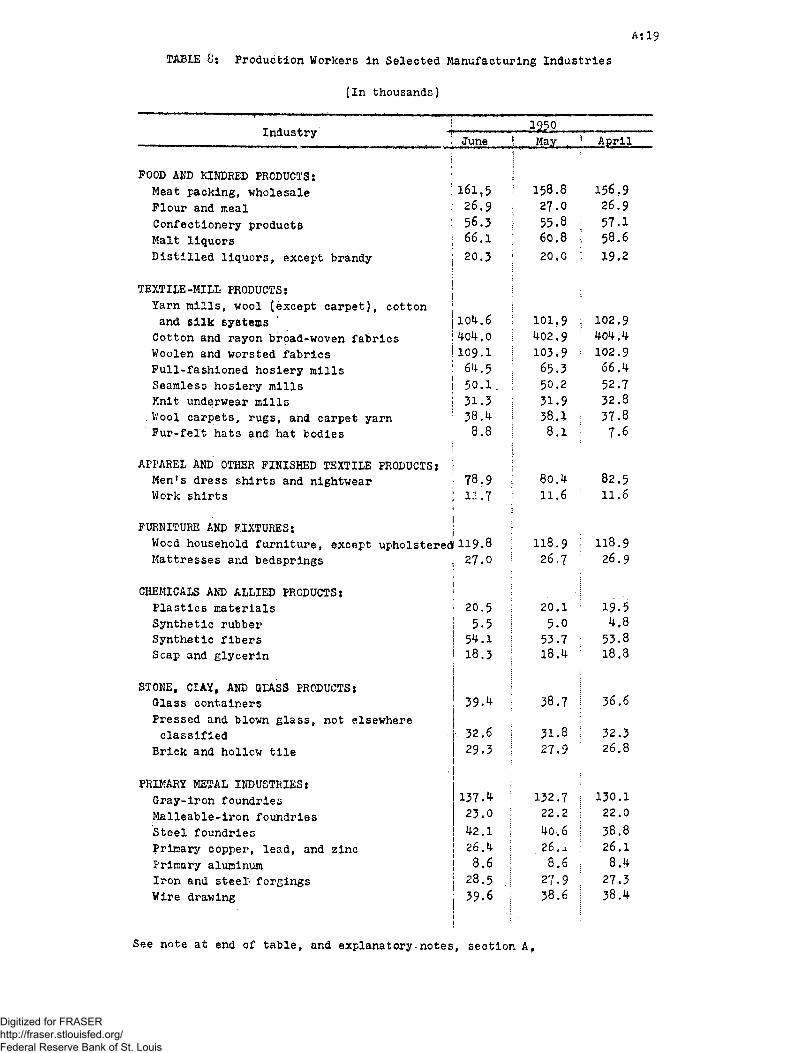
TABLE 0: Production Workers In Selected Manufacturing Industries
(In thousands)
IndustryJune April
jFOOD AND KINDRED PRODUCTS: !
Meat packing, wholesale !161,5 1 158.8 156.9
Flour and meal ' 26.9 27.0 26.9
Confectionery products i 56.3 55.8 57.1
Malt liquors j 66.1 60.8 58.6
Distilled liquors, except brandy j 20.3 20.0 19.2
TEXTILE-MILL PRODUCTS: j Yarn mills, wool (except carpet), cotton jand eilk systems ‘ |104.6 101.9 102.9
Cotton and rayon broad-woven fabrics |404,0 402.9 404,4
Woolen and worsted fabrics ! 109.1 103.9 ' 102.9
Full-fashioned hosiery mills | 64.5 65.3 66.4Seamless hosiery mills \ 50.1. 50.2 52.7
Knit underwear mills i 31.3 31.9 32.8.Wool carpets, rugs, and carpet yarn 38.4 38.. 1 37.8
Fur-felt hats and hat bodiesj
8.8 8.1 7.6
APPAREL AND OTHER FINISHED TEXTILE PRODUCTS:
Men*s dress shirts and nightwear 78.9 80.4 82.5
Work shirts jj
11.7 11.6 11.6
FURNITURE AND FIXTURES; j
Wood household furniture, except upholstered! 119.8 118.9 118.9Mattresses and bedsprings ,
i27.0 26.7 26.9
ICHEMICALS AND ALLIED PRODUCTS:
I1
Plastics materials 20.5 20.1 19.5
Synthetic rubber 5-5 5.0 4,8
Synthetic fibers 54.1 53.7 : 53.8
Scap and glycerin 1i 18.3 18.4 18.8
STONE, CIAY, AND GLASS PRODUCTS:
Glass containers 39.4 38.7 36.6
Pressed and blown glass, not elsewhere j
classified 32.6 31.8 32.3
Brick and hollow tile 29.3 27.9 26.8
PRIMARY METAL INDUSTRIES:
Gray-iron foundries 137.4 132.7 130.1
Malleable-iron foundries 23.0 22.2 22.0
Steel foundries 42.1 40.6 38.8
Primary copper, lead, and zinc 26.4 26.1 26.1Primary aluminum 8.6 8.6 8.4
Iron and steel’ forgings 28.5 27.9 27.3
Wire drawing 39.6 38.6 38.4
See note at end of table, and explanatory-notes, section A,
Digitized for FRASER http://fraser.stlouisfed.org/ Federal Reserve Bank of St. Louis

A:20
TABLE S: Production Workers in Selected Manufacturing Industries (Continued)
(In thousands)
Industry1i j , irjl . , 1950!! June !! May » April
FABRICATED’METAL PRODUCTS (EXCEPT ORDNANCE,
MACHINERY, AND TRANSPORTATION EQUIPMENT):
Cutlery and edge tools
i ! 1! 22.7[ 23.1 23.1
Hand tools, not elsewhere classified, files,
hand saws, and saw blades 1 32.0 31.8 31.4
Hardware, not elsewhere classified | 73.5 71.7 70.7
Metal plumbing fixtures and fittings ' 28.4|28.1 27.9
Oil burners, heating and cooking apparatus,
not elsewhere classified
I
! 76.5 73.6 72.5
Structural and ornamental products i 57.4 55.6 54.3
Boiler shop products I ^ . 9 45.5 • 44.4
Metal stampings 1 113.9 108.3 102.3
MACHINERY (EXCEPT ELECTRICAL):
Tractors i 65.9 56.4 66.0
Farm machinery, except tractors 73,2 73.0 74.8
Machine tools 38.7 37.7 37.0
Metalworking machinery, not elsewhere
classified ! 35.8 . 35.2 34.5
Cutting tools, jigs, fixtures, etc. i 62.8 60.5 60.1Computing and related machines j 34.2 33.9 33.7
Typewriters j 17,9 17.8 17.4
Refrigeration machinery ! 111.3 112.3; 105.8Machine shops I 35.3 33.7 32.2
ELECTRICAL MACHINERY:
Radios and related- products
ii
150.9 146.0 .143.7
Telephone and telegraph equipment and
communication equipment, not elsewhere
classified 1 34.71 34.6 34,8
TRANSPORTATION EQUIPMENT:
Locomotives'and parts 20.4 20.5 20.0
Railroad and streetcars 30.4 28,4 24.7
MISCELLANEOUS MANUFACTURING INDUSTRIES*
Silverware and plated ware 16.9 17.0 17.0
See explanatory notes, section A,
NOTE: These series include production and related workers who worked during, or received
pay for, the pay period ending nearest the 15th of the month. The series are based on the
levels of employment indicated by the 19^7 Census of Manufactures and have been carried forward by use of the employment changes reported by the BLS monthly sample of
cooperating establishments. The. series shown in this table are not comparable with data
shown in table 2 of this Report, since the latter are adjusted to 19^7 levels indicated
by data from the social insurance programs. Data from January 19^7 a**e available upon
request to the Bureau of Labor Statistics. Such requests should specify the series for
which data are desired.
Digitized for FRASER http://fraser.stlouisfed.org/ Federal Reserve Bank of St. Louis

EXPLANATORY NOTES
Section A, Scope of the BLS Employment Series - The Bureau of Labor Statistics
publishes each month the number of employees in all aonagricultural establishments and in
the 8 major Industry divisions: mining, contract construction, manufacturing, transporta
tion and public utilities, trade, finance, service, and government. Both all-employee and
production-worker employment series are also presented for 21 major manufacturing groups,
10? separate manufacturing industries, and the durable and nondurable goods subdivisions.
Within nonmanufacturing, total employment information is published for 34 series, Production-worker employment is also presented for most of the industry components of the
mining division.
Beginning*with the March 1950 issue of this Regort, table 'f shows production-
worker data for 53 new Industries. These series are based on the levels of employment
Indicated by the 19^7 Census of Manufactures-and have been carried forward by use of the employment changes reported by the BLS monthly sample of cooperating establishments.
These series are not comparable with the data shown in table 2 since the latter are ad
justed to 1947 levels indicated by data from the social insurance programs..
Hours and earnings Information for manufacturing and selected nonmanufacturing
industries are published monthly in the Hours and Earnings Industry Report and in the"
Monthly Labor Review,
Section B # Definition of Employment - For privately operated establishments
in the nonagricultural industries the ELS employment Information covers all full- and
part-time employees who were on the ray roll, i.e., who worked during, or received pay
for, the pay period ending nearest the 15th of the month. For Federal establishments the
employment period relates to the pay period ending prior to the first of the month; in
State and local governments, during the pay period ending on or just before the last of
the month* Proprietors, self-employed persons, domestic servants, unpaid family workers,
and members of the armed forces are excluded from the ‘employment information.
Section C. Comparability With Other Employment Data - The Bureau of Labor
Statistics employment series differ from the Monthly Report on the Labor. Force in the
following respects: (1 ) The BLS series are based on reports from cooperating establish
ments, while the MRLF is based on employment information obtained from household inter
views; (2) persons who worked in more than one establishment during the reporting period would be counted more, than .once in the BLS series, but not' in the MRLF; (3) the BLS infor
mation covers all full^ and part-time wage and salary workers in private noftagricultural
establishments who:worked during, or received pay for, the pay period ending nearest the
15th of the month; in Federal establishments during the pay period ending just before the first of the month; and in State and local government during the pay period ending on or
just before the last of the month, while the MRIP series relates to the calendar week which
contains the 8th day of the month; (4) proprietors, self-employed persons, domestic
servants, and unpaid family workers are excluded from the BLS but not the MELF series.
Section D. Methodology - Changes in the level of employment are based.on
reports from a sample group of establishments, inasmuch as full coverage is prohibitively
costly and time-consuming. In using a sample, it is essential that a complete count
or “bench mark" be established from which the series may be carried forward. Briefly,
the BLS computes employment data as follows: first, a bench mark or level of employment
is determined; second, a -sample of establishments is selected; and third, changes in
employment indicated by this reporting sample* are applied to the bench mark to determine
the monthly employment between bench-mark periods. An illustration of the estimation
procedure used in those Industries for which both all-employee and production-worker
employment information Is published follows: The latest production-worker employment
- i -
Digitized for FRASER http://fraser.stlouisfed.org/ Federal Reserve Bank of St. Louis

bench mark for a given industry was 50*000 in January. According to the BLS reporting
sample, 60 establishments in that industry employed 25,000 workers in -January and
26,000 in February, an increase of 4 percent. The February figure of 52,000 would be
derived by applying the change for identical establishments reported in the January-
February sample to the bench marks
50,000 x 26,000 ( or 1 . 04) » 52,000 25,000
The estimated all-employee level of 65,000 for February is then determined by using that month!s sample ratio (.800) of production workers to total employment,
^ l o o *or m u ltlPlie d 1.25) = 65,000}.
When a new bench mark becomes available, employment data prepared since the
last bfcnch mark are reviewed to determine if any adjustment of level is required* In
general, the month-to-month changes in employment reflect the. fluctuations shown by
establishments reporting to the BLS, while the level of employment is determined by
the bench mark*
The pay-roll index is obtained by dividing the total weekly pay roll for a
given month by the average weekly pay roll in 1939* Aggregate weekly pay rolls for all
manufacturing industries combined are derived by multiplying gross average weekly
earnings by production-worker employment,
Section E* Sources of Sample Data - Approximately 120,000 cooperating
establishments furnish monthly employment and pay-roll schedules, by mail, to the
Bureau of Labor Statistics. In addition, the Bureau makes use of data collected by
the Interstate Commerce Commission, the Civil Service Commission and the Bureau of the
Census.
APPROXIMATE COVERAGE OF MONTHLY SAMPLE USED-IK
BLS EMPLOYMENT AND PAY-ROLL STATISTICS
Division or *
industry ♦
EmployeesNumber of
establishments'. ,, , „ ....: r ..: ,J5- '
Number in t
sample :
Percent
of total
Mining 2,700 460,000 **7Contract construction 15,000 450,000 23Manufacturing 35,200 8,845,000 62Transportation and public, utilities':
Interstate railroads (ICC) — 1,359,000 98Rest of division (BLS) 10,500 1,056,000 41
Trade 46,300 1,379,000 15Finance 6,000 281,000 16Service:
Hotels 1,200 115,000 25Laundries and cleaning and dyeing:plants 1,700 86,000 1?
Government:
Federal (Civil Service Commission) 1,885,000 100State and local (Bureau of Census--
quarterly) 2,400,000 62
- ii -
Digitized for FRASER http://fraser.stlouisfed.org/ Federal Reserve Bank of St. Louis

Section P. Sources of Bench-Mark Data - Reports from Unemployment Insurance
Agencies presenting (1) employment in firms liable for contributions to State unemploy
ment compensation funds, and (2) tabulations from the Bureau of Old-Age and Survivors Insurance on employment in firms exempt from State unemployment insurance laws because of their small size comprise the basic sources of bench-mark data for nonfarm employment. Most of the employment data in this report have buen adjusted to levels indicated by these sources for 191i7• Special bench marks are used for industries not covered by the Social Security program. Bench marks for State and local government are based on data compiled by the Bureau of the Census, while information on Federal Government employment is made available by the U. S. Civil Service Commission. The Interstate Commerce Commission is the source for railroads.
Bench marks for production-worker employment are not available on a regular basis. The production-worker series are, therefore, derived by applying to all-employee bench marks the ratio of production-worker employment to total employment, as determined from the Bureau*s Industry samples.
Section G. Industrial Classification - In the BLS employment and hours and earnings series, reporting establishments are classified into significant economic groups on the basis of major postwar product or activity as determined from annual sales data. The following references present the industry classification structure currently used in the employment statistics program*
(1) For manufacturing industries - Standard Industrial Classification Manual, Vol. I, Manufacturing
Industries, Bureau of the Budget, November 19^5;
(2) For nonmanufacturing Industries - Industrial Classification Code, Federal Security Agency,Social Security Board, 19^2*
Section H* State Employment - State data are collected and prepared in cooperation with various State Agencies as indicated below. The series have been adjusted to recent data made available by State Unemployment Insurance Agencies and the Bureau of Old-Age and Survivors Insurance. Since some States have adjusted to more recent bench marks than others, and because varying methods of computation are used, the total of the State series differs from the national total. A number of States also make available more detailed industry data and information for earlier periods which may be secured directly upon request to the appropriate State Agency.
The following publications are available upon request from the BLS Regional Offices or the Bureau’s Washington Office:
Nonagricultural Employment, by State, 1947 48-49j
Employment in Manufacturing Industries, by State,
1947^48^49 (in process).
- iii -
Digitized for FRASER http://fraser.stlouisfed.org/ Federal Reserve Bank of St. Louis

COOPERATING STATE AGENCIES
Alabama - Department of Industrial Relations, Montgomery 5.Arizona - Unemployment Compensation Division, Employment Security Commission, Phoenix. Arkansas - Employment Security Division, Department of Labor,.Little Rock.California - Division of Labor Statistics and Research, Department of Industrial Relation's,
San Francisco 1.Colorado - Department of Employment Security, Denver 2.Connecticut - Employment Security Division, Department of Labor and Factory Inspection,
Hartford 5*Delaware Federal Reserve Bank of Philadelphia, Philadelphia 1, Pennsylvania,District of Columbia - U. S. Employment Service for D. C., Washington 25#Florida - Unemployment Compensation Division, Industrial Commission, Tallahassee*Georgia - Employment Security Agency, Department of Labor, Atlanta 3*Idaho - Employment Security Agency, Boise,Illinois - Division of Placement and Unemployment Compensation, Department of Labor,
Chicago - 54.Indiana - Employment Security Division, Indianapolis 9*Iowa - Employment Security Commission, Des Moines 9,Kansas - Employment Security Division, State Labor Department, Topeka*Kentucky - Bureau of Employment Security, Department of Economic Security, Frankfort* Louisiana - Division of Employment Security, Department of Labor, Baton Rouge 4*Maine - Employment Security Commission, Augusta.Maryland - Employment•Security Board, Department of Employment Security, Baltimore 1. Massachusetts - Division of Statistics, Department of Labor and Industries, Boston 10. Michigan - Unemployment Compensation Commission, Detroit 2f*Minnesota - Division of Employment and Security, St. Paul 1.Mississippi - Employment Security Commission, Jackson.Missouri - Division of Employment Security, Department of Labor and Industrial Relations,
Jefferson City.Montana - Unemployment Compensation Commission, Helena.Nebraska « Division of Employment Security, Department of Labor, Lincoln 1.Nevada - Employment Security Department, Carson City.New Hampshire - Employment Service and Unemployment Compensation Division, Bureau of
Labor, Concord.New Jersey - Department of Labor and Industry, Trenton 8.New Mexico- Employment Security Commission, Albuquerque.New York - Bureau of Research and Statistics, Division of Placement and Unemployment
Insurance, New York Department of Labor, 342 Madison Avenue, New ’York 17.North Carolina - Department of Labor, Raleigh.North Dakota - Unemployment Compensation Division, Bismarck.Ohio - Bureau of Unemployment Compensation, Columbus 16.Oklahoma - Employment Security Commission, Oklahoma City 2.Oregon - Unemployment Compensation Commission, Salem.Pennsylvania - Federal Reserve Bank of Philadelphia, Philadelphia 1 (mfg*)j Bureau of
Research.and Information, Department of Labor and Industry, Harrisburg (nonmfg*).
Rhode Island - Department of Labor, Providence 2*South Carolina - Employment Security Commission, Columbia 10*South Dakota - Employment Security Department, Aberdeen.
- iv -
Digitized for FRASER http://fraser.stlouisfed.org/ Federal Reserve Bank of St. Louis

Tennessee - Department of Employment Security, Nashville 3.
Texas - Employment Commission, Austin.19.
Utah - Department of Employment Security, Industrial Commission, Salt Lake City 13.
Vermont - Unemployment Compensation Commission, Montpelier.
Virginia - Division of Research and Statistics, Department of Labor and Industry, Richmond.
Washington - Employment.Security Department, Olympia.
West Virginia - Department of Employment Security, Charleston.
Wisconsin - Industrial Commission, Madison 3.
Wyoming - Employment Security Commission, Casper*
Section I. Area Employment - Figures on area employment are prepared by
cooperating State agencies# The methods of adjusting to bench marks and of making
computations used to prepare State employment are also applied in preparing area infor
mation* Hence, the appropriate qualifications should also be observed. For a number of
areas, data in greater Industry detail and for earlier periods can be obtained by
writing directly to the appropriate State agency,
GLOSSARY
All Employees or Wage and Salary Workers - In addition to production and related workers
as defined elsewhere, Includes workers engaged in the following activities: executive,
purchasing, finance, accounting, legal, personnel (including cafeterias, medical, etc.),
professional and technical activities, sales, sales-delivery, advertising, credit collection,
and in installation and servicing of own products, routine office functions, factory
supervision (above the working foremen level). Also includes employees on the establish
ment pay roll engaged in new construction and major additions or alterations to the
plant who are utilized as a separate work force (force-account construction workers).
Continental United States - Covers only the 48 States and the District of Columbia.
Contract Construction - Covers only firms engaged in the construction business on a
contract basis for others. Force-account construction workers, i.e., hired directly
by and on the pay rolls of Federal, State, and local government, public utilities, and
private establishments, are excluded from contract construction and included in the
employment for such establishments.
Defense Agencies - Covers civilian employees of the Department of. Defense (Secretary of
Defense; Army, Air Force, and Navy), Maritime Commission, National Advisory Committee
for Aeronautics, The Panama Canal, Philippine Allen Property Administration, Philippine
War Damage Commission, Selective Service System, National Security Resources Board,National Security Council.
Durable Goods - The durable goods subdivision includes the following major groups:
ordnance and accessories; lumber and wood products (except furniture); furniture and
fixtures; stone, clay, and glass products; primary metal industries; fabricated metal
products (except ordnance, machinery, and transportation equipment); machinery (except
electrical); electrical machinery; transportation equipment; instruments and related
products; and miscellaneous manufacturing industries,
- v
Digitized for FRASER http://fraser.stlouisfed.org/ Federal Reserve Bank of St. Louis

Federal Government - Executive Branch - Includes Government corporations (including
Federal Reserve Banks and mixed-ownership banks of the Farm Credit Administration) and
other activities performed by Government personnel in establishments such as navy yards,,
arsenals, hospitals, and on force-account construction. Data, which are based mainly
on reports to the Civil Service Commission, are adjusted tp maintain continuity of
coverage and definition with information for former periods.
Finance - Covers establishments operating i*i the fields of finance, insurance, and real
estate; excludes the Federal Reserve Banks and the mixed-ownership banks of the Farm
Credit Administration which are included under Government.
Government Covers Federal, State, and local governmental establishments performing
legislative, executive, and judicial functions, as well as all government-operated
establishments and institutions (arsenals, navy yards, hospitals, etc.), government
corporations, and government force-account construction. Fourth-class postmasters
are excluded from table 1, because they presumably have other major Jobs; they are
included, however, in table 5 .
Indexes of Manufacturing Production-Worker Employment - Number of production workers
expressed as a percentage of the average employment in 1939.
Indexes of Manufacturing Production-Worker Weekly Pay Rolls - Production-worker weekly
piay rolls expressed as a percentage of the average weekly pay roll for 1939.
Manufacturing - Covers only privately-operated establishments; governmental manufacturing
operations such as arsenals and navy yards are excluded from manufacturing and included
with government.
Mining - Covers establishments engaged in the extraction from the earth of organic and
inorganic minerals which occur in nature as solids, liquids, or gases; includes various
contract services required in mining operations, such as removal of overburden,
tunnelling and shafting, and the drilling or acidizing of oil wells; also includes ore
dressing, beneficiating, and concentration.
Nondurable Goods The nondurable goods subdivision includes the following major groups:
food and kindred products; tobacco manufactures; textile-mill products; apparel and
other finished textile products; paper and allied products; printing, publishing, and
allied industries; chemicals and allied products; products of petroleum and coal;
rubber products; and leather and leather products.
- vi
Digitized for FRASER http://fraser.stlouisfed.org/ Federal Reserve Bank of St. Louis

Pay Rolls - Private pay rolls represent weekly pay rolls of both full- and part-time
production and related workers who worked during, or received pay for, any part of the
pay period ending nearest the 15th of the month, before deductions for old-age and unemployment insurance, group insurance, withholding tax, bonds, and union dues; also,
includes pay for sick leave, holidays, and vacations taken. Excludes cash payments
for vacations not taken, retroactive pay not earned during period reported, value of
payments in kind, and bonuses, unless earned and paid regularly each pay period. Federal
civilian pay rolls cover the working days in the calendar month.
Production and Related Workers - Includes working foremen and all nonsupervisory workers
(including lead men and trainees) engaged in fabricating, processing, assembling, inspec
tion, receiving, storage, handling, packing, warehousing, shipping, maintenance, repair,
janitorial, watchman services, product development, auxiliary production for plant*s own
use (e.g., power plant), and record-keeping and other services closely associated with
the above production operations.
Service - Covers establishments primarily engaged in rendering services to individuals
and business firms, including automobile repair services. Excludes all government-
operated services such as hospitals, museums, etc., and all domestic service employees.
Trade - Covers establishments engaged in wholesale trade, i.e., selling merchandise to
retailers, and in retail trade, i.e., selling merchandise for personal or household
consumption, and rendering sex’vices incidental to the sales of goods.
Transportation and Public Utilities - Covers only privately-owned and operated enter
prises engaged in providing all types of transportation and related services; telephone,
telegraph, and other communication services; Dr providing electricity, gas, steam, water,
or sanitary service. Government operated establishments are included under government,
Washington, D. C« - Data for the executive branch of the Federal Government also include
areas in Maryland and Virginia which are within the metropolitan area, as defined by the
Bureau of the Census,
:l s 51- 537)
- vii -
Labor - D.C,
Digitized for FRASER http://fraser.stlouisfed.org/ Federal Reserve Bank of St. Louis
Related Documents


