Employment and employment conditions in the current economic crisis in Croatia GORAN VUKŠIĆ, PhD* Article** JEL: J01, J21, J30, J41, J81 doi: 10.3326/fintp.38.2.1 * The author would like to thank two anonymous referees for their useful comments and suggestions. The paper is a part of the research project “The impact of the current economic crisis on employment and employment conditions in Croatia” financed by the Friedrich Ebert Foundation. ** Received: March 24, 2014 Accepted: April 28, 2014 Goran VUKŠIĆ Institute of Public Finance, Smičiklasova 21, 10000 Zagreb, Croatia e-mail: [email protected]

Welcome message from author
This document is posted to help you gain knowledge. Please leave a comment to let me know what you think about it! Share it to your friends and learn new things together.
Transcript
go
ra
n vu
kšić:
emplo
ym
ent a
nd em
ploy
men
t co
nd
ition
s in the c
ur
ren
t eco
no
mic c
risis in c
ro
atiafin
an
cia
l theo
ry an
d pr
ac
tice
38 (2) 103-138 (2014)103Employment and
employment conditions in the current economic crisis in Croatia
GORAN VUKŠIĆ, PhD*
Article**JEL: J01, J21, J30, J41, J81doi: 10.3326/fintp.38.2.1
* The author would like to thank two anonymous referees for their useful comments and suggestions. The paper is a part of the research project “The impact of the current economic crisis on employment and employment conditions in Croatia” financed by the Friedrich Ebert Foundation.
** Received: March 24, 2014 Accepted: April 28, 2014
Goran VUKŠIĆInstitute of Public Finance, Smičiklasova 21, 10000 Zagreb, Croatiae-mail: [email protected]
go
ra
n vu
kšić:
emplo
ym
ent a
nd em
ploy
men
t co
nd
ition
s in the c
ur
ren
t eco
no
mic c
risis in c
ro
atiafin
an
cia
l theo
ry an
d pr
ac
tice
38 (2) 103-138 (2014)
104 abstractThe goal of this research is to analyze developments in employment and em-ployment characteristics during the current crisis in Croatia. The main findings can be summarized as follows: (1) The primary (aggregate) mode of adjustment to the crisis was a decline in employment. There are, however, considerable diffe-rences in adjustment patterns across economic activities. (2) During the crisis, jobs were lost in the, more dynamic, private sector, while the number of jobs in the public sector (entities in state ownership) slightly increased. (3) Economic activi-ties with comparatively larger shares of women in employment have experienced fewer employment cuts and the aggregate employment share of women rose du-ring the crisis, especially in activities with a larger share of public sector workers. (4) There has been a declining share of younger workers during the crisis, ju-stifying policy actions to facilitate their employment. (5) Employees with compa-ratively lower educational attainment face severe challenges in the labor market, which is a longer term trend, not specific to the crisis period. There are indications that this group of employees enjoys a higher level of protection in the public sec-tor. (6) Analysis also shows a rising significance of more flexible forms of em-ployment: increasing shares of fixed term employees (during the last two observed years), and of part time workers. (7) Working hours do not exhibit any strong trends specific to the crisis, except for the diminishing number of overtime hours per worker.
Keywords: employment, wages, employment conditions, crisis, Croatia
1 introductionThe current economic crisis has put pressure on many private companies, but also state owned enterprises and other public sector entities to cut costs. Many of them reduced their labor force and/or the wages of their employees. In addition to these negative effects, there may have been changes in other employment characteristics, such as full time and part time employment, employment for an unspecified vs. a fixed period of time, number of hours worked, etc. These effects may have differed across different groups of employees as distinguished by gender, age or educational attainment. Also, there may be differences depending on the type of ownership (private vs. state ownership).
The goal of this research is to analyze developments in employment and employment characteristics described above, using sectoral data for Croatia between 2009 and 2012. The methods applied are descriptive statistical analysis and regression analysis. The paper is structured as follows: the second section gives a short and selective review of related literature. The third section presents a brief overview of the main characteristics of the Croatian labor market and aggregate and sectoral trends and developments of employment, real gross wages and employment characteristics for the period between 2000 and 2012. The fourth part of the study looks deeper into sectoral data for the years of crisis between 2009 and
go
ra
n vu
kšić:
emplo
ym
ent a
nd em
ploy
men
t co
nd
ition
s in the c
ur
ren
t eco
no
mic c
risis in c
ro
atiafin
an
cia
l theo
ry an
d pr
ac
tice
38 (2) 103-138 (2014)1052012, by performing regression analysis in order to gain more insight into the
factors affecting the trends in employment and employment characteristics. The last section discusses the results, gives a summary of conclusions and some policy implications.
2 related researchThe impact of economic crises on labor market developments in general, and of the current crisis specifically, has been the subject of numerous research papers. This section reviews some of the existing empirical work for the current crisis, but it also supplements the insights by taking into account the available lessons from previous crises episodes. It should be noted that many of the studies of the impact of the current crisis on labor market developments are restricted by the fact that the most recent data come with a time lag, so that the available information may be suited only for an analysis using descriptive statistics and not for more sophisticated econometric analysis. The most common concerns of the existing related research are the (un-)employment of women and young workers and the adjustment patterns of the labor market to economic shocks, i.e. the question whether employment decline dominates over real wages decline, or whether the quality of jobs is deteriorating, some types of employment becoming more dominant during the crisis.
Khanna, Newhouse and Paci (2010) present early evidence on the labor market impact of the current crisis for 41 middle-income countries. They state that the number of jobs did not change much – employment growth did slow down, but only moderately, with positive growth rates being recorded in the crisis for the majority of observed countries. Still, the reduction in employment growth in Eastern European countries turned out to be more severe. The authors also highlight the differences according to exchange rate regimes, those countries with a fixed exchange rate experiencing stronger employment declines.1 However, reduction in real earnings growth has been much sharper and accounted for almost three quarters of the wage bill growth decline on average, but with stark differences across countries. The major factor behind the reduction in earnings was found to be a decline in the number of hours worked, but the shift in employment away from the better-paid jobs in the industrial sector also played an important role.
Another important study covering the labor market effects of the current crisis for a number of countries is the article by Cho and Newhouse (2013). They examine the impact of the crisis on different types of workers in 17 middle-income coun-tries and find that young workers experienced the most striking shift from wage employment to unemployment. Many of them also exited the labor force, as self-employment did not turn out to be a strong buffer against shocks. They were either laid-off disproportionally much or failed to be hired after exiting schools. As for
1 The exchange rate regime is also found to be highly relevant for the labor market effects of the crisis, for a number of countries experiencing severe financial crises in the 1990s (Fallon and Lucas, 2002).
go
ra
n vu
kšić:
emplo
ym
ent a
nd em
ploy
men
t co
nd
ition
s in the c
ur
ren
t eco
no
mic c
risis in c
ro
atiafin
an
cia
l theo
ry an
d pr
ac
tice
38 (2) 103-138 (2014)
106 the differing impact on workers by gender, men are found to be hit more severely by this crisis than women, unlike in most of the past crises. The authors explain this by men’s higher initial employment rates, and the concentration of men workers in industries that experienced more severe deterioration of economic conditions. Furthermore, they emphasize the possibility that firms substituted away from men workers because of the gender wage gap, i.e. because they tend to be more expensive. As for the differences in the effects of the crisis across emplo yees with different educational backgrounds, the study finds surprisingly small differences, again, unlike in most of the past crises. Still, employees at the extreme ends of the education distributions tended to suffer smaller declines, i.e. workers with medium education level suffered relatively more in the crisis.2 Cho and Newhouse (2013) further report mixed evidence on the impact of crisis on urban and rural workers, with the former experiencing larger employment cuts, but also stronger increases in working hours and earnings.
As mentioned above, many related studies deal with the impact of crisis on women’s employment. Sabarwal, Sinha and Buvinic (2011) review the evidence from the existing research and discuss it in the context of the current crisis (for which there were no available analyzes at the time their study was written). Besides the possibility that female workers are more exposed to sectors hit harder in the current crisis (especially in lower-income countries), the authors believe that the direct adverse effects of the economic decline may be more pronounced for women than they have been historically, because of women’s increased participation in the globalized labor force generally. The second-round effects should depend on strategies adopted to cope with the negative shocks which are expected to differ across countries and households, depending on age and education. According to evidence from past crises, labor force participation of women is more likely to increase for low-income households and in low-income countries, for less educated and older women. This is in line with some results from Signorelli, Choudhry and Marelli (2012) who analyze the impact of past financial crises (between 1980 and 2005) for a large number of countries and try to assess the likely impact of the present crisis on female employment indirectly (given the time lag in data and lack of more explicit studies), by considering some aspects of this crisis and the results for the past episodes. They find that the impact of past crises on the participation rate of women is negative and significant only for high- income and upper middle-income countries. However, for some developed countries men workers were hit more severely by the current crisis as they dominate in the employment of the sectors experiencing stronger economic downturns.3 The results from Cho and Newhouse (2013) given above also show that the hypothesized, and
2 Leung, Stampini and Vencatachellum (2009) analyze whether human capital helps to protect workers from adverse shocks in a country study for South Africa in the present crisis. They find that education and experience are largely able to offset the negative impact of the crisis on the likelihood of employment.3 Barakat et al. (2010) come up with the same conclusion by observing the unemployment rates for men and women in EU-27.
go
ra
n vu
kšić:
emplo
ym
ent a
nd em
ploy
men
t co
nd
ition
s in the c
ur
ren
t eco
no
mic c
risis in c
ro
atiafin
an
cia
l theo
ry an
d pr
ac
tice
38 (2) 103-138 (2014)107expected, stronger negative impact on female workers did not materialize for
middle income countries either.
As for the impact of the current crisis on young workers, Ha et al. (2010), present data showing a disproportionate adverse impact on young workers for large number of countries (mostly developed, but also for some emerging economies). They argue that such development meant a further relative deterioration of the labor market position of young people, as their unemployment rates were much higher than for other age groups of workers even before the crisis. The authors find the position of young, low-educated workers to be especially challenging. Further-more, there are already indications of increasing long-term youth unemployment in the majority of the observed countries. The authors also emphasize the observed pattern of decreasing youth participation rates, i.e. the trend for discouraged young people to leave the labor market altogether, as well as the trend for the increasing incidence of temporary and especially of part time jobs among young workers, visible since the beginning of the crisis in many of the observed coun-tries. Barakat et al. (2010) also document more pronounced negative effects of the crisis on young workers for European economies, when compared to older workers (age 55 to 64). They see potential reasons in the differences in employment contracts, as older employees largely hold indefinite contracts and enjoy better protection. They also stress that with rigid labor markets, it is mainly the inflows to the labor market that are affected, i.e. the younger workforce is affected disproportionally. Further analysis and support for the outlined conclusions are found in Scarpetta, Sonnet and Manfredi (2010), Bell and Blanchflower (2010, 2011) and Verick (2009). Bell and Blanchflower (2010, 2011) especially emphasize the potential longer-term consequences of youth unemployment while Verick (2009) stresses that young men were hit especially hard.
The only study known to the author of this research that analyzed the impact of current crisis on the Croatian labor market is that by Matković, Arandarenko and Šošić (2010). By observing data in the first year of the crisis, i.e. in 2009, and comparing these with pre-crisis period, the authors conclude that there has been a significant fall in employment in the crisis, but of smaller magnitude than the fall in GDP; employment cuts were the primary adjustment channel to deteriorating economic conditions, but later in 2009, real wages also started to decline; average working hours declined only marginally; crafts and small entrepreneurs were hit somewhat harder by the crisis, while public sector workers were protected; men were hit harder by employment declines, mostly due to their dominance in sectors which experienced more severe economic downturn, and some of them withdrew from the labor market; young workers face even larger challenges than before the crisis; and there has been an increase in the share of persons who had a working contract for an unspecified period of time, but lost their job.
go
ra
n vu
kšić:
emplo
ym
ent a
nd em
ploy
men
t co
nd
ition
s in the c
ur
ren
t eco
no
mic c
risis in c
ro
atiafin
an
cia
l theo
ry an
d pr
ac
tice
38 (2) 103-138 (2014)
108 3 trends and developments 2000-2012This section presents the main features of the Croatian labor market, as well as the developments of the relevant indicators for the period between 2000 and 2012. There is a problem with data at sectoral level, since the classification of economic activities has changed from NCEA2002 to NCEA2007 during the observed period. The consequence is that sectoral data for most of indicators are not comparable across the whole period from 2000 to 2012. For this reason, the data are presented on an aggregate level, except for data on real gross wages and employment in legal persons, which were recalculated (reclassified) backwards to 2000 by the Croatian Bureau of Statistics (CBS), according to the new classification standard NCEA2007. This has important consequences for the regression analysis in the fourth section as well, because it limits the time dimension of the available data. The pre-crisis period is defined from 2000 to 2008, while the period after 2008 is considered crisis. This corresponds to real GDP growth rates which were positive between 2000 and 2008 and negative afterwards (i.e. it equaled zero in 2011).4
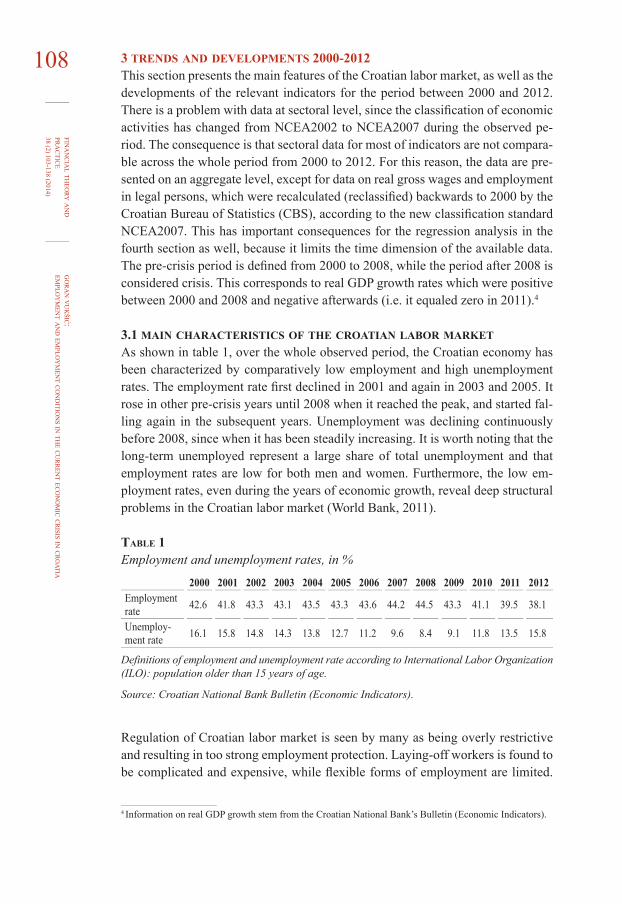
3.1 main characteristics of the croatian labor marketAs shown in table 1, over the whole observed period, the Croatian economy has been characterized by comparatively low employment and high unemployment rates. The employment rate first declined in 2001 and again in 2003 and 2005. It rose in other pre-crisis years until 2008 when it reached the peak, and started falling again in the subsequent years. Unemployment was declining continuously before 2008, since when it has been steadily increasing. It is worth noting that the long-term unemployed represent a large share of total unemployment and that employment rates are low for both men and women. Furthermore, the low employment rates, even during the years of economic growth, reveal deep structural problems in the Croatian labor market (World Bank, 2011).
table 1Employment and unemployment rates, in %
2000 2001 2002 2003 2004 2005 2006 2007 2008 2009 2010 2011 2012Employment rate 42.6 41.8 43.3 43.1 43.5 43.3 43.6 44.2 44.5 43.3 41.1 39.5 38.1
Unemplo yment rate 16.1 15.8 14.8 14.3 13.8 12.7 11.2 9.6 8.4 9.1 11.8 13.5 15.8
Definitions of employment and unemployment rate according to International Labor Organization (ILO): population older than 15 years of age.
Source: Croatian National Bank Bulletin (Economic Indicators).
Regulation of Croatian labor market is seen by many as being overly restrictive and resulting in too strong employment protection. Laying-off workers is found to be complicated and expensive, while flexible forms of employment are limited.
4 Information on real GDP growth stem from the Croatian National Bank’s Bulletin (Economic Indicators).
go
ra
n vu
kšić:
emplo
ym
ent a
nd em
ploy
men
t co
nd
ition
s in the c
ur
ren
t eco
no
mic c
risis in c
ro
atiafin
an
cia
l theo
ry an
d pr
ac
tice
38 (2) 103-138 (2014)109Some researchers saw this as the primary cause of low labor market dynamics, as
described by job flows (jobs turnover), i.e. comparatively low job destruction and job creation rates, thus, leading to high unemployment and low employment rates (Rutkowski, 2003a; 2003b).5 The comparison of the employment protection legislation (EPL) index for Croatia with other European countries was supportive for the assessment of Croatian labor market as comparatively inflexible, especially before the Labor Act was amended in July 2003 (Matković and Biondić, 2003). This was particularly the case for the components of EPL index describing temporary employment and collective dismissals, but also for employment for an unspecified period of time, i.e. regular employment (Rutkowski, 2003b). Even after this reform, the EPL index for Croatia remained above the EU average in all its components (the higher the index value, the stronger the employment protection), as well as above the average for eight Central and Eastern European countries, except for the component of collective dismissals (Šošić, 2004).
Thus, the main features of the proposed reforms in 2003 consisted of introducing more flexibility, although the sharpness of the initially suggested reforms was mitigated in the negotiation process. As outlined by Matković and Biondić (2003), more flexibility was primarily brought about by introducing and regulating the activities of Temporary Work Agencies (which act as an intermediary in tempo-rary employment). Critics of the 2003 Labor Act reform suggested that, although the legislation may have been quite restrictive, it was not the cause of comparatively static labor markets because legislation has been poorly enforced. Šošić (2004) analyzed this issue and concluded that there have been important differences across sectors of ownership with regard to employment dynamics, i.e. that job flow rates in the private sector (especially in new companies) have been high, but that stringent regulation slowed down the process of restructuring in the government sector (and in privatized companies). He thus expected more flexibility to contribute to the speed of restructuring in these last two segments of economy. However, according to calculations presented in Šošić (2008), in the three years after the reforms, these expectations did not materialize, as demonstrated by job flow rates by firm ownership.
Further reforms in labor regulation were contained in the new Labor Act from 2009, which entered into force in the beginning of 2010. Changes were mostly related to the adjustment of the existing legislation to that of European Union (see Pavičić, 2010). The new Labor Act was amended in 2011 (see Pavičić, 2011) and in 2013 (see Vidović, 2013). However, even after the introduction of new legislation and the aforementioned amendments, the same or similar aspects of labor
5 Rutkowski (2003a) analyzed other potential explanations for unsatisfactory labor market outcomes, such as unemployment benefit system, labor taxation, the wage structure, and skill and spatial mismatches, but found that they did not significantly contribute to the poor labor market performance of the Croatian economy. In the more recent World Bank reports, however, the skills gap, design of the social security system, labor market institutions (role of the trade unions, pro-labor biased labor courts, collective agreements, especially in the public sector, etc.) are stressed as additional causes of poor labor market performance, next to high employment protection (World Bank, 2009; 2010; 2011).
go
ra
n vu
kšić:
emplo
ym
ent a
nd em
ploy
men
t co
nd
ition
s in the c
ur
ren
t eco
no
mic c
risis in c
ro
atiafin
an
cia
l theo
ry an
d pr
ac
tice
38 (2) 103-138 (2014)
110 market legislation remain an important point of criticism in policy discussions and assessments. Clauwaert and Schömann (2013) review the set of labor market-related reform recommendations to the Croatian government made by the World Bank and the IMF during the crisis, showing that the primary concern is still the suggested inflexibility of the Croatian labor market. For example, conclusions by the World Bank (2011), stress that it is very difficult for employers in Croatia to adjust their labor inputs by adjusting employment or by adjusting the rigidly regulated working hours.
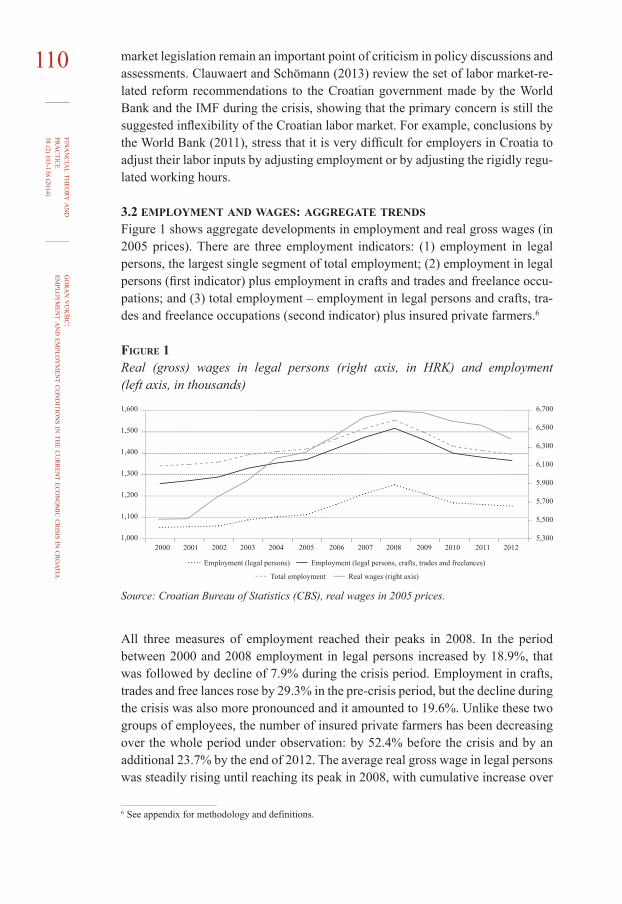
3.2 employment and wages: aggregate trendsFigure 1 shows aggregate developments in employment and real gross wages (in 2005 prices). There are three employment indicators: (1) employment in legal persons, the largest single segment of total employment; (2) employment in legal persons (first indicator) plus employment in crafts and trades and freelance occupations; and (3) total employment – employment in legal persons and crafts, trades and freelance occupations (second indicator) plus insured private farmers.6
figure 1Real (gross) wages in legal persons (right axis, in HRK) and employment (left axis, in thousands)
1,600
1,500
1,400
1,300
1,200
1,100
1,000
6,700
6,500
6,300
6,100
5,900
5,700
5,500
5,300
Employment (legal persons) Employment (legal persons, crafts, trades and freelances)
2000 2001 2002 2003 2004 2005 2006 2007 2008 2009 2010 2011 2012
Total employment Real wages (right axis)
Source: Croatian Bureau of Statistics (CBS), real wages in 2005 prices.
All three measures of employment reached their peaks in 2008. In the period between 2000 and 2008 employment in legal persons increased by 18.9%, that was followed by decline of 7.9% during the crisis period. Employment in crafts, trades and free lances rose by 29.3% in the pre-crisis period, but the decline during the crisis was also more pronounced and it amounted to 19.6%. Unlike these two groups of employees, the number of insured private farmers has been decreasing over the whole period under observation: by 52.4% before the crisis and by an additional 23.7% by the end of 2012. The average real gross wage in legal persons was steadily rising until reaching its peak in 2008, with cumulative increase over
6 See appendix for methodology and definitions.
go
ra
n vu
kšić:
emplo
ym
ent a
nd em
ploy
men
t co
nd
ition
s in the c
ur
ren
t eco
no
mic c
risis in c
ro
atiafin
an
cia
l theo
ry an
d pr
ac
tice
38 (2) 103-138 (2014)111the pre-crisis period amounting to 21.5%. The crisis brought a decline in amount
of 4.6%.7
If one considers employment only in legal persons and compares it to the real wage developments, both of these variables in 2012 (1,153 thousand employees with an average real gross wage of HRK 6,395) were slightly below their respective levels in 2006 (1,160 thousand employees with an average wage in amount of HRK 6,428). Although relative employment decline in legal persons was stronger than real wage decline (as described by negative growth rates), employment increases between 2006 and 2008 were also higher than for the wages. However, the adjustment in crisis for this, the largest segment of employees, was more pronounced on the employment reduction side in the first two years of the crisis (as in other Eastern European countries, according to Cho and Newhouse, 2013), while real wages declined faster than employment in 2012 (in 2011 the intensity of adjustment was roughly the same).
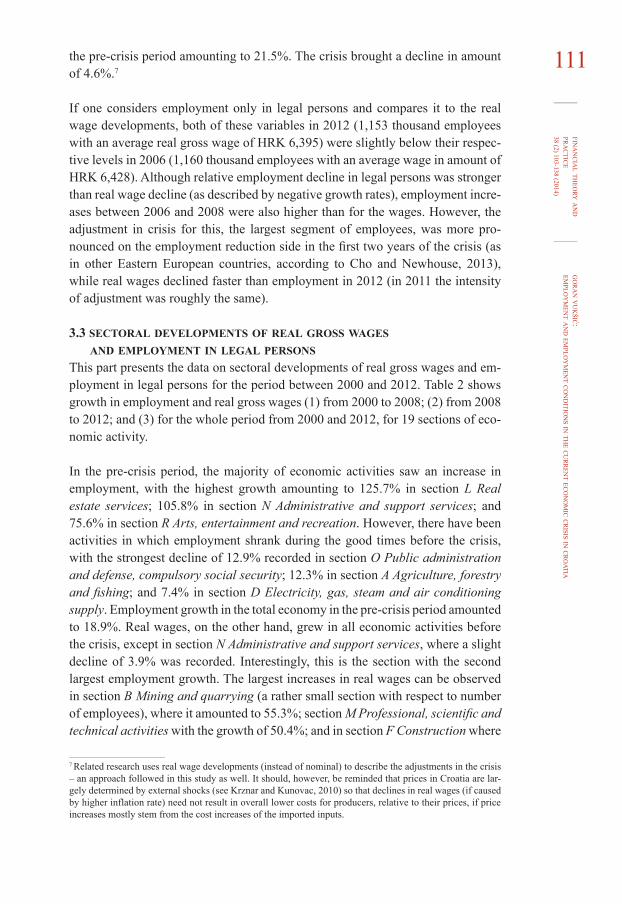
3.3 sectoral developments of real gross wages and employment in legal persons
This part presents the data on sectoral developments of real gross wages and employment in legal persons for the period between 2000 and 2012. Table 2 shows growth in employment and real gross wages (1) from 2000 to 2008; (2) from 2008 to 2012; and (3) for the whole period from 2000 and 2012, for 19 sections of economic activity.
In the pre-crisis period, the majority of economic activities saw an increase in employment, with the highest growth amounting to 125.7% in section L Real estate services; 105.8% in section N Administrative and support services; and 75.6% in section R Arts, entertainment and recreation. However, there have been activities in which employment shrank during the good times before the crisis, with the strongest decline of 12.9% recorded in section O Public administration and defense, compulsory social security; 12.3% in section A Agriculture, forestry and fishing; and 7.4% in section D Electricity, gas, steam and air conditioning supply. Employment growth in the total economy in the pre-crisis period amounted to 18.9%. Real wages, on the other hand, grew in all economic activities before the crisis, except in section N Administrative and support services, where a slight decline of 3.9% was recorded. Interestingly, this is the section with the second largest employment growth. The largest increases in real wages can be observed in section B Mining and quarrying (a rather small section with respect to number of employees), where it amounted to 55.3%; section M Professional, scientific and technical activities with the growth of 50.4%; and in section F Construction where
7 Related research uses real wage developments (instead of nominal) to describe the adjustments in the crisis – an approach followed in this study as well. It should, however, be reminded that prices in Croatia are largely determined by external shocks (see Krznar and Kunovac, 2010) so that declines in real wages (if caused by higher inflation rate) need not result in overall lower costs for producers, relative to their prices, if price increases mostly stem from the cost increases of the imported inputs.
go
ra
n vu
kšić:
emplo
ym
ent a
nd em
ploy
men
t co
nd
ition
s in the c
ur
ren
t eco
no
mic c
risis in c
ro
atiafin
an
cia
l theo
ry an
d pr
ac
tice
38 (2) 103-138 (2014)
112 the change over the pre-crisis period amounted to 38.5%. The growth of real gross wages before the crisis for the whole economy approximately equaled 21.5%.
table 2Sectoral developments of employment and real gross wages in legal persons, in %
employ ment Real wages(1) (2) (3) (4) (5) (6)
changes in periods 2008/00 2012/08 2012/00 2008/00 2012/08 2012/00Sectors (sections):A Agriculture, forestry and fishing 12.3 4.1 15.9 20.7 3.2 16.8B Mining and quarrying 8.1 -36.8 31.7 55.3 10.4 39.2C Manufacturing 0.3 16.7 16.9 27.3 4.9 21.0D Electricity, gas, steam and air conditioning supply 7.4 1.9 9.2 26.0 0.0 26.0
E Water supply; sewerage, waste management and remediation activities 31.3 3.8 36.2 21.2 6.7 13.1
F Construction 65.4 27.4 20.0 38.5 10.1 24.4G Wholesale and retail trade; repair of motor vehicles and motorcycles 45.7 16.6 21.5 31.9 5.7 24.5
H Transportation and storage 2.2 -8.6 6.6 36.3 4.9 29.6I Accommodation and food service activities 21.7 1.6 19.8 28.2 4.3 22.7
J Information and communication 19.9 4.0 24.7 15.5 0.1 15.6K Financial and insurance activities 25.6 1.4 27.3 15.3 1.1 14.1L Real estate activities 125.7 20.4 171.8 12.7 5.6 6.4M Professional, scientific and technical activities 54.9 2.5 51.0 50.4 11.2 33.6
N Administrative and support service activities 105.8 13.6 133.8 3.9 14.0 17.3
O Public administration and defense; compulsory social security 12.9 0.2 13.1 2.7 4.7 2.2
P Education 21.8 7.5 30.9 14.8 3.5 10.8Q Human health and social work activities 13.2 6.9 21.0 8.7 -6.8 1.3R Arts, entertainment and recreation 75.6 6.3 86.6 22.2 -8.9 11.3S Other service activities 46.1 1.2 47.8 20.2 4.7 14.6Total economy 18.9 7.9 9.5 21.5 4.6 16.0Descriptive statistics by sections:Minimum 12.9 -36.8 31.7 3.9 14.0 17.3Maximum 125.7 20.4 171.8 55.3 0.1 39.2Mean 33.2 2.7 31.5 23.3 -5.8 16.1Standard deviation 38.7 13.8 51.7 14.9 3.8 13.2
Source: Author’s calculations based on data from CBS.
During the crisis, employment declined in 10 out of 19 sectors of economic activities, with the largest fall of 36.8% recorded in B Mining and quarrying; 27.4% in F Construction; and 16.7% in C Manufacturing. Interestingly, employment in three sections with the highest pre-crisis employment growth considerably increased also during the crisis. Employment in the overall economy (in legal persons)
go
ra
n vu
kšić:
emplo
ym
ent a
nd em
ploy
men
t co
nd
ition
s in the c
ur
ren
t eco
no
mic c
risis in c
ro
atiafin
an
cia
l theo
ry an
d pr
ac
tice
38 (2) 103-138 (2014)113decreased by 7.9% during the crisis. Real wages, on the other hand, declined in 17
out of 19 activities after 2008 and the fall for the whole economy equaled 4.6%. One can observe quite large heterogeneity in sectoral developments of employment and wages, given the fact that not all activities were equally exposed to a negative economic shock and/or had a quite different adjustment patterns. For example, the sectors with the largest two employment cuts in the crisis were also characterized by the comparatively large declines in real wages (sections B Mi-ning and quarrying and F Construction). At the same time, section N Administra-tive and support service activities recorded the second largest increase in employment and the largest drop in wages during the crisis.
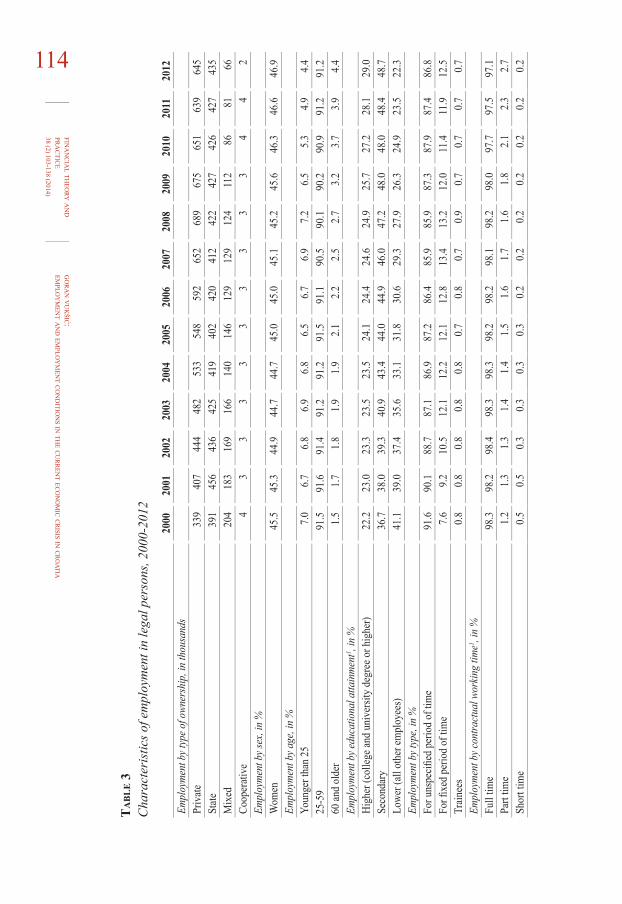
3.4 employment characteristicsTable 3 gives developments of a number of employment characteristics for the period from 2000 to 2012. The presentation is restricted to legal persons, as these indicators are available only for this employment segment. The first part of table 3 shows the number of workers by ownership: state, private and mixed ownership and workers in cooperatives, although this is a negligible segment as regards the number of employees. These data are not shown in shares like most of other indicators, since it is particularly interesting to see whether, especially during the crisis, the actual number of workers has been decreasing or increasing in legal entities with specific type of ownership. It is clear that private sector contributed the most to strong employment increases prior to the crisis.8 Although this may partly result from the privatization process, the number of jobs in privately owned entities increased by a much larger amount than the absolute value of net job losses in other legal persons. At the same time, the number of employees in entities with mixed ownership decreased substantially, while that in the public sector (entities in state ownership) rose slightly.9 However, while this slight increase in the number of public sector workers continued throughout the crisis as well, a number of jobs in the private sector were lost (number of employees dropped from 689 thousand in 2008 to 645 in 2012) and the decline in the number of employees in entities with mixed ownership continued at a faster rate.
The share of female employment decreased slightly at the beginning of the observed period, but started increasing after 2004. During the crisis, the rise in share of female employment accelerated, reaching its peak in 2012 when it amounted to nearly 47%. Thus, it seems that men workers have been hit by the crisis more than women.
8 When referring to the data analyzed in this text, private sector employment is defined as the employment in entities in private ownership, while public sector workers are those employed in entities in state ownership. 9 Again, privatization of state owned enterprises should have a negative partial effect on number of public sector employees. However, it may increase the number of employees in entities with private and/or mixed ownership, depending on whether a company has been fully privatized. Furthermore, there may be cases in which the state as the co-owner (mixed ownership) decides to sell its (remaining) shares, which is a (further) privatization of firms in mixed ownership. This should, per se, then lead to an increase in private sector employment and to a decline in the number of employees in entities with mixed ownership.
go
ra
n vu
kšić:
emplo
ym
ent a
nd em
ploy
men
t co
nd
ition
s in the c
ur
ren
t eco
no
mic c
risis in c
ro
atiafin
an
cia
l theo
ry an
d pr
ac
tice
38 (2) 103-138 (2014)
114
ta
bl
e 3
Cha
ract
eris
tics o
f em
ploy
men
t in
lega
l per
sons
, 200
0-20
12
2000
2001
2002
2003
2004
2005
2006
2007
2008
2009
2010
2011
2012
Empl
oyme
nt b
y typ
e of o
wner
ship
, in
thou
sand
sPr
ivate
339
407
444
482
533
548
592
652
689
675
651
639
645
State
391
456
436
425
419
402
420
412
422
427
426
427
435
Mix
ed20
418
316
916
614
014
612
912
912
411
286
8166
Coop
erati
ve4
33
33
33
33
34
42
Empl
oyme
nt b
y sex
, in
%W
omen
45.5
45.3
44.9
44.7
44.7
45.0
45.0
45.1
45.2
45.6
46.3
46.6
46.9
Empl
oyme
nt b
y age
, in
%Yo
unge
r tha
n 25
7.0
6.7
6.8
6.9
6.8
6.5
6.7
6.9
7.2
6.5
5.3
4.9
4.4
255
991
.591
.691
.491
.291
.291
.591
.190
.590
.190
.290
.991
.291
.260
and
olde
r1.
51.
71.
81.
91.
92.
12.
22.
52.
73.
23.
73.
94.
4Em
ploy
ment
by e
duca
tiona
l atta
inme
nt1 , i
n %
High
er (c
olleg
e and
uni
versi
ty d
egre
e or h
ighe
r)22
.223
.023
.323
.523
.524
.124
.424
.624
.925
.727
.228
.129
.0Se
cond
ary
36.7
38.0
39.3
40.9
43.4
44.0
44.9
46.0
47.2
48.0
48.0
48.4
48.7
Lowe
r (all
oth
er em
ploy
ees)
41.1
39.0
37.4
35.6
33.1
31.8
30.6
29.3
27.9
26.3
24.9
23.5
22.3
Empl
oyme
nt b
y typ
e, in
%Fo
r uns
pecifi
ed p
erio
d of
tim
e91
.690
.188
.787
.186
.987
.286
.485
.985
.987
.387
.987
.486
.8Fo
r fixe
d pe
riod
of ti
me
7.6
9.2
10.5
12.1
12.2
12.1
12.8
13.4
13.2
12.0
11.4
11.9
12.5
Train
ees
0.8
0.8
0.8
0.8
0.8
0.7
0.8
0.7
0.9
0.7
0.7
0.7
0.7
Empl
oyme
nt b
y con
tractu
al w
orkin
g tim
e1 , in
%Fu
ll tim
e98
.398
.298
.498
.398
.398
.298
.298
.198
.298
.097
.797
.597
.1Pa
rt tim
e1.
21.
31.
31.
41.
41.
51.
61.
71.
61.
82.
12.
32.
7Sh
ort t
ime
0.5
0.5
0.3
0.3
0.3
0.3
0.2
0.2
0.2
0.2
0.2
0.2
0.2
go
ra
n vu
kšić:
emplo
ym
ent a
nd em
ploy
men
t co
nd
ition
s in the c
ur
ren
t eco
no
mic c
risis in c
ro
atiafin
an
cia
l theo
ry an
d pr
ac
tice
38 (2) 103-138 (2014)115
2000
2001
2002
2003
2004
2005
2006
2007
2008
2009
2010
2011
2012
Hour
s wor
ked1 , h
ours
by e
mplo
yee
Total
num
ber o
f hou
rs pe
r wor
ker
2,11
62,
104
2,09
12,
087
2,09
62,
080
2,07
92,
081
2,08
92,
075
2,07
32,
064
–Ho
urs a
ctuall
y wo
rked
1,71
91,
720
1,70
81,
718
1,72
71,
712
1,70
11,
688
1,69
61,
687
1,69
41,
689
–Ho
urs n
ot ac
tuall
y wo
rked
– p
aid w
ithin
the l
egal
entit
y27
727
127
427
326
926
226
427
526
927
527
026
9–
Hour
s not
actu
ally
work
ed –
paid
out
of a
lega
l ent
ity97
8879
6669
7580
8491
8888
84–
Non
paid
hou
rs2
11
12
22
11
11
1–
Over
time h
ours
2124
2829
2929
3233
3224
2021
–1 S
ee a
ppen
dix
for d
efin
ition
s.
Sour
ce: C
BS a
nd a
utho
r’s c
alcu
latio
ns b
ased
on
CBS
dat
a.
go
ra
n vu
kšić:
emplo
ym
ent a
nd em
ploy
men
t co
nd
ition
s in the c
ur
ren
t eco
no
mic c
risis in c
ro
atiafin
an
cia
l theo
ry an
d pr
ac
tice
38 (2) 103-138 (2014)
116 As for the groups of employees by age, the shares for the three groups have been roughly constant in the pre-crisis period, but after 2008, the share of young workers (younger than 25 years of age) decreased from 7.2% in 2008 to only 4.4% in 2012, which is the lowest value during the observed period. This development after 2008 went hand in hand with a slight increase in the share of workers bet-ween 25 and 59 years of age and a more pronounced rise in the share of emplo yees aged 60 or older.
Looking at the data on employment shares by educational attainments, one observes a clear trend of steadily decreasing share for the group of workers with comparatively lower education throughout the whole period. Exactly the opposite developments can be seen for shares of workers with secondary school and those with higher educational attainment.
The next two indicators refer to the shares of workers by type of employment (employed for an unspecified period of time, fixed period of time or as trainees), and to employees by contractual working time (full, part or short time workers).
Obviously, employees for an unspecified period of time dominate over the whole period under observation, but their share is characterized by a slowly diminishing trend before the crisis, with the lowest values in 2007 and 2008, followed by a small increase over the next two years and a slight decline in 2011 and 2012. Since the share of trainees has been rather constant (and small), data on workers employed for a fixed period of time give a mirror picture of those employed for an unspecified period, i.e. their share reached its peak of more than 13% in 2007.
The share of full time employees was rather constant in the pre-crisis period and exceeded the value of 98% in each of these years. In the crisis, however, this share declined slightly, but steadily, from 98.2% in 2008 to 97.1% in 2012. While the share of short time workers remained largely unchanged after 2002 (and rather small), the share of part time employees rose from 1.2% in 2000 to 2.7% at the end of the observed period. Thus, although the share is still very small, it has more than doubled, mostly in the years of the crisis.
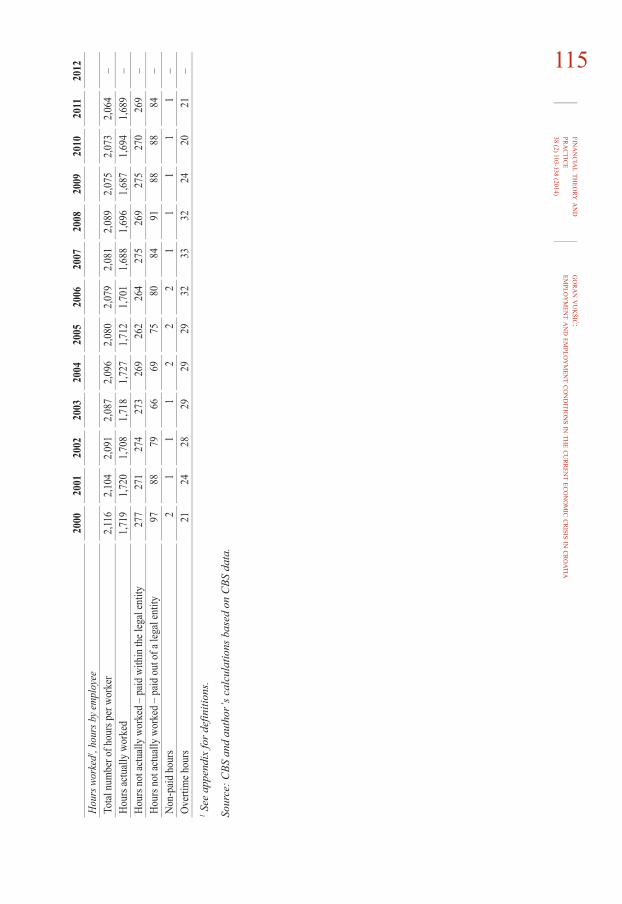
The last part of table 3 shows data on hours worked. These are available only for the period until 2011 and they do not display any strong upward or downward trends, not overall, nor in the periods before and during the crisis. There is a slight decline in total number of hours and the hours actually worked in the crisis, but these numbers were declining also in part of the period before the crisis, i.e. this is not something specific for the crisis period. The only exception in this respect may be the number of overtime hours per worker which reached the highest values in the period between 2006 and 2008, after which there was a significant decline.
go
ra
n vu
kšić:
emplo
ym
ent a
nd em
ploy
men
t co
nd
ition
s in the c
ur
ren
t eco
no
mic c
risis in c
ro
atiafin
an
cia
l theo
ry an
d pr
ac
tice
38 (2) 103-138 (2014)1174 developments in the crisis
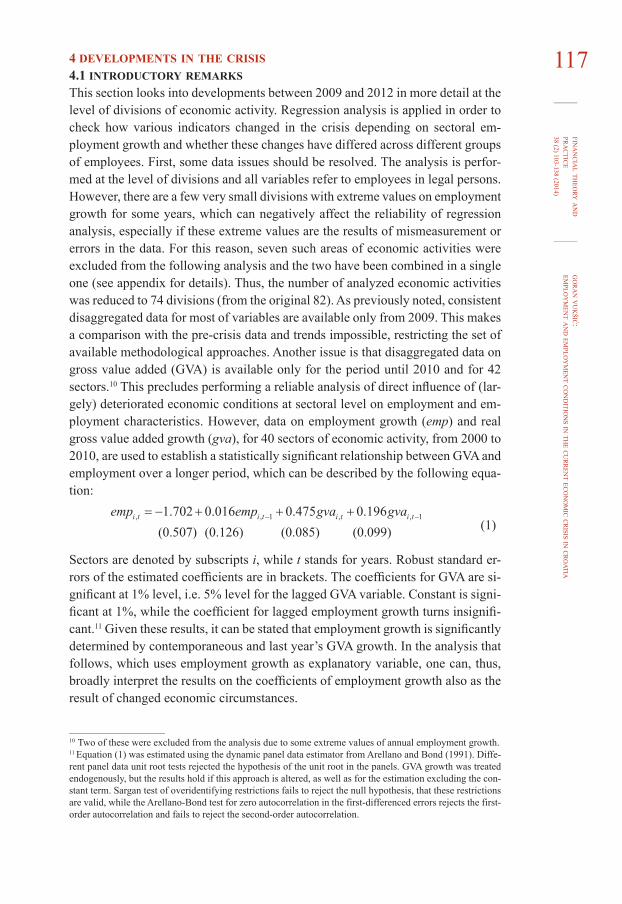
4.1 introductory remarksThis section looks into developments between 2009 and 2012 in more detail at the level of divisions of economic activity. Regression analysis is applied in order to check how various indicators changed in the crisis depending on sectoral employment growth and whether these changes have differed across different groups of employees. First, some data issues should be resolved. The analysis is performed at the level of divisions and all variables refer to employees in legal persons. However, there are a few very small divisions with extreme values on employment growth for some years, which can negatively affect the reliability of regression analysis, especially if these extreme values are the results of mismeasurement or errors in the data. For this reason, seven such areas of economic activities were excluded from the following analysis and the two have been combined in a single one (see appendix for details). Thus, the number of analyzed economic activities was reduced to 74 divisions (from the original 82). As previously noted, consistent disaggregated data for most of variables are available only from 2009. This makes a comparison with the pre-crisis data and trends impossible, restricting the set of available methodological approaches. Another issue is that disaggregated data on gross value added (GVA) is available only for the period until 2010 and for 42 sectors.10 This precludes performing a reliable analysis of direct influence of (largely) deteriorated economic conditions at sectoral level on employment and employment characteristics. However, data on employment growth (emp) and real gross value added growth (gva), for 40 sectors of economic activity, from 2000 to 2010, are used to establish a statistically significant relationship between GVA and employment over a longer period, which can be described by the following equation:
(1)
Sectors are denoted by subscripts i, while t stands for years. Robust standard errors of the estimated coefficients are in brackets. The coefficients for GVA are significant at 1% level, i.e. 5% level for the lagged GVA variable. Constant is significant at 1%, while the coefficient for lagged employment growth turns insignificant.11 Given these results, it can be stated that employment growth is significantly determined by contemporaneous and last year’s GVA growth. In the analysis that follows, which uses employment growth as explanatory variable, one can, thus, broadly interpret the results on the coefficients of employment growth also as the result of changed economic circumstances.
10 Two of these were excluded from the analysis due to some extreme values of annual employment growth.11 Equation (1) was estimated using the dynamic panel data estimator from Arellano and Bond (1991). Different panel data unit root tests rejected the hypothesis of the unit root in the panels. GVA growth was treated endogenously, but the results hold if this approach is altered, as well as for the estimation excluding the constant term. Sargan test of overidentifying restrictions fails to reject the null hypothesis, that these restrictions are valid, while the Arellano-Bond test for zero autocorrelation in the first-differenced errors rejects the first-order autocorrelation and fails to reject the second-order autocorrelation.
go
ra
n vu
kšić:
emplo
ym
ent a
nd em
ploy
men
t co
nd
ition
s in the c
ur
ren
t eco
no
mic c
risis in c
ro
atiafin
an
cia
l theo
ry an
d pr
ac
tice
38 (2) 103-138 (2014)
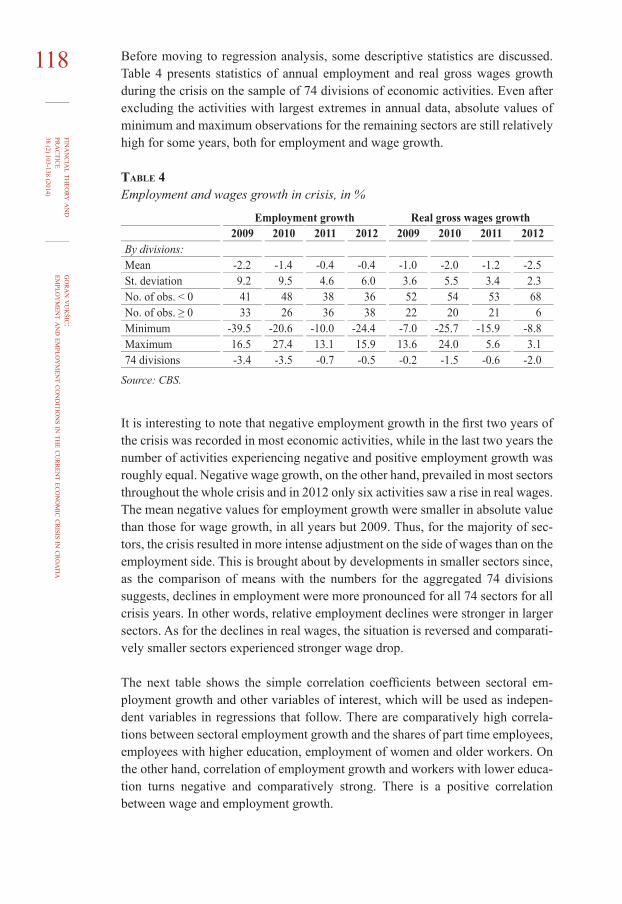
118 Before moving to regression analysis, some descriptive statistics are discussed. Table 4 presents statistics of annual employment and real gross wages growth during the crisis on the sample of 74 divisions of economic activities. Even after excluding the activities with largest extremes in annual data, absolute values of minimum and maximum observations for the remaining sectors are still relatively high for some years, both for employment and wage growth.
table 4Employment and wages growth in crisis, in %
employment growth Real gross wages growth2009 2010 2011 2012 2009 2010 2011 2012
By divisions:Mean 2.2 1.4 0.4 0.4 1.0 2.0 1.2 2.5St. deviation 9.2 9.5 4.6 6.0 3.6 5.5 3.4 2.3No. of obs. < 0 41 48 38 36 52 54 53 68No. of obs. ≥ 0 33 26 36 38 22 20 21 6Minimum 39.5 20.6 10.0 24.4 7.0 25.7 15.9 -8.8Maximum 16.5 27.4 13.1 15.9 13.6 24.0 5.6 3.174 divisions 3.4 3.5 0.7 0.5 0.2 1.5 0.6 2.0
Source: CBS.
It is interesting to note that negative employment growth in the first two years of the crisis was recorded in most economic activities, while in the last two years the number of activities experiencing negative and positive employment growth was roughly equal. Negative wage growth, on the other hand, prevailed in most sectors throughout the whole crisis and in 2012 only six activities saw a rise in real wages. The mean negative values for employment growth were smaller in absolute value than those for wage growth, in all years but 2009. Thus, for the majority of sectors, the crisis resulted in more intense adjustment on the side of wages than on the employment side. This is brought about by developments in smaller sectors since, as the comparison of means with the numbers for the aggregated 74 divisions suggests, declines in employment were more pronounced for all 74 sectors for all crisis years. In other words, relative employment declines were stronger in larger sectors. As for the declines in real wages, the situation is reversed and comparatively smaller sectors experienced stronger wage drop.
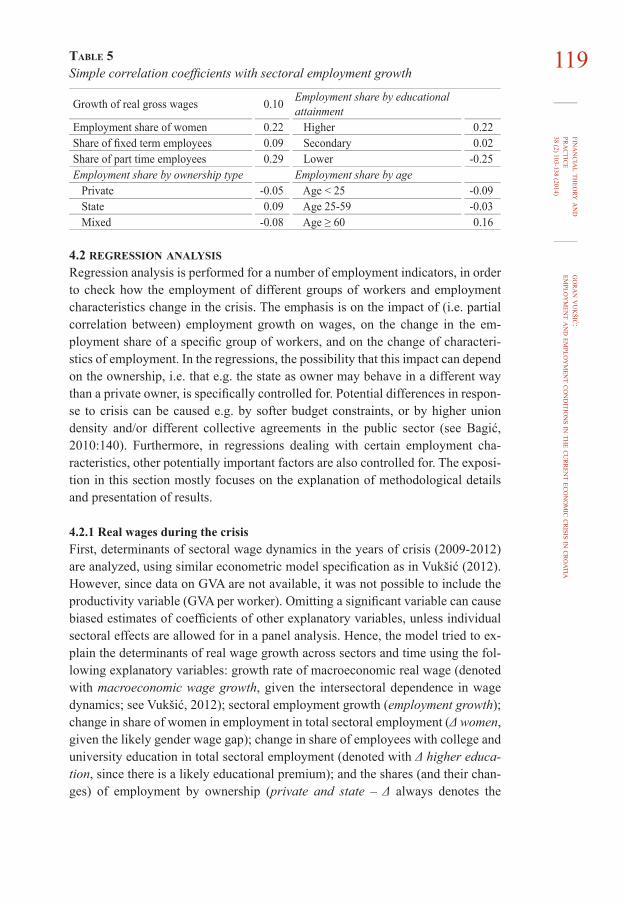
The next table shows the simple correlation coefficients between sectoral employment growth and other variables of interest, which will be used as independent variables in regressions that follow. There are comparatively high correlations between sectoral employment growth and the shares of part time employees, employees with higher education, employment of women and older workers. On the other hand, correlation of employment growth and workers with lower education turns negative and comparatively strong. There is a positive correlation between wage and employment growth.
go
ra
n vu
kšić:
emplo
ym
ent a
nd em
ploy
men
t co
nd
ition
s in the c
ur
ren
t eco
no
mic c
risis in c
ro
atiafin
an
cia
l theo
ry an
d pr
ac
tice
38 (2) 103-138 (2014)119table 5
Simple correlation coefficients with sectoral employment growth
Growth of real gross wages 0.10 Employment share by educational attainment
Employment share of women 0.22 Higher 0.22Share of fixed term employees 0.09 Secondary 0.02Share of part time employees 0.29 Lower 0.25Employment share by ownership type Employment share by age Private 0.05 Age < 25 0.09 State 0.09 Age 25-59 0.03 Mixed -0.08 Age ≥ 60 0.16
4.2 regression analysisRegression analysis is performed for a number of employment indicators, in order to check how the employment of different groups of workers and employment characteristics change in the crisis. The emphasis is on the impact of (i.e. partial correlation between) employment growth on wages, on the change in the employment share of a specific group of workers, and on the change of characteristics of employment. In the regressions, the possibility that this impact can depend on the ownership, i.e. that e.g. the state as owner may behave in a different way than a private owner, is specifically controlled for. Potential differences in response to crisis can be caused e.g. by softer budget constraints, or by higher union density and/or different collective agreements in the public sector (see Bagić, 2010:140). Furthermore, in regressions dealing with certain employment characteristics, other potentially important factors are also controlled for. The exposition in this section mostly focuses on the explanation of methodological details and presentation of results.
4.2.1 Real wages during the crisisFirst, determinants of sectoral wage dynamics in the years of crisis (2009-2012) are analyzed, using similar econometric model specification as in Vukšić (2012). However, since data on GVA are not available, it was not possible to include the productivity variable (GVA per worker). Omitting a significant variable can cause biased estimates of coefficients of other explanatory variables, unless individual sectoral effects are allowed for in a panel analysis. Hence, the model tried to explain the determinants of real wage growth across sectors and time using the following explanatory variables: growth rate of macroeconomic real wage (denoted with macroeconomic wage growth, given the intersectoral dependence in wage dynamics; see Vukšić, 2012); sectoral employment growth (employment growth); change in share of women in employment in total sectoral employment (Δ women, given the likely gender wage gap); change in share of employees with college and university education in total sectoral employment (denoted with Δ higher educa-tion, since there is a likely educational premium); and the shares (and their changes) of employment by ownership (private and state – Δ always denotes the
go
ra
n vu
kšić:
emplo
ym
ent a
nd em
ploy
men
t co
nd
ition
s in the c
ur
ren
t eco
no
mic c
risis in c
ro
atiafin
an
cia
l theo
ry an
d pr
ac
tice
38 (2) 103-138 (2014)
120 change in a variable, given the possible different behavior of state and private employers and a potential wage gap between wages in private and public sector).
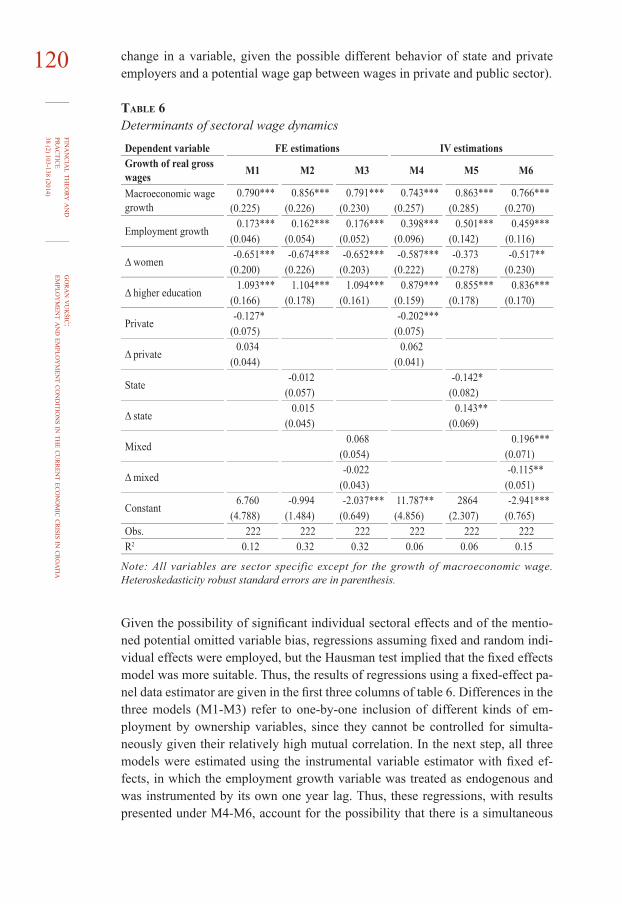
table 6Determinants of sectoral wage dynamics
Dependent variable fe estimations IV estimationsGrowth of real gross wages M1 M2 M3 M4 M5 M6
Macroeconomic wage growth
0.790*** 0.856*** 0.791*** 0.743*** 0.863*** 0.766***(0.225) (0.226) (0.230) (0.257) (0.285) (0.270)
Employment growth0.173*** 0.162*** 0.176*** 0.398*** 0.501*** 0.459***
(0.046) (0.054) (0.052) (0.096) (0.142) (0.116)
Δ women-0.651*** -0.674*** -0.652*** -0.587*** 0.373 -0.517**
(0.200) (0.226) (0.203) (0.222) (0.278) (0.230)
Δ higher education1.093*** 1.104*** 1.094*** 0.879*** 0.855*** 0.836***
(0.166) (0.178) (0.161) (0.159) (0.178) (0.170)
Private-0.127* -0.202***
(0.075) (0.075)
Δ private0.034 0.062
(0.044) (0.041)
State0.012 -0.142*
(0.057) (0.082)
Δ state0.015 0.143**
(0.045) (0.069)
Mixed0.068 0.196***
(0.054) (0.071)
Δ mixed 0.022 -0.115**
(0.043) (0.051)
Constant6.760 0.994 -2.037*** 11.787** 2864 -2.941***
(4.788) (1.484) (0.649) (4.856) (2.307) (0.765)Obs. 222 222 222 222 222 222R2 0.12 0.32 0.32 0.06 0.06 0.15
Note: All variables are sector specific except for the growth of macroeconomic wage. Heteroskedasticity robust standard errors are in parenthesis.
Given the possibility of significant individual sectoral effects and of the mentioned potential omitted variable bias, regressions assuming fixed and random individual effects were employed, but the Hausman test implied that the fixed effects model was more suitable. Thus, the results of regressions using a fixed-effect panel data estimator are given in the first three columns of table 6. Differences in the three models (M1-M3) refer to one-by-one inclusion of different kinds of employment by ownership variables, since they cannot be controlled for simultaneously given their relatively high mutual correlation. In the next step, all three models were estimated using the instrumental variable estimator with fixed effects, in which the employment growth variable was treated as endogenous and was instrumented by its own one year lag. Thus, these regressions, with results presented under M4-M6, account for the possibility that there is a simultaneous
go
ra
n vu
kšić:
emplo
ym
ent a
nd em
ploy
men
t co
nd
ition
s in the c
ur
ren
t eco
no
mic c
risis in c
ro
atiafin
an
cia
l theo
ry an
d pr
ac
tice
38 (2) 103-138 (2014)121relationship between wage and employment growth, which can lead to biased
estimates in the first approach. A dynamic model (which includes a lagged dependent variable) was also estimated, using the Arellano-Bond estimator dynamic panel data estimator. The results of this approach largely coincide with results of the fixed effects estimations. However, when attempting to run regressions with the Arellano-Bond estimator, assuming endogeneity of the employment growth variable, no good instruments could be found and the regressions’ diagnostics turned out bad, so that these results are not considered. It must, however, be emphasized that the lagged dependent variable never turned out significant, so that the estimates presented are the most confident given the data limitations.
The results show that growth rate of macroeconomic wage strongly affects sectoral wage growth, across all specifications and both methods. This is in line with the results from Vukšić (2012), who analyzed the wage dynamics for the period before the current crisis (from 1998 to 2007). Employment growth variable is also significant at 1% level, with positive coefficients, for all the approaches and with somewhat higher coefficients in instrumental variables estimations. Change in the share of women in total employment is highly significant, except for the specification M5, with a negative sign, implying that an increase in the share of women is associated with slower wage growth. This may indicate a gender wage gap. Similarly, an increase in the share of employees with higher educational attainments brings about higher wage growth rates, indicating an educational premium. As for the impact of ownership, negative coefficients for the share of private sector employees (not the change in share), imply that in the economic activities with a comparatively high share of private sector workers, wages tend to grow more slowly, or decline faster. This result is statistically significant at the 10%, i.e. 1% level. Similar results regarding the signs of coefficients, but with differences with respect to statistical significance, are obtained for the share of public sector workers. These are significant at the 10% level in the instrumental variable estimations only. Coefficients of changes in private and public sector employment shares are both positive, but insignificant, except for public sector employment, which is significant only in the estimations using instrumental variables. Finally, results for the respective variables on employment share in entities with mixed ownership have opposite signs and are significant only in the instrumental variables app-roach. One should note that in regressions including the employment share of private sector, the counterfactual is employment in both, state owned and entities in mixed ownership. The analog applies for other specifications.12
In addition to the model specifications presented in table 6, models were estimated that also included other employment indicators relating to shares of employees by age, by type of employment and by contractual working time (as well as the chan
12 It should be noted here that the results for variables describing the change in share of employees by ownership are confirmed also when the shares by ownership variables are excluded from regressions, or when they enter with one year lag.
go
ra
n vu
kšić:
emplo
ym
ent a
nd em
ploy
men
t co
nd
ition
s in the c
ur
ren
t eco
no
mic c
risis in c
ro
atiafin
an
cia
l theo
ry an
d pr
ac
tice
38 (2) 103-138 (2014)
122 ges in these variables). The results of these additional estimations are not shown, because none of the additionally included variables turned significant in any of the specifications.
4.2.2 employment by groups and other characteristicsAs for the other employment indicators analyzed in the rest of this section, the empirical approach used was to test for the heteroskedasticity and serial correlation in the Ordinary Least Square (OLS) framework for each estimated model specification. Afterwards, Generalized Least Square (GLS) regressions were performed, producing heteroskedasticity robust standard errors and/or assuming an AR1 process in the error term, depending on the results from the tests. In cases in which neither heteroskedasticity nor serial correlation turned out to be a problem, standard OLS assumptions were used in the estimations.13 Results are presented in tables 7-12, but before they are presented, it should be noted that for each dependent variable, model specifications include: sectoral employment growth variable, lagged dependent variable (capturing initial conditions), as well as ownership variables (private or state, denoting shares of employment in private or state owned entities, respectively) as explanatory variables.14 Caution is required in interpreting the results of estimated coefficients of the sectoral employment growth: the impact of changing employment on dependent variable need not be linear, i.e. it need not have the same direction in times of increasing and decreasing employment. For this reason, if the estimated coefficients are not significant, one cannot make reliable conclusions about the direction of the impact of changing employment on dependent variables. Variables entering the equation with a one year lag are denoted with lagged in the parentheses, while Δ always denotes the change in a variable.
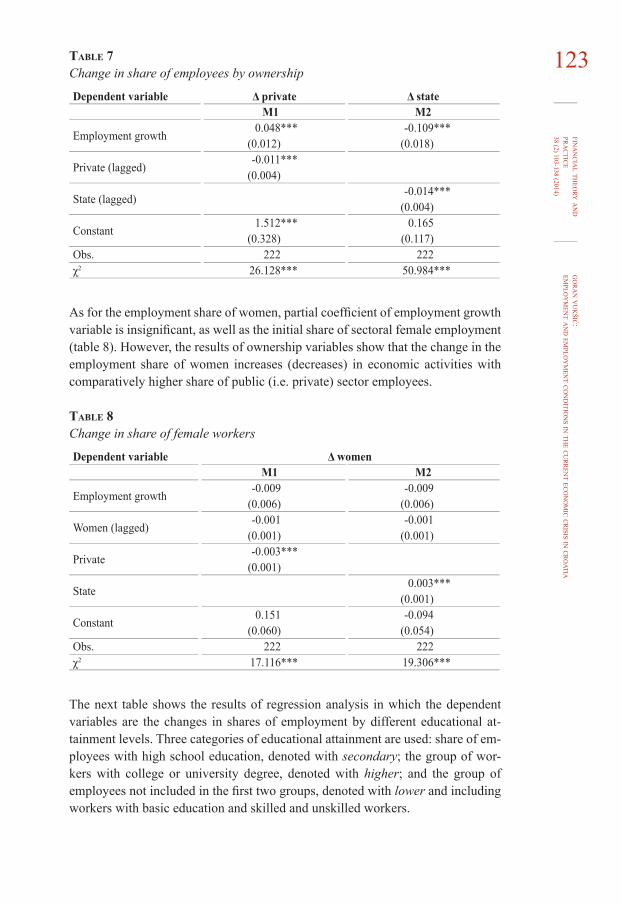
The results from regressions investigating the impact of employment growth on the changes in the shares of employment by ownership are summarized in table 7 and show that the partial correlation between employment growth and change in shares of employment by ownership is positive and statistically significant for private sector, while it turns negative for the changes in share of employees in state owned enterprises and entities. This could imply more employment dynamics in the private sector, i.e. that in economic activities with positive employment growth, the share of private sector workers increases, and the other way around (other things held equal). The opposite holds for public sector employment. At the same time, coefficients of lagged values of shares in employment by ownership, denoted with private (lagged) and state (lagged), turn negative and significant in both cases.
13 Individual sectoral effects are not included because for both, random and fixed effect approaches, the appropriate tests (the F test for fixed effects and the Breusch-Pagan Lagrangian multiplier test for random effects) rejected the hypothesis of their significance.14 Given the already very large number of regression results presented below, and the comparatively lower importance of employment in entities in mixed ownership, the results of specifications including the share of employment in entities in mixed ownership are not shown, as they do not significantly contribute to the conclusions of the analysis.
go
ra
n vu
kšić:
emplo
ym
ent a
nd em
ploy
men
t co
nd
ition
s in the c
ur
ren
t eco
no
mic c
risis in c
ro
atiafin
an
cia
l theo
ry an
d pr
ac
tice
38 (2) 103-138 (2014)123table 7
Change in share of employees by ownership
Dependent variable Δ private Δ stateM1 M2
Employment growth0.048*** -0.109***
(0.012) (0.018)
Private (lagged)-0.011***
(0.004)
State (lagged)-0.014***
(0.004)
Constant1.512*** 0.165
(0.328) (0.117)Obs. 222 222χ2 26.128*** 50.984***
As for the employment share of women, partial coefficient of employment growth variable is insignificant, as well as the initial share of sectoral female employment (table 8). However, the results of ownership variables show that the change in the employment share of women increases (decreases) in economic activities with comparatively higher share of public (i.e. private) sector employees.
table 8Change in share of female workers
Dependent variable Δ womenM1 M2
Employment growth0.009 0.009
(0.006) (0.006)
Women (lagged)0.001 0.001
(0.001) (0.001)
Private-0.003***
(0.001)
State0.003***
(0.001)
Constant0.151 0.094
(0.060) (0.054)Obs. 222 222χ2 17.116*** 19.306***
The next table shows the results of regression analysis in which the dependent variables are the changes in shares of employment by different educational attainment levels. Three categories of educational attainment are used: share of employees with high school education, denoted with secondary; the group of workers with college or university degree, denoted with higher; and the group of employees not included in the first two groups, denoted with lower and including workers with basic education and skilled and unskilled workers.
go
ra
n vu
kšić:
emplo
ym
ent a
nd em
ploy
men
t co
nd
ition
s in the c
ur
ren
t eco
no
mic c
risis in c
ro
atiafin
an
cia
l theo
ry an
d pr
ac
tice
38 (2) 103-138 (2014)
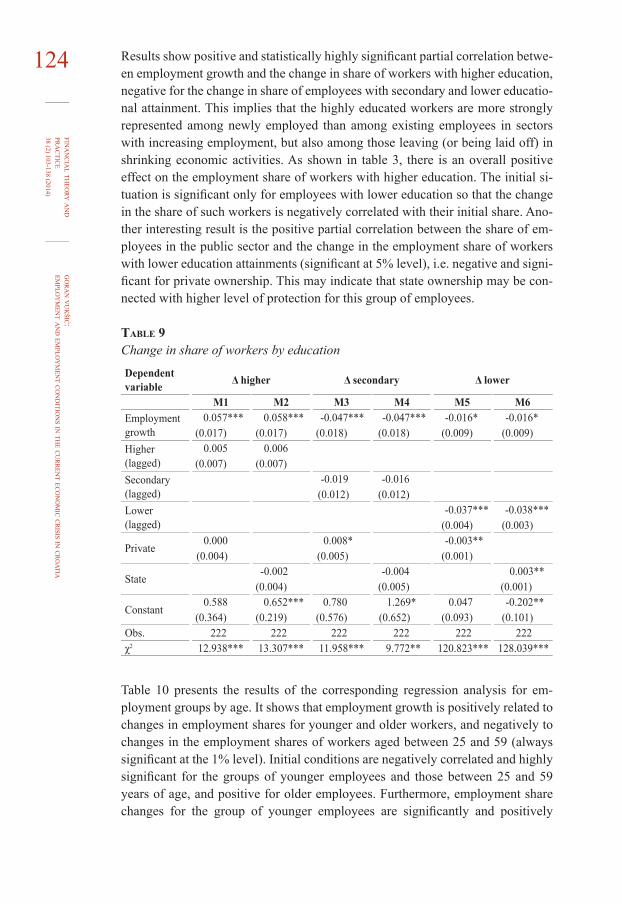
124 Results show positive and statistically highly significant partial correlation between employment growth and the change in share of workers with higher education, negative for the change in share of employees with secondary and lower educational attainment. This implies that the highly educated workers are more strongly represented among newly employed than among existing employees in sectors with increasing employment, but also among those leaving (or being laid off) in shrinking economic activities. As shown in table 3, there is an overall positive effect on the employment share of workers with higher education. The initial situation is significant only for employees with lower education so that the change in the share of such workers is negatively correlated with their initial share. Another interesting result is the positive partial correlation between the share of employees in the public sector and the change in the employment share of workers with lower education attainments (significant at 5% level), i.e. negative and significant for private ownership. This may indicate that state ownership may be connected with higher level of protection for this group of employees.
table 9Change in share of workers by education
Dependent variable Δ higher Δ secondary Δ lower
M1 M2 M3 M4 M5 M6Employment growth
0.057*** 0.058*** -0.047*** -0.047*** -0.016* -0.016*(0.017) (0.017) (0.018) (0.018) (0.009) (0.009)
Higher (lagged)
0.005 0.006(0.007) (0.007)
Secondary (lagged)
0.019 0.016(0.012) (0.012)
Lower (lagged)
-0.037*** -0.038***(0.004) (0.003)
Private0.000 0.008* -0.003**
(0.004) (0.005) (0.001)
State0.002 0.004 0.003**
(0.004) (0.005) (0.001)
Constant0.588 0.652*** 0.780 1.269* 0.047 -0.202**
(0.364) (0.219) (0.576) (0.652) (0.093) (0.101)Obs. 222 222 222 222 222 222χ2 12.938*** 13.307*** 11.958*** 9.772** 120.823*** 128.039***
Table 10 presents the results of the corresponding regression analysis for employment groups by age. It shows that employment growth is positively related to changes in employment shares for younger and older workers, and negatively to changes in the employment shares of workers aged between 25 and 59 (always significant at the 1% level). Initial conditions are negatively correlated and highly significant for the groups of younger employees and those between 25 and 59 years of age, and positive for older employees. Furthermore, employment share changes for the group of younger employees are significantly and positively
go
ra
n vu
kšić:
emplo
ym
ent a
nd em
ploy
men
t co
nd
ition
s in the c
ur
ren
t eco
no
mic c
risis in c
ro
atiafin
an
cia
l theo
ry an
d pr
ac
tice
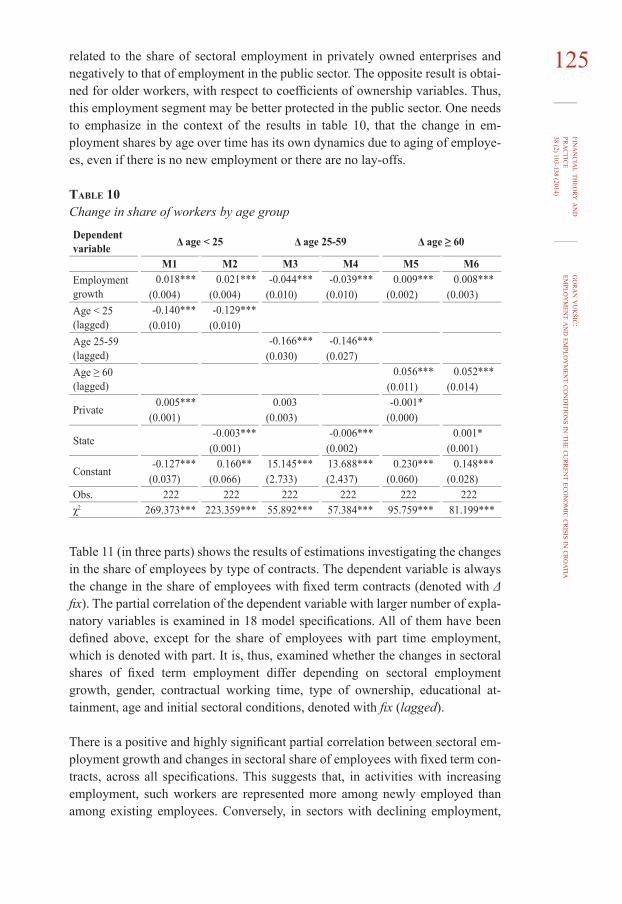
38 (2) 103-138 (2014)125 related to the share of sectoral employment in privately owned enterprises and
negatively to that of employment in the public sector. The opposite result is obtained for older workers, with respect to coefficients of ownership variables. Thus, this employment segment may be better protected in the public sector. One needs to emphasize in the context of the results in table 10, that the change in employment shares by age over time has its own dynamics due to aging of employees, even if there is no new employment or there are no lay-offs.
table 10Change in share of workers by age group
Dependent variable Δ age < 25 Δ age 25-59 Δ age ≥ 60
M1 M2 M3 M4 M5 M6Employment growth
0.018*** 0.021*** -0.044*** -0.039*** 0.009*** 0.008***(0.004) (0.004) (0.010) (0.010) (0.002) (0.003)
Age < 25 (lagged)
-0.140*** -0.129***(0.010) (0.010)
Age 25-59 (lagged)
-0.166*** -0.146***(0.030) (0.027)
Age ≥ 60 (lagged)
0.056*** 0.052***(0.011) (0.014)
Private0.005*** 0.003 -0.001*
(0.001) (0.003) (0.000)
State-0.003*** -0.006*** 0.001*
(0.001) (0.002) (0.001)
Constant-0.127*** 0.160** 15.145*** 13.688*** 0.230*** 0.148***
(0.037) (0.066) (2.733) (2.437) (0.060) (0.028)Obs. 222 222 222 222 222 222χ2 269.373*** 223.359*** 55.892*** 57.384*** 95.759*** 81.199***
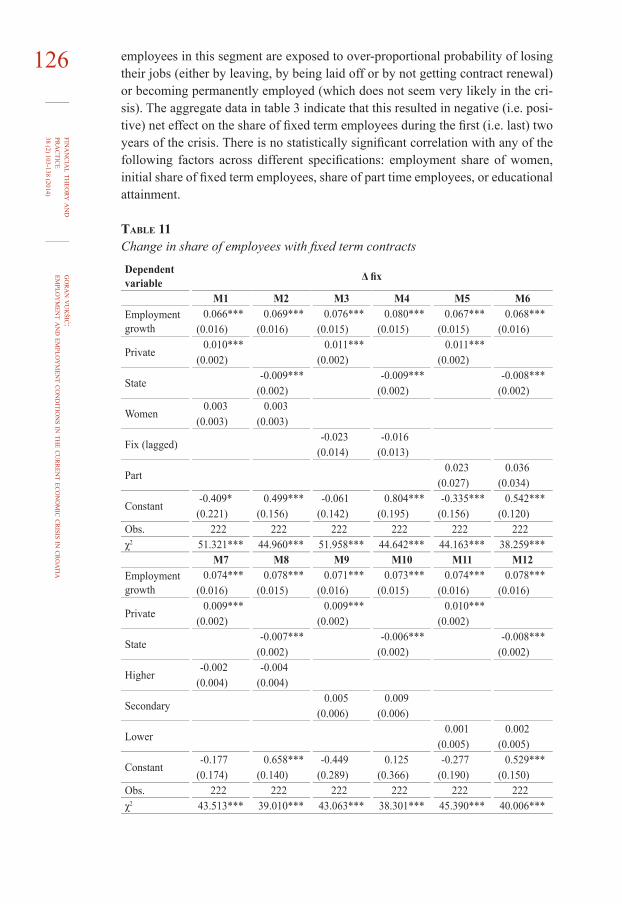
Table 11 (in three parts) shows the results of estimations investigating the changes in the share of employees by type of contracts. The dependent variable is always the change in the share of employees with fixed term contracts (denoted with Δ fix). The partial correlation of the dependent variable with larger number of explanatory variables is examined in 18 model specifications. All of them have been defined above, except for the share of employees with part time employment, which is denoted with part. It is, thus, examined whether the changes in sectoral shares of fixed term employment differ depending on sectoral employment growth, gender, contractual working time, type of ownership, educational attainment, age and initial sectoral conditions, denoted with fix (lagged).
There is a positive and highly significant partial correlation between sectoral employment growth and changes in sectoral share of employees with fixed term contracts, across all specifications. This suggests that, in activities with increasing employment, such workers are represented more among newly employed than among existing employees. Conversely, in sectors with declining employment,
go
ra
n vu
kšić:
emplo
ym
ent a
nd em
ploy
men
t co
nd
ition
s in the c
ur
ren
t eco
no
mic c
risis in c
ro
atiafin
an
cia
l theo
ry an
d pr
ac
tice
38 (2) 103-138 (2014)
126 employees in this segment are exposed to over-proportional probability of losing their jobs (either by leaving, by being laid off or by not getting contract renewal) or becoming permanently employed (which does not seem very likely in the crisis). The aggregate data in table 3 indicate that this resulted in negative (i.e. positive) net effect on the share of fixed term employees during the first (i.e. last) two years of the crisis. There is no statistically significant correlation with any of the following factors across different specifications: employment share of women, initial share of fixed term employees, share of part time employees, or educational attainment.
table 11Change in share of employees with fixed term contracts
Dependent variable Δ fix
M1 M2 M3 M4 M5 M6Employment growth
0.066*** 0.069*** 0.076*** 0.080*** 0.067*** 0.068***(0.016) (0.016) (0.015) (0.015) (0.015) (0.016)
Private0.010*** 0.011*** 0.011***
(0.002) (0.002) (0.002)
State-0.009*** -0.009*** -0.008***
(0.002) (0.002) (0.002)
Women0.003 0.003
(0.003) (0.003)
Fix (lagged)0.023 0.016
(0.014) (0.013)
Part0.023 0.036
(0.027) (0.034)
Constant-0.409* 0.499*** 0.061 0.804*** -0.335*** 0.542***
(0.221) (0.156) (0.142) (0.195) (0.156) (0.120)Obs. 222 222 222 222 222 222χ2 51.321*** 44.960*** 51.958*** 44.642*** 44.163*** 38.259***
M7 M8 M9 M10 M11 M12Employment growth
0.074*** 0.078*** 0.071*** 0.073*** 0.074*** 0.078***(0.016) (0.015) (0.016) (0.015) (0.016) (0.016)
Private0.009*** 0.009*** 0.010***
(0.002) (0.002) (0.002)
State-0.007*** -0.006*** -0.008***
(0.002) (0.002) (0.002)
Higher0.002 0.004
(0.004) (0.004)
Secondary0.005 0.009
(0.006) (0.006)
Lower0.001 0.002
(0.005) (0.005)
Constant0.177 0.658*** 0.449 0.125 0.277 0.529***
(0.174) (0.140) (0.289) (0.366) (0.190) (0.150)Obs. 222 222 222 222 222 222χ2 43.513*** 39.010*** 43.063*** 38.301*** 45.390*** 40.006***
go
ra
n vu
kšić:
emplo
ym
ent a
nd em
ploy
men
t co
nd
ition
s in the c
ur
ren
t eco
no
mic c
risis in c
ro
atiafin
an
cia
l theo
ry an
d pr
ac
tice
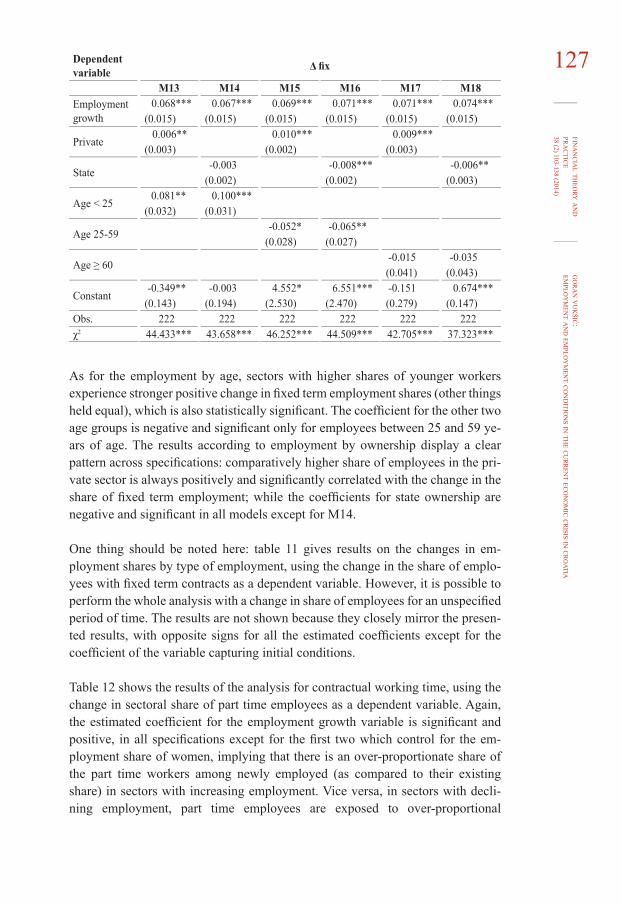
38 (2) 103-138 (2014)127Dependent
variable Δ fix
M13 M14 M15 M16 M17 M18Employment growth
0.068*** 0.067*** 0.069*** 0.071*** 0.071*** 0.074***(0.015) (0.015) (0.015) (0.015) (0.015) (0.015)
Private0.006** 0.010*** 0.009***
(0.003) (0.002) (0.003)
State0.003 -0.008*** -0.006**
(0.002) (0.002) (0.003)
Age < 250.081** 0.100***
(0.032) (0.031)
Age 25-59-0.052* -0.065**
(0.028) (0.027)
Age ≥ 600.015 0.035(0.041) (0.043)
Constant-0.349** 0.003 4.552* 6.551*** 0.151 0.674***
(0.143) (0.194) (2.530) (2.470) (0.279) (0.147)Obs. 222 222 222 222 222 222χ2 44.433*** 43.658*** 46.252*** 44.509*** 42.705*** 37.323***
As for the employment by age, sectors with higher shares of younger workers experience stronger positive change in fixed term employment shares (other things held equal), which is also statistically significant. The coefficient for the other two age groups is negative and significant only for employees between 25 and 59 years of age. The results according to employment by ownership display a clear pattern across specifications: comparatively higher share of employees in the private sector is always positively and significantly correlated with the change in the share of fixed term employment; while the coefficients for state ownership are negative and significant in all models except for M14.
One thing should be noted here: table 11 gives results on the changes in employment shares by type of employment, using the change in the share of employees with fixed term contracts as a dependent variable. However, it is possible to perform the whole analysis with a change in share of employees for an unspecified period of time. The results are not shown because they closely mirror the presented results, with opposite signs for all the estimated coefficients except for the coefficient of the variable capturing initial conditions.
Table 12 shows the results of the analysis for contractual working time, using the change in sectoral share of part time employees as a dependent variable. Again, the estimated coefficient for the employment growth variable is significant and positive, in all specifications except for the first two which control for the employment share of women, implying that there is an over-proportionate share of the part time workers among newly employed (as compared to their existing share) in sectors with increasing employment. Vice versa, in sectors with declining employment, part time employees are exposed to over-proportional
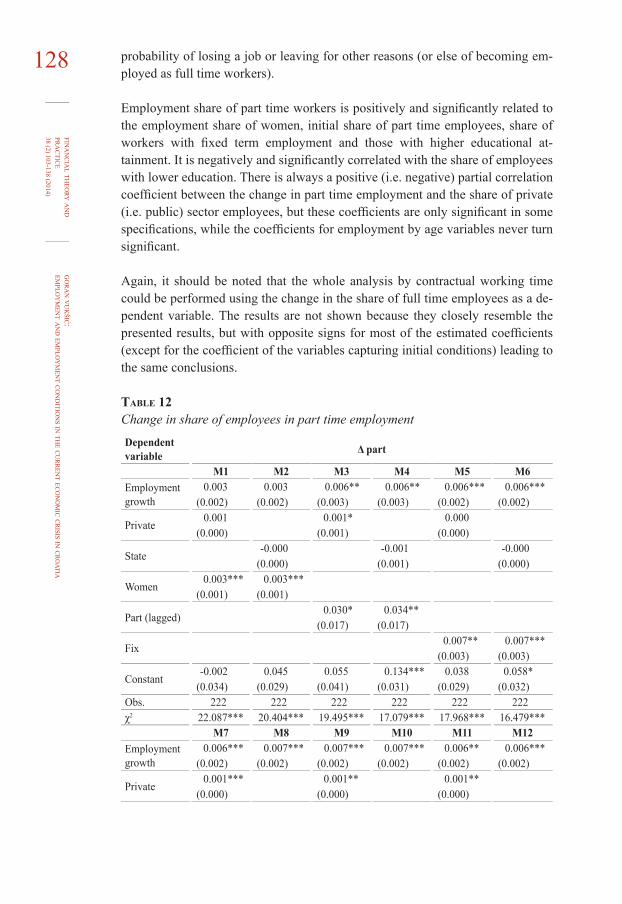
go
ra
n vu
kšić:
emplo
ym
ent a
nd em
ploy
men
t co
nd
ition
s in the c
ur
ren
t eco
no
mic c
risis in c
ro
atiafin
an
cia
l theo
ry an
d pr
ac
tice
38 (2) 103-138 (2014)
128 probability of losing a job or leaving for other reasons (or else of becoming employed as full time workers).
Employment share of part time workers is positively and significantly related to the employment share of women, initial share of part time employees, share of workers with fixed term employment and those with higher educational attainment. It is negatively and significantly correlated with the share of employees with lower education. There is always a positive (i.e. negative) partial correlation coefficient between the change in part time employment and the share of private (i.e. public) sector employees, but these coefficients are only significant in some specifications, while the coefficients for employment by age variables never turn significant.
Again, it should be noted that the whole analysis by contractual working time could be performed using the change in the share of full time employees as a dependent variable. The results are not shown because they closely resemble the presented results, but with opposite signs for most of the estimated coefficients (except for the coefficient of the variables capturing initial conditions) leading to the same conclusions.
table 12Change in share of employees in part time employment
Dependent variable Δ part
M1 M2 M3 M4 M5 M6Employment growth
0.003 0.003 0.006** 0.006** 0.006*** 0.006***(0.002) (0.002) (0.003) (0.003) (0.002) (0.002)
Private0.001 0.001* 0.000
(0.000) (0.001) (0.000)
State0.000 0.001 0.000
(0.000) (0.001) (0.000)
Women0.003*** 0.003***
(0.001) (0.001)
Part (lagged)0.030* 0.034**
(0.017) (0.017)
Fix0.007** 0.007***
(0.003) (0.003)
Constant0.002 0.045 0.055 0.134*** 0.038 0.058*
(0.034) (0.029) (0.041) (0.031) (0.029) (0.032)Obs. 222 222 222 222 222 222χ2 22.087*** 20.404*** 19.495*** 17.079*** 17.968*** 16.479***
M7 M8 M9 M10 M11 M12Employment growth
0.006*** 0.007*** 0.007*** 0.007*** 0.006** 0.006***(0.002) (0.002) (0.002) (0.002) (0.002) (0.002)
Private0.001*** 0.001** 0.001**
(0.000) (0.000) (0.000)
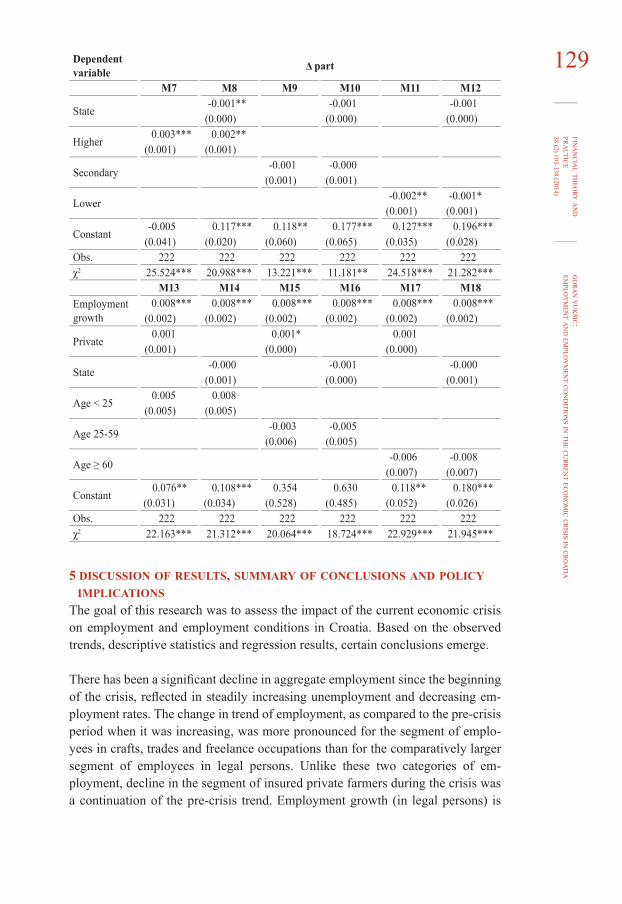
go
ra
n vu
kšić:
emplo
ym
ent a
nd em
ploy
men
t co
nd
ition
s in the c
ur
ren
t eco
no
mic c
risis in c
ro
atiafin
an
cia
l theo
ry an
d pr
ac
tice
38 (2) 103-138 (2014)129Dependent
variable Δ part
M7 M8 M9 M10 M11 M12
State-0.001** 0.001 0.001
(0.000) (0.000) (0.000)
Higher0.003*** 0.002**
(0.001) (0.001)
Secondary0.001 0.000
(0.001) (0.001)
Lower-0.002** -0.001*
(0.001) (0.001)
Constant0.005 0.117*** 0.118** 0.177*** 0.127*** 0.196***
(0.041) (0.020) (0.060) (0.065) (0.035) (0.028)Obs. 222 222 222 222 222 222χ2 25.524*** 20.988*** 13.221*** 11.181** 24.518*** 21.282***
M13 M14 M15 M16 M17 M18Employment growth
0.008*** 0.008*** 0.008*** 0.008*** 0.008*** 0.008***(0.002) (0.002) (0.002) (0.002) (0.002) (0.002)
Private0.001 0.001* 0.001
(0.001) (0.000) (0.000)
State0.000 0.001 0.000
(0.001) (0.000) (0.001)
Age < 250.005 0.008
(0.005) (0.005)
Age 25-590.003 0.005
(0.006) (0.005)
Age ≥ 600.006 -0.008
(0.007) (0.007)
Constant0.076** 0.108*** 0.354 0.630 0.118** 0.180***
(0.031) (0.034) (0.528) (0.485) (0.052) (0.026)Obs. 222 222 222 222 222 222χ2 22.163*** 21.312*** 20.064*** 18.724*** 22.929*** 21.945***
5 discussion of results, summary of conclusions and policy implicationsThe goal of this research was to assess the impact of the current economic crisis on employment and employment conditions in Croatia. Based on the observed trends, descriptive statistics and regression results, certain conclusions emerge.
There has been a significant decline in aggregate employment since the beginning of the crisis, reflected in steadily increasing unemployment and decreasing employment rates. The change in trend of employment, as compared to the pre-crisis period when it was increasing, was more pronounced for the segment of emplo-yees in crafts, trades and freelance occupations than for the comparatively larger segment of employees in legal persons. Unlike these two categories of employment, decline in the segment of insured private farmers during the crisis was a continuation of the pre-crisis trend. Employment growth (in legal persons) is
go
ra
n vu
kšić:
emplo
ym
ent a
nd em
ploy
men
t co
nd
ition
s in the c
ur
ren
t eco
no
mic c
risis in c
ro
atiafin
an
cia
l theo
ry an
d pr
ac
tice
38 (2) 103-138 (2014)
130 shown to be significantly determined by contemporaneous and lagged changes in economic conditions, as captured by the real gross value added growth.
Especially during the first two years of the crisis, adjustment to worsening economic conditions was primarily brought about through employment cuts. This is in line with the conclusions from Matković, Arandarenko and Šošić (2010) and Cho and Newhouse (2013) for the group of Eastern European countries. However, in 2011 the intensity of decline in employment and real earnings was roughly the same, while in 2012 decline in real wages turned out stronger. One can observe some heterogeneous developments of employment and wages across sectors of economic activities. Although this is expected given that they were not equally exposed to negative economic shocks, there are also indications of different sectoral adjustment patterns. During the crisis, jobs were lost in the private sector and in entities in mixed ownership, while the number of jobs in the public sector (entities in state ownership) slightly increased. There seems to have been greater labor dynamics in the private sector segment, as the employment share of private sector workers increased (decreased) in economic activities with positive (nega-tive) employment growth.
The growth of sectoral real wages in the crisis is positively and significantly related to the growth of the macroeconomic wage, underlining the importance of broader macroeconomic conditions for sectoral wage dynamics found in earlier research (Vukšić, 2012). There is also a positive and significant partial correlation between employment and wage growth. Results of wage dynamics analysis further indicate the existence of a gender wage gap and an educational wage premium. Wage growth in the crisis is negatively related to the sectoral share of private sector employees; and positively to share of workers in entities in mixed ownership. Results for wage growth in the public sector (entities in state ownership) are similar to those for the private sector, but the relationship is weaker and statistically less convincing.
As for the impact of the crisis on female workers, their aggregate employment share has been increasing. This is the consequence of the fact that the economic activities with comparatively larger share of women employment have experienced fewer employment cuts, or comparatively higher employment growth. Furthermore, increases in their employment share were stronger in economic activities with comparatively higher shares of public sector employment.
Aggregate data on employment by age groups show a declining share of younger workers (younger than 25) and an increasing shares of workers aged between 25 and 59, and, even more pronounced, of older workers (aged 60 or older) during the crisis. These trends of aggregate shares may result from the low number of new job openings and the fact that the existing workers naturally shifted to older age categories. The share of employees aged between 25 and 59 decreases with
go
ra
n vu
kšić:
emplo
ym
ent a
nd em
ploy
men
t co
nd
ition
s in the c
ur
ren
t eco
no
mic c
risis in c
ro
atiafin
an
cia
l theo
ry an
d pr
ac
tice
38 (2) 103-138 (2014)131increasing sectoral employment, while the opposite effect can be observed for the
other two groups. In addition, change in the shares of young employees is positively (negatively) related to the share of private (public) sector workers, while the opposite holds true for older employees aged 60 or older.
Data show that employees with comparatively lower educational attainments face severe challenges in the labor market. This is a longer term trend, not specific to the crisis period, as the aggregate share of employees with basic education and of skilled and unskilled workers has been declining steadily since the year 2000. The corresponding shares for employees with secondary education and those with higher educational attainment show the opposite trend. More detailed data for the years of crisis show that sectors with higher shares of workers with higher education experienced fewer employment cuts, or higher employment growth rates. Results of regression analysis imply that employees with higher education are more strongly represented among newly employed than among existing emplo-yees in sectors with increasing employment, but also among those leaving (or being laid off) in shrinking economic activities. The opposite holds true for workers with lower and secondary education. Results also indicate that state ownership may be connected with a higher level of protection for the group of emplo-yees with lower educational attainment.
Data on workers employed for a fixed period of time show that their share has increased in the last two years of the crisis, after a slight decline in 2009 and 2010. One explanation might be that these were the first to be laid off in the beginning of the crisis, but that in later years, the relative importance of this type of employment among the newly employed increased. Regression analysis shows that, in activities with increasing employment, fixed term employees are represented among new employees proportionally more than among existing workers. Conversely, in sectors with declining employment, this segment of employees is exposed to over-proportional probability of losing a job (either by being laid off, or by not getting contract renewal), leaving for other reasons, or becoming permanently employed (which does not seem very likely in the times of crisis). Sectors with higher shares of younger workers experience stronger increases in fixed term employment shares. The results according to employment by ownership clearly show that comparatively higher share of employees in private sector is always associated with stronger increases in share of fixed term employment. This indicates that the increasing importance of this, more flexible form of employment (during the last two years of the crisis), has been stronger in the more dynamic labor market segment, i.e. private sector, during the crisis.
The share of full time employees was rather constant in the pre-crisis period and exceeded the value of 98% in each of these years. In the crisis, however, this share declined slightly but steadily. The share of part time employees rose correspondingly and although it is still very small, it has increased substantially during the
go
ra
n vu
kšić:
emplo
ym
ent a
nd em
ploy
men
t co
nd
ition
s in the c
ur
ren
t eco
no
mic c
risis in c
ro
atiafin
an
cia
l theo
ry an
d pr
ac
tice
38 (2) 103-138 (2014)
132 crisis. Results of regression analysis imply that there is an over-proportionate share of part time workers among newly employed in sectors with increasing employment, i.e. that in sectors with declining employment, part time employees are exposed to over-proportional probability of losing a job or leaving for other reasons (or becoming employed as full time workers). The increasing importance of this more flexible form of employment, i.e. of working part time, during the crisis, was stronger in economic activities with comparatively high shares of women employees, of workers with higher education and fixed term employees.
Data on hours worked do not display any strong upward or downward trends, not overall, nor in the periods before and during the crisis. There is a slight decline in average number of hours and the hours actually worked in the crisis, but this is not something specific to the crisis period. The only exception in this respect may be the number of overtime hours per worker with a significant decline during the crisis.
From the above discussion, the main findings of the analysis can shortly be summarized as follows:
– The primary (aggregate) mode of adjustment to the crisis was a decline in employment, although the intensity of decline in real wages exceeded that of employment reduction in the last observed year, i.e. 2012. There are, how-ever, considerable differences in adjustment patterns across economic activities.
– During the crisis, jobs were lost in the more dynamic private sector, while the number of jobs in the public sector (entities in state ownership) slightly increased. Jobs were also lost in entities in mixed ownership during the crisis, but this is a continuation of a longer term trend.
– Economic activities with comparatively larger shares of women in employment have experienced fewer employment cuts and the aggregate employment share of women rose in the crisis. Their share increased more strongly in activities with a larger share of public sector workers.
– There is a declining share of younger workers during the crisis. – Employees with comparatively lower educational attainments face severe challenges in the labor market, which is a longer term trend, not specific to the crisis period. There are indications that this group of employees enjoys a higher level of protection in the public sector.
– Analysis also shows a rising significance of more flexible forms of employment: the share of fixed term employees has been increasing during the last two observed years, especially in economic activities with larger shares of private sector employment and younger workers. Similarly, the share of part time workers increased during the crisis, particularly in activities with comparatively large shares of women employees, those with higher education and fixed term employees.
go
ra
n vu
kšić:
emplo
ym
ent a
nd em
ploy
men
t co
nd
ition
s in the c
ur
ren
t eco
no
mic c
risis in c
ro
atiafin
an
cia
l theo
ry an
d pr
ac
tice
38 (2) 103-138 (2014)133 – Working hours do not exhibit any strong trends specific to the crisis, except
for the diminishing number of overtime hours per worker.
The fact that the intensity of adjustment to crisis on the employment side has been stronger than on the side of wages (mostly during the first two years of the crisis) implies that the costs of crisis have been unevenly shared among workers in the sense that some lost all of their labor income. This puts the unemployment benefits aspect of the social system at the center of interest, i.e. policies which should mitigate the negative consequences of complete, or at least severe, labor income losses (see Khanna, Newhouse and Paci, 2010). However, instead of discussing the efficiency of possible models of compensating for income losses of the laid off workers, one might want to consider possibilities of mitigating the income losses in the first place. In the context of the concentration of social consequences to laid-off workers, Matković, Arandarenko and Šošić (2010) suggest that it increases the general level of insecurity and that the alternative to it is to have a more even distribution of risks, e.g. through a social pact on wages or measures relating to the efficient distribution of working hours. One could state more generally that labor market policies increasing the flexibility of wages or working hours may contribute to such a more even distribution of risks resulting from negative labor market trends. However, even if wages are rigid, government may use fiscal instruments to lower labor costs generally, by altering the structure of budget revenues and shifting the tax (including social contributions) burden away from labor income. This could have positive effects on labor demand and it could make it easier for employers to keep more workers in the present crisis. Unfortunately, the only policy measure in this direction (reduction of health insurance contributions paid by the employer by 2 percentage points from May 2012), turned out to be only temporary.
Results also indicate that the situation for young workers deteriorated significa-ntly during the crisis. This in turn requires policy makers to take more active roles and come up with tailored measures facilitating employment for this age group, and/or promoting their further education. The latter should relieve the pressures on the labor supply side, and increase young people’s employment chances in future as the evidence shows a clear trend of stronger demand for workers with higher educational attainments (this also presents an argument to promote more adult education and lifelong learning). A policy measure facilitating the hiring of young workers without previous work experience was adopted in May 2012,15 enabling employers to hire young workers registered at the Croatian Employment Service for one year (or two in some cases) without signing a labor contract. The employer is only obliged to pay for retirement insurance contributions, while other costs are borne by the state. The measure has been criticized by some, suggesting that it can lead to misuse in private sector and reduce chances of young
15 ‟The Law on Stimulating Employment” has been published in the Official Gazette No. 57, 2012. This act also contains provisions facilitating the employment of long-term unemployed persons.
go
ra
n vu
kšić:
emplo
ym
ent a
nd em
ploy
men
t co
nd
ition
s in the c
ur
ren
t eco
no
mic c
risis in c
ro
atiafin
an
cia
l theo
ry an
d pr
ac
tice
38 (2) 103-138 (2014)
134 workers getting regular employment (Clauwaert and Schömann, 2013). There are a number of other active policies and programs (see discussions in Ha et al., 2010; or in Scarpetta, Sonnet and Manfredi, 2010) which can be implemented in order to relieve young workers of their present hardships, and, thus, prevent their longer term unemployment with longer term consequences for the whole society.

go
ra
n vu
kšić:
emplo
ym
ent a
nd em
ploy
men
t co
nd
ition
s in the c
ur
ren
t eco
no
mic c
risis in c
ro
atiafin
an
cia
l theo
ry an
d pr
ac
tice
38 (2) 103-138 (2014)135appendix
employment dataPersons in employment are persons who have signed a work contract with the employer for a fixed or unspecified period of time, irrespective of their contractual working time or of the type of ownership of the business entity. Persons in paid employment include trainees, persons on maternity or paternity leave, on sick leave or absent from work for other reasons, until the cessation of employment. They also include self-employed persons who work in their own trade company, enterprise, craft or freelances.
owners of craft and trade or freelance shops are persons who have established with their own means, a shop or a freelance occupation where they, in their own name and on their account, perform an activity, alone or with employees.
employees in crafts and trades and freelance occupations are persons who have signed a work contract with an employer for a fixed or specified period of time.
Insured private farmers are employed persons performing agricultural activity as the sole occupation as landowners, tenure holders or holders of concessions to agricultural land.
educational (professional) attainment is the highest level of education acquired by a person upon completing an appropriate school or course, sitting for exams or receiving recognition based on proving professional attainment in a business entity. The level acquired can be proved by the appropriate official document (diploma, certificate, degree). CBS distinguishes between ten different levels of educational attainment in its data, which are grouped for the needs of the present study in the following way: higher education (doctors, masters, others with university degree and those with non-university college education); secondary education; and basic education including skilled and unskilled workers (basic school education, highly skilled, skilled, semi-skilled and unskilled). The group of employees with basic education, including skilled and unskilled workers is referred to as the group of employees with lower educational attainment.
full time work lasts 40 hours a week, if not prescribed otherwise by law, collective agreement or work contract.
Part time work is practiced in the case when the quantity of work is such that it does not need full working time to be completed.
short time work is practiced in the case when the nature of work is such that the employee cannot be protected from harmful effects by safety measures at work.
go
ra
n vu
kšić:
emplo
ym
ent a
nd em
ploy
men
t co
nd
ition
s in the c
ur
ren
t eco
no
mic c
risis in c
ro
atiafin
an
cia
l theo
ry an
d pr
ac
tice
38 (2) 103-138 (2014)
136 Hours actually worked include effective hours of work, hours of waiting, stoppage or interruption at work which employees are not responsible for.
Hours not actually worked which are paid in a legal entity include hours of vacation, holidays and days off prescribed by law, professional education, sick leave covered by a legal entity, paid leave and other absent hours paid.
Hours not actually worked which are paid out of a legal entity include sick leave of 42 days and longer, maternity leave, hours of parent short time work, etc.
Non-paid hours include non-paid leave and other hours not actually worked for which no pay is received.
wagesGross monthly earning (gross wages) covers everything that is included in the monthly paid net earnings (earnings of persons in paid employment in legal entities earned for work done during regular working hours, and pays for annual leave, paid leave, public holidays and free days established by the law, sickness pay for up to 42 days, absence for the continuing professional education, job stoppages caused against a person’s will or no fault of his own and receipts on the basis of reimbursements, supports and awards in amounts for which contributions, taxes and surtaxes must be paid) plus participation, co-payments, contributions and taxes, as prescribed by law.
Source of definitions: Croatian Bureau of Statistics (CBS): Statistical Yearbook of the Republic of Croatia (chapters: 6. Employment; and 7. Earnings and labor costs).
go
ra
n vu
kšić:
emplo
ym
ent a
nd em
ploy
men
t co
nd
ition
s in the c
ur
ren
t eco
no
mic c
risis in c
ro
atiafin
an
cia
l theo
ry an
d pr
ac
tice
38 (2) 103-138 (2014)137references
1. Arellano, M. and Bond, S., 1991. Some tests of specification for panel data: Monte Carlo evidence and an application to employment equations. Review of Economic Studies, 58 (2), pp. 277-297. doi: 10.2307/2297968
2. Bagić, D. 2010. Industrijski odnosi u Hrvatskoj: društvena integracija ili tržišni sukob. Zagreb: TIM press.
3. Barakat, B. [et al.], 2010. The Impact of the Economic Crisis on Labour and Education in Europe. Vienna Institute of Demography Working Papers, No. 6/2010.
4. Bell, D. N. F. and Blanchflower, D. G., 2010. Youth Unemployment: Déjà vu? IZA Discussion Paper, No. 4705.
5. Bell, D. N. F. and Blanchflower, D. G., 2011. Young People and the Great Recession. IZA Discussion Paper, No. 5674.
6. Cho, Y. and Newhouse, D., 2013. How Did the Great Recession Affect Different Types of Workers? Evidence from 17 Middle-Income Countries. World Development, 41, pp. 31-50. doi: 10.1016/j.worlddev.2012.06.003
7. Clauwaert, S. and Schömann, I., 2013. The crisis and national labour law re-forms: a mapping exercise. Country report: Croatia. Brussels: European Trade Union Institute.
8. Fallon, P. R. and Lucas, R. E. B., 2002. The Impact of Financial Crises on Labor Markets, Household Incomes, and Poverty: A Review of Evidence. The World Bank Research Observer, 17, pp. 21-45. doi: 10.1093/wbro/17.1.21
9. Ha, B-J. [et al.], 2010. Youth Employment in Crisis. International Institute for Labour Studies Discussion paper, DP/201/2010.
10. Khanna, G., Newhouse, D. and Paci, P., 2010. Fewer Jobs or Smaller Paychecks? Labor Market Impacts of the Recent Crisis in Middle-Income Countries. Eco-nomic Premise, No. 11.
11. Krznar, I. and Kunovac, D., 2010. Impact of External Shocks on Domestic Inflation and GDP. Croatian National Bank Working Papers, W-26.
12. Leung, R., Stampini, M. and Vencatachellum, D., 2009. Does Human Capital Protect Workers against Exogenous Shocks? South Africa in the 2008-2009 Crisis. IZA Discussion Paper, No. 4608.
13. Matković, T. and Biondić, I., 2003. Reforma Zakona o radu i promjena indeksa zakonske zaštite zaposlenja. Financijska teorija i praksa, 27(4), pp. 515-528.
14. Matković, T., Arandarenko, M. and Šošić, V., 2010. Utjecaj ekonomske krize na tržište rada. UNDP. Available at: <http://www.undp.hr/upload/file/234/117299/FILENAME/Trzisterada_HR_fin.pdf>.
15. Pavičić, D., 2010. Donesen je novi Zakon o radu. Računovodstvo, revizija i financije, No. 1/10.
go
ra
n vu
kšić:
emplo
ym
ent a
nd em
ploy
men
t co
nd
ition
s in the c
ur
ren
t eco
no
mic c
risis in c
ro
atiafin
an
cia
l theo
ry an
d pr
ac
tice
38 (2) 103-138 (2014)
138 16. Pavičić, D., 2011. Izmjene i dopune Zakona o radu. Računovodstvo, revizija i financije, No. 7/11.
17. Rutkowski, J., 2003a. Does Strict Employment Protection Discourage Job Creation? Evidence from Croatia. World Bank Policy Research Working Pa-pers, No. 3104.
18. Rutkowski, J., 2003b. Analiza i prijedlozi poboljšanja tržišta rada u Hrvatskoj. Financijska teorija i praksa, 27(4), pp. 495-513.
19. Sabarwal, S., Sinha, N. and Buvinic, M., 2011. How Do Women Weather Economic Shocks? What We Know. Economic Premise, No. 46.
20. Scarpetta, S., Sonnet, A. and Manfredi, T., 2010. Rising Youth Unemployment During the Crisis: How to Prevent Negative Long-Term Consequences on a Generation? OECD Social, Employment and Migration Papers, No. 106.
21. Signorelli, M., Choudhry, M. and Marelli, F., 2012. The Impact of Financial Crisis on Female Labour. European Journal of Development Research, 24, pp. 413433. doi: 10.1057/ejdr.2012.3
22. Šošić, V., 2004. Regulation and flexibility of the Croatian labor market. The WIIW Balkan Observatory Working Papers, No. 48.
23. Šošić, V., 2008. Contribution of Gross Job Flows to the Dynamics of Corporate Restructuring in Croatia. Financial Theory and Practice, 32(4), pp. 499-517.
24. Verick, S., 2009. Who is Hit Hardest during a Financial Crisis? The Vulnerability of Young Men and Women to Unemployment in an Economic Downturn. IZA Discussion Paper, No. 4359.
25. Vidović, A., 2013. Novosti u Zakonu o radu – ugovor o radu na određeno, probni rad i druge promjene. Računovodstvo, revizija i financije, No. 8/13.
26. Vukšić, G., 2012. Sectoral wage dynamics and intersectoral linkages in Croatia in the context of export competitiveness. The WIIW Balkan Observatory Working Papers, No. 99.
27. World Bank, 2009. Croatia’s EU Convergence Report: Reaching and Sustain-ing Higher Rates of Economic Growth. Washington: The World Bank.
28. World Bank, 2010. Croatia: Social Impact of the Crisis and Building Resil-ience. Washington: The World Bank.
29. World Bank, 2011. Employment Protection Legislation and Labor Market Outcomes: Theory, Evidence and Lessons for Croatia. Washington: The World Bank.
Related Documents