61% 2012 $5,615 THE KAISER FAMILY FOUNDATION -AND- HEALTH RESEARCH & EDUCATIONAL TRUST 2012 Summary of Findings Employer Health Benefits 1 E mployer-sponsored insurance is the leading source of health insurance in America, covering about 149 million nonelderly people. 1 To provide current information about the nature of employer-sponsored health benefits, the Kaiser Family Foundation (Kaiser) and the Health Research & Educational Trust (HRET) conduct an annual national survey of nonfederal private and public employers with three or more workers. This is the fourteenth Kaiser/HRET survey and reflects health benefit information for 2012. The key findings from the survey, conducted from January through May 2012, include modest increases in the average single and family insurance premiums and little change in the premium contributions and cost sharing that workers face since last year. Enrollment in high deductible plans with a savings option, such as a health savings account or health reimbursement arrangement, did not increase significantly over the previous year for the first time since 2009. The share of workers in a grandfathered health plan decreased significantly from the previous year to 48% of covered workers. Approximately 2.9 million adult children who were previously not eligible for benefits now have health insurance coverage through their parents due to the Affordable Care Act. In addition, the 2012 survey includes questions on employer wellness programs, including the percentage of plans with financial rewards or penalties for completing health programs or achieving biometric targets. HEALTH INSURANCE PREMIUMS AND WORKER CONTRIBUTIONS The average annual premiums for employer-sponsored health insurance in 2012 are $5,615 for single coverage and $15,745 for family coverage. Compared to 2011, the average premium for single coverage ($5,429) is 3% higher and the average premium for family coverage ($15,073) is 4% higher. Since 2002, average premiums for family coverage have increased 97% (Exhibit A). The growth in premiums has outpaced increases in both workers’ wages (1.7% since 2011 and 33% since 2002) and inflation (2.3% since 2011 and 28% since 2002). 2 The average premium for family coverage is lower for workers in small firms (3–199 workers) than for workers in large firms (200 or more workers) ($15,253 vs. $15,980). Average premiums for high- deductible health plans with a savings option (HDHP/SOs) are lower than the overall average for all plan types for both single and family coverage (Exhibit B), at $4,928 and $14,129, respectively. Average single and family premiums are higher in the Northeast and lower in the South when compared to the other regions. There is significant variation in the average annual premiums as a result of factors such as benefits, cost sharing, and geographical cost differences. Nineteen percent of covered workers are in plans with an annual total premium for family coverage of at least $18,894 (120% of the average family premium), while 20% of covered workers are in plans where the family premium is less than $12,596 (less than 80% of the average family premium). The distribution is similar around the average single premium (Exhibit C). Covered workers contribute on average 18% of the premium for single coverage and 28% of the premium for family coverage, the same percentages they contributed in 2011 and relatively unchanged over the past decade. Workers in small firms (3–199 workers) contribute a lower average percentage for single coverage compared to workers in larger firms (16% vs. 18%), but a higher average percentage for family coverage (35% vs. 25%). As with total premiums, the share of the premium contributed by workers varies considerably around these averages. For single coverage, 61% of covered workers are in plans that require them to make a contribution of less than or equal to a quarter of the total premium and 2% are in plans that require a contribution of more than half of the premium; while 16% are in plans that require no contribution at all. For family coverage, 43% of covered workers are in plans that require them to make a contribution of less than or equal to a quarter of the total premium and 14% are in plans that require more than half of the premium; only 6% are in plans that require no contribution for family coverage (Exhibit D). $2,137 $4,316 $5,866 $11,429 2002 2012 Worker Contribution Employer Contribution $8,003 $15,745 97% Total Premium Increase 102% Worker Contribution Increase EXHIBIT A Average Annual Health Insurance Premiums and Worker Contributions for Family Coverage, 2002–2012 Source: Kaiser/HRET Survey of Employer-Sponsored Health Benefits, 2002–2012.

Welcome message from author
This document is posted to help you gain knowledge. Please leave a comment to let me know what you think about it! Share it to your friends and learn new things together.
Transcript
61% 2012 $5,615T H E K A I S E R F A M I L Y F O U N D A T I O N - A N D - H E A L T H R E S E A R C H & E D U C A T I O N A L T R U S T
2 0 1 2 S u m m a r y o f F i n d i n g sEmployer Health Benefits
1
Employer-sponsored insurance is the leading source of health insurance in America, covering about 149 million nonelderly
people.1 To provide current information about the nature of employer-sponsored health benefits, the Kaiser Family
Foundation (Kaiser) and the Health Research & Educational Trust (HRET) conduct an annual national survey of nonfederal
private and public employers with three or more workers. This is the fourteenth Kaiser/HRET survey and reflects health benefit
information for 2012.
The key findings from the survey, conducted from January through May 2012, include modest increases in the average single and family insurance premiums and little change in the premium contributions and cost sharing that workers face since last year. Enrollment in high deductible plans with a savings option, such as a health savings account or health reimbursement arrangement, did not increase significantly over the previous year for the first time since 2009. The share of workers in a grandfathered health plan decreased significantly from the previous year to 48% of covered workers. Approximately 2.9 million adult children who were previously not eligible for benefits now have health insurance coverage through their parents due to the Affordable Care Act. In addition, the 2012 survey includes questions on employer wellness programs, including the percentage of plans with financial rewards or penalties for completing health programs or achieving biometric targets.
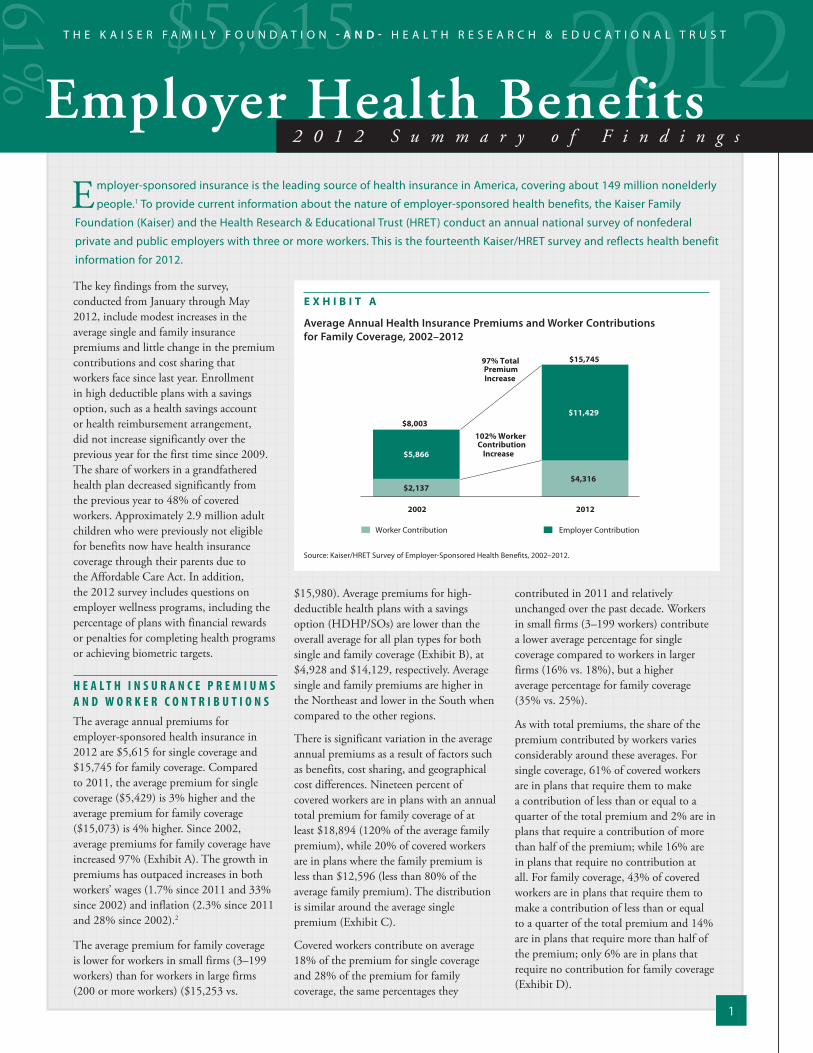
H E A L T H I N S U R A N C E P R E M I U M S A N D W O R K E R C O N T R I B U T I O N SThe average annual premiums for employer-sponsored health insurance in 2012 are $5,615 for single coverage and $15,745 for family coverage. Compared to 2011, the average premium for single coverage ($5,429) is 3% higher and the average premium for family coverage ($15,073) is 4% higher. Since 2002, average premiums for family coverage have increased 97% (Exhibit A). The growth in premiums has outpaced increases in both workers’ wages (1.7% since 2011 and 33% since 2002) and inflation (2.3% since 2011 and 28% since 2002).2
The average premium for family coverage is lower for workers in small firms (3–199 workers) than for workers in large firms (200 or more workers) ($15,253 vs.
$15,980). Average premiums for high-deductible health plans with a savings option (HDHP/SOs) are lower than the overall average for all plan types for both single and family coverage (Exhibit B), at $4,928 and $14,129, respectively. Average single and family premiums are higher in the Northeast and lower in the South when compared to the other regions.
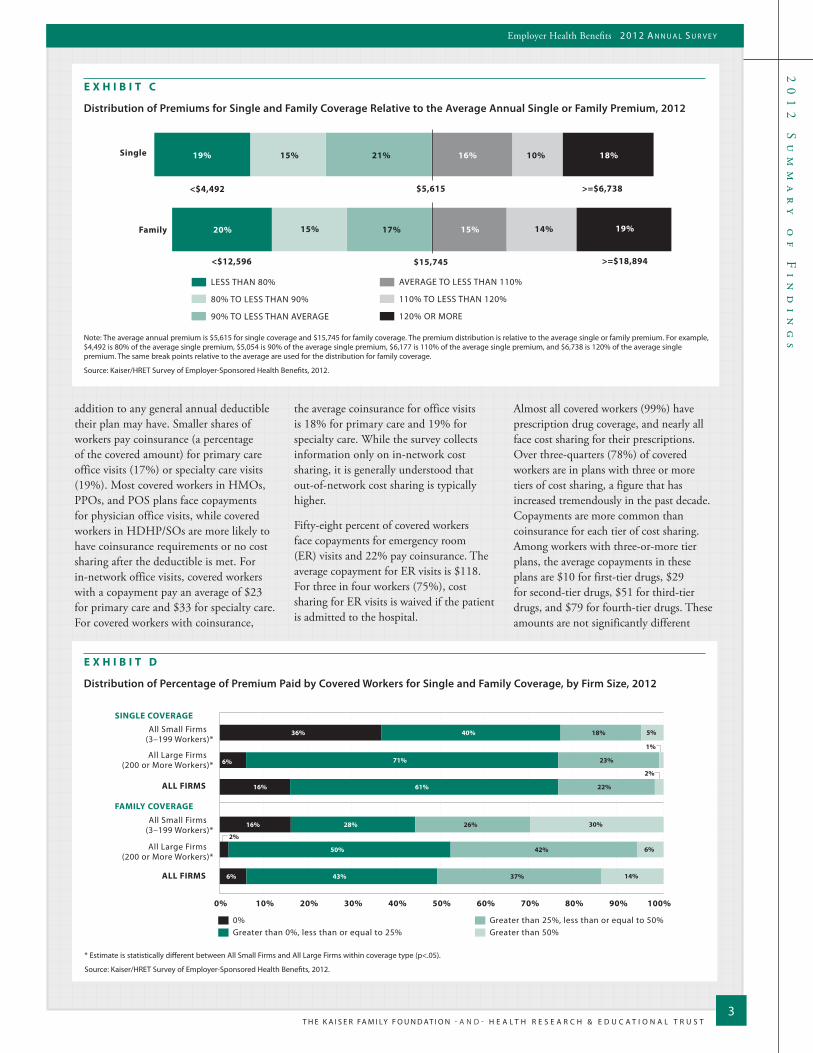
There is significant variation in the average annual premiums as a result of factors such as benefits, cost sharing, and geographical cost differences. Nineteen percent of covered workers are in plans with an annual total premium for family coverage of at least $18,894 (120% of the average family premium), while 20% of covered workers are in plans where the family premium is less than $12,596 (less than 80% of the average family premium). The distribution is similar around the average single premium (Exhibit C).
Covered workers contribute on average 18% of the premium for single coverage and 28% of the premium for family coverage, the same percentages they
contributed in 2011 and relatively unchanged over the past decade. Workers in small firms (3–199 workers) contribute a lower average percentage for single coverage compared to workers in larger firms (16% vs. 18%), but a higher average percentage for family coverage (35% vs. 25%).
As with total premiums, the share of the premium contributed by workers varies considerably around these averages. For single coverage, 61% of covered workers are in plans that require them to make a contribution of less than or equal to a quarter of the total premium and 2% are in plans that require a contribution of more than half of the premium; while 16% are in plans that require no contribution at all. For family coverage, 43% of covered workers are in plans that require them to make a contribution of less than or equal to a quarter of the total premium and 14% are in plans that require more than half of the premium; only 6% are in plans that require no contribution for family coverage (Exhibit D).
$2,137 $4,316
$5,866
$11,429
2002 2012
Worker Contribution Employer Contribution
$8,003
$15,745 97% Total Premium Increase
102% Worker Contribution
Increase
E X H I B I T A
Average Annual Health Insurance Premiums and Worker Contributions for Family Coverage, 2002–2012
Source: Kaiser/HRET Survey of Employer-Sponsored Health Benefits, 2002–2012.
T H E K A I S E R FA M I LY F O U N D AT I O N - A N D - H E A L T H R E S E A R C H & E D U C A T I O N A L T R U S T
20
12
S
um
ma
ry
o
f
Fi
nd
in
gs
2
Employer Health Benefits 2 0 1 2 A n n u A l S u r v e y
E X H I B I T B
Average Annual Firm and Worker Premium Contributions and Total Premiums for Covered Workers for Single and Family Coverage, by Plan Type, 2012
Single
HMO
Family
ALL PLANS
HDHP/SO
Single
Family
PPO
Single
Family
POS
Single
Single
Family
Family
Worker Contribution Employer Contribution
$0 $2,000 $4,000 $6,000 $8,000 $10,000 $12,000 $14,000 $16,000 $18,000
$941 $4,408
$4,148 $11,140
$921 $4,508
$1,002
$784
$5,333*
$5,057*
$9,927
$4,582
$4,129 $10,944
$4,072 $11,333
$3,634
$4,070*
$10,070*
$1,114*
$4,563
$1,002
$4,410
$743*
$4,578
$765*
$3,720*
$951
$4,316
$4,554
$11,166
$4,848*
$11,947
$4,765
$10,800
$4,163*
$10,409*
$4,664
$11,429
$5,668
$15,729
$5,850*
$16,356*
$5,507
$15,378
$4,928*
$14,129*
$5,615
$15,745
* Estimate is statistically different from All Plans estimate by coverage type (p<.05).
Source: Kaiser/HRET Survey of Employer-Sponsored Health Benefits, 2012.
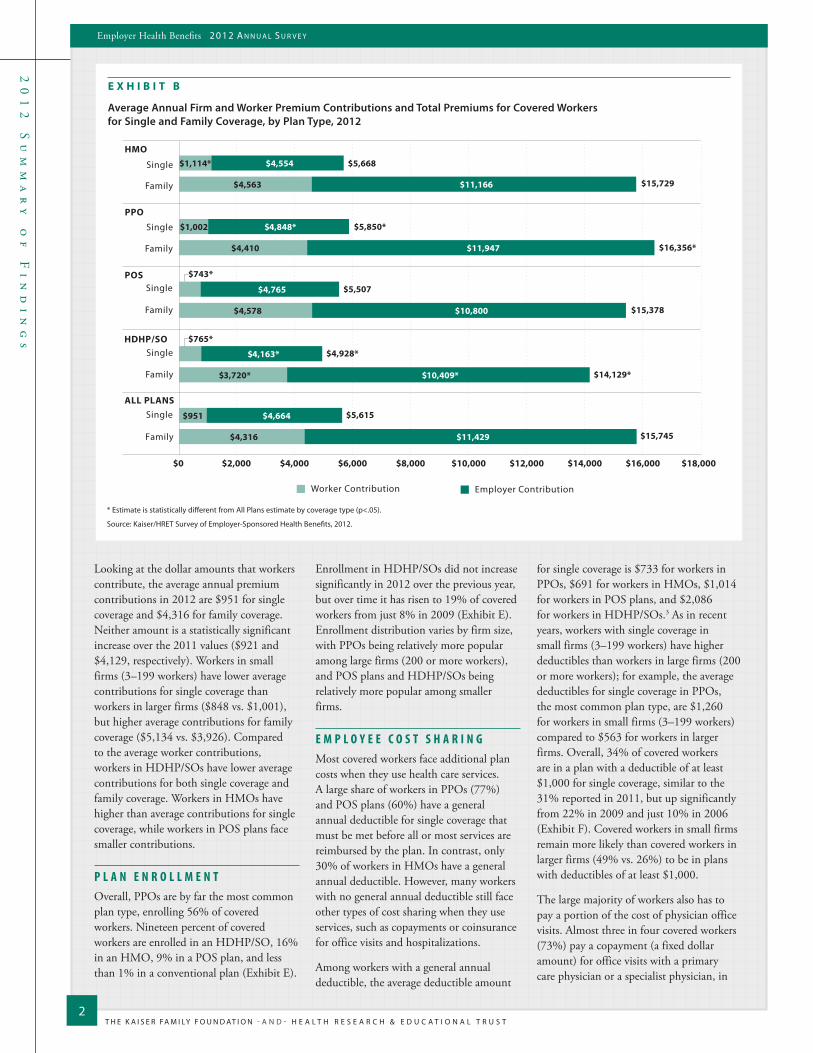
Looking at the dollar amounts that workers contribute, the average annual premium contributions in 2012 are $951 for single coverage and $4,316 for family coverage. Neither amount is a statistically significant increase over the 2011 values ($921 and $4,129, respectively). Workers in small firms (3–199 workers) have lower average contributions for single coverage than workers in larger firms ($848 vs. $1,001), but higher average contributions for family coverage ($5,134 vs. $3,926). Compared to the average worker contributions, workers in HDHP/SOs have lower average contributions for both single coverage and family coverage. Workers in HMOs have higher than average contributions for single coverage, while workers in POS plans face smaller contributions.
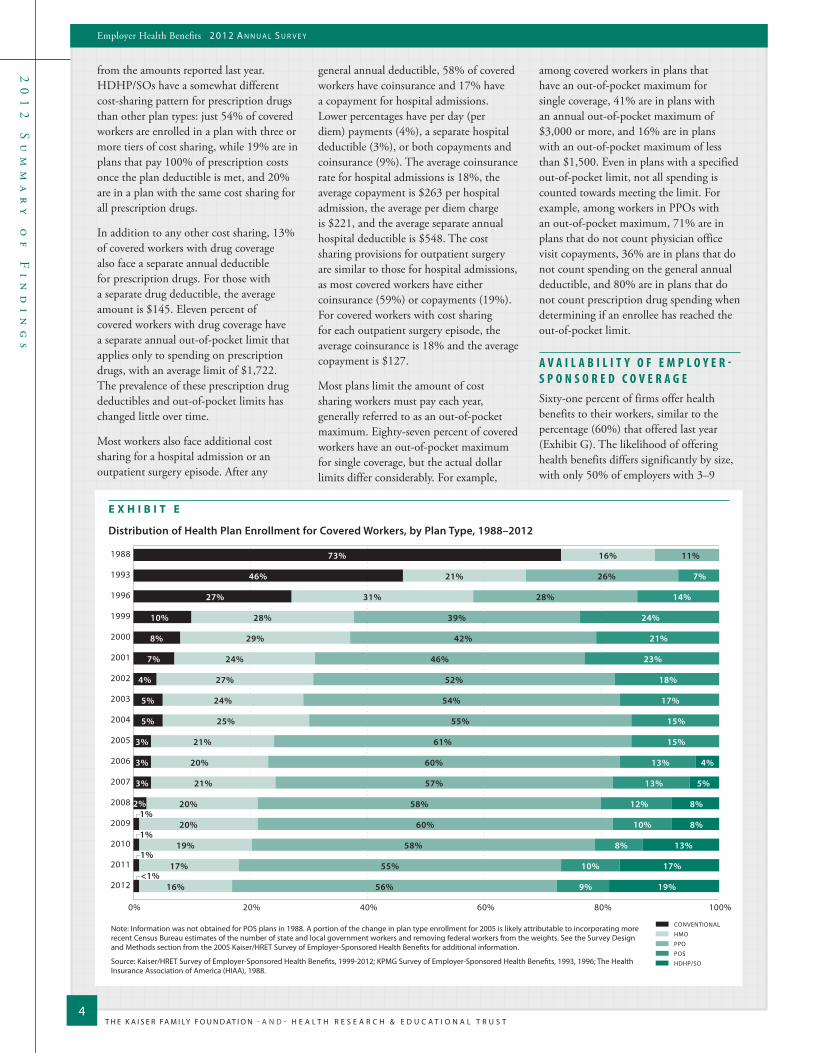
P L A N E N R O L L M E N TOverall, PPOs are by far the most common plan type, enrolling 56% of covered workers. Nineteen percent of covered workers are enrolled in an HDHP/SO, 16% in an HMO, 9% in a POS plan, and less than 1% in a conventional plan (Exhibit E).
Enrollment in HDHP/SOs did not increase significantly in 2012 over the previous year, but over time it has risen to 19% of covered workers from just 8% in 2009 (Exhibit E). Enrollment distribution varies by firm size, with PPOs being relatively more popular among large firms (200 or more workers), and POS plans and HDHP/SOs being relatively more popular among smaller firms.
E M P L O Y E E C O S T S H A R I N GMost covered workers face additional plan costs when they use health care services. A large share of workers in PPOs (77%) and POS plans (60%) have a general annual deductible for single coverage that must be met before all or most services are reimbursed by the plan. In contrast, only 30% of workers in HMOs have a general annual deductible. However, many workers with no general annual deductible still face other types of cost sharing when they use services, such as copayments or coinsurance for office visits and hospitalizations.
Among workers with a general annual deductible, the average deductible amount
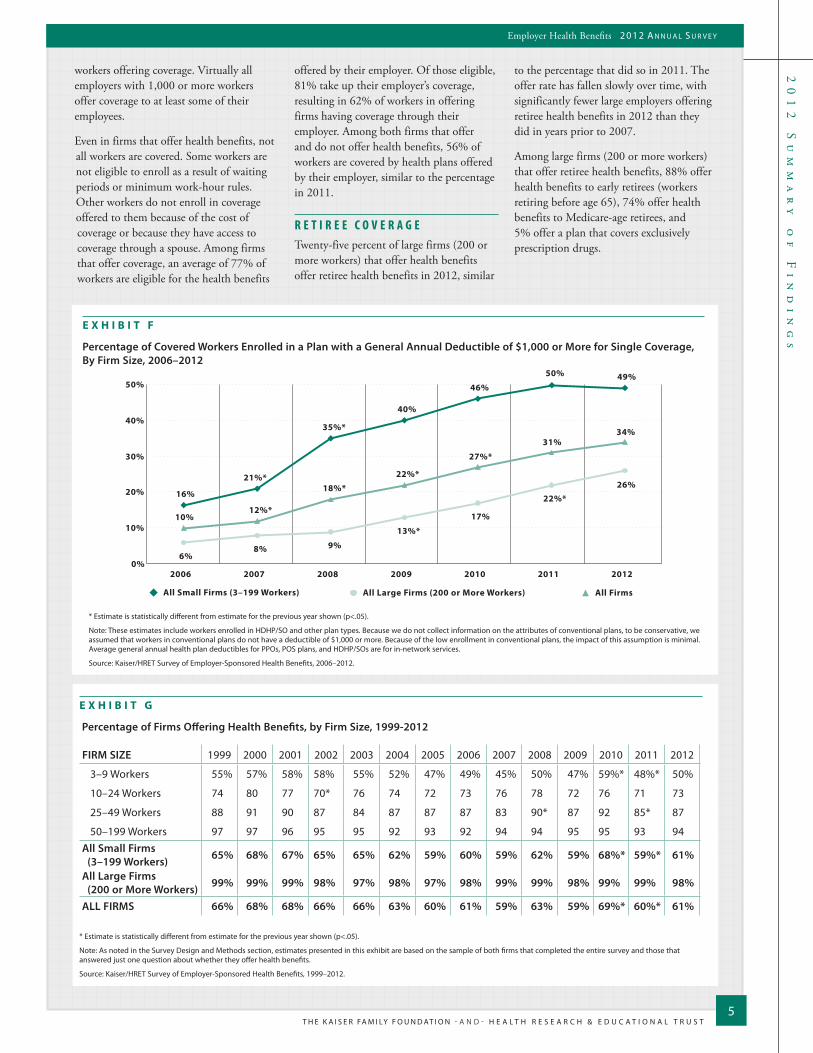
for single coverage is $733 for workers in PPOs, $691 for workers in HMOs, $1,014 for workers in POS plans, and $2,086 for workers in HDHP/SOs.3 As in recent years, workers with single coverage in small firms (3–199 workers) have higher deductibles than workers in large firms (200 or more workers); for example, the average deductibles for single coverage in PPOs, the most common plan type, are $1,260 for workers in small firms (3–199 workers) compared to $563 for workers in larger firms. Overall, 34% of covered workers are in a plan with a deductible of at least $1,000 for single coverage, similar to the 31% reported in 2011, but up significantly from 22% in 2009 and just 10% in 2006 (Exhibit F). Covered workers in small firms remain more likely than covered workers in larger firms (49% vs. 26%) to be in plans with deductibles of at least $1,000.
The large majority of workers also has to pay a portion of the cost of physician office visits. Almost three in four covered workers (73%) pay a copayment (a fixed dollar amount) for office visits with a primary care physician or a specialist physician, in
20
12
S
um
ma
ry
o
f
Fi
nd
in
gs
T H E K A I S E R FA M I LY F O U N D AT I O N - A N D - H E A L T H R E S E A R C H & E D U C A T I O N A L T R U S T
Employer Health Benefits 2 0 1 2 A n n u A l S u r v e y
3
addition to any general annual deductible their plan may have. Smaller shares of workers pay coinsurance (a percentage of the covered amount) for primary care office visits (17%) or specialty care visits (19%). Most covered workers in HMOs, PPOs, and POS plans face copayments for physician office visits, while covered workers in HDHP/SOs are more likely to have coinsurance requirements or no cost sharing after the deductible is met. For in-network office visits, covered workers with a copayment pay an average of $23 for primary care and $33 for specialty care. For covered workers with coinsurance,
the average coinsurance for office visits is 18% for primary care and 19% for specialty care. While the survey collects information only on in-network cost sharing, it is generally understood that out-of-network cost sharing is typically higher.
Fifty-eight percent of covered workers face copayments for emergency room (ER) visits and 22% pay coinsurance. The average copayment for ER visits is $118. For three in four workers (75%), cost sharing for ER visits is waived if the patient is admitted to the hospital.
Almost all covered workers (99%) have prescription drug coverage, and nearly all face cost sharing for their prescriptions. Over three-quarters (78%) of covered workers are in plans with three or more tiers of cost sharing, a figure that has increased tremendously in the past decade. Copayments are more common than coinsurance for each tier of cost sharing. Among workers with three-or-more tier plans, the average copayments in these plans are $10 for first-tier drugs, $29 for second-tier drugs, $51 for third-tier drugs, and $79 for fourth-tier drugs. These amounts are not significantly different
E X H I B I T D
Distribution of Percentage of Premium Paid by Covered Workers for Single and Family Coverage, by Firm Size, 2012
* Estimate is statistically different between All Small Firms and All Large Firms within coverage type (p<.05).
Source: Kaiser/HRET Survey of Employer-Sponsored Health Benefits, 2012.
0% 10% 20% 30% 40% 50% 60% 70% 80% 90% 100%
SINGLE COVERAGE
FAMILY COVERAGE
All Small Firms (3–199 Workers)*
All Large Firms (200 or More Workers)*
ALL FIRMS
All Small Firms (3–199 Workers)*
All Large Firms (200 or More Workers)*
ALL FIRMS
Greater than 25%, less than or equal to 50%Greater than 50%
0%Greater than 0%, less than or equal to 25%
36%
6%
16%
16%
2%
6%
40%
71%
61%
28%
50%
43%
18%
23%
22%
26%
42%
37%
5%
1%
2%
30%
6%
14%
Family
Single 19% 15% 21% 16% 10% 18%
20% 15% 17% 15% 14% 19%
$5,615
$15,745
LESS THAN 80%
80% TO LESS THAN 90%
90% TO LESS THAN AVERAGE
AVERAGE TO LESS THAN 110%
110% TO LESS THAN 120%
120% OR MORE
>=$6,738<$4,492
>=$18,894<$12,596
E X H I B I T C
Distribution of Premiums for Single and Family Coverage Relative to the Average Annual Single or Family Premium, 2012
Note: The average annual premium is $5,615 for single coverage and $15,745 for family coverage. The premium distribution is relative to the average single or family premium. For example, $4,492 is 80% of the average single premium, $5,054 is 90% of the average single premium, $6,177 is 110% of the average single premium, and $6,738 is 120% of the average single premium. The same break points relative to the average are used for the distribution for family coverage.
Source: Kaiser/HRET Survey of Employer-Sponsored Health Benefits, 2012.
T H E K A I S E R FA M I LY F O U N D AT I O N - A N D - H E A L T H R E S E A R C H & E D U C A T I O N A L T R U S T
20
12
S
um
ma
ry
o
f
Fi
nd
in
gs
4
Employer Health Benefits 2 0 1 2 A n n u A l S u r v e y
from the amounts reported last year. HDHP/SOs have a somewhat different cost-sharing pattern for prescription drugs than other plan types: just 54% of covered workers are enrolled in a plan with three or more tiers of cost sharing, while 19% are in plans that pay 100% of prescription costs once the plan deductible is met, and 20% are in a plan with the same cost sharing for all prescription drugs.
In addition to any other cost sharing, 13% of covered workers with drug coverage also face a separate annual deductible for prescription drugs. For those with a separate drug deductible, the average amount is $145. Eleven percent of covered workers with drug coverage have a separate annual out-of-pocket limit that applies only to spending on prescription drugs, with an average limit of $1,722. The prevalence of these prescription drug deductibles and out-of-pocket limits has changed little over time.
Most workers also face additional cost sharing for a hospital admission or an outpatient surgery episode. After any
general annual deductible, 58% of covered workers have coinsurance and 17% have a copayment for hospital admissions. Lower percentages have per day (per diem) payments (4%), a separate hospital deductible (3%), or both copayments and coinsurance (9%). The average coinsurance rate for hospital admissions is 18%, the average copayment is $263 per hospital admission, the average per diem charge is $221, and the average separate annual hospital deductible is $548. The cost sharing provisions for outpatient surgery are similar to those for hospital admissions, as most covered workers have either coinsurance (59%) or copayments (19%). For covered workers with cost sharing for each outpatient surgery episode, the average coinsurance is 18% and the average copayment is $127.
Most plans limit the amount of cost sharing workers must pay each year, generally referred to as an out-of-pocket maximum. Eighty-seven percent of covered workers have an out-of-pocket maximum for single coverage, but the actual dollar limits differ considerably. For example,
among covered workers in plans that have an out-of-pocket maximum for single coverage, 41% are in plans with an annual out-of-pocket maximum of $3,000 or more, and 16% are in plans with an out-of-pocket maximum of less than $1,500. Even in plans with a specified out-of-pocket limit, not all spending is counted towards meeting the limit. For example, among workers in PPOs with an out-of-pocket maximum, 71% are in plans that do not count physician office visit copayments, 36% are in plans that do not count spending on the general annual deductible, and 80% are in plans that do not count prescription drug spending when determining if an enrollee has reached the out-of-pocket limit.
A V A I L A B I L I T Y O F E M P L O Y E R -S P O N S O R E D C O V E R A G ESixty-one percent of firms offer health benefits to their workers, similar to the percentage (60%) that offered last year (Exhibit G). The likelihood of offering health benefits differs significantly by size, with only 50% of employers with 3–9
E X H I B I T E
Distribution of Health Plan Enrollment for Covered Workers, by Plan Type, 1988–2012
73%
46%
27%
10%
8%
7%
4%
5%
5%
3%
3%
3%
16%
21%
31%
28%
29%
24%
27%
24%
25%
21%
20%
21%
20%
20%
19%
17%
16%
11%
26%
28%
39%
42%
46%
52%
54%
55%
61%
60%
57%
58%
60%
58%
55%
56%
7%
14%
24%
21%
23%
18%
17%
15%
15%
13%
13%
12%
10%
8%
10%
9%
4%
5%
8%
8%
13%
17%
19%
1988
1993
1996
1999
2000
2001
2002
2003
2004
2005
2006
2007
2008
2009
2010
2011
2012
1%
1%
1%
<1%
2%
CONVENTIONAL
HMO
PPO
POS
HDHP/SO
0% 20% 40% 60% 80% 100%
Note: Information was not obtained for POS plans in 1988. A portion of the change in plan type enrollment for 2005 is likely attributable to incorporating more recent Census Bureau estimates of the number of state and local government workers and removing federal workers from the weights. See the Survey Design and Methods section from the 2005 Kaiser/HRET Survey of Employer-Sponsored Health Benefits for additional information.
Source: Kaiser/HRET Survey of Employer-Sponsored Health Benefits, 1999-2012; KPMG Survey of Employer-Sponsored Health Benefits, 1993, 1996; The Health Insurance Association of America (HIAA), 1988.
20
12
S
um
ma
ry
o
f
Fi
nd
in
gs
T H E K A I S E R FA M I LY F O U N D AT I O N - A N D - H E A L T H R E S E A R C H & E D U C A T I O N A L T R U S T
Employer Health Benefits 2 0 1 2 A n n u A l S u r v e y
5
workers offering coverage. Virtually all employers with 1,000 or more workers offer coverage to at least some of their employees.
Even in firms that offer health benefits, not all workers are covered. Some workers are not eligible to enroll as a result of waiting periods or minimum work-hour rules. Other workers do not enroll in coverage offered to them because of the cost of coverage or because they have access to coverage through a spouse. Among firms that offer coverage, an average of 77% of workers are eligible for the health benefits
offered by their employer. Of those eligible, 81% take up their employer’s coverage, resulting in 62% of workers in offering firms having coverage through their employer. Among both firms that offer and do not offer health benefits, 56% of workers are covered by health plans offered by their employer, similar to the percentage in 2011.
R E T I R E E C O V E R A G ETwenty-five percent of large firms (200 or more workers) that offer health benefits offer retiree health benefits in 2012, similar
to the percentage that did so in 2011. The offer rate has fallen slowly over time, with significantly fewer large employers offering retiree health benefits in 2012 than they did in years prior to 2007.
Among large firms (200 or more workers) that offer retiree health benefits, 88% offer health benefits to early retirees (workers retiring before age 65), 74% offer health benefits to Medicare-age retirees, and 5% offer a plan that covers exclusively prescription drugs.
E X H I B I T G
Percentage of Firms Offering Health Benefits, by Firm Size, 1999-2012
* Estimate is statistically different from estimate for the previous year shown (p<.05).
Note: As noted in the Survey Design and Methods section, estimates presented in this exhibit are based on the sample of both firms that completed the entire survey and those that answered just one question about whether they offer health benefits.
Source: Kaiser/HRET Survey of Employer-Sponsored Health Benefits, 1999–2012.
0%
10%
20%
30%
40%
50%
16%
21%*
35%*
40%
46%
50% 49%
6% 8% 9%
13%*
17%
22%* 26%
10% 12%*
18%*
22%*
27%* 31%
34%
2006 2007 2008 2009 2010 2011 2012
All Small Firms (3–199 Workers) All Large Firms (200 or More Workers) All Firms
E X H I B I T F
Percentage of Covered Workers Enrolled in a Plan with a General Annual Deductible of $1,000 or More for Single Coverage, By Firm Size, 2006–2012
* Estimate is statistically different from estimate for the previous year shown (p<.05).
Note: These estimates include workers enrolled in HDHP/SO and other plan types. Because we do not collect information on the attributes of conventional plans, to be conservative, we assumed that workers in conventional plans do not have a deductible of $1,000 or more. Because of the low enrollment in conventional plans, the impact of this assumption is minimal. Average general annual health plan deductibles for PPOs, POS plans, and HDHP/SOs are for in-network services.
Source: Kaiser/HRET Survey of Employer-Sponsored Health Benefits, 2006–2012.
FIRM SIZE 1999 2000 2001 2002 2003 2004 2005 2006 2007 2008 2009 2010 2011 2012
3–9 Workers 55% 57% 58% 58% 55% 52% 47% 49% 45% 50% 47% 59%* 48%* 50%
10–24 Workers 74 80 77 70* 76 74 72 73 76 78 72 76 71 73
25–49 Workers 88 91 90 87 84 87 87 87 83 90* 87 92 85* 87
50–199 Workers 97 97 96 95 95 92 93 92 94 94 95 95 93 94All Small Firms (3–199 Workers) 65% 68% 67% 65% 65% 62% 59% 60% 59% 62% 59% 68%* 59%* 61%
All Large Firms (200 or More Workers) 99% 99% 99% 98% 97% 98% 97% 98% 99% 99% 98% 99% 99% 98%
ALL FIRMS 66% 68% 68% 66% 66% 63% 60% 61% 59% 63% 59% 69%* 60%* 61%
T H E K A I S E R FA M I LY F O U N D AT I O N - A N D - H E A L T H R E S E A R C H & E D U C A T I O N A L T R U S T
20
12
S
um
ma
ry
o
f
Fi
nd
in
gs
6
Employer Health Benefits 2 0 1 2 A n n u A l S u r v e y
W E L L N E S SEmployers continue to offer wellness and other programs as a benefit to their employees. These include offering their employees the opportunity to complete a health risk assessment and offering programs that help employees engage in healthier personal behavior. Some employers have begun to collect biometric information from employees (e.g., cholesterol levels, body mass index) and are using it as part of their wellness and health programs. Some larger employers also are offering on-site medical clinics to provide care for employees for work-related and non-work-related medical conditions.
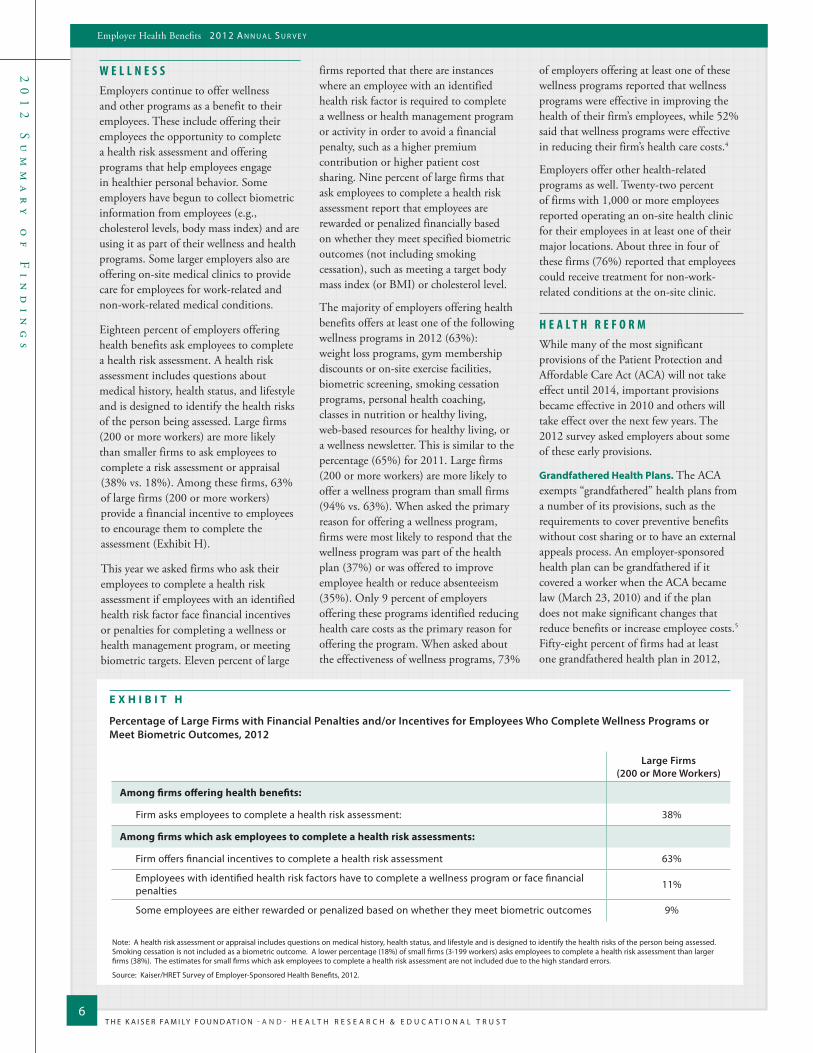
Eighteen percent of employers offering health benefits ask employees to complete a health risk assessment. A health risk assessment includes questions about medical history, health status, and lifestyle and is designed to identify the health risks of the person being assessed. Large firms (200 or more workers) are more likely than smaller firms to ask employees to complete a risk assessment or appraisal (38% vs. 18%). Among these firms, 63% of large firms (200 or more workers) provide a financial incentive to employees to encourage them to complete the assessment (Exhibit H).
This year we asked firms who ask their employees to complete a health risk assessment if employees with an identified health risk factor face financial incentives or penalties for completing a wellness or health management program, or meeting biometric targets. Eleven percent of large
firms reported that there are instances where an employee with an identified health risk factor is required to complete a wellness or health management program or activity in order to avoid a financial penalty, such as a higher premium contribution or higher patient cost sharing. Nine percent of large firms that ask employees to complete a health risk assessment report that employees are rewarded or penalized financially based on whether they meet specified biometric outcomes (not including smoking cessation), such as meeting a target body mass index (or BMI) or cholesterol level.
The majority of employers offering health benefits offers at least one of the following wellness programs in 2012 (63%): weight loss programs, gym membership discounts or on-site exercise facilities, biometric screening, smoking cessation programs, personal health coaching, classes in nutrition or healthy living, web-based resources for healthy living, or a wellness newsletter. This is similar to the percentage (65%) for 2011. Large firms (200 or more workers) are more likely to offer a wellness program than small firms (94% vs. 63%). When asked the primary reason for offering a wellness program, firms were most likely to respond that the wellness program was part of the health plan (37%) or was offered to improve employee health or reduce absenteeism (35%). Only 9 percent of employers offering these programs identified reducing health care costs as the primary reason for offering the program. When asked about the effectiveness of wellness programs, 73%
of employers offering at least one of these wellness programs reported that wellness programs were effective in improving the health of their firm’s employees, while 52% said that wellness programs were effective in reducing their firm’s health care costs.4
Employers offer other health-related programs as well. Twenty-two percent of firms with 1,000 or more employees reported operating an on-site health clinic for their employees in at least one of their major locations. About three in four of these firms (76%) reported that employees could receive treatment for non-work-related conditions at the on-site clinic.
H E A L T H R E F O R MWhile many of the most significant provisions of the Patient Protection and Affordable Care Act (ACA) will not take effect until 2014, important provisions became effective in 2010 and others will take effect over the next few years. The 2012 survey asked employers about some of these early provisions.
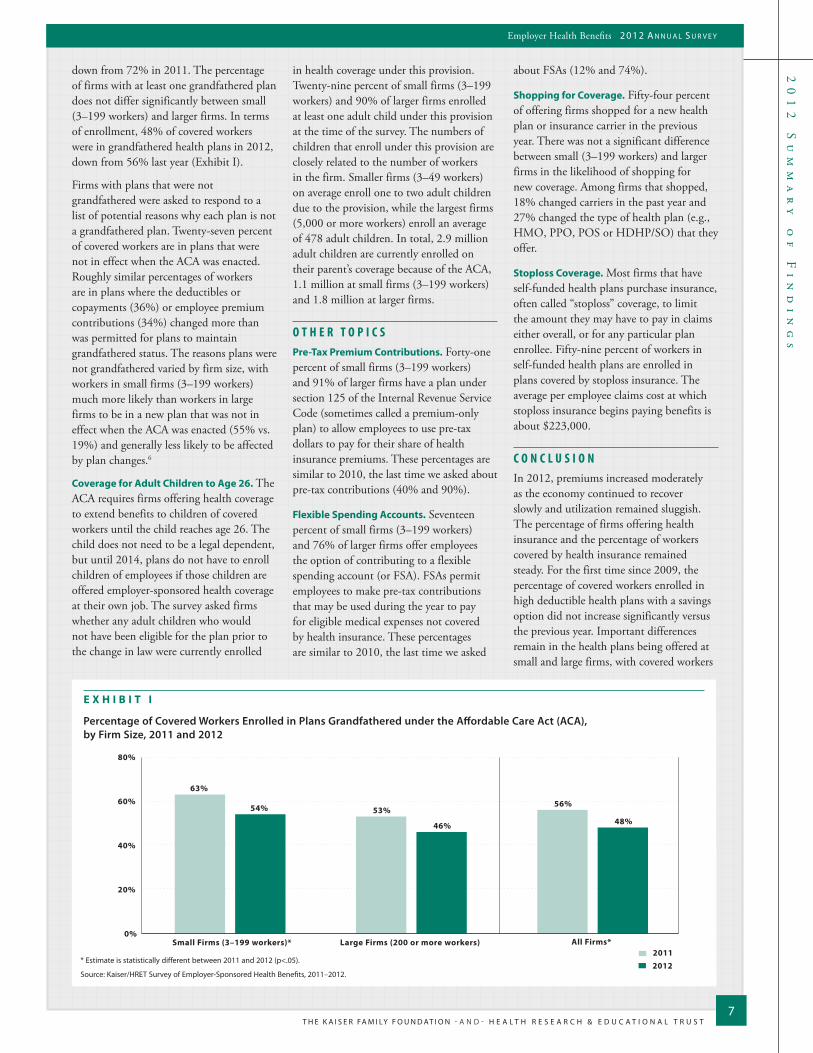
Grandfathered Health Plans. The ACA exempts “grandfathered” health plans from a number of its provisions, such as the requirements to cover preventive benefits without cost sharing or to have an external appeals process. An employer-sponsored health plan can be grandfathered if it covered a worker when the ACA became law (March 23, 2010) and if the plan does not make significant changes that reduce benefits or increase employee costs.5 Fifty-eight percent of firms had at least one grandfathered health plan in 2012,
E X H I B I T H
Percentage of Large Firms with Financial Penalties and/or Incentives for Employees Who Complete Wellness Programs or Meet Biometric Outcomes, 2012
Note: A health risk assessment or appraisal includes questions on medical history, health status, and lifestyle and is designed to identify the health risks of the person being assessed. Smoking cessation is not included as a biometric outcome. A lower percentage (18%) of small firms (3-199 workers) asks employees to complete a health risk assessment than larger firms (38%). The estimates for small firms which ask employees to complete a health risk assessment are not included due to the high standard errors.
Source: Kaiser/HRET Survey of Employer-Sponsored Health Benefits, 2012.
Large Firms(200 or More Workers)
Among firms offering health benefits:
Firm asks employees to complete a health risk assessment: 38%
Among firms which ask employees to complete a health risk assessments:
Firm offers financial incentives to complete a health risk assessment 63%
Employees with identified health risk factors have to complete a wellness program or face financial penalties 11%
Some employees are either rewarded or penalized based on whether they meet biometric outcomes 9%
20
12
S
um
ma
ry
o
f
Fi
nd
in
gs
T H E K A I S E R FA M I LY F O U N D AT I O N - A N D - H E A L T H R E S E A R C H & E D U C A T I O N A L T R U S T
Employer Health Benefits 2 0 1 2 A n n u A l S u r v e y
7
63%
53% 56% 54%
46% 48%
0%
20%
40%
60%
80%
Small Firms (3–199 workers)* Large Firms (200 or more workers) All Firms*20112012
E X H I B I T I
Percentage of Covered Workers Enrolled in Plans Grandfathered under the Affordable Care Act (ACA), by Firm Size, 2011 and 2012
* Estimate is statistically different between 2011 and 2012 (p<.05).
Source: Kaiser/HRET Survey of Employer-Sponsored Health Benefits, 2011–2012.
down from 72% in 2011. The percentage of firms with at least one grandfathered plan does not differ significantly between small (3–199 workers) and larger firms. In terms of enrollment, 48% of covered workers were in grandfathered health plans in 2012, down from 56% last year (Exhibit I).
Firms with plans that were not grandfathered were asked to respond to a list of potential reasons why each plan is not a grandfathered plan. Twenty-seven percent of covered workers are in plans that were not in effect when the ACA was enacted. Roughly similar percentages of workers are in plans where the deductibles or copayments (36%) or employee premium contributions (34%) changed more than was permitted for plans to maintain grandfathered status. The reasons plans were not grandfathered varied by firm size, with workers in small firms (3–199 workers) much more likely than workers in large firms to be in a new plan that was not in effect when the ACA was enacted (55% vs. 19%) and generally less likely to be affected by plan changes.6
Coverage for Adult Children to Age 26. The ACA requires firms offering health coverage to extend benefits to children of covered workers until the child reaches age 26. The child does not need to be a legal dependent, but until 2014, plans do not have to enroll children of employees if those children are offered employer-sponsored health coverage at their own job. The survey asked firms whether any adult children who would not have been eligible for the plan prior to the change in law were currently enrolled
in health coverage under this provision. Twenty-nine percent of small firms (3–199 workers) and 90% of larger firms enrolled at least one adult child under this provision at the time of the survey. The numbers of children that enroll under this provision are closely related to the number of workers in the firm. Smaller firms (3–49 workers) on average enroll one to two adult children due to the provision, while the largest firms (5,000 or more workers) enroll an average of 478 adult children. In total, 2.9 million adult children are currently enrolled on their parent’s coverage because of the ACA, 1.1 million at small firms (3–199 workers) and 1.8 million at larger firms.
O T H E R T O P I C SPre-Tax Premium Contributions. Forty-one percent of small firms (3–199 workers) and 91% of larger firms have a plan under section 125 of the Internal Revenue Service Code (sometimes called a premium-only plan) to allow employees to use pre-tax dollars to pay for their share of health insurance premiums. These percentages are similar to 2010, the last time we asked about pre-tax contributions (40% and 90%).
Flexible Spending Accounts. Seventeen percent of small firms (3–199 workers) and 76% of larger firms offer employees the option of contributing to a flexible spending account (or FSA). FSAs permit employees to make pre-tax contributions that may be used during the year to pay for eligible medical expenses not covered by health insurance. These percentages are similar to 2010, the last time we asked
about FSAs (12% and 74%).
Shopping for Coverage. Fifty-four percent of offering firms shopped for a new health plan or insurance carrier in the previous year. There was not a significant difference between small (3–199 workers) and larger firms in the likelihood of shopping for new coverage. Among firms that shopped, 18% changed carriers in the past year and 27% changed the type of health plan (e.g., HMO, PPO, POS or HDHP/SO) that they offer.
Stoploss Coverage. Most firms that have self-funded health plans purchase insurance, often called “stoploss” coverage, to limit the amount they may have to pay in claims either overall, or for any particular plan enrollee. Fifty-nine percent of workers in self-funded health plans are enrolled in plans covered by stoploss insurance. The average per employee claims cost at which stoploss insurance begins paying benefits is about $223,000.
C O N C L U S I O NIn 2012, premiums increased moderately as the economy continued to recover slowly and utilization remained sluggish. The percentage of firms offering health insurance and the percentage of workers covered by health insurance remained steady. For the first time since 2009, the percentage of covered workers enrolled in high deductible health plans with a savings option did not increase significantly versus the previous year. Important differences remain in the health plans being offered at small and large firms, with covered workers
T H E K A I S E R FA M I LY F O U N D AT I O N - A N D - H E A L T H R E S E A R C H & E D U C A T I O N A L T R U S T
20
12
S
um
ma
ry
o
f
Fi
nd
in
gs
8
Employer Health Benefits 2 0 1 2 A n n u A l S u r v e y
The full report of survey findings (#8345) is available on the Kaiser Family Foundation’s website at www.kff.org.This summary (#8346) is also available at www.kff.org.
- A n d -
The Henry J. Kaiser Family Foundation Headquarters
2400 Sand Hill Road Menlo Park, CA 94025
Phone 650-854-9400 Fax 650-854-4800
Washington Offices and Barbara Jordan Conference Center
1330 G Street, NWWashington, DC 20005
Phone 202-347-5270 Fax 202-347-5274
www.kff.org
Health Research & Educational Trust 155 North Wacker
Suite 400 Chicago, IL 60606
Phone 312-422-2600 Fax 312-422-4568
www.hret.org
The Kaiser Family Foundation, a leader in health policy analysis, health journalism and communication, is dedicated to filling the need for trusted, independent information on the major health issues facing our nation and its people. The Foundation is a non-profit private operating foundation, based in Menlo Park, California.
The Health Research & Educational Trust is a private, not-for-profit organization involved in research, education, and demonstration programs addressing health management and policy issues. Founded in 1944, HRET, an affiliate of the American Hospital Association, collaborates with health care, government, academic, business, and community organizations across the United States to conduct research and disseminate findings that help shape the future of health care.
facing larger premium contributions for family coverage and cost-sharing requirements at smaller firms.
A significant number of firms (18%) are asking their employees to complete a health risk assessment, with a share of employers levying financial penalties to certain workers who do not complete wellness programs or meet biometric outcomes.
Employers continue to implement the early provisions of the Affordable Care Act. Currently 2.9 million children are enrolled in a parent’s employer-sponsored health plan as a result of the ACA. Less than half of covered workers are in grandfathered plans, a reduction from last year. The survey will continue to monitor employers’ responses to health reform and other changes in the insurance market.
M E T H O D O L O G YThe Kaiser Family Foundation/Health Research & Educational Trust 2012 Annual Employer Health Benefits Survey (Kaiser/HRET) reports findings from a telephone survey of 2,121 randomly selected public and private employers with three or more workers. Researchers at the Health Research & Educational Trust, NORC at the University of Chicago, and the Kaiser Family Foundation designed and analyzed the survey. National Research, LLC conducted the fieldwork between January and May 2012. In 2012 the overall response rate is 47%, which includes firms that offer and do not offer health benefits. Among firms that offer health benefits, the survey’s response rate is also 47%.
From previous years’ experience, we learned that firms that decline to participate in the study are less likely to offer health coverage. Therefore, we asked one question to all firms with which we made phone contact, but the firm declined to participate. The question was, “Does your company offer a health insurance program as a benefit to any of your employees?” A total of 3,326 firms responded to this question (including the 2,121 who responded to the full survey and 1,205 who responded to this one question). Their responses are included in our estimates of the percentage of firms offering health coverage. The response rate for this question is 73%. Since firms are selected randomly, it is possible to extrapolate from the sample to national, regional, industry, and firm size estimates using statistical weights. In calculating weights, we first determined the basic weight, then applied a nonresponse adjustment, and finally applied a post-stratification adjustment. We used the U.S. Census Bureau’s Statistics of U.S. Businesses as the basis for the stratification and the post-stratification adjustment for firms in the private sector, and we used the Census of Governments as the basis for post-stratification for firms in the public sector. Some numbers in the exhibits in the report do not sum up to totals due to rounding effects, and, in a few cases, numbers from distribution exhibits referenced in the text may not add due to rounding effects. Unless otherwise noted, differences referred to in the text and exhibits use the 0.05 confidence level as the threshold for significance.
For more information on the survey methodology, please visit the Survey Design and Methods Section at http://ehbs.kff.org/.
_______________________________________________________________________________________________________________________________________________________________________________________________
1 Kaiser Commission on Medicaid and the Uninsured. The Uninsured: A Primer. Kaiser Family Foundation. 2011 Oct. Available from: http://www.kff.org/uninsured/upload/7451-07.pdf. 56.2% of the non-elderly American population receives insurance coverage through an employer-sponsored plan.
2 Kaiser/HRET surveys use the April-to-April time period. The inflation numbers are not seasonally adjusted. Bureau of Labor Statistics. Consumer Price Index, U.S. city average of annual inflation (April to April). [Internet]. Washington (DC): Department of Labor; 2012 [cited 2012 Aug 27]. Available from: http://data.bls.gov/timeseries/CUUR0000SA0?include_graphs=false&output_type=column&years_option=all_years10. Wage data are from the Bureau of Labor Statistics and based on the change in total average hourly earnings of production and nonsupervisory employees. Employment, hours, and earnings from the Current Employment Statistics survey [Internet]. Washington (DC): Department of Labor; 2012 [cited 2012 Aug 27]. Available from: http://data.bls.gov/timeseries/CES0500000008.
3 The survey treats high-deductible plans that can be paired with a savings option as a distinct plan type – High-Deductible Health Plan with Savings Option (HDHP/SO) – even if the plan would otherwise be considered a PPO, HMO, POS plan, or conventional health plan. Specifically for the survey, HDHP/SOs are defined as (1) health plans with a deductible of at least $1,000 for single coverage and $2,000 for family coverage offered with an HRA (referred to as HDHP/HRAs); or (2) high-deductible health plans that meet the federal legal requirements to permit an enrollee to establish and contribute to an HSA (referred to as HSA-qualified HDHPs).
4 Twelve percent of firms indicated that they did not know if wellness programs were effective in improving employees’ health and 13% did not know if wellness programs were effective in reducing costs.
5 Federal Register. Vol. 75, No 221, November 17, 2010, http://www.gpo.gov/fdsys/pkg/FR-2010-11-17/pdf/2010-28861.pdf.6 In 2012 and 2011 firms that indicate “other” were allowed to explain why the plan was no longer eligible. In 2011 firms that indicated that they changed carriers were recoded as having a
new plan. Federal regulations now allow some firms that changed carriers to preserve their grandfather status, and therefore these firms were not recoded as new plans in 2012. 7 Federal Register. Vol. 75, No 92, May 13, 2010, http://www.gpo.gov/fdsys/pkg/FR-2010-05-13/pdf/2010-11391.pdf.
Related Documents