JOURNAL OF Accounting &Economids ELSEVIER Journal of Accounting and Economics 21 (1996) 5 43 Employee stock option exercises An empirical analysis Steven Huddart *'a, Mark Lang b aFuqua School of Business, Duke University, Durham, NC 27708-0120, USA bKenan-Flagler School of Business, University of North Carolina at Chapel Hill, Chapel Hill, NC 27599-3490, USA (Received March 1995; final version received August 1995) Abstract This paper describes the exercise behavior of over 50,000 employees who hold long- term options on employer stock at eight corporations. Employees typically exercise options years before expiration, commonly sacrificing half of the Black-Scholes value. Exercise is strongly associated with recent stock price movements, the market-to-strike ratio, proximity to vesting dates, time to maturity, volatility, and the employee's level within the company. These findings have implications for compensation planners, the FASB as it develops a new accounting standard for options, and financial statement users and preparers who apply and interpret the new FASB standard. Key words: Management compensation; Stock options; Exercise policy; Valuation JEL classification: G12; J33; M41 1. Introduction In this paper, we investigate the exercise behavior of employees who receive nontransferable long-term options on the stock of their employer (employee *Corresponding author. We thank Andrew Alford, Cheryl Breetwor, Patrick Ontko, Nicholas Reitter, Rick Lambert, and Diana Willis for helpful discussions. Participants at workshops at Duke, Laval, Michigan, North Carolina, Stanford, Waterloo, and Wisconsin, and presentations at the Financial Accounting Standards Board, ShareData User Conference, and the Financial Executives Institute Current Financial Reporting Issues Conference provided many valuable comments. We are grateful to ShareData, Inc. for furnishing us with some of the data used in this study and to Debashis Bhattacharya and Kent Klein for research assistance. 0165-4101/96/$15.00 (c~ 1996 Elsevier Science B.V. All rights reserved SSDI 0165-4101(95)00409-C

Welcome message from author
This document is posted to help you gain knowledge. Please leave a comment to let me know what you think about it! Share it to your friends and learn new things together.
Transcript
JOURNAL OF Accounting & Economids
ELSEVIER Journal of Accounting and Economics 21 (1996) 5 43
Employee stock option exercises An empirical analysis
Steven Huddar t *'a, Mark Lang b
aFuqua School of Business, Duke University, Durham, NC 27708-0120, USA bKenan-Flagler School of Business, University of North Carolina at Chapel Hill, Chapel Hill,
NC 27599-3490, USA
(Received March 1995; final version received August 1995)
Abstract
This paper describes the exercise behavior of over 50,000 employees who hold long- term options on employer stock at eight corporations. Employees typically exercise options years before expiration, commonly sacrificing half of the Black-Scholes value. Exercise is strongly associated with recent stock price movements, the market-to-strike ratio, proximity to vesting dates, time to maturity, volatility, and the employee's level within the company. These findings have implications for compensation planners, the FASB as it develops a new accounting standard for options, and financial statement users and preparers who apply and interpret the new FASB standard.
Key words: Management compensation; Stock options; Exercise policy; Valuation
J E L classification: G12; J33; M41
1. Introduction
In this paper, we investigate the exercise behavior of employees who receive nontransferable long-term options on the stock of their employer (employee
*Corresponding author. We thank Andrew Alford, Cheryl Breetwor, Patrick Ontko, Nicholas Reitter, Rick Lambert, and Diana Willis for helpful discussions. Participants at workshops at Duke, Laval, Michigan, North Carolina, Stanford, Waterloo, and Wisconsin, and presentations at the Financial Accounting Standards Board, ShareData User Conference, and the Financial Executives Institute Current Financial Reporting Issues Conference provided many valuable comments. We are grateful to ShareData, Inc. for furnishing us with some of the data used in this study and to Debashis Bhattacharya and Kent Klein for research assistance.
0165-4101/96/$15.00 (c~ 1996 Elsevier Science B.V. All rights reserved SSDI 0 1 6 5 - 4 1 0 1 ( 9 5 ) 0 0 4 0 9 - C
6 S. Huddart, M. Lang / Journal c?[Accounting and Economics 21 (1996) 5-43
stock options or ESOs). We analyze patterns in exercise behavior from the detailed grant and exercise records of eight corporations. Together, these cor- porations issued options to almost 60,000 employees during the last decade. Our results suggest early exercise of ESOs is pervasive, but is not uniform from grant to grant. Determinants of exercise for in-the-money options include recent stock price movements, the market-to-strike ratio, proximity to vesting dates, time to maturity, and volatility. While the paper is primarily descriptive, the results are broadly consistent with predictions in Huddart (1994) who considers the effect of risk aversion on option exercise. Our results suggest the assumptions implicit in the Modified Black Scholes option pricing formula proposed in a 1993 FASB exposure draft do not apply to ESOs.
Coopers and Lybrand (1993) document the increasing importance of stock options in employee compensation over the last decade. The popularity of options has been attributed to the absence of a charge against accounting income for most option compensation, favorable tax treatment, and the positive incentive effect of linking employee compensation to share price. However, little is known about stock options in general, and employee exercise behavior in particular. In part, the poor understanding of ESOs is attributable to the paucity of publicly available data. Disclosure in the annual report typically is limited to a general description of the stock plans; the aggregate number of options outstanding, issued, exercised, and surrendered during the year; and the range of strike prices. Disclosures mandated by the SEC in proxy statements and Forms 3, 4, and 5 cover just a small proportion of employees receiving options in companies with broad-based option plans and do not provide complete detail on the options held. Moreover, the exercise behavior of officers is likely to differ significantly from that of lower-level employees because officers must publicly reveal exercise of ESOs, while other employees are exempt from this SEC requirement, and because officers may differ in risk preference and liquidity needs from other employees.
In this study, we analyze internal corporate records detailing substantially all grant and exercise activity by employees at eight firms over the last decade. Our sample includes a range of firms - one large industrial company, one large high-technology company, two financial services companies, three small high- technology companies that undertook initial public offerings, and an employee- owned service company. These data allow us to investigate the general nature of grant and exercise activity and the factors associated with exercise.
An understanding of employee exercise behavior is important to the Financial Accounting Standards Board's (FASB's) deliberations on the accounting for stock compensation. In 1993, the FASB issued a controversial exposure draft that would have required companies to recognize compensation expense for the value of stock options granted to employees. The key issue in the subsequent debate over the proposal has been whether the value of employee stock options is estimable with adequate precision and, if so, what measurement method to
S. Huddart, M. Lang / Journal of Accounting and Economics 21 (1996) 5 43 7
use. Evidence on option exercise behavior is crucial to the choice of valuation approach, the selection of valuation assumptions, and estimation of the pre- cision of computed option values? Further, once requirements have been established by the FASB, evidence on exercise behavior will be important to corporations in deciding what value to assign to options for financial reporting purposes and to investors in interpreting the disclosure.
Evidence on exercise behavior is also important in other contexts. The SEC requires that proxies state a value for the options granted to the five most highly compensated employees. To date many of these values have been computed using the Black Scholes formula (Yermack, 1995), but regulation S-K §229.402 permits options to be valued under 'any option pricing model'. Thus, corpora- tions face the same issues in complying with the SEC requirements as they would under the FASB's proposal. Further, corporations and compensation consulting firms also estimate stock option value for internal decision-making purposes. An understanding of employee exercise patterns is necessary for accurate estimation.
Beyond the implications for valuation, this research improves our under- standing of compensation more generally. One often-cited motivation for in- creased use of stock options is their effect on employee incentives. These incentive effects depend on when and why employees exercise their options. For instance, the duration of the incentive clearly differs if employees exercise options for cash immediately on the vest date rather than holding them until expiration, especially since many options have ten-year lives but vest over four years.
Finally, the research provides insight into individuals' financial decision- making. Research on publicly traded stock options (TSOs) shows a call option is generally worth more than the difference between the strike price and current stock price and, therefore, exercise at expiration is generally optimal. The extent to which employees sacrifice option value by exercising ESOs early provides evidence on the importance of factors like risk and liquidity in decision-making.
In the next section, we discuss stock options, the FASB's proposal, and the issues addressed in this paper. In Section 3, we describe the data. The fourth section presents univariate and regression analyses. Section 5 concludes the paper.
l i t is straightforward to illustrate the importance of exercise behavior on the valulation of ESOs. For simplicity, consider an American at- the-money option on a stock paying no dividends. The expected cost of the dilution suffered by the existing shareholders is a function of the employee's exercise policy. Suppose the employee's policy is to exercise the option only at maturi ty and only if the option is in the money. Then the Black Scholes value approximates the expected cost to the existing shareholders at the date of grant. Now suppose the employee's policy is to exercise the option on the first occasion it is in the money. Then the expected cost is nearly zero. In practice, the exercise policy of employees (and the expected cost to shareholders) lies somewhere between these extremes.
8 S. Huddart, M. Lang / Journal of Accounting and Economics 21 (1996) 5-43
2. Accounting background
Account ing Principles Board Opin ion No. 25 (APB 25), Accounting for Stock Issued to Employees specifies the current U.S. account ing t rea tment for employee stock options. Unde r that s tandard , the measurement da te for s tock opt ions is the da te on which the terms of the opt ion are first known. F o r fixed stock options, this is the grant date. 2 N o compensa t ion expense is recorded unless the marke t price of the stock exceeds the strike price on the measurement date. APB 25, which was passed in 1972, antedates seminal opt ions research by Black and Scholes (1973), Mer ton (1973), and Cox et al. (1979). While s tandard setters recognized that at- or out -of - the-money opt ions had value, it was not clear how to measure value.
Two concerns p rompted the FASB's reexaminat ion of stock opt ion accounting. First, financial statements are not ' representat ionally faithful' because a component of compensat ion does not figure in the computa t ion of net income. Second, the accounting for stock options is not 'neutral ' since APB 25 appears to discourage use of in- the-money options and variable options compared with fixed stock options.
In June 1993, the F A S B issued an exposure draft, Proposed Statement of Financial Accounting Standards: Accounting for Stock-based Compensation. In the s u m m a r y to the exposure draft , the F A S B no ted that ' dur ing the last 20 years m a t h e m a t i c a l mode l s to es t imate the fair value of op t ions have been deve loped to meet the needs of investors ' and ' sof tware avai lable for pe rsona l compu te r s reduces the app l i ca t ion of those models to a f i l l - in- the-blank exer- cise'. Therefore, the exposure draf t p r o p o s e d recogni t ion of an expense for fixed s tock op t ions at the g ran t date. Recogniz ing the po ten t ia l for ear ly exercise, the Boa rd p r o p o s e d to de te rmine expense by the so-cal led Modi f ied B la c k -Sc ho l e s formula , in which the expected t ime to exercise replaces the op t ion ' s s ta ted term. Conce rned that incentives would exist to unders ta te the expected life of the op t ion , the Boa rd p r o p o s e d to adjus t expense if the realized t ime to exercise differed from the expected t ime to exercise. 3
The Board ' s pos i t ion was based on the asser t ions that:
• employee s tock op t ions have value, • va luable f inancial ins t ruments given to employees are compensa t ion ,
2Fixed options are those whose terms are specified at grant date. Variable options are options whose terms (e.g., number of shares to be issued or strike price) are determined by future events. Compensation expense for variable options is determined in the same way as for fixed options except that measurement typically occurs at a later date (when the terms are known).
3The adjustment would equal the difference between the option value at grant using the realized time to exercise and the amount originally recognized. This feature probably will not be included in the final standard because it yields a counter-intuitive result. Options that are outstanding for long periods of time because of poor stock price performance (and that, ex post, are less valuable) result in a higher charge against income than options exercised earlier than expected. However, the issues of how to compute expected life and how to guard against systematic underestimation of expected option life remain.
S. Huddart, M. Lang / Journal of Accounting and Economics 21 (1996) 5 43 9
• compensation cost, including the estimated value of employee stock options, is properly included in measuring net income, and
• the value of employee stock options can be estimated within tolerable limits for inclusion in financial statements. 4
Opposition to the standard was unprecedented. The debate initially focused on the alleged adverse economic consequences of the proposed standard, the conceptual issues of whether an option grant is an expense or a capital transac- tion, and the lack of clearly identified demand for recognition of option compen- sation expense (as opposed to disclosure in the notes). However, the FASB ultimately became most concerned with determining the appropriate measure- ment approach for valuing stock options and establishing collateral disclosures.
At a December 1994 meeting, the FASB voted to require the disclosure of option value but to make recognition in the income statement voluntary. While the Board still believes recognition is most appropriate, the decision reflects the difficulty of assigning a value to options. How to assign a value and what additional disclosure to require remain to be settled.
The primary measurement issues with respect to ESOs result from the fact that the assumptions underlying the Black-Scholes option pricing formula apply to publicly traded stock options. TSOs differ from ESOs because em- ployees who hold ESOs cannot sell them. The Black-Scholes formula is predicated on the fact exercise of transferable options takes place at predictable points in the option's life - generally at expiration. This is because the option is worth more than the difference between the current market price and the strike price and can be sold rather than exercised if the holder wishes to liquidate her position.
But if options are not transferable, factors like risk aversion and liquidity needs in imperfect capital markets complicate exercise behavior and make valuation more difficult. 5 Incorporating the expected time to exercise into the
4Letter dated December 15, 1994 from Joseph V. Anania, FASB Task Force Chairman, and Diana W. Willis, FASB Project Manager, to Participants in the April 18, 1994 Roundtable, Respondents to the December 2, 1994 Pre-Meeting Questionnaire, and other Interested Parties.
5The argument depends on the inalienability of options. It might seem that an attractive arbitrage opportunity exists for a third party to purchase options from employees who want to reduce their position in their employer 's stock. The third party could offer to pay less than the market value of a similar TSO, but more than the difference between the market price and strike. On average, a third party who held the option to expiration would capture the difference between the price paid and the market value. According to several industry experts we consulted, no such market exists.
There are substantial legal impediments to such arbitrage. The passage below typifies restrictions on the transfer of options granted to employees under a long-term incentive plan:
No Award (other than Released Securities), and no right under any such Award, shall be assignable, alienable, saleable, or transferable by a Participant otherwise than by will or by the laws of descent and distribution (or, in the case of an Award of Restricted Securities, to the
10 S. Huddart, M. Lang / Journal (?]Accounting and Economics 21 (1996) 5 43
analysis in the manner outlined in the exposure draft could result in substantial misvaluation of the underlying options because the Modified Black-Scholes method does not reflect the decision rules used by employees. An option valuation formula based on exercise as a function of time alone is not descrip- tive. Thus, the cost to the employer corporation of granting nontransferable options to risk-averse employees may well differ from the Modified Black-Scholes value proposed in the exposure draft.
Most empirical research on stock options has focused on the size of the adjustment to compensation expense the 1993 exposure draft would require. Coopers & Lybrand (1993) and Foster et al. (1991) quantify the effect of retrospective application of the proposal on companies' net income and share- holders' equity. The proposal would have had a substantial effect on reported profitability in the period studied. Coopers & Lybrand estimates the average reduction in net income after the phase-in period would have been 3.4% for mature companies and 26.5% for emerging companies. Further, they show option valuation is sensitive to underlying assumptions, particularly the term of the option and the expected stock price volatility.
In related research, Hemmer et al. (1994b) consider the influence of risk diversification on 110 exercise decisions by top executives during 1990. They find the willingness to sacrifice option value by early exercise is an increasing function of the volatility of the option value. Other compensation that serves as a hedge against fluctuations in option value mitigates the effect of volatility on early exercise.
There has been some recent effort to develop valuation methodologies for employee stock options. Huddart (1994) illustrates how to incorporate the effects of inalienability and risk aversion on employee exercise decisions within the binomial pricing framework of Cox et al. (1979). As in the Black-Scholes derivation, risk-neutral employees exercise options on non-dividend-paying stocks only at expiration. However, Huddart argues risk-averse employees generally will find it optimal to exercise options before expiration, even for stocks paying no dividends.
Carpenter (1994) illustrates the effects of employee resignations prompted by employment opportunities outside the firm. Since the employee must forfeit unexercised options on termination of employment, exercise of in-the-money
Company); provided, however, that, if so determined by the Committee, a Paticipant may, in the manner established by the Committee, designate a beneficiary or beneficiaries to exercise the rights of the Participant, and to receive any property distributable, with respect to any Award upon the death of the Participant. Each Award, and each right under any Award, shall be exercisable, during the Participant's lifetime, only by the Participant or, if permissible under applicable law, by the Participant's guardian or legal representative. No Award (other than Released Securities), and no right under any such Award, may be pledged, alienated, attached, or otherwise encumbered, and any purported pledge, alienation, attachment, or encumbrance thereof shall be void and unenforceable against the Company or any Affiliate.
S. Huddart, M. Lang / Journal o f Accounting and Economics 21 (1996) 5 43 11
options precedes departure. The exercise decision is correlated with both the stock price level and the time remaining until the options expire. The intuition from Carpenter (1994) and Huddart (1994) is that employees exercise options when the market-to-strike ratio is high. On the other hand, Cuny and Jorion (1995) argue employees are more likely to remain with their current employer and not exercise options as the stock price rises. These models indicate the potential significance of early exercise. They also suggest factors that may contribute to early exercise. Empirical evidence on employee exercise behavior is necessary to determine how important the considerations identified in those models are likely to be in practice.
3. Data
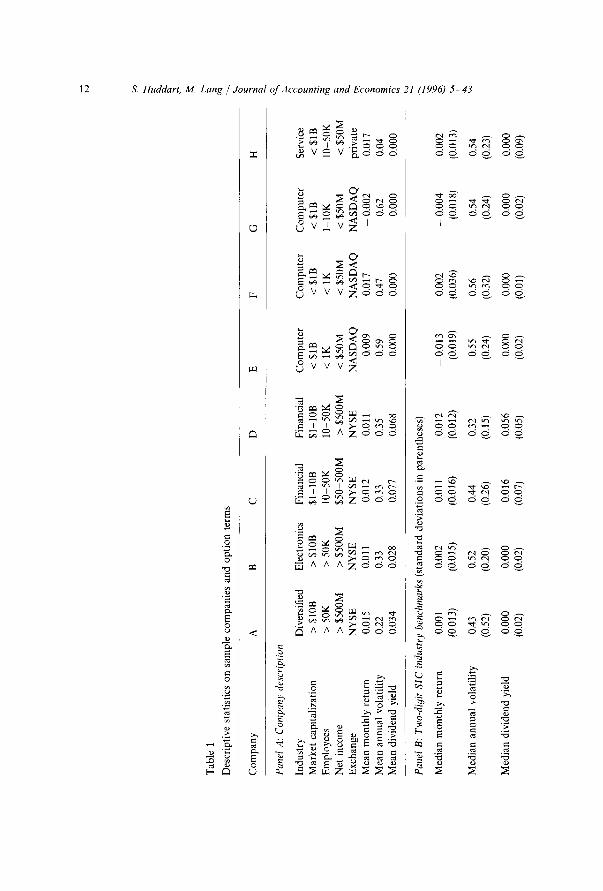
Our analysis is based on employee-by-employee grant and exercise records for eight companies that issued stock options to 58,316 employees over the past decade. Table 1 provides descriptive data on the sample companies. The com- panies supplying data requested anonymity. Accordingly, we identify them by a letter code only. Companies A - D are listed on the NYSE. They each have 1992 market capitalization over $1 billion, more than 10,000 employees, and net income over $50 million. Company A is diversified. Company B is an electronics company. Companies C and D are financial institutions. The stocks of these companies have been publicly traded for at least a decade. Companies E, F, and G are smaller companies in the computer industry. The stocks of these com- panies were first listed on NASDAQ in the last decade. All three had 1992 market capitalization of less than $1 billion, net income of less than $50 million, and fewer than 10,000 employees. Company H is an employee-owned corpora- tion. The stock of company H is traded at a price established by formula only (i) among employees and (ii) between the corporate treasury and employees. The market capitalization indicated by the formula price in 1992 is less than $1 billion. In 1992 net income was less than $50 million. Company H has more than 10,000 employees.
Our sample includes a range of companies, which allows us to investigate the robustness of the results across a variety of settings. Further, the presence of three firms that recently went public allows us to investigate the issues for the firms of great concern to many commentators - emerging high-technology firms for which a change in accounting for options could greatly affect reported results and, allegedly, the continued use of option-based compensation and capital markets access.
The companies in our sample volunteered to participate after the FASB circulated a data request to participants in its field study. The data request indicated that researchers were interested in studying employee stock options in connection with the FASB's ongoing deliberations on this topic and encouraged
Tab
le 1
Des
crip
tive
sta
tist
ics
on s
ampl
e co
mpa
nies
and
opt
ion
term
s
p..
Com
pany
A
B
C
D
E
F
G
H
Pan
el A
: C
ompa
ny d
escr
iptio
n
Indu
stry
D
iver
sifi
ed
Ele
ctro
nics
F
inan
cial
F
inan
cial
C
ompu
ter
Com
pute
r C
ompu
ter
Serv
ice
Mar
ket
capi
tali
zati
on
> S1
0B
> S1
0B
$1-1
0B
$1-1
0B
< $1
B
< $1
B
< $1
B
< $1
B
Em
ploy
ees
> 50
K
> 50
K
10
50K
10
-50K
<
1K
< IK
1-
10K
10
-50K
0~
N
et i
ncom
e >
$500
M
> $5
00M
$5
0-50
0M
> $5
00M
<
$50M
<
$50M
<
$50M
<
$50M
E
xcha
nge
NY
SE
N
YS
E
NY
SE
N
YS
E
NA
SD
AQ
N
AS
DA
Q
NA
SD
AQ
pr
ivat
e M
ean
mon
thly
ret
urn
0.01
5 0.
011
0.01
2 0.
011
0.00
9 0.
017
- 0.
002
0.01
7 M
ean
annu
al v
olat
ilit
y 0.
22
0.33
0.
33
0.35
0.
59
0.47
0.
62
0.04
_~
M
ean
divi
dend
yie
ld
0.03
4 0.
028
0.07
7 0.
068
0.00
0 0.
000
0.00
0 0.
000
~
Pan
el B
: Tw
o-di
git
SIC
ind
ustr
y be
nchm
arks
(st
anda
rd d
evia
tion
s in
par
enth
eses
)
Med
ian
mon
thly
ret
urn
0.00
1 0.
002
0.01
1 0.
012
- 0.
013
0.00
2 -
0.00
4 0.
002
(0.0
13)
(0.0
15)
(0.0
16)
(0.0
12)
(0.0
19)
(0.0
36)
(0.0
18)
(0.0
13)
Med
ian
annu
al v
olat
ilit
y 0.
43
0.52
0.
44
0.32
0.
55
0.56
0.
54
0.54
(0
.52)
(0
.20)
(0
.26)
(0
.15)
(0
.24)
(0
.32)
(0
.24)
(0
.23)
Med
ian
divi
dend
yie
ld
0.00
0 0.
000
0.01
6 0.
056
0.00
0 0.
000
0.00
0 0.
000
(0.0
2)
(0.0
2)
(0.0
7)
(0.0
5)
(0.0
2)
(0.0
1)
(0.0
2)
(0.0
9)
Pan
el C
: O
ptio
n te
rms
Ter
m (
year
s)
10
10
10
10
10, 6
, &
5
10
5 5
Ves
ting
dat
es
Ann
uall
y A
nnua
lly
Ann
uall
y A
nnua
lly
Mon
thly
V
ario
us
Ann
uall
y A
nnua
lly
Yea
rs t
o fu
ll ve
stin
g 3
to 4
4
4 3
4 to
5
4 to
5
3 to
4
4
Pan
el D
: G
rant
dat
e B
lack
Sch
oles
val
ue o
f 19
92 o
ptio
ns
Per
em
ploy
ee (
$)
1,02
1 89
0 75
5 70
3 2,
080
38,9
95
1,89
9 54
8 P
er o
ptio
nee
($)
31,3
38
10,3
74
38,5
18
23,5
33
44,1
32
52,3
77
5,02
2 1,
477
As
a pe
rcen
t of
199
2 ne
t in
com
e 4.
99
15.0
0 5.
93
12.7
9 20
.41
77.9
0 85
.93
22.1
9
Dat
a in
pan
el A
on
mar
ket
capi
tali
zati
on,
net
inco
me,
em
ploy
ees,
and
exc
hang
e ar
e fr
om C
ompu
stat
for
fis
cal
year
199
2. M
onth
ly r
etur
n, a
nnua
l vo
lati
lity
, an
d di
vide
nd y
ield
in p
anel
s A
and
B a
re c
ompu
ted
usin
g C
ompu
stat
dat
a fr
om 1
980
thro
ugh
1992
, wit
h tw
o ex
cept
ions
: (i)
sin
ce th
e st
ock
of
com
pani
es E
, F, a
nd G
did
not
tra
de p
ubli
cly
for
the
enti
re p
erio
d 19
80 to
199
2, t
he s
tati
stic
s w
ere
com
pute
d ov
er t
he p
erio
d fr
om t
he I
PO
thr
ough
199
2;
(ii)
sinc
e co
mpa
ny H
's s
tock
pri
ce is
an
inte
rnal
ly c
ompu
ted
func
tion
of e
arni
ngs
and
net b
ook
valu
e, r
etur
ns a
nd v
olat
ilit
y fo
r th
is c
ompa
ny a
re c
ompu
ted
from
the
int
erna
lly
prod
uced
pri
ce s
erie
s. D
ivid
end
yiel
d is
the
ann
uali
zed
amou
nt o
f an
y di
vide
nd i
n th
e m
onth
, de
flat
ed b
y m
onth
-end
sto
ck p
rice
. M
edia
ns a
nd s
tand
ard
devi
atio
ns r
epor
ted
in p
anel
B a
re t
aken
ove
r al
l C
ompu
stat
com
pani
es in
the
sam
e tw
o-di
git S
IC c
ode
as t
he s
ampl
e co
mpa
ny.
In
ever
y ca
se,
the
benc
hmar
k gr
oup
cons
ists
of
at l
east
40
com
pani
es.
The
str
ike
pric
e on
all
opti
ons
is t
he m
arke
t pr
ice
on t
he d
ate
of g
rant
. F
or a
ll co
mpa
nies
exc
ept
H,
vest
ing
is s
trai
ght
line.
At
com
pany
H,
vest
ing
is e
ithe
r st
raig
ht l
ine
or s
um o
f ye
ars'
dig
its.
t.a I 4~
14 S. Huddart, M. Lang / Journal (~[Accounting and Economics 21 (1996) 5 43
companies to consider contributing data to the study. In turn, some field study participants circulated the request to other interested parties, including at least one industry association. We also expressed our interest in studying grant and exercise records at a public meeting on stock compensation held in the FASB's offices. 6
These methods of data solicitation create the possibility of selection bias. While it is impossible to quantify the effects of biases (if they are present) on our analysis, the incentives of firms to participate in the study provide a basis for speculation. 7 Assuming that the sample companies (like most companies with substantial stock option plans) opposed recognition of compensation expense for stock options, firms participating in our study may have felt that results of an analysis employing their data would dissuade FASB from requiring recognition of stock option compensation expense. At the time firms agreed to participate, the most significant issue before the FASB was whether option value could be estimated with sufficient precision to be recorded on the income statement. To buttress the case against recognition, firms for which employee exercise is most difficult to predict may have been more likely to participate in our study. If so, the selection bias would reduce our ability to explain exercise behavior.
Because our interest is in employee exercise behavior, another concern is that employees of the sample companies behave in a manner that is systematically different from employees at other companies. Our discussions with the data providers gave us no indication that the exercise behavior of employees at the sample firms was in any way special or unusual.
It is possible to gain further insight into the representativeness of our sample by comparing our data with the features of option programs and stock return volatilities for US firms documented in other studies:
• Aboody (1995) summarizes the vesting schedules for 478 US public firms for which outstanding fixed options exceeded 5% of outstanding common stock in 1988. He reports that for 44% of these firms options vest ratably over four years. A variety of other vesting schedules are present in Aboody's sample, but in almost every case options are fully vested by the fifth anniversary of the grant date. Our data set includes three-, four-, and five-year vesting schedules.
• All of the options in Aboody's sample have either five or ten years to expiration. Our data set includes both five-year and ten-year options.
• Aboody reports that exercise is spread over the life of the option. Hemmer et al. (1994b) find exercise before maturity is common in a sample of exercise decisions by top executives. Early exercise is pervasive in our data as well.
6Because the list of FASB field study participants remains confidential, we do not know which companies participated in the field study, nor do we know whether the companies who contributed data to our study are members of the field study. 7The discussion of potential selection biases is based only on our conjecture.
S. Huddart, M. Lang / Journal of Accounting and Economics 21 (1996) 5 43 15
• Alford and Boatsman (1995) summarize the volatility of the common stocks of US public companies in the period 1966 to 1993. The median volatility over 13,851 firm-periods is 41.5 %. The 25th and 75th percentiles of the distribution are 30.9% and 54.8%, respectively. In Table 1, panel A, the stock price volatility of listed companies in our sample ranges from 22% to 62%.
Table 1, panel B provides benchmark stock returns, volatilities, and dividend yields for companies in the same two-digit SIC codes as our sample. In general, our sample companies are comparable with other firms in their industries. While the stock returns for the sample firms are often higher than for the average firm in the industry, the sample firms are generally within a standard deviation of the average firm. Volatilities are quite comparable for the publicly-traded firms. Company H exhibits substantially lower stock price volatility than the publicly- traded firms in its industry. The sample firms that do not pay dividends (companies E - H ) are in industries in which a minority of firms pay dividends. Dividend yields for sample firms that do pay dividends tend to be higher than for the average firm in their industry. This is because a significant proport ion of firms in those industries do not pay dividends.
Overall, the sample companies appear to be comparable to firms examined in previous studies and to other firms in their industries. However, the possibility of sample selection bias cannot be dismissed.
4. Exercise behavior
Our empirical analysis provides evidence on four pr imary questions:
• To what extent are options exercised before expiration? • Assuming exercise does occur before expiration, does exercise cluster around
specific, predictable points during the option's life? • To what extent is exercise predictable based on past history or comparison
across companies? • What factors other than time to exercise appear to be determinants of exercise?
Our first set of analyses is a description of exercise as a function of the options' time to expiration. To the extent exercise clusters around certain dates and is consistent across grants, time since grant may be an important determinant of exercise policy. Next we consider the relation between exercise and calendar time. To the extent events occurring at the company level induce employees to exercise, patterns should be evident in exercise activity as a function of calendar time. Third, we examine exercise as a function of other factors including stock price variables. If exercise is sensitive to risk aversion, it should be evident in the relation between recent stock price movements and exercise. Finally, we break
Tab
le 2
Des
crip
tive
sta
tist
ics
on o
ptio
n gr
ants
Com
pany
A
B
C
D
E
F
G
H
Pan
el A
: P
erce
ntag
e of
em
ploy
ees
who
rec
eive
opt
ions
by
year
(sa
mpl
e ye
ar i
n pa
rent
hese
s)
Min
imum
yea
r 0.
1 (8
4)
0.0
(89)
0.
0 (8
3)
0.2
(83)
3.
4 (8
9)
48.5
(90
) 31
.1 (
92)
Med
ian
year
0.
4 (8
7)
9.3
(86)
0.
6 (8
6)
2.7
(88)
21
.5 (
88)
50.2
(91
) 82
.0 (
82)
Max
imum
yea
r 3.
2 (9
2)
15.1
(90
) 2.
0 (9
2)
3.0
(92)
10
0.0
(87)
62
.5 (
92)
100.
0 (8
4)
1992
3.
2 8.
5 2.
0 3.
0 4.
3 62
.5
31.1
M
ean
1.1
9.2
0.8
1.8
32.4
55
.2
70.2
15.7
(80
) 23
.9 (
87)
30.5
(9o
t 29
.5
22.8
Pan
el B
: M
ean
num
ber
of o
ptio
ns g
rant
ed p
er y
ear
as a
per
cent
of s
hare
s ou
tsta
ndin
g (s
ampl
e ye
ar i
n pa
rent
hese
s)
Min
imum
yea
r 0.
2 (8
4)
0.0
(89)
0.
0 (8
0)
0.4
(83)
1.
0 (8
9)
2.7
(90)
3.
1 (8
5)
Med
ian
year
0.
5 (8
9)
0.9
(87)
0.
5 (8
7)
1.0
(92)
5.
0 (8
4)
3.8
(91)
6.
0 (9
1)
Max
imum
yea
r 0.
8 (9
2)
2.3
(90)
1.
1 (9
1)
2.5
(88)
21
.3 (
83)
14.8
(89
) 32
.4 (
90)
1992
0.
8 0.
9 0.
9 1.
0 1.
4 6.
5 4.
5 M
ean
0.5
1.1
0.5
1.2
7.3
7.0
8.6
3.5
(851
5.
0 (8
0)
7.8
(91)
6.
6 5.
1
Pan
el C
: N
umbe
r o
f gra
nts
per
year
Min
imum
yea
r 4
1 1
1 5
6 1
3 M
edia
n ye
ar
9 1
1 3
10
7 11
0 7
Max
imum
yea
r 9
3 4
7 15
7
224
12
Mea
n 8.
0 1.
5 1.
6 3.
7 9.
9 6.
7 10
3.6
6.3
Pan
el D
: N
umbe
r o
f opt
ions
gra
nted
on
a gr
ant d
ate
(tho
usan
ds)
Min
imum
2
11
1 0
0 1
0 1
10%
3
313
4 1
2 19
0
13
Med
ian
11
1,94
4 33
7
12
59
2 27
5 90
%
2,10
9 2,
552
783
883
179
205
17
678
Max
imum
4A
08
3A71
84
0 4,
408
1,89
8 1,
068
4,18
6 2,
052
Mea
n 50
7 1,
787
231
208
70
110
17
325
Obs
erva
tion
s 72
12
23
41
11
9 40
1,
450
152
g~
Pan
el E
: N
umbe
r o
f em
ploy
ees
rece
ivin
g op
tion
s on
a g
rant
dat
e
Min
imum
1
17
1 1
1 1
1 1
10%
1
100
1 1
1 5
1 1
Med
ian
3 6,
958
7 2
3 17
2
67
90%
51
8 7,
941
272
459
44
52
13
872
Max
imum
7,
005
11,8
24
387
556
364
287
3,22
5 1,
743
Mea
n 39
0 6,
020
88
87
16
30
13
152
Pan
el F
: N
umbe
r o
f opt
ions
gra
nted
per
em
ploy
ee
Min
imum
1 O
0 25
20
0 95
8
1 O0
1 15
~-
10
%
500
100
1,00
0 45
5 37
5 10
0 50
50
~
Med
ian
500
175
1,69
6 1,
225
1,50
0 1,
800
379
500
90%
3,
000
500
4,84
8 4,
400
9,00
0 8,
500
2,67
6 2,
000
= ~.
Max
imum
65
,000
65
,000
62
,200
80
,000
12
0,00
0 15
0,00
0 30
0,00
0 40
0,00
0 M
ean
1,30
1 29
7 2,
626
2,32
7 4,
348
2,62
6 1,
300
1,20
4 _~
Dat
a in
pan
el A
are
com
pute
d as
the
num
ber
of e
mpl
oyee
s re
ceiv
ing
opti
ons
duri
ng a
sam
ple
year
div
ided
by
tota
l em
ploy
ees
at y
ears
' end
as
repo
rted
in
Com
pust
at.
Dat
a in
pan
el B
are
com
pute
d as
the
num
ber
of o
ptio
ns g
rant
ed d
urin
g th
e sa
mpl
e ye
ar d
ivid
ed b
y to
tal
shar
es o
utst
andi
ng a
s of
yea
r en
d as
~'
re
port
ed in
Com
pust
at.
In p
anel
s A
and
B, n
umbe
rs in
par
enth
eses
are
the
yea
rs th
e re
port
ed v
alue
occ
urre
d. D
ata
in p
anel
C a
re b
ased
on
the
num
ber
of
opti
on g
rant
s pe
r ye
ar.
Dat
a in
pan
els
D,
E,
and
F ar
e co
mpu
ted
from
all
opti
on g
rant
s in
the
sam
ple.
18 S. Huddart, M. Lang / Journal o f Accounting and Economics 21 (1996) 5 43
down exercise by employee level to investigate whether systematic differences in exercise patterns are attributable to employees' positions within the company.
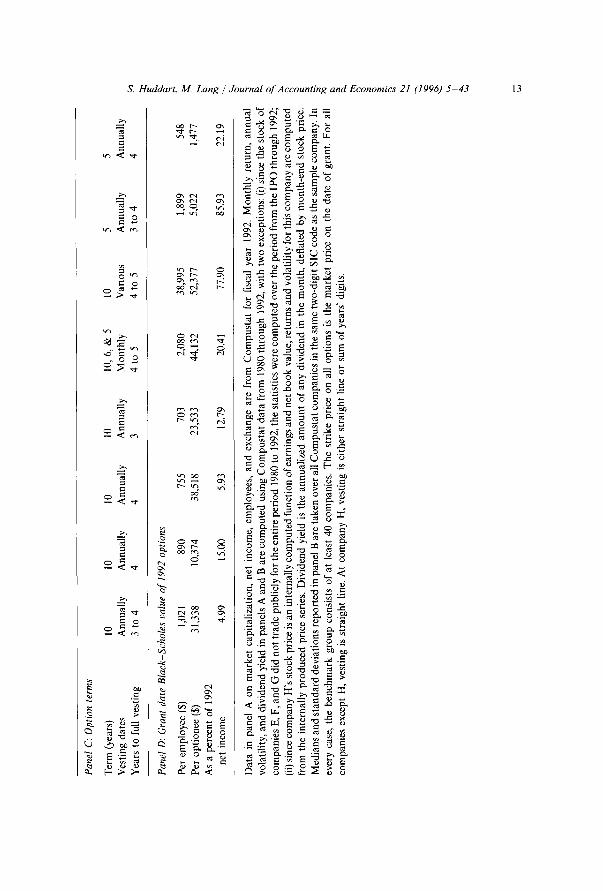
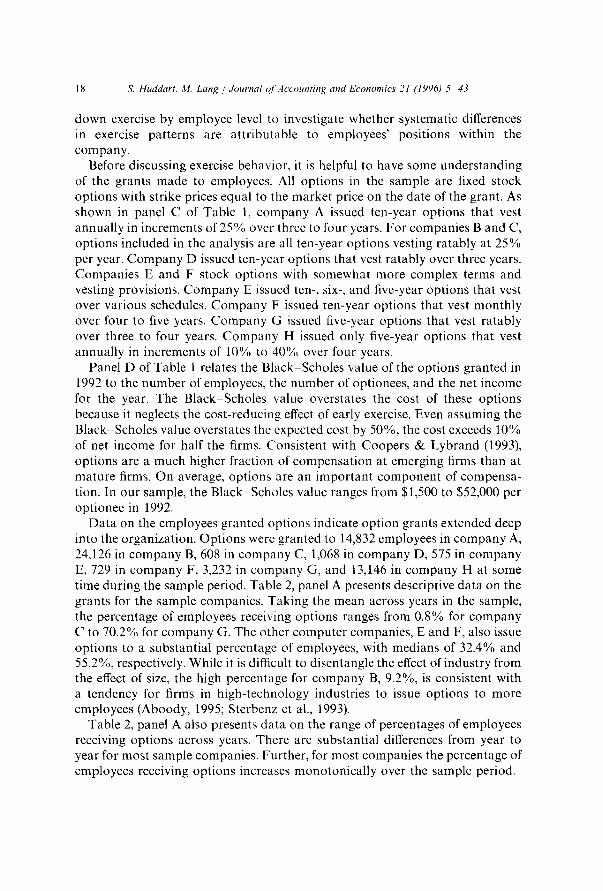
Before discussing exercise behavior, it is helpful to have some understanding of the grants made to employees. All options in the sample are fixed stock options with strike prices equal to the market price on the date of the grant. As shown in panel C of Table 1, company A issued ten-year options that vest annually in increments of 25% over three to four years. For companies B and C, options included in the analysis are all ten-year options vesting ratably at 25% per year. Company D issued ten-year options that vest ratably over three years. Companies E and F stock options with somewhat more complex terms and vesting provisions. Company E issued ten-, six-, and five-year options that vest over various schedules. Company F issued ten-year options that vest monthly over four to five years. Company G issued five-year options that vest ratably over three to four years. Company H issued only five-year options that vest annually in increments of 10% to 40% over four years.
Panel D of Table 1 relates the Black Scholes value of the options granted in 1992 to the number of employees, the number of optionees, and the net income for the year. The Black Scholes value overstates the cost of these options because it neglects the cost-reducing effect of early exercise. Even assuming the Black Scholes value overstates the expected cost by 50%, the cost exceeds 10% of net income for half the firms. Consistent with Coopers & Lybrand (1993), options are a much higher fraction of compensation at emerging firms than at mature firms. On average, options are an important component of compensa- tion. In our sample, the Black Scholes value ranges from $1,500 to $52,000 per optionee in 1992.
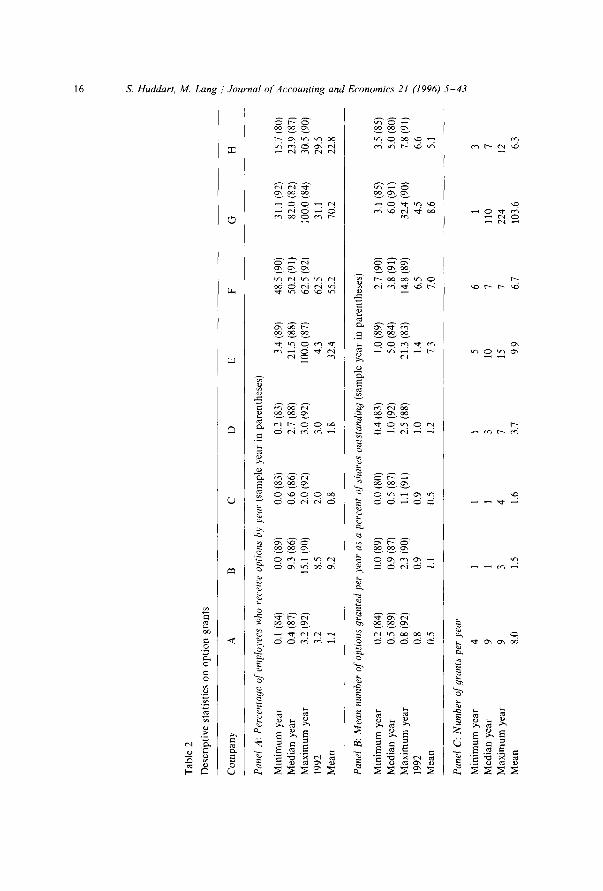
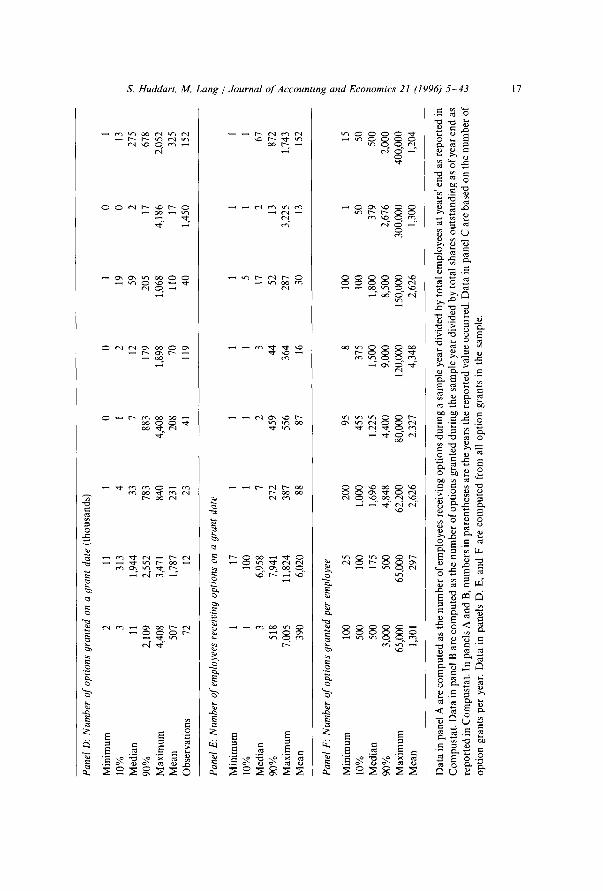
Data on the employees granted options indicate option grants extended deep into the organization. Options were granted to 14,832 employees in company A, 24,126 in company B, 608 in company C, 1,068 in company D, 575 in company E, 729 in company F, 3,232 in company G, and 13,146 in company H at some time during the sample period. Table 2, panel A presents descriptive data on the grants for the sample companies. Taking the mean across years in the sample, the percentage of employees receiving options ranges from 0.8% for company C to 70.2% for company G. The other computer companies, E and F, also issue options to a substantial percentage of employees, with medians of 32.4% and 55.2%, respectively. While it is difficult to disentangle the effect of industry from the effect of size, the high percentage for company B, 9.2%, is consistent with a tendency for firms in high-technology industries to issue options to more employees (Aboody, 1995; Sterbenz et al., 1993).
Table 2, panel A also presents data on the range of percentages of employees receiving options across years. There are substantial differences from year to year for most sample companies. Further, for most companies the percentage of employees receiving options increases monotonically over the sample period.
s. Huddart. M. Lang / Journal of Accounting and Economics" 21 (1996) 5 43 19
Table 2, panel B presents options granted each year as a percentage of shares outstanding at year end. The mean percentage ranges from 0.5% for companies A and C to 8.6% for company G. The pattern across companies and over time is similar to that for the percentage of employees receiving options. Since options are typically outstanding for several years, options outstanding are a large fraction of shares outstanding, particularly for companies E to H.
Table 2, panel C describes the number of grants during a year by company. These data are important for structuring the empirical tests. The number of grants per year illustrates how grant policies vary across companies. At the extremes, company B has a general option grant once per year, with additional grants in some years, while company G issues options on employees' hiring and promotion anniversaries. Because strike price is generally equal to market price at issuance, and vesting and expiration are based on grant date, companies that issue options more frequently have a wider variety of options outstanding at any point in time.
Table 2 also summarizes the number of options issued on a grant date, the number of employees receiving options, and the number of options per em- ployee. Most grants represent many thousands of options granted to a number of employees. Each employee typically receives options on hundreds of shares. However, there is also a substantial range across companies. In particular, companies A, D, E, and G often grant options to only a few employees on a given grant date. The number of options per employee is tightly clustered for all companies, but each company's distribution has a substantial right tail: the maximum value is at least 35 times as large as the median value.
4.1. Univariate analysis" o f exercise activity
Table 3 presents data on exercise activity by employee. While our data do not specify the ultimate disposition of the options, our discussions with the data providers suggest that employees generally sell shares acquired on exercise. 8 Often, employees undertake a 'cashless exercise' in which a brokerage firm delivers the employee the difference between the strike and market price at exercise. Immediate sale of stock acquired on exercise is consistent with risk reduction and liquidity motives for early exercise, as well as bearishness on the employer 's stock.
Table 3, panel A presents the fraction of options issued to an employee in one grant that are exercised together. The typical employee exercises her grant in
8A few key employees at companies C and H have share ownership targets set by top management. These key employees may hold the stock acquired on exercise of the options. We do not know which employees are subject to ownership targets.
20 S. Huddart, M. Lang / Journal o f Accounting and Economics 21 (1996) 5-43
Table 3 Exercise activity by employee
Company A B C D E F G H
Panel A: Fraction of options granted that are exercised by an employee at one time
10% 0.25 0.25 0.20 0.33 0.05 0.02 0.24 0.14 Median 0.30 0.63 0.40 0.55 0.31 0.13 0.50 1.00 90% 1.00 1.00 1.00 1.00 1.00 0.40 1.00 1.00 Mean 0.45 0.64 0.48 0.59 0.41 0.18 0.55 0.72
Panel B: Fraction of life elapsed at the time of exercise (all observations)
10% 0.11 0.13 0.11 0.13 0.17 0.09 0.05 0.39 Median 0.27 0.35 0.31 0.35 0.38 0.22 0.21 0.92 90% 0.51 0.71 0.64 0.77 0.67 0.39 0.60 0.99 Mean 0.30 0.40 0.35 0.40 0.40 0.23 0.26 0.79
Panel C: Fraction of life elapsed at the time ~f exercise lincludes only options for which more than 90% of the options' life elapsed before 12/31/93)
10% 0.21 0.34 0.21 0.50 0.24 0.20 0.49 Median 0.50 0.80 0.68 0.91 0.45 0.48 0.96 90% 0.78 0.98 0.99 1.00 0.83 0.83 1.00 Mean 0.51 0.71 0.64 0.82 0.49 0.51 0.85
Panel D: Fraction of Black Seholes value captured at time of exercise
10% 0.28 0.36 0.39 0.43 0.60 0.59 0.46 0.62 Median 0,55 0.66 0.61 0.67 0.92 0.93 0.72 0.99 90% 0,80 0.87 0.84 0.89 0.99 1.00 0.99 1.00 Mean 0,55 0.64 0.60 0.66 0.85 0.84 0.71 0.89
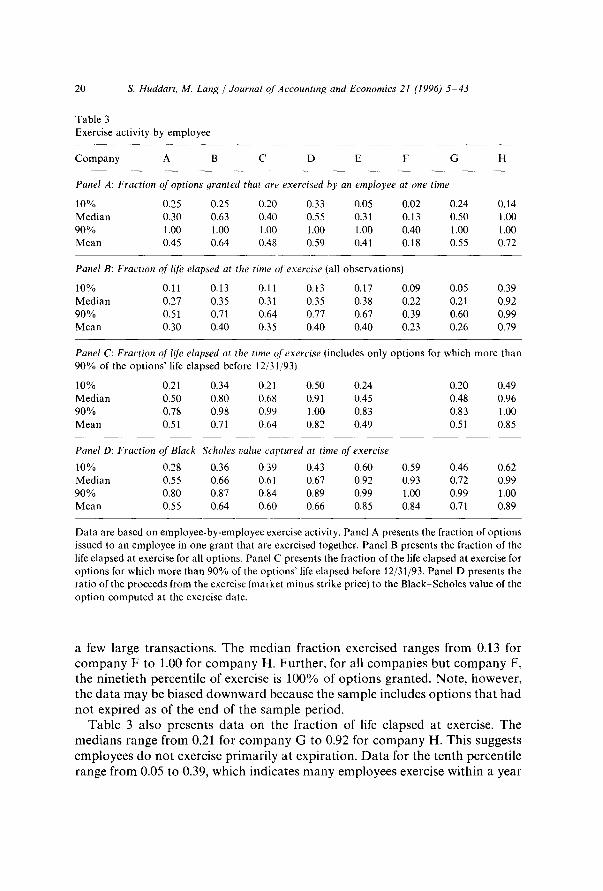
Data are based on employee-by-employee exercise activity. Panel A presents the fraction of options issued to an employee in one grant that are exercised together. Panel B presents the fraction of the life elapsed at exercise for all options. Panel C presents the fraction of the life elapsed at exercise for options for which more than 90% of the options' life elapsed before 12/31/93. Panel D presents the ratio of the proceeds from the exercise (market minus strike price) to the Black-Scholes value of the option computed at the exercise date.
a few large transactions. The median fraction exercised ranges from 0.13 for company F to 1.00 for company H. Further, for all companies but company F, the ninetieth percentile of exercise is 100% of options granted. Note, however, the data may be biased downward because the sample includes options that had not expired as of the end of the sample period.
Table 3 also presents data on the fraction of life elapsed at exercise. The medians range from 0.21 for company G to 0.92 for company H. This suggests employees do not exercise primarily at expiration. Data for the tenth percentile range from 0.05 to 0.39, which indicates many employees exercise within a year

S. Huddart, M. Lang / Journal of Accounting and Economics 21 (1996) 5 43 21
or two of grant. Further, the ninetieth percentiles range from 0.39 of option life for company F to 0.99 for company H.
Finally, Table 3 presents the difference between the market price and the strike price at the time of exercise as a fraction of the Black-Scholes value computed on the exercise date. The median value for the variable ranges from 0.55 to 0.99 over the companies in our sample. A low value indicates employees sacrifice a large portion of the option's expected value if held to expiration. The value sacrificed is greatest in the large public companies, namely A to D. The value sacrificed in company H is negligible. This is because employees at company H tend to hold options until maturity. The value sacrificed is also low for companies E to G. These start-up companies issued options with very low strike prices to employees before going public. Because the strike price on these options is a small fraction of the pos t - IPO market price, the intrinsic value of the option at any time subsequent to the IPO nearly equals the option's Black-Scholes value, so value sacrificed is low.
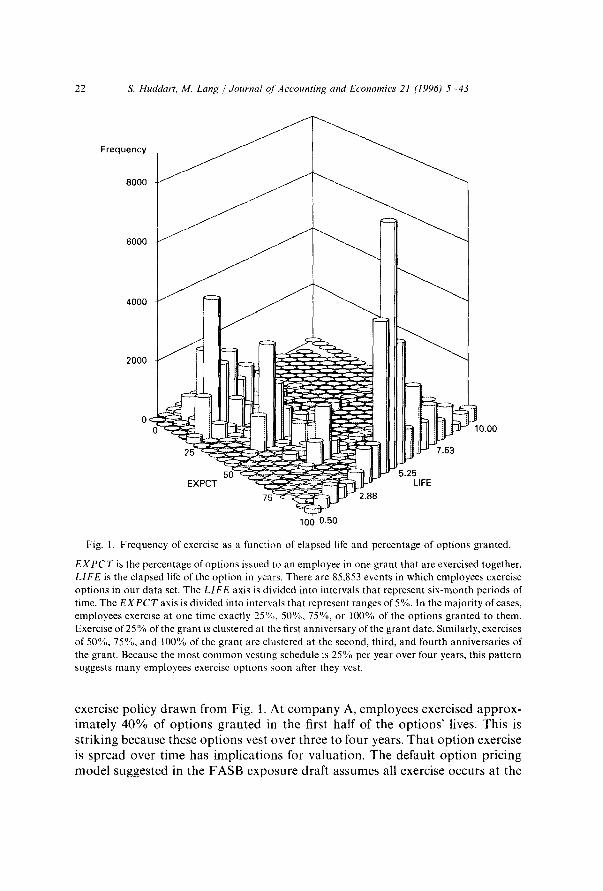
Additional evidence on exercise patterns is available in Fig. 1. The unit of observation in the figure is an individual employee's decision to exercise one or more options from a given grant. There are 85,853 exercise events. The fre- quency of these events are plotted along two axes. One axis records the time of exercise, measured from the date of grant. This axis is divided into six-month intervals. The second axis records the percentage of options issued to an employee in one grant that are exercised together. This axis is divided into intervals that represent ranges of 5%. Consistent with Table 3, panel A, the distribution across exercise percentages suggests employees typically exercise options in large blocks. By far the most common block sizes are 25%, 50%, 75%, and 100% of options granted. Looking over the life of the option, the mode for 25% exercise occurs in the first six months of the second year of option life, for 50% exercise occurs in the first six months of the third year of option life, for 75% exercise occurs in the first six months of the fourth year of option life, and for 100% exercise occurs in the second half of the fifth year of option life. The peak at the beginning of the second year of option life and 25% of options granted suggests that many employees exercise the maximum permissible num- ber of options shortly after the first vesting anniversary. The other peaks indicate some employees wait past this anniversary, but then exercise all avail- able options soon after a subsequent vesting date. Further, the graph confirms that much exercise takes place well before expiration.
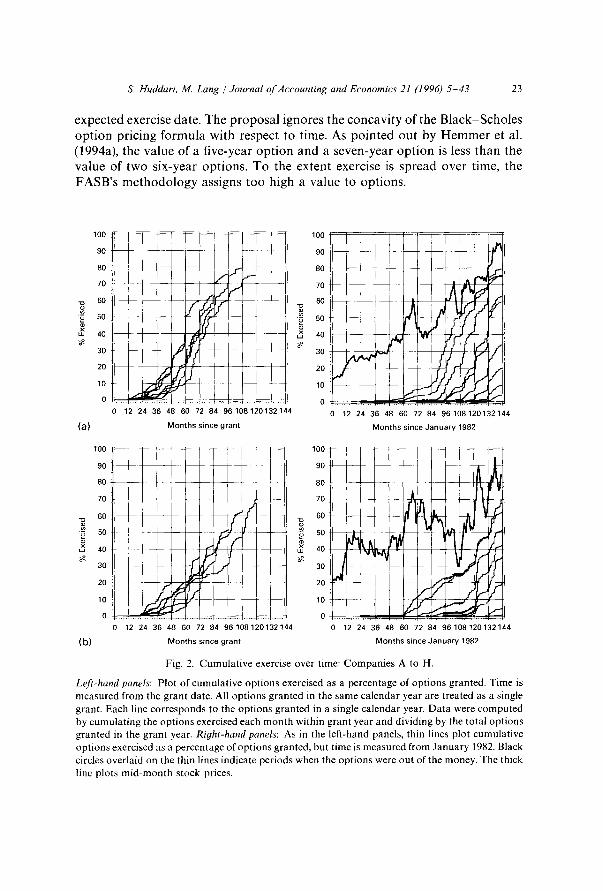
The left-hand panels of Figs. 2a -h present cumulative monthly exercise as a percentage of options granted for companies A-H. Time is measured in months since the grant date. Each line corresponds to the options granted in a single calendar year. Where a company made more than one grant in a year, the amount granted is the sum of the grants made in the year, and the amount exercised in a month is the sum of the amounts exercised from each of these grants. The figures for companies A - G reinforce the conclusions for average
22 S. Huddart, M. Lang / Journal o/'Accounting and Economics 21 (1996) 5-43
Frequency
8000
6000
4000
2000
~.'>.L !-
25' .~
" ~ ll.- "" 5.25 EXPCT ~ LIFE
75 2.88
~ 10.00
7.63
I00 0.50
Fig. 1. Frequency of exercise as a function of elapsed life and percentage of options granted.
E X P C T is the percentage of options issued to an employee in one grant that are exercised together. LIFE is the elapsed life of the option in years. There are 85,853 events in which employees exercise options in our data set. The LIFE axis is divided into intervals that represent six-month periods of time. The E X P C T axis is divided into intervals that represent ranges of 5%. In the majority of cases, employees exercise at one time exactly 25%, 50%, 75%, or 100% of the options granted to them. Exercise of 25 % of the grant is clustered at the first anniversary of the grant date. Similarly, exercises of 50%, 75%, and 100% of the grant are clustered at the second, third, and fourth anniversaries of the grant. Because the most common vesting schedule is 25% per year over four years, this pattern suggests many employees exercise options soon after they vest.
exerc i se p o l i c y d r a w n f r o m Fig. 1. A t c o m p a n y A, e m p l o y e e s exe rc i s ed a p p r o x -
i m a t e l y 4 0 % of o p t i o n s g r a n t e d in t he f irst h a l f o f t he o p t i o n s ' l ives. T h i s is
s t r i k i n g b e c a u s e t h e s e o p t i o n s ves t o v e r t h r e e to f o u r years . T h a t o p t i o n exerc i se
is s p r e a d o v e r t i m e h a s i m p l i c a t i o n s for v a l u a t i o n . T h e d e f a u l t o p t i o n p r i c i n g
m o d e l s u g g e s t e d in t h e F A S B e x p o s u r e d r a f t a s s u m e s al l exerc i se o c c u r s a t t h e
S, Huddart, M. Lang / Journal of Accounting and Economics 21 (1996) 5-43 23
e x p e c t e d exercise date. T h e p r o p o s a l ignores the c o n c a v i t y o f the B l a c k - S c h o l e s o p t i o n pr ic ing f o r m u l a w i t h respect to t ime. As p o i n t e d out by H e m m e r et al. (1994a), the va lue o f a f ive-year o p t i o n a n d a seven-year o p t i o n is less than the v a l u e o f t w o s ix-year op t ions . T o the extent exercise is spread over t ime, the F A S B ' s m e t h o d o l o g y ass igns too h igh a v a l u e to op t ions .
100
90
80
70
~ 60
~ 40
30
20
10
0
(a) 0 12 24 36 48 60 72 84 96108120132144
Months since grant
- - - - ~ 80 90
,
2O
0 12 24 36 48 60 72 84 96108120132144
Months since January 1982
100
90
80
70
60
50
40
30
20
10
0
I
---f - _ rf-
,tee___
12 24 36 48 60 72 84 96108120132144
(b) Months since grant
100
90
80
70
6 0
50
4 0
30
20
10
0 0 12 24 36 48 60 72 84 96108120132144
Months since January 1982
Fig. 2. Cumulative exercise over time: Companies A to H.
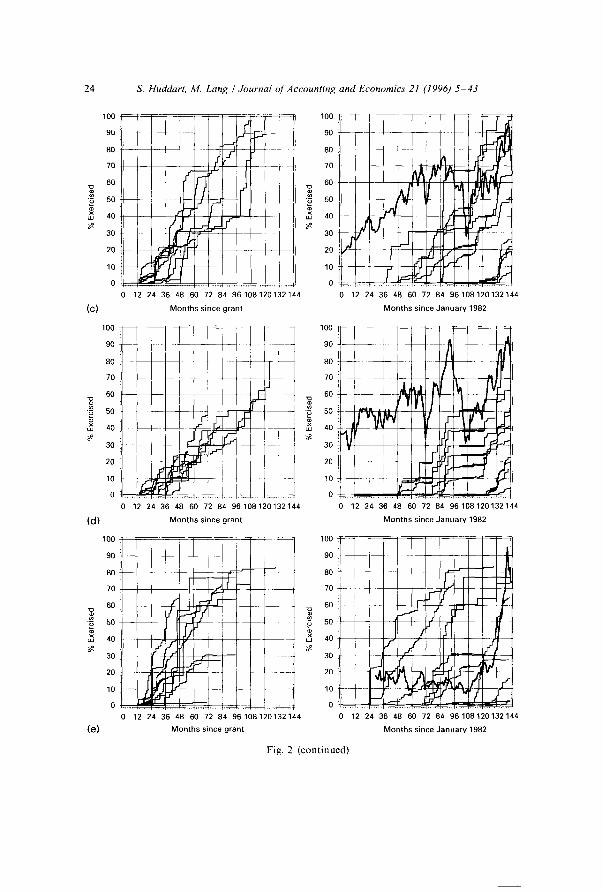
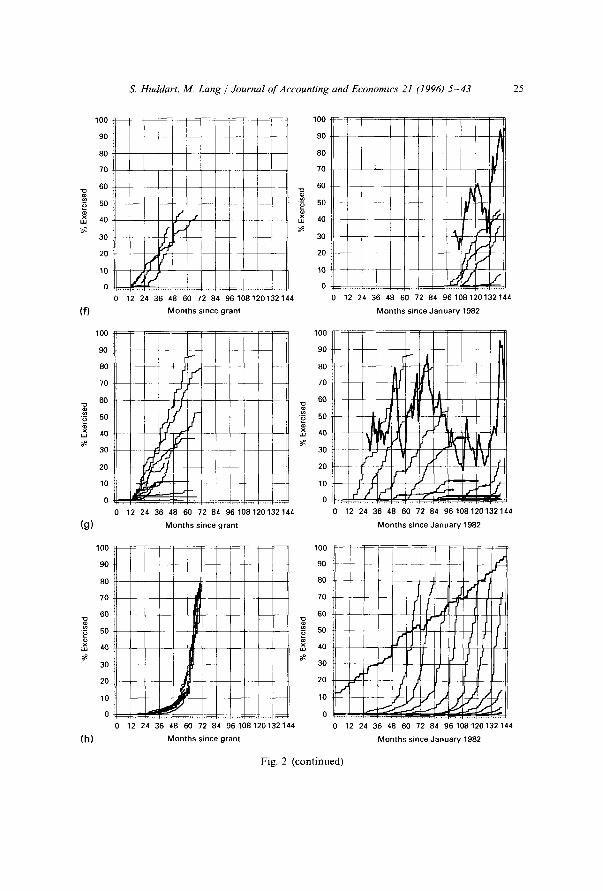
Left-hand panels: Plot of cumulative options exercised as a percentage of options granted. Time is measured from the grant date. All options granted in the same calendar year are treated as a single grant. Each line corresponds to the options granted in a single calendar year. Data were computed by cumulating the options exercised each month within grant year and dividing by the total options granted in the grant year. Right-hand panels: As in the left-hand panels, thin lines plot cumulative options exercised as a percentage of options granted, but time is measured from January 1982. Black circles overlaid on the thin lines indicate periods when the options were out of the money. The thick line plots mid-month stock prices.
24 S. Huddart, M. Lang / Journal (~f Accounting and Economics 21 (1996) 5-43
80 f !
• ~ 5o
40 w . r ~
20
1o 2 l ~ !
12 24 36 48 60 72 84 96108120132144
(C) Months since grant
1 O 0 - ~ -" - -
80 , ~ ~ , , ~-- , , ,-
60 ' 1 I~WJ~[
10
0 12 24 36 48 60 72 84 96108120132144
(d ) Months since grant
100 ! L _ _ - : ] ~
o o _ . + 4 - - , 1 80 . . . . . ~ ~ ~ ~ -
6o - ~ N ~ 50
"~ 40 w g
30 ..]
20 -~ 10
0 0 12 24 36 48 60 72 84 96108120132144
(e) Months since grant
LU
ua
I00
9O ~ 80
70
60
50
40
30
20
10
0 0 12 24 36 48 60 72 84 96108120132144
Months since January 1982
100
90
80
70
60
50
40
30
20
10
0
100
90
80
70
60
50
40
30
20
10
0
A
0 12 24 36 49 60 72 84 96108120132144
Months since January 1982
0 12 24 36 48 60 72 84 96108120132144
Months since January 1982
Fig . 2 ( c o n t i n u e d )
S. Huddart, M. Lang / Journal of Accounting and Economics 21 (1996) 5-43 25
100
90
80
70
60 i '2 50
~ 40
30
20
10
0
(f)
100
90
80
70
60
~ 50
~ 40
30
20
10
0
(g)
100
90
80
70
60
i • ~ 50
~ 4o
30
20
10
0 _ _
(h)
0 12 24 36 48 60 72 84 96108120132144
Months since grant
0 12 24 36 48 60 72 84 96108120132144
Months since grant
0 12 24 36 48 60 72 84 96108120132144
Months since grant
100
90
80
70
6O
• ~ 50
~ 40 30
20
10
0
0 12 24 36 48 60 72 84 96108120132144
Months since January 1982
i
=/11 I ~ J g - , , !" iI- / ,V
I
12 24 36 48 60 72 84 96108120132144
Months since January 1982
100 ~ : ~
90 ~ t ~ ~
'O it 70
60
60
40
30 - -
20 - - ~
0 r ~ - . . . . 1
0 12 24 36 48 60 72 84 96108120132144
Months since January 1982
Fig. 2 (continued)
26 S. Huddart, M. Lang / Journal ~?['Accounting and Economics 21 (1996) 5 43
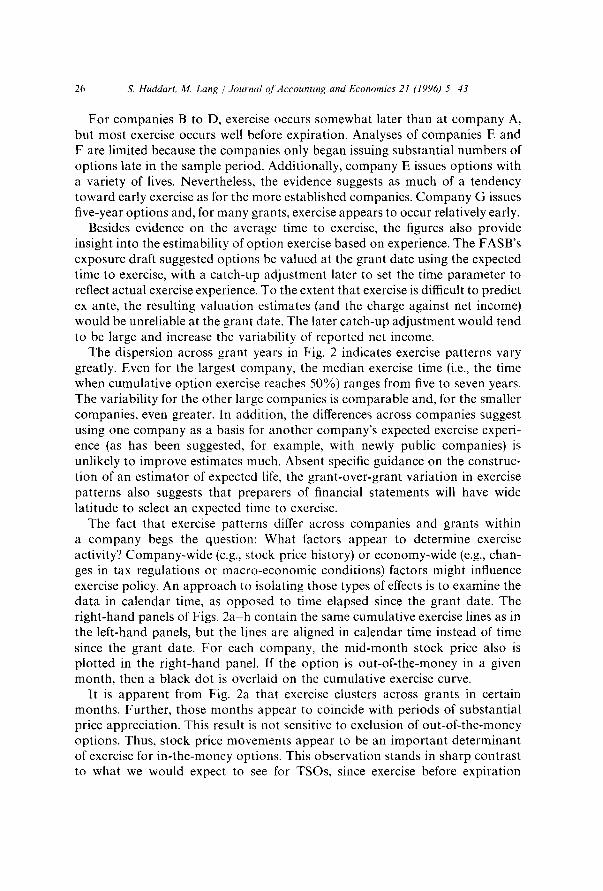
For companies B to D, exercise occurs somewhat later than at company A, but most exercise occurs well before expiration. Analyses of companies E and F are limited because the companies only began issuing substantial numbers of options late in the sample period. Additionally, company E issues options with a variety of lives. Nevertheless, the evidence suggests as much of a tendency toward early exercise as for the more established companies. Company G issues five-year options and, for many grants, exercise appears to occur relatively early.
Besides evidence on the average time to exercise, the figures also provide insight into the estimability of option exercise based on experience. The FASB's exposure draft suggested options be valued at the grant date using the expected time to exercise, with a catch-up adjustment later to set the time parameter to reflect actual exercise experience. To the extent that exercise is difficult to predict ex ante, the resulting valuation estimates (and the charge against net income) would be unreliable at the grant date. The later catch-up adjustment would tend to be large and increase the variability of reported net income.
The dispersion across grant years in Fig. 2 indicates exercise patterns vary greatly. Even for the largest company, the median exercise time (i.e., the time when cumulative option exercise reaches 50%) ranges from five to seven years. The variability for the other large companies is comparable and, for the smaller companies, even greater. In addition, the differences across companies suggest using one company as a basis for another company's expected exercise experi- ence (as has been suggested, for example, with newly public companies) is unlikely to improve estimates much. Absent specific guidance on the construc- tion of an estimator of expected life, the grant-over-grant variation in exercise patterns also suggests that preparers of financial statements will have wide latitude to select an expected time to exercise.
The fact that exercise patterns differ across companies and grants within a company begs the question: What factors appear to determine exercise activity? Company-wide (e.g., stock price history) or economy-wide (e.g., chan- ges in tax regulations or macro-economic conditions) factors might influence exercise policy. An approach to isolating those types of effects is to examine the data in calendar time, as opposed to time elapsed since the grant date. The right-hand panels of Figs. 2a h contain the same cumulative exercise lines as in the left-hand panels, but the lines are aligned in calendar time instead of time since the grant date. For each company, the mid-month stock price also is plotted in the right-hand panel. If the option is out-of-the-money in a given month, then a black dot is overlaid on the cumulative exercise curve.
It is apparent from Fig. 2a that exercise clusters across grants in certain months. Further, those months appear to coincide with periods of substantial price appreciation. This result is not sensitive to exclusion of out-of-the-money options. Thus, stock price movements appear to be an important determinant of exercise for in-the-money options. This observation stands in sharp contrast to what we would expect to see for TSOs, since exercise before expiration
s. Huddart, M. Lang / Journal of Accounting and Economics 21 (1996) 5-43 27
is generally suboptimal and not a function of either the market-to-strike ratio or recent share price movements. On the other hand, numerical simulations in Huddar t (1994) and Carpenter (1994) suggest nontransferability precipi- tates early exercise when the stock price crosses a threshold market-to-strike ratio.
The patterns for the other companies in Figs. 2b-g lead to similar con- clusions. Movements in stock price are clearly important in explaining exercise. For example, Fig. 2b suggests substantial clustering of option grants in the last two years of the sample period coincident with substantial stock price appreci- ation. Similar clustering in exercise activity is apparent for the other sample companies.
Fig. 2h stands in sharp contrast to Figs. 2a-g. Most employees at company H wait until just before expiration to exercise the options they hold. Relative to companies A G, at company H there is high correlation across grants in cumulative exercise measured from the grant date. It is apparent from the figure that company H's stock price is much less volatile and more predictable than the stock price of any other sample company. In fact, company H's stock price is an internally generated function of financial accounting earnings and book value. 9 Because the stock price process is more stable, the probability distribution representing the beliefs of an employee at company H about his options' intrinsic value at any future time likely is more concentrated than the probabil- ity distributions in the minds of employees at companies A-G. Thus, options on the stock of company H are much less risky. Huddar t and Lang (1994) and Kulatilaka and Marcus (1994) argue that reductions in stock price volatility lead to later exercise. The finding that exercise occurs much later at company H is consistent with the predicted interaction of risk aversion and volatility: em- ployees are willing to hold less risky options longer.
4.2. Regression analysis
The preceding analysis suggests both time to expiration and stock price movements are important determinants of employee exercise activity. To ad- dress these issues formally, we estimate regressions of the percentage of options exercised as a function of various explanatory variables including stock price measures and time to expiration.
A primary consideration for the regressions is the appropriate unit of analysis. There are several issues. First, because we have records for almost 60,000 employees (most of whom participated in several option grants) and daily data
9Company H makes a market in its own stock. Employees are free to sell shares acquired on exercise of options in this market. The market-maker ensures demand equals supply at the formula price through discretionary mechanisms such as stock purchases for the company ESOP.
28 S. Huddart, M. Lang / Journal (~l'Accounting and Economics 21 (1996) 5-43
on exercise activity, some degree of aggregation is necessary. For our primary regressions, we aggregate activity on a grant month basis. For every grant, there is one observation for each month the grant was outstanding. The dependent variable is the number of options exercised from a specific grant in a given month divided by the number of options originally issued in that grant. In addition, for some of the analysis, we disaggregate based on a proxy for an employee's level in the company. There the dependent variable is the number of options exercised by employees at that level during the month divided by the number of options originally issued to those employees in that grant.
The number of employees who receive options and the total number of options issued varies over time and across companies. Since the dependent variable, options exercised as a fraction of options granted, is an average over the number of employees included in the grant, we expect the variance of the disturbance term to decrease as the number of employees included in a grant increases. To account for this heteroskedasticity, we estimate weighted least squares regressions. The weight is the same for each month of a given grant and is inversely proport ional to the square root of the number of employees included in the grant. By-company results weighting based on options issued are very similar.
The explanatory variables include three returns variables, two variables based on the market-to-strike ratio, a measure of volatility, and a variable based on recent vesting:
• forty-five-day return ending fifteen days prior to the exercise month, • fifteen-day return immediately prior to the exercise month, • return over the exercise month, • market-to-strike ratio on the first day of the exercise month (MTS), • market-to-strike ratio on the first day of the exercise month squared (MTS2), • share price volatility measured as the standard deviation of log returns over
the 250 trading days preceding the exercise month, and • in months where the market-to-strike ratio exceeds 1.15, the number of
options that vested in the prior three months as a fraction of the total options granted.
The market-to-strike ratio is included in the regression to reflect the fact that in models like Huddar t (1994), risk-averse employees exercise stock options at a threshold market-to-strike ratio that is a function of their level of risk tolerance. The market-to-strike ratio squared is included to capture potential nonlinearities between the market-to-strike ratio and option exercise. In par- ticular, assuming that risk tolerances vary across employees and are drawn from a unimodal probability distribution, the threshold market-to-strike ratios of individual employees will also be drawn from a unimodal distribution. Very little exercise will take place at a market-to-strike ratio close to unity because
S. Huddart, M. Lang / Journal of Accounting and Economics 21 (1996) 5 43 29
very few employees' market-to-strike thresholds will have been exceeded. As the stock price increases, the threshold market-to-strike ratios of more employees will be crossed and exercise will increase. However, at high market-to-strike ratios most employees' thresholds will already have been reached, so a given increase in market-to-strike ratio will result in less of an increase in exercise. Including M T S and M T S z in the regressions permits this potential nonlinearity. The coefficient on M T S is predicted to be positive and the coefficient on M T S a
is predicted to be negative. In addition, contemporaneous and lagged returns are likely to be associated with exercise since exercise is more likely if a given market-to-strike ratio has only recently been reached. The volatility measure captures the notion that an increase in price variability will tend to cause increased exercise by risk-averse employees.
The vesting variable is included to capture the fact that exercise is constrained by the vesting schedule. Fig. 1 suggests that many options are exercised shortly after they vest, but in the figure each exercise decision is weighted equally regardless of the number of options exercised. The vest variable allows us to test whether the proportion of options exercised shortly after vesting is significant. The variable takes on nonzero values only in cases in which MTS is greater than 1.15 because exercise is most likely to be undertaken at the vest date when the market price exceeds the strike price by a sufficient margin to justify exercise. 1 o
We also include three other variables:
• fraction of grant available at the beginning of the exercise month, • years remaining from the beginning of the exercise month until expiration,
and • vested, unexercised options that will be canceled within three months, ex-
pressed as a fraction of options granted.
The fraction of grant available captures the cumulative effects of vesting and past exercise. 11 Theory predicts the tendency to exercise increases when the intrinsic value of an option approaches its total value. As expiration approaches, the intrinsic value of an option approaches its total value. The life left variable captures this effect. The life left variable also allows us to control for the
~°The choice of three months of vesting activity and 1.15 as a market-to-strike cut-off is arbitrary. Results are consistent for a vesting activity measured over periods ranging from one month to six months and for market-to-strike cut-offs of 1.00 to 1.50.
11An alternate dependent variable would be shares exercised as a percentage of shares available (as opposed to shares granted). A disadvantage of shares available as a deflator is that it treats the exercise of, say, all 100 options in a grant at once in the same way as the exercise of the sole remaining option from a grant, even though the valuation implications of the two observations are quite different. As a practical matter, the same basic conclusions hold for shares exercised as a percentage of shares available.
30 S. Huddart, M. Lang / Journal qf Accounting and Economics 21 (1996) 5-43
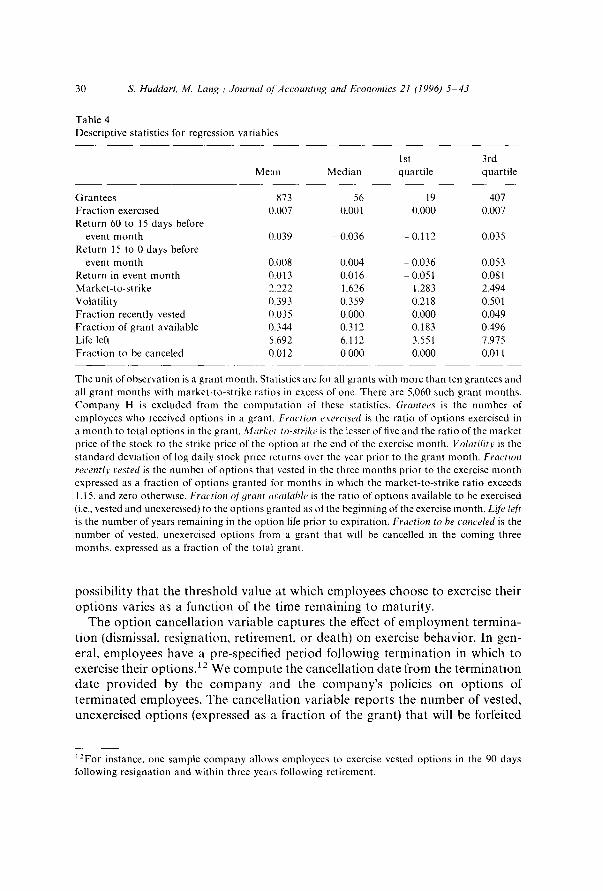
Table 4 Descriptive statistics for regression variables
1st 3rd Mean Median quartile quartile
Grantees Fraction exercised Return 60 to 15 days before
event month 0.039 Return 15 to 0 days before
event month 0.008 Return in event month 0.013 Market-to-strike 2.222 Volatility 0.393 Fraction recently vested 0.035 Fraction of grant available 0.344 Life left 5.692 Fraction to be canceled 0.012
873 56 19 407 0.007 0.001 0.000 0.007
- 0.036 - 0.112 0.035
0.004 - 0.036 0.053 0.016 -- 0.051 0.081 1.626 1.283 2.494 0.359 0.218 0.501 0.000 0.000 0.049 0.312 0.183 0.496 6.112 3.551 7.975 0.000 0.000 0.011
The unit of observation is a grant month. Statistics are for all grants with more than ten grantees and all grant months with market-to-strike ratios in excess of one. There are 5,060 such grant months. Company H is excluded from the computation of these statistics. Grantees is the number of employees who received options in a grant. Fraction e,:ercised is the ratio of options exercised in a month to total options in the grant. Market-to-strike is the lesser of five and the ratio of the market price of the stock to the strike price of the option at the end of the exercise month. Volatility is the standard deviation of log daily stock price returns over the year prior to the grant month. Fraction recently vested is the number of options that vested in the three months prior to the exercise month expressed as a fraction of options granted for months in which the market-to-strike ratio exceeds 1.15, and zero otherwise. Fraction q[yrant available is the ratio of options available to be exercised (i.e., vested and unexercised) to the options granted as of the beginning of the exercise month. Lift_, left is the number of years remaining in the option life prior to expiration. Fraction to be canceled is the number of vested, unexercised options from a grant that will be cancelled in the coming three months, expressed as a fraction of the total grant.
possibility that the threshold value at which employees choose to exercise their options varies as a function of the time remaining to maturity.
The option cancellation variable captures the effect of employment termina- tion (dismissal, resignation, retirement, or death) on exercise behavior. In gen- eral, employees have a pre-specified period following termination in which to exercise their options.~ 2 We compute the cancellation date from the termination date provided by the company and the company's policies on options of terminated employees. The cancellation variable reports the number of vested, unexercised options (expressed as a fraction of the grant) that will be forfeited
12For instance, one sample company allows employees to exercise vested options in the 90 days following resignation and within three years following retirement.
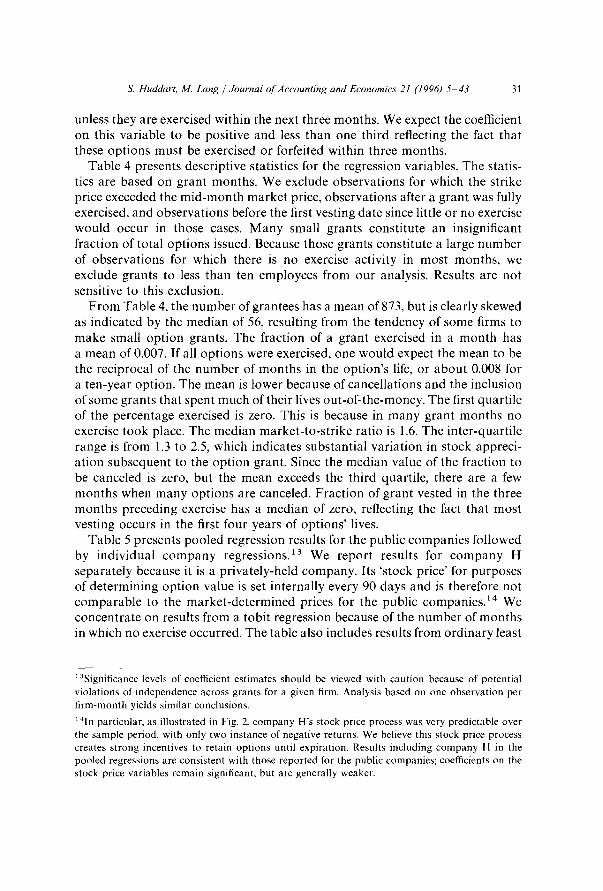
S. Huddart, M. Lang / Journal of Accounting and Economics 21 (1996) 5 43 31
unless they are exercised within the next three months. We expect the coefficient on this variable to be positive and less than one third reflecting the fact that these options must be exercised or forfeited within three months.
Table 4 presents descriptive statistics for the regression variables. The statis- tics are based on grant months. We exclude observations for which the strike price exceeded the mid-month market price, observations after a grant was fully exercised, and observations before the first vesting date since little or no exercise would occur in those cases. Many small grants constitute an insignificant fraction of total options issued. Because those grants constitute a large number of observations for which there is no exercise activity in most months, we exclude grants to less than ten employees from our analysis. Results are not sensitive to this exclusion.
From Table 4, the number of grantees has a mean of 873, but is clearly skewed as indicated by the median of 56, resulting from the tendency of some firms to make small option grants. The fraction of a grant exercised in a month has a mean of 0.007. If all options were exercised, one would expect the mean to be the reciprocal of the number of months in the option's life, or about 0.008 for a ten-year option. The mean is lower because of cancellations and the inclusion of some grants that spent much of their lives out-of-the-money. The first quartile of the percentage exercised is zero. This is because in many grant months no exercise took place. The median market-to-strike ratio is 1.6. The inter-quartile range is from 1.3 to 2.5, which indicates substantial variation in stock appreci- ation subsequent to the option grant. Since the median value of the fraction to be canceled is zero, but the mean exceeds the third quartile, there are a few months when many options are canceled. Fraction of grant vested in the three months preceding exercise has a median of zero, reflecting the fact that most vesting occurs in the first four years of options' lives.
Table 5 presents pooled regression results for the public companies followed by individual company regressions. 13 We report results for company H separately because it is a privately-held company. Its 'stock price' for purposes of determining option value is set internally every 90 days and is therefore not comparable to the market-determined prices for the public companies. TM We concentrate on results from a tobit regression because of the number of months in which no exercise occurred. The table also includes results from ordinary least
~3Significance levels of coefficient estimates should be viewed with caution because of potential violations of independence across grants for a given firm. Analysis based on one observation per f i rm-month yields similar conclusions.
14|n particular, as illustrated in Fig. 2, company H's stock price process was very predictable over the sample period, with only two instance of negative returns. We believe this stock price process creates strong incentives to retain options until expiration. Results including company H in the pooled regressions are consistent with those reported for the public companies; coefficients on the stock price variables remain significant, but are generally weaker.
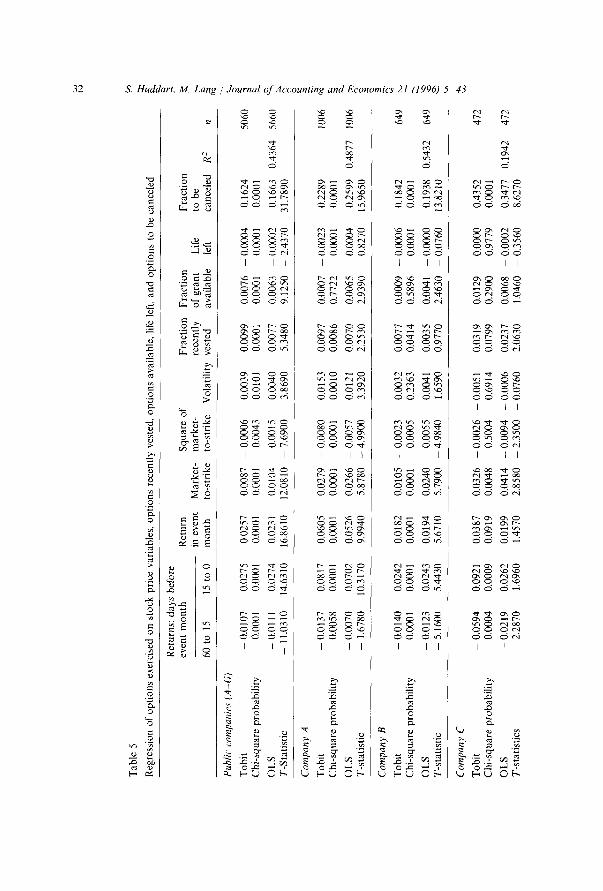
Tab
le 5
Reg
ress
ion
of o
pti
on
s ex
erci
sed
on
sto
ck p
rice
var
iabl
es,
op
tio
ns
rece
ntly
ves
ted,
op
tio
ns
avai
labl
e, l
ife
left
, an
d o
pti
on
s to
be
can
cele
d
Ret
urns
: d
ays
befo
re
even
t m
on
th
60 t
o 15
15
to
0
Ret
urn
S
qu
are
of
Fra
ctio
n
Fra
ctio
n
Fra
ctio
n
in e
vent
M
ark
et-
mar
ket
- re
cent
ly
of g
ran
t L
ife
to b
e m
on
th
to-s
trik
e to
-str
ike
Vol
atil
ity
vest
ed
avai
lab
le
left
ca
nce
led
R
2
Pub
lic c
ompa
nies
(A-G
)
To
bit
0.
0107
0.
0275
0.
0257
0.
0087
-
0.00
06
0.00
39
0.00
99
0.00
76
- 0.
0004
C
hi-
squ
are
pro
bab
ilit
y
0.00
01
0.00
0l
0.00
01
0.00
01
0.00
43
0.01
01
0.00
01
0.00
01
0.00
01
OL
S
- 0.
0111
0.
0274
0.
0231
0.
0104
0.
0015
0.
0040
0.
0077
0.
0063
-
0.00
02
T-S
tati
stic
-
11.0
310
14.6
310
16.8
610
12.0
810
- 7.
6900
3.
8690
5.
3480
9.
1250
-
2.43
70
0.16
24
5060
0.
0001
0.16
63
0.43
64
5660
~
31.7
890
Com
pany
A
To
bit
-
0.01
37
0.08
17
0.06
05
0.02
79
- 0.
0080
0.
0153
0.
0097
0.
0007
-
0.00
23
Ch
i-sq
uar
e p
rob
abil
ity
0.
0058
0.
0001
0.
0001
0.
0001
0.
0001
0.
0010
0.
0086
0.
7722
0.
0001
OL
S
- 0.
0070
0.
0702
0.
0526
0.
0266
-
0.00
57
0.01
21
0.00
70
0.00
65
0.00
04
T-s
tati
stic
-
1.67
80
10.3
170
9.99
40
5.87
80
- 4.
9900
3.
3920
2.
2530
2.
9390
0.
8270
0.22
89
1006
o.
oool
0.25
99
0.48
77
1006
15
.965
0
Com
pany
B
To
bit
-
0.01
40
0.02
42
0.01
82
0.01
05
- 0.
0023
0.
0032
0.
0077
0.
0009
-
0.00
06
Ch
i-sq
uar
e p
rob
abil
ity
0.
0001
0.
0001
0.
0001
0.
0001
0.
0005
0.
2363
0.
0414
0.
5896
0.
0001
OL
S
- 0.
0123
0.
0243
0.
0194
0.
0240
-
0.00
55
0.00
41
0.00
35
0.00
41
- 0.
0000
T
-sta
tist
ic
- 5.
1600
5.
4430
5.
6710
5.
7900
-
4.98
40
1.65
90
0.97
70
2.46
30
- 0.
0760
0.18
42
649
0.00
01
0.19
38
0.54
32
649
13.8
210
~-~
Com
pany
C
To
bit
-
0.05
94
0.09
21
0.03
87
0.03
26
- 0.
0026
-
0.00
51
0.03
19
0.01
29
0.00
00
Cb
i-sq
uar
e p
rob
abil
ity
0.
0004
0.
0009
0.
0919
0.
0048
0.
5004
0.
6914
0.
0799
0.
2900
0.
9779
OL
S
- 0.
0219
0.
0262
0.
0199
0.
0414
-
0.00
94
- 0.
0006
0.
0237
0.
0068
-
0.00
02
T-s
tati
stic
s -
2.28
70
1.69
60
1.45
70
2.85
80
- 2.
3500
-
0.07
60
2.06
30
1.04
60
- 0.
3560
0.43
52
0.00
01
0.34
77
0.19
42
8.62
70
472
472
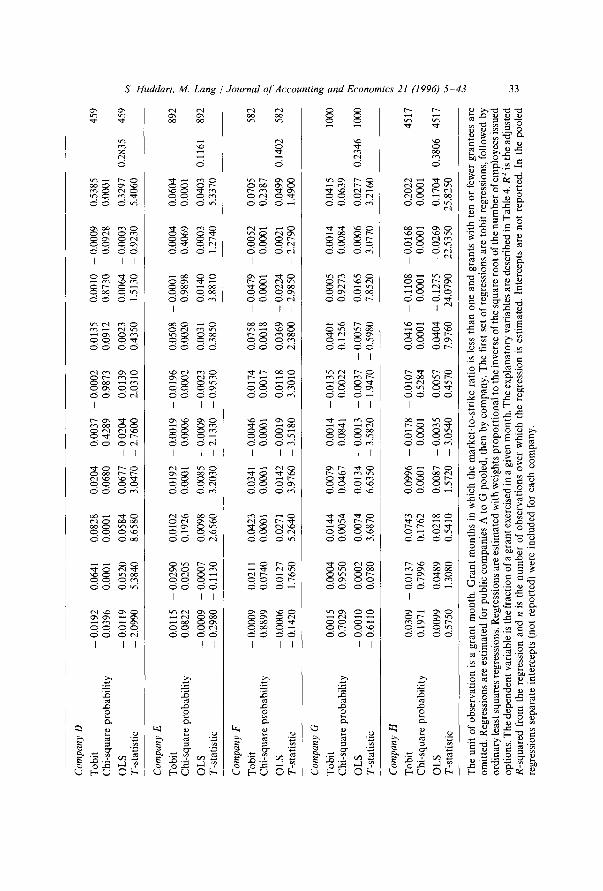
Com
pany
D
Tob
it
-0.0
19
2
0.06
41
0.08
28
0.02
04
-0.0
03
7
-0.0
00
2
0.01
35
0.00
10
-0.0
00
9
0.53
85
Ch
i-sq
uar
e p
rob
abil
ity
0.
0396
0,
0001
0.
0001
0.
0680
0.
4289
0.
9873
0.
0912
0.
8730
0.
0928
0.
0001
OL
S
-0.0
11
9
0.05
20
0.05
84
0.06
77
-0.0
20
4
0.01
39
0.00
23
0.00
64
-0.0
00
3
0.32
97
T-s
tati
stic
-
2.09
90
5.38
40
8.65
80
3.04
70
- 2.
7600
2.
0310
0.
4350
1.
5130
-
0.92
30
5.40
60
0.28
35
459
459
Com
pany
E
To
bit
0.
0115
-
0.02
90
0.01
02
0.01
92
- 0.
0019
-
0.01
96
0.05
08
- 0.
0001
0.
0004
0.
0604
C
hi-
squ
are
pro
bab
ilit
y
0.08
22
0.02
05
0.19
26
0.00
01
0.00
06
0.00
02
0.00
20
0.98
98
0.40
69
0.00
01
OL
S
- 0.
0009
-
0.00
07
0.00
98
0.00
85
- 0.
0009
0.
0023
0.
0031
0.
0140
0.
0003
0.
0403
T
-sta
tist
ic
- 0.
2980
-
0.11
30
2.65
60
3.20
30
- 2.
1330
-
0.95
30
0.38
50
3.88
10
1.27
40
5.33
70
Com
pany
F
0.11
61
892
892
To
bit
-
0.00
09
0.02
11
0.04
23
0.03
41
- 0.
0046
0.
0174
0.
0758
-
0.04
79
- 0.
0052
0.
0705
C
hi-
squ
are
pro
bab
ilit
y
0.88
99
0.07
40
0.00
01
0.00
01
0.00
01
0.00
17
0.00
18
0.00
01
0.00
01
0.23
87
OL
S
- 0.
0006
0.
0127
0.
0271
0.
0142
-
0.00
19
0.01
18
0.03
69
- 0.
0224
0.
0021
0.
0499
T
-sta
tist
ic
- 0.
1420
1.
7650
5.
2640
3.
9760
-
3.51
80
3.30
10
2.38
00
- 2.
9850
-
2.27
90
1.49
00
0.14
02
582
-k
582
a,
Com
pany
G
To
bit
0.
0015
0.
0004
0.
0144
0.
0079
0.
0014
-
0.01
35
0.04
01
0.00
05
0.00
14
0.04
15
Ch
i-sq
uar
e p
rob
abil
ity
0.
7029
0.
9550
0.
0054
0.
0467
0.
0841
0.
0022
0.
1256
0.
9273
0.
0084
0.
0639
OL
S
- 0.
0010
0.
0002
0.
0074
0.
0134
-
0.00
13
- 0.
0037
-
0.00
57
0.01
65
0.00
06
0.02
77
T-s
tati
stic
-
0.61
10
0.07
80
3.68
70
6.63
50
- 3.
5820
-
1.94
70
- 0.
5980
7.
8520
3.
0770
3.
2160
0.
2346
1000
lOOO
~
Com
pany
H
To
bit
0.
0309
-
0.01
37
0.07
43
0.09
96
- 0.
0178
-
0.01
07
0.04
16
- 0.
1108
-
0.01
68
0.20
22
Ch
i-sq
uar
e p
rob
abil
ity
0.
1971
0.
7996
0.
1762
0.
0001
0.
0001
0.
5284
0.
0001
0.
0001
0.
0001
0.
0001
OL
S
0.00
99
0.04
89
0.02
18
0.00
87
- 0.
0035
0.
0057
0.
0404
-
0.12
75
- 0.
0269
0.
1704
T
-sta
tist
ic
0.57
50
1.30
80
0.54
10
1.57
20
- 3.
0540
-
0.45
70
7.97
60 -
24
.079
0 -
22.5
350
25.8
250
0.38
06
4517
4517
Ixa
t~
4~
Th
e un
it o
f o
bse
rvat
ion
is
a g
ran
t m
on
th.
Gra
nt
mo
nth
s in
wh
ich
the
mar
ket
-to
-str
ike
rati
o i
s le
ss t
han
on
e an
d g
ran
ts w
ith
ten
or
few
er g
ran
tees
are
om
itte
d. R
egre
ssio
ns a
re e
stim
ated
for
pu
bli
c co
mp
anie
s A
to
G
pool
ed,
then
by
com
pan
y.
Th
e fi
rst
set
of r
egre
ssio
ns a
re t
ob
it r
egre
ssio
ns,
foll
owed
by
o
rdin
ary
lea
st s
qu
ares
reg
ress
ions
. R
egre
ssio
ns a
re e
stim
ated
wit
h w
eigh
ts p
rop
ort
ion
al t
o th
e in
vers
e of
the
squ
are
roo
t of
the
nu
mb
er o
f em
plo
yee
s is
sued
op
tion
s. T
he
dep
end
ent
var
iab
le i
s th
e fr
acti
on o
f a
gra
nt
exer
cise
d in
a g
iven
mo
nth
. T
he
exp
lan
ato
ry v
aria
bles
are
des
crib
ed i
n T
able
4. R
2 is
the
ad
just
ed
R-s
qu
ared
fro
m t
he r
egre
ssio
n an
d n
is
the
nu
mb
er o
f o
bse
rvat
ion
s ov
er w
hic
h t
he r
egre
ssio
n is
est
imat
ed.
Inte
rcep
ts a
re n
ot
rep
ort
ed.
In t
he p
oo
led
re
gres
sion
s se
par
ate
inte
rcep
ts (
not
repo
rted
) w
ere
incl
ud
ed f
or e
ach
co
mp
any
.
34 S. Huddart, M, Lang / Journal t~/'Accounting and Economics 21 (1996) 5 43
squares regressions as their interpretation is more intuitive. The conclusions drawn from the OLS regressions are consistent with those from the tobit regressions. Rank regressions were estimated because some of the underlying relations may be nonlinear and the distributional assumptions underlying ordinary least squares may be violated. Conclusions from rank regressions (not reported) are generally consistent with those reported.
In the pooled regressions, recent returns are positively associated with exer- cise. The strongest results are a positive coefficient for contemporaneous returns and returns over the preceding 15 days. Contemporaneous returns include stock price movements subsequent to the exercise but in the same month and are, therefore, somewhat more difficult to interpret. However, taken with the returns for the preceding 15 days, they strongly suggest exercise occurs in response to recent stock price movements. The relation is negative for the longer lagged returns which, together with the positive association for contemporaneous returns, suggests exercise activity is path-dependent: exercise occurs in periods in which the stock price is rebounding from a previous fall. is
The relation with the market-to-strike ratio is strongly positive, suggesting more exercise when market-to-strike ratios are high even after controlling for recent returns. Further, the coefficient on the market-to-strike ratio squared is negative, suggesting the relation is increasing, but at a decreasing rate. 16 The coefficient on volatility is positive. Assuming persistence in volatility, this result is consistent with the prediction that increases in volatility increase risk to employees who hold options which, in turn, induces exercise. The coefficient on the vesting variable is positive and significant, suggesting that there is unusually high exercise activity in the three months following vesting. The coefficient on fraction of grant available is positive, indicating more exercise occurs when more options are available. The coefficient on life left is negative. Exercise appears to increase as expiration approaches, but time is not a key predictor of exercise. Finally, the coefficient on option cancellations is positive, which indicates that terminated employees exercise options shortly before cancellation.
Results are generally consistent for the company-by-company regressions for companies A-G. The relation between exercise and concurrent returns is always positive. For lagged returns, where the signs differ from those in the pooled
t 5This result is consistent with the results of laboratory studies of sequential risky choice like Thaler and Johnson 0990) who document the tendency of decision makers to (i) avoid risks following losses, (ii) seek risks following gains, and (iii) alter risk-taking behavior when a course of action offers the possibility of recouping past losses.
~'A problem with the quadratic formulation for market-to-strike is that the relation can become negative for high market-to-strike ratios. Given the coefficient estimates, this occurs outside the range of market-to-strike ratios in the dat~L
S. Huddart, M. Lang / Journal of Accounting and Economics 21 (1996) 5-43 35
regressions, the coefficients are generally insignificant. The market-to-strike ratio is always positive and significant and the market-to-strike ratio squared is negative (except at company G) and generally significant. The coefficient on the vesting variable is generally positive and significant. Results for the life left variable are mixed. The tobit coefficients are significant and negative at com- panies A, B, F, and H, and significant and positive at companies C, E, and G. The OLS coefficients are generally insignificant. The regression R 2 ranges from 0.12 to 0.54 for the weighted least squares specification and is 0.44 for the pooled regression. While a large portion of the variation is explained, much of it remains. Consistent with the assertion that exercise is more difficult to predict in smaller, less-established companies, the regression fit is best for the largest companies, particularly A and B.
The primary difference between company H and the publicly traded com- panies is in the ability of stock price variables to explain exercise. The relation between exercise and returns and market-to-strike ratios is generally consistent with that for the publicly traded companies, but is statistically weak. Instead, exercise is determined primarily by the life left, consistent with the tendency to delay exercise until option expiration, and the percentage of grant available.
If factors like risk aversion and liquidity needs influence exercise behavior, exercise is likely to vary based on the personal circumstances of the employee. While we do not have data on employee-specific characteristics, it is possible to infer something about those characteristics from an employee's level in the company. In particular, the amount and allocation across asset classes of high- level employees' wealth is likely to differ systematically from lower-level em- ployees. Also the risk attitudes of employees may differ systematically by level. Finally, the visibility of high-level employees may limit their willingness to exercise options early for perceived loyalty issues.
We test jointly whether such differences exist and whether they have an impact on exercise behavior by dividing employees into four levels - those who rank in the top 5% in number of the options issued, averaged over the years they receive options (level 1), those who rank between 5% and 25% (level 2), those between 25% and 50% (level 3), and those in the bottom 50% (level 4). 17
Table 6, panel A presents results from the regressions that differentiate by employee level. Because of the number of regressions involved, we limit pre- sentation of results to the pooled sample of public companies. On the whole, behavior is consistent across levels. Coefficient signs are always the same and are generally significant. Explanatory power is somewhat lower for level 1, but otherwise quite comparable. The most pronounced differences are for historical stock price variance. The coefficient estimate on historical price variance is
17Thes e categories are admittedly ad hoc. Results are robust to changes in the percentages included in each category. Further, for companies A, B, D, and H we have information identifying each employee's salary and level in the company. Results are consistent for analyses based on those data.
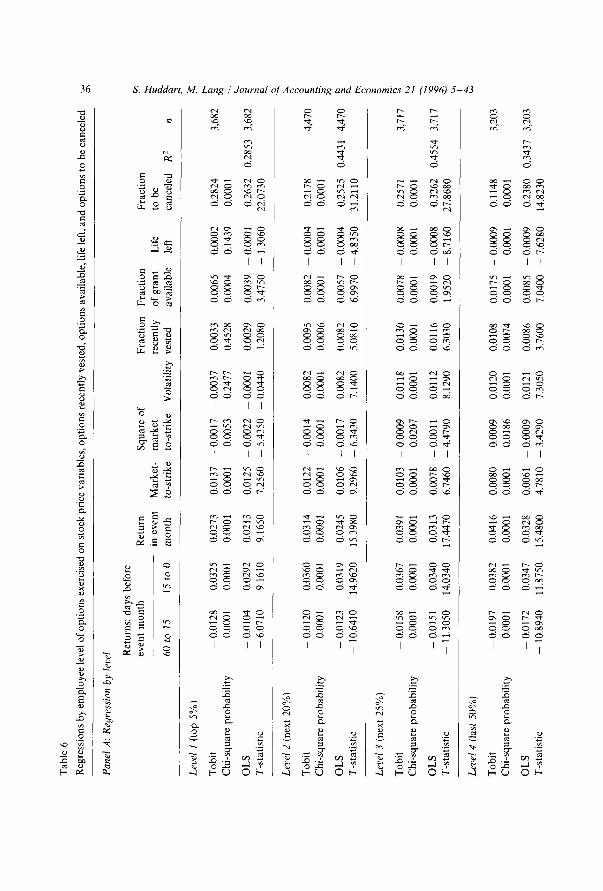
Tab
le 6
Reg
ress
ions
by
em
plo
yee
lev
el o
f o
pti
on
s ex
erci
sed
on
sto
ck p
rice
var
iabl
es,
op
tio
ns
rece
ntly
ves
ted,
op
tio
ns
avai
labl
e, l
ife
left
, an
d o
pti
on
s to
be
canc
eled
Pan
el A
: R
egre
ssio
n by
lev
el Ret
urns
: d
ays
befo
re
even
t m
on
th
60 t
o 15
15
to
0
Ret
urn
S
qu
are
of
Fra
ctio
n
Fra
ctio
n
Fra
ctio
n
in e
vent
M
ark
et-
mar
ket
- re
cent
ly
of g
ran
t L
ife
to b
e
mo
nth
to
-str
ike
to-s
trik
e V
olat
ilit
y ve
sted
av
aila
ble
le
ft
canc
eled
R
2
n
Lev
el 1
(to
p 5
%)
To
bit
-
0.01
28
0.03
25
0.02
73
Ch
i-sq
uar
e p
rob
abil
ity
0.
0001
0.
0001
0.
0001
OL
S
- 0.
0104
0.
0292
0.
0213
T-s
tati
stic
-
6.07
10
9.16
10
9.16
50
0.01
37
- 0.
0017
-
0.00
37
0.00
33
0.00
01
0.00
53
0.24
77
0.45
28
0.01
25
- 0.
0022
-
0.00
01
0.00
29
7.25
60
5.43
50
- 0.
0440
1.
2080
t"-,
0.00
65
0.00
02
0.28
24
3,68
2
0.00
04
0.14
39
0.00
01
~-
0.00
39
- 0.
0001
0.
2632
0.
2853
3,
682
~
3.47
50
- 1.
3060
22
.073
0
Lev
el 2
(ne
xt 2
0%)
To
bit
-
0.01
20
0.03
60
0.03
14
Ch
i-sq
uar
e p
rob
abil
ity
0.
0001
0.
0001
0.
0001
OL
S
- 0.
0123
0.
0319
0.
0245
T-s
tati
stic
-
10.6
410
14.9
620
15.3
980
0.01
22
- 0.
0014
0.
0082
0.
0095
0.00
01
0.00
01
0.00
01
0.00
06
0.01
06
- 0.
0017
0.
0082
0.
0082
9.29
60
- 6.
3430
7.
1400
5.
0810
0.00
82
- 0.
0004
0.
2178
4,
470
0.00
01
0.00
01
0.00
01
~"
0.00
57
- 0.
0004
0.
2525
0.
4431
4,
470
~.
6.99
70
- 4.
8350
31
.211
0
Lev
el 3
(ne
xt 2
5%
)
To
bit
-
0.01
58
0.03
67
0.03
91
Ch
i-sq
uar
e p
rob
abil
ity
0.
0001
0.
0001
0.
0001
OL
S
- 0.
0151
0.
0340
0.
0313
T-s
tati
stic
-
11.3
050
14.0
340
17.4
470
0.01
03
- 0.
0009
0.
0118
0.
0130
0.00
01
0.02
07
0.00
01
0.00
01
0.00
78
- 0.
0011
0.
0112
0.
0116
6.74
60
- 4.
4790
8.
1290
6.
3030
0.00
78
- 0.
0008
0.
2571
3,
717
~'
t,,a
0.00
01
0.00
01
0.00
01
0.00
19
-- 0
.000
8 0.
3262
0.
4554
3,
717
,~
1.95
20
- 8.
7160
27
.868
0
Lev
el 4
(la
st 5
0%)
To
bit
-
0.01
97
0.03
82
0.04
16
Ch
i-sq
uar
e p
rob
abil
ity
0.
0001
0.
0001
0.
0001
OL
S
- 0.
0172
0.
0347
0.
0328
T-s
tati
stic
-
10.8
940
11.8
750
15.4
800
0.00
80
- 0.
0009
0.
0120
0.
0108
0.00
01
0.01
86
0.00
01
0.00
74
0.00
61
- 0.
0009
0.
0121
0.
0086
4.78
10
- 3.
4290
7.
3050
3.
7600
0.01
75
- 0.
0009
0.
1148
3,
203
0.00
01
0.00
01
0.00
01
0.00
85
- 0.
0009
0.
2380
0.
3437
3,
203
7.04
00
- 7.
6280
14
.823
0

Pan
el B
: In
crem
enta
l re
gres
sion
s, l
evel
1 v
s. l
evel
s 2
-4
Ret
urns
: da
ys t
o ev
ent
mo
nth
R
etur
n S
quar
e of
F
ract
ion
Fra
ctio
n F
ract
ion
in e
vent
M
arke
t-
mar
ket-
re
cent
ly
of g
rant
L
ife
to b
e 60
to
15
15 t
o 0
mo
nth
to
-str
ike
to-s
trik
e V
olat
ilit
y ve
sted
av
aila
ble
left
ca
ncel
ed
R 2
Lev
els
2-
4
Tob
it
-0.0
15
1
0.03
87
0.03
92
0.01
14
-0.0
01
3
0.0
11
3
0.01
25
0.0
11
1 -
0.0
00
8
0.1
63
1
Chi
-squ
are
prob
abil
ity
0.0
00
1
0.0
00
1
0.0
00
1
0.0
00
1
0.0
00
1
0.0
00
1
0.0
00
1
0.0
00
1
0.0
00
1
0.0
00
1
OL
S
- 0.
0144
0.
0342
0.
0305
0.
0093
-
0.00
14
0.01
08
0.01
02
0.00
64
- 0.
0006
0.
2402
T
-sta
tist
ic
- 18
.925
0 24
.479
0 29
.695
0 14
.191
0 -
9.86
50
13
.85
20
9.
5310
11
.710
0 -
11.8
810
40.7
700
t~
Lev
el 1
inc
rem
enta
l
Tob
it
0.00
21
- 0.
0060
-
0.01
17
0.0
01
8
- 0.
0003
-
0.01
53
- 0.
0090
-
0.00
46
0.00
10
0.12
14
Chi
-squ
are
prob
abil
ity
0.57
47
0.38
47
0.02
15
0.64
16
0.7
76
1
0.0
00
1
0.08
04
0.04
97
0.0
00
1
0.0
00
1
OL
S
0.00
40
- 0.
0050
-
0.00
92
0.0
03
2
- 0.
0008
-
0.01
08
- 0.
0073
-
0.00
25
0.00
05
0.02
30
T-s
tati
stic
1.
9980
-
1.35
40
- 3.
3720
1
.61
10
-
1.72
60
- 5.
5450
-
2.57
30
- L
9150
3.
7040
1
.62
20
15,0
72
0.38
23 1
5,07
2
Var
iabl
es a
re d
efin
ed a
s in
Tab
le 5
. The
tot
al n
um
ber
of
op
tio
ns
issu
ed to
an
empl
oyee
div
ided
by
the
nu
mb
er o
f yea
rs d
urin
g w
hich
she
rec
eive
d o
pti
on
s de
term
ines
em
ploy
ee le
vel.
Lev
el 1
em
ploy
ees
wer
e am
on
g th
e to
p 5%
of e
mpl
oyee
s re
ceiv
ing
opti
ons
at t
heir
com
pany
; lev
el 2
, am
on
g th
e ne
xt 2
0%;
leve
l 3,
am
on
g t
he n
ext
25%
; an
d le
vel
4, a
mo
ng
the
fin
al 5
0%.
Pan
el A
reg
ress
ions
are
est
imat
ed b
y le
vel.
The
dep
ende
nt v
aria
ble
is t
he n
um
ber
of
op
tio
ns
~.
exer
cise
d fr
om a
giv
en g
ran
t in
a g
iven
mo
nth
as
a fr
acti
on o
f sh
ares
gra
nted
to
empl
oyee
s at
tha
t le
vel
in t
hat
gran
t.
,,~
In p
anel
B,
all
obse
rvat
ions
fro
m p
anel
A a
re i
nclu
ded
in o
ne p
oole
d re
gres
sion
. T
h ex
plan
ator
y va
riab
les
in p
anel
A a
re a
ugm
ente
d w
ith
thos
e sa
me
expl
anat
ory
vari
able
s in
tera
cted
wit
h a
vari
able
tak
ing
the
valu
e on
e if
the
empl
oyee
was
in l
evel
1, a
nd z
ero
othe
rwis
e. T
he t
op
hal
f o
f pan
el B
rep
orts
the
po
oled
coe
ffic
ient
est
imat
es f
or le
vels
2-4
. T
he b
ott
om
hal
f of
pan
el B
rep
orts
the
dif
fere
nce
betw
een
the
pool
ed e
stim
ates
for
leve
l 1
and
thos
e fo
r le
vels
I
2-4.
Sep
arat
e in
terc
epts
(no
t re
port
ed)
are
incl
uded
for
eac
h co
mpa
ny.
38 s. Huddart. M. Lang / Journal ~f Aceounting and Economics 21 (1996) 5 43
insignificantly negative for level 1 employees and increases monotonically across levels. The coefficient estimate is quite significant for levels 2-4, consistent with greater risk aversion for lower-level employees. Differences also exist across levels in the coefficient on the vesting variable. Recent vesting appears to have little effect on the exercise behavior of the highest level of employees, but has significant explanatory power for lower-level employees. Similarly, the coeffi- cients on the returns variables are lowest for the high-level employees, indicating they are less sensitive to recent stock returns. The coefficient on M T S is higher and on M T S 2 is lower for the highest-level employees. For M T S less than two, the slope of the relation between exercise and the market-to-strike ratio is steeper (but decreases quicker) for high-level employees. The monotonic change in the coefficients on M T S and M T S 2 from level to level suggests high-level employees are more sensitive to M T S than lower-level employees.
Because our primary interest is in differences in behavior between top em- ployees and those at other levels, we estimate pooled regressions separating level 1 by including the explanatory variables interacted with a dummy variable that is one for level 1 employees and zero otherwise. The results, reported in panel B, are consistent with panel A.18
The difference in the coefficient on past return variance is significant and negative. Differences in the coefficients on contemporaneous returns and vesting are significant. Surprisingly, the difference in coefficients on life left is signifi- cantly positive and on fraction of grant available is significantly negative. Controlling for other factors, it seems exercise decisions by top-level employees are affected less by the time to expiration and the proport ion of the grant available. The results indicate employees at different levels in the company vary in their sensitivity to the factors considered in our analysis.
4.3. O ther regressors
The list of regressors included in the preceding analysis is not exhaustive. For parsimony, we have limited our reported results to include variables that are likely to be important determinants of exercise for our sample firms and that may be useful in predicting future exercise behavior by employees. To test the sensitivity of our results to inclusion of other variables, we conducted supple- mental analyses including several other potential explanatory variables.
Div idend y ie ld
Dividend yield may be a determinant of employee exercise because employee stock options are generally not dividend-proctected. Therefore, incentives exist
~SBecause the level 1 results are based on a regression with an interaction term, the coefficient estimates from the level 1 incremental section of panel B must be added to the coefficient estimates from the levels 2 4 section to be comparable to the level 1 coefficient estimates in panel A.
S. Huddart, M. Lang / Journal of Accounting and Economics" 21 (1996) 5 43 39
to exercise options immediately prior to ex-dividend dates to obtain the right to receive the dividend. However, dividends are unlikely to play a major part in the overall results of this study because, as noted in Table 1, four of the sample firms (companies E H) do not pay dividends and a fifth (company B) has a very low dividend yield.
We re-estimated the regressions for companies A - D including a variable which took on a value of the ratio of the dividend amount to stock price in months in which the stock went ex-dividend and zero in other months. The coefficient on the dividend variable was significantly positive only for company A (t-statistic of 2.2) and was not significant in the pooled public regression, suggesting that, for our sample of firms, dividends are not a major determinant of exercise activity.
In teres t rate
The interest rate may also be a determinant of exercise activity because it is an input to standard option pricing models. However, predicting the likely effect of interest rates on stock option exercise is complicated because (i) the effect of an interest rate change on the other components of an employee's investment portfolio is unknown and (ii) the interest rate is likely to be endogenous to the future stock price process.
We re-estimated our regressions including an interest rate variable based on the three-year Treasury bill interest rate for each month of the sample period. Regression results were not sensitive to inclusion of the interest rate variable and there was no systematic relation between option exercise behavior and interest rates across the sample companies.
Future s tock returns Private information held by employee-optionees may affect exercise as well. If
the employee can sell the stock acquired on exercise, incentives exist to exercise the options immediately before an anticipated stock price drop. Several factors argue against pervasive information-based trading in our sample. First, em- ployees who exercise options based on private information are likely to be in violation of Section 10(b) of the Securities Exchange Act of 1934. While one can imagine a few employees exercising options in violation of securities law, it is difficult to imagine insider trading on a big enough scale to be captured in our data. Second, the stock option plans in our sample go deep in the organization. While it is plausible that top executives often possess inside information, it is unlikely that large numbers of employees are privy to such information. Thus, information-based trading is unlikely to be detected.
To test for the effects of information-based trading on our analysis, we included the stock return over the following month as an explanatory variable. To the extent that employees exercise options and sell the stock in anticipation of stock price drops, the coefficient on future returns should be negative.
40 S. Huddart, M. Lang / Journal of Accounting and Economics 21 (1996) 5 43
However, our results provide little evidence of a systematic relation between option exercise and future returns in either the by-company or pooled regres- sions.
Tax rate changes Change over time in personal tax rates may affect exercise behavior as well.
While tax rate changes are inherently difficult to predict and therefore of limited use in predicting employee exercise behavior, they could be a significant factor explaining exercise during our sample period.
Perhaps the most natural place to look for the effects of tax rate changes on exercise is in December 1992, immediately preceding the tax rate increase for high-income US employees. 19 As a general test of the sensitivity of our results to that tax rate change, we included a dummy variable for December 1992 which should have a positive coefficient if the tax rate increase significantly accelerated exercise. The regression results were not sensitive to inclusion of the variable and there was no evidence of a systematic relation between exercise and the Decem- ber 1992 coefficient across companies.
Value of option sacriliced As an alternative to including variables that affect option value (i.e., MTS,
M T S 2, volatility, and life left) separately, one can estimate the value of the option and compute the fraction of this value that would be realized if the option were exercised. There should be a positive relation between exercise and the proport ion of the option value captured at exercise.
To evaluate the explanatory power of option value captured at exercise, we created a variable with current stock price less the strike in the numerator and, in the denominator, the Black Scholes value of the option using the current stock price, the actual strike, the remaining time to expiration, historical volatil- ity, and the current three-year Treasury bill yield. In a regression in which the proport ion of the Black-Scholes value captured replaces MTS, MTS 2, volatil- ity, and life left, the coefficient on value captured is significantly positive for all companies. However, the explanatory power of the regression generally de- creases relative to the regressions reported in Table 5. This suggests individual components of option value explain variation the Black Scholes value does not.
19Another significant event that affected tax rates was the Tax Reform Act of 1986 which substan- tially reduced rates, creating an incentive to defer exercise. However, examining exercise around the Tax Reform Act is complicated because deferred exercise is likely to be more difficult to detect than accelerated exercise and the tax rate changes were spread over several years. An examination of the exercise data during the 1986-1988 period provided no evidence of significant change in exercise behavior.
S. Huddart, M. Lang / Journal of Accounting and Economics 21 (1996) 5-43 41
5. Conclusions
Many of the accounting issues raised in response to the exposure draft hinge on the actual exercise practices of employees who own options. Despite the importance of employee stock options to earnings, little is known about option programs or employee exercise decisions. Principally, the lack of research follows from the lack of publicly available data on options for employees other than top executives.
This paper offers several insights. First, it appears early exercise is a pervasive phenomenon that has important implications for understanding employee stock options. Variables that explain exercise activity include recent stock price movement, the market-to-strike ratio, the remaining option term, the vesting schedule, and the proportion of the grant remaining unexercised. Since the results are generally similar across sample companies, employee exercise behav- ior appears to be consistent over the range of factors represented in the data. Results by level of employee point to differences across employees.
In the 1993 exposure draft on stock compensation, the FASB proposed a minor change to an existing valuation formula to arrive at an approximation of the cost of ESOs, namely the substitution of the expected time to exercise for the stated term of employee stock options in the Black-Scholes formula. However, the variability of option exercise behavior over grants at the same company complicates the measurement of the expected time to exercise. This makes extrapolating mean exercise time from past grants difficult. Moreover, our results show time alone is a poor predictor of exercise. Absent some specific guidance on the method for estimating future exercise, the justifiable range of expected time to exercise is large. This creates the potential for preparers of financial statements to manage disclosed option values through opportunistic selection of expected option life. 2°
The correlation of option exercise with stock price levels and returns has several implications for valuation. In extrapolating past exercise behavior, it is important to consider how representative the stock price history has been. If a company has experienced a substantial stock price increase over the reference period, for example, valuation based on past average option life will tend to understate the value of stock options issued. Second, it suggests pricing methods that require different parameters from those in the Black Scholes formula (e.g., a threshold market-to-strike ratio) merit consideration. Third, it indicates that the disclosure of more detailed information about outstanding options may be
2°One response to the possibility of earnings management would be to incorporate a catch-up adjustment for actual option life as proposed in the exposure draft. Our data suggest grant date estimates of mean time to exercise are likely to be imprecise. The necessary adjustments to reflect actual experience would be substantial, even absent gaming on the part of companies in selecting expected lives.
42 S. Huddart, M. Lang / Journal :?[Accounting and Economics 21 (1996) 5 43
desirable, because it would permit financial statement readers to form their own estimates of cost. Current disclosure is limited to the number of options granted, exercised, and canceled each year. Outstanding options need not be broken down by time remaining to maturity or strike price. Mandating disclosure on a grant-by-grant basis (or similar disaggregation) of the number of options outstanding, time to maturity, and strike price would allow readers to form better estimates of the likely cost of options. It would also permit researchers to test and refine valuation procedures.
The major issue remaining for the FASB is prescribing note disclosure for stock options. The regression analysis presented here suggests information on the past variability of exercise time and sensitivity of exercise behavior to stock prices may be relevant. For example, the range of past times to exercise of half the grant and the median historical market-to-strike ratio at exercise could be disclosed. The SEC currently requires that the value of stock options issued to executives be disclosed under assumptions of 5% and 10% annual stock returns. Financial statement disclosure could be enhanced by including information on expected exercise patterns under alternative assumptions about future stock price movements. Alternatively, the historical sensitivity of exercise to stock price movements could be disclosed.
For compensation design more generally, the results imply an analysis of the incentive features of options should anticipate the pervasiveness of early exer- cise. For example, a ten-year option may serve to align incentives for only five years if exercise typically takes place then. Further, the duration of incentive effects depends on stock price performance.
Finally, the analysis provides insight into individual decision-making. Em- ployees sacrifice a significant portion of potential value by exercising options before maturity. That fact and the relation between exercise and stock price movements suggest risk aversion is an important consideration for employees, consistent with theoretical models.
References
Aboody, David, 1995, Market valuation of employee stock options, Working paper (University of California, Berkeley, CA).
Alford, Andrew W. and James R. Boatsman, 1995, Predicting long-term stock return volatility: Implications for accounting and valuation of equity derivatives, Accounting Review 70, 599 618.
Black, Fisher and Myron Scholes, 1973, The pricing of options and corporate liabilities, Journal of Political Economy 31, 637-654.
Carpenter, Jennifer N., 1994, The valuation and exercise of executive stock options, Working paper (University of Pennsylvania, Philadelphia, PA).
Coopers and Lybrand, 1993, Stock options: Accounting, valuation and management issues (Coopers and Lybrand, New York, NY).
Cox, John C., Stephen A. Ross, and Mark Rubinstein, 1979, Option pricing: A simplified approach, Journal of Financial Economics 7, 229 263.

S. Huddart, M. Lang / Journal of Accounting and Economics 21 (1996) 5 43 43
Cuny, Charles J. and Philippe Jorion, 1995, Valuing executive stock options with a departure decision, Journal of Accounting and Economics 20, 193 205.
Financial Accounting Standards Board, 1993, Proposed statement of financial accounting stan- dards: Accounting for stock-based compensation (FASB, Norwalk, CT).
Foster, Taylor W., Ill, Paul R. Koogler, and Don Vickrey, 1991, Valuation of executive stock options and the FASB Proposal, Accounting Review 66, 595 610.
Hemmer, Thomas, Steve Matsunaga, and Terry Shevlin, 1994a, Estimating the 'fair value" of employee stock options with expected early exercise, Accounting Horizons 8, 23 42.
Hemmer, Thomas, Steve Matsunaga, and Terry Shevlin, 1994b, The influence of risk diversification on the early exercise of employee stock options by executive officers, Journal of Accounting and Economics, this issues.
Huddart, Steven, 1994, Employee stock options, Journal of Accounting and Economics 18, 207-231. Huddart, Steven and Mark Lang, 1994, Roundtahle on stock option valuation: Presentation to the
Financial Accounting Standards Board, April 18, 1994, Mimeo. Kulatilaka, Nalin and Alan J. Marcus, 1994, Early exercise and the valuation of employee stock
options, Financial Analysts Journal 50, 46-56. Merton, Robert C., 1973, Theory of rational option pricing, Bell Journal of Economics 4, 141-183. Sterbenz, Frederic P., Richard Elmendorf, and Betty Chavis, 1993, Adjustments to earnings per
share related to employee stock options: Income and dilution effects, Working paper (University of Wyoming, Laramie, WY).
Thaler, Richard H. and Eric J. Johnson, 1990, Gambling with the house money and trying to break even: The effects of prior outcomes on risky choice, Management Science 36, 643 660.
Yermack, David, 1995, Companies' modest claims about the value of CEO stock option awards, Working paper (New York University, New York, NY).
Related Documents