March 21, 2022 Placeholder for Presentation Name

Employee Engagement - Ryan Gunhold
Aug 20, 2015
Welcome message from author
This document is posted to help you gain knowledge. Please leave a comment to let me know what you think about it! Share it to your friends and learn new things together.
Transcript

April 18, 2023 Placeholder for Presentation Name

SHRM Presents
The Changing Face of
Employee EngagementRyan Gunhold
Associate Faculty &
Education Consultant
March 2010
Timothy Sprake
HR Director

Workshop Learning Objectives
•Understand the importance and strategic impact of conducting an internal analysis of employee engagement that establishes the foundation for change to a culture where employees are genuinely engaged in the success of the organizations they support.
•Explore the different measurements of employee engagement and why these measures are more effective at achieving organizational success.
• Understand that an engagement survey is only one of the tools available that help organizations identify the need for change and improvement. More importantly participants will understand that an organizations willingness and ability to actively pursue their current reality on multiple fronts and through multiple methods is the primary path to improvement and ultimately greatness.

4
What is a Magnetic Culture™ in the Workplace?Redefining Employee Satisfaction
• Defining Employee Engagement.
• Outcomes Driven by Employee Engagement.
• The Numbers Behind the Story of Engagement & Diversity.
• Key Drivers.
• The Top Ten Tool Kit.

5
Satisfaction versus Engagement
• “What do I get”
• Employees more focused on Pay Satisfaction, Benefits Satisfaction, Physical Working Conditions, and other factors that satisfy.
• “What you give back”
• Employees more emotional, feeling of ownership, involvement in their job, passion, safe culture, and having meaning and purpose as an employee.

6
What is a Magnetic Culture™ in the Workplace?
• A Magnetic Culture™ is one that draws talented employees to the workplace, and sustains an environment in which they are less likely to leave.
• It is marked by engaged employees who share a strong desire to be part of the value that the organization creates.

7
Defining Employee Engagement
• Engaged Employees are:
– Motivated.
– Committed.
– Very involved in their work.
– An inspiration for others.
– Supportive of co-workers.
– Oriented to providing good customer service.
– Loyal.
– Optimistic about their work goals.

8
Outcomes Influenced By Employee Engagement
• The following business outcomes result from successful implementation of Employee Engagement programs:
– Top Employer Ranking.
– Stellar Productivity and Financial Success.
– Outstanding Performance from Employees.
– A Magnetic Culture™ is established at your organization.

9
Reputation
Customer Satisfaction
Absenteeism
Retention
Outcomes Influenced By Employee Engagement
EmployeeEngagement

10
Employee Engagement – The Numbers Behind the Story
• Three Types of Employees1:
1. ENGAGED– Highly engaged and committed to the mission,
vision and values of the organization.
2. AMBIVALENT– They are “checked out”, lack of spirit and vivacity,
they feel unappreciated and insignificant.
3. ACTIVELY DISENGAGED– Negative energy, they focus on problems.
1Source: HR Solutions National Study

11
Employee Engagement – The Numbers Behind the Story
• Percentage of Engaged Employees in the workplace1:
11Source: Source: HR Solutions National StudyHR Solutions National Study
64%
17% 19%
Engaged
Ambivalent
Actively Disengaged

12
• Estimated costs of turnover in the United States economy: $5 trillion per year1.
• The cost of disengagement: $300 billion2.
1 Frank, F.D., Finnegan, R. P., & Taylor, C.R. (2004) The Race for talent: Retaining and engaging workers in the 21 st century. 2 Getting Engaged by Steve Bates, HR Magazine Feb 2004
Employee Engagement – The Numbers Behind the Story

13
Gender Quiz
My job gives me the opportunity to do the things I do best.
This organization provides me the opportunity to improve my professional knowledge.
Senior Management of this organization is concerned about the employees.
I have an opportunity to participate in decisions made by my supervisor that affect my work environment.
All in all, I am satisfied with my job.

14
Changing Priorities
1
2
3
4
5
6
<25 26-34 35-39 40-54 55+
Opportunity forTraining
Careeradvancement
Supervision
Pay
Benefits
Policies andprocedures
Age Group
Impo
rtan
ce (
6=M
ost
Impo
rtan
t)

15
Employee Engagement & Diversity Satisfaction
0%
20%
40%
60%
80%
100%
StronglyDisagree
Neither StronglyAgree
Job Sat
Diversity Sat
% F
avor
able

16
Employee Engagement – The Numbers Behind the Story
• Mature Generation—A Different Perspective on Work.
– 47% increase in age 55+ workers by 20101.– 80% of Baby Boomers plan to work at least part-time during
retirement1.– 69% of age 45+ plan to work “well beyond age 65”2.
• Characteristics3
– Trust for authority; optimal in hierarchical structure.– Compliant to organizational practices/policies.– Team players.– Long tenure at single company.– Different appreciation characteristics: Value benefits programs, role within the organization,
and recognition.
• Less value assigned to pay levels (not pay fairness).
• The older generation “lives to work” whereas the younger population “works to live.”
1 Source AARP,2 Source J. Walter Thompson, 20043 Source – The Concours Group

Connecting the Generations
Veteran Baby Boomers Generation Xers Generation Y Millenials
Outlook Practical Optimistic Skeptical Hopeful
Work Ethic Dedicated Driven Balanced Ambitious
View of Authority
Respectful Love/hate Unimpressed Relaxed, polite
Leadership by Hierarchy Consensus Competence Collaboration
Relationships Personal Sacrifice Personal gratification Reluctant to commit Loyal
Perspective Civic Team Self Civic
Influencing Messages
• Make do or do without• Stay in line• Sacrifice• Be heroic• Consider the common
good
• Be anything you want • Change the world• Work well with others• Live up to expectation• Duck and cover
• Don’t count on it• Remember – heroes…
aren’t• Get real• Survive – stayin’ alive• Ask “why?”
• Be smart– you are special
• Leave no one behind• Connect 24/7• Achieve now!• Serve your community
Source: Willa Starks, Parkview Health: The Cross Generational Workplace

18
The Face of CityU

Six Item Highlights from Data Analysis
• There is good communication between members of my work group. (80% Favorable, Education Norm: 67, National Norm: 68, BIC Norm: 80)
• My supervisor is friendly and helpful. (83% Favorable, Education Norm: 79, National Norm: 78, BIC Norm: 87)
• The person/persons doing my performance appraisal is/are aware of my work. (75% Favorable, National Norm: 69, BIC Norm: 79)
• My immediate manager’s actions are consistent with what she/she communicates. (74% Favorable, National Norm: 69, BIC Norm: 78)
• I can explain the organization’s strategy/mission to my family, friends and coworkers. (76% Favorable, National Norm: 69, BIC Norm: 84)
• I feel free to express new ideas and work methods which I feel will help this organization. (67% Favorable, National Norm: 55, BIC Norm: 81)
BIC – Best in Class
19

20
CityU of Seattle’s Employee Engagement Levels
Ambivalent, 66% (59% Norm)
Actively Disengaged, 19%
(16% Norm)
Actively Engaged, 14% (25% Norm)
A Magnetic Culture™ is one that draws talented employees to the workplace, empowers them, and sustains an environment in which they are less likely to leave.
It is marked by engaged employees who share a strong desire to be part of the value that the organization creates.

21
4653
6874
566267
81
65
75 76
85
0
10
20
30
40
50
60
70
80
90
100
Training &Development
Strategy/Mission Overall JobSatisfaction
City U Of Seattle 2008Education NormNational NormBest-in-Class Norm
Per
cent
F
avor
able
Best-in-Class – 90th Percentile in our database.
Three Dimension Opportunities from Data Analysis

Ancillary Highlights
In addition, when closing each feedback session, the facilitator made a point to ask what employees liked most about their jobs and working at City University of Seattle. The most frequent responses included the following types of comments:
Coworkers Benefits Empowerment President Variety of work Flexibility Supervisors Friendly and challenging environment

23
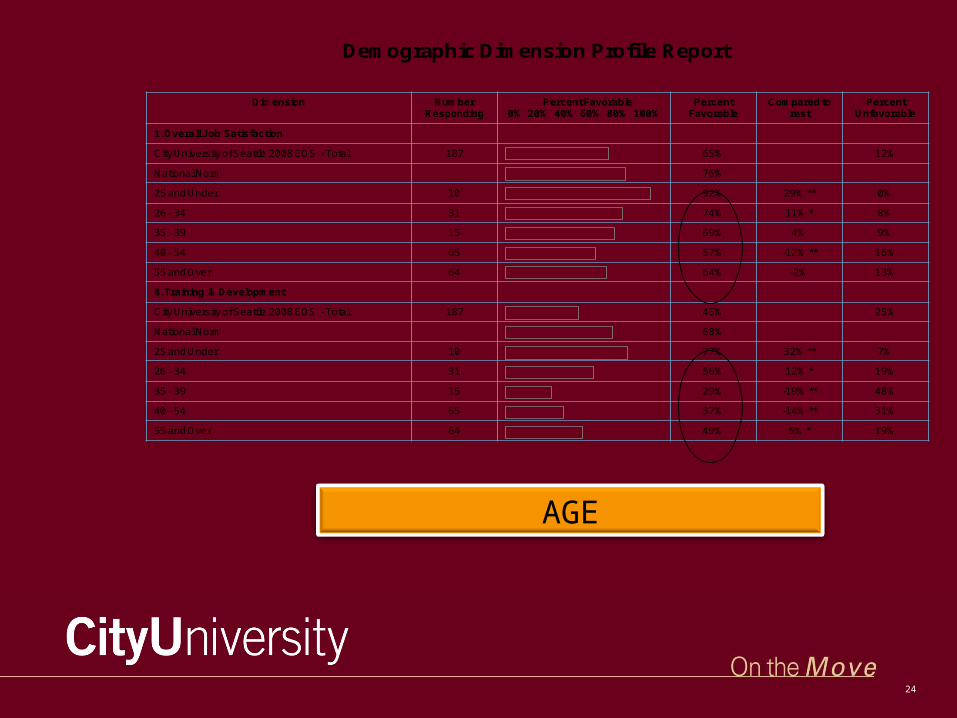
Demographic Dimension Profile Report
Dimension Number Responding
Percent Favorable 0% 20% 40% 60% 80% 100%
Percent Favorable
Compared to rest
Percent Unfavorable
1. Overall Job Satisfaction
City University of Seattle 2008 EOS - Total 187 65% 12%
National Norm 76%
Male 52 60% -8% 14%
Female 133 67% 8% 12%
3. Benefits Satisfaction
City University of Seattle 2008 EOS - Total 187 56% 19%
National Norm 61%
Male 52 44% -16% * 21%
Female 133 61% 16% * 17%
5. Communication
City University of Seattle 2008 EOS - Total 187 56% 21%
National Norm 66%
Male 52 48% -10% ** 24%
Female 133 59% 10% ** 20%
8. Training & Development
City University of Seattle 2008 EOS - Total 187 46% 25%
National Norm 68%
Male 52 44% -3% 24%
Female 133 47% 3% 26%
Male vs. Female
24
Demographic Dimension Profile Report
Dimension Number Responding
Percent Favorable 0% 20% 40% 60% 80% 100%
Percent Favorable
Compared to rest
Percent Unfavorable
1. Overall Job Satisfaction
City University of Seattle 2008 EOS - Total 187 65% 12%
National Norm 76%
25 and Under 10 92% 29% ** 0%
26 - 34 31 74% 11% * 8%
35 - 39 15 69% 4% 9%
40 - 54 65 57% -12% ** 16%
55 and Over 64 64% -2% 13%
8. Training & Development
City University of Seattle 2008 EOS - Total 187 46% 25%
National Norm 68%
25 and Under 10 77% 32% ** 7%
26 - 34 31 56% 12% * 19%
35 - 39 15 29% -19% ** 48%
40 - 54 65 37% -14% ** 31%
55 and Over 64 49% 5% * 19%
AGE

25
Demographic Dimension Profile Report
Dimension Number Responding
Percent Favorable 0% 20% 40% 60% 80% 100%
Percent Favorable
Compared to rest
Percent Unfavorable
1. Overall Job Satisfaction
City University of Seattle 2008 EOS - Total 187 65% 12%
National Norm 76%
Less than one year 34 78% 16% ** 8%
1-3 years 80 60% -9% * 14%
4-6 years 34 65% -1% 14%
7-10 years 15 59% -7% * 19%
More than ten years 22 69% 5% * 6%
8. Training & Development
City University of Seattle 2008 EOS - Total 187 46% 25%
National Norm 68%
Less than one year 34 64% 23% ** 19%
1-3 years 80 46% -1% * 30%
4-6 years 34 33% -15% * 28%
7-10 years 15 38% -9% 18%
More than ten years 22 44% -3% 17%
Years of Service

Training and Development
Feedback sessions included the following types of comments:
“There is no training or development. Orientation to company is great. You learn about the benefits. The training is fine when you first come here. There are people here that help you out. Once you are trained that is it. It is pretty much it.” Nine agreed.
“I don’t feel organization is committed to Training & Development. I got some in my own department; but there is no institutional commitment to it.” [10 of 11 Managers agreed]
• Job-role specific department training• IT Training,
• Seminars,• MS Excel training, • Phone etiquette/ transferring phone calls.
• SharePoint• Leadership Development.
• How to hold people accountable.• How to deal with underperformers.

27
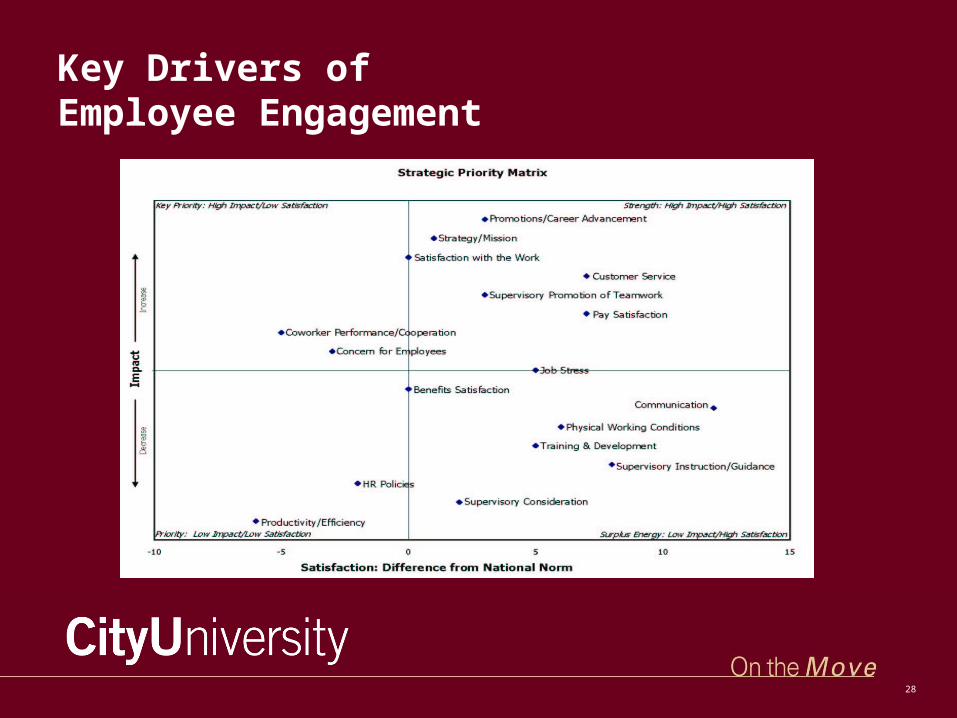
Key Drivers
1. Promotions/Career Advancement
2. Strategy/Mission
3. Satisfaction with the Work
4. Customer Service
5. Supervisory Promotion Teamwork
6. Pay Satisfaction
7. Coworker Performance/Cooperation
8. Concern for Employees
9. Job Stress
10. Benefits Satisfaction
Top 10 Influencers on Employees’ Overall Job Satisfaction/Engagement
Determination of key drivers based on survey responses in ourNational Normative Database, representing over
2.2 million participants and 2,100 organizations.
28
Key Drivers of Employee Engagement

Action Planning in ActionPro®

ActionPro® / Action Planning Process

31
Action Planning to Lowest Organizational Level

Meet with your
Supervisor to discuss
Department
Opportunities
Global Opportunities for
Senior Management
Develop Action Plan
with ActionPro®
Submit Action Plan to
Supervisor & wait for approval
Implement &
Communicate Action
Plan
APulse: Measure Results
Discuss/adjust Action Plan with
staff
Action Planning Process

Action Planning in 7 Simple Steps
1. ROADMAP to EMPLOYEE ENGAGEMENT REVIEW
2. INITIAL POST-SURVEY COMMUNICATION TO ALL EMPLOYEES
3. POST-SURVEY COMMUNICATION AMONG ALL MANAGERS
4. DEVELOP AND SAVE INITIAL ACTION PLANS IN ACTIONPRO®
5. MEET WITH YOUR EMPLOYEES TO DISCUSS THE ACTION PLAN
6. SUBMIT, COMMUNICATE, AND IMPLEMENT ACTION PLANS
7. MEASURE THE RESULTS OF THE ACTION PLAN
Senio
r M
anagem
ent
All
Managem
ent

©2007 HR Solutions, Inc. 34
The Top Ten Ways To Create a Magnetic Culture™: A Best Practices Tool Kit
1. Provide career development opportunities.2. Competitive salary.3. Flexible work schedules.4. Optimal day-to-day work life.5. Provide top-notch customer service.6. Ensure company mission is clear.7. Retain best supervisors and managers.8. Strong senior management.9. Maintain positive organizational culture.10. Generous benefits.

35
Employee Engagement & Diversity Satisfaction
37
87
0
10
20
30
40
50
60
70
80
90
100
% F
avora
ble
Q80: All in all, I am satisfiedwith my job.
Very Dissatisfiedon DiversityVery Satisfied onDiversity

36
Creating a Magnetic Culture™ in the Workplace
The kind of commitment I find among the best performers across virtually every field is a single-minded passion for what they do, an unwavering desire for excellence in the way they think and the way they work. Genuine confidence is what launches you out of bed in the morning, and through your day with a spring in your step.
Jim Collins
Source: Good to Great: Why Some Companies Make the Leap... and Others Don't, Page: 87

October 2, 2007 37
Questions / Comments
Thank You!
Related Documents

![Digital Transformation & Employee Engagement How to Make it …PDF] Ryan Thomas - Timlin... · Digital Transformation & Employee Engagement How to Make it Happen with Office 365 Ryan](https://static.cupdf.com/doc/110x72/5f95ad20b7aa8905117d4f48/digital-transformation-employee-engagement-how-to-make-it-ryan-thomas-timlin.jpg)