589 THE ACCOUNTING REVIEW American Accounting Association Vol. 84, No. 2 DOI: 10.2308/accr.2009.84.2.589 2009 pp. 589–612 Employee Discretion and Performance Pay Jaime Ortega Universidad Carlos III de Madrid ABSTRACT: This study examines the relationship between performance pay and the decision to delegate the choice of work methods and scheduling. I compare two the- oretical approaches, based on specific knowledge and measurement costs, respec- tively. Both perspectives suggest a complementarity between discretion and perform- ance pay, but the former predicts a positive effect of job complexity on discretion and performance pay, and the latter implies a negative effect. Results suggest that group and firm-wide incentives are used to decentralize decisions and to take advantage of employees’ specific knowledge, whereas piece rates are driven by performance mea- surement considerations and are not associated with more discretion. Keywords: discretion; delegation; performance pay; piece rate; specific knowledge. Data Availability: The European Working Conditions Surveys are publicly available from the European Foundation for the Improvement of Living and Working Conditions (http://www.eurofound.europa.eu). I. INTRODUCTION T his study provides empirical evidence on employee discretion (autonomy) and per- formance pay contracts for a large sample of European employees. I examine whether a firm’s decision to delegate the choice of work methods and scheduling (i.e., to give more discretion) is related to incentive pay. The idea that decentralization must be combined with appropriate incentive schemes has been studied extensively by theorists (Stiglitz 1975; Mirrlees 1976; Melumad and Reichelstein 1987; Prendergast 1995; Baiman and Rajan 1995; Aghion and Tirole 1997; Baldenius 2003). However, despite recent efforts (Osterman 1994b; MacLeod and Parent 1999; Nagar 2002; Abernethy et al. 2004; Foss and Laursen 2005; Moers 2006), empirical research is still small compared to the wealth of theoretical work in the area. There is a large empirical literature on performance pay that Earlier versions of this paper were presented at workshops organized by the Center for Economic Policy Research (Toulouse, France, May 2003) and the Center for Corporate Performance (Aarhus, Denmark, March 2006). I am grateful to the European Foundation for the Improvement of Living and Working Conditions for providing the data, to John Hurley and Sara Riso for data support, and to Clarisa Herna ´ndez for excellent editorial assistance. I thank Salvador Carmona, Edward Lazear, Eduardo Melero, James Nelson, Julien Pouget, and Michael Raith for their help. I am especially grateful to John Core, Steve Kachelmeier, and two anonymous referees for their valuable comments and suggestions. This research has been partially funded by the Spanish Ministry of Science and In- novation (grant SEJ2006-01731 / ECON) and the Community of Madrid (grant S2007 / HUM-0413). Editor’s note: Accepted by Steven Kachelmeier, with thanks to John Core for serving as editor on a previous version. Submitted: June 2006 Accepted: October 2008 Published Online: March 2009

Welcome message from author
This document is posted to help you gain knowledge. Please leave a comment to let me know what you think about it! Share it to your friends and learn new things together.
Transcript
589
THE ACCOUNTING REVIEW American Accounting AssociationVol. 84, No. 2 DOI: 10.2308/accr.2009.84.2.5892009pp. 589–612
Employee Discretion andPerformance Pay
Jaime OrtegaUniversidad Carlos III de Madrid
ABSTRACT: This study examines the relationship between performance pay and thedecision to delegate the choice of work methods and scheduling. I compare two the-oretical approaches, based on specific knowledge and measurement costs, respec-tively. Both perspectives suggest a complementarity between discretion and perform-ance pay, but the former predicts a positive effect of job complexity on discretion andperformance pay, and the latter implies a negative effect. Results suggest that groupand firm-wide incentives are used to decentralize decisions and to take advantage ofemployees’ specific knowledge, whereas piece rates are driven by performance mea-surement considerations and are not associated with more discretion.
Keywords: discretion; delegation; performance pay; piece rate; specific knowledge.
Data Availability: The European Working Conditions Surveys are publicly available fromthe European Foundation for the Improvement of Living and WorkingConditions (http:/ /www.eurofound.europa.eu).
I. INTRODUCTION
This study provides empirical evidence on employee discretion (autonomy) and per-formance pay contracts for a large sample of European employees. I examinewhether a firm’s decision to delegate the choice of work methods and scheduling
(i.e., to give more discretion) is related to incentive pay. The idea that decentralization mustbe combined with appropriate incentive schemes has been studied extensively by theorists(Stiglitz 1975; Mirrlees 1976; Melumad and Reichelstein 1987; Prendergast 1995; Baimanand Rajan 1995; Aghion and Tirole 1997; Baldenius 2003). However, despite recent efforts(Osterman 1994b; MacLeod and Parent 1999; Nagar 2002; Abernethy et al. 2004; Foss andLaursen 2005; Moers 2006), empirical research is still small compared to the wealth oftheoretical work in the area. There is a large empirical literature on performance pay that
Earlier versions of this paper were presented at workshops organized by the Center for Economic Policy Research(Toulouse, France, May 2003) and the Center for Corporate Performance (Aarhus, Denmark, March 2006). I amgrateful to the European Foundation for the Improvement of Living and Working Conditions for providing thedata, to John Hurley and Sara Riso for data support, and to Clarisa Hernandez for excellent editorial assistance. Ithank Salvador Carmona, Edward Lazear, Eduardo Melero, James Nelson, Julien Pouget, and Michael Raith fortheir help. I am especially grateful to John Core, Steve Kachelmeier, and two anonymous referees for their valuablecomments and suggestions. This research has been partially funded by the Spanish Ministry of Science and In-novation (grant SEJ2006-01731 /ECON) and the Community of Madrid (grant S2007 /HUM-0413).
Editor’s note: Accepted by Steven Kachelmeier, with thanks to John Core for serving as editor on a previousversion.
Submitted: June 2006Accepted: October 2008
Published Online: March 2009
590 Ortega
The Accounting Review March 2009American Accounting Association
does not consider discretion as part of the analysis, and a smaller empirical research thattouches on discretion but rarely examines its relationship to performance pay.1
Early research on incentive contracts placed a special emphasis on the informativenessof performance measures (Holmstrom 1979) and inspired an empirical literature focusedon examining whether the volatility of stock returns, firm earnings, or other financial ornonfinancial performance measures influenced the use of incentive contracts (Lambert andLarcker 1987; Jensen and Murphy 1990; Garen 1994; Aggarwal and Samwick 1999).Prendergast (2002) pointed out that such evidence is inconsistent with theory—many stud-ies actually find a positive or insignificant relationship between risk and incentive pay. Heargued that in riskier environments, jobs are more complex, employees have more specificknowledge, and firms tend to give more discretion. With more discretion, firms must alsogive more performance pay to make sure that incentives are aligned, which would explainthe positive correlation between risk and incentives. Earlier research also underlined theimportance of job differences to understand observed patterns of performance pay anddiscretion: Lazear (1986) argued that firms weigh monitoring costs against output mea-surement costs in choosing between salaries and piece rates; Holmstrom and Milgrom(1991), Feltham and Xie (1994), and Baker (2002) examined the role of multi-tasking onincentive contracts; and several studies have shown how discretion and incentive pay aremost effective for jobs where employees have an informational advantage (Lazear 1986;Melumad and Reichelstein 1987; Baker 1992). Yet, the empirical literature does not speakto the question of how differences across jobs influence performance pay and discretion.
The current approach has two distinguishing features. First, it hypothesizes that jobcomplexity is an important source of variation for discretion and performance pay and testswhether evidence conforms with such theoretical predictions. It therefore departs fromprevious empirical research in which the volatility of the business environment has beentaken as the main source of variation.2 Second, it provides evidence about four differenttypes of incentive contracts (piece rates, group performance pay, profit sharing, and stockownership), and relates them to the employees’ levels of discretion—i.e., it examineswhether the allocation of discretion has different effects on different types of performancepay. In this manner the current study complements Nagar (2002), where the issue of howfirms choose between different types of contracts does not arise because all performancepay contracts in his data are based on the same performance measure.
The data are drawn from the three latest European Working Conditions Surveys(EWCS), which were conducted in 1995–96, 2000–01, and 2005 by the European Foun-dation for the Improvement of Living and Working Conditions, a European Union govern-ment agency. These surveys provide a detailed description of working conditions, includingdiscretion levels and performance pay contracts, and offer two important advantages overother data sets: they provide information on discretion and pay method across a wide varietyof jobs, and they include information on four different types of performance-related pay.
I test two competing theoretical views. The first one emphasizes specific knowledgeand predicts that complexity will be positively associated with discretion and performancepay: employees with more complex jobs have more specific knowledge, firms will givediscretion to ensure that this knowledge is used, and performance pay contracts will beneeded to align incentives. The second view puts the emphasis on measurement costs and
1 For the empirical literature on performance pay, see the survey by Murphy (1999) and later work by Lazear(2000), Shearer (2004), and Bandiera et al. (2005). For empirical evidence on discretion, see Appelbaum et al.(2000), Golden (2001) and Zoghi et al. (2005).
2 See Nagar (2002) and the abovementioned empirical literature on performance pay.
Employee Discretion and Performance Pay 591
The Accounting Review March 2009American Accounting Association
suggests the opposite relationship: when jobs are more complex, performance is more dif-ficult to measure, performance pay will not be optimal, and discretion will be limited. Thus,both views suggest a complementarity between discretion and performance pay, but theyhave opposite predictions on the effect of job complexity.
In general, the analysis provides more support for the former view than for the latter.Job complexity has a positive effect on discretion and on all incentive schemes except piecerates, which suggests that, as complexity increases, the benefits from a better use of specificinformation outweigh the costs caused by a more imperfect measurement of performance.Measurement costs are important for piece rates, but covariation between discretion andpiece rates is negative, which is inconsistent with the idea of complementarity. This suggeststhat, unlike other incentive schemes, piece rates are mostly influenced by performancemeasurement considerations, and are not meant to serve as a mechanism to delegatedecision-making.
II. THEORYThis section explains the idea that employee discretion and performance pay are com-
plementary organizational choices, i.e., discretion raises the marginal benefit of performancepay, and performance pay raises the marginal benefit of discretion.
One can think of employment as an agency relationship in which the employee’s actionsare not perfectly observed by the employer (the principal), and the two parties have differentobjectives. If the employer offers more performance pay, then the agent’s incentives willbe better aligned with the principal’s, and the marginal benefit of monitoring will fall(monitoring will be less useful)—i.e., the marginal benefit of discretion will increase. Con-versely, if the principal gives more discretion to the employee, then the marginal benefit ofperformance pay will increase, because it will be more important to align the employee’sinterests with the principal’s. This complementarity implies that two systems may be op-timal for different sets of parameters: one with low levels of discretion and performancepay, and an alternative with high levels of both variables.3 The former has been calleda ‘‘salary system’’ and the latter a performance pay or piece rate system (Lazear 1986).In a salary system, the employee does not work hard unless he is closely supervised.Supervision enables the employer to fire the employee if he is not behaving in accordancewith the firm’s objectives. Therefore, an employee who works for salary will generally haveless discretion, while someone who receives performance pay will be less supervised andwill have more discretion.
To illustrate this trade-off, suppose x is the outcome of interest to the principal, a islabor input, and c(a) � a2 /2 is the agent’s disutility of effort. Assume that principal andagent are risk-neutral, and earn x � w and w, respectively, where w is the agent’s remu-neration. Suppose y is a performance measure chosen by the principal to reward the agent,such that w � w(y). The performance measure can be equal to x (output monitoring), to a(input monitoring), or to some third measure correlated with x or a. Since the principalwill prefer the most informative measure, there are cases where y � a will be optimal andcases where y � x will be preferred.
For example, suppose that x � a � t, where t is exogenous noise and is not observedby the principal or the agent. If labor input can be measured at very low cost (comparedto the cost of measuring x), then it is better to have y � a instead of y � x. The firm canask the agent to choose the optimal level of input (a � 1) and fire him otherwise. Thus,
3 See Roberts (2004) for an overview of complementarities in organizational design.
592 Ortega
The Accounting Review March 2009American Accounting Association
the agent will have no discretion and will be paid a salary. Of course, if the cost of inputmeasurement is high compared to the cost of output measurement, then the firm wouldprefer to measure x instead of a, and would offer a performance pay contract. Since awould not be measured, the employee would have discretion—i.e., he would choose a tosatisfy a standard incentive compatibility constraint. Thus, depending on how costly it isto measure x and a, a salary system or a performance pay system will be optimal.
Now suppose that x � at, where in this case t is known to the agent, but not to theprincipal. We can think of t as ‘‘specific knowledge’’ that the employee learns on the joband is too costly for the principal to learn. Since the optimal level of input is now givenby a � t,4 being able to measure the input is not enough to control the agent: even if theprincipal knew what a has been chosen, he would still have to know t to discern whetherthe choice was optimal. As a consequence, if t cannot be learned, then a salary system willnot be optimal. An alternative is to ask the agent to maximize x—i.e., to ‘‘sell the firm’’to the agent or give him some ‘‘high-powered’’ incentive scheme. This makes sense as longas the agent has discretion to choose a; if not, he will not use his information about t tochoose a � t. Thus, in this case, the employer is likely to prefer to monitor the output(y � x) and delegate discretion to the agent.
The literature on specific knowledge (Baker 1992; Prendergast 2002; Raith 2008) holdsthat employees with more complex jobs have more specific knowledge. For this reason, inPrendergast (2002), when the job is complex, it is too costly for the firm to know whichactions are optimal, and it is better to use a performance pay scheme and let the agentdecide which action to take. Because the employee has discretion and is paid through aperformance pay contract, he will use his specific knowledge to meet organizational goals.In Raith (2008), the job involves multiple tasks and the agent can have private informationabout the optimal distribution of effort across tasks. In this setting, when jobs are morecomplex, there will be more discretion and performance pay in order to take advantage ofthe employee’s specific knowledge. In addition, in a two-agent variant of the model, Raith(2008) shows that complexity will reduce individual-based performance pay and will in-crease group-based performance pay if the employee’s specific knowledge is about the valueof his contribution to team output.
Job complexity is also important in the measurement cost approach. In Lazear (1986),to implement a piece rate, the firm must be able to measure actual output, but to implementa salary scheme it suffices to know whether input is above or below a minimum requiredlevel. If complexity means that it is very costly to measure output, when jobs are complexfirms will prefer a salary system, and employees will have less discretion. Thus, complexityis likely to have a negative effect on both discretion and performance pay. In Holmstromand Milgrom (1991), jobs are complex for a different reason: there are multiple tasks anddifferences in measurement costs across tasks. Performance pay contracts generate distor-tions because employees will tend to concentrate their effort on the tasks that have moreimpact on pay,5 and if so, firms can prefer to pay a straight salary. Related work on con-gruity (Feltham and Xie 1994; Baker 2002) also suggests that lack of congruity will be a
4 Total value is given by x � c(a). If x � at and t is known and can be contracted on, then a can be chosen soas to maximize the exact total value x � c(a) � at � a2 /2. Maximizing with respect to a yields a � t.
5 Because output measurement costs vary across tasks, in general the (second-best) optimal performance paycontract will be such that the weights of the different output measures in the agent’s remuneration will not beproportional to their relative importance in the principal’s objective function.
Employee Discretion and Performance Pay 593
The Accounting Review March 2009American Accounting Association
more important problem when jobs are more complex. Since lack of congruity leads todistortions in effort, it can be optimal to pay a straight salary.6
In summary, both the specific knowledge and measurement cost approaches imply thatan increase in complexity will produce a positive covariation between discretion and per-formance pay. However, the specific knowledge approach suggests that discretion andperformance pay will increase, while the measurement cost approach suggests they willdiminish.
III. EMPIRICAL EVIDENCEEmpirical evidence can be organized in three groups. The first concerns the determi-
nants of discretion and performance pay (Osterman 1994b; MacLeod and Parent 1999;Nagar 2002; Foss and Laursen 2005).7 MacLeod and Parent (1999) use individual data toestimate the determinants of pay method. In some specifications, they find that discretionreduces the use of piece rates and hourly wages versus other pay methods, raising theprobability that the firm chooses piece rates over hourly wages, and commissions oversalaries. The current study is different because it focuses on job complexity and allows forthe possibility that employees receive more than one type of pay.8 Osterman (1994b) esti-mates the effect of pay level, performance pay, and other human resource (HR) practiceson discretion for a sample of establishments, but finds no significant effect of performancepay. Nagar (2002) and Foss and Laursen (2005) study uncertainty as a source of variationfor discretion and performance pay. They use a simultaneous equation approach in whichdiscretion and pay method are endogenous and the level of uncertainty can influence thetwo choice variables. Both studies find a positive effect of discretion on performance payand some evidence of a positive effect of uncertainty on discretion and performancepay. However, there is no evidence of a positive effect of performance pay on discretion.The current study is different because I use a reduced-form estimation approach in whichjob complexity (instead of uncertainty) is the main source of contract variation.
A second set of studies estimates the effect of bundles of HR practices on labor pro-ductivity, output quality, and financial performance, typically using firm or establishmentdata. This literature finds that the joint introduction of performance pay, employee involve-ment policies, and other ‘‘innovative’’ HR practices increases labor productivity and outputquality, which is consistent with complementarity.9 My study differs from this literature in
6 Note that here, as in Lazear (1986), measurement costs play a key role: in fact, consider the multi-task setting,and suppose a job becomes more complex because extra tasks are added to it. If measurement costs were similarfor new and old tasks, then the increase in complexity could have no effect on performance pay and discretion.
7 See also Abernethy et al. (2004) and Moers (2006). Abernethy et al. (2004) relate decentralization to the useof divisional summary performance measures (DSMs) versus more specific (nonfinancial) or broader (financial)measures. They study whether divisional managers have more discretion when DSMs weigh more heavily intheir evaluation. However, the article does not tell whether DSMs are used as part of an explicit incentivecontract. Moers (2006) uses a sample of managers with a performance pay contract and examines the influenceof measurement quality on delegation. Quality is given by the verifiability, sensitivity, and precision of perform-ance measures. He shows that firms delegate more when the difference in quality between financial and nonfi-nancial measures of performance increases.
8 According to the EWCS, in 2005 approximately 17 percent of salary earners received some kind of performancepay, and 22 percent of employees with performance pay had at least two different types of incentive scheme.
9 See Ichniowski (1990), Cooke (1994), MacDuffie (1995), Huselid (1995), Huselid and Becker (1996), Deleryand Doty (1996), Ichniowski et al. (1997), Appelbaum et al. (2000), Cappelli and Neumark (2001), Black andLynch (2001), Conyon and Freeman (2004), and Kruse et al. (2004). The effects on financial performance areless clear. In particular, it has been noted that adjustment costs are important and that high-involvement practicestend to raise labor costs Cappelli and Neumark (2001).
594 Ortega
The Accounting Review March 2009American Accounting Association
two respects. First, I am concerned about the reasons why firms give discretion and per-formance pay. As noted in the previous section, the positive effect of discretion and incen-tive contracts on performance is consistent with several theories, and the aim of this studyis to test these theories empirically. Second, I am interested in discretion as an aspect ofjob design. The studies of bundles typically consider two types of employee involvementpractices: some that imply job re-design and others that can be adopted without majorchanges in job design.10 I focus only on the former.
The third and last group of studies analyze performance pay or discretion, but not theirrelationship to one another. Research on performance pay shows a very large productivityeffect, which is consistent with the above-mentioned literature on HR bundles. As fordiscretion, research is primarily concerned with work-family balance, the relationship withother HR practices, and the effects on employee well-being and motivation.11
IV. DATAThe main data sources for this article are the second, third, and fourth European Work-
ing Conditions Surveys (EWCS), conducted in 1995–96, 2000–01 and 2005, respectively,by the European Foundation for the Improvement of Living and Working Conditions, aEuropean Union government agency.12 The main purpose of the surveys was to evaluatethe quality of working conditions in Europe. Aside from standard employer and employeecharacteristics, they include questions in five different areas: the physical work environment,time use, job characteristics, the social environment at work, and health outcomes.
The EWCS has already been used to study a variety of topics. Green and McIntosh(2001) used the first and second Surveys to analyze the evolution of work effort in Europefrom 1991 to 1996, and Nienhuser and Matiaske (2006) used the third Survey to analyzethe working conditions of temporary agency workers. Daniels et al. (2007) studied therelationship between discretion (job control) and health outcomes. Tangian (2007) con-ducted a statistical analysis of the third Survey to construct an indicator of workingconditions and studies its correlation with earnings across Europe, and Morley (2007) usedthe fourth Survey to analyze the consequences of the European Union enlargement.
The EWCS is based on individual interviews conducted at the respondents’ homes. Thesecond Survey (Paoli 1997) was conducted between November 1995 and January 1996 inthe 15 countries that were members of the European Union (EU)—the so-called EU-15group. It has an important limitation for this study, because it provides information aboutonly one type of performance pay (piece rates). For this reason, and for the sake of brevity,I do not tabulate the results from this Survey, although I discuss them in the text. The thirdand fourth Surveys provide more complete information and constitute the main basis forthe analysis. The third EWCS surveyed the EU-15 group in March 2000 (Paoli and Merllie
10 For example, corporate newsletters, union-management meetings and offline consultation schemes can be im-plemented with little job re-design, whereas self-managed online teams involve more substantial changes.
11 The effects of explicit incentive contracts on productivity have been studied by Lazear (2000), Shearer (2004),Bandiera et al. (2005), and Matsumura and Shin (2006) among others. Studies of determinants of discretioninclude Osterman (1995), Golden (2001), and Zoghi et al. (2005). For the effect of discretion on satisfaction,see Karasek (1979), Parker and Wall (1998), Singh (2000), and Parker (2003).
12 I do not use the first EWCS (conducted in 1991) because it does not have information about job complexity,age, tenure, the number of subordinates, sex, and industry. Moreover, the questionnaire does not distinguishbetween different types of performance pay (the only question on pay method is: ‘‘Do your wages or incomedepend upon your work rate?’’), and there are only two questions about discretion (order of tasks and speed ofwork).
Employee Discretion and Performance Pay 595
The Accounting Review March 2009American Accounting Association
2001) and 12 ‘‘acceding’’ and ‘‘candidate’’ countries13 in May and July 2001 (Paoli andParent-Thirion 2003). The fourth EWCS was conducted between September and November2005 in those 27 countries, and in Croatia, Norway, Switzerland, and Turkey (Parent-Thirion et al. 2007). The response rates were 61 percent in the second and third Surveysand 48 percent in the fourth Survey. Because I only use data about employees, my samplehas almost 24,000 observations from 2000–01, nearly 20,000 observations from 2005, andmore than 41,000 pooled observations (2000–05). I also discuss results based on the secondSurvey, which includes almost 10,000 usable observations.
V. MODEL SPECIFICATION AND DEFINITION OF VARIABLESI investigate the following two relations:
Discretion � ƒ(Complexity, Controls); (1)
PerformancePay � g(Complexity, Controls). (2)
The measures of employee discretion, performance pay, and job complexity, as well as thecontrol variables, are discussed next.
Employee DiscretionEmployee discretion or ‘‘job autonomy’’ is defined in the organizational behavior lit-
erature as the extent to which employees can choose their own work methods and schedules(Hackman and Oldham 1975). The EWCS contains six related questions: two about thechoice of work methods and work hours, and four more specific questions that concerndiscretion to choose the order of tasks, the rate or speed of work, when to take breaks, andwhen to take vacations and days off (see definitions in Table 1). Based on these questions,I define six dichotomous variables: METHODS, HOURS, ORDER, SPEED, BREAKS, andDAYSOFF (see Table 2 for summary statistics). Factor analysis of these variables yieldstwo measures of discretion (see the Appendix for details). The first one measures discretionto choose the methods of work and is defined as DIMETH � (ORDER � METHODS� SPEED) /3, and the second one measures discretion to choose work schedules and is de-fined as DISCHED � (BREAKS � HOURS � DAYSOFF) /3. As in Nagar (2002), the sixbase variables are standardized to have a 0 mean and a standard deviation equal to 1.
Performance PayThe third and fourth Surveys contain information about four types of performance pay:
piece rates or productivity payments, group performance pay, profit sharing, and employeestock ownership. The second Survey only includes information about piece rates or pro-ductivity payments. In each case, the employee reports whether his compensation includeseach of these items, and based on the answers I construct four dichotomous variables:PRATE (piece rate or productivity payments), GPAY (group performance pay), PSHARING(profit sharing), and STOCK (stock ownership). Variable definitions are shown in Table 1,with summary statistics in Table 2. Piece rates are the most frequent type of performancepay (around 11 percent in 2005), followed by profit-sharing schemes (around 8 percent)
13 EU-15 group: Austria, Belgium, Denmark, Finland, France, Germany, Greece, Ireland, Italy, Luxemburg, TheNetherlands, Portugal, Spain, Sweden, and United Kingdom. ‘‘Acceding’’ and ‘‘candidate’’ countries: Bulgaria,Cyprus, Czech Republic, Estonia, Hungary, Latvia, Lituania, Malta, Poland, Romania, Slovakia, and Slovenia.
596 Ortega
The Accounting Review March 2009American Accounting Association
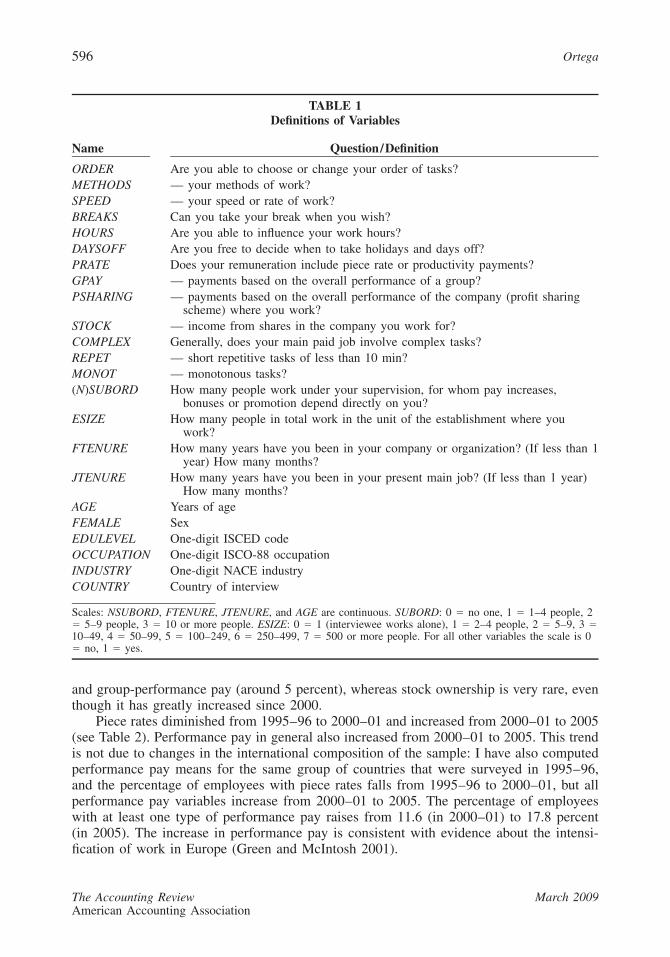
TABLE 1Definitions of Variables
Name Question/Definition
ORDER Are you able to choose or change your order of tasks?METHODS — your methods of work?SPEED — your speed or rate of work?BREAKS Can you take your break when you wish?HOURS Are you able to influence your work hours?DAYSOFF Are you free to decide when to take holidays and days off?PRATE Does your remuneration include piece rate or productivity payments?GPAY — payments based on the overall performance of a group?PSHARING — payments based on the overall performance of the company (profit sharing
scheme) where you work?STOCK — income from shares in the company you work for?COMPLEX Generally, does your main paid job involve complex tasks?REPET — short repetitive tasks of less than 10 min?MONOT — monotonous tasks?(N)SUBORD How many people work under your supervision, for whom pay increases,
bonuses or promotion depend directly on you?ESIZE How many people in total work in the unit of the establishment where you
work?FTENURE How many years have you been in your company or organization? (If less than 1
year) How many months?JTENURE How many years have you been in your present main job? (If less than 1 year)
How many months?AGE Years of ageFEMALE SexEDULEVEL One-digit ISCED codeOCCUPATION One-digit ISCO-88 occupationINDUSTRY One-digit NACE industryCOUNTRY Country of interview
Scales: NSUBORD, FTENURE, JTENURE, and AGE are continuous. SUBORD: 0 � no one, 1 � 1–4 people, 2� 5–9 people, 3 � 10 or more people. ESIZE: 0 � 1 (interviewee works alone), 1 � 2–4 people, 2 � 5–9, 3 �10–49, 4 � 50–99, 5 � 100–249, 6 � 250–499, 7 � 500 or more people. For all other variables the scale is 0� no, 1 � yes.
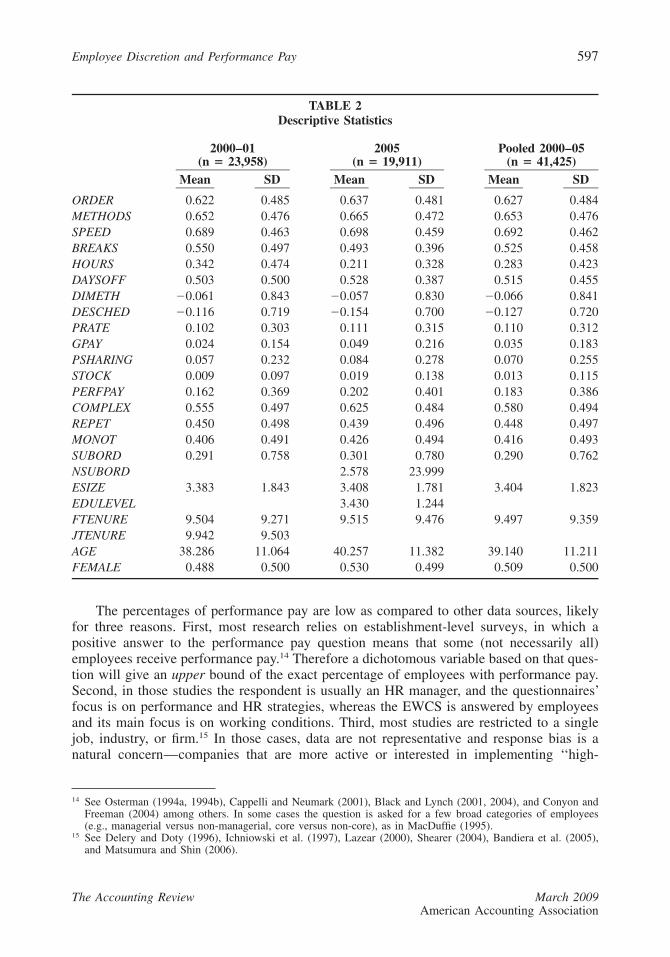
and group-performance pay (around 5 percent), whereas stock ownership is very rare, eventhough it has greatly increased since 2000.
Piece rates diminished from 1995–96 to 2000–01 and increased from 2000–01 to 2005(see Table 2). Performance pay in general also increased from 2000–01 to 2005. This trendis not due to changes in the international composition of the sample: I have also computedperformance pay means for the same group of countries that were surveyed in 1995–96,and the percentage of employees with piece rates falls from 1995–96 to 2000–01, but allperformance pay variables increase from 2000–01 to 2005. The percentage of employeeswith at least one type of performance pay raises from 11.6 (in 2000–01) to 17.8 percent(in 2005). The increase in performance pay is consistent with evidence about the intensi-fication of work in Europe (Green and McIntosh 2001).
Employee Discretion and Performance Pay 597
The Accounting Review March 2009American Accounting Association
TABLE 2Descriptive Statistics
2000–01(n � 23,958)
2005(n � 19,911)
Pooled 2000–05(n � 41,425)
Mean SD Mean SD Mean SD
ORDER 0.622 0.485 0.637 0.481 0.627 0.484METHODS 0.652 0.476 0.665 0.472 0.653 0.476SPEED 0.689 0.463 0.698 0.459 0.692 0.462BREAKS 0.550 0.497 0.493 0.396 0.525 0.458HOURS 0.342 0.474 0.211 0.328 0.283 0.423DAYSOFF 0.503 0.500 0.528 0.387 0.515 0.455DIMETH �0.061 0.843 �0.057 0.830 �0.066 0.841DESCHED �0.116 0.719 �0.154 0.700 �0.127 0.720PRATE 0.102 0.303 0.111 0.315 0.110 0.312GPAY 0.024 0.154 0.049 0.216 0.035 0.183PSHARING 0.057 0.232 0.084 0.278 0.070 0.255STOCK 0.009 0.097 0.019 0.138 0.013 0.115PERFPAY 0.162 0.369 0.202 0.401 0.183 0.386COMPLEX 0.555 0.497 0.625 0.484 0.580 0.494REPET 0.450 0.498 0.439 0.496 0.448 0.497MONOT 0.406 0.491 0.426 0.494 0.416 0.493SUBORD 0.291 0.758 0.301 0.780 0.290 0.762NSUBORD 2.578 23.999ESIZE 3.383 1.843 3.408 1.781 3.404 1.823EDULEVEL 3.430 1.244FTENURE 9.504 9.271 9.515 9.476 9.497 9.359JTENURE 9.942 9.503AGE 38.286 11.064 40.257 11.382 39.140 11.211FEMALE 0.488 0.500 0.530 0.499 0.509 0.500
The percentages of performance pay are low as compared to other data sources, likelyfor three reasons. First, most research relies on establishment-level surveys, in which apositive answer to the performance pay question means that some (not necessarily all)employees receive performance pay.14 Therefore a dichotomous variable based on that ques-tion will give an upper bound of the exact percentage of employees with performance pay.Second, in those studies the respondent is usually an HR manager, and the questionnaires’focus is on performance and HR strategies, whereas the EWCS is answered by employeesand its main focus is on working conditions. Third, most studies are restricted to a singlejob, industry, or firm.15 In those cases, data are not representative and response bias is anatural concern—companies that are more active or interested in implementing ‘‘high-
14 See Osterman (1994a, 1994b), Cappelli and Neumark (2001), Black and Lynch (2001, 2004), and Conyon andFreeman (2004) among others. In some cases the question is asked for a few broad categories of employees(e.g., managerial versus non-managerial, core versus non-core), as in MacDuffie (1995).
15 See Delery and Doty (1996), Ichniowski et al. (1997), Lazear (2000), Shearer (2004), Bandiera et al. (2005),and Matsumura and Shin (2006).
598 Ortega
The Accounting Review March 2009American Accounting Association
performance’’ practices are more likely to welcome academic researchers. When EWCSdata are compared with data from similar surveys, the percentage of employees with per-formance pay is actually quite similar.16
EWCS data on performance pay are consistent with evidence about performance mea-surement. The Survey provides indirect information about three types of performancemeasurement: specifically, it asks whether ‘‘the pace of work is dependent on numericalproduction targets,’’ and whether the job involves ‘‘meeting precise quality standards’’ and‘‘assessing yourself the quality of your own work.’’ A positive answer to the first questionmeans that the firm sets production targets and the employee is working to meet them,which suggests that the employee must be monitored on output. Consistent with this im-plication, piece rates are much more correlated with numerical production targets than withprecise quality standards or self-assessment.17
Job ComplexityI examine three measures of complexity. COMPLEX is equal to 1 when the respondent’s
job involves doing complex tasks, and 0 otherwise (see Table 1). The other two variablesare also dichotomous and measure whether the job involves monotonous tasks (MONOT)or ‘‘short repetitive tasks of less than ten minutes’’ (REPET). As expected, COMPLEX isnegatively correlated with REPET and MONOT, although the correlations are relativelysmall compared to the correlation between REPET and MONOT (see Table 5).18 This maybe because REPET and MONOT are not only informative within low-skill occupations, butalso because task variety is only one source of complexity among others. For these reasons,a priori COMPLEX seems a better measure of complexity than REPET or MONOT.
Since these measures are self-reported, there may be various sources of bias. Onepossibility is that employees alter their responses to influence employers. This bias seemsunlikely, however, because the EWCS was not conducted or sponsored by employers, andemployees were interviewed at home and did not report their employer’s name. A secondsource of potential bias is that respondents’ perceptions of complexity may vary with skillsand experience. However, I find that job tenure, firm tenure, and age are positively corre-lated with COMPLEX and negatively correlated with REPET and MONOT, which wouldbe inconsistent with the idea that inexperienced workers over-estimate complexity. I alsoregress the three complexity variables on firm tenure, age, age squared, and standard con-trols (the number of subordinates, establishment size, gender, and occupation, industry, andcountry indicators), using the pooled 2000–05 sample (results available upon request). I
16 The EWCS rates of performance pay are similar to the rates computed from other individual-level data sets,such as the German Wage Structure Samples (Jirjahn 2002) or the French Salary Structure Survey (Fakhfakhand Perotin 2002; Pouget 2005). The British Household Panel Survey (BHPS) does show a higher percentageof employees with performance pay than the EWCS, but the phrasing of the questions is different: whereas theEWCS asks whether the respondent receives performance pay, the BHPS asks whether employees have everreceived performance pay. For the United States individual-level data sets also find performance pay contractsto be less frequent than suggested by establishment-level surveys (Parent 1999; Heywood and O’Halloran 2005).For example, using the latest National Longitudinal Survey of Youth (NLSY) available data on performance pay(1995–2000), Heywood and O’Halloran (2005) report that 8.44 percent of male full-time private-sector em-ployees earned piece rates, tips, or commissions, and 19.42 percent of them earned bonuses based on objectiveor subjective performance assessments.
17 Piece rates are also much more correlated with quality standards (which imply that there is some objectivemeasure of output quality) than with self-assessment.
18 However, Cronbach’s alpha between REPET and MONOT (0.392 in the pooled sample) is not high enough torecommend aggregation.
Employee Discretion and Performance Pay 599
The Accounting Review March 2009American Accounting Association
find that firm tenure and age have a positive effect on COMPLEX and a negative effect onMONOT. Age has a negative effect on REPET, but the effect of firm tenure is positive.19
Control VariablesSome control variables are available for the three Surveys, while others are only avail-
able for the third or fourth Surveys.As reported in Tables 1 and 2, the variables available for the three surveys are the
number of subordinates, tenure in the firm, age, gender, establishment size, industry, oc-cupation, and country. The number of subordinates is the number of people whose pay andpromotion depend directly upon the respondent (see Table 1). Responses are available infour intervals, from which I create four indicator variables and a summary measure(SUBORD). Information about establishment size also comes in intervals, and I also createa summary measure (ESIZE) and an indicator for each interval (see Tables 1 and 2 formore detailed information about ESIZE). Data on industry and occupation are provided atthe one-digit level and are based on standard international classifications (see Table 1).
In the third Survey there is a question about tenure in the job, but this question is notincluded in the fourth Survey. Thus, for the 2000–01 regressions, I use three measuresof tenure as controls: firm tenure, job tenure, and an interaction term (firm tenure � jobtenure). On the other hand, the fourth Survey provides information about completed edu-cation, with a scale based on one-digit ISCED codes. With this information I create anindicator for each level of educational attainment and one summary measure (EDULEVEL)(see Tables 1 and 2). In addition, the fourth Survey provides the exact number of subor-dinates, from which I construct a continuous variable (NSUBORD). I use NSUBORD andits square as control variables in the regressions with 2005 data.
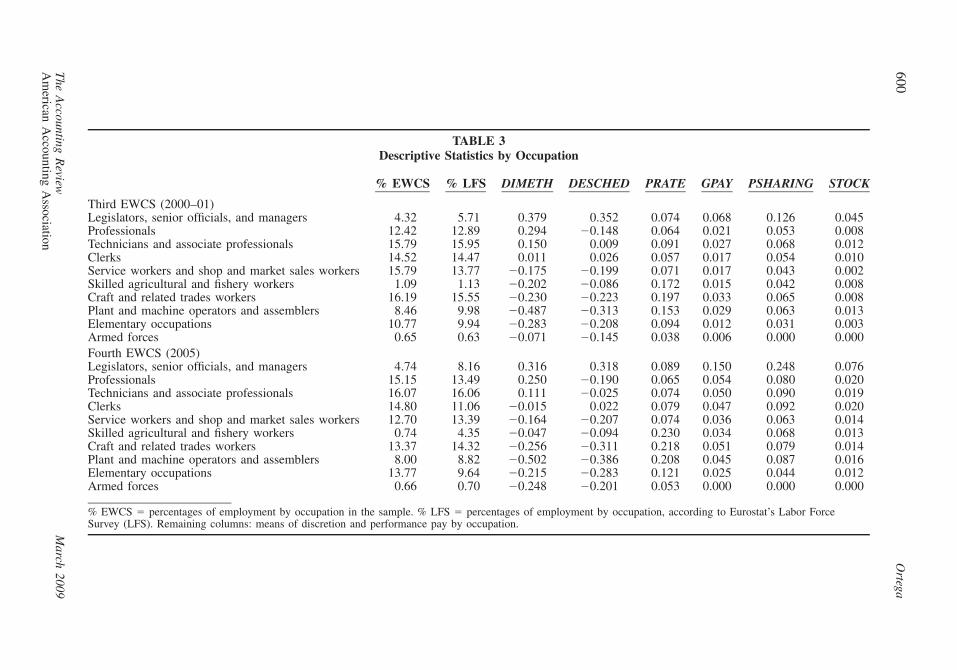
VI. RESULTSTable 3 reports the means of the dependent variables by occupation. Discretion is
highest for the top occupations and tends to diminish with occupational level. The onlyclear exception is for professionals, for whom DESCHED is relatively low and DIMETHis relatively high. There are also important differences in performance pay across occupa-tions. Piece rates are most common among skilled agricultural workers, craft and relatedtrades workers, and machine operators and assemblers (15 to 23 percent of employees),and least common for clerical and other service jobs (less than 8 percent). In contrast, theother types of performance pay are more common for white-collar employees in generaland managers in particular than for blue-collar workers.
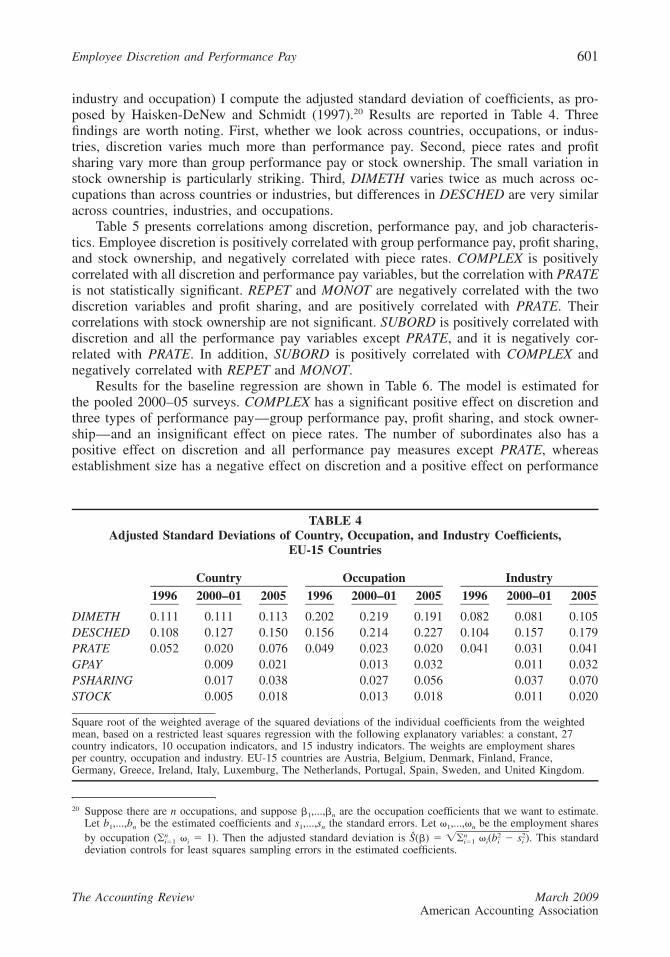
To estimate the size of the variation in discretion and performance pay across occu-pations, and to compare it with the size of the variation across countries and industries, Iregress the six dependent variables on all the country, industry, and occupation indicators,and a constant. I use a restricted least squares approach whereby, for each set of coefficients(country, industry, and occupation), I constrain the weighted average of coefficients (withemployment shares as weights) to be equal to 0. Next, for each set of indicators (country,
19 With the 2000–01 sample, I regress the three complexity variables on a broader set of variables, which includejob tenure and firm tenure � job tenure, in addition to the variables used for the 2000–05 sample. Age and thetwo tenure variables have a positive effect on COMPLEX. Job tenure and age have positive and negative effects(respectively) on REPET, and firm tenure and age have negative effects on MONOT. Details are available uponrequest.
600O
rtega
The
Accounting
Review
March
2009A
merican
Accounting
Association
TABLE 3Descriptive Statistics by Occupation
% EWCS % LFS DIMETH DESCHED PRATE GPAY PSHARING STOCK
Third EWCS (2000–01)Legislators, senior officials, and managers 4.32 5.71 0.379 0.352 0.074 0.068 0.126 0.045Professionals 12.42 12.89 0.294 �0.148 0.064 0.021 0.053 0.008Technicians and associate professionals 15.79 15.95 0.150 0.009 0.091 0.027 0.068 0.012Clerks 14.52 14.47 0.011 0.026 0.057 0.017 0.054 0.010Service workers and shop and market sales workers 15.79 13.77 �0.175 �0.199 0.071 0.017 0.043 0.002Skilled agricultural and fishery workers 1.09 1.13 �0.202 �0.086 0.172 0.015 0.042 0.008Craft and related trades workers 16.19 15.55 �0.230 �0.223 0.197 0.033 0.065 0.008Plant and machine operators and assemblers 8.46 9.98 �0.487 �0.313 0.153 0.029 0.063 0.013Elementary occupations 10.77 9.94 �0.283 �0.208 0.094 0.012 0.031 0.003Armed forces 0.65 0.63 �0.071 �0.145 0.038 0.006 0.000 0.000Fourth EWCS (2005)Legislators, senior officials, and managers 4.74 8.16 0.316 0.318 0.089 0.150 0.248 0.076Professionals 15.15 13.49 0.250 �0.190 0.065 0.054 0.080 0.020Technicians and associate professionals 16.07 16.06 0.111 �0.025 0.074 0.050 0.090 0.019Clerks 14.80 11.06 �0.015 0.022 0.079 0.047 0.092 0.020Service workers and shop and market sales workers 12.70 13.39 �0.164 �0.207 0.074 0.036 0.063 0.014Skilled agricultural and fishery workers 0.74 4.35 �0.047 �0.094 0.230 0.034 0.068 0.013Craft and related trades workers 13.37 14.32 �0.256 �0.311 0.218 0.051 0.079 0.014Plant and machine operators and assemblers 8.00 8.82 �0.502 �0.386 0.208 0.045 0.087 0.016Elementary occupations 13.77 9.64 �0.215 �0.283 0.121 0.025 0.044 0.012Armed forces 0.66 0.70 �0.248 �0.201 0.053 0.000 0.000 0.000
% EWCS � percentages of employment by occupation in the sample. % LFS � percentages of employment by occupation, according to Eurostat’s Labor ForceSurvey (LFS). Remaining columns: means of discretion and performance pay by occupation.
Employee Discretion and Performance Pay 601
The Accounting Review March 2009American Accounting Association
TABLE 4Adjusted Standard Deviations of Country, Occupation, and Industry Coefficients,
EU-15 Countries
Country Occupation Industry1996 2000–01 2005 1996 2000–01 2005 1996 2000–01 2005
DIMETH 0.111 0.111 0.113 0.202 0.219 0.191 0.082 0.081 0.105DESCHED 0.108 0.127 0.150 0.156 0.214 0.227 0.104 0.157 0.179PRATE 0.052 0.020 0.076 0.049 0.023 0.020 0.041 0.031 0.041GPAY 0.009 0.021 0.013 0.032 0.011 0.032PSHARING 0.017 0.038 0.027 0.056 0.037 0.070STOCK 0.005 0.018 0.013 0.018 0.011 0.020
Square root of the weighted average of the squared deviations of the individual coefficients from the weightedmean, based on a restricted least squares regression with the following explanatory variables: a constant, 27country indicators, 10 occupation indicators, and 15 industry indicators. The weights are employment sharesper country, occupation and industry. EU-15 countries are Austria, Belgium, Denmark, Finland, France,Germany, Greece, Ireland, Italy, Luxemburg, The Netherlands, Portugal, Spain, Sweden, and United Kingdom.
industry and occupation) I compute the adjusted standard deviation of coefficients, as pro-posed by Haisken-DeNew and Schmidt (1997).20 Results are reported in Table 4. Threefindings are worth noting. First, whether we look across countries, occupations, or indus-tries, discretion varies much more than performance pay. Second, piece rates and profitsharing vary more than group performance pay or stock ownership. The small variation instock ownership is particularly striking. Third, DIMETH varies twice as much across oc-cupations than across countries or industries, but differences in DESCHED are very similaracross countries, industries, and occupations.
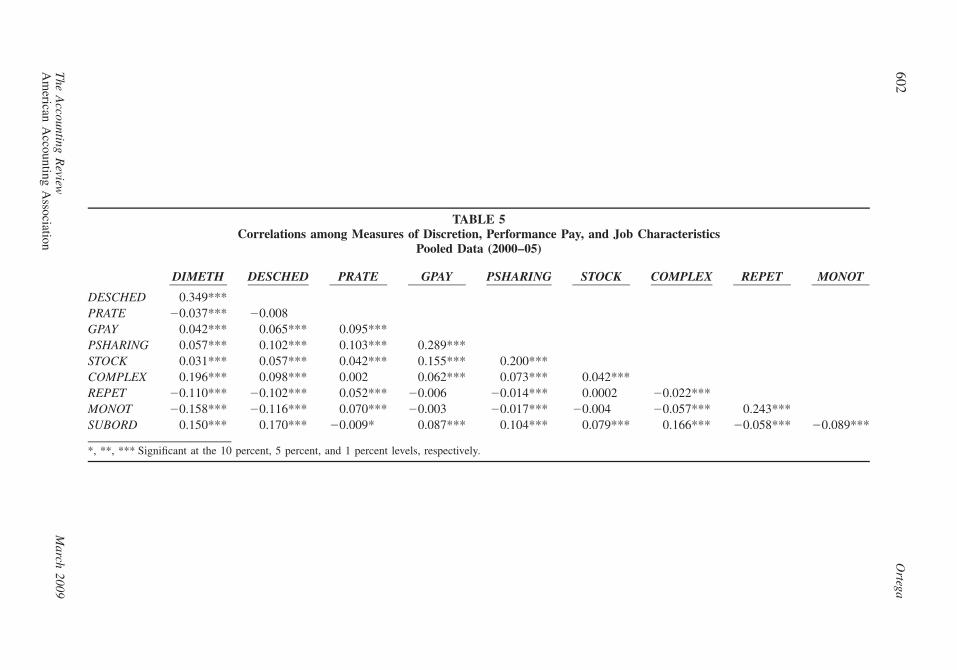
Table 5 presents correlations among discretion, performance pay, and job characteris-tics. Employee discretion is positively correlated with group performance pay, profit sharing,and stock ownership, and negatively correlated with piece rates. COMPLEX is positivelycorrelated with all discretion and performance pay variables, but the correlation with PRATEis not statistically significant. REPET and MONOT are negatively correlated with the twodiscretion variables and profit sharing, and are positively correlated with PRATE. Theircorrelations with stock ownership are not significant. SUBORD is positively correlated withdiscretion and all the performance pay variables except PRATE, and it is negatively cor-related with PRATE. In addition, SUBORD is positively correlated with COMPLEX andnegatively correlated with REPET and MONOT.
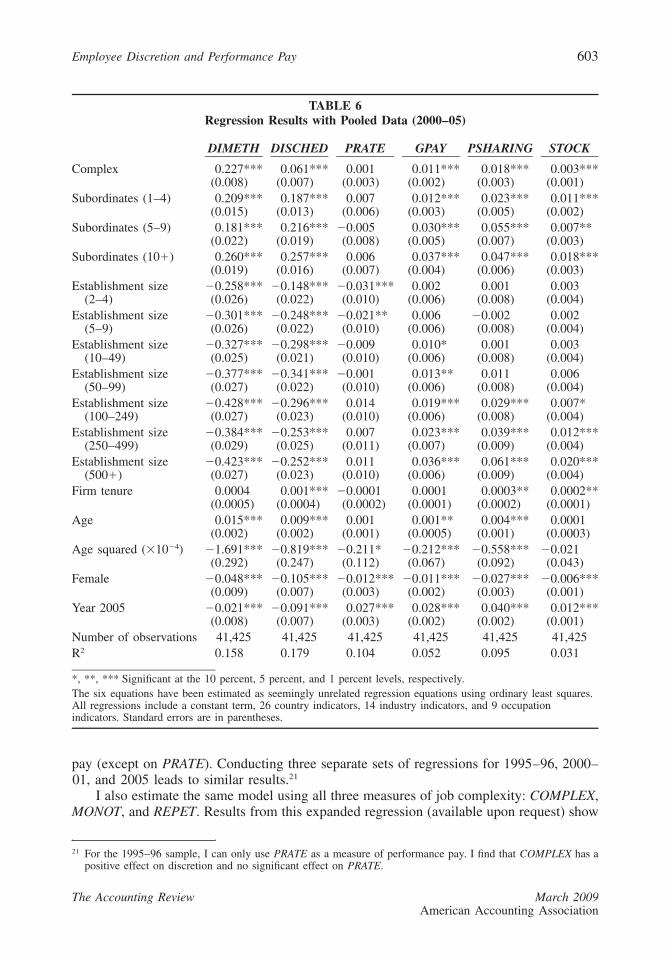
Results for the baseline regression are shown in Table 6. The model is estimated forthe pooled 2000–05 surveys. COMPLEX has a significant positive effect on discretion andthree types of performance pay—group performance pay, profit sharing, and stock owner-ship—and an insignificant effect on piece rates. The number of subordinates also has apositive effect on discretion and all performance pay measures except PRATE, whereasestablishment size has a negative effect on discretion and a positive effect on performance
20 Suppose there are n occupations, and suppose �1,...,�n are the occupation coefficients that we want to estimate.Let b1,...,bn be the estimated coefficients and s1,...,sn the standard errors. Let �1,...,�n be the employment sharesby occupation �i � 1). Then the adjusted standard deviation is (�) � This standardn n 2 2ˆ(� S �� � (b � s ).i�1 i�1 i i i
deviation controls for least squares sampling errors in the estimated coefficients.
602O
rtega
The
Accounting
Review
March
2009A
merican
Accounting
Association
TABLE 5Correlations among Measures of Discretion, Performance Pay, and Job Characteristics
Pooled Data (2000–05)
DIMETH DESCHED PRATE GPAY PSHARING STOCK COMPLEX REPET MONOT
DESCHED 0.349***PRATE �0.037*** �0.008GPAY 0.042*** 0.065*** 0.095***PSHARING 0.057*** 0.102*** 0.103*** 0.289***STOCK 0.031*** 0.057*** 0.042*** 0.155*** 0.200***COMPLEX 0.196*** 0.098*** 0.002 0.062*** 0.073*** 0.042***REPET �0.110*** �0.102*** 0.052*** �0.006 �0.014*** 0.0002 �0.022***MONOT �0.158*** �0.116*** 0.070*** �0.003 �0.017*** �0.004 �0.057*** 0.243***SUBORD 0.150*** 0.170*** �0.009* 0.087*** 0.104*** 0.079*** 0.166*** �0.058*** �0.089***
*, **, *** Significant at the 10 percent, 5 percent, and 1 percent levels, respectively.
Employee Discretion and Performance Pay 603
The Accounting Review March 2009American Accounting Association
TABLE 6Regression Results with Pooled Data (2000–05)
DIMETH DISCHED PRATE GPAY PSHARING STOCK
Complex 0.227*** 0.061*** 0.001 0.011*** 0.018*** 0.003***(0.008) (0.007) (0.003) (0.002) (0.003) (0.001)
Subordinates (1–4) 0.209*** 0.187*** 0.007 0.012*** 0.023*** 0.011***(0.015) (0.013) (0.006) (0.003) (0.005) (0.002)
Subordinates (5–9) 0.181*** 0.216*** �0.005 0.030*** 0.055*** 0.007**(0.022) (0.019) (0.008) (0.005) (0.007) (0.003)
Subordinates (10�) 0.260*** 0.257*** 0.006 0.037*** 0.047*** 0.018***(0.019) (0.016) (0.007) (0.004) (0.006) (0.003)
Establishment size �0.258*** �0.148*** �0.031*** 0.002 0.001 0.003(2–4) (0.026) (0.022) (0.010) (0.006) (0.008) (0.004)
Establishment size �0.301*** �0.248*** �0.021** 0.006 �0.002 0.002(5–9) (0.026) (0.022) (0.010) (0.006) (0.008) (0.004)
Establishment size �0.327*** �0.298*** �0.009 0.010* 0.001 0.003(10–49) (0.025) (0.021) (0.010) (0.006) (0.008) (0.004)
Establishment size �0.377*** �0.341*** �0.001 0.013** 0.011 0.006(50–99) (0.027) (0.022) (0.010) (0.006) (0.008) (0.004)
Establishment size �0.428*** �0.296*** 0.014 0.019*** 0.029*** 0.007*(100–249) (0.027) (0.023) (0.010) (0.006) (0.008) (0.004)
Establishment size �0.384*** �0.253*** 0.007 0.023*** 0.039*** 0.012***(250–499) (0.029) (0.025) (0.011) (0.007) (0.009) (0.004)
Establishment size �0.423*** �0.252*** 0.011 0.036*** 0.061*** 0.020***(500�) (0.027) (0.023) (0.010) (0.006) (0.009) (0.004)
Firm tenure 0.0004 0.001*** �0.0001 0.0001 0.0003** 0.0002**(0.0005) (0.0004) (0.0002) (0.0001) (0.0002) (0.0001)
Age 0.015*** 0.009*** 0.001 0.001** 0.004*** 0.0001(0.002) (0.002) (0.001) (0.0005) (0.001) (0.0003)
Age squared (�10�4) �1.691*** �0.819*** �0.211* �0.212*** �0.558*** �0.021(0.292) (0.247) (0.112) (0.067) (0.092) (0.043)
Female �0.048*** �0.105*** �0.012*** �0.011*** �0.027*** �0.006***(0.009) (0.007) (0.003) (0.002) (0.003) (0.001)
Year 2005 �0.021*** �0.091*** 0.027*** 0.028*** 0.040*** 0.012***(0.008) (0.007) (0.003) (0.002) (0.002) (0.001)
Number of observations 41,425 41,425 41,425 41,425 41,425 41,425R2 0.158 0.179 0.104 0.052 0.095 0.031
*, **, *** Significant at the 10 percent, 5 percent, and 1 percent levels, respectively.The six equations have been estimated as seemingly unrelated regression equations using ordinary least squares.All regressions include a constant term, 26 country indicators, 14 industry indicators, and 9 occupationindicators. Standard errors are in parentheses.
pay (except on PRATE). Conducting three separate sets of regressions for 1995–96, 2000–01, and 2005 leads to similar results.21
I also estimate the same model using all three measures of job complexity: COMPLEX,MONOT, and REPET. Results from this expanded regression (available upon request) show
21 For the 1995–96 sample, I can only use PRATE as a measure of performance pay. I find that COMPLEX has apositive effect on discretion and no significant effect on PRATE.
604 Ortega
The Accounting Review March 2009American Accounting Association
TABLE 7Regression Results with Pooled Data (2000–05)
Establishments with at Least Ten Employees
DIMETH DISCHED PRATE GPAY PSHARING STOCK
Complex 0.239*** 0.065*** �0.001 0.013*** 0.018*** 0.005***(0.010) (0.008) (0.004) (0.002) (0.003) (0.002)
Subordinates (1–4) 0.205*** 0.190*** 0.001 0.009* 0.022*** 0.008***(0.019) (0.016) (0.007) (0.005) (0.006) (0.003)
Subordinates (5–9) 0.151*** 0.191*** �0.005 0.028*** 0.054*** 0.006(0.025) (0.021) (0.010) (0.006) (0.008) (0.004)
Subordinates (10�) 0.249*** 0.245*** 0.010 0.036*** 0.047*** 0.016***(0.019) (0.016) (0.007) (0.005) (0.006) (0.003)
Establishment size �0.050*** �0.042*** 0.008 0.003 0.009** 0.003(50–99) (0.013) (0.011) (0.005) (0.003) (0.004) (0.002)
Establishment size �0.100*** 0.001 0.023*** 0.008** 0.026*** 0.003(100–249) (0.013) (0.011) (0.005) (0.003) (0.004) (0.002)
Establishment size �0.058*** 0.044*** 0.016** 0.011*** 0.036*** 0.007***(250–499) (0.017) (0.015) (0.007) (0.004) (0.006) (0.003)
Establishment size �0.097*** 0.042*** 0.021*** 0.025*** 0.058*** 0.015***(500�) (0.014) (0.012) (0.006) (0.004) (0.005) (0.002)
Firm tenure 0.0004 �0.001** �0.0001 0.0002 0.0003 0.0003***(0.001) (0.0005) (0.0002) (0.0001) (0.0002) (0.0001)
Age 0.012*** 0.007*** 0.0002 0.001** 0.004*** 0.0004(0.003) (0.002) (0.001) (0.001) (0.001) (0.0005)
Age squared (�10�4) �1.273*** �0.654** �0.122* �0.263*** �0.574*** �0.064(0.351) (0.298) (0.139) (0.088) (0.118) (0.057)
Female �0.059*** �0.110*** �0.006 �0.010*** �0.026*** �0.006***(0.010) (0.009) (0.004) (0.002) (0.003) (0.002)
Year 2005 �0.021** �0.089*** 0.028*** 0.033*** 0.050*** 0.014***(0.009) (0.008) (0.004) (0.002) (0.003) (0.001)
Number of observations 29,148 29,148 29,148 29,148 29,148 29,148R2 0.181 0.209 0.116 0.057 0.101 0.037
*, **, *** Significant at the 10 percent, 5 percent, and 1 percent levels, respectively.The six equations have been estimated as seemingly unrelated regression equations using ordinary least squares.All regressions include a constant term, 26 country indicators, 14 industry indicators, and 9 occupationindicators. Standard errors are in parentheses.
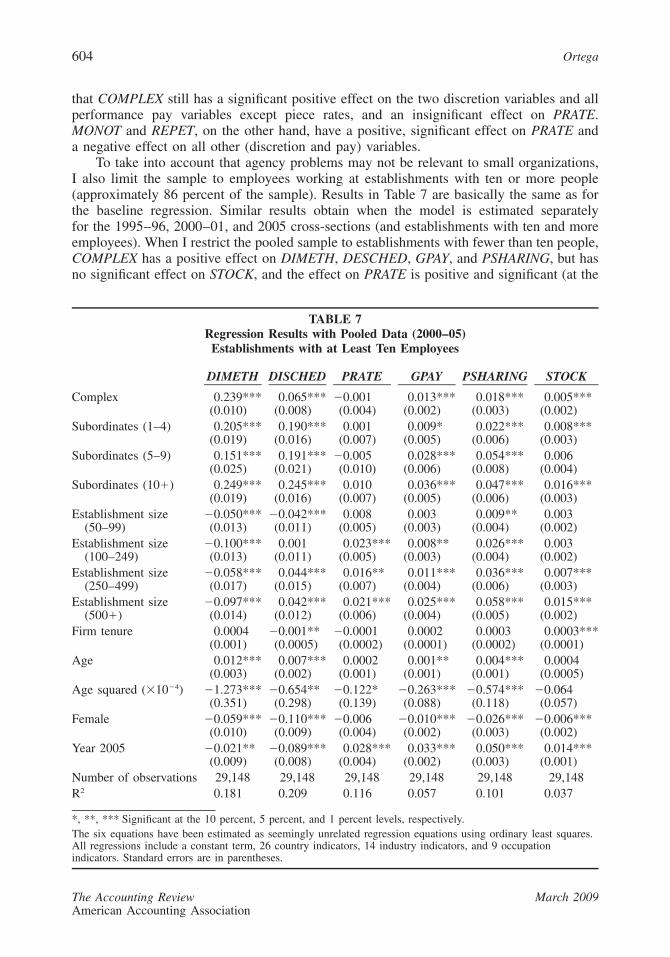
that COMPLEX still has a significant positive effect on the two discretion variables and allperformance pay variables except piece rates, and an insignificant effect on PRATE.MONOT and REPET, on the other hand, have a positive, significant effect on PRATE anda negative effect on all other (discretion and pay) variables.
To take into account that agency problems may not be relevant to small organizations,I also limit the sample to employees working at establishments with ten or more people(approximately 86 percent of the sample). Results in Table 7 are basically the same as forthe baseline regression. Similar results obtain when the model is estimated separatelyfor the 1995–96, 2000–01, and 2005 cross-sections (and establishments with ten and moreemployees). When I restrict the pooled sample to establishments with fewer than ten people,COMPLEX has a positive effect on DIMETH, DESCHED, GPAY, and PSHARING, but hasno significant effect on STOCK, and the effect on PRATE is positive and significant (at the
Employee Discretion and Performance Pay 605
The Accounting Review March 2009American Accounting Association
10 percent level). In samples of smaller establishments (fewer than five people and estab-lishments where the interviewee works alone), the effect of DIMETH remains positive andsignificant, but the coefficients for DESCHED and the performance pay variables becomeinsignificant.
Given that some control variables are only available for some survey years, I alsoestimate the baseline model with different sets of controls (not tabulated; details availableupon request). For the 2000–01 data, I use firm and job tenure and an interaction term(firm tenure � job tenure) as controls. Results are similar to Table 6: COMPLEX has apositive effect on DIMETH, DESCHED, and all pay variables except PRATE. The effecton PRATE is positive but insignificant. Results are also similar when the sample is restrictedto establishments with ten or more employees. For the 2005 sample, job tenure is notavailable but this sample does include information about the level of completed educationand about the actual number of subordinates (NSUBORD instead of SUBORD). I use sixeducation-level indicators, NSUBORD, and NSUBORD squared as additional controls, andfind similar results for COMPLEX: a positive, significant effect on all dependent variablesexcept on PRATE, where the effect is insignificant. Educational level has a positive effecton the two discretion variables and an insignificant effect on PRATE. As far as the otherperformance pay variables are concerned, I find that only those employees at the top edu-cational level (postgraduate) report significantly more performance pay. The coefficients ofthe other education indicators are insignificant. Finally, the number of subordinates has apositive effect on all dependent variables except PRATE, where the effect is insignificant.The effect diminishes as the number of subordinates increases.
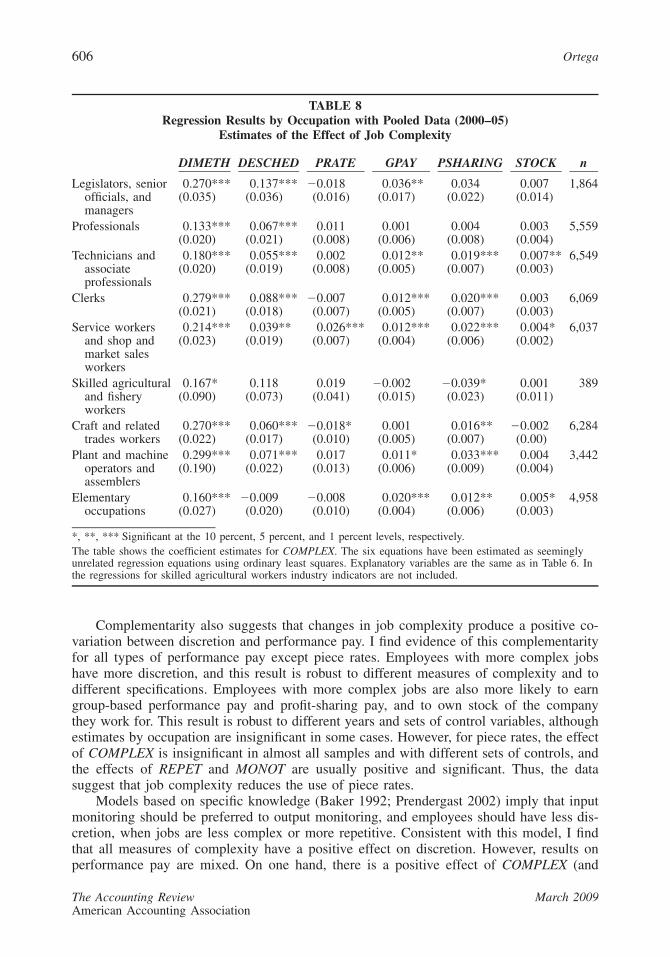
Finally, I estimate the baseline model by occupation. Table 8 shows the estimates ofthe COMPLEX coefficient. Some results are very similar to the full sample results. Inparticular, effects on discretion and PSHARING are positive and significant for almost everyoccupation, and the effect on PRATE is insignificant almost everywhere. Results for GPAYand STOCK are mixed, but the coefficients on COMPLEX are always positive or insignif-icant. COMPLEX has a positive effect on GPAY for six (out of nine) occupations, and apositive effect on STOCK for three occupations.
VII. DISCUSSION AND CONCLUSIONSThe notion of complementarity presented in Section II suggests a positive correlation
between employee discretion and performance pay. The unconditional correlations in Table5 are consistent with this prediction. Further, positive correlations among the four types ofperformance pay are consistent with evidence that firms use several performance measuresat a time to improve precision (Gibbs et al. 2004).22 A more puzzling result is that discretionvaries much more than performance pay (see Table 4), be it across occupations, industries,or countries, indicating that relatively similar pay methods are combined with quite differentlevels of discretion.23 This observation may be related to evidence that international differ-ences in working conditions are larger than differences in earnings (Tangian 2007).
22 Note that incentive theory does not clearly predict a positive or negative correlation among different types ofperformance pay. The informativeness principle (Holmstrom 1979) implies that the optimal contract may bebased on one or several measures of performance: more measures will be added to the contract as long as theyprovide information about effort that is not conveyed by the other measures.
23 This is consistent with at least two interpretations. First, technological and cultural factors may be more importantfor job design (in particular, discretion) than for the design of compensation schemes. Technological factorscould explain inter-industry and inter-occupation differences, while cultural factors could explain internationaldifferences. Second, it is possible that small variations in performance pay are sufficient to implement relativelylarge increases in discretion.
606 Ortega
The Accounting Review March 2009American Accounting Association
TABLE 8Regression Results by Occupation with Pooled Data (2000–05)
Estimates of the Effect of Job Complexity
DIMETH DESCHED PRATE GPAY PSHARING STOCK n
Legislators, seniorofficials, andmanagers
0.270***(0.035)
0.137***(0.036)
�0.018(0.016)
0.036**(0.017)
0.034(0.022)
0.007(0.014)
1,864
Professionals 0.133*** 0.067*** 0.011 0.001 0.004 0.003 5,559(0.020) (0.021) (0.008) (0.006) (0.008) (0.004)
Technicians andassociateprofessionals
0.180***(0.020)
0.055***(0.019)
0.002(0.008)
0.012**(0.005)
0.019***(0.007)
0.007**(0.003)
6,549
Clerks 0.279*** 0.088*** �0.007 0.012*** 0.020*** 0.003 6,069(0.021) (0.018) (0.007) (0.005) (0.007) (0.003)
Service workersand shop andmarket salesworkers
0.214***(0.023)
0.039**(0.019)
0.026***(0.007)
0.012***(0.004)
0.022***(0.006)
0.004*(0.002)
6,037
Skilled agriculturaland fisheryworkers
0.167*(0.090)
0.118(0.073)
0.019(0.041)
�0.002(0.015)
�0.039*(0.023)
0.001(0.011)
389
Craft and relatedtrades workers
0.270***(0.022)
0.060***(0.017)
�0.018*(0.010)
0.001(0.005)
0.016**(0.007)
�0.002(0.00)
6,284
Plant and machineoperators andassemblers
0.299***(0.190)
0.071***(0.022)
0.017(0.013)
0.011*(0.006)
0.033***(0.009)
0.004(0.004)
3,442
Elementaryoccupations
0.160***(0.027)
�0.009(0.020)
�0.008(0.010)
0.020***(0.004)
0.012**(0.006)
0.005*(0.003)
4,958
*, **, *** Significant at the 10 percent, 5 percent, and 1 percent levels, respectively.The table shows the coefficient estimates for COMPLEX. The six equations have been estimated as seeminglyunrelated regression equations using ordinary least squares. Explanatory variables are the same as in Table 6. Inthe regressions for skilled agricultural workers industry indicators are not included.
Complementarity also suggests that changes in job complexity produce a positive co-variation between discretion and performance pay. I find evidence of this complementarityfor all types of performance pay except piece rates. Employees with more complex jobshave more discretion, and this result is robust to different measures of complexity and todifferent specifications. Employees with more complex jobs are also more likely to earngroup-based performance pay and profit-sharing pay, and to own stock of the companythey work for. This result is robust to different years and sets of control variables, althoughestimates by occupation are insignificant in some cases. However, for piece rates, the effectof COMPLEX is insignificant in almost all samples and with different sets of controls, andthe effects of REPET and MONOT are usually positive and significant. Thus, the datasuggest that job complexity reduces the use of piece rates.
Models based on specific knowledge (Baker 1992; Prendergast 2002) imply that inputmonitoring should be preferred to output monitoring, and employees should have less dis-cretion, when jobs are less complex or more repetitive. Consistent with this model, I findthat all measures of complexity have a positive effect on discretion. However, results onperformance pay are mixed. On one hand, there is a positive effect of COMPLEX (and
Employee Discretion and Performance Pay 607
The Accounting Review March 2009American Accounting Association
negative effects of REPET and MONOT) on group performance pay, profit sharing,and stock ownership, which is consistent with these models. On the other hand, however,REPET and MONOT have positive effects on piece rates, which is inconsistent with thespecific knowledge argument. One possible interpretation is that employees’ specific knowl-edge refers to the value of their contribution to team output, as in Raith (2008). If complexjobs are characterized by such specific knowledge, then group incentives would elicit theright level of input, but individual incentives would be inefficient.
Conversely, models that emphasize measurement costs, such as Lazear (1986) andHolmstrom and Milgrom (1991), suggest a negative effect of complexity on discretionand performance pay. In Lazear (1986), piece rates have more stringent measurement re-quirements than salaries and, therefore, salaries are preferred when jobs are more complex.Although there is no significant effect of COMPLEX on piece rates, REPET and MONOThave positive effects on piece rates, which is consistent with this view. Moreover, piecerates are positively correlated with the use of explicit production targets and are much morefrequent for blue-collar and agricultural workers than for clerical and other service workers.All this suggests that piece rates are preferred when output measurement is less costly.However, as MONOT and REPET increase (or COMPLEX diminishes) employees have lessdiscretion, which is inconsistent with the notion of complementarity between discretion andperformance pay.
Holmstrom and Milgrom (1991) show that incentive contracts can produce distortionsbecause employees tend to devote more effort to the tasks that have more impact on theperformance measure. This means that the performance measures have to be consistent withjob content. For example, piece rates are appropriate if the firm wants employees to focuson output and inappropriate if employees are expected to perform a variety of tasks thathave different marginal effects on output. The negative effect of task variety (positive effectof REPET and MONOT) on piece rates is in accordance with this view. Moreover, whenjobs are complex and piece rates are inappropriate, the multi-task framework is consistentwith firms choosing three different options: a salary, an incentive scheme based on a broadmeasure of performance, or a combination of several incentive schemes. Empirical evidencesuggests the third option: as job complexity increases, group performance pay, profit shar-ing, and stock ownership become more frequent.
The positive effect of job complexity on discretion and some types of performance payis related with evidence that branch managers have more discretion when banks are moreinnovative or the environment is more volatile (Nagar 2002). It is possible that an increasein the bank’s operational uncertainty makes a manager’s job more complex, in which casethe results of this study are consistent with Nagar (2002). The main difference is that Idistinguish between four types of performance pay and find that piece rates behave in adifferent way. Although the finding that job complexity affects different pay methods dif-ferently is new to the literature, it is consistent with MacLeod and Parent (1999), who findthat discretion reduces the probability that the firm will use piece rates or hourly wagesversus other pay methods.
All in all, the findings give more support to the specific knowledge view than to themeasurement cost perspective. The specific knowledge view predicts a positive effect ofcomplexity on discretion and performance pay, and regressions show a positive effect onall measures of discretion and three measures of performance pay (group performance pay,profit sharing, and stock ownership). Thus, results for discretion and group and firm-wideincentives suggest that, when jobs are more complex, firms prefer to give discretion evenif the available incentive schemes are based on imperfect measures of performance. In otherwords, the benefits from a better use of (specific) information are larger than the costs of
608 Ortega
The Accounting Review March 2009American Accounting Association
imperfect measurement (e.g., lack of congruency). However, two important qualificationsmust be made.
First, unlike other incentive schemes, piece rates are mostly driven by performancemeasurement considerations: increases in job complexity are associated with reductions inthe use of piece rates, exactly as predicted by the measurement cost approach. This suggeststhat, when firms introduce piece rates, specific knowledge is not a major concern. Moreover,the negative covariation between discretion and piece rates speaks against complementarity,and suggests that (unlike other forms of performance pay) piece rates are not introducedas a way to decentralize decision making.
Second, the negative effect of complexity on piece rates and positive effect on the otherincentive schemes may have two possible readings. From a specific-knowledge perspective,one can argue that, as complexity increases, firms change the type of performance pay tomake employees accountable for their presumably wider decision rights. However, from ameasurement-cost perspective, one can also argue that performance pay changes to moreaccurately assess performance and minimize the costs of bad measurement. While mosttheoretical analyses have focused on the choice of performance pay versus straight salaries,this study suggests that the choice among different incentive schemes deserves moreattention.
This study is subject to several limitations. First, the data are cross-sectional, and em-ployee fixed effects cannot be estimated. If unobserved ability is correlated with complexity,then the coefficients on the job complexity variables will be biased. Second, I cannot controlfor firm characteristics other than industry and establishment size. In particular, I cannotcontrol for whether the firms are family firms, entrepreneurial firms, partnerships, start-ups,private, or publicly traded. The data also do not provide me the ability to control for therisk/volatility of the firm’s activity. Ideally, it would be important to analyze whether the ef-fect of job complexity remains after controlling for environmental risk, but the EWCS doesnot include firm identifications and it is not possible to match employee responses withother firm-level data. Third, the measures for discretion, performance pay, and job com-plexity are all self-reported. While I can provide some evidence of internal validity, I cannotestablish external validity. To do so, I would need to match employee responses with datafrom other sources, but the EWCS does not allow me to do so.
Despite these caveats, I think this study makes an interesting contribution. It proposesa different way to analyze contract variation, focusing on job complexity instead of envi-ronmental risk. It shows that the two main theoretical perspectives on discretion and per-formance pay generate different predictions, and tests them using a large data set of indi-vidual employees. The empirical analysis suggests that specific knowledge is important tounderstand the use of group and firm-wide incentives, but also suggests that piece rates areprimarily driven by measurement costs.
APPENDIXMEASURES OF EMPLOYEE DISCRETION
I conduct exploratory and confirmatory factor analyses of the six discretion variables(ORDER, METHODS, SPEED, BREAKS, HOURS, and DAYSOFF). For the exploratoryanalysis I use a principal-components factoring method with oblique rotation, as in Ittnerand Larcker (1995) and Nagar (2002). I standardize the six variables to have 0 mean anda standard deviation equal to 1 and I conduct a separate analysis for each survey. Only twofactors have eigenvalues greater than 1. METHODS, ORDER, and SPEED load more heav-ily on the first factor, and BREAKS, HOURS, and DAYSOFF on the second one. Rotated
Employee Discretion and Performance Pay 609
The Accounting Review March 2009American Accounting Association
factors account for a large percentage of total variance: 65.45 percent (1995–96), 68.26percent (2000–01), and 73.79 percent (2005), and none of the questions loads greater than0.45 on both factors. For METHODS, ORDER, and SPEED, Cronbach’s alphas are 0.78(1995–96), 0.77 (2000–01), and 0.76 (2005), respectively; for BREAKS, HOURS, andDAYSOFF, Cronbach’s alphas are 0.41 (1995–96), 0.54 (2000–01), and 0.66 (2005),respectively.
For the confirmatory analysis I try two alternative models: one where the six variablesmeasure the same latent construct (employee discretion), and an alternative one whereMETHODS, ORDER, and SPEED measure one construct (discretion on work methods) andBREAKS, HOURS, and DAYSOFF measure another one (discretion on work scheduling),in which case I allow the constructs to be correlated. I estimate the two models using anasymptotically distribution-free estimation procedure (Browne 1982). Both models havean excellent fit, but the two-factor model is clearly superior in terms of adjusted goodnessof fit (AGFI) and root mean-squared residuals (RMR).24
Based on these analyses I define the index for discretion over work methods asDIMETH � (METHODS � ORDER � SPEED) /3, and the index for discretion over workschedules as DISCHED � (BREAKS � HOURS � DAYSOFF) /3, where the six base var-iables are standardized (0 mean, variance equal to 1).
REFERENCESAbernethy, M., J. Bouwens, and L. van Lent. 2004. Determinants of control system design in divi-
sionalized firms. The Accounting Review 79 (3): 545–570.Aggarwal, R., and A. Samwick. 1999. The other side of the trade-off: The impact of risk on executive
compensation. The Journal of Political Economy 107 (1): 65–105.Aghion, P., and J. Tirole. 1997. Formal and real authority in organizations. The Journal of Political
Economy 105 (1): 1–29.Appelbaum, E., T. Bailey, P. Berg, and A. Kalleberg. 2000. Manufacturing Advantage. Why High-
Performance Work Systems Pay Off. Ithaca, NY: ILR Press.Baiman, S., and M. Rajan. 1995. Centralization, delegation, and shared responsibility in the assign-
ment of capital investment decision rights. Journal of Accounting Research 33 (Supplement):135–164.
Baker, G. 1992. Incentive contracts and performance measurement. The Journal of Political Economy100 (3): 598–614.
———. 2002. Distortion and risk in optimal incentive contracts. The Journal of Human Resources37 (4): 728–751.
Baldenius, T. 2003. Delegated investment decisions and private benefits of control. The AccountingReview 78 (4): 909–930.
Bandiera, O., I. Barankay, and I. Rasul. 2005. Social preferences and the response to incentives:Evidence from personnel data. The Quarterly Journal of Economics 120 (3): 917–962.
Black, S., and L. Lynch. 2001. How to compete: The impact of workplace practices and informationtechnology on productivity. The Review of Economics and Statistics 83 (3): 434–445.
———, and ———. 2004. What’s driving the new economy? The benefits of workplace innovation.The Economic Journal 114 (493): F97–F116.
24 For the 1995–96 data, AGFI is 0.988 in the one-factor model and 0.997 in the two-factor model, and RMRsare 0.011 and 0.004, respectively. For the 2000–01 data, the AGFI is equal to 1 for both models, but thestandardized RMR is 0.017 in the one-factor model and 0.006 in the two-factor model. For the 2005 data, AGFIis 0.959 for the one-factor model and 0.993 for the two-factor model, and RMRs are 0.103 and 0.025,respectively.
610 Ortega
The Accounting Review March 2009American Accounting Association
Browne, M. 1982. Covariance structures. In Topics in Applied Multivariate Analysis, edited by D.Hawkins, 72–141. Cambridge, U.K.: Cambridge University Press.
Cappelli, P., and D. Neumark. 2001. Do ‘‘high-performance’’ work practices improve establishment-level outcomes? Industrial & Labor Relations Review 54 (4): 737–775.
Conyon, M., and R. Freeman. 2004. Shared modes of compensation and firm performance. In Seekinga Premiere League Economy, edited by R. Blundell, D. Card, and R. Freeman, 109–146. Chi-cago, IL: University of Chicago Press.
Cooke, W. 1994. Employee participation programs, group-based incentives, and company perform-ance: A union-nonunion comparison. Industrial & Labor Relations Review 47 (4): 594–609.
Daniels, K., O. Tregaskis, and J. Seaton. 2007. Job control and occupational health: The moderatingrole of national R&D activity. Journal of Organizational Behavior 28 (1): 1–19.
Delery, J., and H. Doty. 1996. Modes of theorizing in strategic human resource management: Testsof universalistic, contingency, and configurational performance predictions. Academy of Man-agement Journal 39 (4): 802–835.
Fakhfakh, F., and V. Perotin. 2002. France: Weitzman under state paternalism? In Paying for Per-formance: An International Comparison, edited by M. Brown, and J. Heywood, 90–114.Amonk, NY: M. E. Sharpe.
Feltham, G., and J. Xie. 1994. Performance measure congruity and diversity in multi-task principal /agent relations. The Accounting Review 69 (3): 429–453.
Foss, N., and K. Laursen. 2005. Performance pay, delegation and multitasking under uncertainty andinnovativeness: An empirical investigation. Journal of Economic Behavior & Organization 58(2): 246–276.
Garen, J. 1994. Executive compensation and principal-agent theory. The Journal of Political Economy102 (6): 1175–1199.
Gibbs, M., K. Merchant, W. van der Stede, and M. Vargus. 2004. Determinants and effects of sub-jectivity in incentives. The Accounting Review 79 (2): 409–436.
Golden, L. 2001. Flexible work schedules: Which workers get them? The American Behavioral Sci-entist 44 (7): 1157–1178.
Green, F., and S. McIntosh. 2001. The intensification of work in Europe. Labour Economics 8 (2):291–308.
Hackman, R., and G. Oldham. 1975. Development of the Job Diagnostic Survey. The Journal ofApplied Psychology 60 (2): 159–170.
Haisken-DeNew, J., and C. Schmidt. 1997. Interindustry and interregion differentials: Mechanics andinterpretation. The Review of Economics and Statistics 79 (3): 516–521.
Heywood, J., and P. O’Halloran. 2005. Racial earnings differentials and performance pay. The Journalof Human Resources 40 (2): 435–452.
Holmstrom, B. 1979. Moral hazard and observability. The Bell Journal of Economics 10 (1): 74–91.———, and P. Milgrom. 1991. Multitask principal-agent analyses: Incentive contracts, asset owner-
ship, and job design. Journal of Law Economics and Organization 7 (Special issue): 24–52.Huselid, M. 1995. The impact of human resource management practices on turnover, productivity,
and corporate financial performance. Academy of Management Journal 38 (3): 635–672.———, and B. Becker. 1996. Methodological issues in cross-sectional and panel estimates of the
human resource-firm performance link. Industrial Relations 35 (3): 400–422.Ichniowski, C. 1990. Human resource management systems and the performance of U.S. manufac-
turing businesses. Working paper, National Bureau of Economic Research.———, K. Shaw, and G. Prennushi. 1997. The effects of human resource management practices on
productivity: A study of steel finishing lines. The American Economic Review 87 (3): 291–313.Ittner, C., and D. Larcker. 1995. Total quality management and the choice of information and reward
systems. Journal of Accounting Research 33 (Supplement): 1–34.Jensen, M., and K. Murphy. 1990. Performance pay and top management incentives. The Journal of
Political Economy 98 (2): 225–264.
Employee Discretion and Performance Pay 611
The Accounting Review March 2009American Accounting Association
Jirjahn, U. 2002. The German experience with performance pay. In Paying for Performance. AnInternational Comparison, edited by M. Brown, and J. Heywood, 148–178. Amonk, NY: M. E.Sharpe.
Karasek, R. 1979. Job demands, job decision latitude, and mental strain: Implications for job redesign.Administrative Science Quarterly 24 (2): 285–308.
Kruse, D., R. Freeman, J. Blasi, R. Buchele, A. Scharf, L. Rodgers, and C. Mackin. 2004. Motivatingemployee-owners in ESOP firms: Human resource policies and company performance. In Ad-vances in the Economic Analysis of Participatory and Self-Managed Firms, Vol. 8, edited byV. Perotin and A. Robinson. Greenwich, CN: JAI Press.
Lambert, R., and D. Larcker. 1987. An analysis of the use of accounting and market measures ofperformance in executive compensation contracts. Journal of Accounting Research 25 (Supple-ment): 85–125.
Lazear, E. 1986. Salaries and piece rates. Journal of Business 59 (3): 405–431.———. 2000. Performance pay and productivity. The American Economic Review 90 (5): 1346–1361.MacDuffie, J. 1995. Human resource bundles and manufacturing performance: Organizational logic
and flexible production systems in the world auto industry. Industrial & Labor Relations Review48 (2): 197–221.
MacLeod, B., and D. Parent. 1999. Job characteristics and the form of compensation. Research inLabor Economics 18: 177–242.
Matsumura, E. M., and J. Y. Shin. 2006. An empirical analysis of an incentive plan with relativeperformance measures: Evidence from a postal service. The Accounting Review 81 (3): 533–566.
Melumad, N., and S. Reichelstein. 1987. Centralization versus delegation and the value of commu-nication. Journal of Accounting Research 25 (Supplement): 1–18.
Mirrlees, J. 1976. The optimal structure of incentives and authority within an organization. The BellJournal of Economics 7 (1): 105–131.
Moers, F. 2006. Performance measure properties and delegation. The Accounting Review 81 (4): 897–924.
Morley, J. 2007. Labour market developments in the new EU member states. Industrial RelationsJournal 38 (6): 458–479.
Murphy, K. 1999. Executive compensation. In Handbook of Labor Economics, edited by O.Ashenfelter and D. Card, 2485–2563. Amsterdam, The Netherlands: North Holland.
Nagar, V. 2002. Delegation and incentive compensation. The Accounting Review 77 (2): 379–395.Nienhuser, W., and W. Matiaske. 2006. Effects of the ‘‘principle of non-discrimination’’ on temporary
agency work: Compensation and working conditions of temporary agency workers in 15 Eur-opean countries. Industrial Relations Journal 37 (1): 64–77.
Osterman, P. 1994a. How common is workplace transformation and who adopts it? Industrial & LaborRelations Review 47 (2): 173–188.
———. 1994b. Supervision, discretion, and work organization. The American Economic Review 84(2): 380–384.
———. 1995. Work/family programs and the employment relationship. Administrative Science Quar-terly 40 (4): 681–700.
Paoli, P. 1997. Second European Survey on Working Conditions. Dublin, Ireland: The European Foun-dation for the Improvement of Living and Working Conditions.
———, and D. Merllie. 2001. Third European Survey on Working Conditions 2000. Dublin, Ireland:The European Foundation for the Improvement of Living and Working Conditions.
———, and A. Parent-Thirion. 2003. Working Conditions in the Acceding and Candidate Countries.Dublin, Ireland: The European Foundation for the Improvement of Living and WorkingConditions.
Parent, D. 1999. Methods of pay and earnings: A longitudinal analysis. Industrial & Labor RelationsReview 53 (1): 71–86.
612 Ortega
The Accounting Review March 2009American Accounting Association
Parent-Thirion, A., E. Fernandez Macıas, J. Hurley, and G. Vermeylen. 2007. Fourth European Work-ing Conditions Survey. Dublin, Ireland: The European Foundation for the Improvement of Liv-ing and Working Conditions.
Parker, S., and T. Wall. 1998. Job Design and Work Design: Organizing Work to Promote Well-Beingand Effectiveness. Thousand Oaks, CA: Sage.
———. 2003. Longitudinal effects of lean production on employee outcomes and the mediating roleof work characteristics. The Journal of Applied Psychology 88 (4): 620–634.
Pouget, J. 2005. Primes, Participation et Interessement Dans le Secteur Prive. INSEE Premiere No.1022. Paris, France: Insee.
Prendergast, C. 1995. A theory of responsibility in organizations. Journal of Labor Economics 13 (3):387–400.
———. 2002. The tenuous trade-off between risk and incentives. The Journal of Political Economy110 (5): 1071–1102.
Raith, M. 2008. Specific knowledge and performance measurement. The Rand Journal of Economics39 (4): 1059–1079.
Roberts, J. 2004. The Modern Firm. Organizational Design for Performance and Growth. Oxford,U.K.: Oxford University Press.
Shearer, B. 2004. Piece rates, fixed wages and incentives: Evidence from a field experiment. TheReview of Economic Studies 71 (2): 513–534.
Singh, J. 2000. Performance productivity and quality of frontline employees in service organizations.Journal of Marketing 64 (2): 15–34.
Stiglitz, J. 1975. Incentives, risk, and information: Notes towards a theory of hierarchy. The BellJournal of Economics 6 (2): 552–579.
Tangian, A. 2007. Analysis of the third European Survey on Working Conditions with compositeindicators. European Journal of Operational Research 181 (1): 468–499.
Zoghi, C., A. Levenson, and M. Gibbs. 2005. Why are jobs designed the way they are? Workingpaper, U.S. Bureau of Labor Statistics, University of Southern California, and University ofChicago.
Related Documents