平成 30 年 1 月 18 日提出 Empirical Research on IPO Underpricing of GEM in China 指導教員:金京 拓司 学籍番号:168E406E 何相濱

Welcome message from author
This document is posted to help you gain knowledge. Please leave a comment to let me know what you think about it! Share it to your friends and learn new things together.
Transcript

平成 30年 1月 18日提出
Empirical Research on IPO Underpricing of GEM in China
指導教員:金京 拓司
学籍番号:168E406E
何相濱
Contents
Abstract ............................................................................................................................................. 1
1. Introduction ................................................................................................................................... 1
2. Background ................................................................................................................................... 3
3. Literature Review .......................................................................................................................... 5
3.1 Overview of literature outside China .................................................................................. 5
3.1.1 Information asymmetry theory ................................................................................. 5
3.1.2 Behavioral Finance Theory ...................................................................................... 7
3.2 An overview of domestic literature ..................................................................................... 8
4. Statistical analysis of the IPO underpricing rate of the GEM in China ......................................... 8
4. 1 Data description ................................................................................................................. 8
4.2 Methodology ....................................................................................................................... 9
4.3 Statistical analysis of the IPO underpricing rate of the GEM ............................................. 9
4.4 Comparative analysis of the IPO underpricing rate of the GEM and SME markets. ........ 10
4.4.1 Overall descriptive statistical analysis. .................................................................. 10
4.4.2 Underpricing Rate Analysis of Different Intervals and Degrees ............................ 11
4.4.3 Trend analysis of underpricing rate changes by year ............................................. 12
5. Empirical Analysis and Research on the Determinants of the underpricing Rate in China’s GEM.
........................................................................................................................................................ 13
5.1. Research hypotheses and theoretical analysis .................................................................. 13
5.1.1 Heat of the market .................................................................................................. 13
5.1.2 Investment behavior ............................................................................................... 14
5.1.3 Growth of the listed companies .............................................................................. 15
5.1.4 Asymmetric information theory ............................................................................. 16
5.2 Empirical Analysis ............................................................................................................ 18
5.2.1 Model construction and variable definitions .......................................................... 18
5.2.2 Descriptive statistical analysis of the sample of the GEM and SME markets........ 19
5.2.3 Correlation analysis ................................................................................................ 21
5.2.4 Estimation results of multiple regressions.............................................................. 22
6. Conclusions and implications ..................................................................................................... 27
References ....................................................................................................................................... 29

1
Abstract
This study examines the first-day returns of initial public offerings listed on China’s
Growth Enterprise Market (GEM) from its inception up to 2015. The results show that
GEM exhibits higher underpricing. This result can be explained by the heat of the
market and investment behavior. Both company growth and the theory of asymmetric
information show little effect on IPO underpricing.
1. Introduction
In 1978, the Chinese government implemented a policy of reform and development
that attracted worldwide attention and achieved significant achievements. China’s first
stock exchange, the Shanghai Stock Exchange, was established in December 1990,
and the Shenzhen Stock Exchange was established in April 1991. China’s securities
market then began its formal development and acquired resource-allocation functions.
With the rapid development of China’s economy, China’s capital market has grown,
and its systems are continuously improving. China’s capital market provides an
investment platform for investors and a financial tool for corporate development. It
promotes the effective configuration of resources and China’s economic development.
As small and medium-sized enterprises have few financial resources, the Growth
Enterprise Market (GEM) became a part of China’s capital market in 2009.The GEM
has become a financing platform for fast-growing high-tech small and medium-size
enterprises.
Regulators of and investors in China's securities market all hope the GEM will
develop healthily and steadily. However, its immature state has led to some unusual
phenomena, such as IPO underpricing—whereby the IPO closing price is significantly
higher than the issue price on the first day. This phenomenon is common in stock
markets all over the world, but its degree differs depending on the stock market.
China’s IPO underpricing rate is high. After decades of development, capital markets
in developed countries are very mature, while the capital market in China has only
just been established. The rate of underpricing in developed countries tends to be
reasonable, at about 20%. However, the average rate of underpricing in China’s GEM
market reached 40% in September 30, 2015.The average underpricing rate of the first
28 companies listed on China’s GEM was 106.23%, and the maximum reached
209.7%. This problem will greatly impede the healthy and stable development of
China’s GEM.
China’s capital market is different from the capital markets of developed countries.
Before the introduction of the GEM market, its function was performed by China’s
SME (small and medium-sized enterprises) market. The establishment of the SME
was important for building a multilevel capital market, and served as a prelude to the
GEM. The SME market comprises the small and medium-sized enterprises that are set
up by the Shenzhen stock exchange in order to encourage independent innovation.

2
Companies in this sector are generally characterized by quick revenue growth, strong
profitability, and high technology content; the liquidity of the stocks is good and the
transactions are active. It is regarded as China’s future NASDAQ. Before the
introduction of the GEM market, the SME market was called “China’s GEM market.”
This study compares the GEM and SME markets to determine the reasons for the
high underpricing rate in the GEM. First, we survey the research on the rate of
underpricing in the GEM market in China and overseas. Then, we empirically analyze
the high underpricing rate of the GEM and identify its influencing factors. We use
data covering October 1, 2009 to September 30, 2015. However, since China’s GEM
and SME markets did not issue IPOs in 2013, there are no data for that year. Four
hypotheses are proposed on the characteristics of the GEM market concerning the
behavior of investors, the heat of the market, asymmetric information theory, and the
growth of listed companies. For these hypotheses, we select 10 explanatory variables.
Finally, we examine the IPO underpricing of the GEM using quantitative methods.
Our analysis of the data leads to five conclusions. First, the underpricing rate of
China’s GEM and SME markets is very high, although it has a downward trend, and it
has a wide fluctuate range. Second, the main reason for the high underpricing rate of
the GEM and SME markets is the heat of the market, which is a reflection of the stock
market trend and investor expectations of the capital market as a whole. When the
market trend rises, blind investment behavior increases the underpricing rate. Third,
investor behavior is another important factor in the high underpricing rate in China’s
GEM. This reflects the fact that China’s capital market includes many irrational
investors, whose speculative behavior has led to a high rate of underpricing in China’s
GEM. Fourth, company growth has little impact on the high underpricing rate in
China’s GEM market, indicating that investors in China’s capital market have begun
to pay attention to the growth and future of China’s listed companies. Fifth, the theory
of asymmetric information has little impact on the high underpricing rate in China’s
GEM market, showing that the information disclosure system of the GEM is
gradually improving.
Based on these empirical findings, we offer four suggestions. First, we suggest
strengthening investment education for capital market investors and suppressing blind
speculation by individual investors. Second, we suggest improving the IPO system in
China’s capital market and strengthening supervision over institutional investors.
Third, we suggest enhancing the information disclosure system of listed companies to
improve the fairness of the market. Fourth, due to the importance of financial
knowledge, we suggest improving financial education for individual investors.
This study makes three contributions to the IPO literature. First, previous studies on
the GEM’s high underpricing rate have not examined beyond 2013; thus, this study
expands the breadth and depth of the empirical evidence. Second, the data used in this
study cover up to September 30, 2015, six years after the GEM market had been
launched, giving our data the quality of timeliness. Third, this study performs a
comparative analysis of China’s unique SME and GEM capital markets, thus
producing findings that are relevant to China’s capital market as a whole.
However, this study also has several limitations. First, though many factors affect

3
the rate of IPO underpricing, only 10 are examined in this study. Second, because of
the limitations imposed by information constraints, the study’s analysis lacks
thoroughness. More extensive research on this topic is required.
The remainder of the paper is organized as follows. Section 2 presents background
information on China’s GEM. Section 3 reviews the literature on IPO underpricing.
Section 4 performs a statistical analysis of the IPO underpricing rate of China’s GEM.
Section 5 presents an empirical analysis on the determinants of the underpricing rate
in China’s GEM. Finally, Section 6 offers a conclusion and outlines the study’s
implications.
2. Background
Since the implementation of its policy of reform and opening up, China has made
remarkable economic strides and has jumped into the ranks of the world’s economic
powers. The Chinese government has established a highly efficient and stable capital
market. Its scale is expanding, and its system is evolving. Capital markets around are
important channels for enterprise financing, and so is China’s. It has promoted the
effective allocation of resources and fostered the rapid development of China’s
economy. According to statistics from China’s Ministry of Commerce, the gross
industrial output value and tax payments of China’s small and medium-sized
enterprises account for more than one-third of the national total, and this trend is
growing. This shows that small and medium-sized enterprises occupy an important
position in China’s economic development and have great potential. However, due to
their small scale, low credit level, and poor ability to resist risks, it is difficult for
them to obtain loans from commercial banks, making it difficult to foster long-term
development. Therefore, they have faced financing difficulties. This not only hinders
their long-term growth but also hinders the rapid development of China’s economy.
Solving this problem requires establishing a multilevel financial services capital
market, broadening the financing channels for small and medium-sized enterprises,
and expanding the scope of service in the capital market. On June 25, 2004, the
Chinese government introduced the small and medium-sized board market for the
financing and trading of small and medium-sized enterprises. However, this board
market suffered from high costs and low efficiency and could not provide financing
for small and medium-sized enterprises. After careful planning and consideration, the
government therefore launched the GEM on October 1, 2009. The birth of the GEM
set a new development course for China’s capital market and became a new milestone
in the rapid development of China’s economy.
In the last six years of rapid development, new companies have been appearing
constantly, and their scale of development has been consistently expanding. By the
end of September 30, 2015, according to statistics of the Shenzhen stock exchange,
489 enterprises were listed, the total issued share capital was 1,669 billion, the total
market value was 36,456 billion, the circulation market value was 27,000 billion, and
the average price earnings ratio was 50.
However, China’s GEM has several unique characteristics. First, it has a unique

4
market system. Most of the companies listed on the GEM market are high-tech
businesses. These companies need more rapid financing than other types of
companies. Second, it features low-threshold entry. The companies listed on the GEM
have higher growth, but they tend to have shorter lifespans, a smaller scale, and
mediocre performance; however, there is much room for growth. The GEM can be
described as having a low threshold, high risk, strict supervision and control, but is
also a cradle of incubating science and technology firms and growth enterprises.
Since the establishment of the capital market, underperformance and underpricing
have been hotly debated. Although China’s GEM provides a very fast and effective
platform for small and medium-sized enterprise financing and plays an important role
in resource allocation, the high rate of underpricing remains a problem. This has
seriously hindered the development of the financing of small and medium-sized
enterprises and confused investors in the Chinese capital market.
An initial public offering (IPO) is the first time an enterprise or company (a
company with limited liability) has sold its shares to the public (an initial public
offering is thus the first public offering of shares to the general public). In IPO
underpricing, the IPO closing price is significantly higher than the issue price on the
first day. This phenomenon is common in stock markets all over the world, but the
degree of the phenomenon differs depending on the stock market. Statistics show that
China’s IPO underpricing rate is very high. The rate of underpricing in international
GEMs tends to be reasonable, at about 20%. However, the average rate of
underpricing in China’s GEM was 40% by September 30, 2015. The average
underpricing rate of the first 28 companies listed on China’s GEM was 106.23%, and
the maximum was 209.7%. This will greatly impede the healthy and stable
development of China’s GEM.
Such a high rate of underpricing has an adverse impact on the long-term
development of China’s GEM market. First, the risk of stock issuance in China’s
capital market is very low. In order to be listed quickly, companies have
“over-wrapped” themselves, while ignoring their profitability and corporate
governance structure, ultimately leading to investors being ignored. Second, due to
the high underpricing of new shares, newly listed companies can obtain huge profits
without considering the future or growth. Newly listed companies put most of the
funds into the issue market, making the issue market overcapitalized and indirectly
leading to a lack of funds in the circulation market. Third, if the shares of the new
company are not going to continue their rapid growth after they are issued with high
underpricing, investors will gradually lose their confidence in the companies holding
the shares. This may lead to a long-term downturn, even a market plunge, which
could lead to huge losses for investors.
Therefore, in-depth research on the high underpricing rate in China’s GEM market
is necessary. This will not only protect the interests of investors in China’s capital
market but will also improve the market, which will lead to steady and healthy
progress for China’s economy.

5
3. Literature Review
3.1 Overview of literature outside China
The first scholars to study the IPO underpricing rate are Hatfield and Reilly (1969)
and Stoll and Curly (1970). Since then, economists all over the world have examined
this abnormal stock phenomenon. After years of intensive study, economists have
found that IPO underpricing is a common phenomenon, but the degree of
underpricing varies across countries and regions. The degree of underpricing in
developed countries is significantly lower than that in emerging countries. Economists
have been trying to determine the causes of this phenomenon. Two main theories have
been influential on research on IPO underpricing around the world: information
asymmetry theory and behavioral finance theory.
3.1.1 Information asymmetry theory
In contract theory and economics, information asymmetry deals with transactions
where one party has more or better information than the other. This asymmetry creates
an imbalance of power in transactions, which can sometimes cause the transactions to
fail and lead to a kind of market failure in the worst case. Examples of this problem
include adverse selection, moral hazard, and information monopoly. The following
four IPO underpricing theories have been proposed.
1. Information asymmetry between issuers and underwriters
Baron (1982) pointed out that issuers and underwriters are in unequal positions in
the issuance and pricing of new shares, with the underwriters having more
information about the capital markets. Issuing companies generally take into account
the advantages of underwriters in this regard and take advantage of them in order to
make up for their own information deficit, entrusting underwriters with the issuance
of their own new shares. Issuing companies and underwriters try to “game” the
pricing process, which leads to an underpricing of the stock issue. To allow a
successful issuance, the underwriters will suggest issuing at a lower price when they
negotiate with the issuer, so that the stock that they underwrite can be successfully
issued. In an underwriter monopoly, underwriters not need spend much energy in
pricing research; they need only sell shares through underpricing. Doing otherwise
would not only cause huge losses to underwriters but also seriously damage their
reputation. However, too much underpricing will also undermine the reputation of the
underwriters, weakening the next phase of the business; thus, the underwriter’s
monopoly would be only temporary. For the sake of their long-term development,
therefore, underwriters will not conduct underpricing.
2. Information asymmetry between investors
Rock (1986) proposed the “winner’s curse” theory, which posits the following.
There are informed and uninformed investors in the capital market. Informed
investors are aware of the internal situation of the issuing company and will subscribe
only to those stocks that are at less than the true value of the company’s IPO.

6
Overvalued stocks will be subscribed only by uninformed investors. The winner’s
curse occurs when demand for undervalued stocks drops. When uninformed investors
become aware of this, companies face a lack of demand when new shares are issued,
leaving uninformed investors unable to fully absorb all the shares issued by the
company. To make up for the loss to uninformed investors due to the lack of
information and induce them to participate in the company’s stock subscription,
underwriters generally adopt the strategy of underpricing. Well-known scholars such
as Grinblatt (1989) argue that the degree of IPO underpricing can reflect the
company’s project quality because there is a positive correlation between the two: the
lower the degree of underpricing, the lower the uncertainty of the project. Another
reason for the underpricing, Muscarella claims (1989), is that it is difficult to
determine the real value of the stock of the issuing company. To raise funds as quickly
as possible, these companies are listed before accounting firms, tax offices, and law
firms have determined their true value. There is a negative correlation between the
two, whereby the shorter the establishment of the company, the greater the uncertainty,
and the higher the underpricing rate.
3. The signaling theory: Information asymmetry between issuers and investors
The signaling theory (Leland and Pyle, 1977) posits that, to avoid the limitations of
low-quality issuers, higher-quality issuers will set IPO prices at less than what
investors are willing to pay. Welch (1989) and Jegadeesh et al. (1993) suggest that
high-quality issuers will leave the money on the table in the IPO and will be
compensated in the subsequent issuing activity. In general, the quality of the issuing
enterprise is positively related to the price of the stock issue, and the higher the
quality of the enterprise, the higher the price of the stock issue. Unlike the issuing
enterprise, the investor lacks accurate and reliable information, making it difficult to
judge the value of the company. Therefore, investors are usually willing to pay the
average market price only when the quality of the issuing enterprise cannot be
accurately judged. As a result, the stocks of high-quality companies are artificially
underestimated, while the stocks of low-quality ones receive a higher valuation.
However, high-quality enterprises issue shares at a lower price in order to signal
better quality to investors and clarify their boundaries with inferior enterprises, thus
leading to higher underpricing benefits. Thus, IPO underpricing actually signals high
quality to investors.
4. Information asymmetry between underwriters and investors
The distribution system in countries with sound capital market systems tends to be
different from that in developing countries. For example, the founder of the global
GEM, the Nasdaq stock market, issues new shares via an institutional investor inquiry
system. Institutional investors, given their advantages, know more about the
background of the issuing company and the situation of the capital market than the
underwriters do. The stock prices they offer can often reflect the real value of the
company. This is an important reference by which underwriters set the price of the
stock. To allow institutional investors to report the most substantial, real, and reliable
prices, underwriters have to offer them special treatment. For example, reducing the
issue price gives institutional investors more opportunities to sell.

7
3.1.2 Behavioral Finance Theory
Behavioral finance is based on the alternative notion that investors, or at least a
significant minority of them, are subject to behavioral biases that make their financial
decisions less than fully rational. Evidence of these biases has typically come from the
cognitive psychology literature and has been applied in the financial context.
Behavioral finance also challenges the use of conventional utility functions based
on the idea of risk aversion. For example, Kahneman and Tversky (1979) propose
prospect theory as a descriptive theory of decision making in risky situations.
Outcomes are evaluated against a subjective reference point (e.g., the purchase price
of a stock), and investors are loss averse, exhibiting risk-seeking behavior in the face
of losses and risk-averse behavior in the face of gains. Behavioral finance theory leads
to the IPO underpricing theories described below.
1. Investor sentiment hypothesis.
Stock prices are often affected by investor sentiment. Miller (1977) studied the
impact of investor sentiment on IPO underpricing and pointed out that a main factor
leading to IPO underpricing is optimistic investors’ positive buying behavior.
Ljungqvist, Nanda, and Singh (2006) found that most of the investors in the
circulation market were irrational and that an important factor in IPO underpricing
was personal investor sentiment.
Baker and Stein (2004) used the first-day turnover ratio in the market to represent
investors’ sentiment index, which can reflect IPO speculation on the first day. The
higher turnover ratio on the first listing day indicates that the stronger the
“speculative” atmosphere in the circulation market is, the higher the IPO underpricing
rate will be.
2. Popular effect theory
This theory was proposed by Welch (1992), who used behavioral finance theory to
analyze the mind and behavior of the investor. He points out that the purchase
behavior in an investment is a “dynamic” process. The investor’s subscription
behavior will be directly affected by the behavior of other investors. The investors
think that stocks are easy to trade during the hot issue and are willing to purchase new
shares. In a cold issue period, however, no one is willing to purchase new shares.
Therefore, to avoid IPO failure, regardless of whether the underwriters or the issuing
companies can ensure subscriptions for all the new shares, they often attract the initial
subscribers by reducing the issue price, and induce related investors to subscribe to
the stock, eventually leading to IPO underpricing.
3. Psychological accounting hypothesis.
This theory was proposed by Loughran and Ritter (2002). They argue that people
tend to focus on changes in wealth relative to absolute changes in wealth levels.
They claim that two opposite wealth effects occur for issuers during stock issuance.
First, the issue price of new shares is greater than that of the issuers. Second, the issue
price of new shares lower than that of the first day’s trading price. As long as the
value-added portion of new shares issued is greater than the impairment of new shares

8
issued, issuers generally do not care whether IPO underpricing occurs. However, the
underwriter and issuer have different aims, and the underwriter expects to make a
profit from the issuance of the stock, such as via underwriting fees. Underpricing is
also conducive to the successful subscription of the new shares, which leads to more
underwriting business. However, excessive underpricing will also damage the
underwriter’s reputation, so it is necessary to control it. Therefore, as long as IPO
underpricing is controlled, the stock issuing company can increase its value via the
issuance of new shares. Distribution companies are acceptable, even with a certain
amount of underpricing.
3.2 An overview of domestic literature
To solve the financing difficulties facing small and medium-sized enterprises, the
Chinese government launched the GEM on the basis of the small and medium-sized
board market. Since then, the GEM has been the main research focus.
Zhuang (2009) examined a sample of shares listed in the small and medium-sized
enterprises board market after the reform of China’s share equity structure. Empirical
analysis found that the price earnings ratio, turnover rate, and other indicators helped
explain IPO underpricing in the board market. Zhao and Zheng (2010) studied IPO
underpricing by examining the first batch of 28 companies listed on the GEM. The
empirical results showed that no arbitrary pricing behavior occurred in the issuance of
new shares. Lee and Chen (2011) studied IPO underpricing by adding corporate
governance and issue characteristics to the research scope. The empirical analysis
showed that the higher was the proportion of independent directors in the GEM, the
greater was the IPO underpricing; moreover, the lower the P/E ratio, the higher the
IPO underpricing.
Liu (2012) examined the phenomenon of IPO underpricing by studying data on 125
companies listed on the GEM covering August 27, 2010 to September 27, 2011,
finding that the lottery winning rate, the issuing price earnings ratio, and the IPO price
were the important factors affecting IPO underpricing. This result shows that the
theory of asymmetric information and blind investment followers have strong
explanatory power. Yu, Zhang, and Li (2013) based their analysis on the intrinsic
value of the company and investor sentiment to examine GEM enterprises. They
found that the intrinsic value of and investor sentiment about the company were the
two main factors affecting IPO underpricing. This suggests that the behavioral finance
theory has strong explanatory power for IPO underpricing. Ren and Sun (2015)
examined data on 355 GEM companies covering October 2009 to July 2013 to
systematically analyze the influencing factors in GEM underpricing. They concluded
that information asymmetry and investor sentiment were the main factors affecting
IPO underpricing in China’s GEM.
4. Statistical analysis of the IPO underpricing rate of the GEM in China
4. 1 Data description

9
Our data cover 484 China GEM stocks and 469 China SME stocks from October 1,
2009 to September 30, 2015. An IPO is considered as an existing private company
being listed on the GEM and the Small and Medium-sized Enterprise Market. Data on
the issuing details of each GEM and SME are obtained from two sources. The
historical daily related stock data come from The China Stock Market and Accounting
Research (CSMAR) database, while the financial data come from the prospectuses
and annual reports of the GEM stocks and SME stocks provided by the Shenzhen
GEM and SME websites. Eviews and Excel software were used for most of the data
analysis.
4.2 Methodology
Initial returns, which measure the level of underpricing, are the percentage
difference between the closing price on the first day of public listing and the offer
price:
Initial return (Rit)=[(Pit-Pit-1)/Pit-1]×100
where
Rit = initial rate of return on stock i at period t,
Pit = closing price of stock i on the first day of trading,
Pit-1 = share price of stock i at the time of offering.
The higher the initial return, the more underpriced an offering is assumed to be.
4.3 Statistical analysis of the IPO underpricing rate of the GEM
This study first conducted a comprehensive analysis of the underpricing rate of the
GEM. Data covering October 1, 2009 to September 30, 2015 are divided into 28 listed
companies and 456 listed companies, and the following results are obtained. The
average underpricing rate of companies listed on the GEM is 36.94%, with a standard
deviation of 0.3224. Among them, the maximum value is 209.7%, and the minimum
value is -16.68%.
Table 4-1 Analysis of the rate of underpricing of the first and subsequent listed
companies of the GEM
There are 28 listed companies in the GEM market, with an average underpricing
rate of 106.230%, of which the maximum value is 209.700%, more than five times the
average underpricing rate of all listed companies. As of September 30, 2015, no
Listing date Sample Mean Std Dev Min Max Skew Kurt
First listed 28 106.230% 0.355 75.800% 209.700% 1.532 4.646
After listed 456 32.690% 0.267 -16.680% 198.890% 1.152 7.561
Total 484 36.940% 0.322 -16.680% 209.700% 1.485 7.561

10
company underpricing has exceeded this value. The minimum value of the
underpricing rates of the first listed companies is much greater than the overall market
average.
Although the initial underpricing rates of companies listed on the GEM are
surprisingly large, the underpricing rates of companies listed in succession have much
declined. The rate of underpricing of the later listed companies is less than 1/3 of the
rate of underpricing of the first 28 companies listed on the GEM. As can be seen from
the above data, the underpricing value of the first of the 28 listed companies deviates
widely from the normal value of the international capital markets. However, the
subsequent underpricing of companies listed on the GEM is significantly smaller than
that of the initial public offerings, indicating that the IPO of China’s growth enterprise
market is gradually maturing.
4.4 Comparative analysis of the IPO underpricing rate of the GEM and SME
markets.
4.4.1 Overall descriptive statistical analysis.
Table 4-2 Statistical analysis of the IPO underpricing rates of the GEM and SME
Mean Median Maximum Minimum Std Dev Skew Kurt
GEM 0.369 0.435 2.097 -0.167 0.322 1.485 7.561
SME 0.371 0.326 2.753 -0.263 0.396 1.972 9.100
As can be seen from the table, by the end of September 30, 2015, the average
underpricing rate of the 484 companies listed on the GEM is 36.9%, the maximum
value is 209.7%, the minimum value is -16.7%, the standard deviation is 0.322, the
skewness is 1.485, and the kurtosis is 7.561, reflecting the asymmetrical peak of the
positive distribution. The average underpricing rate is 36.9%, which means that, if the
investor succeeds in buying the shares at the time of the IPO, the stock will be sold
out before the close of trading with an average yield of 37%. The average
underpricing rate of the 469 companies listed on the SME board market is 0.371, the
maximum value is 275.3%, the minimum value is -26.3%, the standard deviation is
0.396, the skewness is 1.972, and the kurtosis is 9.100, reflecting the asymmetrical
peak of the positive distribution.
The rate of underpricing in developed countries tends to stay at a reasonable level
of about 20%. The data in the table show that the underpricing rate of both the
Chinese GEM and the SME board markets is significantly higher than the global
average. There is a high rate of underpricing in the GEM and the SME board markets.
There may be several reasons for this. First, the information disclosure system of a
small company is imperfect. It is difficult for investors to grasp the real value of the
company, so the risk of investment is larger than that of large companies. The
consequent risk compensation required by investors is relatively large, and issuing
companies offer this risk compensation by reducing the issue price of new shares.
Second, China’s GEM is immature. Most of the companies listed on the GEM are

11
emerging high-tech companies from small and medium-sized boards. These
companies are easily manipulated by large companies because of their small size.
Speculative factors have increased, and intense speculation eventually leads to a high
rate of underpricing. Third, these companies also belong to the high- and
new-technology sector of the “sunrise” industry, which is experiencing strong growth.
Such firms are high risk and offer high interest, so investors have high expectations
for them.
Table 4-2 also shows that the standard deviation, skewness, and kurtosis of the two
major markets are large, indicating that the asymmetry of the distribution of the two
major markets is pronounced. The deviation of the initial underpricing rates of the two
major markets from the mean value is also abnormally large. It also shows the high
risk and uncertainty of the GEM market, given that it was launched only a short time
ago, and the legal mechanism governing it is imperfect (it comes under the legal
mechanism of the main board market). On the other hand, most of the investors in
China’s capital markets lack investment knowledge and experience. Most of these
investors blindly follow trends and speculate without real investment strategies.
Therefore, the sharp underpricing rate on the first day in the GEM will not only cause
huge losses for real investors but also disturb the capital market’s order, lead to a huge
waste of resources, and hinder the healthy development of the economy.
In a word, the underpricing rate of the Chinese GEM is not only abnormally high
but extremely volatile. This reflects the high risk and uncertainty in China’s capital
market.
4.4.2 Underpricing Rate Analysis of Different Intervals and Degrees
Table 4-3 Interval comparison and analysis of the underpricing rate of the GEM and
SME board market
High underpricing rates are common in stock markets all over the world, but the
degree differs across them. While the rate of underpricing in developed countries
tends to be reasonable level of about 20%, the level in developing countries is
somewhere between 30% and 70%.
Table 4-3 indicates the following. (1) The underpricing rate of China’s GEM and
SME board market is concentrated at the 20% to 50% level, the over-20% share of the
IPO Underpricing GEM board Second board
Sample Proportion Sample Proportion
< 0 52 10.740% 64 13.620%
0–20% 102 21.070% 103 21.910%
20%–50% 236 48.760% 203 43.190%
50%–100% 76 15.710% 69 14.680%
100%–150% 13 2.690% 19 4.040%
>150% 5 1.030% 11 2.560%
Total 484 100% 469 100%

12
GEM market accounts for 68.19% of the total, and the over-20% share of the SME
board market accounts for 64.47%. (2) The over-50% underpricing rate accounts for
nearly one-fifth of the total. The proportion of the GEM market is 19.43%, and the
proportion of the SME board market is 21.28%; the number of sample stocks is 94
and 99 respectively. (3) Both markets have underpricing rates that fall below the issue
price. These include 52 stocks in the GEM market with lowered issue prices,
accounting for 10.74%. In the SEM, 64 stocks have lowered their issue price,
accounting for 13.62%. (4) Both China’s GEM and SME board markets, some stocks
show underpricing of more than 100%, or even 150% .The proportions of sample
stock are 3.72% and 6.60% respectively, and the numbers of sample stocks are 18 and
30, respectively. This means that, if the investor succeeds in buying the shares at the
time of the IPO, the stock will be sold out before the close of trading with an average
yield of 100% even 150%. The above data suggest that there is a high rate of
underpricing in both the GEM and SEM, mainly concentrated in the 20% to 50%
range.
4.4.3 Trend analysis of underpricing rate changes by year
Table 4-4 Comparative analysis of the underpricing rate of GEM and SME board
markets by year
Figure 4-1 IPO underpricing rate trend in GEM and SME by year
Comparing the underpricing rates from 2009 to 2012 and from 2014 to 2015 shows
that the two markets’ underpricing rates have a downward trend relative to 2009. A
rebound occurred in 2014 and 2015, but the rate was still much smaller than in 2009.
The data above show the following. First, the underpricing rate trends of the two
major market segments is roughly the same, and the heat and atmosphere of the
2009 2010 2011 2012 2014 2015
GEM 92.670% 37.830% 22.590% 20.750% 43.760% 44.000%
SME 66.450% 45.120% 20.640% 21.100% 44.120% 44.000%

13
market are reflected in the changes in the rate: the higher the market’s heat and the
higher investors’ investment enthusiasm, the higher the enthusiasm about the issuance
of new shares and the more speculative the market atmosphere, which eventually
increases the rate of underpricing. If the economic environment is poor (i.e., if the
market cools), investors will worry about investing in stocks that are too risky,
risk-averse investors will be deterred, and the heat of new shares in the market will be
reduced, reducing the rate of underpricing.
Second, the level of underpricing in China’s GEM remains high. Although there is
a slight decline midway, a higher rate of underpricing is still maintained in 2014 and
2015. China’s GEM market finally entered onto the historical stage of China’s capital
market in October 1, 2009 after careful planning and preparation. The first companies
to be listed on the GEM were strictly screened. Their financial background and
profitability were relatively good, showing great potential for development.
Expectations for these companies were very high, resulting in investor enthusiasm and
increasing market speculation, eventually leading to a high underpricing rate.
Third, although the underpricing level in China’s GEM has experienced ups and
downs, the overall trend is declining. A rebound occurred in 2014 and 2015, but the
rate was much smaller than in 2009. This shows that the systems in China’s two major
markets are gradually improving and that the two markets are on the right track.
Meanwhile, investor behavior is also becoming more rational and mature.
5. Empirical Analysis and Research on the Determinants of the underpricing
Rate in China’s GEM.
5.1. Research hypotheses and theoretical analysis
The above statistical analysis indicates that the Chinese GEM had a higher level of
underpricing by the end of September 30, 2015. Based on theoretical research
conducted in China and abroad and the characteristics of China’s GEM and capital
markets, this study’s analysis will consider the heat of the market, investment
behavior, the growth of listed companies, and asymmetric information theory.
5.1.1 Heat of the market
If the overall trend of the economy is good, investors will have more confidence in
stock investments and more expectations of capital markets, so they will increase their
investments. If the overall economic situation is poor, investors will expect that the
stock market and even the capital market as a whole will be affected by the adverse
climate. Investors’ self-confidence will be affected, and the risk-averse will reduce
their investments. These factors will have a great impact on stock prices. Market
return and trading value can be used to measure market heat. Therefore, this study
uses these two indicators to analyze the relationship between market heat and
underpricing rates.
We propose the following:

14
Hypothesis 1: There is a positive correlation between market return and stock
underpricing.
When a stock market is a “bull” market, its yield and even that of the whole capital
market, will improve. Although high yield is bound to be associated with high risk,
investors are dazzled by high returns and tend to ignore the risks. At this time, it is
difficult to estimate the real value of a listed company, so the price of a stock will not
reflect the real value of the company, leading to uncertainty in the stock and capital
markets. Second, when the entire capital market is a bull market, investors are full of
confidence in the stocks they are going to invest in, and blindly believe that they have
great growth potential. Excessive speculation increases the liquidity of the capital
market.
We propose the following:
Hypothesis 2: There is a positive correlation between trading value and stock
underpricing.
Stock trading value reflects the amount of a certain stock traded on the exchange
market during a certain period of time, or the total amount of stock traded on the day.
The vast majority of investors are very familiar with the concept of “trading volume.”
In fact, the “trading value” and “trading volume” concepts are roughly the same. The
effect of trading value on the stock market is the same as that of trading volume, and
the trading volume of the trading value is more in line with market reality. When the
capital or stock market is on the rise, investors are confident in the future of the stocks
and will buy them, even if they are high-risk. Most of the investors in China’s capital
market are irrational, and other kinds of investors will blindly follow certain stocks.
As a result, the volume of such stocks will greatly increase, as will the trading value,
eventually leading to a substantial increase in stock prices.
5.1.2 Investment behavior
Some researchers argue that the emotions of investors strongly affect their behavior
in the capital market. If the good news about an IPO continues, they will be full of
expectations for the market, which will make them constantly overestimate the value
of new shares. High expectations will induce investors to buy new shares. This
irrational optimism from investors can cause an abnormal increase in the price of new
shares in the circulation market, eventually leading to high underpricing.
China’s GEM is a relatively new market. It is still developing, and most investors
are immature and irrational. Such investors are volatile and easily affected by changes
in external information, causing stock prices to diverge from their real value. This
changeability in investors leads to a sharp fluctuation in stock prices. The
lottery-winning rate is a good measure of investor behavior. We thus use this indicator
to study the relationship between investor behavior and the underpricing rate.

15
We propose the following:
Hypothesis 3: There is a negative correlation between the lottery-winning rate
and stock underpricing.
The lottery-winning rate is the funds raised by the issuing company in the
distribution market divided by the participation of the subscribed funds; thus, lottery
winning rate = the number of stock issues/the number of valid purchases. As can be
seen from the formula, the smaller the denominator, the greater the value of the
lottery-winning rate, indicating that investors do not agree with the new shares.
Contrariwise, the larger the denominator, the smaller the value of the lottery-winning
rate, indicating that investors agree with the new shares. In other words, the lower the
lottery-winning rate at the time of issue, the higher the investor sentiment is and the
more funds investors are willing to invest in the listed company. In this case, demand
is greater than supply, causing the stock price to increase.
5.1.3 Growth of the listed companies
The GEM has a feature that differentiates it from the main and SME board markets:
The enterprises listed on the GEM are small and medium-sized high-tech enterprises.
These enterprises generally use high-tech means of production technology and
innovative management models, and also receive the key support of the government.
For such firms now in the R&D stage, the potential for development is huge. If the
listing is successful and if they obtain the funding and support they need from the
government, their products will quickly perform well in the market and allow them to
become industry leaders. Investors who realize the high growth potential of these
companies will be full of optimism about them, which will lead them to buy the new
stocks. The price of the new shares will be too high, and a high underpricing rate will
appear. This study uses three indicators to study the relationship between company
growth and the rate of underpricing: outstanding shares, net asset value per share
before issue, and the price–earnings (P/E) ratio.
We propose the following:
Hypothesis 4: There is a positive correlation between the outstanding shares
and stock underpricing.
Outstanding shares constitute a company’s stock currently held by all its
shareholders, including share blocks held by institutional investors and restricted
shares owned by the company’s officers and insiders. Outstanding shares are shown
on a company’s balance sheet under the heading “Capital Stock.” The number of
outstanding shares is used to calculate key metrics such as a company’s market
capitalization, its earnings per share (EPS), and cash flow per share (CFPS).

16
Transactions involving the larger varieties of outstanding shares are very active.
Irrational investors in the capital market blindly follow suit. Excessive speculation
will lead to an abnormal increase in stock prices, eventually resulting in high
underpricing.
We propose the following:
Hypothesis 5: There is a positive correlation between the net asset value per
share before issue and stock underpricing.
Net asset per share is the ratio of shareholders’ equity to the total number of shares.
The calculation formula is as follows: net assets per share = shareholders’ equity/total
number of shares. This indicator reflects the current value of the assets per share. The
higher the net assets per share, the higher the value of the shareholders’ assets per
share. Investors are also more confident about the future of the stock, leading to
excessive speculation and raising the stock price.
We propose the following:
Hypothesis 6: There is a positive correlation between the price–earnings ratio
and stock underpricing.
The P/E ratio is the ratio of the market price of a stock to the earnings per share.
P/E is one of the most commonly used indicators to assess whether the price level is
reasonable, as it reflects the investor’s expected return on the company’s stock. The
high risk of companies listed on the GEM market will inevitably lead to higher
speculation. The P/E ratio can be used as a measure of speculation: The higher the P/E
ratio, the greater the enthusiasm of the investors, and the greater the atmosphere of
speculation. The greater the P/E value, the greater the speculation; and the greater the
speculation, the more likely it is that the stock prices of newly listed companies will
increase.
5.1.4 Asymmetric information theory
Asymmetric information theory posits that different personnel in the market
economy have different information levels. People with sufficient information are
often in a relatively favorable position, while people with poor information are in a
relatively unfavorable position. There are usually three economic entities in a stock
market: the issuer, the underwriter, and the investor. The asymmetric information
between the three will result in stock underpricing. The higher the information
asymmetry, the higher the rate of underpricing. This study considers four indicators to
examine the relationship between company growth and the rate of underpricing: issue
price, IPO time interval, issue scale, and underwriting fee.

17
We propose the following:
Hypothesis 7: There is a negative correlation between the issue price and stock
underpricing.
According to the winner’s curse theory, unknowing investors who are at an inferior
stage of information due to information asymmetry will slowly withdraw from the
stock market after realizing their situation. To keep these investors in the stock market,
issuers and underwriters use several methods. One is to reduce the price of new shares;
investors can increase the number of stocks they want to buy. In this case, the degree
of information asymmetry is usually reflected in the degree of stock price decline. The
more the issue price declines, the more the issuer reimburses the investors.
Uninformed investors tend to reduce their subscription of shares or withdraw from the
stock market entirely due to asymmetric information. Shares at lower prices will be
favored by more investors. For the GEM market, however, the IPO underpricing rate
will be greatly improved. We thus posit that there is a negative correlation between
the issue price and stock underpricing.
We propose the following:
Hypothesis 8: There is a positive correlation between the time interval and
stock underpricing.
It often takes a long time for a new issue to be listed. If the wait time is too long,
the greater the uncertainty of the future stock, the more risk the investor faces because
the price trend of the stock market is unpredictable. This will affect the accuracy and
integrity of the information investors have obtained. The uninformed investor, who is
at a disadvantage because of information asymmetry, will ask for more compensation.
Moreover, if the wait for the listing is too long, the first day of IPO is likely to fall
below the issue price. The price of a new issue is calculated according to the specific
situation of the circulation market, and there is a very close relationship with the
circulation market. If the stock market is a bull market before the IPO, the issue price
of the new share will probably rise substantially. If the stock market is a bear market
before the IPO, the issuing price of the new stock will probably fall, perhaps even
below the issuing price. Thus, the longer the wait for the IPO, the higher the
underpricing of the issue.
We propose the following:
Hypothesis 9: There is a negative correlation between the issue scale and stock
underpricing.
The issuance scale of new shares refers to the total sum of the funds to be raised by
the issuing company. The formula is the product of the price and quantity of the

18
issuance of a company’s new shares. Stock companies expand their size by raising
funds in the stock market. Most large enterprises become mature after a long period of
development, their operations are standardized, their information disclosure is
relatively sound, and investors are more inclined to study them. Moreover, the stock
price of a large enterprise is difficult to manipulate by a small number of shareholders,
which can ensure investors a stable return on investment. Information transparency in
small businesses is relatively low, so investors are less aware of them, and their
investment risks are relatively high. The uninformed investor, who is at a
disadvantage because of information asymmetry, will ask for more compensation. The
smaller the enterprise, the smaller its market value, making it easily manipulated by
large capital.
However, China’s GEM market is relatively new and is dominated by small and
medium-sized high-tech enterprises. These companies have relatively low levels of
information disclosure, and investors know little about them; thus, information
asymmetry is relatively high. The higher the information asymmetry, the higher the
underpricing of new shares.
We propose the following:
Hypothesis 10: There is a negative correlation between the underwriting fee
and stock underpricing.
The information asymmetry theory also applies to the issuer and underwriter. In
China, underwriters are generally large securities companies, professionals who are
very familiar with the stock market. Therefore, underwriters will conduct detailed
analyses of the market in order to understand it better than the issuers do. To maintain
their reputation and guarantee success, underwriters tend to deliberately reduce the
price of stocks at issuance. In addition, if the issuing company’s incentives are
insufficient or the underwriters’ fees are too low, the underwriters will lack motivation.
Therefore, to fulfill their tasks and cater to investors in the capital market,
underwriters often artificially reduce stock prices at issuance instead of studying the
real value of the new shares. Lower prices will also be sought by investors, who are
scrambling to buy, eventually leading to high underpricing.
5.2 Empirical Analysis
5.2.1 Model construction and variable definitions
The explained variable Y of the model is the rate of underpricing (IpoUnd), and Y=
(P1-P0)/P0,P1 is the closing price of the first day of listing,P0 is the issue price.
The explanatory variables of the model are as follows:
X1: market return (Makren);

19
X2: trading value (Tradv);
X3: lottery-winning rate (Lot);
X4: outstanding shares (IpoShr);
X5: net asset value per share before issue (Nav1);
X6: price earnings ratio (PE);
X7: issue price (IpoPr);
X8: time interval from issue to list in the market (IpoInt);
X9: issue scale (IpoSum);
X10: underwriting fee (UdwFee);
The model is constructed as follows:
Yi= β+
10
1j
βijXij +Ụi (1)
where, Yi is the IPO underpricing rate of the i sample, and β is the constant term.
βij is the coefficient of the j explanatory variable, Xij is the j explanatory variable, and
Ụi is a random error term.
5.2.2 Descriptive statistical analysis of the sample of the GEM and SME markets
Table 5-1 GEM descriptive statistics
GEM Mean Median Maximum Minimum Std Dev
IpoUnd 0.369 0.435 2.097 -0.167 0.322
Makren 0.011 0.017 0.142 -0.202 0.051
Tradv(million) 36702.630 30828.130 381284.800 2.314 40684.730
Lot 0.011 0.007 0.187 0.001 0.013
IpoShr (million) 1987.571 1720.000 8000.000 699.000 1001.013
Nav1 3.590 3.210 12.230 1.060 1.584
PE 47.151 42.860 150.820 7.110 24.888
IpoPr 26.728 22.385 110.000 4.470 15.339
IpoInt 11.163 10.000 50.000 7.000 4.891
IpoSum(million) 56824.260 44676.000 255300.000 12948.650 589.800
UdwFee 3437.719 2998.580 14700.000 589.800 1920.570
Table 5-2 SME descriptive statistics
SME Mean Median Maximum Minimum Std Dev
IpoUnd 0.371 0.325 2.753 -0.263 0.400
Makren 0.002 0.002 0.177 -0.193 0.054
Tradv (million) 56990.350 50262.960 397954.800 4.259 49079.900
Lot 0.012 0.007 0.655 0.001 0.033
IpoShr (million) 3323.750 2680.000 120000.000 1064.000 5768.522
Nav1 3.519 3.240 11.360 1.400 1.392
PE 44.361 44.520 113.640 12.940 17.890
IpoPr 24.517 22.000 148.000 5.280 13.361

20
IpoInt 10.927 11.000 22.000 7.000 2.505
IpoSum(million) 85889.070 65930.000 699600.000 16876.350 68663.210
UdwFee 4106.658 3534.050 20771.800 675.050 2424.253
The above table shows that the underpricing rates of the two major markets are
both high and that the maximum value is over 200%. The standard deviation of the
two major markets is more than 0.300, indicating that the volatility of the rate of
underpricing in the two major markets is relatively large.
The market return on the GEM market is 1.100%, and that on the SME market is
0.200%. Both are positive, perhaps because, as the GEM market has just been
established, it is popular with investors, and its market capacity is small, thus funds
can easily pull the market and create a linkage effect.
The trading value of the GEM market is 36702.630 million, and that of the SME
market is 56990.350 million. Thus, both have a large trading value, perhaps because
the many irrational investors in the capital market blindly follow the trading, pushing
the trading value high.
Concerning the lottery-winning rate, the average value of the GEM is 1.100%, and
that of the SME market is 1.200%, values that are relatively small. The standard
deviation for both is also relatively small, indicating little volatility. It can be seen that
the investors in the issuing market are enthusiastic about the new stock market in the
GEM.
Concerning the IPO outstanding shares, the average value of the GEM is 1987.571
million, and that of the SME market is 3323.750 million, values that are relatively
large. These data show that trading is active in the two major markets.
The average net asset value per share before issue is around 3.500 for both markets.
This indicator reflects the current value of the assets per share. The higher it is, the
higher the value of the shareholders’ assets per share, and the brighter the future of the
company.
The price earnings ratio of the two major markets is high. The ratio of the GEM is
about 47.000 times, and that of the SME market is about 44.000 times. Because the
companies in the GEM are high- and new-technology firms, investors are more
optimistic about them and their growth potential.
The issue price of the two major markets is relatively high. That of the GEM is
about 27.000 CNY, and that of the SME board market is about 24.000 CNY. However,
the maximum issue prices are 110.000 and 148.000 yuan, respectively.
The average IPO time interval value of the GEM is 11.163, and that of the SME
market is 10.927, which are almost equal. However, the standard variance of the GEM
is 4.891, and that of the SME is 2.505; the GEM value is almost double that of the
SME. This shows that the uncertainty of the GEM market is greater than that of the
SEM market.
The average issue scale value of the GEM is 56824.260 million, and that of the
SME market is 85889.070 million. The value of the GEM is much smaller than that of
the SME board market, showing that the companies listed on the GEM market are
relatively small. As mentioned, the information disclosure of large companies is better
21
than that of small companies, which affects the price of the issuance of new shares.
Underwriting fees for the GEM are obviously lower than for the SME market,
explaining underwriters’ lack of motivation in the former. Increasing revenue requires
reducing the issue price of new shares.
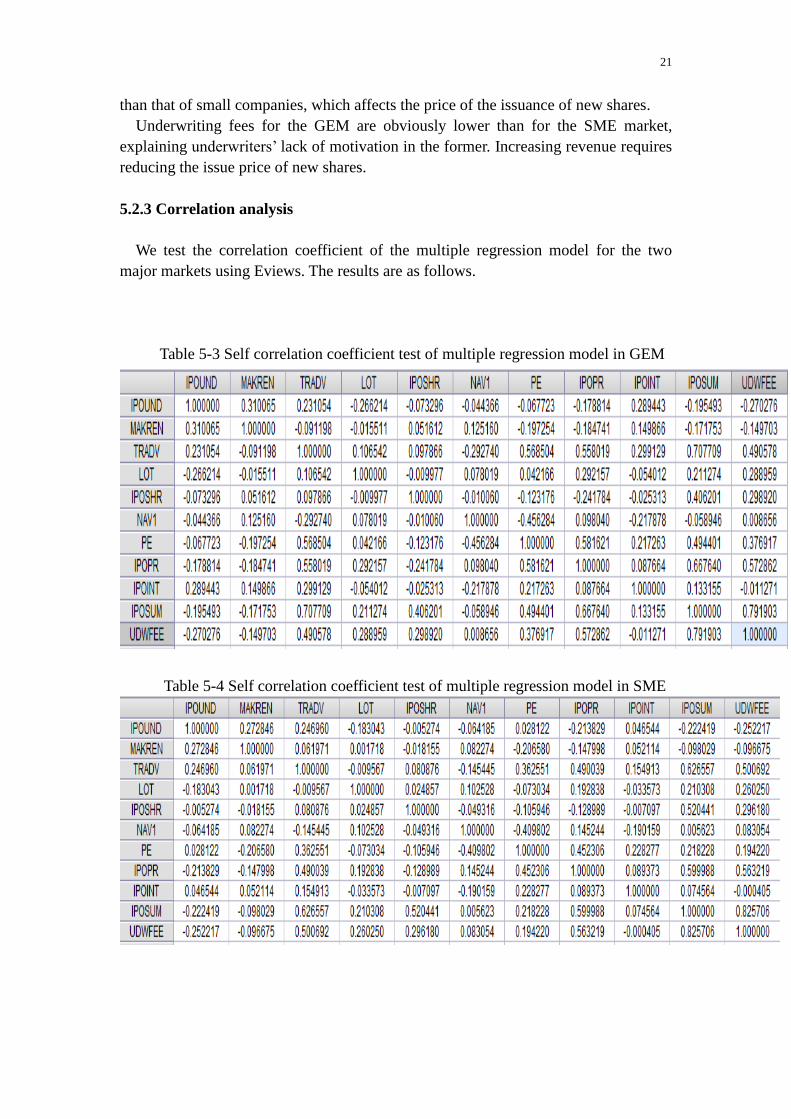
5.2.3 Correlation analysis
We test the correlation coefficient of the multiple regression model for the two
major markets using Eviews. The results are as follows.
Table 5-3 Self correlation coefficient test of multiple regression model in GEM
Table 5-4 Self correlation coefficient test of multiple regression model in SME

22
As can be seen in the above table, the correlation coefficient of the multiple
regression model’s explanatory variable for the GEM reaches a maximum of
0.791903, while that for the SME board market reaches a maximum of 0.825706. A
linear correlation is generally assumed when the correlation coefficient is 0.7 or above.
Thus, a multicollinearity problem may be occurring between the explanatory variables
of the model. The correlation coefficient of the issue scale and the underwriting fee in
the GEM is 0.791903; the correlation coefficient of the issue scale and the trading
value in the GEM is 0.707709; and the correlation coefficient of the issue scale and
the underwriting fee in the SME board market is 0.825706.
5.2.4 Estimation results of multiple regressions
We estimate Equation (1) via ordinary least squares (OLS) using HAC standard
errors and covariance. To address the potential multicollinearity problem, we estimate
the regressions by removing one of the aforementioned variables with close
correlations with each other. The estimation results for the GEM are shown in Tables
5-5 through 5-8, while those for the SME market are shown in Tables 5-9 and 5-10.
Table 5-5 Results for GEM (full explanatory variables)
Variable Coefficient Std.Error t-Statistic Prob
C 0.281091 0.096299 2.918924 0.0037
MAKREN 1.233897 0.350983 3.515548 0.0005
TRADV 6.26E-06 6.46E-07 9.680615 0.0000
LOT -4.463390 1.378510 -3.237837 0.0013
IPOSHR 2.82E-05 2.31E-05 1.220963 0.2227
NAV1 0.302277 0.009472 3.196553 0.0015
PE -0.000875 0.000657 -1.331801 0.1836
IPOPR -0.001128 0.001797 -0.627676 0.5305
IPOINT 0.009786 0.004142 2.362669 0.0185
IPOSUM -4.85E-06 9.87E-07 -4.912711 0.0000
UDWFEE -1.02E-05 9.50E-06 -1.072644 0.2840
R-squared 0.472567 F-statistic 42.37957
Adjusted R-squarde 0.461416 Prob(F-statistic) 0.000000
The full explanatory variable regression results for the GEM show that R2 is
0.472567 and adjusted R2 is 0.461416, which indicates that the model’s degree of fit
is high and the error is small. This shows that most of the variation in the explained
variable is caused by the change of the explanatory variables. The significance test of
the regression equation produces F = 42.37957, Prob(F-statistic) = 0.000000, which is
much smaller than the value of F. Therefore, the result of the significance test is
positive.

23
Table 5-6 Result for GEM (removing underwriting fee)
Variable Coefficient Std.Error t-Statistic Prob
C 0.266034 0.094952 2.801781 0.0053
MAKREN 1.229471 0.347131 3.541806 0.0004
TRADV 6.31E-06 6.57E-07 9.609977 0.0000
LOT -4.619323 1.375266 -3.358858 0.0008
IPOSHR 2.85E-05 2.31E-05 1.237541 0.2165
NAV1 0.030304 0.009569 3.166823 0.0016
PE -000891 0.000656 -1.358476 0.1750
IPOPR -0.001188 0.001788 -0.664370 0.5068
IPOINT 0.010155 0.004072 2.494001 0.0130
IPOSUM -5.25E-06 9.54E-07 -5.505255 0.0000
R-squared 0.471316 F-statistic 46.95175
Adjusted R-squarde 0.461278 Prob(F-statistic) 0.000000
Table 5-7 Result for GEM (removing IpoSum)
Variable Coefficient Std.Error t-Statistic Prob
C 0.475966 0.092475 5.146972 0.0000
MAKREN 1.410395 0.372826 3.782986 0.0002
TRADV 5.01E-06 5.18E-07 9.656308 0.0000
LOT -4.110780 1.611808 -2.550416 0.0111
IPOSHR -5.27E-05 1.81E-05 -2.901755 0.0039
NAV1 0.030974 0.009636 3.214541 0.0014
PE -0.00975 0.000652 -1.495539 0.1354
IPOPR -0.006930 0.001485 -4.667648 0.0000
IPOINT 0.008523 0.004676 1.822796 0.0690
UDWFEE -3.88E-05 9.40-06 -4.127543 0.0000
R-squared 0.430123 F-statistic 39.75098
Adjusted R-squarde 0.419303 Prob(F-statistic) 0.000000

24
Table 5-8 Result for GEM (removing TradV)
Variable Coefficient Std.Error t-Statistic Prob
C 0.372032 0.118758 3.132687 0.0018
MAKREN 1.564436 0.423571 3.693446 0.0002
LOT -4.827696 1.748305 -2.761358 0.0060
IPOSHR -1.96E-05 2.29E-05 -0.855609 0.3926
NAV1 -0.000954 0.010935 -0.087260 0.9305
PE -9.31E-05 0.000829 -0.112355 0.9106
IPOPR -0.000834 0.001561 -0.534235 0.5934
IPOINT 0.015608 0.005817 2.683449 0.0075
IPOSUM 3.10E-07 9.41E-07 0.329195 0.7422
UDWFEE -2.68E-05 1.20E-05 -2.238022 0.0257
R-squared 0.246847 F-statistic 17.26159
Adjusted R-squarde 0.232547 Prob(F-statistic) 0.000000
The results of Tables 5-6 to 5-8 show that, when the underwriting fee is removed,
the value of F of the regression equation increases while no significant change occurs
in the values of the R2 and adjusted R2 . Thus, the model shown in Table 5-6 is
meaningful and significant.
Table 5-9 Results for SME market (full explanatory variables)
Variable Coefficient Std.Error t-Statistic Prob
C 0.239417 0.108040 2.215998 0.0272
MAKREN 1.076861 0.448605 2.400467 0.0168
TRADV 6.31E-06 1.03E-06 6.118705 0.0000
LOT 0.082450 0.832022 0.099096 0.9211
IPOSHR 2.98E-05 7.67E-06 3.882663 0.0001
NAV1 0.025110 0.012111 2.073286 0.0387
PE 0.001396 0.001254 1.113562 0.2661
IPOPR 0.000132 0.002019 0.065321 0.9479
IPOINT -0.001195 0.005973 -0.199997 0.8416
IPOSUM -5.37E-06 1.34E-06 -3.999962 0.0001
UDWFEE -2.34E-06 1.21E-05 -0.192985 0.8471
R-squared 0.434364 F-statistic 35.09401
Adjusted R-squarde 0.421987 Prob(F-statistic) 0.000000

25
The full explanatory variable regression results for the SME market show that R2 is
0.434364 and adjusted R2 is 0.421987, which indicates that the model’s degree of fit
is high and the error is small. This shows that most of the variation in the explained
variable is caused by the change of the explanatory variables. The significance test of
the regression equation produces F = 35.09401, Prob(F-statistic) = 0.000000, which is
much smaller than the value of F. Therefore, the result of the significance test is
positive.
Table 5-10 Result for SME market (removing UdwFee)
Variable Coefficient Std.Error t-Statistic Prob
C 0.236759 0.103891 2.278933 0.0231
MAKREN 1.078560 0.446246 2.416963 0.0160
TRADV 6.32E-06 1.01E-06 6.264307 0.0000
LOT 0.073661 0.837069 0.087998 0.9299
IPOSHR 3.00E-05 7.12E-06 4.214975 0.0000
NAV1 0.024973 0.012245 2.039422 0.0420
PE 0.001382 0.001227 1.126369 0.2606
IPOPR 0.000147 0.001965 0.074723 0.9405
IPOINT -0.001170 0.005827 -0.200830 0.8409
IPOSUM -5.45E-06 1.11E-06 -4.927911 0.0000
R-squared 0.434132 F-statistic 39.12709
Adjusted R-squarde 0.423037 Prob(F-statistic) 0.000000
Table 5-11 Result for SME market (removing IpoSum)
Variable Coefficient Std.Error t-Statistic Prob
C 0.354824 0.104789 3.386061 0.0008
MAKREN 1.301301 0.489219 2.659956 0.0081
TRADV 4.42E-06 6.16E-07 7.179156 0.0000
LOT -0.281584 0.890639 -0.316159 0.7520
IPOSHR 3.33E-06 4.62E-06 0.719652 0.4721
NAV1 0.039762 0.012323 3.226517 0.0013
PE 0.003332 0.001365 2.441346 0.0150
IPOPR -0.009412 0.002185 -4.307066 0.0000
IPOINT -0.004357 0.006580 -0.662196 0.5082
UDWFEE -6.21E-05 1.03E-05 -6.031259 0.0000
R-squared 0.345090 F-statistic 26.81479
Adjusted R-squarde 0.332221 Prob(F-statistic) 0.000000
The results of Tables 5-10 and 5-11 show that, when the underwriting fee is
removed, the value of F of the regression equation increases, while there is no
significant change in the values of the R2 and adjusted R2. Thus, the model shown in
Table 5-10 is meaningful and significant.

26
The estimation results can be summarized as follows:
1. Market return: In the GEM regression model, the value of P is 0.0004, and the
test was passed at significance levels of 0.01 and 0.05. Moreover, β1=1.229471, which
is positive and supports our hypothesis of a positive correlation with the rate of IPO
underpricing. For the SME market, however, this variable is not significant, with
significance levels of 0.01. At a significance level of 0.05, however, the variable is
significant, and the β1 of the SME market shows that it has a positive correlation with
the underpricing rate of the SME board market. These results show that investors are
excited about the newly established GEM market and that their investment
enthusiasm is very high.
2. Trading value: In the GEM regression model, the value of P is 0.0000, and the
test was passed at significance levels of 0.01 and 0.05. Moreover, β2 = 6.31E-06,
which is positive and supports our hypothesis of a positive correlation with the rate of
IPO underpricing. For the SME market, the significance test results and coefficient
analysis results are the same. This variable has a significantly positive correlation
with the underpricing rates of the two major markets and supports our hypothesis.
This result shows that investors in the two major markets are very active in trading,
indicating that the impact of the heat of the market on the underpricing rate is
extremely significant.
3. Lottery-winning rate: In the GEM regression model, the value of P is 0.0008, and
the test was passed at significance levels of 0.01 and 0.05. Moreover, β3 = -4.619323,
which is negative and supports our hypothesis of a negative correlation with the rate
of IPO underpricing. However, this variable did not enter the SME board regression
equation at significance levels of 0.01 and 0.05.The lower the lottery-winning rate, the
smaller the ratio of the issuing scale to the purchase scale, which indicates that
investors are actively purchasing and that potential demand is great, which promotes
price increases.
4. Outstanding shares of IPO: In the GEM regression model, β4 = 2.85E-05, which
is positive and supports our hypothesis of a positive correlation with the rate of IPO
underpricing. The value of P is 0.2165 and significant at a level of 0.05, but it is not
significant at a level of 0.01. For the SME market, β4 = 3.00E-05, which is positive
and supports our hypothesis of a positive correlation with the rate of IPO underpricing.
The value of P is 0.0000, and the test was passed at significant levels of 0.01 and 0.05.
5. Nav1: In the GEM regression model, β5 = 0.030304, which is positive and
supports our hypothesis of a positive correlation with the rate of IPO underpricing.
The value of P is 0.0016, and the test was passed at significance levels of 0.01 and
0.05. This shows that investors are optimistic about the growth and profitability of the
companies they have subscribed to. For the SME market, β5=0.024973, which is
positive and supports our hypothesis of a positive correlation with the rate of IPO
underpricing. However, the value of P is 0.0420 and significant at a level of 0.05 but
not significant at a level of 0.01.
6. Price earnings ratio: In the GEM regression model, β6 = -0.000891, which is
negative and does not support our hypothesis. For the SME board market, however, β6

27
= 0.001382, which is positive and does support our hypothesis of a positive
correlation with the rate of IPO underpricing. It is significant at a level of 0.05.
7. Issue price: In the GEM regression, β7 = -0.001188, which is negative and
supports our hypothesis of a negative correlation with the rate of IPO underpricing.
However, the value of P is 0.5068 and is not significant at levels of 0.01 and 0.05. For
the SME market, β7 = 0.000147, which is positive and does not support our
hypothesis. This may be due to the short supply of stocks in the two major markets
and the high issuance prices. The winner curse theory does not hold in either market.
8. IPO time interval: In the GEM regression model, β8 = 0.010155, which is positive
and supports our hypothesis of a positive correlation with the rate of IPO underpricing.
The value of P is 0.0130 and significant at a level of 0.05 but not significant as a level
of 0.01. For the SME market, β8 = -0.001170, which is negative and does not support
our hypothesis. The longer the listing deadline is, the higher the degree of asymmetric
information for investors, and the higher the corresponding underpricing rate;
however, its influence is limited, which weakens the influence of information
asymmetry.
9. Issue scale: In the GEM regression model, β9 = -5.25E-06, which is negative and
supports our hypothesis of a negative correlation with the rate of IPO underpricing.
The value of P is 0.0000, and the test was passed at significance levels of 0.01 and
0.05. For the SME market, the significance test results and coefficient analysis results
are the same. This variable has a significantly negative correlation with the
underpricing rates of the two major markets and supports our hypothesis. This may be
because the companies are small, they have weak information disclosure systems, and
they are easily manipulated.
6. Conclusions and implications
This study explored the important factors influencing the underpricing rate of
China’s GEM market. Based on the theory of underpricing, data on 484 GEM
companies covering October 1, 2009 to September 30, 2015 were used in an empirical
analysis. The main findings are as follows.
(1) By the end of September 30, 2015, China’s GEM market had a high
underpricing rate.
Through descriptive statistics for the GEM and SME board markets, this study
shows that the markets have high underpricing rates. The underpricing rate of the
GEM is 36.9%, and that of the SEM market is 37.1%, which are far higher than the
underpricing rates in developed countries. The standard deviation of the two major
markets exceeds 0.3, indicating high volatility in the underpricing rates in the two
major markets. This shows that the risk levels of these two major markets are very
high. These results appear in different intervals and different periods. However, with
the improvement and reform of the IPO system, the rate of underpricing in the GEM
is declining relative to the 2009 level.
(2) The most important factor in the high underpricing rate of China’s GEM is the

28
heat of the market.
The empirical results show that the two heat-of-the-market variables are very
significant. The heat of the market not only represents the overall trend in capital
market changes but also reflects investors’ expectations for the market. Since
launching in 2009, China’s GEM has been an investor focus because the companies
listed on it are all high-tech firms, and the GEM provides a very good financing
platform for their development, which makes investors confident in their growth and
future. However, most of the investors in the GEM market are irrational, and not only
lack investment knowledge but are also easily affected by the external environment.
Therefore, when the growth trend of the GEM market is rising, investors blindly
follow it, and their speculation increases stock prices sharply.
(3) Investor behavior is one important reason for the high underpricing rate in
China’s GEM.
The empirical analysis shows that the indicators of investor behavior are very
significant. The lottery-winning rate reflects not only the degree of investor
recognition of a stock but also the relationship between supply and demand. It also
reflects the blind pursuit of irrational investors and their degree of speculation,
perhaps because the Chinese GEM is young and its market and legal mechanisms are
immature. Investors are easily influenced by environmental factors.
(4) Company growth has little impact on the high underpricing rate in China’s
GEM market.
In the empirical analysis, the three indicators of company growth are all significant
at a level of 0.05; at a significance level of 0.01, however, only Nav1 is significant.
Thus, for the three indicators of firm growth, only Nav1 is significant and can enter
the regression equation. This shows that company growth has little impact on the high
underpricing rate in China’s GEM market. However, it also shows that, as China’s
GEM develops, China’s market system is evolving, its legal mechanisms are
becoming standardized, and investors are becoming more rational. Investors will
consider not only their immediate interests but also their long-term horizons and the
future of the companies they invest in.
(5) The theory of asymmetric information has little impact on the high underpricing
rate in China’s GEM market.
In the empirical analysis, IpoSum and IpoInt are significant at a level of 0.05; at a
significance level of 0.01, however, only IpoSum is significant. Thus, the three
indicators are not very significant, except for IpoSum. This may be because, as
China’s GEM develops, China’s market system is evolving, and its legal mechanisms
are becoming standardized. The result also shows that the information disclosure
system in China’s GEM needs to be improved. In particular, the information
disclosure system of small firms should be strengthened so that investors can gain a
comprehensive understanding of the real value of the stocks they are considering
investing in.
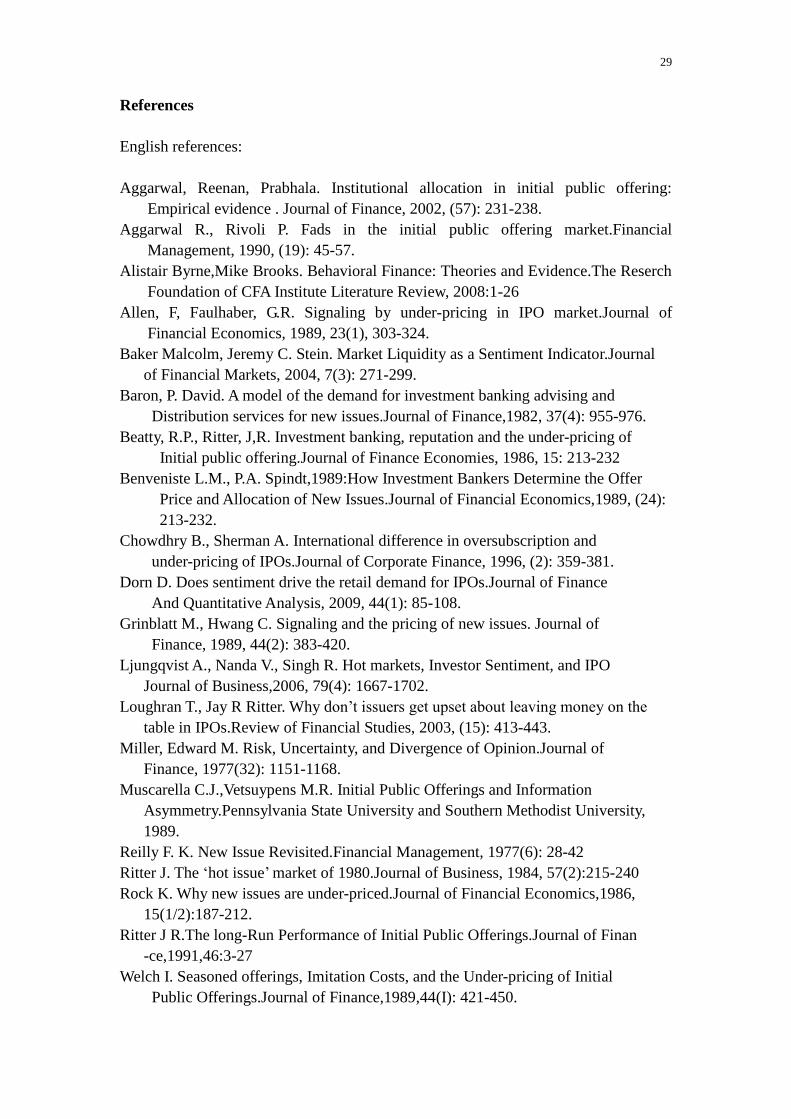
29
References
English references:
Aggarwal, Reenan, Prabhala. Institutional allocation in initial public offering:
Empirical evidence . Journal of Finance, 2002, (57): 231-238.
Aggarwal R., Rivoli P. Fads in the initial public offering market.Financial
Management, 1990, (19): 45-57.
Alistair Byrne,Mike Brooks. Behavioral Finance: Theories and Evidence.The Reserch
Foundation of CFA Institute Literature Review, 2008:1-26
Allen, F, Faulhaber, G.R. Signaling by under-pricing in IPO market.Journal of
Financial Economics, 1989, 23(1), 303-324.
Baker Malcolm, Jeremy C. Stein. Market Liquidity as a Sentiment Indicator.Journal
of Financial Markets, 2004, 7(3): 271-299.
Baron, P. David. A model of the demand for investment banking advising and
Distribution services for new issues.Journal of Finance,1982, 37(4): 955-976.
Beatty, R.P., Ritter, J,R. Investment banking, reputation and the under-pricing of
Initial public offering.Journal of Finance Economies, 1986, 15: 213-232
Benveniste L.M., P.A. Spindt,1989:How Investment Bankers Determine the Offer
Price and Allocation of New Issues.Journal of Financial Economics,1989, (24):
213-232.
Chowdhry B., Sherman A. International difference in oversubscription and
under-pricing of IPOs.Journal of Corporate Finance, 1996, (2): 359-381.
Dorn D. Does sentiment drive the retail demand for IPOs.Journal of Finance
And Quantitative Analysis, 2009, 44(1): 85-108.
Grinblatt M., Hwang C. Signaling and the pricing of new issues. Journal of
Finance, 1989, 44(2): 383-420.
Ljungqvist A., Nanda V., Singh R. Hot markets, Investor Sentiment, and IPO
Journal of Business,2006, 79(4): 1667-1702.
Loughran T., Jay R Ritter. Why don’t issuers get upset about leaving money on the
table in IPOs.Review of Financial Studies, 2003, (15): 413-443.
Miller, Edward M. Risk, Uncertainty, and Divergence of Opinion.Journal of
Finance, 1977(32): 1151-1168.
Muscarella C.J.,Vetsuypens M.R. Initial Public Offerings and Information
Asymmetry.Pennsylvania State University and Southern Methodist University,
1989.
Reilly F. K. New Issue Revisited.Financial Management, 1977(6): 28-42
Ritter J. The ‘hot issue’ market of 1980.Journal of Business, 1984, 57(2):215-240
Rock K. Why new issues are under-priced.Journal of Financial Economics,1986,
15(1/2):187-212.
Ritter J R.The long-Run Performance of Initial Public Offerings.Journal of Finan
-ce,1991,46:3-27
Welch I. Seasoned offerings, Imitation Costs, and the Under-pricing of Initial
Public Offerings.Journal of Finance,1989,44(I): 421-450.

30
Welch I. Sequential Sales, Learning and Cascades.Journal of Finance,1992,
47(2): 695-732.
Japanese references:
忽那憲治:IPO 市場の価額形成[M],中央経済社,2008.
Yahoo Jpan:https://www.yahoo.co.jp
Chinese references:
庄学敏. 我国中小板抑价原因研究[J].经济与管理研究,2009(11).
郑红梅,赵红岩. 基于随机前沿方法的我国创业板 IPO定价效率
分析[J].供应链,2010(3).
吴晓求.中国创业板市场:现状与未来,2011(4):5-14.
李善民,陈旭. 创业板 IPO抑价、公司治理与发行特征——中国创业板
和中小板上市公司的比较研究,2011 (5):111-120.
朱元甲,李阳. 风险投资对创业板市场 IPO抑价的影响,2012(3):21-26.
刘超然. 我国创业板 IPO抑价实证研究[J]. 中国市场,2012 (13).
于晓红,张雪,李燕燕. 公司内在价值、投资者情绪与 IPO抑价——
基于创业板市场的经验证据,2013(1):86-90.
黄俊,陈信元.媒体报道与 IPO抑价,2013(2):83-94.
孙国贸,姜顺其,张韶岩.中国股票市场 IPO抑价原因研究——
基于创业板的统计数据,2013(4):21-29.
任辉,孙倩. 我国创业板 IPO抑价影响因素实证研究[J],2015(6):58-65.
易宪容,赵春明,行为金融学[M].社会科学文献出版社.2004.第 110页.
庞皓. 计量经济学[M],科学出版社,2007.
高铁梅. 计量经济分析方法与建模:Eviews 应用及实例[M].清华大学出版社,
2006
金融界: http://www.jrj.com.cn
深圳证券交易所网站: http//www.szse.cn
Related Documents


