AWARD NUMBER: W81XWH-12-1-0607 TITLE: Emotion Regulation Training for Treating Warfighters with Combat-Related PTSD Using Real-Time fMRI and EEG-Assisted Neurofeedback PRINCIPAL INVESTIGATOR: Jerzy Bodurka CONTRACTING O GANIZATION : Laureate Institute for Brain Research Tulsa, OK 74137 REPORT DATE: October 2016 TYPE OF REPORT: Annual PREPARED FOR: U.S. Army Medical Research and Materiel Command Fort Detrick, Maryland 21702-5012 DISTRIBUTION STATEMENT: Approvced for public release; Distribution Unlimited The views, opinions and/or findings contained in this report are those of the author(s) and should not be construed as an official Department of the Army position, policy or decision unless so designated by other documentation.

Welcome message from author
This document is posted to help you gain knowledge. Please leave a comment to let me know what you think about it! Share it to your friends and learn new things together.
Transcript

AWARD NUMBER: W81XWH-12-1-0607
TITLE: Emotion Regulation Training for Treating Warfighters with Combat-Related PTSD Using Real-Time fMRI and EEG-Assisted Neurofeedback
PRINCIPAL INVESTIGATOR: Jerzy Bodurka
CONTRACTING ORGANIZATION: Laureate Institute for Brain Research Tulsa, OK 74137
REPORT DATE: October 2016
TYPE OF REPORT: Annual
PREPARED FOR: U.S. Army Medical Research and Materiel Command Fort Detrick, Maryland 21702-5012
DISTRIBUTION STATEMENT: Approvced for public release; Distribution Unlimited
The views, opinions and/or findings contained in this report are those of the author(s) and should not be construed as an official Department of the Army position, policy or decision unless so designated by other documentation.

REPORT DOCUMENTATION PAGE Form Approved
OMB No. 0704-0188 Public reporting burden for this collection of information is estimated to average 1 hour per response, including the time for reviewing instructions, searching existing data sources, gathering and maintaining the data needed, and completing and reviewing this collection of information. Send comments
regarding this burden estimate or any other aspect of this collection of information, including suggestions for reducing this burden to Department of
Defense, Washington Headquarters Services, Directorate for Information Operations and Reports (0704-0188), 1215 Jefferson Davis Highway, Suite 1204,
Arlington, VA 22202-4302. Respondents should be aware that notwithstanding any other provision of law, no person shall be subject to any penalty for
failing to comply with a collection of information if it does not display a currently valid OMB control number. PLEASE DO NOT RETURN YOUR FORM TO THE ABOVE
ADDRESS.
1. REPORT DATE
October 2016 2. REPORT TYPE
Annual
3. DATES COVERED
30 Sep 2015 - 29 Sep 2016 4. TITLE AND SUBTITLE
Emotion Regulation Training for Treating Warfighters with Combat- Related PTSD Using Real-Time fMRI and EEG-Assisted Neurofeedback
5a. CONTRACT NUMBER
W81XWH-12-1-0607
5b. GRANT NUMBER
PT110256 5c. PROGRAM ELEMENT
NUMBER
6. AUTHOR(S)
Jerzy Bodurka E-Mail: [email protected]
5d. PROJECT NUMBER
5e. TASK NUMBER
5f. WORK UNIT NUMBER
7. PERFORMING ORGANIZATION NAME(S) AND ADDRESS(ES)
Laureate Institute for Brain Research 6655 S. Yale Ave, Tulsa, OK 74137
8. PERFORMING ORGANIZATION REPORT NUMBER
9. SPONSORING / MONITORING AGENCY NAME(S) AND ADDRESS(ES)
U.S. Army Medical Research and Materiel Command Fort Detrick, Maryland 21702-5012
10. SPONSOR/MONITOR’S ACRONYM(S)
11. SPONSOR/MONITOR’S REPORT
NUMBER(S)
12. DISTRIBUTION / AVAILABILITY STATEMENT
Approved for Public Release; Distribution Unlimited
13. SUPPLEMENTARY NOTES
14. ABSTRACT
PTSD is a chronic and disabling condition. Neurocircuitry-based models of PTSD emphasize dysregulation of the amygdala, which is involved in the regulation of PTSD-relevant emotions. We are utilizing real-time functional magnetic resonance imaging neurofeedback (rtfMRI-nf) training with concurrent electroencephalography (EEG) recordings to directly target and modulate the emotion regulation neurocircuit. By using multimodal data, we can determine which EEG signals/leads or their combination specifically predicts or correlates with clinical improvement associated with the rtfMRI-nf training. Difficult recruitment is the main reason behind the delayed study schedule (currently 2nd year no cost extension). During year 4 of the project we have improved our recruitment, finished rtfMRI-nf and EEG data collection, and started EEG-only data collection. Data analysis indicates amygdala training with concurrent EEG recordings in a combat-related PTSD population is feasible, tolerated well and this procedure resulted in improvements in PTSD symptoms. We identified the variations in frontal upper alpha EEG asymmetry (FEA) during the rtfMRI-nf amygdala training as a promising measure of PTSD severity and treatment response. We are employing this measure together with our already developed stand-alone EEG-only neurofeedback training protocol to evaluate FEA EEG-nf training feasibility in combat-related PTSD.
15. SUBJECT TERMS
PTSD; amygdala; fMRI; EEG; real-time fMRI neurofeedback; simultaneous EEG-fMRI; emotion regulation
16. SECURITY CLASSIFICATION OF:
17. LIMITATION OF ABSTRACT
18. NUMBER OF PAGES 28
19a. NAME OF RESPONSIBLE PERSON
USAMRMC
a. REPORT
U b. ABSTRACT
U c. THIS PAGE
U
UU
36
19b. TELEPHONE NUMBER
2

3
Table of Contents
Page
1. Introduction 4
2. Keywords 4
3. Overall Project Summary 5
4. Key Research Accomplishments 28
5. Conclusion 28
6. Publications, Abstracts, and Presentations 30
7. Inventions, Patents and Licenses 32
8. Reportable Outcomes 32
9. Other Achievements 33
10. References 34
11. Appendices 36

4
1. INTRODUCTION: Narrative that briefly (one paragraph) describes the subject, purpose
and scope of the research.
Our main objective is to determine whether rtfMRI- and rtEEG-assisted neurofeedback
emotion regulation training protocols can reduce the symptoms of combat-related post-traumatic
stress disorder (PTSD), a chronic and disabling psychiatric condition. Individuals with PTSD
suffer from the dysregulation of several types of emotion, including fear, anxiety, anger, and
depression [1–4]. Neurocircuit models of PTSD emphasize the role of the amygdala and its
reciprocal interactions with the ventromedial prefrontal cortex (vmPFC) [5–9]. To advance
understanding of the treatment of combat-related PTSD, the current state-of-the-art research aims
to test ways to modulate the functions of the emotion circuit implicated in PTSD. We utilize the
recent advances in real-time functional magnetic resonance imaging neurofeedback (rtfMRI-nf)
to directly target and modulate amygdala activity [10–11]. This technique measures neuronal
activity with sufficiently high temporal resolution that information from the amygdala is
immediately available to form a feedback loop. In parallel with rtfMRI-nf, we obtain
simultaneous measurement of electroencephalography (EEG) signals, which directly reflect brain
activity in the cerebral cortex [12]. By using the multimodal imaging data we can determine
which EEG signals/leads or their combination specifically predict or correlate with clinical
improvement that has been associated with the rtfMRI-nf training [11,13–16]. This knowledge
will enable us to establish a translational path toward the development of stand-alone real-time
EEG neurofeedback (rtEEG-nf) training for emotion regulation, which can facilitate the
widespread implementation of the treatment approach due to the high portability and relatively
low cost of EEG systems.
2. KEYWORDS: Provide a brief list of keywords (limit to 20 words).
Combat-related PTSD, fMRI, EEG, emotions, amygdala, neurofeedback
5
3. OVERALL PROJECT SUMMARY: Summarize the progress during appropriate
reporting period (single annual or comprehensive final). This section of the report shall be
in direct alignment with respect to each task outlined in the approved SOW in a summary
of Current Objectives, and a summary of Results, Progress and Accomplishments with
Discussion. Key methodology used during the reporting period, including a description of
any changes to originally proposed methods, shall be summarized. Data supporting
research conclusions, in the form of figures and/or tables, shall be embedded in the text,
appended, or referenced to appended manuscripts. Actual or anticipated problems or
delays and actions or plans to resolve them shall be included. Additionally, any changes in
approach and reasons for these changes shall be reported. Any change that is
substantially different from the original approved SOW (e.g., new or modified tasks,
objectives, experiments, etc.) requires review by the Grants Officer’s Representative
and final approval by USAMRAA Grants Officer through an award modification
prior to initiating any changes.
Difficult and challenging recruitment is the main reason behind the study delay schedule
by approximately two years. We therefore requested on August 2, 2016 a second twelve-month,
no-cost extension (beyond the original project completion date of Sep 29, 2015), which was
approved. During the fourth year of the project period we have completed Phase 1 of the study
(i.e., real-time fMRI neurofeedback [rtfMRI-nf] and EEG data collection) targeting Aim #1:
Establish rtfMRI-nf training feasibility with concurrent EEG recordings in a combat-related
PTSD population. We have already met and exceeded project Milestone #2: fMRI/EEG data
collection of 8 subjects per group (control: veterans with no PTSD; neurofeedback, sham:
veterans with PTSD). Preliminary data analysis indicates (as described below) rtfMRI-nf
amygdala training with concurrent EEG recordings in a combat-related PTSD population is
feasible. In parallel we have also developed the rtfMRI-nf and rtEEG-nf software (Milestone #3)
for the purpose of Aim #2: Develop a stand-alone rtEEG neurofeedback training protocol for
PTSD. We identified the variations in frontal upper alpha EEG asymmetry during the rtfMRI-nf
amygdala training as a promising measure of PTSD severity and treatment response. This EEG
signal feature is suitable for developing a stand-alone EEG neurofeedback training protocol
(Milestone #4). We have finished preparation and begun data collection for Phase 3 of the
project and Aim #3: EEG-only neurofeedback training feasibility in combat-related PTSD. The
Phase 3 subject visit schedule is shown in Figure 1 below.
6
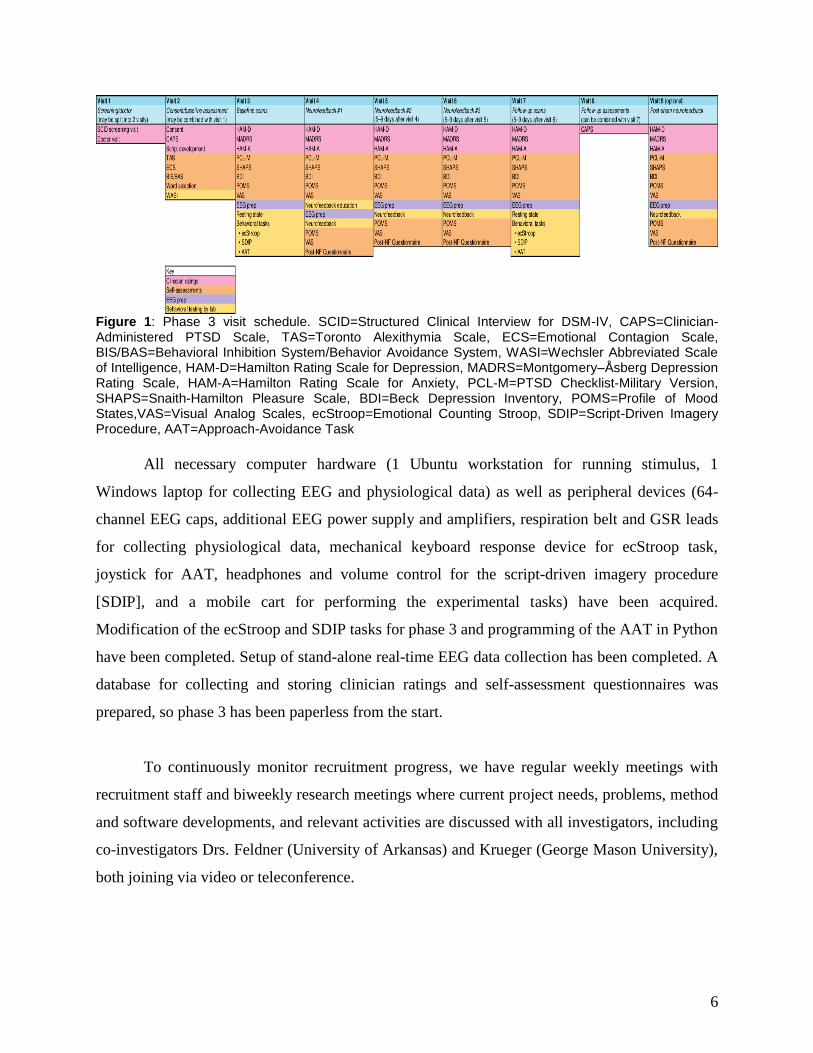
Figure 1: Phase 3 visit schedule. SCID=Structured Clinical Interview for DSM-IV, CAPS=Clinician-Administered PTSD Scale, TAS=Toronto Alexithymia Scale, ECS=Emotional Contagion Scale, BIS/BAS=Behavioral Inhibition System/Behavior Avoidance System, WASI=Wechsler Abbreviated Scale of Intelligence, HAM-D=Hamilton Rating Scale for Depression, MADRS=Montgomery–Åsberg Depression Rating Scale, HAM-A=Hamilton Rating Scale for Anxiety, PCL-M=PTSD Checklist-Military Version, SHAPS=Snaith-Hamilton Pleasure Scale, BDI=Beck Depression Inventory, POMS=Profile of Mood States,VAS=Visual Analog Scales, ecStroop=Emotional Counting Stroop, SDIP=Script-Driven Imagery Procedure, AAT=Approach-Avoidance Task
All necessary computer hardware (1 Ubuntu workstation for running stimulus, 1
Windows laptop for collecting EEG and physiological data) as well as peripheral devices (64-
channel EEG caps, additional EEG power supply and amplifiers, respiration belt and GSR leads
for collecting physiological data, mechanical keyboard response device for ecStroop task,
joystick for AAT, headphones and volume control for the script-driven imagery procedure
[SDIP], and a mobile cart for performing the experimental tasks) have been acquired.
Modification of the ecStroop and SDIP tasks for phase 3 and programming of the AAT in Python
have been completed. Setup of stand-alone real-time EEG data collection has been completed. A
database for collecting and storing clinician ratings and self-assessment questionnaires was
prepared, so phase 3 has been paperless from the start.
To continuously monitor recruitment progress, we have regular weekly meetings with
recruitment staff and biweekly research meetings where current project needs, problems, method
and software developments, and relevant activities are discussed with all investigators, including
co-investigators Drs. Feldner (University of Arkansas) and Krueger (George Mason University),
both joining via video or teleconference.

7
Preliminary and ongoing data analysis
Now that we have completed data collection for Phase 1 of the study, we continue to
advance efficient data processing pipelines and conduct preliminary data analysis for Aim #1,
which includes the following: (A) to validate whether veterans with PTSD are able to tolerate
well and use rtfMRI-nf training to enhance their control of the hemodynamic response of the
amygdala, and to further asses specificity of this training; (B) to evaluate possible sustained
neuroplastic changes induced by the procedure; and for Aim #2; (C) to perform EEG coherence
analysis to further investigate EEG correlates of the rtfMRI-nf procedure; (D) to investigate
connection between frontal EEG asymmetry (identified a single EEG feature that is suitable for
developed the stand-alone rtEEG-nf training protocol, Phase 2) and BOLD activity during the
rtfMRI-nf training in PTSD; and (E) to conduct the EEG exploratory analysis focusing on
temporally independent EEG microstates.
A) rtfMRI-nf amygdala emotional training.
Introduction: We have assessed whether veterans with PTSD and trauma exposed veteran
controls are able to tolerate well and use rtfMRI-nf emotional training during happy memories
recall to enhance their control of the hemodynamic amygdala response.
Methods: The updated analyses were conducted on the 25 veterans in the left amygdala (LA)
feedback experimental group (EG), 11 in the control feedback (HIPS) group (CG), and 20 in the
healthy (trauma control) group (TC) (Fig. A1). These analyses include results from only the first
rtfMRI-nf visit.
All subjects were male, age 18–55, right-handed U.S. military combat veterans. No significant
baseline differences were observed in age, PTSD symptom severity, or depression symptom
severity between EG and CG. There was significant different in PTSD and depression symptom
severity, but not age, between TC and EG/CG (Table A1).

8
Experimental (EG)
Control (CG)
Trauma Control (TC)
n 25 11 20
Age 31 (6) 34 (9) 34 (9)
Initial CAPS 53 (15) 57 (25) 5(5)*
Initial HRSD 15 (4) 17 (8) 3(4)*
Table A1. Demographic information for experimental (EG), control (CG), and trauma-exposed
healthy (TC) groups. CAPS = Clinician Administered PTSD Scale. HRSD = 21-Item Hamilton
Rating Scale for Depression. Numbers in parentheses indicate standard deviation. * indicates
significant difference (p<0.05) from EG/CG on an independent samples t-test
Results: ROI analysis. A GLM analysis for each of the three visits was performed to determine
the training effect of the neurofeedback procedure [1]. The analyses were implemented in AFNI
and SciPy. Pre-processing included our in-house developed EEG-assisted retrospective motion
correction (EREMCOR) [2], white matter regression, volume registration, and slice timing
correction. Standard GLM analysis was then applied separately for each of the five
neurofeedback runs of each of the first visit including the following regressors: two block
stimulus conditions (Happy Memories, Count), six motion parameters, and five polynomial
terms. After deconvolution, percent signal change for Happy vs. Rest conditions was calculated.
In preparation for the whole-brain statistical group analysis, the spatially-normalized fMRI
percent signal change maps were spatially smoothed using a Gaussian kernel with full width at
half maximum (FWHM) of 5 mm. One-sample t-tests were performed separately for each run
and for each group to determine whether activation was significant.

9
Figure A2. Mean percent signal change between Happy and Rest conditions for each of the
neurofeedback runs. LA = left amygdala, RA = right amygdala, HIPS = left horizontal segment
of the intraparietal sulcus, PR = practice, R1–3 = training runs 1–3, TR = transfer. EG =
experimental group, CG = control group, TC = trauma-exposed healthy control group.
ROI analysis results are shown below in Figure A2. Each row of graphs represents results
from one of the three subject groups. Each bar shows results for one of three ROIs: left amygdala
(target ROI for the EG and TC), right amygdala (shown to explore the effects of laterality), and
left HIPS (target ROI for the control group). In each graph, bar height represents mean percent
signal change between Happy and Rest conditions for a single run.
10
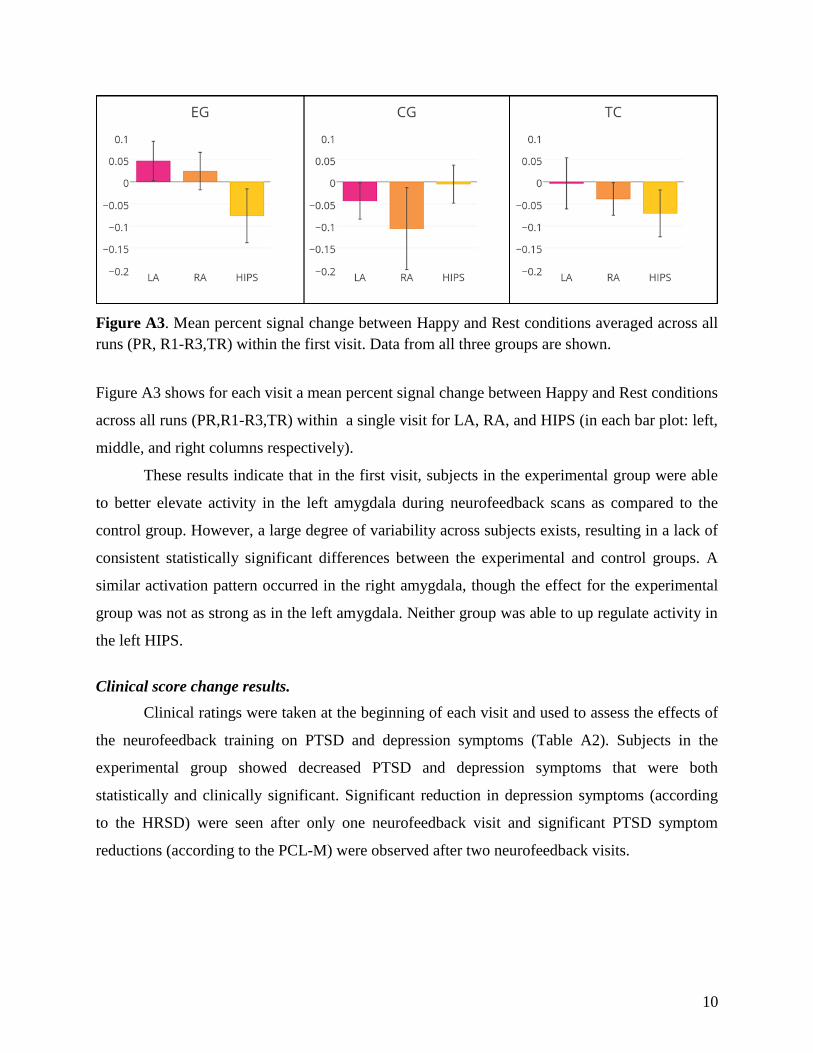
Figure A3. Mean percent signal change between Happy and Rest conditions averaged across all
runs (PR, R1-R3,TR) within the first visit. Data from all three groups are shown.
Figure A3 shows for each visit a mean percent signal change between Happy and Rest conditions
across all runs (PR,R1-R3,TR) within a single visit for LA, RA, and HIPS (in each bar plot: left,
middle, and right columns respectively).
These results indicate that in the first visit, subjects in the experimental group were able
to better elevate activity in the left amygdala during neurofeedback scans as compared to the
control group. However, a large degree of variability across subjects exists, resulting in a lack of
consistent statistically significant differences between the experimental and control groups. A
similar activation pattern occurred in the right amygdala, though the effect for the experimental
group was not as strong as in the left amygdala. Neither group was able to up regulate activity in
the left HIPS.
Clinical score change results.
Clinical ratings were taken at the beginning of each visit and used to assess the effects of
the neurofeedback training on PTSD and depression symptoms (Table A2). Subjects in the
experimental group showed decreased PTSD and depression symptoms that were both
statistically and clinically significant. Significant reduction in depression symptoms (according
to the HRSD) were seen after only one neurofeedback visit and significant PTSD symptom
reductions (according to the PCL-M) were observed after two neurofeedback visits.

11
Experimental Group Control Group Trauma-Exposed Healthy
Scale Initial
score
Mean
change t
Initial
score
Mean
change t
Initial
score
Mean
change t
CAPS 54 −14** t(15)=3.8 62 −9 t(7)=1.7 4 −1 t(15)=0.5
PCL-M 46 −9** t(18)=4.3 52 −9 t(8)=2.1 19 0 t(16)=−0.2
HRSD 17 −6** t(19)=4.9 17 −6* t(8)=2.7 2 +1 t(16)=−0.7
MADRS 21 −8** t(20)=4.1 19 −6 t(8)=1.4 1 +2 t(15)=−0.7
HRSA 17 −5** t(20)=4.4 19 −5* t(8)=2.4 2 +1 t(16)=−0.6
Table A2. Clinical score change results for experimental, control, and trauma-exposed healthy
groups. CAPS = Clinician Administered PTSD Scale (0–136). PCL-M = PTSD Checklist –
Military Version (17–85). HRSD = 21-Item Hamilton Rating Scale for Depression (0–52).
MADRS = Montgomery–Åsberg Depression Rating Scale (0–60). HARS = Hamilton Anxiety Rating
Scale (0–56). Initial ratings taken before first neurofeedback scan. Final ratings taken at final
Stroop scan (after 3rd neurofeedback scan). A significant change from pre- to post-scan ratings
(paired t-test) at p < 0.05 marked with *, and at p < 0.01 marked with **.
Discussion: We have observed a large degree of individual variability across subjects during
rtfMRI-nf amygdala emotional training, resulting in a lack of consistent statistically significant
differences between the experimental and control groups. A similar activation pattern occurred in
the right amygdala, though the effect for the experimental group was not as strong as in the left
amygdala. Neither group was able to up regulate activity in the left HIPS. The rtfMRI-nf
amygdala emotional training is feasible in veterans with combat related PTSD, all study
participants tolerate this procedure well. Importantly only in active group, we have observed
larger improvements in CAPS and PCL-M symptoms scores that were statistically and clinically
significant.
References: [1] Zotev et al., Self-regulation of amygdala activation using real-time fMRI neurofeedback. PLoS ONE 2011 6(9), e24522.
[2] Wong CK, et al., Automatic EEG-assisted retrospective motion correction for fMRI (aE-REMCOR) Neuroimage 2016
129:133-147
12
B) Whole brain exploratory analysis of altered resting-state fMRI connectivity for combat-
veterans with and without PTSD and rtfMRI-nf amygdala training effect on abnormal
connectivity.
Introduction: We have explored altered resting-state functional connectivity for combat
veterans with and without PTSD compared to non-trauma-exposed healthy control subjects. We
employed multivariate distance-based matrix regression (MDMR) analysis [1] to perform an
unbiased search of whole-brain voxel-by-voxel connectivity (connectome-wide association
study). We aimed to identify altered connectivity in combat veterans and then to examine
changes of identified abnormalities after the rtfMRI-nf training.
Methods: Participants. Thirty-nine male combat veterans with PTSD and 22 male combat
veterans without PTSD (veteran control, VC) participated in the resting-state fMRI scan before
the rtfMRI-nf training sessions. Resting-state fMRI data of 28 age-matched non trauma-exposed
healthy males participated in other study were used as control (non-trauma controls, NC). After a
careful data inspection, we found that several resting-state data for PTSD and VC groups
suffered from significantly large head motion compared to NC group. To address this problem
we excluded four PTSD and four VC subjects from the analysis. Within veteran subjects, 27
PTSDs and 13 VCs completed all the rtfMRI-nf training sessions and the post-training resting-
state scan. All VCs and 20 PTSDs received amygdala (active) neurofeedback and seven PTSDs
received HIPS (sham control) neurofeedback in the rtfMRI-nf training. We had to exclude five
PTSDs (4 active and 1 sham control) and two VCs resting-state data from the analysis due to
severe head motion. In summary, 35 PTSD, 18 VC, and 28 NC subjects were analyzed for pre-
training connectivity investigation, and 16, 6, and 11 subjects of PTSD active, PTSD sham, and
VC active, respectively, were analyzed for post-training connectivity investigation.
MRI/fMRI preprocessing; Physiological noise reduction with RETROICOR/RVT, slice-timing
and motion correction, nonlinear warping to the MNI template brain, spatial smoothing (4mm3
FWHM), and scaling to percent change were applied to resting-state fMRI data. Noises in signal
time-course were removed by regressing out three principal components of ventricle signal, local
white matter average signal (ANATICOR), motion parameters, low-frequency fluctuation
(polynomial model) from the signal time course, and censoring volumes with large head motion.

13
MDMR analysis overview; For each subject: a) down-sampled fMRI images to 4mm3 voxels; b)
extracted voxels in gray matter region; c) calculated correlation of signal time courses for each
voxel to all other brain voxels and applied Fisher Z-transform to make a connectivity map for
each voxel; d) calculated Euclid distance between connectivity maps of the subjects to make a
distance matrix; and e) applied nonparametric MANCOVA for the distance matrix. P value was
evaluated by a 10,000 repetition permutation test. These steps were repeated for all voxels as a
seed to make a statistical parametric map.
Results: Abnormal functional connectivity in PTSD and VC before the rtfMRI-nf training;
Figure B1 shows the
regions with significant
main effect of group
difference between
PTSD, VC, and NC
groups in MDMR
analysis. These regions
were used as a seed for
the post-hoc analysis
that investigated which functional
connectivity was significantly
altered between groups in detail.
Post-hoc analysis indicated that
PTSD compared to NC had
increased connectivity across
sensory motor regions including the
precentral gyrus, the intraparietal
region, and the precuneus region
(Fig. B2a). PTSD also showed
increased connectivity between the
superior temporal sulcus (STS) and
Figure B1: F-value map for the main effect of PTSD, VC, and NC groups in MDMR analysis (P<0.005 with cluster size P<0.05 by permutation test).
Figure B2: Altered resting-state functional connectivity between PTSD and NC (a,b), and between VC and NC (c).

14
the default model network (DMN) regions compared to NC (Fig. B2b). VC subjects compared to
NC showed altered connectivity from the bilateral posterior insula (Fig. B2c). No significant
difference was seen between PTSD and VC groups.
Effects of rtfMRI-nf training on the altered functional connectivity: All the abnormal
functional connectivity identified in the previous analysis showed significant change to
normalize the connectivity after the rtfMRI-nf training. Hyperconnectivity in sensory motor
areas and the STS to the DMN regions for PTSD were reduced after the training (Fig. B3a).
While the effect was seen for both PTSD active and PTSD sham groups, active group showed
more significant reduction (P=0.001) than sham group (P=0.039). Importantly only the PTSD
active group showed significant reduction of PTSD symptoms measured by PCL-M after the
training (P=0.005). Examining subscores of PTSD symptoms revealed that training effect was
significant for ‘avoidance and numbing’ symptoms (P=0.005) for PTSD active group. Abnormal
connectivity in VC also normalized after the training (Fig. B3b) while no symptom change was
observed.
Discussion: PTSD subjects had higher connectivity across sensory motor areas, which could be
associated with hyperarousal symptom in PTSD. Connectivity between the right superior
temporal region and the default mode network regions also increased in PTSD, which might be
associated with dissociation symptom in PTSD. It has been indicated that abnormal activity in
the superior temporal region is associated with dissociation symptom in PTSD[2] and the default
mode network is related to introspective thinking[3]. The abnormal connectivity in these regions,
therefore, might indicate abnormality of self-recognition in PTSD. VC subjects also showed
Figure B3: rtfMRI-nf training effect on abnormal resting-state functional connectivity. STS-DMN connectivity where PTSD had hyperconnectivity before the training was reduced after the training (a). Hyperconnectivity to the right insula in VC was also normalized after the training. P values indicate the significance of difference between pre- and post-session (corrected for multiple comparisons).

15
altered connectivity in the bilateral posterior insula. Although VC subjects showed no PTSD
symptoms, combat experience might leave some effect on brain functional connectivity. These
abnormal connectivities were normalized after the rtfMRI-nf training. As the effect was seen
both for active and sham feedback groups, the training experience itself could have positive
effect on PTSD. Active feedback group, however, showed a more pronounced training effect
than sham group, which indicates that the neurofeedback helped to enhance the positive effect of
the training.
References: [1] Shehzad Z, et al. (2014): A multivariate distance-based analytic framework for connectome-wide association studies.
Neuroimage. 93 Pt 1:74-94.
[2] Lanius RA, et al. (2006): A review of neuroimaging studies in PTSD: heterogeneity of response to symptom provocation.
Journal of Psychiatric Research. 40:709-729.
[3] Hamilton JP, et al. (2015): Depressive Rumination, the Default-Mode Network, and the Dark Matter of Clinical
Neuroscience. Biol Psychiatry. 78(4):224-30.
C) EEG coherence enhancement during the rtfMRI-nf training in PTSD veterans
Introduction: We investigate EEG correlates of the rtfMRI-nf amygdala emotional training
procedure by conducting analyses of EEG coherence, which is an EEG measure of functional
connectivity. We hypothesized that EEG coherence during the rtfMRI-nf task would increase
across the rtfMRI-nf runs. We observed that the enhancement in EEG coherence among the left
fronto-temporal EEG channels significantly and positively correlated with the participants’
PTSD severity ratings (CAPS).
Methods: The EEG coherence analysis was conducted for the EEG data, acquired during fMRI,
after careful pre-processing and artifact removal using ICA. The EEG coherence was computed
in Brain Vision Analyzer 2 as the ratio of cross-spectrum and auto-spectrum. The coherence
values were averaged for an individual upper-alpha EEG band [IAF...IAF+2] Hz as in [1].

16
The EEG coherence slope (ECS) was defined as a slope of a linear trend in EEG coherence
difference between the Happy and Rest conditions across the four rtfMRI-nf runs (Fig. C1A).
Results: The average ECS values for the left fronto-temporal EEG channel pairs during the 1st
rtfMRI-nf session exhibited significant positive correlations with the initial CAPS ratings (Fig.
C1B,C,D). Correlations for the right fronto-temporal EEG channel pairs were not significant
(Fig. C1B,E). The average ECS laterality also significantly correlated with the CAPS ratings
(Fig. C1F). Similar effects were observed for the 3rd rtfMRI-nf session: the average ECS values
for the left fronto-temporal channel pairs showed significant correlations with the final CAPS
(Fig. C2).
Figure C1. EEG coherence enhancement during the 1st rtfMRI-nf session. A) Definition
of the EEG coherence slope (ECS) for a pair of EEG channels across four rtfMRI-nf runs.
B) EEG channel pairs that exhibited positive correlations (p<0.01, uncorr) between the
ECS and the initial CAPS ratings. C) Illustration of such correlation for one channel pair.
D) ECS(L) is the average ECS among fronto-temporal channels Fp1, F3, F7, FC5, T7 on
the left. E) ECS(R) is the average ECS among the corresponding channels Fp2, F4, F8,
FC6, T8 on the right. F) Correlation between the average ECS laterality and the initial
CAPS ratings. See [1].

17
Discussion: Our results demonstrated that variations in EEG coherence during the rtfMRI-nf
procedure are sensitive to severity of PTSD symptoms. The enhancement in EEG coherence
among the left fronto-temporal EEG channels can be interpreted as an indication of enhancement
in approach motivation [1]. The significant positive correlation between the ECS(L) and CAPS
(Figs. C1D, C2D) suggests that the rtfMRI-nf procedure may be able to correct the approach
motivation deficiencies specific to PTSD. The lack of significant inverse correlation between the
ECS(R) and CAPS (Figs. C1E, C2E) suggests that the avoidance motivation might not be
reduced. Nevertheless, the significant positive correlation between the average ECS laterality
and CAPS (Figs. C1F, C2F) suggests that the overall motivational changes are positive and
beneficial to PTSD patients. Similar results were previously observed for MDD patients [1].
References: [1] Zotev V., et al, Correlation between amygdala BOLD activity and frontal EEG asymmetry during real-time fMRI
neurofeedback training in patients with depression NeuroImage:Clinical 11 (2016) 224-238.
Figure 2. EEG coherence enhancement during the 3rd
rtfMRI-nf session. Notations are the
same as in Fig. 1. The ECS results are compared with the final CAPS ratings.

18
D) Correlation between amygdala BOLD activity and frontal EEG asymmetry in PTSD
Introduction: We investigate connection between frontal EEG asymmetry and BOLD activity
during the rtfMRI-nf training in PTSD by performing EEG-fMRI correlation analysis. We
hypothesized that temporal correlation between frontal EEG asymmetry and BOLD activity of
the amygdala would be enhanced during the rtfMRI-nf task compared to a control task. Our
analysis confirmed this hypothesis and provided new insights into functional deficiencies in
PTSD.
Methods: The EEG-fMRI
correlation analysis was performed
as described in detail in [Ref1].
Frontal EEG asymmetry was
defined as either
ln(P(F4))−ln(P(F3)) or
ln(P(F8))−ln(P(F7)), where P is
EEG power in the upper alpha
band. The time course of frontal
EEG asymmetry was used to
define two terms for the
psychophysiological interaction (PPI) analysis: correlation and interaction. The [EEG-
asymmetry-based regressor] × [Happy−Count] interaction term described the difference in
temporal correlations of the frontal EEG asymmetry (convolved with the HRF) and BOLD
activity between the Happy and Count conditions. The PPI analysis was conducted within the
GLM framework for all brain voxels [1].
Results: The PPI interaction effect for the frontal EEG asymmetry ln(P(F4))−ln(P(F3)),
averaged within the LA ROI (Fig. D1A), was positive and significant for the last rtfMRI-nf run
(R3) and exhibited a significant linear trend across the nf runs. This means that temporal
correlation between the frontal EEG asymmetry and the LA BOLD activity was significantly
enhanced during the Happy condition with rtfMRI-nf compared to the Count condition. Similar
PPI effects were observed for the ln(P(F8))−ln(P(F7)) asymmetry (Fig. D1B).
Figure D1. Enhancement in temporal correlation between frontal EEG
asymmetry and BOLD activity of the left amygdala (LA) during the
rtfMRI-nf training. A) Average PPI coefficients for the LA ROI
corresponding to frontal EEG asymmetry ln(P(F4))−ln(P(F3)). B)
Average PPI coefficients corresponding to frontal EEG asymmetry
ln(P(F8))−ln(P(F7)). See [1].
19
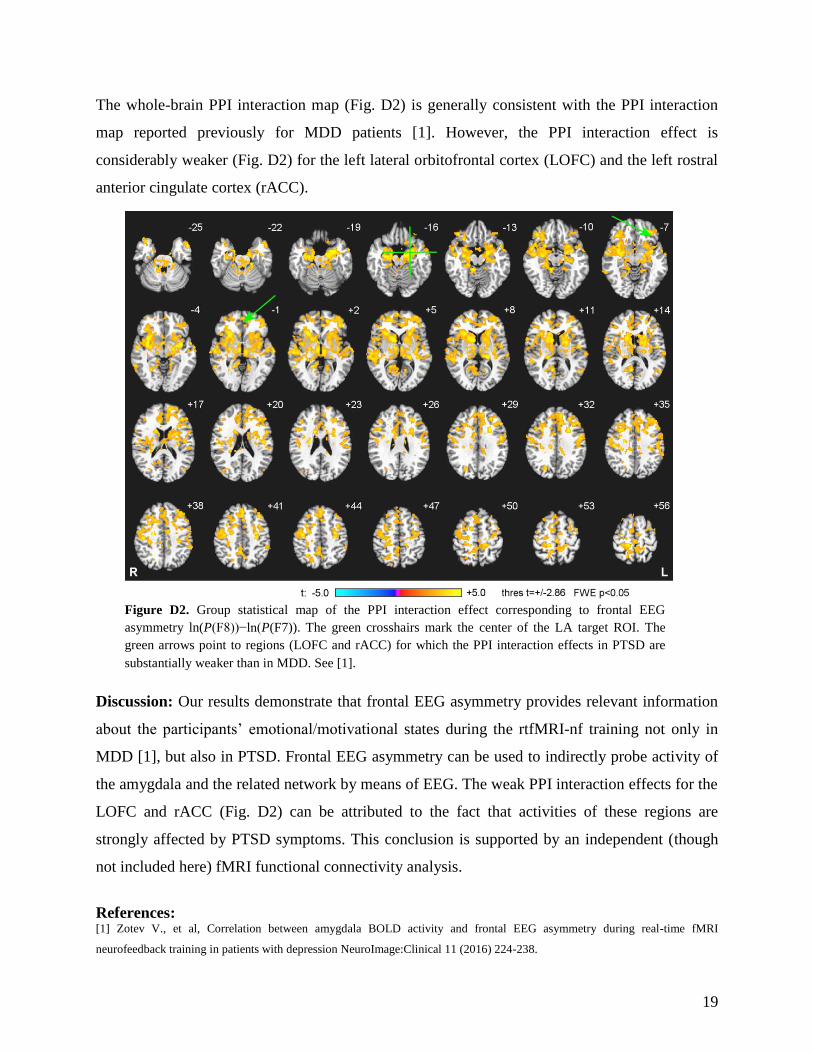
The whole-brain PPI interaction map (Fig. D2) is generally consistent with the PPI interaction
map reported previously for MDD patients [1]. However, the PPI interaction effect is
considerably weaker (Fig. D2) for the left lateral orbitofrontal cortex (LOFC) and the left rostral
anterior cingulate cortex (rACC).
Discussion: Our results demonstrate that frontal EEG asymmetry provides relevant information
about the participants’ emotional/motivational states during the rtfMRI-nf training not only in
MDD [1], but also in PTSD. Frontal EEG asymmetry can be used to indirectly probe activity of
the amygdala and the related network by means of EEG. The weak PPI interaction effects for the
LOFC and rACC (Fig. D2) can be attributed to the fact that activities of these regions are
strongly affected by PTSD symptoms. This conclusion is supported by an independent (though
not included here) fMRI functional connectivity analysis.
References: [1] Zotev V., et al, Correlation between amygdala BOLD activity and frontal EEG asymmetry during real-time fMRI
neurofeedback training in patients with depression NeuroImage:Clinical 11 (2016) 224-238.
Figure D2. Group statistical map of the PPI interaction effect corresponding to frontal EEG
asymmetry ln(P(F8))−ln(P(F7)). The green crosshairs mark the center of the LA target ROI. The
green arrows point to regions (LOFC and rACC) for which the PPI interaction effects in PTSD are
substantially weaker than in MDD. See [1].
20
E) Tracking Resting State Connectivity Dynamics in Veterans with PTSD
Introduction: In PTSD abnormal connectivity of spontaneous activity in several brain regions
constituting the so-called default mode network (DMN) at resting state has been reported [1-3].
However, the mechanisms underlying these brain abnormalities are not fully resolved.
Simultaneous electroencephalography (EEG) and BOLD fMRI have allowed for probing brain
activity with joint high spatial and temporal resolution. Here, we acquired concurrent EEG and
BOLD fMRI in groups of unmedicated veterans with combat-related PTSD and healthy veterans
at rest and developed a novel multimodal analysis approach using temporal independent EEG
microstates [4] to study DMN activity.
Methods: Simultaneous EEG and fMRI data were from 23 veterans with combat-related PTSD
and 19 combat-expose veterans (combat-exposed controls, CEC) with eyes open in a resting
state. BOLD fMRI RSNs were derived from preprocessed imaging data using spatial
independent component analysis (ICA) separately for PTSD and CEC groups. The default mode
network was selected by choosing the best-fit component with a template of the DMN [5]. The
difference between groups was assessed using a two-sample unpaired t test. After correcting the
MRI and cardioballistic artifacts, temporal independent EEG microstates (EEG-ms) were derived
using the method described in [4]. We have identified temporal independent EEG-ms for each
participant, and then obtained CEC and PTSD group results (Fig. E1). The DMN-related EEG-
ms was selected by choosing one EEG-ms of correlated time course with BOLD fMRI DMN.
The complete time courses of DMN-related EEG-ms were obtained by back-projection and
determined via a winner-take-all approach. The occurrence frequency of DMN-related EEG-ms
was calculated per each subject then compared across groups and against the clinical ratings.

21
Results: The demographic and clinical characteristics of all subjects are listed in Table E1.
Table E1.
Participants demographics
and clinical characteristics
PTSD
(n=23)
CEC
(n=19)
Age (Mean ± SD Years) 34±9 32±7
PCL-M(Mean ± SD) *** 43±15 18±3
CAPS(Mean ± SD) *** 54±19 5±5
HARS (Mean ± SD) *** 14±6 3±4
SHAPS(Mean ± SD) *** 30±5 18±2
HDRS (Mean ± SD) *** 14±6 3±4
MADRS (Mean ± SD)*** 17±8 2±4 *** significant difference between groups at p<0.001
Figure E1 shows two sets of ten identified EEG microstates for both HC (upper row), and PTSD
(lower row) groups. Nine out of the ten microstates highly resemble those found in our previous
study in Yuan et al. 2012 [4].
As the dynamics of the temporal independent microstates were reconstructed from EEG time
series, it allows us to examine their signatures at a millisecond time scale. Among these EEG-ms,
three microstates demonstrated distinctive differences in their fast evolving dynamics. EEG-ms
that differ across both patient groups are marked by dashed lines in Fig. E1. The occurring
frequencies of these three microstates are significantly different between HC and PTSD groups.
Fig. E1 EEG microstates identified in HC and PTSD groups. The pairs of microstates in dashed lines (MS1,
M9, and MS10) show distinct features between HC and PTSD groups.
PTSD
HC
MS1 MS9 MS10

22
To further explore the
neuronal substrates of these three
signature microstates, the temporal
dynamics of the microstates were
compared with the time courses of
BOLD signals after convolving with
impulse hemodynamic response
function. Regions where BOLD and
EEG microstate time series are
correlated were identified using a
general linear model.
The default model network (DMN) was identified therefore in correlation with one of the
EEG microstates as shown in Figure E2. Importantly, the occurring frequency of the DMN-
associated EEG microstates shows distinctive temporal dynamics between HC and PTSD groups
(i.e., faster in PTSD subjects).
Moreover, the occurring frequency of such EEG microstates was also linearly related to
the scores of PCL-M across the individuals in the PTSD group, indicating that more severe
Fig. E3 EEG microstates (MS9, left panel, and MS10 right panel) that differ between HC and PTSD groups.
(A) occurring frequency of microstate in HC and PTSD groups (B) MS9 occurring frequency vs. PCL-M
scores (left panel) and MS10 occurrence ratio vs SHAPS (right panel) in PTSD group (C) maps of correlation
between BOLD and microstate time courses.
Fig. E2 EEG microstate MS1 that differ between HC and PTSD groups.
(A) occurring frequency of microstate in HC and PTSD groups (B)
occurring frequency vs. PCL-M scores in PTSD group (C) maps of
correlation between BOLD and MS1 microstate time courses.

23
symptom levels of PTSD are associated with faster dynamics of the DMN network. While
functional MRI was able to pinpoint the anatomical regions of DMN, simultaneous EEG offers
fast temporal dynamics that facilitate relating to the severity of symptoms. Two other microstates
MS9 and MS10, were also found to be associated with distinctive dynamics between PTSD and
HC groups (Fig E3, left and right panels respectively).
Discussion: From the simultaneously acquired EEG-fMRI data we identified temporal
independent EEG microstates. Although EEG-ms temporal dynamics evolve at a much faster
scale (order of milliseconds versus seconds for fMRI), we found an EEG-ms that was correlated
with the fMRI DMN network (MS1) and MS9, and MS10 interestingly identified a similar
insular network including bilateral insula, the cingulate cortex and the medial temporal cortex.
However, the temporal dynamics of MS9 and MS10 (Fig. E3, left and right panels respectively)
show dramatically different characteristics. For MS10, PTSD subjects showed significantly
higher occurring frequency than the control veterans, whereas for microstate MS9, PTSD
subjects showed lower occurring frequency. Furthermore, the dynamics of MS10 did not show
any significant linear trend between the occurring frequency and the level of symptoms (p>0.05
for both PCL-M and SHAPS). On the contrary, the dynamics of MS9 was found to negatively
correlate with SHAPS scores across the individual subjects. The occurrence frequency of MS1
EEG-ms (Fig. E2) statistically differentiates between PTSD and HC group. Importantly, this
EEG-ms occurrence frequency positively correlated with PTSD symptom severity (PCL-M). The
abnormally decreased functional connectivity in PTSD veterans observed by fMRI was
associated with decreased occurrence frequency of DMN-related EEG-ms, which suggests
dynamic relocation of neural processing resources associated with the PTSD condition.
References: [1] Rauch, S. L. (2006), Neurocircuitry models of posttraumatic stress disorder and extinction: human neuroimaging research--
past, present, and future. Biol Psychiatry, vol. 60, pp. 376-82.
[2] Bruce, S.E., (2012), Altered emotional interference processing in the amygdala and insula in women with Post-Traumatic
Stress Disorder Neuroimage Clin, vol. 2, pp. 43-49.
[3] Yan, X., (2014), Psychiatry Res, pii: S0925-4927(14)00328-X.
[4] Yuan, H. (2012), Spatiotemporal dynamics of the brain at rest – exploring EEG microstates as electrophysiological signatures
of BOLD resting state networks Neuroimage, vol. 60, no. 4, pp. 2062-2072.
[5] Laird, A.R. Investigating the functional heterogeneity of the default mode network using coordinate-based meta-analytic
modeling (2009), J Neurosci, vol. 29, no. 46, pp. 14496-14505.
24
Summary of preliminary data analyses
Taken together, preliminary analyses of our rtfMRI-nf amygdala training results
demonstrate feasibility of the rtfMRI-nf amygdala training procedure. All study participants
tolerate this procedure well. We have observed large individual variability in learning ability to
control left amygdala hemodynamic activity during rtfMRI-nf procedure. However, data
suggests that veterans with PTSD can learn to self-regulate their amygdala BOLD responses
during recall of positive autobiographical memories (i.e., confirmation of Aim #1). Notably,
rtfMRI-nf training of the left amygdala resulted in statistically and clinical significant
improvements in PTSD (CAPS, PCL-M) and depression symptoms (HRSD). Significant
reduction in PTSD and depression symptoms were seen in veterans with PTSD in the
experimental group but not in controls.
Functional connectivity analysis of the amygdala during the neurofeedback procedures
revealed substantial differences between the experimental (feedback from LA) and control
groups (feedback from HIPS), proving additional evidence of a specific neuromodulatory effect
induced by the LA neurofeedback procedure during positive memory recall. Brain regions co-
activated with the LA feedback procedure (forming an amygdala-related network) were
consistent with the broader literature regarding the amygdala-related neural network involved in
emotion processing. We found that veterans with PTSD had higher connectivity across motor
areas, which could associate with hyperarousal symptom. In addition, we found
hyperconnectivity between the right superior temporal region and default mode network regions,
which could associate with dissociation symptom in PTSD, indicating abnormalities in self-
referential in PTSD. Interestingly, we also found in trauma-exposed veterans without PTSD
diagnosis altered connectivity in bilateral posterior insula, suggesting that military training
and/or combat experience might affect brain connectivity. Notably, these abnormal
connectivities were normalized after rtfMRI-nf amygdala training, although we did not see
statistically significant difference between active and control/sham condition. Lack of
statistically significant difference between active and control/sham condition is likely due to
large individual subject variability, exclusion due to head motions, and simply the use of all
available PTSD subjects without any classification (i.e. responders vs non-responders to rtfMRI-
nf procedure, our currently ongoing classification efforts). Nevertheless, the active feedback

25
group showed more pronounced training effect then control/sham group, which indicates that the
rtfMRI-nf amygdala emotional training is beneficial to veterans with PTSD.
Ongoing analysis of the concurrently acquired EEG data during rtfMRI-nf revealed that
modulation of BOLD LA activity during the neurofeedback procedure was accompanied by
changes in frontal EEG asymmetry (FEA) in the upper alpha band (power(F4)-power(F3)
electrodes). The direction of change in the FEA (e.g., more positive FEA) induced by the
rtfMRI-nf LA training was consistent with more approach-oriented responses and traits as well
as more positive emotions. Indeed, we observed that reduction in CAPS ratings was associated
with reduction in the average FEA changes during the rtfMRI-nf task, indicating that variations
in FEA during rtfMRI-nf training might independently provide valuable information about PTSD
severity and treatment response. Those preliminary results identified the FEA as a promising
target for currently ongoing EEG-only neurofeedback training among veterans with combat-
related PTSD (Aim #3).
During the rtfMRI-nf training of the amygdala, EEG coherence among left fronto-
temporal EEG channels in the upper alpha band shows enhancement that significantly correlates
with PTSD severity. Findings demonstrate that variations in EEG coherence during the rtfMRI-
nf procedure are sensitive to severity of PTSD symptoms. Notably, such left-lateralized EEG
coherence enhancement, indicating increased coherent neuronal activity, suggests an increase in
approach motivation, which is more pronounced in patients with more severe PTSD. No
reduction in EEG coherence among right fronto-temporal EEG channels is observed, suggesting
that the employed rtfMRI-nf procedure does not lead to a significant reduction in avoidance
motivation in PTSD. Nevertheless, the significant positive correlation between the average EEG
coherence slope laterality and CAPS suggests that the overall motivational changes are positive
and beneficial to PTSD patients. Similar results were previously observed for MDD patients
[30].
We have identified temporal independent EEG microstates in individuals with combat
related PTSD and found ones that differs between people with PTSD and healthy controls. The
occurrence frequency of the EEG-ms which was associated with BOLD DMN, statistically
differentiates PTSD and HC groups and positively correlates with PTSD symptom severity.
26
Recruitment efforts description
During the fourth year of the grant (October 2015 through September 2016) radio
advertising continued to be our most successful recruitment effort. We ran 15 ads for a total of
1221 ad spots on 4 different radio stations across multiple genres (country, rock, hip-hop, and
contemporary hits) in the Tulsa area. Radio stations were chosen based on previous success as
well as Nielson ratings. Due to the large number of calls we got when running ads on and around
Independence Day we increased the number of advertisements airing during the week of
Veterans Day this year. For one ad run we also were the sponsors of the live read traffic for the
morning and evening commute. In addition to advertisements, LIBR staff members participated
in monthly on-air interviews the hip- hop station, which is the highest rated station for minority
listeners in the Tulsa area according to Arbitron.
This year we also aired a television ad for the study. The advertisement aired on the local
FOX station as well as the local MyNetworkTV station. There were a total of 290 ad spots over
19 days in June. Air times were selected based on TV ratings for male viewers age 18 to 55. In
addition to these media broadcast advertisements, the study was featured on a local news
program in June. The segment was 3 minutes long and aired during the 5 o'clock news on the
Tulsa NBC channel. It featured a veteran who had completed phase 1 of the study and showed
the rtfMRI-nf with simultaneous EEG procedure.
We have also continued running advertisements on Facebook on a quarterly basis. These
advertisements reach up to 200,000 individual accounts and target both male and female users to
maximize the number of both direct and indirect referrals. In addition to these study-specific ads,
general advertisements for LIBR on radio, electronic media, and bus stations also refer veterans
to our study.
We have also continued our community outreach efforts during the last year. LIBR staff
participated in the PURPOSE 2.2 Run/Walk, an event to raise awareness of veteran suicide, on
April 30, 2016. LIBR also promoted the study at a number of events throughout the year,
including the North Tulsa Neighborhood Summit (August 27, 2016) and the Zarrow Symposium
(September 28-30, 2016). We have an on-going monthly relationship with certain medical and
veteran organizations such as the Veterans Initiative, Family and Children Services, Veteran’s
Advisory Council, and Laureate Psychiatric Clinic and Hospital. Each month, our recruitment-
focused staff attended meetings and provided presentations provided study-focused literature to

27
various social workers, mental health counselors, psychologists, and physicians. These
recruitment efforts included meetings and presentations with selected clinicians who work
directly with the target population. We also continued our efforts directly targeting recruiting
patients/potential participants from Family and Children Services monthly and the Laureate
Psychiatric Clinic and Hospital weekly.
As we are now recruiting exclusively for phase 3 of the study, we have rewritten some of
our advertising material to align with the participation criteria for the EEG-only experiments. We
hope that rerecording our radio advertisements may also have the effect of hooking listeners who
grew accustomed to hearing the old ad. Additionally, we went through our database of subjects
who had been excluded from the first phase of the study due to metal in the body or size
restrictions and contacted them about participating in phase 3.
Enrollment information
Between October 1, 2015 and September 30, 2016:
414 veterans contacted LIBR
367 veterans completed phone screens
114 completed initial screening
o 34 found eligible for the current study
10 participants signed the consent for the study
4 participants completed the study
Phase 3:
8 consented to the study
6 completed the 1st scan
4 completed the 2nd scan
4 completed the 3rd scan
4 completed the 4th scan
4 completed the final scan
4 completed the final CAPS
Phase 1:
71 consented to the study
62 completed the 1st scan
57 completed the 2nd scan

28
52 completed the 3rd scan
49 completed the 4th scan
47 completed the final scan
37 completed the final CAPS
In the upcoming months, recruitment will continue to research new ways to help recruit the
target population. Radio ads have consistently been our most effective recruitment method, so
we will continue to run regular ads on the radio. We already have a number of recruitment events
scheduled for the next year, including the Tulsa NAMI Conference and meeting with the
Laureate Psychiatric Clinic and Hospital intensive outpatient groups.
4. KEY RESEARCH ACCOMPLISHMENTS: Bulleted list of key research
accomplishments emanating from this research. Project milestones, such as simply
completing proposed experiments, are not acceptable as key research accomplishments.
Key research accomplishments are those that have contributed to the major goals and
objectives and that have potential impact on the research field.
Due to recruitments delays and continuing EEG data collection, there is nothing to report for the
period covered by this report.
5. CONCLUSION: Summarize the importance and/or implications with respect to
medical and /or military significance of the completed research including distinctive
contributions, innovations, or changes in practice or behavior that has come about as a
result of the project. A brief description of future plans to accomplish the goals and
objectives shall also be included.
Recruitment of veterans continued to be challenging which has resulted in data collection
delays and in our request on August 2, 2016 for a second 12-month no-cost extension, which was
approved (beyond the original project complete date of Sep 29, 2015). During the last year we
have improved our recruitment. We are continuing to secure even more institutional support for
our already very substantial recruitment efforts to further increase our recruitment campaign
focused on the veteran population in Oklahoma. Those substantial efforts (as described in this
report) improved subject enrollment rate. We anticipate that those efforts will be sufficient and
realistic to accomplish our pending aims of this project.

29
Our other efforts during year 4 have resulted in substantial progress toward
accomplishing our aims for this project. We have completed the rtfMRI-nf and EEG
experimental Phase 1 of the study and advanced necessary methodological aspects of the study,
including development and implementation of data analysis pipelines and conducting data
analysis on collected multimodal fMRI and EEG data. All study participants tolerate the rtfMRI-
nf emotional training well. Despite large individual subject variability in controlling amygdala
hemodynamic activity during the rtfMRI-nf, ongoing data analysis suggests rtfMRI-nf feasibility
and clinical relevance in reducing PTSD symptoms. For the purpose of accomplishing Aim #2,
we have developed and continue to improve a software environment for real-time EEG
neurofeedback (rtEEG-nf). Feasibility of rtfMRI-nf amygdala training (with simultaneous EEG
recordings) in the combat-related PTSD population (Aim #1) allowed for identification of an
EEG signal feature (frontal EEG asymmetry) for the purpose of establishing rtEEG
neurofeedback. We have developed and implemented an EEG-nf training paradigm (Aim #3 and
Phase 3), and data collection is currently underway. We anticipate that our accomplishments in
Years 1 through 4 have situated our successfully collaborating team for further satisfactory
progress throughout the remainder of the project period. Therefore, we remain well-positioned to
develop and proof-of-concept a novel intervention that has the potential to advance both
understanding of PTSD and our ability to more successfully treat this chronic and costly
condition.

30
PUBLICATIONS, ABSTRACTS, AND PRESENTATIONS:
a. List all manuscripts submitted for publication during the period covered by this report
resulting from this project. Include those in the categories of lay press, peer-reviewed
scientific journals, invited articles, and abstracts. Each entry shall include the
author(s), article title, journal name, book title, editors(s), publisher, volume number,
page number(s), date, DOI, PMID, and/or ISBN.
(1) Lay Press:
(2) Peer-Reviewed Scientific Journals:
(3) Invited Articles:
(4) Abstracts:
b. List presentations made during the last year (international, national, local societies,
military meetings, etc.). Use an asterisk (*) if presentation produced a manuscript.
a. Submitted manuscripts:
Peer-Reviewed Scientific Journals:
1) Wong CK, Zotev V, Misaki M, Phillips R, Luo Q, Bodurka J. “Automatic EEG-assisted
retrospective motion correction for fMRI (aE-REMCOR).” Neuroimage. 2016 Apr 1;129:133-
47. doi: 10.1016/j.neuroimage.2016.01.042.
2) Mayeli A, Zotev V, Refai H, Bodurka J. “Real-time EEG artifact correction during fMRI
using ICA.” J Neurosci Methods. 2016 Sep 30;274:27-37. doi: 10.1016/j.jneumeth.2016.09.012.
b. Conference abstracts:
1) Zotev, V., Phillips, R., Misaki, M., Wong, C.K., Wurfel, B., Meyer, M., Krueger, F., Feldner,
M., Bodurka, J. (2015). Evaluation of rtfMRI Neurofeedback Training Effects in Combatrelated
PTSD Using Simultaneous EEG. E-poster presented at the 24th Annual Meeting of the
International Society of Magnetic Resonance in Medicine, Singapore. In: Proc. Intl. Soc. Magn.
Reson. Med. 24, 280
3) *Mayeli, A., Zotev, V., Refai, H., Bodurka, J. (2016). Real-time ICA-based artifact correction
of EEG data recorded during functional MRI. E-poster presented at the 24th Annual Meeting of
the International Society of Magnetic Resonance in Medicine, Singapore. In: Proc. Intl. Soc.
Magn. Reson. Med. 24, 3773
3) Wong, C.K., Zotev, V., Misaki, M., Phillips, R., Luo, Q., Bodurka, J. (2016). Automatic EEG-
assisted retrospective head motion correction improves rs-fMRI connectivity analysis. Poster
presented at the 24th Annual Meeting of the International Society of Magnetic Resonance in
Medicine, Singapore. In: Proc. Intl. Soc. Magn. Reson. Med. 24, 3774
4) Wong, C.K., Zotev, V., Misaki, M., Phillips, R., Luo, Q., Bodurka, J. (2016). Support vector
machine classification of head motion independent components from EEG-fMRI. Poster
presented at the 22nd Annual Meeting of the Organization for Human Brain Mapping, Geneva,
Switzerland. In: Conf. Proc. 1811.
31
5) Phillips, R., Zotev, V., Young, K., Misaki, M., Wong, C.K., Wurfel, B., Meyer, M., Krueger,
F., Feldner, M., Bodurka, J. (2016). Changes in Amygdala Connectivity During Multiple Visits
of Real-Time fMRI Neurofeedback Training. Poster presented at the 22nd Annual Meeting of the
Organization for Human Brain Mapping, Geneva, Switzerland. In: Conf. Proc. 3951.
c. Presentations:
1) Bodurka, J. (2015). Emotional regulation training of amygdala using real-time fMRI and
EEG-assisted neurofeedback in combat-related PTSD. Talk (seminar) at the 31st Annual Meeting
of the International Society for Traumatic Stress Studies, New Orleans, Louisiana, USA.
2) Bodurka, J. (2015). Emotional regulation training with real-time fMRI neurofeedback of the
amygdala and simultaneous EEG measurements. Talk (key note) at the Neuroscience
Symposium, Central Institute for Mental Health, Mannheim, Germany.
3) Bodurka, J. (2016). Emotion Regulation Training with Real-Time fMRI Neurofeedback of
the Amygdala and Concurrent EEG Recordings in Combat-Related PTSD. Talk at the 13th
Annual Meeting of the Society for Brain Mapping and Therapeutics, Miami, Florida, USA
4) Bodurka, J. (2016). Advances in multimodal MRI and EEG Imaging for studying the human
brain. Talk (invited first inaugural speaker of the Stephenson School of Biomedical Engineering
seminar series), Oklahoma University, Norman, Oklahoma, USA.
5) Bodurka J. (2016). Emotion Regulation Training of Amygdala using Real-time fMRI and
EEG-assisted Neurofeedback. Talk (seminar) at the 22nd Annual Meeting of Organization for
Human Brain Mapping, Geneva, Switzerland.

32
6. INVENTIONS, PATENTS AND LICENSES: List all inventions made and patents and
licenses applied for and/or issued. Each entry shall include the inventor(s), invention title,
patent application number, filing date, patent number if issued, patent issued date, national,
or international.
Nothing to report.
7. REPORTABLE OUTCOMES: Provide a list of reportable outcomes that have resulted
from this research. Reportable outcomes are defined as a research result that is or relates
to a product, scientific advance, or research tool that makes a meaningful contribution
toward the understanding, prevention, diagnosis, prognosis, treatment and /or
rehabilitation of a disease, injury or condition, or to improve the quality of life. This list
may include development of prototypes, computer programs and/or software (such as
databases and animal models, etc.) or similar products that may be commercialized.
1) We have completed development of an enhanced an automated implementation of EEG-
assisted retrospective motion correction (E-REMCOR), which utilizes EEG motion artifacts
to correct the effects of head movements in simultaneously acquired fMRI data on a slice-by-
slice basis [27]. The automated implementation of E-REMCOR, referred to as aE-REMCOR
[28], was developed to facilitate the application of E-REMCOR in multimodal brain research
and in particular in large-scale clinical EEG-fMRI studies. The aE-REMCOR algorithm,
implemented in MATLAB, enables automated preprocessing of the EEG data, ICA
decomposition, and, importantly, automatic, computer-based identification of motion-related
ICs. The aE-REMCOR is capable of substantially reducing head motion artifacts in fMRI
data. We found that veterans with PTSD tend to move more during fMRI scans as compared
to other patient groups and healthy controls. Therefore, we have continued to apply the
method on all acquired fMRI and EEG data from veterans with combat-related PTSD.
2) We are continuing development of better algorithms for artifact suppression in EEG data
acquired simultaneously with fMRI. Specifically, we have developed an improved method
for automatic period detection of cardioballistic artifacts in EEG-fMRI data. Because of the
presence of high magnetic field in fMRI, inaccurate heart beat period detection using the
electrocardiogram (ECG) recording is often observed. Since the waveform of the BCG
artifact in EEG-fMRI data is relatively invariable as compared to the ECG waveforms, we

33
propose a multiple-scale peak detection algorithm to determine directly the BCG period. The
proposed algorithm achieves a higher and better detection accuracy of the artifact occurrence
on a large EEG dataset in EEG-fMRI, and importantly without using the ECG recordings. It
virtually eliminates the need of ECG for BCG artifact removal. Importantly, it can be applied
retrospectively on the large EEG-fMRI data sets already acquired.
3) Abnormal brain resting state connectivity dynamics in PTSD: novel insights from
simultaneous EEG and fMRI. We have completed, on a larger number of unmedicated
veterans with combat-related PTSD and trauma-exposed healthy veterans, an exploratory
multimodal analysis on the EEG-fMRI data collected during resting scans. This novel
analysis approach uses temporal independent EEG microstates (EEG-ms) [16] to study
default mode network activity (DMN) activity. From the simultaneously acquired EEG-fMRI
data we identified temporal independent EEG microstates whose temporal dynamics evolve
at much faster scale and yet we found EEG-ms (MS1) that is correlated with the fMRI DMN
network, and found another EEG-ms that correlates with insular network including bilateral
insular, the cingulate cortex and the medial temporal cortex. The occurrence ratio of the
EEG-ms MS1, MS9, and MS10 statistically differentiates between PTSD and HC group.
Additionally, the MS1 occurrence ratio positively correlates with PCL-M scores, and MS9
occurrence ratio negatively correlates with SHAPS scores in veterans with PTSD.
Importantly, the abnormally decreased functional connectivity in veterans with PTSD
observed via fMRI was associated with a decreased occurrence ratio of DMN-related EEG-
ms MS1, which suggests the relocation of neural processing resources associated with the
PTSD condition. The ability to capture and measure brain connectivity dynamics with
simultaneous EEG&fMRI and EEG-ms analysis provides very promising approach to
discover endophenotypes in PTSD.
8. OTHER ACHIEVEMENTS: This list may include degrees obtained that are supported
by this award, development of cell lines, tissue or serum repositories, funding applied for
based on work supported by this award, and employment or research opportunities applied
for and/or received based on experience/training supported by this award.
Nothing to report.

34
9. REFERENCES: List all references pertinent to the report using a standard journal format
(i.e., format used in Science, Military Medicine, etc.).
1. Diagnostic and Statistical Manual of Mental Disorders (DSM-IV) (American Psychiatric
Association, 2000).
2. Milliken, C. S., Auchterlonie, J. L. & Hoge, C. W. Longitudinal assessment of mental
health problems among active and reserve component soldiers returning from the Iraq
war. Jama 298, 2141-8, (2007).
3. Kessler, R. C. Posttraumatic stress disorder: the burden to the individual and to society. J
Clin Psychiatry 61 Suppl 5, 4-12; discussion 13-4, (2000).
4. Rauch, S. L., Shin, L. M. & Phelps, E. A. Neurocircuitry models of posttraumatic stress
disorder and extinction: human neuroimaging research--past, present, and future. Biol
Psychiatry 60, 376-82 (2006).
5. Shin, L. M., Rauch, S. L. & Pitman, R. K. Amygdala, medial prefrontal cortex, and
hippocampal function in PTSD. Ann N Y Acad Sci 1071, 67-79, (2006).
6. Protopopescu, X. et al. Differential time courses and specificity of amygdala activity in
posttraumatic stress disorder subjects and normal control subjects. Biol Psychiatry 57,
464-73 (2005).
7. Rauch, S. L. et al. Exaggerated amygdala response to masked facial stimuli in
posttraumatic stress disorder: a functional MRI study. Biol Psychiatry 47, 769-76, (2000).
8. Sergerie K, Chochol C, Armony JL. The role of the amygdala in emotional processing: a
quantitative meta-analysis of functional neuroimaging studies. Neurosci Biobehav Rev.
32(4):811-30, (2008).
9. Shin, L. M. et al. A functional magnetic resonance imaging study of amygdala and medial
prefrontal cortex responses to overtly presented fearful faces in posttraumatic stress
disorder. Arch Gen Psychiatry 62, 273-81, (2005).
10. deCharms, R. C. Applications of real-time fMRI. Nat Rev Neurosci 9, 720-729, (2008).
11. Zotev, V., Krueger, F., Phillips, R., Alvarez, R. P., Simmons, W. K., Bellgowan, P.,
Drevets, W. C., Bodurka, J. Self-regulation of amygdala activation using real-time fMRI
neurofeedback. PLoS ONE 6(9), e24522, (2011).
12. Mulert, C., Lemieux, L. (Eds) EEG-FMRI: Physiological basis, Technique and
Applications. Springer (2010).
13. Allen, J.J.B., Harmon-Jones, E., Cavender, J.H., Manipulation of frontal EEG asymmetry
through biofeedback alters self-reported emotional responses and facial EMG.
Psychophysiology 38, 685–693, (2001).
14. Gordon, E., Palmer, D.M., Cooper, N., EEG alpha assymetry in schizophrenia,
depression, PTSD, panic disorders, ADHD and conduct disorder. Clinical EEG and
Neuroscience 41, 178-183, (2010).
15. Harmon-Jones, E, Gable, P.A., Peterson, C. K. The role of asymmetric frontal cortical
activity in emotion-related phenomena: a review and update. Biol. Psychol 84(3), 451-

35
462, (2010).
16. Yuan, H., Zotev, V., Phillips, R., Drevets, W.C., Bodurka, J. Spatiotemporal dynamics of
the brain at rest – exploring EEG microstates as electrophysiological signatures of BOLD
resting state networks. Neuroimage 60(4), 2062-2072, (2012).
17. Zhang, D. & Raichle, M.E. Disease and the brain's dark energy, Nat Rev Neurol vol. 6,
no. 1, pp. 15-28. (2010).
18. Young, K.D., Zotev, V., Phillips, R., Misaki, M., Yuan, H., Drevets, W.C., Bodurka, J.
Real-time fMRI neurofeedback training of amygdala activity in patients with major
depressive disorder, PloS One, 9(2): e88785 (2014).
19. Smith, S.M. Correspondence of the brain's functional architecture during activation and
rest. PNAS, vol. 106, no.31, pp. 13040-13045 (2009).
20. Laird, A.R. Investigating the functional heterogeneity of the default mode network using
coordinate-based meta-analytic modeling, J Neurosci, vol. 29, no. 46, pp. 14496-14505
(2009).
21. Bruce, S.E., Altered emotional interference processing in the amygdala and insula in
women with Post-Traumatic Stress Disorder, Neuroimage Clin, vol. 2, pp. 43-49 (2012).
22. Lanius, R.A., Default mode network connectivity as a predictor of post-traumatic stress
disorder symptom severity in acutely traumatized subjects, Acta Psychiatr Scand, vol.
121, no. 1, pp.33-40 (2010).
23. Zotev, V., et al. Correlation between amygdala BOLD activity and frontal EEG
asymmetry during real-time fMRI neurofeedback training in patients with depression.
NeuroImage Clinical (in revision), preprint http://www.arxiv.org/abs/1409.2046
24. Kemp, A.H., et al. Disorder specificity despite comorbidity: resting EEG alpha
asymmetry in major depressive disorder and post-traumatic stress disorder. Biol.
Psychology 85, 350-354 (2010).
25. Bruce, S.E., Altered emotional interference processing in the amygdala and insula in
women with Post-Traumatic Stress Disorder, Neuroimage Clin, vol. 2, pp. 43-49 (2012).
26. Yan, X., Precuneal and amygdala spontaneous activity and functional connectivity in
war-zone-related PTSD, Psychiatry Res, pii: S0925-4927(14)00328-X (2014).
27. Zotev, V., Yuan, H., Phillips, R., Bodurka, J. EEG-assisted retrospective motion
correction for fMRI: E-REMCOR. Neuroimage 63, 698-712, (2012).
28. Wong, C.K, Zotev, V., Misaki, M., Phillips, R., Luo, Q., Bodurka, J. Automatic EEG-
assisted retrospective motion correction for fMRI (aE-REMCOR). Neuroimage 129:133-
47 (2016).
29. Mayeli, A., Zotev, V., Refai, H., Bodurka, J. Real-time EEG artifact correction during
fMRI using ICA. J Neurosci Methods. 2016 274:27-23 (2012).
30. Zotev, V., Yuan, H., Misaki, M., Phillips, R., Young, K.D., Feldner, M.T. Bodurka J.
Correlation between amygdala BOLD activity and frontal EEG asymmetry during real-
time fMRI neurofeedback training in patients with depression. NeuroImage Clinical
11:224-238 (2016).

36
10. APPENDICES: Attach all appendices that contain information that supplements, clarifies
or supports the text. Examples include original copies of journal articles, reprints of
manuscripts and abstracts, a curriculum vitae, patent applications, study questionnaires,
and surveys, etc.
NOTE:
TRAINING OR FELLOWSHIP AWARDS: For training or fellowship awards, in addition to
the elements outlined above, include a brief description of opportunities for training and
professional development. Training activities may include, for example, courses or one-on-one
work with a mentor. Professional development activities may include workshops, conferences,
seminars, and study groups.
COLLABORATIVE AWARDS: For collaborative awards, independent reports are required
from BOTH the Initiating Principal Investigator (PI) and the Collaborating/Partnering PI. A
duplicative report is acceptable; however, tasks shall be clearly marked with the responsible PI
and research site. A report shall be submitted to https://ers.amedd.army.mil for each unique
award.
QUAD CHARTS: If applicable, the Quad Chart (available on this eReceipt System
https://cdmrp.org/Program_Announcements_and_Forms/ and under “Forms” on
https://www.usamraa.army.mil) should be updated and submitted with attachments.
MARKING OF PROPRIETARY INFORMATION: Data that was developed partially or
exclusively at private expense shall be marked as “Proprietary Data” and Distribution Statement
B included on the cover page of the report. Federal government approval is required before
including Distribution Statement B. The recipient/PI shall coordinate with the GOR to obtain
approval. REPORTS NOT PROPERLY MARKED FOR LIMITATION WILL BE
DISTRIBUTED AS APPROVED FOR PUBLIC RELEASE. It is the responsibility of the
Principal Investigator to advise the GOR when restricted limitation assigned to a document can
be downgraded to “Approved for Public Release.” DO NOT USE THE WORD
"CONFIDENTIAL" WHEN MARKING DOCUMENTS. See term entitled “Intangible Property
– Data and Software Requirements” and
https://mrmc.amedd.army.mil/index.cfm?pageid=researcher_resources.technical_reporting for
additional information.
1) Zotev, V., Yuan, H., Misaki, M., Phillips, R., Young, K.D., Feldner, M.T. Bodurka J.
Correlation between amygdala BOLD activity and frontal EEG asymmetry during real-time
fMRI neurofeedback training in patients with depression. NeuroImage Clinical 2016 11:224-238
http://www.sciencedirect.com/science/article/pii/S2213158216300250
Related Documents