ABSTRACT Title of Document: EMOTION REGULATION MEDIATES THE RELATIONSHIP BETWEEN ADHD AND DEPRESSIVE SYMPTOMS IN YOUTH. Karen E. Seymour, Ph.D., 2010 Directed By: Associate Professor Andrea M. Chronis- Tuscano, Ph.D., Department of Psychology A significant body of longitudinal research suggests increased rates of mood disorders as well as depressive symptoms in youth diagnosed with attention- deficit/hyperactivity disorder (ADHD) in contrast to non-ADHD comparison youth. Furthermore, individuals with co-occurring ADHD and mood disorders experience more serious impairments and worse outcomes than those with either disorder alone. However, few studies have examined the underlying mechanisms which may better elucidate the relationship between ADHD and depression in youth. The present study examined emotion regulation as a mediator in the relationship between ADHD and depressive symptoms in youth. Moreover, effortful control was examined as a mediator in the relationship between ADHD and emotion regulation. Participants included 69 youth between the ages of 10 and 14 with (n = 37) and without (n = 32) DSM-IV ADHD. Parent and youth ratings of depressive symptoms and emotion regulation were collected, and youth completed computerized measures of effortful

Welcome message from author
This document is posted to help you gain knowledge. Please leave a comment to let me know what you think about it! Share it to your friends and learn new things together.
Transcript
ABSTRACT
Title of Document: EMOTION REGULATION MEDIATES THE RELATIONSHIP BETWEEN ADHD AND DEPRESSIVE SYMPTOMS IN YOUTH.
Karen E. Seymour, Ph.D., 2010
Directed By: Associate Professor Andrea M. Chronis-Tuscano, Ph.D., Department of Psychology
A significant body of longitudinal research suggests increased rates of mood
disorders as well as depressive symptoms in youth diagnosed with attention-
deficit/hyperactivity disorder (ADHD) in contrast to non-ADHD comparison youth.
Furthermore, individuals with co-occurring ADHD and mood disorders experience
more serious impairments and worse outcomes than those with either disorder alone.
However, few studies have examined the underlying mechanisms which may better
elucidate the relationship between ADHD and depression in youth. The present study
examined emotion regulation as a mediator in the relationship between ADHD and
depressive symptoms in youth. Moreover, effortful control was examined as a
mediator in the relationship between ADHD and emotion regulation. Participants
included 69 youth between the ages of 10 and 14 with (n = 37) and without (n = 32)
DSM-IV ADHD. Parent and youth ratings of depressive symptoms and emotion
regulation were collected, and youth completed computerized measures of effortful

control. Results demonstrated significant differences between youth with and without
ADHD on depressive symptoms and emotion regulation ability, but not effortful
control. Furthermore, emotion regulation fully mediated the relationship between
ADHD and depressive symptoms. Clinical implications and limitations are discussed.
Keywords: Attention-deficit/hyperactivity disorder, emotion regulation,
depression, distress tolerance
EMOTION REGULATION MEDIATES THE RELATIONSHIP BETWEEN ADHD AND DEPRESSIVE SYMPTOMS IN YOUTH.
By
Karen E. Seymour
Dissertation submitted to the Faculty of the Graduate School of the University of Maryland, College Park, in partial fulfillment
of the requirements for the degree ofDoctor of Philosophy
2010
Advisory Committee:Associate Professor Andrea M. Chronis-Tuscano, ChairProfessor Carl LejuezAssociate Professor Michael R. Dougherty Assistant Professor Stacey B. DaughtersAssistant Professor Natasha Cabrera

© Copyright byKaren E. Seymour
2010

ii
Dedication
This work is dedicated to my family and friends whose undying love and support
made the completion of this degree possible. I would especially like to thank my
husband Brian, parents Larry and Donna Seymour, the Shirlington crew, Tutu,
Rachel, girls of the ADHD lab, and all of the other people who have made the
accomplishment of this goal possible.
iii
Acknowledgements
Several people were instrumental in the completion of this study. First, the author
would like to acknowledge the contributions of my academic advisor, Dr. Chronis,
and the other members of my dissertation committee, Drs. Lejuez, Dougherty,
Daughters, and Cabrera. Furthermore, the author would like to acknowledge the
efforts of Thorhildur Halldorsdottir, Kristian D. Owens, and Talia Sacks who served
as research assistants on this project. Without their diligence and extraordinary
efforts, this project would not have been possible. Finally, the author acknowledges
the parents and youths who kindly participated in this study.
iv
Table of Contents
Dedication ................................................................................................................ iiAcknowledgements.................................................................................................. iiiTable of Contents..................................................................................................... ivList of Tables ........................................................................................................... viList of Figures......................................................................................................... viiChapter 1: Introduction ............................................................................................. 1
ADHD and Depression.......................................................................................... 1Depression in Children and Adolescents ........................................................ 1Impairments Associated with Comorbid ADHD and Depression ................. 9Limitations of Previous Research ................................................................. 11
Emotion Regulation ............................................................................................ 12Function and Definition ................................................................................ 12The Role of Attentional and Inhibitory Control in ER................................ 16Effortful Control in Youth with ADHD: A Primary Deficit........................ 19ER and ADHD............................................................................................... 20ADHD and Depression .................................................................................. 22Theoretical Models for the Relationship between Effortful Control, ER and Depression ..................................................................................................... 24
Chapter 2: Aims of the Present Study...................................................................... 27Primary Aim 1 .................................................................................................... 27
Hypothesis 1................................................................................................... 27Primary Aim 2 .................................................................................................... 27
Hypothesis 2................................................................................................... 28Chapter 3: Methods................................................................................................. 30
Participants ......................................................................................................... 30Procedures .......................................................................................................... 32Measures............................................................................................................. 33
Assessment of Youth ADHD ......................................................................... 33Assessment of Youth Depression .................................................................. 35Emotion Regulation....................................................................................... 38Distress Tolerance ......................................................................................... 40Effortful Control ........................................................................................... 44
Chapter 4: Results................................................................................................... 48Preliminary Analyses .......................................................................................... 48
Variable Examination ................................................................................... 48Data Reduction.............................................................................................. 49Manipulation Check...................................................................................... 51Comparison of Groups on ADHD, ODD, and CD Symptoms and Overall Impairments .................................................................................................. 52
Data Analytic Plan .............................................................................................. 53Main Analyses .................................................................................................... 55
Chapter 5: Discussion ............................................................................................ 64Appendices ............................................................................................................. 83

v
Bibliography ........................................................................................................... 96

vi
List of Tables
Table 1 Youth and Parent Participant Demographics
Table 2 Correlation Matrix of Independent, Dependent, Mediator and Demographic Variables
Table 3 Depressive symptoms, ER, DT and Effortful Control by Group
Table 4 Fit statistics for Model 1
Table 5 Structural Equations for Model 1
Table 6 Fit statistics for Model 2
Table 7 Structural Equations for Model 2

vii
List of Figures
Figure 1 The relationship between Effortful Control, ER and Depression
Figure 2 Proposed Path Analysis- Model 1 (using Effortful Control and ER as
mediators)
Figure 3 Proposed Path Analysis- Model 2 (using Effortful Control and DT as
the mediators)
Figure 4 Disposition of participants
Figure 5 Computer Display of the BIRD
Figure 6 Computer display for the MTPT-C
Figure 7 Model 1 with paths defined
Figure 8 Model 2 with paths defined
Figure 9 Path analysis indexes for Model 1
Figure 10 Revision of Model 1
Figure 11 Model 2 with standardized and unstandardized beta weights
1
Chapter 1: Introduction
ADHD and Depression
Depression in Children and Adolescents1
Depression has an estimated prevalence of 2% in children and 4%-8% in adolescents
(Avenevoli, Knight, Kessler, & Merikangas, 2008; Birmaher, Ryan, Williamson, et
al., 1996; Kessler, Avenevoli, Ries-Merkangas, 2001; Shaffer, Fisher, Dulkan, et al.,
1996). Approximately 15%-20% of youth will experience a depressive episode by
mid-adolescence (Birmaher, et al., 1996; Lewinsohn, Hops, Roberts, Seeley &
Andrews. 1993). Rises in depressive symptoms during adolescence may be attributed
to increases in stressful life events and physiological and psychological changes
during this developmental period (Bond, Toumbourou, Thomas, Catalano, & Patton,
2005; Kim, Conger, Elder, & Lorenz, 2003; Rhode, Beevers, Stice, O’Neil, 2009).
Adolescent-onset depression most often has a chronic, episodic course which
continues into adulthood and is associated with substantial life-long morbidity
(Copeland, Shanahan, Costello, & Angold, 2009; Weissman, Wolk, Goldstein,
Moreau, Adams & Greenwald, 2000; Weissman, Wolk, Wickramaratne, Goldstein,
Adams & Greenwald, 1999).
A number of detrimental outcomes are associated with depression in youth.
First, depression is a major risk factor for suicide (Apter & King, 2006; Bridge et al.,
1 The child and adolescent literature on both ADHD and depression often combines children and adolescents within one sample (e.g., with participants ranging in age from 7-16 years old; Bird et al., 1988; Blackman et al., 2005; Milberger et al., 1995). In order to avoid excessive wording, the author will refer to this population as “youth” with the understanding that the age range often includes adolescents as well. However, samples that are strictly either child or adolescent will be referred to as such to avoid confusion.
2
2005; Jacobson & Gould, 2009; Lewinsohn et al., 2001), and depressed youth have a
thirty-fold increased risk of completed suicide (Kovacs, 1996; Kovacs & Goldston,
1991). In fact, suicide is the third leading cause of death for youth between the ages
of 15 to 24 years and the sixth leading cause of death for those between the ages of 5
and 14 (Anderson & Smith, 2003). Additionally, depression in youth is associated
with a number of negative outcomes including: decreased school performance, high-
risk sexual behavior (including early pregnancy), increased physical illness, increased
risk of substance abuse, and impaired social relationships, making it a significant
public health concern (Birmaher, et. al., 2004; Kaminer & Bukstein, 2008; Keenan-
Miller, Hammen, & Brennan, 2007; Kovacs, 1996; Rice, Lifford, Thomas, & Thapar,
2007; Rohde, Lewinsohn & Seeley, 1994; Stolberg, Clark & Bongar, 2002).
In recent years, it has been argued that comorbidity in youth is the most
pressing issue in developmental psychopathology research and practice (Angold,
Costello, & Erkanli, 1999; Jensen, 2003). Specifically, Lilienfeld (2003) called for the
systematic exploration of potential mechanisms involved in the development of
comorbid conditions. Of particular relevance to the current study is the exploration of
processes that underlie and mediate the relationship between attention-
deficit/hyperactivity disorder (ADHD) and depression in youth.
Moderate to high rates of comorbidity between ADHD and mood disorders in
youth have been established in cross-sectional studies including both community
(Anderson, Williams, McGee & Silva, 1987; Angold, Costello & Erkanli, 1999;
Bauermeister et al., 2007; Bird, Canino, Rubio-Stipec, Gould, Ribera, Sesman et al.,
1988; Blackman, Ostrander & Herman, 2005) and clinical samples (Daviss, 2009;
3
Elia, Ambrosini & Wade, 2008; Milberger, Biederman, Faroane, Murphy & Tsuang,
1995; Souza, Pinheiro, Denardin, Mattos, & Rohde, 2004). Cross-sectional studies of
community-based samples suggest that the co-occurrence rates of Attention Deficit
Disorder (ADD, DSM-III-R, American Psychological Association, 1987) and/or
Attention Deficit/Hyperactivity Disorder (ADHD, DSM-IV, American Psychological
Association, 2000) and mood disorders range from 0% (McGee et al., 1990) to 75%
(Biederman, Newcorn, Spirch,1991) (for reviews see Angold & Costello, 1993, 1999;
Jensen, Martin & Cantwell, 1997). Research examining DSM-III prevalence rates in
youth ages 4 to 16 years-old in Puerto Rico found that 17% of youth who met criteria
for ADD also met criteria for an affective disorder (Bird et al., 1988).
In another study conducted by Blackman and colleagues (2005), results
suggested that the rate of depression in children with ADHD was greater than
expected in the general population. Specifically, 9% of children with ADHD in the
sample were diagnosed with depression, whereas prevalence rates of depression in
epidemiological studies suggest rates of only 2% for school-age children and
approximately 5% for adolescents (see Kashani & Sherman, 1988; Weller, Weller, &
Svadjian, 1996). These increased rates in children with ADHD are stunning in light of
the stringent diagnostic criteria employed for depression in this study (i.e., in order to
be included in the “depressed” group, children with ADHD had to: (1) receive a score
of at least 12 on the CDI and (2) meet full criteria for either dysthymia or major
depression according to a structured interview (Blackman et al., 2005).
Additionally, a meta-analysis of 21 epidemiological studies found that the
median odds ratio for the co-occurrence of ADHD and depression is 5.5 (95% CI =
4
3.5-8.4), such that the odds of a youth with ADHD also being diagnosed with
depression are increased more than five-fold relative to youth without ADHD
(Angold, Costello & Erklanli, 1999). Greater than expected rates of comorbid ADHD
and depression have even been demonstrated in youth as young as 4-years-old
(Lavigne, LeBailly, Hopkins, Gouze & Binns, 2009).
A number of factors have been shown to impact the variability in reported
rates of comorbidity ADHD and depression, including the nature of the sample (i.e.
community vs. clinical) and definitions of the constructs of ADHD and depression.
For example, comorbidity tends to be lower in community-based or epidemiological
samples (e.g. Anderson et al., 1987; Bird et al., 1988, McGee, et al., 1990) in
comparison to clinical samples (Biederman, Faraone, et al., 1990; Butler et al., 1995).
Additionally, in community-based samples, participant age and ADHD severity have
been found to predict higher odds ratios, with youth ages 10 and older, and those
having more ADHD symptoms being at increased risk (Angold et al., 1999).
Furthermore, research which utilizes more inclusive diagnostic categories (i.e., all
affective disorders, rather than just major depression; dimensional vs.
categorical/diagnostic examination of depression, etc.) may reveal higher prevalence
rates (Jensen et al., 1997).
Cross-sectional studies examining the co-occurrence of ADHD and depression
in clinically-referred youth suggest higher rates of comorbidity than those found in
community samples. Specifically, in clinical samples of youth between the ages of 5
to 18 years, comorbidity rates of ADHD and depression range from 29%-39%
(Daviss, 2009; Elia, et al., 2008; Milberger, et al., 1995; Souza, et al., 2004). In a
5
large clinical sample of youth ages 6 to 18 years, Elia and colleagues (2008) found a
comorbidity rate of 21.6% for ADHD and Depression/Dysthymia. Subgroup analyses
revealed that comorbidity with Depression/Dysthymia was highest in the ADHD-
Combined Type (ADHD-CT) group, followed by ADHD-Primarily Inattentive Type
(ADHD-IA), and then ADHD-Primarily Hyperactive/Impulsive Type (ADHD-HI)2
(Elia, Ambrosini & Wade, 2008). Additionally, high comorbidity rates remain even
when researchers control for the overlapping symptoms of ADHD and depression,
such as difficulty concentrating and psychomotor agitation. For example, Milberger et
al. (1995) examined the overlap of DSM-III-R ADHD and major depression in 6 to
17 year old boys and found that, using the subtraction method to examine
comorbidity (i.e., omitting overlapping symptoms), 79% of participants with ADHD
maintained their initial diagnosis of major depression despite the removal of
overlapping items. These results suggest that high rates of comobid ADHD and
depression are not solely due to overlapping symptoms.
Prospective longitudinal studies examining the development of depression in
children with ADHD followed into adolescence or adulthood provide mixed evidence
for the prevalence of this comorbidity. A number of studies have suggested that
children with ADHD do not demonstrate increased rates of depression during
adolescence and young adulthood as compared to children without ADHD (Bagwell
& Molina, 2006; Claude & Firestone, 1995; Gittleman, Mannuzza, Shenker, &
2 DSM-IV diagnostic criteria specify the following requirements for various subtypes of ADHD: for a diagnosis of ADHD-IA, youth are required to have 6/9 symptoms of inattention; for a diagnosis of ADHD-HI, youth must have 6/9 symptoms of hyperactivity/impulsivity; and for a diagnosis of ADHD-CT youth are required to meet both of the above criteria. In all subtypes, youth must also present with impairments in at least two settings and onset of symptoms must be present before the age of 7-years-old (APA, 1994).
6
Bondura, 1985; Manuzza & Gittleman, 1984; Mannuzza & Klein, 1991, 1998). For
example, Bagwell and Molina (2006) followed both youth first diagnosed with
ADHD between the ages of 5 to 17 years-old and control youth until mid- to late-
adolescence. Results suggested no differences between groups on rates of mood
disorders in mid- to late-adolescence (Bagwell & Molina, 2006). For youth with
ADHD, childhood externalizing symptoms and social problems were predictive of
mood disorders (Bagwell & Molina, 2006). However, one significant limitation of the
previous research should be noted. Many of the studies that demonstrated null
findings included only male participants (Claude & Firestone, 1995; Gittleman et al.,
1985; Mannuzza & Klein, 1991,1998), which is problematic in light of the gender
differences in rates of depressive disorders beginning in adolescence (e.g., Nolen-
Hoeksema & Girguas 1994, Nolen-Hoeksema, 2002, Hilt & Nolen-Hoeksema, 2009).
In contrast, more recent longitudinal research has suggested increased rates of
mood disorders (Biederman, Ball, Monuteaux, Mick, Spencer, McCreary, et al.,
2008; Green et al., 1997; Fisher, Barkley, Smallish & Fletcher, 2002; Biederman,
Monuteaux, Mick, Spencer, Wilens, Silva, et al., 2006; Monuteaux, Faraone, Gross &
Biederman, 2007) and depressive symptoms (Hinshaw et al., 2006; Lahey et al., 2007;
Lee et al., 2008) in children diagnosed with ADHD in comparison to children without
ADHD. Greene and colleagues (1997) examined 6-17 year-old boys with and without
ADHD and found that boys with ADHD demonstrated greater levels of unipolar
depression than non-ADHD comparison boys at the 4-year follow-up. In a female-
only sample, ADHD diagnosis between the ages of 6 to 18 years independently
predicted one-year prevalence rates of Major Depressive Disorder (MDD) at 5-year
7
follow-up (Monuteaux, Faraone, Gross & Biederman, 2007). Similarly, females with
ADHD between the ages of 6 to 12 were 5.1 times more likely to experience MDD
than non-ADHD comparison females at 5-year follow-up (Biederman, Ball, et al.,
2008).
One limitation of the aforementioned research has been the reliance on single-
sex samples. However, research involving samples of both males and females with
and without ADHD has also yielded significantly higher rates of lifetime MDD
during adulthood in youth with ADHD in comparison to non-ADHD controls
(Biederman, Monuteaux, et al., 2006; Biederman et al., 1996; Fisher, Barkley, et al.,
2002). Therefore, while initial longitudinal studies examining the increased risk for
depressive disorders in youth with ADHD over non-ADHD comparison youth
suggested no differences, recent studies provide more compelling evidence for the
increased risk for depressive disorders faced by youth with ADHD in comparison to
their non-ADHD peers.
In addition to being at increased risk for diagnosable depression, longitudinal
studies have also suggested that youth with ADHD are at an increased risk for
elevated symptoms of depression relative to non-ADHD comparison youth. Results
from a 5-year follow-up study comparing females with ADHD-IA, ADHD-CT, and
non-ADHD comparison females (ages 6 to 12 at baseline) suggested that, while
females with ADHD were not at increased risk for MDD diagnoses, females with
both ADHD subtypes exhibited higher scores on parent and teacher reports of
internalizing symptoms than non-ADHD comparison females (Hinshaw, Owens,
Sami, & Fargeon, 2006). Additionally, females in the ADHD-CT group reported
8
higher levels of depression than non-ADHD comparison females. Lahey and
colleagues (2007) conducted an 8-year follow-up study of young children, ages 4 to
6, which evaluated children who had been diagnosed with ADHD and non-ADHD
comparison children on a number of outcomes including depressive symptoms.
Participants were assessed annually, and results suggested that, in comparison to the
non-ADHD group, both boys and girls with ADHD had higher levels of youth- and
parent-reported depressive symptoms during adolescence, even after controlling for
baseline internalizing and conduct symptoms. Furthermore, a steeper increase in
depressive symptoms from baseline to wave 9 was demonstrated for girls with ADHD
in comparison to boys with ADHD. Taken together, cross-sectional and longitudinal
studies seem to suggest that youth diagnosed with ADHD may be at increased risk for
mood disorders as well as increased risk for elevated symptoms of depression in
comparison to non-ADHD youth, which highlights the need for a more
comprehensive understanding of mechanisms which explain this comorbidity.
With regard to the temporal relationship between ADHD and depression,
research suggests that ADHD most often precedes the onset of depression in youth
(Costello, Foley, Angold, 2006; Rohde, Lewinsohn, Seeley, 1993). In order to meet
DSM-IV diagnostic criteria for ADHD, symptoms and impairment must occur before
the age of seven; therefore, by definition, the onset of ADHD occurs early in
development (American Psychological Association, 1994). In contrast, depression
appears to have a later onset and increases in prevalence from late childhood to
adolescence (Kessler, 2002). By mid-adolescence, 15-20% of youth will have
experienced a depressive episode (Birmaher et al., 1996; Lewinsohn et al., 1993). In
9
fact, one-year prevalence rates of clinical depression increase six-fold from 3% to
18% between the ages of 15 to 18 years (Hankin, Abramson, Moffitt, Silva, McGee,
& Angell, 1998). Given that ADHD occurs early in development, while depression
has a later onset, ADHD may be considered a developmental precursor to depression.
In fact, longitudinal results from the Great Smoky Mountain Study which examined
psychiatric comorbidity in youth suggest that the overall prevalence of any
psychiatric disorder is highest between the ages of 9 to 10 years (Costello, Mustillo,
Erklani, Keeler & Angold, 2003). Additionally, elevations in depressive
symptomatology are noticeable by the age of 12 and reach diagnostic levels by age 13
(Angold, Erkanji, Silberg et al., 2003). Therefore, given the temporal relationship
between ADHD and depression, the developmental period of late childhood to early
adolescence appears to be a critical period of increased risk for examining the overlap
of ADHD and depression.
Impairments Associated with Comorbid ADHD and Depression
The combination of ADHD and depressive disorders results in more serious
impairments and worse outcomes than those resulting from either disorder alone.
Comorbidity, in general, is associated with increased risk for behavioral disinhibition,
substance use, violence, and suicide, and tends to be treatment refractory (Capaldi,
1992; Rohde, Lewinsohn, & Seeley, 1991). Specifically, youth with ADHD and
depression require significantly more intensive interventions, experience higher levels
of stress, are at greater risk for developing bipolar disorder and Oppositional Defiant
Disorder (ODD), and have more psychosocial and familial problems than youth with
ADHD alone (Biederman et al., 1996; Jensen et al., 1993). Moreover, a recent review

10
suggests that a diagnosis of comorbid ADHD and depression, as opposed to a
diagnosis of ADHD alone, significantly worsens the prognosis for an individual
(Daviss, 2008). Maternal anxiety and depression are more common in families of
youth with ADHD and Dysthymic Disorder (DD) in comparison to families of youth
with ADHD alone, which may also contribute to children’s symptoms, impairment,
and overall levels of environmental stress (Harris, Boots, Talbot, & Vance, 2006).
Furthermore, youth with ADHD and depression have more negative self-perceptions
than youth with ADHD alone (Schmidt, Stark, Carlson, & Bruno, 1998).
In comparison to youth with MDD alone, youth with comorbid ADHD and
depression demonstrate an earlier onset and longer duration of depressive episodes
(Biederman, et al., 2008), increased risk for recurrence (Rohde et al., 2001), and
higher rates of suicidality and psychiatric hospitalization (Biederman et al., 2008). Of
particular concern is research suggesting that children with comorbid mood disorders
and ADHD are three times more likely to complete suicide that those diagnosed with
either disorder alone (James, Lai, & Dahl, 2004). Taken together, these increased
impairments and deleterious outcomes underscore the need for a more comprehensive
understanding of processes which underlie the relationship between ADHD and
depression.
To date, only one study has examined factors that are associated with the
development of depression among youth with ADHD. Ostrander and Herman (2006)
examined the role of parental behavior management (i.e., parent-rated use of effective
and consistent positive reinforcement and monitoring) and youth locus of control (i.e.,
the extent to which a youth perceived that success or failure was within his/her

11
control) as mediators of the relationship between ADHD and depression in a large
community sample of 8 to 10 year-old youth with and without ADHD. Parent
behavior management partially or fully mediated the relationship between ADHD and
depression across age groups, whereas locus of control partially or fully mediated the
relationship for youth older than age 9.
Limitations of Previous Research
Ostrander and Herman’s (2006) work provides an initial investigation of potential
factors underlying the development of depression in youth with ADHD; however, a
significant limitation must be acknowledged. Noticeably absent from this work is the
role of emotion regulation (ER) in the relationship between ADHD and depression in
youth. Abundant empirical evidence from the fields of neuroscience (Davidson,
1998), developmental psychology (Zeman, Shopman & Suveg, 2002), and personality
psychology (Clark, 2005) has linked poor ER to depression in adults and youth. ER
may be particularly important in understanding the development of depression in
youth with ADHD because research supports the need for both attentional control and
inhibitory control in the regulation of emotion (Calkins & Dedmon, 2000; Calkins,
Dedmon, Gill, Lomax, & Johnson, 2002; Eisenberg & Spinrad, 2004). Moreover,
theoretical models of ADHD posit that emotion regulation is a core deficit in youth
with ADHD due to their difficulties with attentional and inhibitory control (Barkley,
1997). Taken together, this research suggests that ER and attentional/inhibitory
control may be important processes to examine in the relationship between ADHD
and depression in youth. Yet to date, ER has not been examined as a mediator in the
relationship between ADHD and depression in youth. Furthermore, no research has
12
examined attentional/inhibitory control as the mechanism by which youth with
ADHD may have deficits in ER ability.
Emotion Regulation
Function and Definition
It has been suggested that problems in the regulation of emotion may underlie
maladaptive behavior and may be viewed as precursors to later psychopathology
(Keenan, 2000; Calkins & Fox, 2002). The capacity to regulate emotions begins in
the first year of life and is important for the development of appropriate and adaptive
social behavior (Eisenberger et al., 1996, Thompson, 1994). However, within this
literature, there has been a lack of consensus on a definition of ER (see Bridges,
Denham, & Ganniban, 2004; Cole, Martin, & Dennis, 2004; Eisenberg & Spinrad,
2004). Within the developmental and clinical literatures, ER has numerous
definitions, some of which focus more on the regulatory functions of emotions in
organizing internal processes (e.g., attention, memory), and others of which focus on
the manner in which emotion is regulated (e.g., cognitive control, internalization of
social expectations) which allow an individual to monitor, delay, and adjust their
reactions to the situational demands (Cole, Michel & Teti, 1994). In an early
definition, Kopp (1989) stated that ER refers to the processes and the characteristics
involved in coping with heightened levels of positive and negative emotions
including joy, pleasure, distress, anger, and fear. For the purposes of the current
study, ER is conceptualized as the internal and external processes involved in
“initiating, avoiding, inhibiting, maintaining, and modulating the occurrence, form,
13
intensity, or duration of internal feeling states, emotion-related physiological,
attentional processes, motivational states and/or the behavioral concomitants of
emotion in the service of accomplishing affect-related biological or social adaptations
or achieving individual goals” (Eisenberg & Spinard, 2004, p. 338).3 This definition
is particularly relevant for youth with ADHD, as these youth often have impairments
in the underlying processes involved in ER (i.e., attentional control, inhibitory
control, etc.) and in the ability to engage in the goal-oriented behaviors necessary for
regulating emotion.
Emotion dysregulation in the child and adolescent literature refers to:
difficulties with the flexible integration of emotion with other processes (e.g.,
homeostatic regulation, cognitions, etc.) (Cicchetti, Ganiban, & Barnett, 1991; Katz
& Gottman, 1991); poor control over affective experience and expression (Izard,
1977; Kopp, 1989; Thoits, 1985); and interference in the processing of information or
events (e.g. Dodge, 1991a; Plutick, 1980). In a review of both the child and adult
literatures examining emotion regulation and dysregulation, Gratz and Roemer (2004)
have synthesized the definitions and conceptualizations of emotion dysregulation
suggesting that it is “a multidimensional construct involving the following: (a) lack of
awareness, understanding, and acceptance of emotions; (b) lack of access to adaptive
strategies for modulating the intensity and/or duration of emotional responses; (c) an
unwillingness to experience emotional distress as part of pursuing desired goals; and
3 To be clear, emotion regulation is not being used synonymously with “negative emotionality.” While the constructs of emotion regulation, negative emotionality, and control-related characteristics (e.g., impulsivity) appear to be related, they are conceptualized as separate aspects of temperament (e.g., Rothbart, Ahadi, Hershey, & Fisher, 2001).
14
(d) the inability to engage in goal-directed behaviors when experiencing distress”
(Gratz & Roemer, 2004, p. 52; Mennin, Heimberg, Turk, & Fresco, 2005).
This inability to engage in goal-directed behaviors when experiencing distress
is referred to in the adult literature as poor distress tolerance. Distress tolerance (DT) 4
refers to the behavioral assessment of persistence in goal-directed behavior in the face
of emotional distress (e.g., frustration, disappointment, anger; Brown et al., 2005),
and can be considered a behavioral index of ER. Distress tolerance is commonly
measured using behavioral tasks such as the Paced Auditory Serial Addition Task-
Computerized (PASAT-C; Lejuez, Kahler, & Brown, 2003) or The Computerized
Mirror-tracing Persistence Task (MTPT-C; Daughters, Lejuez, Bornovalova et al.,
2005) which serve to elicit psychological distress (measured pre- and post-task).
Based on the definition of DT, it appears that DT may in fact be one facet of
ER. Specifically, DT may serve as a behavioral index of ER. However, to date, only
one study has directly examined the relationship between ER and DT. In a study
comparing adults with borderline personality disorder (BPD), a disorder characterized
by deficits in ER, to individuals without any personality disorder, results
demonstrated group differences in the willingness to experience emotional distress in
order to pursue goal-directed behavior. Individuals with BPD were more likely to quit
the DT tasks prematurely than those without personality disorders (Gratz, Rosenthal,
Tull, Lejuez, & Gunderson, 2006). Additionally, for individuals with BPD, self-
reports of emotion dysregulation and experiential avoidance were significantly
negatively correlated with latency to quit on the DT tasks. When examining group
4 A more detailed discussion of distress tolerance and its relation to adult and youth psychopathology is presented in Appendix A.
15
differences between those with BPD who quit the DT tasks versus those with BPD
who did not quit, differences in emotion dysregulation continued to be significant
even after controlling for BPD symptom severity. Specifically, BPD individuals who
quit DT tasks earlier demonstrated higher levels of emotion dysregulation than BPD
individuals who persisted on DT tasks. These results suggest that the measure of
emotion dysregulation was not just measuring symptoms of BPD (Gratz, et al., 2006).
Therefore, this study demonstrates an inverse relationship between ER and DT, and
suggests that DT may in fact be viewed as a behavioral index of ER.
With regards to DT in youth, only one study has examined DT in adolescents,
and no studies have examined DT in relation to youth with ADHD. In a community
sample of adolescents ages 9-13, Daughters and colleagues (2009) examined the
relationship between DT and internalizing and externalizing problems. When
examining externalizing behaviors, results suggested an interaction of DT and
adolescent ethnicity such that higher levels of alcohol use were found in Caucasian
youth with low levels of DT than in either Caucasian youth with high levels of DT or
in African-American youth regardless of DT level. In terms of delinquent behavior,
African-American youth with low levels of DT demonstrated higher levels of
delinquent behavior than either African-American youth with higher levels of DT or
Caucasian youth regardless of DT level. Results for internalizing problems suggested
an interaction of both adolescent gender and ethnicity with distress tolerance. First,
females with low levels of DT reported higher levels of internalizing symptoms than
females with higher levels of distress tolerance, but for males there was no effect of
DT on internalizing symptoms. Additionally, African-American adolescents with low
16
levels of DT reported greater levels of internalizing symptoms than African-American
adolescents with high DT. There was no effect of DT on internalizing symptoms in
Caucasian youth. These results suggest the potential importance of DT in both
externalizing and internalizing disorders. When viewed together, the research
examining DT suggests that it is related to ER and may be viewed as a behavioral
index of ER, but also that in adolescents, DT is significantly related to both
externalizing and internalizing disorders.
The Role of Attentional and Inhibitory Control in ER
Intrinsic factors involved in ER refer to individual differences within a person
(i.e., “innate”) which contribute to the development of ER (Fox & Calkins, 2003).
Some important intrinsic factors involved in the regulation of emotion include an
individual’s temperament, physiological and neural response systems, cognitive
skills, and executive functioning. Two executive functions, attentional and inhibitory
control, are particularly critical in the ability to regulate emotion.
Attentional control refers to the ability to voluntarily bias attention toward
goal-relevant information (i.e., top–down control of attention), and is an essential part
of successful performance in situations where multiple stimuli or stimulus features
compete for a limited set of resources (Blasi, Goldberg, Elvevag, Rasetti, Bertolino,
Cohen et al., 2007, Desimone & Duncan, 1995; Kastner & Ungerleider, 2001).
Essentially, attentional control consists of the abilities to focus attention and to be
flexible and adapt/shift attention (Rothbart & Bates, 2006). Attentional control
develops in the first year of life (Rothbart, 1989) and has been deemed a central
process in the development of ER (Kopp, 2002). In fact, individual differences in the
17
ability to sustain focus and shift attention are implicated in the development of the
effortful control of behavior (Ahadi & Rothbart, 1994).
Research from the developmental literature highlights the relationship
between attentional control and ER. First, attentional control has been inversely
related to negative emotionality in infants during distressing situations (Rothbart,
Posner, & Boylan, 1990). Cross-sectional studies of early infancy suggest that infants
who are classified as easily frustrated are observed to be less attentive and more
active than less easily frustrated infants in laboratory observations (Calkins, Dedmon,
Gill, Lomax, & Johnson, 2002). Furthermore, in the presence of negative affectivity,
a child’s ability to explore and maintain on-task behavior has been shown to diminish
(Calkins & Dedmon, 2000). The relationship between attentional control and
affectivity is even demonstrated at a physiological level. Research by Perez-Edgar
and Fox (2000) demonstrated that in 9 month-old infants, greater attentional focus
and lower levels of distractibility were related to higher levels of positive affect, less
social withdrawal, lower cortisol levels, and greater relative left frontal EEG
symmetry. Also, easily frustrated infants who demonstrate poor attentional control are
more physiologically reactive than less frustrated infants (Calkins et al., 2002).
Therefore, in the developmental literature, the positive relationship between
attentional control and ER has been well-established.
Inhibitory control is another important aspect of executive function related to
ER. Inhibitory control refers to the ability to inhibit processes or actions that are not
relevant to the task at hand (Rothbart & Posner, 1985). Deficits in inhibitory control
such as failures to anticipate or prepare behavioral responses, impulsive responses to
18
stimuli, and failures to adjust behavior after making an error, are the hallmark of
youth with ADHD (Pliszka, Glahn, Semrud-Clikeman, Franklin, Perez, Xiong, et al.,
2006). In childhood, inhibitory control develops around the age of 4, such that 4 year-
old children use rules to inhibit a dominant response (Gerardi, Rothbart, Posner, &
Kepler, 1996). Examination of inhibitory control and ER in children suggests that
children who are rated by parents and/or teachers as high on inhibitory control are
less likely to express negative emotions (as measured by observation), which is
believed to result from their increased ability to manage their attention, emotions, and
behavioral responses (Eisenberg & Spinrad, 2004). Investigations of individual
differences in youth have found that laboratory performance on tasks of inhibitory
control positively correlate with parent-reported inhibitory control and ER (Carlson &
Moses, 2001; Gerardi-Caulton, 2000; Jones, Rothbart & Posner, 2003; Kochanska,
Murray, & Harlan, 2000). Lastly, a study of inhibitory control and ER in preschoolers
ages 4 to 6 years-old demonstrated that individual differences in inhibitory control
were significantly correlated with youths’ ability to regulate their emotions, even after
controlling for child age and verbal ability (Carlson & Wang, 2007). Therefore,
attentional control and inhibitory control, known together as effortful control,5 both
demonstrate positive associations with ER.
5 The term effortful control will be used to refer to the processes of attentional and inhibitory control for conciseness. This term is defined in the literature as the “efficiency of executive attention, including the ability to inhibit a dominant response and/or to activate a subdominant response, to plan, and to detect errors.” (Rothbart, 1998, pg. 137). Effortful control includes the abilities to voluntarily manage attention (attentional regulation) and inhibit behavior (inhibitory control) as needed to adapt (Eisenberg, 2005 taken from the Encyclopedia on Early Childhood Development).
19
Effortful Control in Youth with ADHD: A Primary Deficit
By definition, youth with ADHD demonstrate extreme deficits in effortful control
(DSM-IV, 1994; Barkley, 1997). In fact, perhaps the most widely-established theory
of ADHD, Barkley’s behavioral inhibition model (1997), highlights the role of
effortful control in ADHD. Specifically, Barkley argues that youth with ADHD
possess a deficit in behavioral inhibition which refers to three inter-related processes:
(a) inhibition of the initial proponent response to an event; (b) stopping of an ongoing
response, which allows for a delay in response decision-making; and (c) inference
control, or the ability to inhibit an incorrect response while still engaging in the
prepotent response (i.e., the ability to inhibit the disruption from competing events or
responses).
A considerable amount of empirical evidence supports Barkley’s theory of
behavioral inhibition. For example, individuals with ADHD make more commission
errors on computerized tasks of sustained attention and inhibitory control than non-
ADHD comparison participants (Lijffijt, Kenemans, Verbaten, & Engeland, 2005;
Losier, McGrath, & Klein, 1996; Oosterlaan, Logan & Sergeant, 1998). Additionally,
individuals with ADHD demonstrate poorer stopping behavior during stop-signal
tasks as compared to non-ADHD comparison youth (for reviews see: Corkum &
Sigel, 1993; Lijffijt, et al., 2005; Losier, et al.,1996; Oosterlaan, et al., 1998).
Moreover, meta-analyses examining studies of Stroop performance in individuals
with ADHD support a deficit in interference control (i.e., the ability to select relevant
information while filtering out irrelevant distracting information), which requires
substantial effortful control (Lansbergen, Kenemans, & Van Engeland, 2008; Van
20
Mourik, Oosterlaan, & Sergeant, 2005). Youth with ADHD also demonstrate
significantly slower mean reaction times (MRT), greater reaction time variability
(SDRT), and slower stop-signal task reaction time (SSRT) in the face of competing
events or responses than non-disordered youth, suggesting deficits in effortful control
(Lijffijt, et al., 2005; Oosterlaan, et al., 1998). When considered together, the
empirical evidence on the importance of effortful control in ER and the evidence
suggesting primary deficits in effortful control in individuals with ADHD suggest that
individuals with ADHD would likely also have difficulties with ER, due to their poor
effortful control.
ER and ADHD
Studies of ER in youth with ADHD initially examined task persistence, as youth with
ADHD often demonstrate difficulties persisting in tasks during times of increased
emotional distress and/or frustration (Walcott & Landau, 2004). In an observational
study, 6-11-year-old boys with and without ADHD, boys with ADHD were less
effective in regulating emotion during a frustrating peer competition than age-
matched, non-ADHD comparison boys. That is, boys with ADHD displayed more
signs of negative or frustrated emotion than non-ADHD comparison boys.
Furthermore, in comparison to non-ADHD comparison boys, boys with ADHD
demonstrated an enduring pattern of disinhibition (as measured by longer stop-signal
reaction time; SSRT) before and after the frustration task (Walcott & Landau, 2004).
Another study demonstrated that 6-12 year-old youth with ADHD were more likely to
quit a frustrating puzzle task before completion, more likely to report frustration, and
less likely to engage in mood repair than non-ADHD comparison youth (Scime &
21
Norvilitis, 2006). Increased levels of frustration and decreased task persistence by
youth with ADHD have been reported during both academic and non-academic tasks
(e.g. videogames, mapping task) (Lawrence, Houghton, Tannock, Douglas, Durkin &
Whiting, 2002). Additionally, youth with ADHD have difficulty identifying and
processing negative emotions (Norvilitis, Casey, Brooklier, & Bonello, 2000; Singh
et al., 1998), which may interfere with their ability to persist in goal-directed activity
as well.
Direct examination of ER in youth with ADHD is also suggestive of
impairments in this domain. In a study of 49 first-grade boys and girls with and
without hyperactivity, participants were asked to engage in a conceptual learning task
involving non-contingent negative feedback. Results suggested that children with
hyperactivity expressed greater negative affect (i.e., negative verbal statements) in
response to negative feedback than children without hyperactivity (Rosenbaum &
Baker, 1984). Relative to non-ADHD comparison youth, youth diagnosed with
ADHD also become more aroused and excitable in response to rewards and more
visibly frustrated in the wake of declining reinforcement (Douglas, 1983). In social
communication, youth with ADHD are more emotional and negative in
communications with their non-ADHD peers (Pelham & Bender, 1982) and display
greater emotional intonation in their verbal interactions with their mothers in
comparison to youth without the disorder (Mash, 1993).
More recently, Melnick and Hinshaw (2000) examined ER in 6 to 12 year-old
boys with and without ADHD. Participants and their families were observed during a
3- segment family interaction designed to elicit frustration and distress (e.g., building
22
a Lego model with pieces missing). Boys with ADHD displayed significantly less
constructive patterns of emotional coping (e.g., inability to continue task in wake of
frustration, inability to seek help from parents when frustrated, extreme levels of
negative affect, inability to problem-solve, and extreme focus on negative aspects of
task) than did non-ADHD comparison boys. Furthermore, boys’ overall negative
emotion during the Lego task predicted their non-compliance during a naturalistic
summer camp program, even when core ADHD symptoms were controlled in the
analyses. In a similar study, Maedgen and Carlson (2002) examined ER during
disappointing and non-disappointing tasks in youth ages 8 to 11 years old diagnosed
with ADHD (both ADHD-CT and ADHD-IA) and non-ADHD comparison youth.
Results demonstrated that youth with ADHD-CT were rated as more intense and less
effective at ER (based on global ratings of overall disappointment) relative to youth
with ADHD-IA. In contrast, youth with ADHD-IA were no different than non-
ADHD comparison youth in ER, suggesting that youth with ADHD-IA may have
more intact ER abilities, which is consistent with Barkley’s (1997) hypothesis that
youth with ADHD-IA are not characterized by an inhibitory deficit. Taken together,
this literature provides strong support for the difficulties youth with ADHD
experience with ER. In particular, youth with ADHD who demonstrate symptoms of
both inattention and hyperactivity/impulsivity may have greater difficulties with ER
than ADHD youth with symptoms of inattention alone.
ADHD and Depression
A vast amount of research in the adult and child literatures has demonstrated a
negative association between ER and depression (e.g., Campbell-Sills, Barlow,

23
Brown, & Hoffman, 2006; Garber, Braafladt, & Weiss, 1995; Gross & John, 2003;
Larson, et al., 1990; Nolen-Hoeksema & Morrow, 1993; Rude & McCarthy, 2003).
Specifically, depressive affect and depressive disorders have been related to
dysfunctional ER (i.e., maladaptive ER strategies and a limited repertoire of
strategies) in both community (Larson, et al., 1990; Nolen-Hoeksema & Morrow,
1993; Reijntejes, Stegge, Terwogt, & Hurkens, 2007; Silk, Steinberg, & Morris,
2003) and clinical samples of youth (Garber, Braafladt, & Weiss, 1995; Ladouceur, et
al., 2005). For example, in a series of studies comparing youth diagnosed with
depressive disorders and those without such disorders, Garber and colleagues (1991,
1995) found that youth with depressive disorders reported poorer ER strategies (e.g.,
used fewer problem-focused and active distraction strategies and more avoidant,
passive, and aggressive strategies) than youth in the comparison group. Additionally,
youth in the depressed group reported lower expectations that the use of ER strategies
would ameliorate their negative emotions than did youth in the comparison group.
Dysregulated emotion has been hypothesized to precede the onset of
depressive disorders (Chaplin, Cole, Zahn-Waxler, 2005; Cole, Teti, & Zahn-Waxler,
2003); however, few studies have examined this relationship longitudinally. In a
study examining antecedents of early internalizing problems, Shaw and colleagues
(1997) found that difficulties with ER in infancy predicted higher levels of continuous
depressive symptoms during preschool. Furthermore, a recent longitudinal study of
girls who were between the ages of 5 and 8 at baseline found that difficulties with ER
predicted depressive symptoms at age 10 (Feng, Keenan, Hipwell, Henneberger,
Rischall, Butch et al., 2009).

24
Additionally, a growing literature has examined the relationship between
effortful control and symptoms of depression (Eisenberg, et al., 2001, 2005; Muris,
2006, 2007a, 2007b; Oldehinkel et al., 2007, Verstraeten, Vasey, Raes, Bijttebier,
2009). Muris et al. (2008) examined self-reported effortful control and depressive
symptoms in a community sample of 8 to 12 year-old youth. Results suggested
significant negative correlations between depressive symptoms and effortful control
(Muris et al., 2008). A similar relationship between effortful control and depressive
symptoms has been found in adolescents (Verstraeten et al., 2009). Moreover, Muris
(2006) concluded that effortful control significantly moderated the relationship
between negative affectivity and depressive symptoms in adolescents; however, the
temporal relationship between effortful control and depressive symptoms has not yet
been established in longitudinal studies.
Theoretical Models for the Relationship between Effortful Control, ER and
Depression
When considering a theoretical model for the relationship between ER and
depression, effortful control appears paramount. Specifically, vulnerability models of
psychopathology suggest that certain traits predispose individuals to or protect them
from certain kinds of psychopathology in some contexts, but that these traits are
inconsequential in other contexts (Shiner & Caspi, 2003; Tackett & Krueger, 2005;
Watson et al., in press). When applied to depression, effortful control can be viewed
as one such mechanism. Therefore, poor effortful control may lead to poor ER, and
therefore increased levels of depressive symptoms in the wake of various other risk
factors for depression (Figure 1).
25
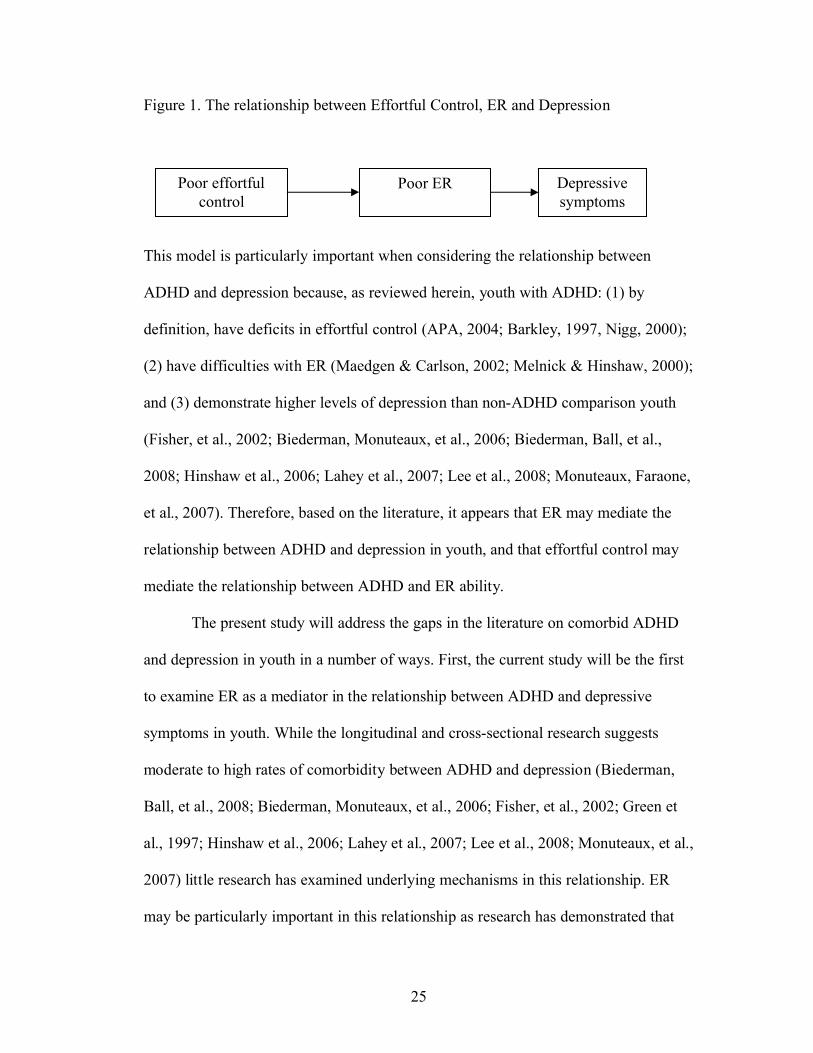
Figure 1. The relationship between Effortful Control, ER and Depression
This model is particularly important when considering the relationship between
ADHD and depression because, as reviewed herein, youth with ADHD: (1) by
definition, have deficits in effortful control (APA, 2004; Barkley, 1997, Nigg, 2000);
(2) have difficulties with ER (Maedgen & Carlson, 2002; Melnick & Hinshaw, 2000);
and (3) demonstrate higher levels of depression than non-ADHD comparison youth
(Fisher, et al., 2002; Biederman, Monuteaux, et al., 2006; Biederman, Ball, et al.,
2008; Hinshaw et al., 2006; Lahey et al., 2007; Lee et al., 2008; Monuteaux, Faraone,
et al., 2007). Therefore, based on the literature, it appears that ER may mediate the
relationship between ADHD and depression in youth, and that effortful control may
mediate the relationship between ADHD and ER ability.
The present study will address the gaps in the literature on comorbid ADHD
and depression in youth in a number of ways. First, the current study will be the first
to examine ER as a mediator in the relationship between ADHD and depressive
symptoms in youth. While the longitudinal and cross-sectional research suggests
moderate to high rates of comorbidity between ADHD and depression (Biederman,
Ball, et al., 2008; Biederman, Monuteaux, et al., 2006; Fisher, et al., 2002; Green et
al., 1997; Hinshaw et al., 2006; Lahey et al., 2007; Lee et al., 2008; Monuteaux, et al.,
2007) little research has examined underlying mechanisms in this relationship. ER
may be particularly important in this relationship as research has demonstrated that
Poor effortful control
Poor ER Depressive symptoms
26
youth with ADHD demonstrate poor ER (Maedgen & Carlson, 2002; Melnick &
Hinshaw, 2000). Moreover, research has suggested a negative association between
ER ability and depression (e.g., Campbell-Sills, et al., 2006; Garber, et al., 1995;
Gross & John, 2003; Larson, et al., 1990; Nolen-Hoeksema & Morrow, 1993; Rude &
McCarthy, 2003).
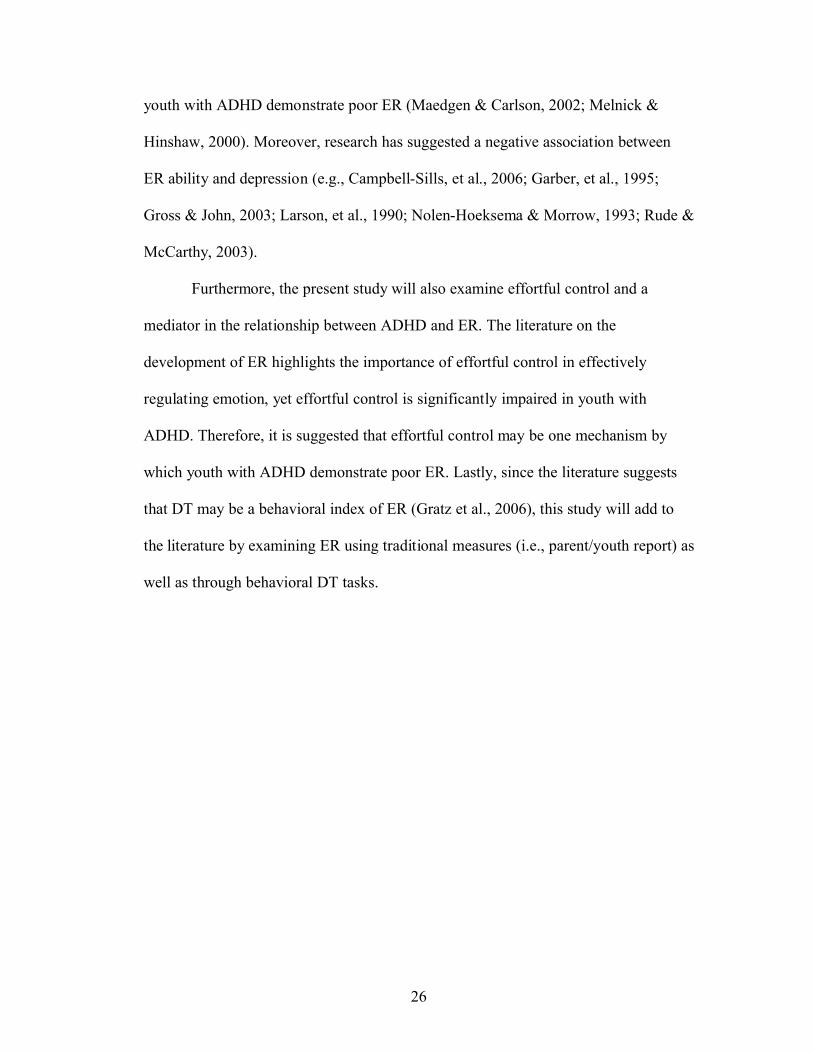
Furthermore, the present study will also examine effortful control and a
mediator in the relationship between ADHD and ER. The literature on the
development of ER highlights the importance of effortful control in effectively
regulating emotion, yet effortful control is significantly impaired in youth with
ADHD. Therefore, it is suggested that effortful control may be one mechanism by
which youth with ADHD demonstrate poor ER. Lastly, since the literature suggests
that DT may be a behavioral index of ER (Gratz et al., 2006), this study will add to
the literature by examining ER using traditional measures (i.e., parent/youth report) as
well as through behavioral DT tasks.
27
Chapter 2: Aims of the Present Study
Primary Aim 1
To compare youth ages 10-14-years-old both with and without ADHD on depressive
symptoms, ER, DT and effortful control.
Hypothesis 1
It was hypothesized that youth with ADHD would demonstrate greater levels of
depressive symptoms, lower levels of ER, and lower levels of effortful control than
non-ADHD comparison youth. Additionally, it was hypothesized that youth with
ADHD would be more likely to quit/demonstrate shorter latency to quit on behavioral
tasks of DT.
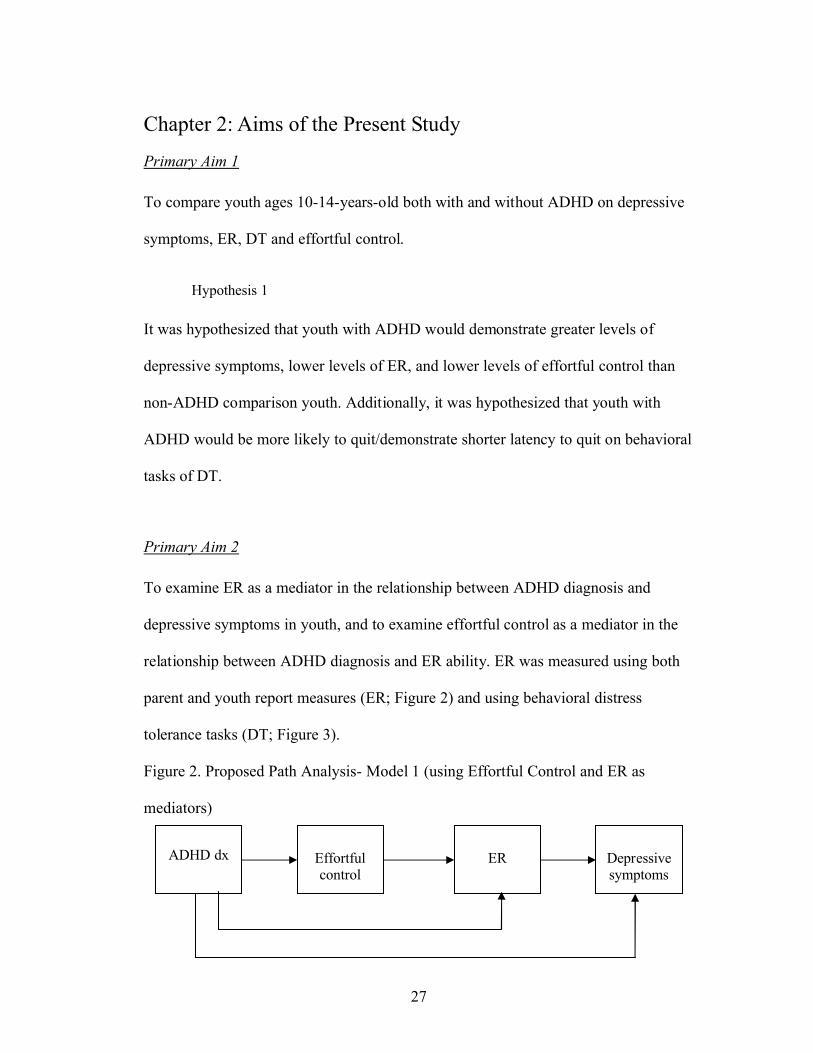
Primary Aim 2
To examine ER as a mediator in the relationship between ADHD diagnosis and
depressive symptoms in youth, and to examine effortful control as a mediator in the
relationship between ADHD diagnosis and ER ability. ER was measured using both
parent and youth report measures (ER; Figure 2) and using behavioral distress
tolerance tasks (DT; Figure 3).
Figure 2. Proposed Path Analysis- Model 1 (using Effortful Control and ER as
mediators)
EREffortful control
ADHD dx Depressive symptoms

28
Figure 3. Proposed Path Analysis- Model 2 (using Effortful Control and DT as the
mediators)
Hypothesis 2
For model 1, it was hypothesized that ADHD status would be negatively associated
with effortful control and ER and that effortful control would be positively associated
with ER. Moreover, it was hypothesized that the relationship between ADHD status
and ER would no longer be significant when effortful control was included in the
equation. That is, effortful control was expected to completely mediate the
relationship between ADHD diagnosis and ER. Further, it was hypothesized that
ADHD status would be positively associated with continuous levels of depression,
and that ER would be negatively associated with continuous levels of depression.
Lastly, it was hypothesized that ER would completely mediate the relationship
between ADHD and depressive symptoms. Therefore, both effortful control and ER
are specified as complete mediators in the model.
For model 2, in which DT was substituted for ER, the same hypotheses as
above were predicted. That is, it was hypothesized that ADHD status would be
negatively associated with effortful control and DT and that effortful control would
be positively associated with DT. Moreover, it was hypothesized that the relationship
between ADHD status and DT would no longer be significant when effortful control
DTEffortful control
ADHD dx Depressive symptoms

29
as included in the equation (i.e., would completely mediate the relationship). Further,
it was hypothesized that ADHD status would be positively associated with continuous
levels of depression and that DT would be negatively associated with continuous
levels of depression. Lastly, it was hypothesized DT would completely mediate the
relationship between ADHD and depressive symptoms. Therefore, both effortful
control and DT are specified as complete mediators in the model.
30
Chapter 3: Methods
Participants
Participants included 69 youth ages 10-14-years-old with (n = 37) or without
(n = 32) DSM-IV ADHD. Participants were recruited through mailings to University
of Maryland employees as well as treatment providers, schools, and community
centers in the Washington, D.C. metropolitan area, including families who had
previously been seen at the University of Maryland ADHD Program. For inclusion in
the study, youth were required to: (1) be between the ages of 10 and 14; (2) be fluent
in reading and writing English (i.e., could understand and complete questionnaires);
and (3) have at least one parent/guardian (i.e., mother or father) who was willing to
participate and could complete the study measures in English. Youth were excluded if
there was evidence of mental retardation (intelligence quotient [IQ] <70) based on a
brief IQ screen or evidence of psychosis, bipolar disorder or pervasive developmental
disorders (PDD). For inclusion in the ADHD group, youth had to meet full DSM-IV
criteria for ADHD according to diagnostic interview and parent and teacher report on
well-validated rating scales. Youth taking ADHD medications were included in the
study, but medication status was examined as a covariate in the analyses. For
inclusion in the non-ADHD comparison group, youth were not allowed to have more
than 3 symptoms of DSM-IV ADHD according to parent or teacher report.
The disposition of participants following screening and assessment is outlined
in Figure 4.
31
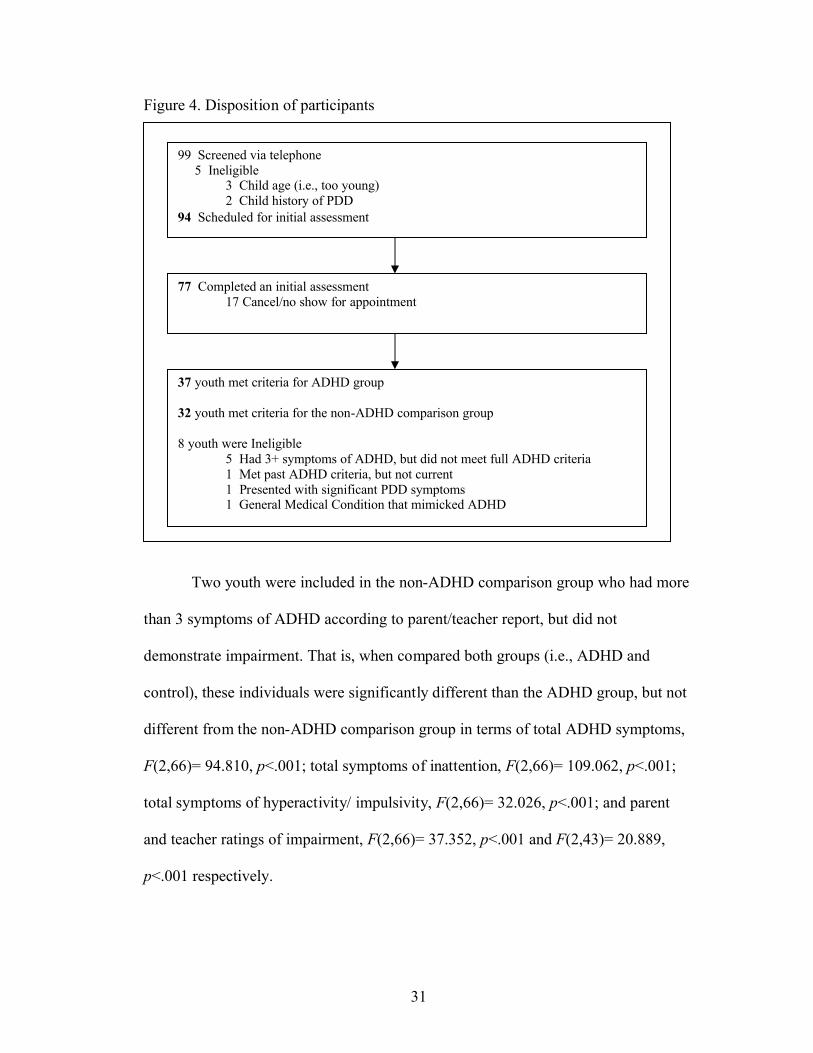
Figure 4. Disposition of participants
Two youth were included in the non-ADHD comparison group who had more
than 3 symptoms of ADHD according to parent/teacher report, but did not
demonstrate impairment. That is, when compared both groups (i.e., ADHD and
control), these individuals were significantly different than the ADHD group, but not
different from the non-ADHD comparison group in terms of total ADHD symptoms,
F(2,66)= 94.810, p<.001; total symptoms of inattention, F(2,66)= 109.062, p<.001;
total symptoms of hyperactivity/ impulsivity, F(2,66)= 32.026, p<.001; and parent
and teacher ratings of impairment, F(2,66)= 37.352, p<.001 and F(2,43)= 20.889,
p<.001 respectively.
99 Screened via telephone5 Ineligible
3 Child age (i.e., too young) 2 Child history of PDD
94 Scheduled for initial assessment
77 Completed an initial assessment17 Cancel/no show for appointment
37 youth met criteria for ADHD group
32 youth met criteria for the non-ADHD comparison group
8 youth were Ineligible 5 Had 3+ symptoms of ADHD, but did not meet full ADHD criteria 1 Met past ADHD criteria, but not current1 Presented with significant PDD symptoms1 General Medical Condition that mimicked ADHD
32
Therefore, following the initial assessment, 37 youth met criteria for the
ADHD group (DSM-IV diagnosis of ADHD) and 32 youth met criteria for the non-
ADHD comparison group. Overall, mean participant age was 11.67 years (SD=1.37).
Fifty-seven percent of the youth sample was male and 54% was Caucasian.
Furthermore, all parent participants were female except for one male (1.4%).
Demographic characteristics for parent and youth participants by group are presented
in Table 1. The ADHD and non-ADHD groups differed significantly based on
parental education level, F(1,56) = 10.238, p<.01. Specifically, parents in the non-
ADHD comparison group evidenced a higher mean level of education than parents in
the ADHD group. Groups also differed based on youth gender, χ² (1, N= 69) = 3.961,
p<.05, and ethnicity/race, χ2 (2, N=69) = 5.729, p<.05. Youth in the ADHD group
were more likely to be male whereas youth in the non-ADHD comparison group were
more likely to be female. Moreover, youth in the non-ADHD comparison group were
more likely to be Caucasian. As a result, these demographic factors were included as
covariates in the subsequent analyses.
Procedures
Participants completed a telephone screen to determine initial eligibility, and
if eligible, participants were scheduled for a single assessment at the University of
Maryland, College Park. During the assessment, parents completed a diagnostic
interview about the youth’s past and current ADHD and depression symptoms as well
as rating scales about youth ADHD, ODD and conduct disorder (CD) symptoms,
youth impairment in various functional domains, youth overall psychopathology
including depression symptoms, youth ER, parental depression symptoms, and a
33
parent/youth demographics questionnaire. Youth participants completed a diagnostic
interview about past and current depression symptoms, self-report measures of
depression symptoms, overall psychopathology and ER, a Stroop task measuring
effortful control, and two behavioral distress tolerance tasks. Youth also completed a
brief IQ screen using the Wechsler Intelligence Scale for Youth, 4th Edition (WISC-
IV) Block Design and Vocabulary subtests (WISC-IV, Wechsler, 1991). The utility of
the Vocabulary and Block Design subscales to estimate full scale IQ has been
demonstrated in a number of studies (e.g., Campbell, 1998; Seguin, Nagin, Assaad, &
Tremblay, 2004). Furthermore, this method has been shown to be the most
appropriate manner of estimating IQ in clinical samples of youth demonstrating a .92
correlation with full scale IQ (Campbell, 1988). Youth were paid $25 for their
participant and parents were allowed to attend a free workshop offered by the PI on
“Parenting an Adolescent”. Following the assessment, rating scales of ADHD, ODD
and CD symptoms and impairment were sent to youth’s teachers.
Measures
Assessment of Youth ADHD
The diagnosis of youth ADHD was made using a well-validated parent
interview and well-validated parent and teacher rating scales to assess symptoms and
impairments associated with ADHD. Parents/guardians of all youth were interviewed
using the Schedule for Affective Disorders for School-Aged Youth- Present and
Lifetime Version (K-SADS-PL; Kaufman, Birmaher, Brent, Rao & Ryan, 1997), a
semi-structured clinical interview assessing DSM-IV youth psychopathology. Parents
were administered the Behavioral Disorders module (ADHD, ODD, CD). All

34
interviews were conducted by the principal investigator, an advanced graduate
student in clinical psychology, who was supervised by a licensed clinical psychologist
(Andrea Chronis-Tuscano, Ph.D.). The K-SADS-PL provides information about
current clinical diagnoses as well as whether symptoms/diagnoses have ever been
present. On the K-SADS-PL each symptom was rated on a three-point scale, ranging
from 1 (not present) to 3 (threshold: definitely present), and symptoms were counted
as clinically significant if the clinician rated it as a “3” based on parent report. The K-
SADS-PL demonstrates strong psychometric properties of reliability (Ambrosini,
2000) and validity (Kaufman et al., 1997). Specifically, the K-SADS-PL has been
shown to demonstrate inter-rater reliability for diagnoses of ADHD, ODD and CD
with the following kappa scores, .77, .51, .68, respectively (Ambrosini, 2000).
Additionally, criterion validity for this measure was established via high correlations
between diagnoses on the K-SADS and scores in the clinical range for the
Internalizing and Externalizing subscales of the Child Behavior Checklist and the
scores in the clinical range on the Conners’ Parent Rating Scale for ADHD (Kaufman
et al., 1997).
Parents and teachers also completed the Disruptive Behavior Disorders
(DBD) symptom checklist (Pelham et al., 1992) which assesses ADHD, ODD and
CD symptoms. Parent and teacher ratings were utilized as data suggests that each
informant contributes a unique variance in identifying youth with ADHD (Hart et al.,
1994; Jensen et al., 1999). On the DBD, symptoms rated as occurring “pretty much”
or “very much” are considered present. Internal consistency for the DBD was high to
adequate on the ADHD (α = 0.95), ODD (α = 0.90) and CD (α = 0.75) scales.
35
For both parent interviews and the completion of parent and teacher measures,
informants were requested to report on youth’s behavior while off medication.
Diagnoses of ADHD were made by counting symptoms either parents or teachers
endorsed as occurring to a clinically significant degree on any of these measures
(Piacentini, Cohen, & Cohen, 1992).
In addition to exhibiting symptoms of inattention, hyperactivity and/or
impulsivity, youth also had to demonstrate cross-situational impairment in order to
meet DSM-IV criteria for ADHD (APA, 1994, 2000). Impairment was measured
using the Children’s Impairment Rating Scale (CIRS; Fabiano et al., 2006) which was
completed by both parents and teachers. On the CIRS, informants assess the youth’s
impairment and need for treatment across multiple domains, including peer/sibling
relations, self-esteem, academic achievement, and parent-child relations. Ratings are
made on a 7-point scale, with scores above the midpoint indicating clinically
significant impairment. The CIRS has demonstrated concurrent validity with other
established measures of youth impairment, and has been shown to accurately
discriminate between youth with ADHD and non-disordered youth (Fabiano et al.,
2006). Test-retest correlations for the parent CIRS range from 0.51-0.69 (p<0.001)
and for the teacher CIRS from 0.40-0.58 (p<0.001). Internal consistency for both
parent- and teacher-rated CIRS was high (α = .947; α = .876 respectively).
Assessment of Youth Depression
Youth depression was measured both categorically and continuously. Both
parents and youth were administered the Mood Disorders module of the KSADS-PL
to establish diagnoses of Major Depression and Dysthymia. However, given low base
36
rates of these disorders in youth, for the present study, depression was examined
continuously.
Youth completed two self-report ratings of depression, the Children’s
Depression Inventory (CDI; Kovacs & Beck, 1977, Kovacs, 1992) and the Behavioral
Assessment System for Children or Adolescents-Self-Report (BASC-SRS; BASC-SRS
for adolescents; Reynolds & Kamphaus, 1992) Depression subscale. The CDI is a
widely-used 27-item self-report inventory designed for use in 8-17 year olds. The
CDI inquires about depressive symptoms within the last 2 weeks and is scored on a 3-
point scale ranging from 0 (absence of the symptom) to 3 (presence of symptom at a
severe level), with a total range of 0 to 54. Scores of 19 and above are thought to be
associated with clinically significant depression (Smucker, Craighead, Craighead &
Green, 1986). In addition to total score, 5 subscales can be derived which include:
Negative Mood, Interpersonal Problems, Ineffectiveness, Anhedonia, and Negative
Self-Esteem (Kovacs, 1992). Raw scores were converted to t-scores based on
normative samples divided by age and sex (Kovacs, 1992). Good reliability and
validity have been established for the CDI (Kazdin, French, Unis & Esveldt-Dawson,
1983; Saylor, Finch, Spirito, & Bennett, 1984). For instance, construct and criterion
validity studies have demonstrated that the CDI relates to self-esteem, hopelessness,
cognitive processing, and depression as measured by other instruments (Kazdin,
1989b, 1990; Kovacs, 1992). Additional studies have found internal consistency to be
in the .80s (Cole & Carpentieri, 1990; Kovacs, 1992). Internal consistency for the
current study was high (α= .90).
37
Youth also completed the BASC-SRS, a multidimensional measure used to
assess adaptive and behavior problems in both children and adolescents. The BASC
was constructed using structural equation modeling; therefore, the subscales represent
a “pure” index of the constructs being assessed, as there is no overlapping content
(Weis & Smenner, 2007). Depending on their age, participants completed either the
BASC-SRS-2 (for children ages 6-11) or the adolescent version (for ages 12-21).
Computerized scoring of the BASC produces t-scores for all subscales based on youth
age and gender (Reynolds & Kampaus, 1992). For the present study, the Depression
subscale, which is composed of 17 items that assess feelings of unhappiness, inability
to experience pleasure, and dejection was used. The BASC Depression subscale
demonstrates strong internal consistency (α = .88) and test-retest reliability (r =.75)
(Reynolds & Kamphaus, 1992), and when compared to other measures of emotional
and behavioral functioning (parent, self and other report), the Depression subscale
offers good convergent and discriminate validity (Ostrander & Herman, 2006).
Parents completed the Behavioral Assessment System for Children or
Adolescents- Parent-Report (BASC-PRS; BASC-PRS for adolescents; Reynolds &
Kamphaus, 1992) in order to report on youth depressive symptoms. Depending on
child age, parents completed either the BASC-PRS-2 for children ages 6-11 or the
BASC-PRS-2 for adolescents ages 12-21. Both measures contain between 130-160
items and use a 4-choice response format ranging from 0 (never) to 3 (always).
Again, the Depression subscale (t-score) was utilized and very good internal
consistency (α = .86) and test-retest reliability (r =.87) have been reported (Reynolds
& Kamphaus, 1992). Furthermore, the depression subscale has demonstrated good
38
convergence with other measures of affective disturbance (Ostrander & Herman,
2006).
Emotion Regulation6
Parent- and youth- rated measures of ER were collected. Parents completed
the Emotion Regulation Checklist (ERC; Shields & Cicchetti, 1997), a 24-item
measure of caregivers’ perceptions of their youth’s ability to regulate emotion. Items
on the ERC assess the frequency with which youth exhibit a variety of positive and
negative emotion-regulation related behaviors (e.g. “Can say when s/he is feeling sad,
angry or mad, fearful or afraid”, “Shows positive feelings in response to friendly or
helpful gestures by adults”), and are rated on a 4-point Likert scale (1 = rarely/never;
4 = almost always). The ERC contains two separate orthogonal factors: (1)
Lability/Negativity which reflects items assessing mood swings, angry reactivity,
emotional intensity and dysregulation of positive emotion, and (2) Emotion
Regulation, which reflects processes central to the adaptive regulation of emotion
including equanimity, emotional understanding and empathy (Shields & Cicchetti,
1997). For the purposes of the present study, only the Emotion Regulation subscale
was used in statistical analyses. On the ER subscale, higher scores are reflective of a
6 One limitation frequently cited in studies of ER, is that measures of ER often contain items that overlap with symptoms of depression making the independence of these constructs difficult to assess (see Abela & Hankin, 2007; Gotlib & Hammen, 2008; Nolen-Hoeksema & Hilt, 2008, for reviews). Given this issue, the ER measures used in the current study were examined for overlapping items with depressive symptoms. It was noted that 2 items on the ER subscale of the ERC (i.e., Is a cheerful child; Seems sad or listless) and 3 items on the DERS (i.e., When I’m upset, I believe that I’ll end up feeling very depressed; When I’m upset, I have difficulty concentrating; When I’m upset, I start to feel very bad about myself.) overlapped with depressive symptoms. When these items were removed internal consistency for the ER scale on the ERC dropped from .75 to .65 and on the DERS from .92 to .91. Given the reduction of internal consistency for the ERC, analyses presented in the results section do not have the overlapping items removed. However, to ensure that the relationship between ER and depression in the current study was not due to measurement error, all analyses were re-run with the overlapping items removed from the ER measures. A detailed description of these analyses can found in Appendix C. It should be noted that even with removal of these overlapping items, ER still mediated the relationship between ADHD and depression.
39
greater ability to regulate one’s emotions. Previous research with the ERC has
demonstrated good construct validity (i.e., has been associated with other measures of
childhood ER) and has been shown to discriminate between well-adjusted and
maltreated youth between the ages of 6 to 12 years (Shields & Cicchetti, 1997, 1998;
2001); however, the measure has been used with adolescents as well (Gratz, Tull,
Reynolds, Daughters, and Lejuez, in press). Internal consistency for the ER subscale
was adequate (α = 0.75).
Youth participants completed a self-report measure of ER, the Difficulties in
Emotion Regulation Scale (DERS, Gratz & Roemer, 2004). The DERS is a 36-item
measure that assesses six domains of emotion dysregulation: nonacceptance of
negative emotions, inability to engage in goal-directed behaviors when distressed,
difficulties controlling impulsive behaviors when distressed, limited access to ER
strategies perceived as effective, lack of emotional awareness, and lack of emotional
clarity. A total score reflecting overall emotion dysregulation is also derived with
higher scores reflecting greater difficulties in regulating emotion. The DERS has high
internal consistency (α= .93), good test–retest reliability (ρ1= .88, p< .01), and
adequate construct and predictive validity (Gratz & Roemer, 2004). Furthermore, in a
youth sample of adolescents’ ages 11-17-years-old, confirmatory factor analysis
demonstrated the same six factor structure shown with adult populations, and DERS
scores were meaningfully related to youth ratings of externalizing and internalizing
problems (Newmann, van Lier, Gratz & Koot, 2009). Internal consistency for the
current study was high (α= .92).
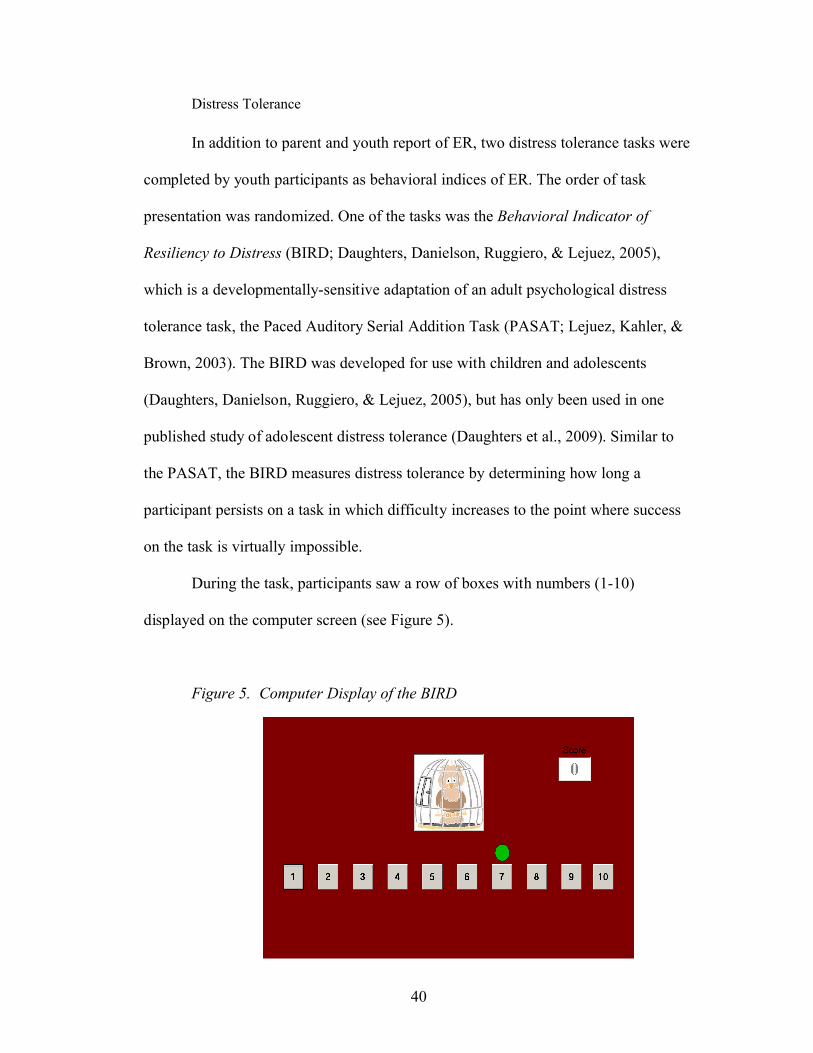
40
Distress Tolerance
In addition to parent and youth report of ER, two distress tolerance tasks were
completed by youth participants as behavioral indices of ER. The order of task
presentation was randomized. One of the tasks was the Behavioral Indicator of
Resiliency to Distress (BIRD; Daughters, Danielson, Ruggiero, & Lejuez, 2005),
which is a developmentally-sensitive adaptation of an adult psychological distress
tolerance task, the Paced Auditory Serial Addition Task (PASAT; Lejuez, Kahler, &
Brown, 2003). The BIRD was developed for use with children and adolescents
(Daughters, Danielson, Ruggiero, & Lejuez, 2005), but has only been used in one
published study of adolescent distress tolerance (Daughters et al., 2009). Similar to
the PASAT, the BIRD measures distress tolerance by determining how long a
participant persists on a task in which difficulty increases to the point where success
on the task is virtually impossible.
During the task, participants saw a row of boxes with numbers (1-10)
displayed on the computer screen (see Figure 5).
Figure 5. Computer Display of the BIRD
41
Participants were instructed that the green dot would appear over one of the number
boxes and that they were to use the computer’s mouse to click on the number box
below the green dot before the dot disappeared. If the number box was clicked before
the dot disappeared, the “bird” on the screen was let out of the cage and the computer
made a chirping noise. However, if the green dot disappeared before the participant
clicked on the number, a loud and abrasive noise was heard and the bird remained in
its cage. For each time the participant freed the bird from the cage (i.e., clicked on the
number box before the dot disappeared), he/she received a point. No points were
awarded for missed green dots.
The task consisted of three levels with varying latencies between dot
presentations. Specifically, the first level of the BIRD lasted 3 minutes and began
with a 5-second latency between dot presentations. The latency in this phase was
titrated by 0.5 seconds based on participant performance. For example, a correct
response reduced the latency by 0.5 seconds (to 4.5 sec) whereas an incorrect answer
or non-response increased the latency by 0.5 seconds (5.5 sec). In the second level,
which lasted for 5 minutes, the average latency determined from the first level was
used for dot presentation during the first four minutes. However, during the last
minute of the second level, the latency of dot presentation was reduced in half making
the task extremely difficult (i.e., challenge latency). Following the second level,
participants received a brief rest period and then began the final level which lasted for
up to 5 minutes and utilized the extremely difficult challenge latency. During the final
level, participants could utilize the “escape option” which terminated the task.
42
Specifically, participants were informed prior to beginning the task that once the final
level began they could quit the task by clicking the ‘quit game’ button on the
computer screen. However, they were also informed that the magnitude of their cash
prize was dependent on how well they did on the task, but were not given specific
“criteria” to determine their earnings. Throughout the task, the participant had the
opportunity to see how many points he/she had earned as displayed on the right-hand
side of the screen. Distress tolerance was indicated by persistence on the final level of
the task which was examined as a continuous variable (i.e., latency to quit)
(Daughters et al., 2005). Total score on the first two levels of the game was recorded
to control for the effects of skill on persistence. Due to technical issues, data for 3
individuals (2 ADHD and 1 control participant; 4%) was missing.
Before beginning the BIRD (i.e., before Level 1) and after Level 2,
participants completed the Positive and Negative Affect Schedule for Children
(PANAS-C, Laurent et al., 1999) to measure the extent to which the BIRD elicited
distress (i.e., manipulation check). The PANAS-C is a child adaptation of the PANAS
(Watson, Clark, Tellegen, 1988), which has been demonstrated to reliably measure
positive and negative affect in children and adolescents (Laurent et al., 1999). The
measure is composed of two subscales: one which measures Positive Affect (5 items)
(e.g., excited, interested, happy, energetic, and proud) and one that measures Negative
Affect (5 items) (e.g., mad, frustrated, upset, embarrassed, nervous). All items are
rated on a 5-point Likert scale ranging from: 1 = very slightly or not at all to 5 =
extremely. The PANAS-C has demonstrated good psychometric properties of
reliability and validity with elementary age youth (in 4th through 8th grades) (Laurent
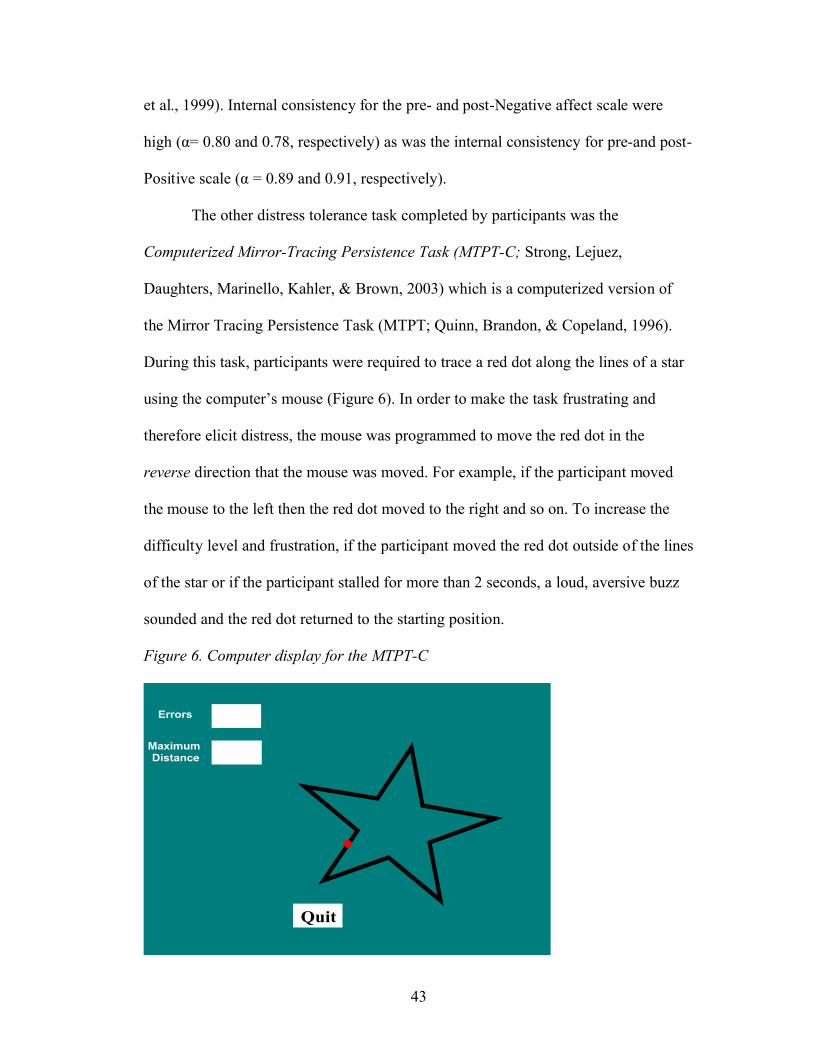
43
et al., 1999). Internal consistency for the pre- and post-Negative affect scale were
high (α= 0.80 and 0.78, respectively) as was the internal consistency for pre-and post-
Positive scale (α = 0.89 and 0.91, respectively).
The other distress tolerance task completed by participants was the
Computerized Mirror-Tracing Persistence Task (MTPT-C; Strong, Lejuez,
Daughters, Marinello, Kahler, & Brown, 2003) which is a computerized version of
the Mirror Tracing Persistence Task (MTPT; Quinn, Brandon, & Copeland, 1996).
During this task, participants were required to trace a red dot along the lines of a star
using the computer’s mouse (Figure 6). In order to make the task frustrating and
therefore elicit distress, the mouse was programmed to move the red dot in the
reverse direction that the mouse was moved. For example, if the participant moved
the mouse to the left then the red dot moved to the right and so on. To increase the
difficulty level and frustration, if the participant moved the red dot outside of the lines
of the star or if the participant stalled for more than 2 seconds, a loud, aversive buzz
sounded and the red dot returned to the starting position.
Figure 6. Computer display for the MTPT-C
Errors
Maximum Distance
20
400
Quit
44
Participants were told that they could end the task at any time by pressing any key on
the computer keyboard, but they were also reminded that how well they did on the
task affected how much money they would earn. After receiving instructions,
participants began the task and worked independently until the five minute maximum
or until they quit. Participants were not told the maximum duration prior to beginning
the task. Due to technical issues, data from 5 individuals (2 ADHD and 3 control
participants; 7%) was missing.
Similar to the BIRD, distress tolerance was measured as a continuous variable
(latency to quit). Because the MTPT-C is comprised of only a single level, dysphoria
could not be assessed without confounding termination latency. However, before and
after the task, participants rated their current: irritability, frustration, anxiety,
difficulty concentrating and bodily discomfort on a scale of 0-100, and these ratings
were examined as a manipulation check. Given the aim of the current study to
examine DT in an ADHD and non-ADHD sample, the item of “difficulty
concentrating” was removed from the manipulation check in order to not bias results.
Internal consistency for pre-task and post-task ratings was adequate (α = 0.80, and 0.
74 respectively)
Effortful Control
The Stroop task (1935) is one measure of executive function used to assess
selective attention and cognitive flexibility. The Stroop task measures an individual’s
ability to shift cognitive set (Spreen & Strauss, 1998), which allows for the
measurement of cognitive inhibition (Archibald & Kerns, 1999; Boone, Miller,
Lesser, Hill & D’Elia, 1990) and the ability to inhibit a dominant response (i.e.,
45
reading) in order to complete a required task (i.e., color-naming) (Spreen & Strauss,
1998). Research on the Stroop task has suggested that two processes are involved: an
automatic response which requires very little attention (word-reading) and a more
controlled response which requires attention and voluntary control (color-naming)
(Cohen et al., 1990).
While many cognitive tasks exist to examine effortful control in youth (e.g.,
Stop Signal task, antisaccade tasks, Stroop task, etc), a great deal of literature has
examined interference control/response inhibition in youth with ADHD using the
Stroop task (Homack & Riccio, 2004). While results have been mixed as to whether
the Stroop task distinguishes between ADHD and non-ADHD participants (e.g.,
Boonstra, et al., 2005; Scheres et al., 2004; Homack & Riccio, 2004; Schwartz &
Verhaeghen, 2008), a significant number of studies have suggested poorer
performance on the Stroop task by ADHD individuals in comparison to controls
(Homack & Riccio, 2004). Furthermore, despite these mixed findings, the Stroop task
still remains the most frequently used task to examine response inhibition (Schwartz
& Verhaeghen, 2008). Therefore, a computerized Stroop task was used to measure
effortful control in the present study.
All Stroop tasks involve words and symbols (i.e., stimuli) being presented in
various colors of ink. Participants were instructed to respond to the color of the ink
presented, not what the word said. For example, if the word RED was presented in
BLUE ink, the participant should have responded “BLUE”. A computerized Stroop
task was utilized for the present study. Specifically, the task was administered on
laptop computer using DirectRT Precision Timing Software v. 2006.2.0.28© (Blair
46
Jarvis, Ph.D.; www.empirisoft.com). Instructions and stimuli were presented in Times
New Roman, font size 54. Stimuli consisted of four single color words (‘RED’.
‘BLUE’, ‘YELLOW’ and ‘GREEN’) and non-word stimuli (*) in corresponding
length to mimic color word length (i.e., *** for red vs. ****** for yellow) presented
in red, blue, green or yellow ink colors. Prior to stimuli presentation, participants
were oriented to the computer screen using a priming symbol (+) in the middle of the
screen. Participants made responses on the keyboard using the following key response
codes: A = red, S= blue, K= yellow, L= green. To assist participants, these keys were
labeled with a colored dot that corresponded to the response key color. Directions for
the task were read by the examiner as follows:
“During this game, you are going to see words and symbols on the
computer screen. The words and colors will be printed in different
colors of ink. Your job is to press the colored key on the keyboard that
is the same color as the color of the ink, not what the word says.
For example, if you see the word "blue" written in red ink, which
button would you press? What if you saw the word "green" written in
yellow ink, which button would you press? Ok, now that you know
what to do, let's practice a few. Remember to respond as quickly, but
as correctly as you can. Press any key to continue.”
During the instructions, if participants made a correct response they were told, “Great
job, that’s exactly right!”; however, if they made any incorrect response they were
corrected (i.e., “Actually the word reads ‘blue’ but it is written in red ink, so you
would say red”). Following the instructions, participants engaged in a 2 minute
47
practice trial with the examiner standing in the room. Following the practice trial, the
actual trials began which lasted for 10 minutes.
The Stroop task consisted of three types of trials: 144 congruent trials in
which the word and the color presented were the same (e.g., the word green written in
green ink), 24 incongruent trials in which the word and the color presented were
different (e.g., the word green written in red ink) and 24 baseline trials in which
symbols (e.g., *******), rather than words were presented, in various colors. Both
between group and within group randomization occurred during the presentation of
trials and stimuli were presented in 750ms intervals. Participant responses times (RT)
were recorded in milliseconds for every trial. Each participant’s data for every trial
was stored in a separate Excel spreadsheet. For every participant, the following
variables were calculated for congruent trials, incongruent trials and baseline trials:
number correct, percent correct, number incorrect, mean RT correct, and mean RT
incorrect. Stroop effect (i.e., Stroop interference) was calculated for both RT data and
percent correct data. For both types of data, Stroop effect was calculated by
subtracting mean RT/percent correct for incongruent trials from the mean RT/percent
correct for baseline trials. Stroop facilitation was calculated by subtracting mean RT
congruent trials from mean RT baseline trials. Due to technical issues, data from 14
individuals (8 ADHD and 6 control participants; 20%) was missing. Split half-
reliability for Stroop effect (RT) was poor (r= -.168, p=n.s.)
48
Chapter 4: Results
Preliminary Analyses
All data were double-entered by two independent research assistants, and the
databases were compared, cleaned and verified by the principal investigator using
SPSS Statistics GradPack 17.0.0 (www.spss.com). Prior to conducting planned
analyses, all variables were examined for distributional properties and outliers using
methods discussed by Tabachnick & Fidell (1996, 2001, 2007). Prior to the main
analyses, preliminary analyses were conducted to examine if composite factors could
be created for youth depression and youth ER, so as to utilize the information
provided by both parent and youth report. Additionally, ER was measured in two
ways: (1) using a composite measure of parent and youth report, and (2) using
behavioral tasks of DT. Lastly, manipulation checks were conducted for the distress
tolerance tasks to ensure they elicited distress.
Variable Examination
Normality was assessed for all variables via visual inspection of the
distribution graphs and assessment of skewness and kurtosis values (Field, 2005;
Hair, et al., 2006; Tabachnick & Fidell, 2001, 2007). First, all variables were
examined for outliers using both visual inspection of Boxplots and statistically by
converting the variables to standardized scores (z-scores) and examining those with z-
scores greater than 3.29 (Tabachnick & Fidell, 2001, 2007). The only variable which
produced significant outliers was effortful control (i.e., Stroop effect measured as
RT). One significant outlier was found, and examination of this participant’s

49
individual trial data during the task revealed an overall pattern of markedly delayed
response; therefore, this participant’s effortful control data was removed from
subsequent analyses.
Once outliers were removed from the data, z-scores were computed for
skewness and kurtosis using the standard error term, for all variables, and variables
demonstrating z-scores equal to or less than 3.29, the criterion recommended for
small samples (Field, 2005; Hair, et al., 2006), were included. One of the youth
measures of depression, the BASC-SRS, demonstrated significant levels of skew, z
=5.70, and kurtosis, z= 3.29, and as such was dropped from subsequent analysis.
Therefore, only two measures of depression, youth-rated CDI and parent-rated BASC
were included in for the depression composite score discussed below. Furthermore,
one of the Stroop variables, Stroop effect measured through percent correct, also
displayed significant levels of skew, z= -4.364, and kurtosis, z= 8.548. Therefore, this
variable was not used for subsequent analyses. Distribution statistics, including mean,
standard deviation, range, skewness and kurtosis are presented in Appendix B.
Data Reduction
Depression composite
Preliminary analyses were conducted to examine the association between
parent-(BASC- Depression subscale t-score) and youth- (CDI total t-score) rated
continuous youth depression scores. As mentioned previously, the youth-rated BASC
score was not included due to non-normal distribution of scores. Results examining
parent and child depressive symptoms ratings suggested a high degree of relatedness.
Specifically, parent report was significantly positively related to youth report, r=.401,
50
p<.01. As a result, t-scores for these two measures were averaged to create a
composite depression score in which higher scores are reflective of higher levels of
depressive symptoms. T-scores were averaged to create a composite (instead of
conducting PCA) because t-scores provide clinically meaningful data as they utilize
clinical cut-points which distinguish between those with significant levels of a
disorder and those without significant levels of a disorder. Essentially, t-scores are
more interpretable than composites completed by PCA.
ER composite
Principal components factor analysis (PCA) was conducted with parent- (ERC
ER subscale) and youth- (DERS total score) reported ER variables to examine
whether these variables could be examined as a singular composite construct of ER. It
should be noted that on the ERC, higher scores are reflective of a greater ability to
regulate one’s emotions whereas for the DERS higher scores reflect greater
difficulties in regulating emotion. A significant negative correlation was found
between parent and youth report, r=-.413, p<.000, indicating that as DERS scores
decrease (i.e., indicating greater regulation or less dysregulation), ER subscale scores
increase (indicating greater ER ability). The Kaiser-Meyer-Olkin measure of sample
adequacy was acceptable, KMO= .500, as was Bartlett’s test of sphericity, χ2(1) =
12.41, p<.000 (Field, 2005; Hair, et al., 2006). Using the Kaiser (1960) criteria for
eigenvalues, results of PCA demonstrated a one factor solution (eigenvalue = 1.413)
which accounted for 70.6% of the variance (communality extraction value = .706).
Use of a scree plot as proposed by Catell (1966) also produced a one factor solution.
Component scores from the coefficient matrix were .595 and -.595 for the ERC ER
51
subscale and DERS total score, respectively. Therefore, PCA analyses supported use
of an ER composite in which higher scores are reflective of a greater ability to
regulate one’s emotions.
Manipulation Check
Manipulation checks were conducted on both distress tolerance tasks. If the
DT tasks indeed elicited distress, we would expect differences between pre- and post-
task scores on measures of negative affect (e.g., PANAS) in which post scores
demonstrated higher levels of negative affect than pre-task scores. On the BIRD,
individuals persisted for an average of 272.89 seconds (SD=61.03) and only 26% quit
the task before the 5 minute time limit expired. Paired t-tests did not indicate a
significant increase in the level of self-reported negative affect during the first two
levels of the task, t(68)= -1.081, p= n.s. These results are inconsistent with the only
other published study that used the BIRD with youth ages 9-13 which found that
approximately 50% of the sample quit the task before the 5-minute time limit
(Daughters et al., 2009). Moreover, manipulation checks conducted by Daughters and
colleagues (2009) using the PANAS-C suggested a significant (p<.001) increase in
negative affect from pre- to post-task ratings. Skill on the BIRD task, as indicated by
the number of correct responses during the first two levels of the game, was examined
in relation to latency to quit. Results suggested that skill level was not related to
persistence on the task (p = n.s.). Therefore, the BIRD task did not elicit distress in
this sample, and was therefore not used in subsequent analyses.
On the Mirror-tracing task, individuals persisted for an average of 139.41
seconds (SD= 109.67), and 73% of participants quit the task before the five minute
52
time limit expired. Participants reported experiencing moderate amounts of distress as
a result of the Mirror-tracing task, as demonstrated through a paired t-test comparison
of pre-task and post-task distress, t(63) = -7.435, p <.000. Additionally, the
relationship between the error count (number of errors an individual made during the
task) and latency to quit was significant, such that individuals who made more errors
were significantly more likely to quit the task, r= .592, p<.01. Therefore, results
suggested that the Mirror-tracing task adequately elicited distress, and as such latency
to quit on the Mirror-tracing task was used as the overall measure of DT. Lastly,
BIRD latency to quit and Mirror tracing latency to quit were not significantly
associated with one another, r=.178, p= n.s.
Comparison of Groups on ADHD, ODD, and CD Symptoms and Overall
Impairments
General linear models multivariate analysis of variance (GLM MANOVA)
analyses were conducted to compare groups on ADHD, ODD, and CD symptoms and
parent-rated overall impairment. A separate ANOVA was conducted for teacher-rated
overall impairment given the reduction in sample size due to missing teacher data
(n=46 versus n=69). Child gender and ethnicity/race as well as parental education
were included as covariates in these analyses as these variables were significantly
different between groups (see Table 1). The multivariate test of differences between
groups on ADHD, ODD, and CD symptoms and parent-rated impairment using the
Wilks Lamba criterion was statistically significant, F(5,60) =38.437, p=.000, η2=
.762. Follow-up ANOVAs demonstrated significant differences between groups in
which youth in the ADHD group demonstrated greater levels of total ADHD
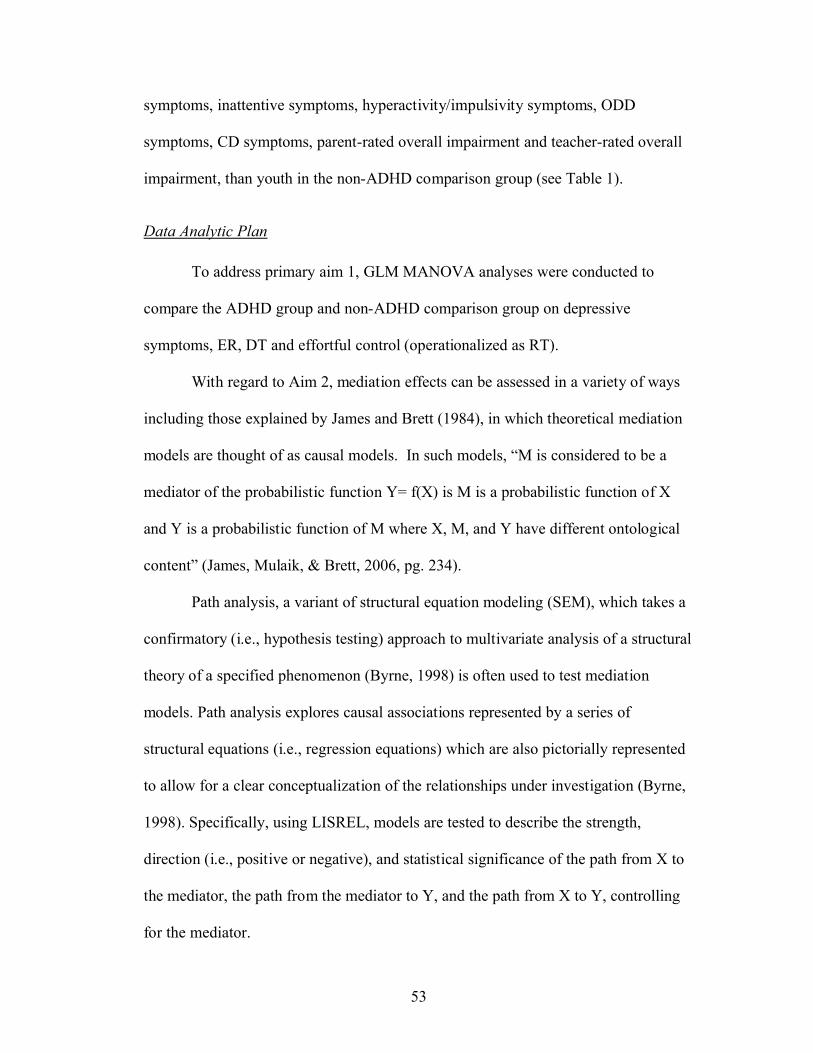
53
symptoms, inattentive symptoms, hyperactivity/impulsivity symptoms, ODD
symptoms, CD symptoms, parent-rated overall impairment and teacher-rated overall
impairment, than youth in the non-ADHD comparison group (see Table 1).
Data Analytic Plan
To address primary aim 1, GLM MANOVA analyses were conducted to
compare the ADHD group and non-ADHD comparison group on depressive
symptoms, ER, DT and effortful control (operationalized as RT).
With regard to Aim 2, mediation effects can be assessed in a variety of ways
including those explained by James and Brett (1984), in which theoretical mediation
models are thought of as causal models. In such models, “M is considered to be a
mediator of the probabilistic function Y= f(X) is M is a probabilistic function of X
and Y is a probabilistic function of M where X, M, and Y have different ontological
content” (James, Mulaik, & Brett, 2006, pg. 234).
Path analysis, a variant of structural equation modeling (SEM), which takes a
confirmatory (i.e., hypothesis testing) approach to multivariate analysis of a structural
theory of a specified phenomenon (Byrne, 1998) is often used to test mediation
models. Path analysis explores causal associations represented by a series of
structural equations (i.e., regression equations) which are also pictorially represented
to allow for a clear conceptualization of the relationships under investigation (Byrne,
1998). Specifically, using LISREL, models are tested to describe the strength,
direction (i.e., positive or negative), and statistical significance of the path from X to
the mediator, the path from the mediator to Y, and the path from X to Y, controlling
for the mediator.
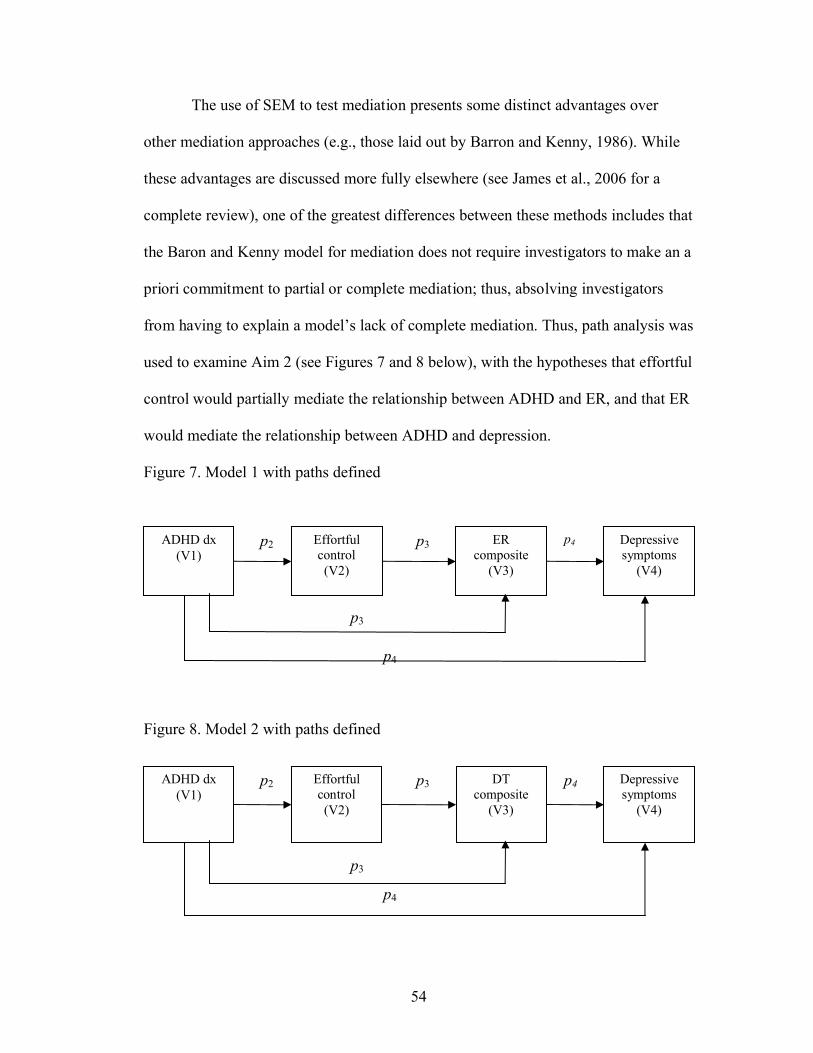
54
The use of SEM to test mediation presents some distinct advantages over
other mediation approaches (e.g., those laid out by Barron and Kenny, 1986). While
these advantages are discussed more fully elsewhere (see James et al., 2006 for a
complete review), one of the greatest differences between these methods includes that
the Baron and Kenny model for mediation does not require investigators to make an a
priori commitment to partial or complete mediation; thus, absolving investigators
from having to explain a model’s lack of complete mediation. Thus, path analysis was
used to examine Aim 2 (see Figures 7 and 8 below), with the hypotheses that effortful
control would partially mediate the relationship between ADHD and ER, and that ER
would mediate the relationship between ADHD and depression.
Figure 7. Model 1 with paths defined
Figure 8. Model 2 with paths defined
p3
p3
p4
p4p2 ER composite
(V3)
Effortful control(V2)
ADHD dx(V1)
Depressive symptoms
(V4)
p3
p3
p4
p4p2 DT composite
(V3)
Effortful control(V2)
ADHD dx(V1)
Depressive symptoms
(V4)
55
In the proposed path analyses, all variables (Vx) of interest are denoted. ADHD
diagnosis represents an exogenous variable while effortful control, ER/DT and
depressive symptoms represent endogenous variables. The paths (pxy) between
variables are denoted using the numbers of the specific variables involved in the
relationship. For example, the path between ADHD diagnosis (labeled as V1 or
variable 1) and effortful control (labeled as V2 or variable 2) is represented as p21
because it relates variables 1 and 2.
Main Analyses
Primary Aim 1: To compare youth with and without ADHD on depressive
symptoms, ER, DT and effortful control (RT).
Correlation analyses were conducted to examine the relationships between the
independent, dependent, mediator and demographic variables of interest. Pearson
product-moment correlations were used to examine the relationships between
continuous variables while Kendall’s tau was used to examine the relationships
between dichotomous variables or a dichotomous and a continuous variable. The
resulting correlation matrix is presented in Table 2.
Results indicated that ADHD diagnosis was positively related to depressive
symptoms, τ = .386, p<.01, and negatively related to ER, τ = -.397, p<.01. However,
ADHD was not significantly related to either effortful control or DT. Depression and
ER were negatively related, r= -.701, p<.01, but depression was not related to DT or
effortful control. Lastly, ER was not significantly related to youth DT, r=.182, p=n.s.
Given these findings, exploratory analyses were conducted examining the relationship
56
between DT and parent-rated ER and youth-rated ER separately. Results suggested
that DT was not significantly related to either parent-rated ER, r=-.097, p=n.s., or
youth-rated ER, r=.210, p=n.s. Furthermore, when relationship between ER and DT
was examined in each group separately, results still suggested no significant
relationship between these constructs.
In terms of demographic variables, child ethnicity/race was positively related
to ADHD diagnosis, τ = .239, p<.05, such that youth in the ADHD group were more
likely to be non-Caucasian while youth in the control group were more likely to be
Caucasian. Child race/ethnicity was also related to overall depression score, τ = .242,
p<.01, and ER, τ = -.301, p<.01, such that African-American youth demonstrated
higher levels of depression and poorer ER than Caucasian youth. Child gender was
significantly related to ADHD diagnosis, τ = -.240, p<.05, in that youth with ADHD
were more likely to be male while non-ADHD comparison youth were more likely to
be female. Parental education was significantly related to ADHD diagnosis, τ = -.290,
p<.01, such that parents of youth in the non-ADHD comparison group were more
highly educated that parents of youth in the ADHD group. Furthermore, higher levels
of parental education were related to greater ER ability, τ = .202, p<.05. Therefore,
child ethnicity/race, child gender and parent education were included in the
subsequent ANOVAs.
Once preliminary correlation analyses were conducted, GLM ANOVA
analyses were conducted to compare groups on depressive symptoms, ER, DT and
effortful control. ANOVA was selected due to the different sample sizes for each
variable due to missing data. Results are presented in Table 3. Results demonstrated
57
that youth in the ADHD group displayed significantly higher levels of depression
than youth in the non-ADHD comparison group, F(4, 65) = 6.55, p<.001. Furthermore,
youth in the non-ADHD comparison group demonstrated a greater ability to regulate
their emotions relative to youth with ADHD, F(4, 65) = 5.003, p<.001.
Groups did not differ significantly on either DT, F(4, 60) = 0.645, p= n.s., or effortful
control7, F(4, 51) = 0.432, p=n.s. It should be noted that for both DT and effortful
control, group sizes were reduced due to technical difficulties with the Mirror-tracing
(n= 64) and Stroop (n= 55) tasks, respectively.
Primary Aim 2: To examine to examine effortful control as a mediator in the
relationship between ADHD diagnosis and ER ability. Furthermore, to examine
ER, measured as self/parent report of ER and DT, as a mediator in the
relationship between ADHD diagnosis and depressive symptoms in youth
between the ages of 10 to 14 years.
Path analyses were used to examine primary aim 2. LISREL VIII (Joreskog &
Sorbom, 1996) was used to test the proposed path analysis models depicted in Figures
7 and 8. For SEM, it has been suggested that the ratio of the number of participants to
the number of model parameters should ideally be 20:1; however, 10:1 is considered
much more realistic while also being acceptable (Kline, 1998). In the current study,
7 For exploratory purposes, Stroop effect measured as percent correct was examined in terms of correlation to other variables of interest and GLM ANOVA analyses were used to examine possible group differences. In terms of correlations, Stroop effect measures as percent correct was not significantly related to any variable aside from Stroop effect measured as RT (r= -.271, p<.05). ANOVA analyses suggested no significant group differences between the ADHD and control group on Stroop effect measured as percent correct, F(4, 51) = .980, p=n.s.. In terms of correlations, Stroop effect measures as percent correct was not significantly related to any variable aside from Stroop effect measured as RT (r= -.271, p<.05). ANOVA analyses suggested no significant group differences between the ADHD and control group on Stroop effect measured as percent correct, F(4, 51) = .980, p=n.s.
58
each model specifies four parameters, suggesting a needed sample size of between
40-80 participants.
LISREL uses several fit indices to assess how well the proposed model fits the
sample data. The likelihood ratio chi-square test (or model chi-square) is used to
assess the overall fit of the specified model. For the chi-square test, the larger the
value of χ2 (and consequently the more significant the p-value) the worse the model
fits the data (Garson, 2009, Kenny 2010, Mueller & Hancock, 2009). That is, when
the chi-square test yields a significant p-value, the results indicate that the given
model's covariance structure is significantly different from the observed covariance
matrix.
A number of additional statistics are available to assess model fit; however,
debate exists within the field as to which or how many fit statistics should be reported
(e.g., Garson, 2009, Jaccard & Wan, 1996; Kenny 2010, Kline, 1998a, Mueller &
Hancock, 2009). For example, Kline (1998a) suggests reporting at least four tests,
such as chi-square; goodness-of-fit index (GFI), normed fit index (NFI), or
comparative fit index (CFI); non-normed fit index (NNFI); and standardized root
mean square residual (SRMR). In contrast, Garson (2009) recommends reporting chi-
square, root mean square error of approximation (RMSEA), and one of the baseline
fit measures (normed fit index [NFI], incremental fit index [IFI], CFI, etc) as well as a
measure of parsimony (e.g., parsimony normed fit index [PNFI], parsimony
comparative fit index [PCFI]) and an information theory measures (e.g., alkaike
information criteria [AIC], bayesian information criteria [BIC], etc.) when comparing
models. For the current study, Kline’s reporting recommendations (i.e., chi square,
59
GFI, NNFI, and SRMR) will be used in text; however, additional fit statistics will be
presented in tables for review. The GFI represents the percent of observed covariance
explained by the model, and larger values (.90 and greater) are related to better fit
(Hu & Bentler, 1995; Schumaker & Lomax, 2004). NNFI values are used to compare
the posited model (i.e., researcher’s model) to the null model (Garson, 2009). It is
recommended that NNFI values closer to 1 indicate a good fit. Specifically, Hu and
Bentler (1999) suggested that NNFI values should be great than or equal to .95.
Lastly, the SRMR is the average difference between predicted and observed variance
and covariance in the model based on standardized residuals, where values less than
.05 are indicative of a good fit while values below .08 indicate adequate fit (Garson,
2009).
Path coefficients are reported as both standardized (β) and unstandardized (B)
beta weights. Standardized beta weights allow for comparisons among the relative
importance of different variables tested, and research suggests that standardized beta
weights > 0.32 indicate meaningful relationships (Billings & Wroten, 1978; Garson,
2009). One limitation of standardized beta weights is that they do not allow for
comparison across samples or studies (Gelfand, Mensinger, & Tenhave, 2009; Little,
Card, Bovaird, Preacher & Crandall, 2007; Stage, Carter, Nora, 2004). Therefore,
unstandardized beta weights were also reported to allow for the comparison across
studies and samples.
In order to account for the effects of significantly-related demographic
variables (i.e., child gender, child ethnicity/race, and parent education), a series of
linear regression analyses were conducted. Specifically, four regressions (one for
60
each dependent variable: depression, effortful control, ER and DT) were conducted in
which the specified demographic variables were entered simultaneously as predictors,
and the unstandardized residuals were saved. The use of unstandardized residuals
allows for the removal of the variance in the exogenous variables (i.e., depression,
effortful control, ER and DT) accounted for by the specified demographic variables.
The unstandardized residuals created by the regressions were then used as the
variables of interest (depression, effortful control [RT], ER and DT) in the subsequent
path analyses. Prior to being entered as independent variables, child gender and
race/ethnicity were recoded using error coding (i.e., 1 and -1). Parental education was
entered as a continuous variable.
Results examining Model 1 suggested that the model was a moderate to good
fit for the data, χ2 = 2.93, df = 1, p = 0.09. Therefore, additional fit statistics were
reviewed. GFI (0.98), CFI (0.95), and SRMR (.05) statistics all indicated a strong fit
while the NNRI value was 0.68 possibly suggesting the need to re-specify the model.
Additional fit statistics are presented in Table 4.
Examination of the paths specified in the model indicated that ADHD
diagnosis significantly predicted ER ability, β = -0.30, p=.012, such that youth with
ADHD demonstrated poorer ER than non-ADHD comparison youth. Emotion
regulation was significantly related to depressive symptoms, β = -0.60, p=.000, such
that youth with greater levels of emotion regulation displayed lower levels of
depressive symptoms. Moreover, the path between ADHD and depression became
non-significant, β = 0.15, p= .130, when ER was included, suggesting a mediating
effect of ER. ADHD diagnosis was not related to effortful control, β = 0.05, p= n.s,

61
and effortful control was not related to emotion regulation, β = -0.03, p= n.s. The
tested model with standardized and unstandardized beta weights is presented in
Figure 9, and the results of the structural equations are presented in Table 5.
Figure 9. Path analysis indexes for Model 1. Standardized path coefficients are
presented with unstandardized coefficients in parentheses. Significant paths are
represented by * (p<.01)
ER mediated the relationship between ADHD diagnosis and depressive symptoms,
accounting for 44% of the variance in the model. In fact, when ER was added as a
mediator into the relationship between ADHD and depression, the unstandardized
beta weight for ADHD diagnosis dropped from 5.33 to 2.40.8
8 Given the shared method variance in measures of depressive symptoms and ER (i.e., both involved composite parent and youth ratings), path analysis were also conducted in which parent-rated ER was examined as a mediator to youth-rated depressive symptoms and vice versa (youth-rated ER as a mediator of parent-rated depressive symptoms). When parent-rated ER was examined as a mediator to youth-rated depressive symptoms, the model still suggested that ER completely mediated the relationship between ADHD and depressive symptoms, accounting for 14% of the variance. However,
Depressive symptoms
0.56(36.50)
0.91(0.68)
1.00(25475.
31)
1.00(0.25)
-0.30*(-0.52)
-0.60*(-5.62)
-0.03(-0.00)
0.05(15.32)ADHD
dxEffortful control
Emotion regulation
0.15(2.40)

62
As mentioned previously in a footnote, one significant limitation frequently
cited in studies of ER, is that measures of ER often contain items that overlap with
symptoms of depression making the independence of these constructs difficult to
assess (see Abela & Hankin, 2007; Gotlib & Hammen, 2008; Nolen-Hoeksema &
Hilt, 2008, for reviews). Therefore, the path analysis in Model 1 was re-run with the
overlapping depression items removed from the ER construct. Again, ER mediated
the effect of ADHD diagnosis on depressive symptoms, accounting for 36% of the
variance in the model. In fact, when ER was added as a mediator into the relationship
between ADHD and depression, the unstandardized beta weight for ADHD diagnosis
dropped from 4.84 to 2.68. A detailed description of these follow-up analyses can be
found in Appendix C.
Given the lack of parsimony in the original model suggested by the fit
statistics, the model was re-structured removing effortful control as it was not
significantly related to ADHD diagnosis or ER (see Table 2) (Figure 10). Again ER
mediated the effect of ADHD diagnosis on depressive symptoms, accounting for 44%
of the variance in the model.
when youth-rated ER was examined as a mediator of parent-rated depressive symptoms, the model was no longer significant.
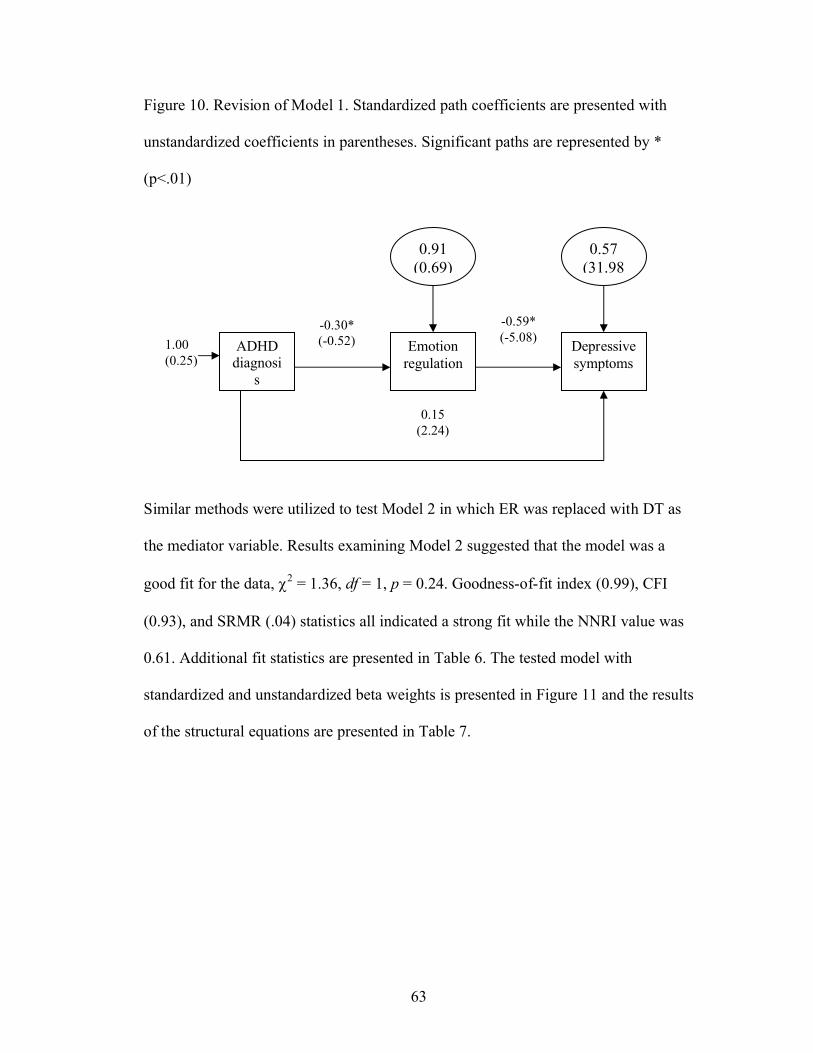
63
Figure 10. Revision of Model 1. Standardized path coefficients are presented with
unstandardized coefficients in parentheses. Significant paths are represented by *
(p<.01)
Similar methods were utilized to test Model 2 in which ER was replaced with DT as
the mediator variable. Results examining Model 2 suggested that the model was a
good fit for the data, χ2 = 1.36, df = 1, p = 0.24. Goodness-of-fit index (0.99), CFI
(0.93), and SRMR (.04) statistics all indicated a strong fit while the NNRI value was
0.61. Additional fit statistics are presented in Table 6. The tested model with
standardized and unstandardized beta weights is presented in Figure 11 and the results
of the structural equations are presented in Table 7.
0.91(0.69)
1.00(0.25)
-0.30*(-0.52)ADHD
diagnosis
Emotion regulation
-0.59*(-5.08)
0.15(2.24)
Depressive symptoms
0.57(31.98
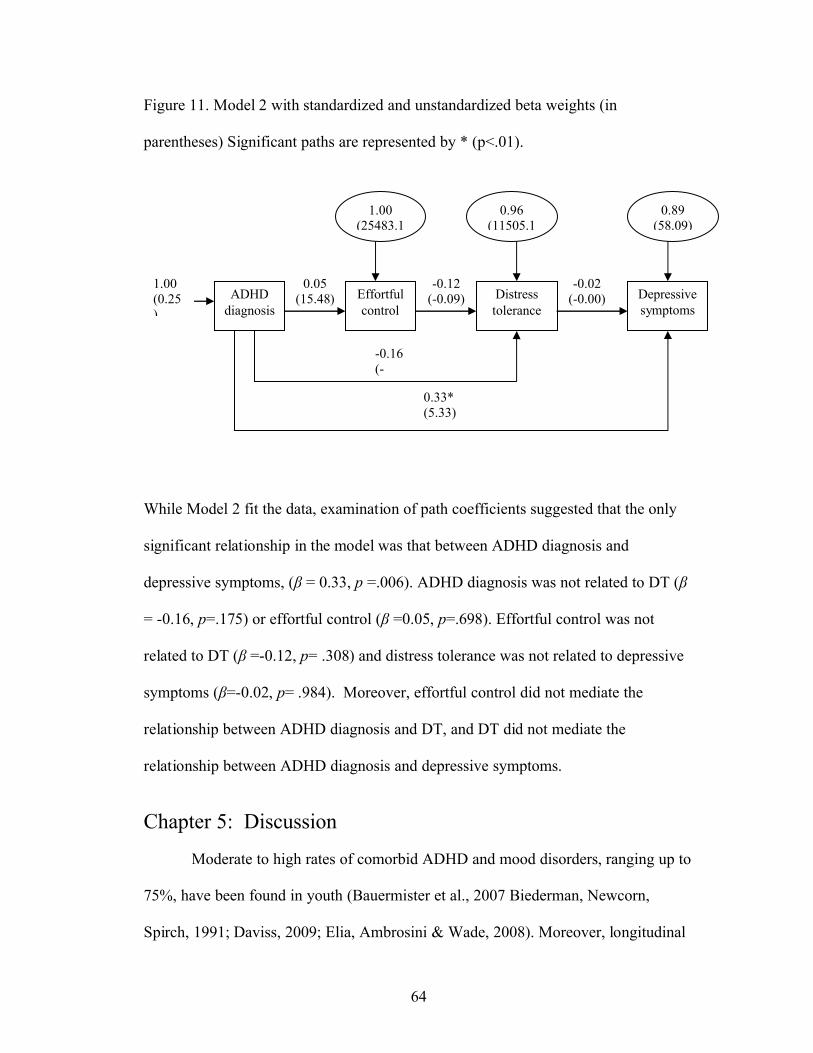
64
Figure 11. Model 2 with standardized and unstandardized beta weights (in
parentheses) Significant paths are represented by * (p<.01).
While Model 2 fit the data, examination of path coefficients suggested that the only
significant relationship in the model was that between ADHD diagnosis and
depressive symptoms, (β = 0.33, p =.006). ADHD diagnosis was not related to DT (β
= -0.16, p=.175) or effortful control (β =0.05, p=.698). Effortful control was not
related to DT (β =-0.12, p= .308) and distress tolerance was not related to depressive
symptoms (β=-0.02, p= .984). Moreover, effortful control did not mediate the
relationship between ADHD diagnosis and DT, and DT did not mediate the
relationship between ADHD diagnosis and depressive symptoms.
Chapter 5: Discussion
Moderate to high rates of comorbid ADHD and mood disorders, ranging up to
75%, have been found in youth (Bauermister et al., 2007 Biederman, Newcorn,
Spirch, 1991; Daviss, 2009; Elia, Ambrosini & Wade, 2008). Moreover, longitudinal
-0.16(-
-0.02(-0.00)
-0.12(-0.09)
0.05(15.48)ADHD
diagnosisEffortful control
Distress tolerance
0.33*(5.33)
1.00(0.25)
Depressive symptoms
1.00(25483.1
0.96(11505.1
0.89(58.09)
65
research suggests increased rates of mood disorders (Biederman, et al., 2008; Green
et al., 1997; Fisher, et al., 2002; Biederman, et al., 2006; Monuteaux, et al., 2007) as
well as depressive symptoms (Hinshaw et al., 2006; Lahey et al., 2007; Lee et al.,
2008) in youth diagnosed with ADHD in comparison to non-ADHD youth.
Unfortunately, youth with comorbid ADHD and depression demonstrate an earlier
onset and longer duration of depressive episodes, increased risk for recurrence, higher
rates of psychiatric hospitalization, require more intense interventions, and have more
psychosocial and familial problems than youth with ADHD or depression alone
(Biederman, et al., 2008, Biederman et al., 1996; Jensen et al., 1993 Rohde et al.,
2001). However, perhaps the most compelling argument for obtaining a more
comprehensive understanding of the processes which underlie the relationship
between ADHD and depression is research suggesting that youth with comorbid
mood disorders and ADHD are three times more likely to complete suicide that those
diagnosed with either disorder alone (James, Lai, & Dahl, 2004). The present study
examined ER as a mediator in the relationship between ADHD and depressive
symptoms in youth ages 10 to 14-years-old. Furthermore, effortful control was
examined as a potential mechanism by which youth with ADHD have poor ER
ability.
Results from path analyses indeed suggested that ER (as measured by
composite parent and youth report) fully mediated the relationship between ADHD
diagnosis and youth depressive symptoms. In fact, this relationship accounted for
44% of the variance in the model. Moreover, in a more stringent test of the model, in
which overlapping symptoms of depression were removed from the measures of ER,

66
ER continued to completely mediate the relationship between ADHD and depression
accounting for 36% of the variance in the model and suggesting that this relationship
was not merely the result of measurement error.
In contrast, effortful control did not mediate the relationship between ADHD
diagnosis and ER ability. In fact, contrary to hypotheses, effortful control was not
significantly related to either ADHD diagnosis or ER ability. These results may be
interpreted in the context of the mixed literature examining Stroop task performance
in ADHD samples. While the Stroop task is the most frequently used cognitive task
of interference control and response inhibition in ADHD populations (Homack &
Riccio, 2004; Schwartz & Verhaeghen, 2008), results have been mixed as to whether
the Stroop task distinguishes between ADHD and non-ADHD participants (e.g.,
Boonstra et al., 2005; Scheres et al., 2004; Homack & Riccio, 2004; Schwartz &
Verhaeghen, 2008). For example, in a meta-analysis of 25 studies of Stroop
performance comparing individuals with and without ADHD, it was concluded that
the Stroop interference effect was not greater for ADHD participants in comparison to
non-ADHD participants (Schwartz & Verhaeghen, 2008). The authors suggest that
perhaps the Stroop task does not adequately assess response inhibition and inference
control in individuals with ADHD, and therefore, other cognitive tasks of response
inhibition may be more sensitive to these effects (Schwartz & Verhaeghen, 2008).
Therefore, perhaps it is not that effortful control is not involved in the relationship
between ADHD and ER, but rather that the Stroop task did not provide a valid or
adequate measure of the construct of effortful control.
67
An alternative explanation may be that perhaps working memory (WM)
deficits (Rapport et al., 2001, 2008a) rather than deficits in behavioral inhibition
(Barkley, 1997; Sonuga-Barke, 2002) better explain the executive function deficits in
individuals with ADHD. Models of WM suggest that WM is a limited capacity
system which allows individuals to store and manipulate information for a brief
period of time after the stimuli responsible for this information have terminated
(Baddeley, 2003). Moreover, WM has been suggested to underlie complex higher
order tasks such as learning, comprehension, reasoning and planning (Baddeley,
2003, 2007; Kane & Engle, 2003). An essential feature suggested to coordinate the
attentional activities and responses of WM is the central executive, which integrates
information from the phonological loop and visuospatial sketchpad and provides
access to information stored in memory (Kane & Engle, 2003). In fact, studies that
examine individual differences in WM are thought to be reflective of differences in
the central executive system (Rosen & Engle, 1997).
With relation to ADHD, early studies examining WM deficits and ADHD
provided inconclusive findings; however, two recent meta-analytic reviews, which
addressed a number of the previous methodological limitations in the literature,
suggest that WM deficits do in fact exist in children with ADHD in comparison to
control children (Martinussen et al., 2005; Willcutt et al., 2005). In fact, converging
evidence suggests that in comparison to children without ADHD, children with
ADHD demonstrate impairments in all three components of WM: the central
executive, visuospatial storage/rehearsal and phonological storage/rehearsal
(Martinussen et al. 2005; Marzocchi et al. 2008; Rapport et al., 2008a; Willcutt et al.

68
2005). Therefore, perhaps youth with ADHD have difficulties with ER due to their
difficulties with WM rather than behavioral inhibition. Indeed, evidence suggests that
individuals with higher WM capacity are better able to suppress the expression of
both negative and positive emotions, appraise emotional stimuli in an unemotional
manner, and therefore experience and express less emotion in response to
emotionally-laden stimuli than individuals with poorer WM (Schmeichel, Wolokhov
& Demaree, 2008). Therefore, future studies should examine the relationship between
WM and ER in youth with ADHD.
The present study also examined DT as a behavioral index of ER. Results did
not suggest a significant relationship between DT and ER. These results fall in
contrast to the findings of Gratz and colleagues (2006) who found a significant
negative relationship between DT and self-reported emotion dysregulation in adults
both with and without personality disorders. This discordance may be the result of
methodological differences between the studies as Gratz and colleagues (2006)
utilized an adult population (ages 18 to 60-years-old) whereas the present study
examined DT and ER in late childhood/early adolescent youth. Moreover, Gratz’s
sample consisted of individuals with borderline personality disorder, a disorder
characterized by emotional avoidance and distress intolerance (Linehan, 1993),
whereas the present sample examined individuals with and without ADHD.
Furthermore, DT was not significantly associated with group status, and when
DT was included as a mediator in the hypothesized models, DT did not mediate the
relationship between ADHD diagnosis and depressive symptoms. The lack of
associations found between DT and ADHD diagnosis appears disparate with previous
69
research examining ER (and seemingly DT) in boys with ADHD (Melnick &
Hinshaw, 2000). Specifically, Melnick and Hinshaw (2000) found that boys with
ADHD displayed significantly less constructive patterns of emotional coping
including an inability to continue the task in the wake of frustration (i.e., poor DT)
and extreme levels of negative affect, inability to problem-solve, and extreme focus
on negative aspects of task (i.e., poor ER) than did non-ADHD comparison boys.
In comparing this research to the current study, two important methodological
differences emerge. First, Melnick and Hinshaw (2000) utilized an observational
paradigm in which the boys’ overt behavioral responses to a frustrating stimuli (i.e.,
building a Lego model with 2 missing pieces) were coded for specific facets of ER
(including a construct almost identical to DT) and well as overall ER ability. Second,
the frustrating task was set in the midst of a family interaction (i.e., mother-child
dyads), which given the abundant literature suggesting impaired parent-child relations
in youth with ADHD (e.g., Johnston & Mash, 2001), may have increased youth levels
of frustration. Therefore, the entirety of a participant’s expressions and behaviors in
addition to the context in which the frustration is elicited may be particularly
important in measuring DT in youth with ADHD.
Furthermore, in the current study, DT was only measured through one
behavioral response, (i.e., quitting the task) rather than a contextual observation of a
participant’s response to the task as a whole (i.e., videotaping and coding youth facial
expressions and behaviors while engaging in the task). However, Campos and
colleagues (1989) suggest that observational coding allows the researcher to capture
the context-specific expressions and “actions” used by participants in managing
70
emotional responses while engaging in goal-directed behavior. As such, future studies
examining DT in youth with ADHD should utilize observational coding systems
which appear to more wholly capture the context-specific range of expressions and
emotions demonstrated by youth with ADHD.
Alternatively, the lack of association between DT and ADHD status may be
the result of the tasks being computer-based which may elicit less frustration for
youth with ADHD than social paradigms, such as frustrating interactions with parents
or peers. In fact, research has demonstrated a significant positive relationship between
ADHD diagnosis and internet use in youth (Yoo, Cho, Ha, Yune, Kim, Hwang et al.,
2004). Furthermore, in comparison to control youth, youth with ADHD have
demonstrated greater intensity with video game play (Bioulac, Afri, & Bouvard,
2008). Jensen and colleagues hypothesize that extensive exposure to television and
video games may actually promote development of brain systems that scan and shift
attention at the expense of those that focus attention (Jensen, et al., 1997). Therefore,
for youth with ADHD, computerized tasks of DT may not yield distress, but rather
increase engagement in the task due to the constant feedback provided by such tasks
and constant shifts in attention.
Such research might also explain the results of the current study in which the
BIRD, one of the behavioral DT tasks, did not appear to elicit distress in the current
sample which is in contrast to the only other study that has utilized the BIRD with
youth participants (Daughters et al., 2009). In the present study, results examining
pre- and post- task measures of distress did not demonstrate significant differences in
experienced “distress” as a result of the task; moreover, only 26% of the sample quit
71
the task prior to the 5-minute task period in comparison to 73% on the Mirror tracing
task. Therefore, it may be that distress was not in fact elicited by the BIRD in the
present sample because youth viewed it as a “videogame”.
An alternate interpretation for why the BIRD did not appear to elicit distress
may be that individuals who did not report an increase in distress actually display
higher levels of DT, and as such, were able to regulate their affect before it became
detectable. In fact, Campos and colleagues (2004) describe, inhibition, a key process
in the regulation of emotion, may actually precede the activation of the cerebral
emotional circuits involved in the elicitation of an emotion. That is, prior to the actual
demonstration of emotion, an individual with a good ability to regulate his/her
emotions (i.e., high distress tolerance) may be able to inhibit their distress. However,
this explanation does not fit with the literature suggesting that youth with ADHD
actually have great difficulty inhibiting their frustration and frequently demonstrate
negative behaviors when frustrated (Lawrence, Houghton, Tannock, Douglas, Durkin
& Whiting, 2002; Scime & Norvilitis, 2006; Walcott & Landau, 2004). Therefore,
future studies should examine if the experimental paradigms or tasks which elicit
distress are different for youth with and without ADHD. For example, it may be that
tasks, such as those used by Melnick and Hinshaw (2000) are better able to elicit
distress in youth with ADHD. Additionally, future studies using the BIRD, may find
it useful to employ observational methods in order to assess pre- and post- task
behavioral indicators of distress or negative affect, not just participant ratings.
The finding of the current study must be considered in the context of some
limitations. The current study included a sample of 69 participants, which limited the
72
number of parameters able to be specified in the present path analysis. As a result,
other important variables such as various risk factors for depression including:
parental psychopathology (Chronis et al., 2003a; Nigg & Hinshaw, 1998), negative
parent-child interactions (Johnston & Mash, 2001), impaired peer relationships
(Blachman & Hinshaw, 2002; Hoza, Mrug, Gerdes, Hinshaw, Bukowski, Gold, et al.,
2005; Mrug, Hoza, Gerdes, Hinshaw, Arnold, Hectman et al., 2009) and low self-
esteem or self-efficacy (Hoza et a., 2004; Owens, Goldfine, Evangelista, Hoza, &
Kaiser, 2007) could not be included in the model. Additionally, a larger sample size
would allow for the examination of the relationship between ADHD, ER and
depressive disorders, not just depressive symptoms. Such examination was not
possible given the low base rates of depressive disorders in youth (Avenevoli, et al.,
2008; Birmaher, et al., 1996; Kessler, et al., 2001; Shaffer, et al., 1996). Furthermore,
the current study was cross-sectional which does not provide information about the
temporal relationship between ADHD, ER and depressive symptoms in youth. While
the current study examined ER through parent and youth report, it does not provide
information about specific ER strategies utilized by youth. The actual strategies
employed by youth may be just as important as the ability to regulate emotion as
research suggests that youth with depressive disorders demonstrate more avoidant,
passive and aggressive strategies, and fewer problem-focused and active distraction
emotion regulation strategies that youth without depressive disorder (Garber
Braafladt, & Zeman, 1991; Garber, Braafladt, & Weiss, 1995).
Despite these limitations, the current study adds to the literature in a number
of ways. Despite the deleterious outcomes, including the three fold risk of completing
73
suicide (James, et al, 2004), for youth with comorbid ADHD and depressive
symptoms, this study represents one of the first studies to examine potential
mediators in the relationship between ADHD and depressive symptoms in youth. The
identification of factors involved in this relationship, provides important information
for future interventions. The present study examined the role of both effortful control
and ER as mediators in the relationship between ADHD and depressive symptoms in
youth. The results indicate the importance of ER in the relationship between ADHD
and depression in youth providing a new avenue for intervention efforts, in particular
teaching youth with ADHD ways to better identify and regulate distressing emotions.
Future research should examine which particular aspects of ER are important
in this relationship. Additionally, future studies should focus on the longitudinal
examination of ADHD, ER and depressive symptoms in large samples of youth. Such
studies would allow for the examination of the temporal relationship between ADHD,
ER and depression, but also a large sample size would allow a more comprehensive
model, that includes the various risk factors for depression in youth, to be tested.
Furthermore, the present study found that a number of demographic variables
including child gender and ethnicity/race, as well as parent education were significant
in the relationship between ADHD, ER and depressive symptoms. While matching
groups based on these variables was not feasible in the current study, future studies
should make efforts to match groups based on these demographic variables.
Furthermore, the present study did not demonstrate differences between youth
with and without ADHD on the Stroop task suggesting that perhaps the Stroop task is
74
not an appropriate measure of effortful control. As such, future research should
examine alternate cognitive tasks (e.g., stop-signal task, anti-saccade task, etc) and
their relation to effortful control. Another possibility is that perhaps the underlying
deficit in youth with ADHD is not behavioral inhibition but rather a deficit in WM
(Martinussen et al. 2005; Marzocchi et al. 2008; Rapport et al., 2008a; Willcutt et al.
2005). Further, given the increasing support that WM deficits are present in
individuals with ADHD, research should examine the role of WM in ER in youth
with ADHD. Lastly, given that youth with ADHD often demonstrate knowledge of
appropriate actions, but often have difficulty in the appropriate execution of these
actions (Whalen & Henker, 1985), future studies of ADHD, ER and depression
should examine ER through laboratory tasks which allow for the observation of ER
during emotion-arousing stimulus in addition to parent and self-report measures of
ER.
Lastly, this was the first study to examine DT in youth with ADHD. While it
was initially hypothesized that youth with ADHD may have deficits in DT, results
from the present study did not find a significant association between ER and DT.
These results fall in contrast to the findings of Gratz and colleagues (2006); therefore,
future research is needed to clarify this relationship including studies that examine
this relationship in relation to various forms of psychopathology, developmental
levels and genders.
A number of clinical implications arise from the results of the current study.
Most importantly, the current study highlights the importance of ER in the
relationship between ADHD and depression. These results suggest the importance of
75
assessing for depressive symptoms and ER ability in clinical practice. Additionally,
these results may suggest the need to provide youth with ADHD extensive training in
the identification of emotions and the use of emotion-regulation strategies in order to
prevent the serious negative outcomes associated with comorbid ADHD and
depression. For example, Kovacs and colleagues (2006) piloted contextual emotion-
regulation therapy (CERT) in 20 youth, ages 7-12 years-old, with dysthymic disorder.
CERT is based on the rationale that dysfunctional self-regulation of distress and
dysphoria, key characteristics in youth with depression, precede the onset of
depression. Therefore, youth experiences of environmental stress may interact with
pre-existing regulatory difficulties and culminates in the progression of dysphoric
emotion. Results of Kovac and colleagues (2006) small pilot study suggested that
53% of completers had full remission while 13% had partial remission of their
dysthymia. Follow-up results collected 12-months post-treatment demonstrated that
92% of completers experienced full remission of their dysthymia. These results
suggest the potential impact of teaching pre-adolescent youth with ADHD how to
better regulate their emotions.
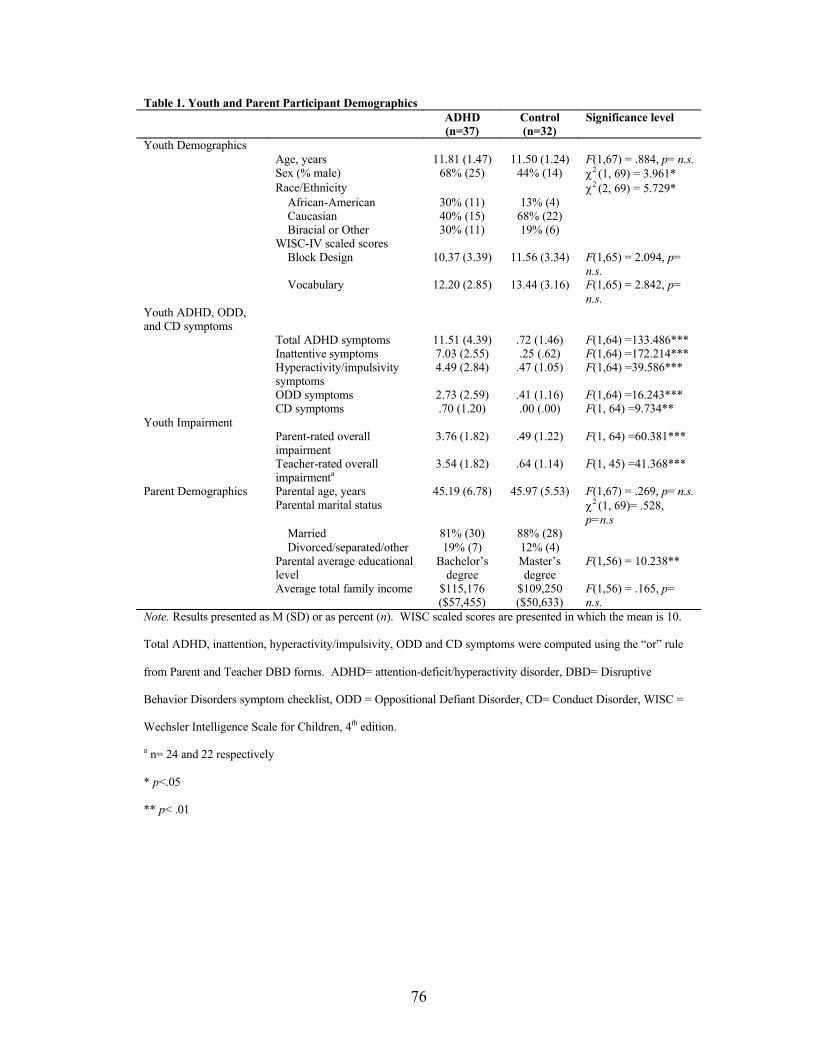
76
Table 1. Youth and Parent Participant DemographicsADHD(n=37)
Control(n=32)
Significance level
Youth DemographicsAge, years 11.81 (1.47) 11.50 (1.24) F(1,67) = .884, p= n.s.Sex (% male) 68% (25) 44% (14) χ2 (1, 69) = 3.961*Race/Ethnicity χ2 (2, 69) = 5.729*
African-American 30% (11) 13% (4)Caucasian 40% (15) 68% (22)Biracial or Other 30% (11) 19% (6)
WISC-IV scaled scoresBlock Design 10.37 (3.39) 11.56 (3.34) F(1,65) = 2.094, p=
n.s.Vocabulary 12.20 (2.85) 13.44 (3.16) F(1,65) = 2.842, p=
n.s.Youth ADHD, ODD, and CD symptoms
Total ADHD symptoms 11.51 (4.39) .72 (1.46) F(1,64) =133.486***Inattentive symptoms 7.03 (2.55) .25 (.62) F(1,64) =172.214***Hyperactivity/impulsivity symptoms
4.49 (2.84) .47 (1.05) F(1,64) =39.586***
ODD symptoms 2.73 (2.59) .41 (1.16) F(1,64) =16.243***CD symptoms .70 (1.20) .00 (.00) F(1, 64) =9.734**
Youth ImpairmentParent-rated overall impairment
3.76 (1.82) .49 (1.22) F(1, 64) =60.381***
Teacher-rated overall impairmenta
3.54 (1.82) .64 (1.14) F(1, 45) =41.368***
Parent Demographics Parental age, years 45.19 (6.78) 45.97 (5.53) F(1,67) = .269, p= n.s.Parental marital status χ2 (1, 69)= .528,
p=n.s
Married 81% (30) 88% (28)Divorced/separated/other 19% (7) 12% (4)
Parental average educational level
Bachelor’s degree
Master’s degree
F(1,56) = 10.238**
Average total family income $115,176($57,455)
$109,250 ($50,633)
F(1,56) = .165, p= n.s.
Note. Results presented as M (SD) or as percent (n). WISC scaled scores are presented in which the mean is 10.
Total ADHD, inattention, hyperactivity/impulsivity, ODD and CD symptoms were computed using the “or” rule
from Parent and Teacher DBD forms. ADHD= attention-deficit/hyperactivity disorder, DBD= Disruptive
Behavior Disorders symptom checklist, ODD = Oppositional Defiant Disorder, CD= Conduct Disorder, WISC =
Wechsler Intelligence Scale for Children, 4th edition.
a n= 24 and 22 respectively
* p<.05
** p< .01

77
Table 2. Correlation Matrix of Independent, Dependent, Mediator and Demographic Variables
Variables 1 2 3 4 5 6 7 8 9 10 11 121. ADHD diagnosis
--
2. Depression composite
.386** --
3. ER composite
-.397** -.701** --
4. Distress Tolerance
-.112 -.067 .182 --
5. Effortful Control (RT)
.023 -.104 -.020 -.148 --
6. Effortful Control (percent accuracy)
.178 -.067 -.007 -.021 -.271* --
7. Child age .093 .161 -.218 .163 -.042 .052 --
8. Child ethnicity/race
.239* .242** -.301** -.007 -.055 .050 .122 --
9. Child gender
-.240* .121 -.166 .110 -.005 -.005 -.061 -.151 --
10. Parent age -.055 -.097 .200 .132 -.103 .234 .244* -.104 -.022 --
11. Parent education
-.290** -.128 .202* .010 -.059 .204 -.080 -.026 .197 .199* --
12. Parent marital status
-.087 .092 -.016 -.031 .056 .151 .027 .083 -.017 -.091 .002 --
Note. Results are reported as Pearson product-moment correlations or Kendall’s tau as appropriate. ADHD =
Attention deficit/hyperactivity disorder, ER= Emotion regulation, RT = response time.
* p<.05, ** p<.01
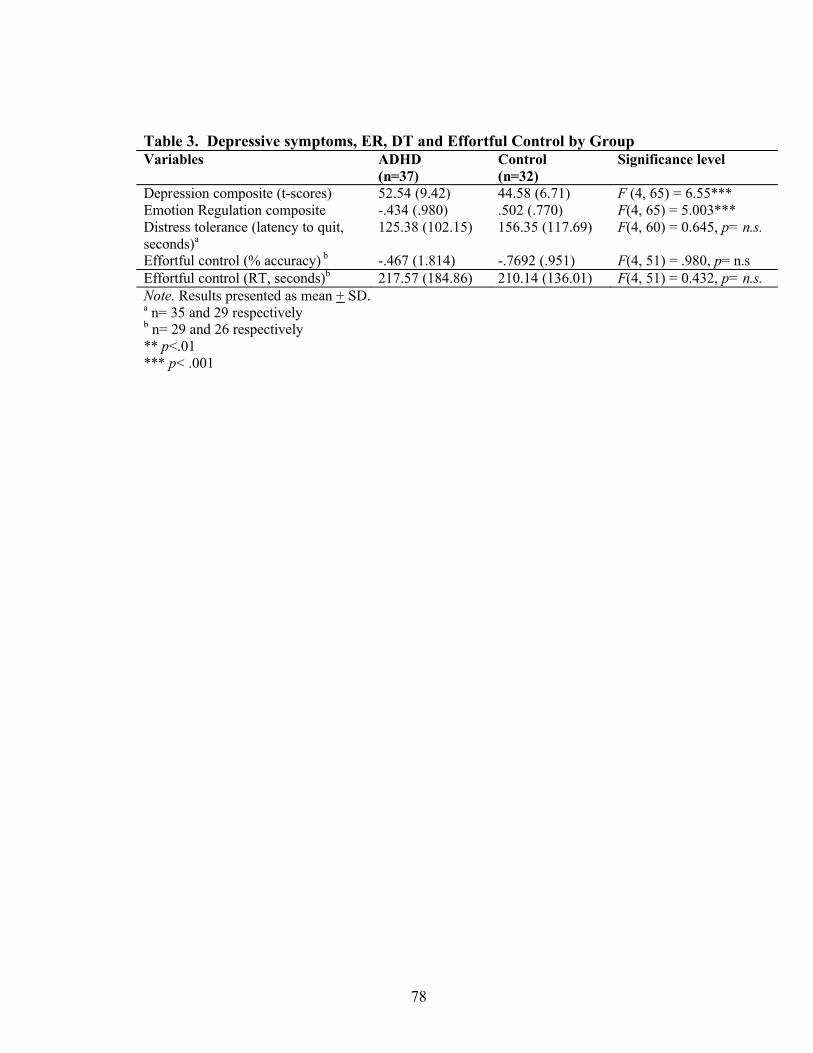
78
Table 3. Depressive symptoms, ER, DT and Effortful Control by GroupVariables ADHD
(n=37)Control(n=32)
Significance level
Depression composite (t-scores) 52.54 (9.42) 44.58 (6.71) F (4, 65) = 6.55***Emotion Regulation composite -.434 (.980) .502 (.770) F(4, 65) = 5.003***Distress tolerance (latency to quit, seconds)a
125.38 (102.15) 156.35 (117.69) F(4, 60) = 0.645, p= n.s.
Effortful control (% accuracy) b -.467 (1.814) -.7692 (.951) F(4, 51) = .980, p= n.sEffortful control (RT, seconds)b 217.57 (184.86) 210.14 (136.01) F(4, 51) = 0.432, p= n.s.Note. Results presented as mean + SD. a n= 35 and 29 respectivelyb n= 29 and 26 respectively** p<.01*** p< .001
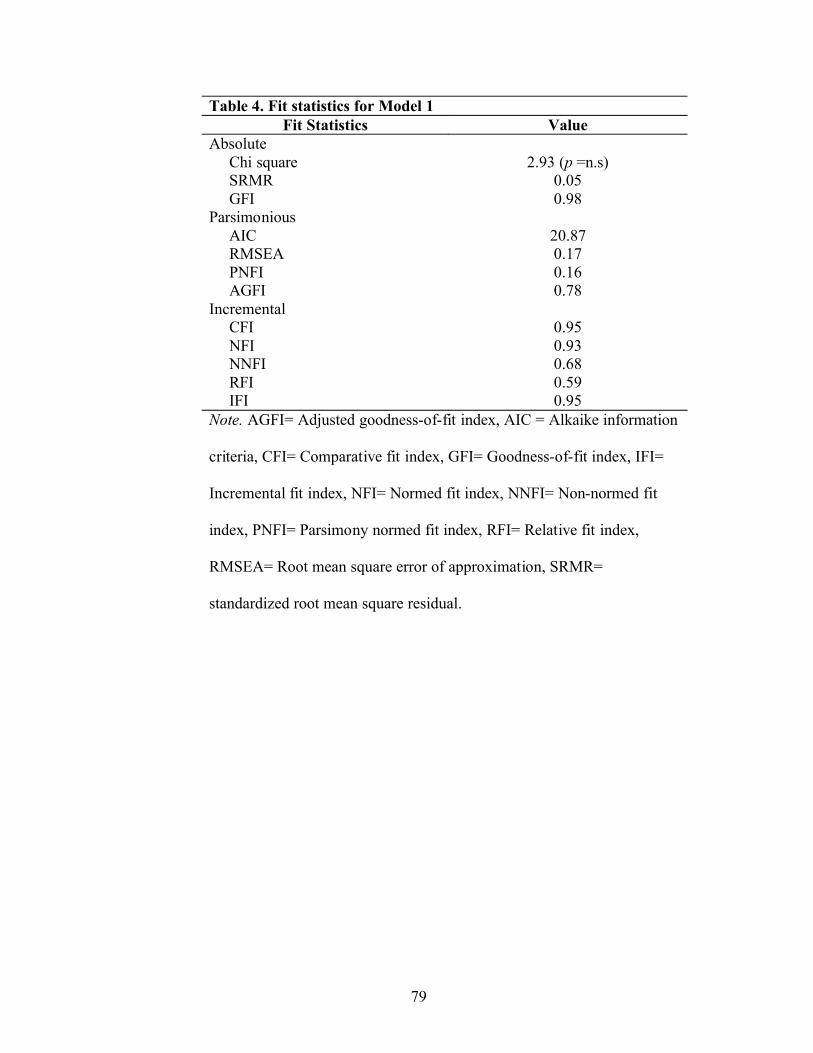
79
Table 4. Fit statistics for Model 1Fit Statistics Value
Absolute Chi square 2.93 (p =n.s)SRMR 0.05GFI 0.98
ParsimoniousAIC 20.87RMSEA 0.17PNFI 0.16AGFI 0.78
Incremental CFI 0.95NFI 0.93NNFI 0.68RFI 0.59IFI 0.95
Note. AGFI= Adjusted goodness-of-fit index, AIC = Alkaike information
criteria, CFI= Comparative fit index, GFI= Goodness-of-fit index, IFI=
Incremental fit index, NFI= Normed fit index, NNFI= Non-normed fit
index, PNFI= Parsimony normed fit index, RFI= Relative fit index,
RMSEA= Root mean square error of approximation, SRMR=
standardized root mean square residual.
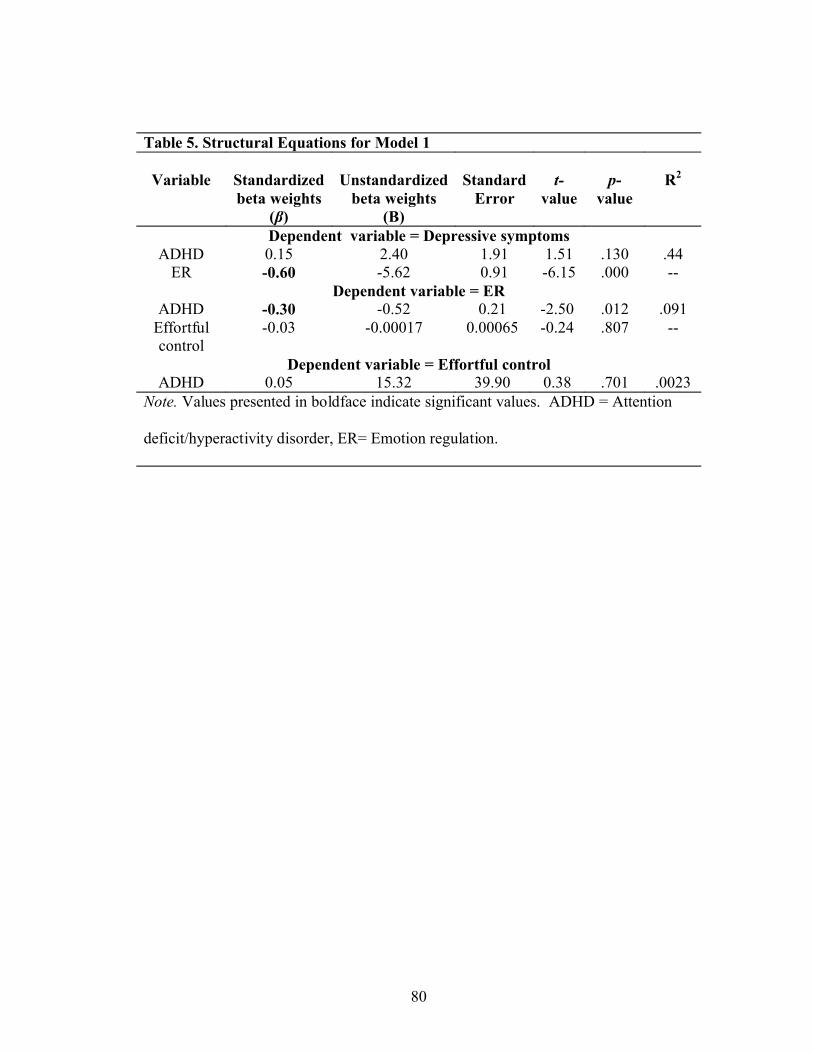
80
Table 5. Structural Equations for Model 1
Variable Standardized beta weights
(β)
Unstandardizedbeta weights
(B)
Standard Error
t-value
p-value
R2
Dependent variable = Depressive symptomsADHD 0.15 2.40 1.91 1.51 .130 .44
ER -0.60 -5.62 0.91 -6.15 .000 --Dependent variable = ER
ADHD -0.30 -0.52 0.21 -2.50 .012 .091Effortful control
-0.03 -0.00017 0.00065 -0.24 .807 --
Dependent variable = Effortful controlADHD 0.05 15.32 39.90 0.38 .701 .0023
Note. Values presented in boldface indicate significant values. ADHD = Attention
deficit/hyperactivity disorder, ER= Emotion regulation.
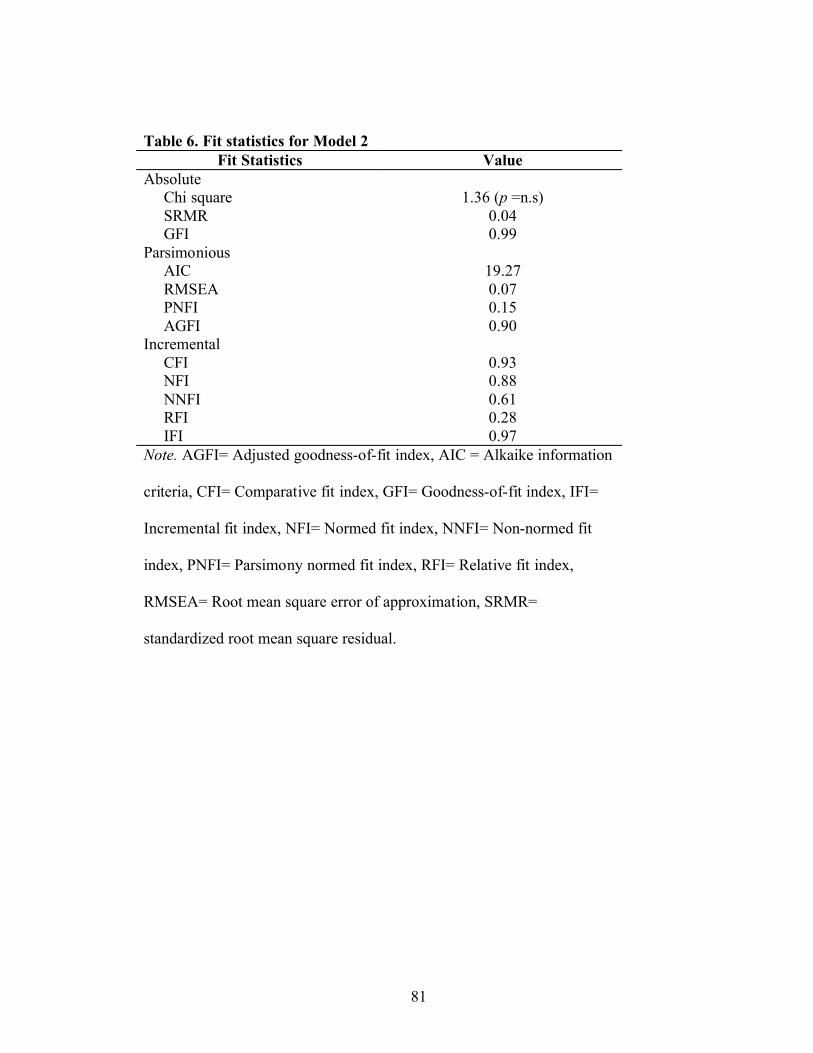
81
Table 6. Fit statistics for Model 2Fit Statistics Value
Absolute Chi square 1.36 (p =n.s)SRMR 0.04GFI 0.99
ParsimoniousAIC 19.27RMSEA 0.07PNFI 0.15AGFI 0.90
Incremental CFI 0.93NFI 0.88NNFI 0.61RFI 0.28IFI 0.97
Note. AGFI= Adjusted goodness-of-fit index, AIC = Alkaike information
criteria, CFI= Comparative fit index, GFI= Goodness-of-fit index, IFI=
Incremental fit index, NFI= Normed fit index, NNFI= Non-normed fit
index, PNFI= Parsimony normed fit index, RFI= Relative fit index,
RMSEA= Root mean square error of approximation, SRMR=
standardized root mean square residual.
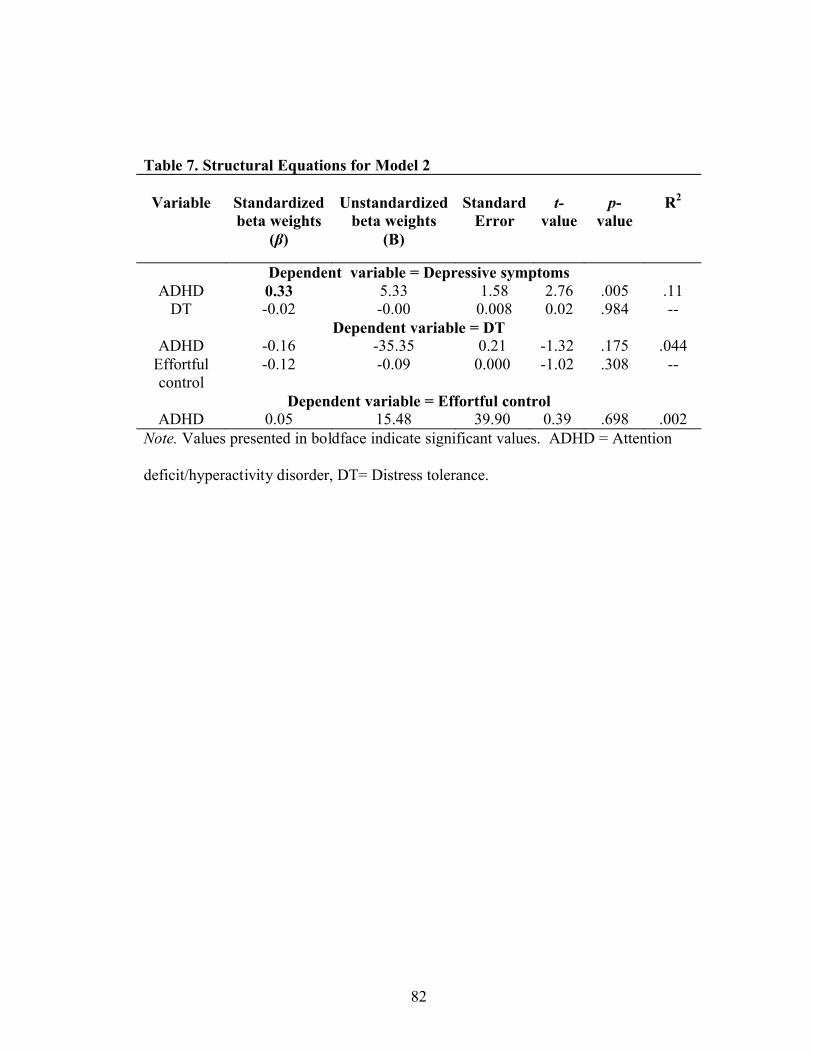
82
Table 7. Structural Equations for Model 2
Variable Standardized beta weights
(β)
Unstandardizedbeta weights
(B)
Standard Error
t-value
p-value
R2
Dependent variable = Depressive symptomsADHD 0.33 5.33 1.58 2.76 .005 .11
DT -0.02 -0.00 0.008 0.02 .984 --Dependent variable = DT
ADHD -0.16 -35.35 0.21 -1.32 .175 .044Effortful control
-0.12 -0.09 0.000 -1.02 .308 --
Dependent variable = Effortful controlADHD 0.05 15.48 39.90 0.39 .698 .002
Note. Values presented in boldface indicate significant values. ADHD = Attention
deficit/hyperactivity disorder, DT= Distress tolerance.

83
Appendices
Appendix A. Discussion of Distress Tolerance and its Relationship to Psychopathology
Appendix B: Distribution statistics for all variables
Appendix C. Path analysis for Model 1 presented with overlapping depression items
removed from ER composite

84
Appendix A. Discussion of Distress Tolerance and its Relationship to
Psychopathology
Distress Tolerance
Function and Definition.
Another factor which may be important in the development of depression in
youth with ADHD is distress tolerance (DT). The concept of DT was initially
introduced by Marsha Linehan in her work with adults with borderline personality
disorder (BPD), where an absence of DT was thought to underlie the maladaptive and
impulsive behaviors common among these individuals (Linehan, 1993). DT has since
been examined in the adult smoking cessation (Brown, Lejuez, Kahler, Strong, &
Zvolensky, 2005) and substance use literature (Daughters, Lejuez, Kahler, Strong &
Brown, 2005; Daughters, Lejuez, Bornovalova, Kahler, Strong & Brown, 2005). DT
refers to the behavioral assessment of persistence in goal-directed behavior in the face
of emotional distress (e.g., frustration, disappointment, anger; Brown et al., 2005).
According to Brown and colleagues (2005), DT is “the behavioral tendency to persist
in pursuit of a goal despite encountering various states of affective discomfort which
may be in response to perceived physical and/or psychological distress” (p. 718). In
order to persist in the wake of affective discomfort, individuals must decline the
immediate negative reinforcement available by quitting the pursuit of the goal, and
instead continue in the goal-directed behavior with the long-term goal of completion
and success. Therefore, low DT is characterized by an inability to persist in goal-
oriented behavior during an aversive situation and is reflective of how one copes with
the negative affect resulting from environmental and interpersonal challenges
85
(Brown et al., 2005). Furthermore, DT is directly related to an individual’s ability to
regulate negative emotion. In fact, DT involves an individual’s evaluation and
expectation of experiencing negative emotional states with regard to (a) tolerability
and aversiveness, (b) appraisal and acceptability, (c) tendency to absorb attention and
disrupt functioning, and (d) regulation of emotions, in particular the ability to avoid
or attenuate the experience (Simons & Gaher, 2005). Since ER requires both the
regulation of affect and the regulation of behavior by affective processes (i.e., use of
emotion to regulate behavior)(Campos, Campos, & Barrett, 1989; Carver, Lawrence
& Scheier, 1996), the inability to tolerate psychological distress (i.e., low DT) may
influence how an individual manages his/her emotions and may moderate the effect
that emotion has on behavior (Simons & Gaher, 2005). Self-report and behavioral
measures of DT have demonstrated moderate negative associations with measures of
affect dysregulation (Simons & Gaher, 2005). Given the relationship between DT and
the regulation of negative emotions, DT may be particularly important in the
development of depression in youth with ADHD.
DT and Psychopathology.
DT has been suggested to underlie maladaptive behaviors in a number of
forms of psychopathology. At the current time, the examination of DT in clinical
populations has been limited mostly to adults. Specifically, research has focused on
how individuals with low levels of DT may have an inability to handle exposure to
negative emotions caused by smoking cessation (Brown, Lejuez, Kahler & Strong,
2002; Brown et al., 2005); abstinence from drugs and alcohol (Daughters, Lejuez,
Kahler, et al., 2005; Daughters, Lejuez, Bornovalova, et al., 2005); treatment for
86
eating disorders (Anestis, Selby, Fink & Joiner, 2007; Waller, Corstorphine, &
Mountford, 2007); and cessation of self-harm behaviors in individuals with BPD
(Gratz, 2003).
To date, only one study has examined DT in adolescents. In a community
sample of adolescents ages 9 to 13, Daughters and colleagues (2009) examined the
relationship between DT and internalizing and externalizing problems. The
examination of externalizing problems suggested an interaction of DT and adolescent
ethnicity such that higher levels of alcohol use were found in Caucasian youth with
low levels of DT than in either Caucasian youth with high levels of DT or African-
American youth regardless of distress tolerance. In terms of delinquent behavior,
African-American youth with low levels of DT demonstrated higher levels of
delinquent behavior than either African-American youth with higher levels of DT or
Caucasian youth regardless of distress tolerance. Results for internalizing problems
suggested an interaction of both adolescent gender and ethnicity with distress
tolerance. First, females with low levels of DT reported higher levels of internalizing
symptoms than females with higher levels of distress tolerance, but for males there
was no effect of DT on internalizing symptoms. Additionally, African-American
adolescents with low levels of DT reported greater levels of internalizing symptoms
than African-American adolescents with high DT. There was no effect of DT on
internalizing symptoms in Caucasian youth. These results suggest the potential
importance of DT in both externalizing and internalizing disorders as well as the
importance of race/ethnicity and gender in the examination of DT.
87
DT has never been examined in an ADHD sample. However, the previously
reviewed literature illustrating that youth with ADHD have higher levels of
frustration and lower levels of task persistence than their non-ADHD comparison
peers in the wake of challenging puzzles or tasks may suggest that youth with ADHD
may also have lower levels of distress tolerance. The inability of youth with ADHD
to persist on a challenging puzzle task demonstrates an inability to persist in goal-
oriented behavior during an aversive situation, which is the hallmark of low distress
tolerance. Based on the prior literature, it appears likely that youth with ADHD may
have difficulties with distress tolerance. Given the relationship between DT and
internalizing problems in some youth (Daughters et al., 2009) and the high
comorbidity between ADHD and depression, distress tolerance appears to be a factor
that warrants examination in the relationship between ADHD and depression. While
the results of Daughters and colleagues (2009) have suggested the importance of DT
and both internalizing and externalizing disorders, the focus of the current study is the
relation between ADHD and the development of depression.
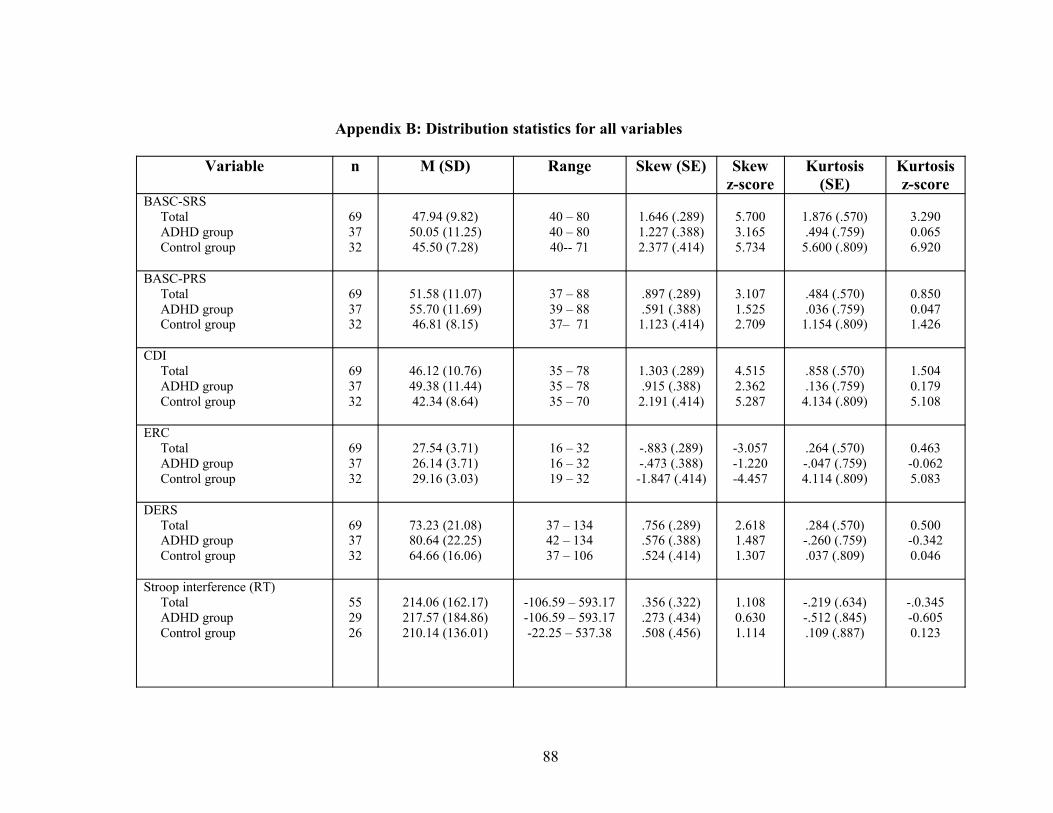
88
Appendix B: Distribution statistics for all variables
Variable n M (SD) Range Skew (SE) Skewz-score
Kurtosis (SE)
Kurtosis z-score
BASC-SRSTotalADHD groupControl group
693732
47.94 (9.82)50.05 (11.25)45.50 (7.28)
40 – 8040 – 8040-- 71
1.646 (.289)1.227 (.388)2.377 (.414)
5.7003.1655.734
1.876 (.570).494 (.759)
5.600 (.809)
3.2900.0656.920
BASC-PRSTotalADHD groupControl group
693732
51.58 (11.07)55.70 (11.69)46.81 (8.15)
37 – 8839 – 8837– 71
.897 (.289)
.591 (.388)1.123 (.414)
3.1071.5252.709
.484 (.570)
.036 (.759)1.154 (.809)
0.8500.0471.426
CDITotalADHD groupControl group
693732
46.12 (10.76)49.38 (11.44)42.34 (8.64)
35 – 7835 – 7835 – 70
1.303 (.289).915 (.388)2.191 (.414)
4.5152.3625.287
.858 (.570)
.136 (.759)4.134 (.809)
1.5040.1795.108
ERC TotalADHD groupControl group
693732
27.54 (3.71)26.14 (3.71)29.16 (3.03)
16 – 3216 – 3219 – 32
-.883 (.289)-.473 (.388)-1.847 (.414)
-3.057-1.220-4.457
.264 (.570)-.047 (.759)4.114 (.809)
0.463-0.0625.083
DERSTotalADHD groupControl group
693732
73.23 (21.08)80.64 (22.25)64.66 (16.06)
37 – 13442 – 13437 – 106
.756 (.289)
.576 (.388)
.524 (.414)
2.6181.4871.307
.284 (.570)-.260 (.759).037 (.809)
0.500-0.3420.046
Stroop interference (RT)TotalADHD groupControl group
552926
214.06 (162.17)217.57 (184.86)210.14 (136.01)
-106.59 – 593.17-106.59 – 593.17-22.25 – 537.38
.356 (.322)
.273 (.434)
.508 (.456)
1.1080.6301.114
-.219 (.634)-.512 (.845).109 (.887)
-.0.345-0.6050.123
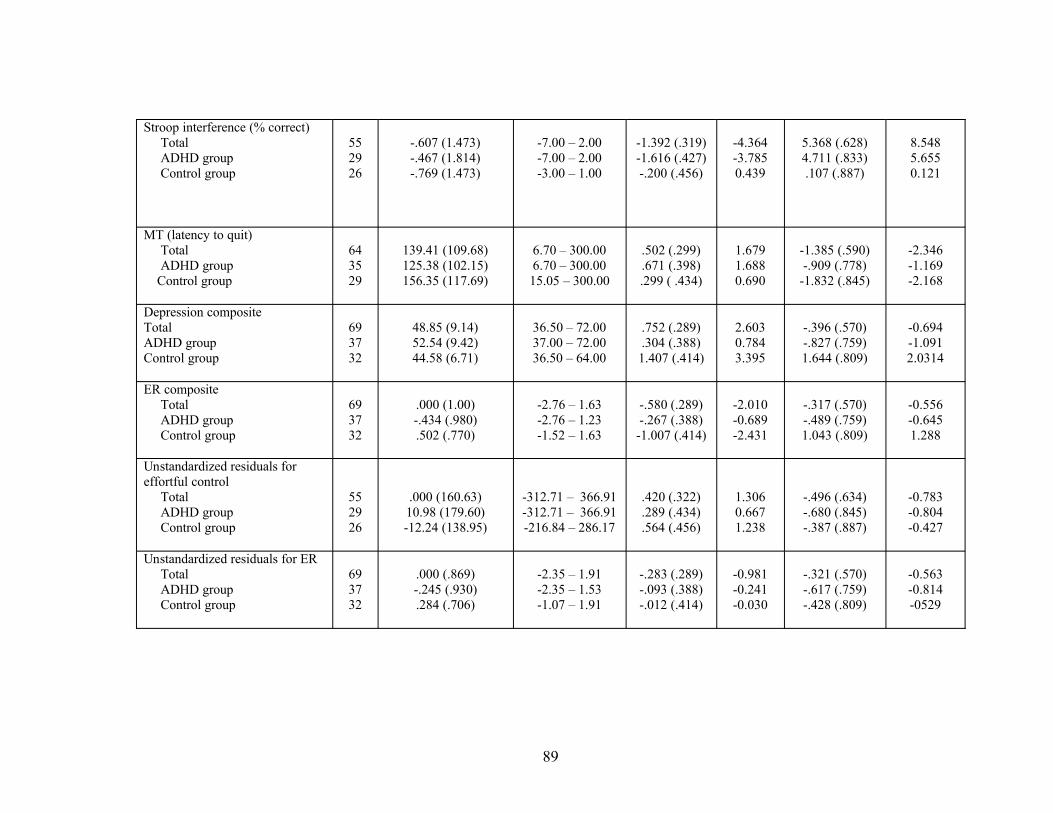
89
Stroop interference (% correct)TotalADHD groupControl group
552926
-.607 (1.473)-.467 (1.814)-.769 (1.473)
-7.00 – 2.00-7.00 – 2.00-3.00 – 1.00
-1.392 (.319)-1.616 (.427)-.200 (.456)
-4.364-3.7850.439
5.368 (.628)4.711 (.833).107 (.887)
8.5485.6550.121
MT (latency to quit)TotalADHD group
Control group
643529
139.41 (109.68)125.38 (102.15)156.35 (117.69)
6.70 – 300.006.70 – 300.0015.05 – 300.00
.502 (.299)
.671 (.398).299 ( .434)
1.6791.6880.690
-1.385 (.590)-.909 (.778)
-1.832 (.845)
-2.346-1.169-2.168
Depression compositeTotalADHD groupControl group
693732
48.85 (9.14)52.54 (9.42)44.58 (6.71)
36.50 – 72.0037.00 – 72.0036.50 – 64.00
.752 (.289)
.304 (.388)1.407 (.414)
2.6030.7843.395
-.396 (.570)-.827 (.759)1.644 (.809)
-0.694-1.0912.0314
ER compositeTotalADHD groupControl group
693732
.000 (1.00)-.434 (.980).502 (.770)
-2.76 – 1.63-2.76 – 1.23-1.52 – 1.63
-.580 (.289)-.267 (.388)-1.007 (.414)
-2.010-0.689-2.431
-.317 (.570)-.489 (.759)1.043 (.809)
-0.556-0.6451.288
Unstandardized residuals for effortful control
TotalADHD group
Control group
552926
.000 (160.63)10.98 (179.60)-12.24 (138.95)
-312.71 – 366.91-312.71 – 366.91-216.84 – 286.17
.420 (.322)
.289 (.434)
.564 (.456)
1.3060.6671.238
-.496 (.634)-.680 (.845)-.387 (.887)
-0.783-0.804-0.427
Unstandardized residuals for ERTotalADHD groupControl group
693732
.000 (.869)-.245 (.930).284 (.706)
-2.35 – 1.91-2.35 – 1.53-1.07 – 1.91
-.283 (.289)-.093 (.388)-.012 (.414)
-0.981-0.241-0.030
-.321 (.570)-.617 (.759)-.428 (.809)
-0.563-0.814-0529
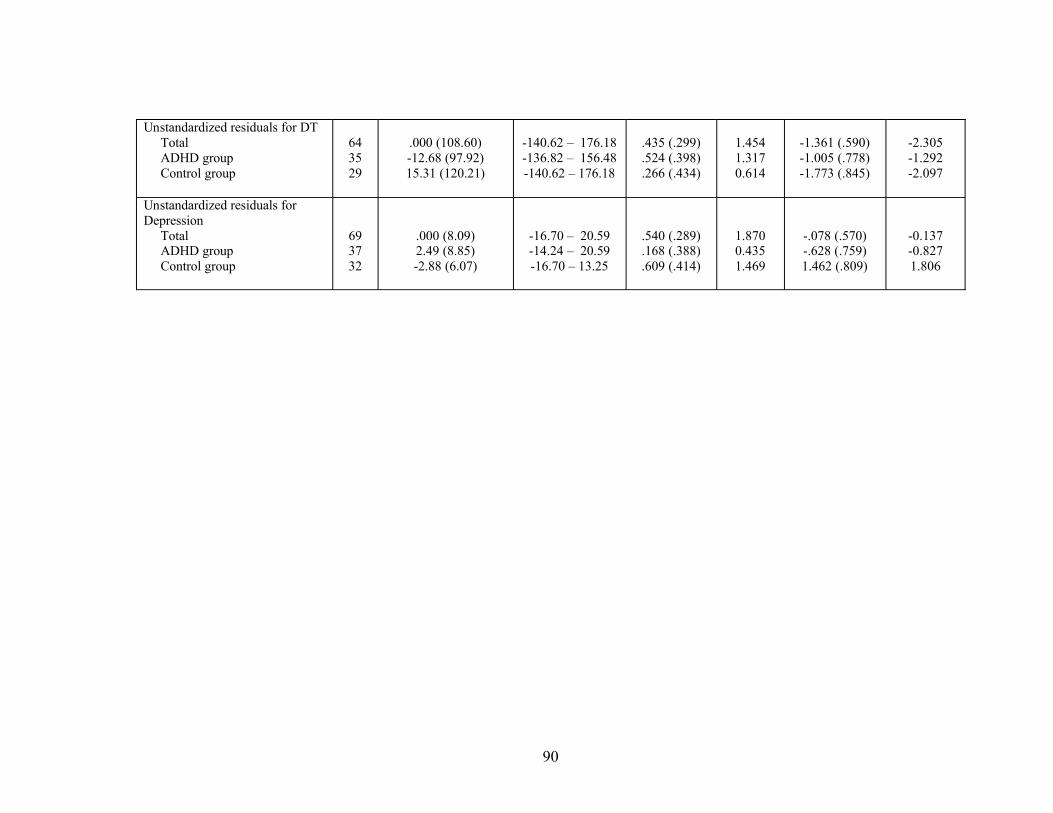
90
Unstandardized residuals for DTTotalADHD groupControl group
643529
.000 (108.60)-12.68 (97.92)15.31 (120.21)
-140.62 – 176.18-136.82 – 156.48-140.62 – 176.18
.435 (.299)
.524 (.398)
.266 (.434)
1.4541.3170.614
-1.361 (.590)-1.005 (.778)-1.773 (.845)
-2.305-1.292-2.097
Unstandardized residuals for Depression
TotalADHD groupControl group
693732
.000 (8.09)2.49 (8.85)-2.88 (6.07)
-16.70 – 20.59-14.24 – 20.59-16.70 – 13.25
.540 (.289)
.168 (.388)
.609 (.414)
1.8700.4351.469
-.078 (.570)-.628 (.759)1.462 (.809)
-0.137-0.8271.806
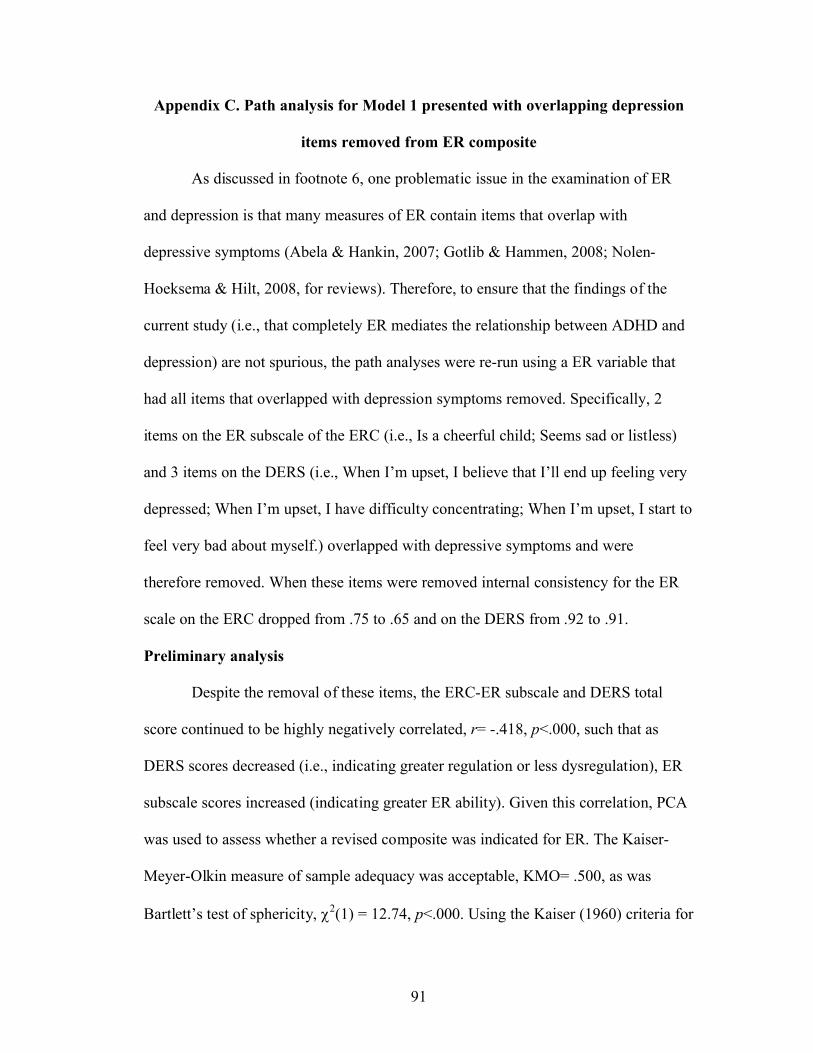
91
Appendix C. Path analysis for Model 1 presented with overlapping depression
items removed from ER composite
As discussed in footnote 6, one problematic issue in the examination of ER
and depression is that many measures of ER contain items that overlap with
depressive symptoms (Abela & Hankin, 2007; Gotlib & Hammen, 2008; Nolen-
Hoeksema & Hilt, 2008, for reviews). Therefore, to ensure that the findings of the
current study (i.e., that completely ER mediates the relationship between ADHD and
depression) are not spurious, the path analyses were re-run using a ER variable that
had all items that overlapped with depression symptoms removed. Specifically, 2
items on the ER subscale of the ERC (i.e., Is a cheerful child; Seems sad or listless)
and 3 items on the DERS (i.e., When I’m upset, I believe that I’ll end up feeling very
depressed; When I’m upset, I have difficulty concentrating; When I’m upset, I start to
feel very bad about myself.) overlapped with depressive symptoms and were
therefore removed. When these items were removed internal consistency for the ER
scale on the ERC dropped from .75 to .65 and on the DERS from .92 to .91.
Preliminary analysis
Despite the removal of these items, the ERC-ER subscale and DERS total
score continued to be highly negatively correlated, r= -.418, p<.000, such that as
DERS scores decreased (i.e., indicating greater regulation or less dysregulation), ER
subscale scores increased (indicating greater ER ability). Given this correlation, PCA
was used to assess whether a revised composite was indicated for ER. The Kaiser-
Meyer-Olkin measure of sample adequacy was acceptable, KMO= .500, as was
Bartlett’s test of sphericity, χ2(1) = 12.74, p<.000. Using the Kaiser (1960) criteria for
92
eigenvalues, results of PCA demonstrated a one factor solution (eigenvalue = 1.418)
which accounted for 70.9% of the variance (communality extraction value = .709).
Use of a scree plot as proposed by Catell (1966) also produced a one factor solution.
Component scores from the coefficient matrix were .594 and -.594 for the ERC ER
subscale and DERS total score respectively. Therefore PCA analyses supported use of
an ER composite despite the deletion of overlapping depression items. For the revised
ER composite, higher scores are reflective of a greater ability to regulate one’s
emotions (i.e., better ER ability).
Path analysis with revised ER composite
Results examining Model 1 with the revised ER composite suggested that the
model was a good fit for the data, χ2 = 1.13, df = 1, p = 0.29. Therefore, additional fit
statistics were reviewed. GFI (0.99), CFI (1.00), and SRMR (.03) and NNRI value
(0.97) all indicated a strong fit. In fact, it appears that Model 1 with the revised ER
composite is a better fit for the data than the initial Model 1 as the AIC value drops
from 20.87 to 19.12. Additional fit statistics are provided in Table 8.
Examination of the paths specified in the model revealed that ADHD
diagnosis significantly predicted ER ability, β = -0.28, p=.002, such that youth with
ADHD demonstrated poorer ER than non-ADHD comparison youth. Emotion
regulation was significantly related to depressive symptoms, β = -0.52, p=.000, such
that youth with greater levels of emotion regulation displayed lower levels of
depressive symptoms. Moreover, the path between ADHD and depression became
non-significant, β = 0.18, p= .09, when ER was included, suggesting a mediating
effect of ER. ADHD diagnosis was not related to effortful control, β = 0.05, p= n.s,
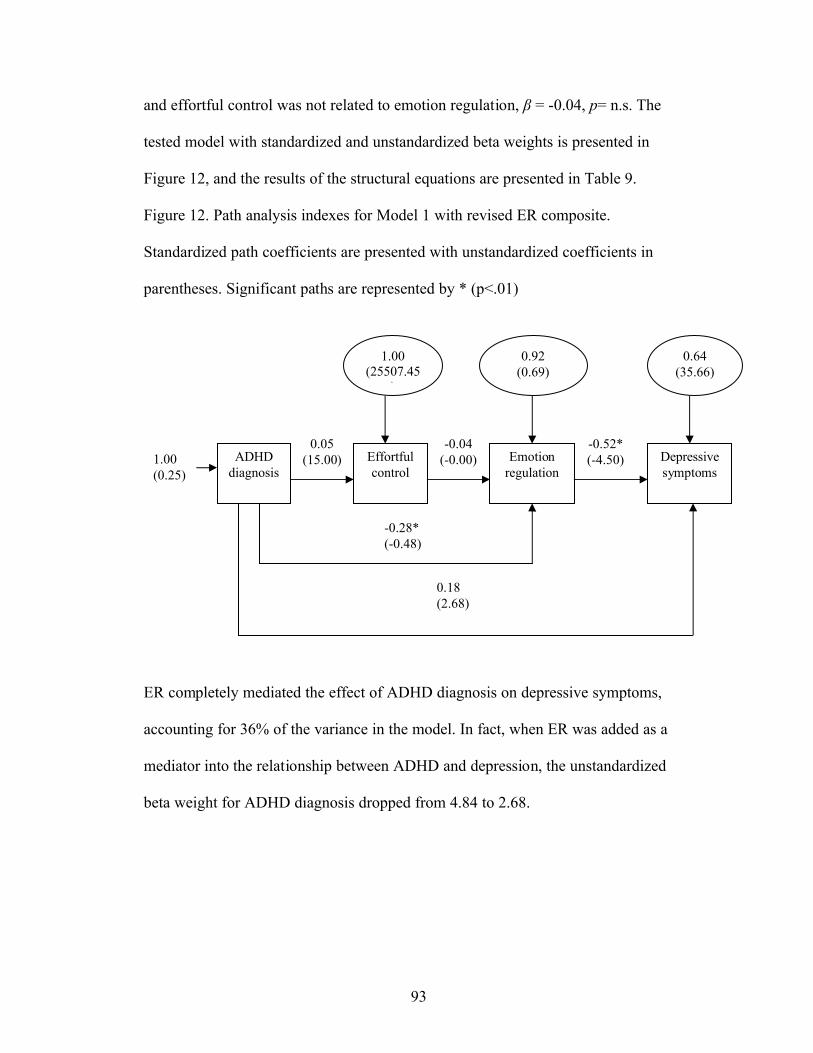
93
and effortful control was not related to emotion regulation, β = -0.04, p= n.s. The
tested model with standardized and unstandardized beta weights is presented in
Figure 12, and the results of the structural equations are presented in Table 9.
Figure 12. Path analysis indexes for Model 1 with revised ER composite.
Standardized path coefficients are presented with unstandardized coefficients in
parentheses. Significant paths are represented by * (p<.01)
ER completely mediated the effect of ADHD diagnosis on depressive symptoms,
accounting for 36% of the variance in the model. In fact, when ER was added as a
mediator into the relationship between ADHD and depression, the unstandardized
beta weight for ADHD diagnosis dropped from 4.84 to 2.68.
-0.28*(-0.48)
-0.52*(-4.50)
-0.04(-0.00)
0.05(15.00)ADHD
diagnosisEffortful control
Emotion regulation
0.18(2.68)
1.00(0.25)
Depressive symptoms
1.00(25507.45
)
0.92(0.69)
0.64(35.66)
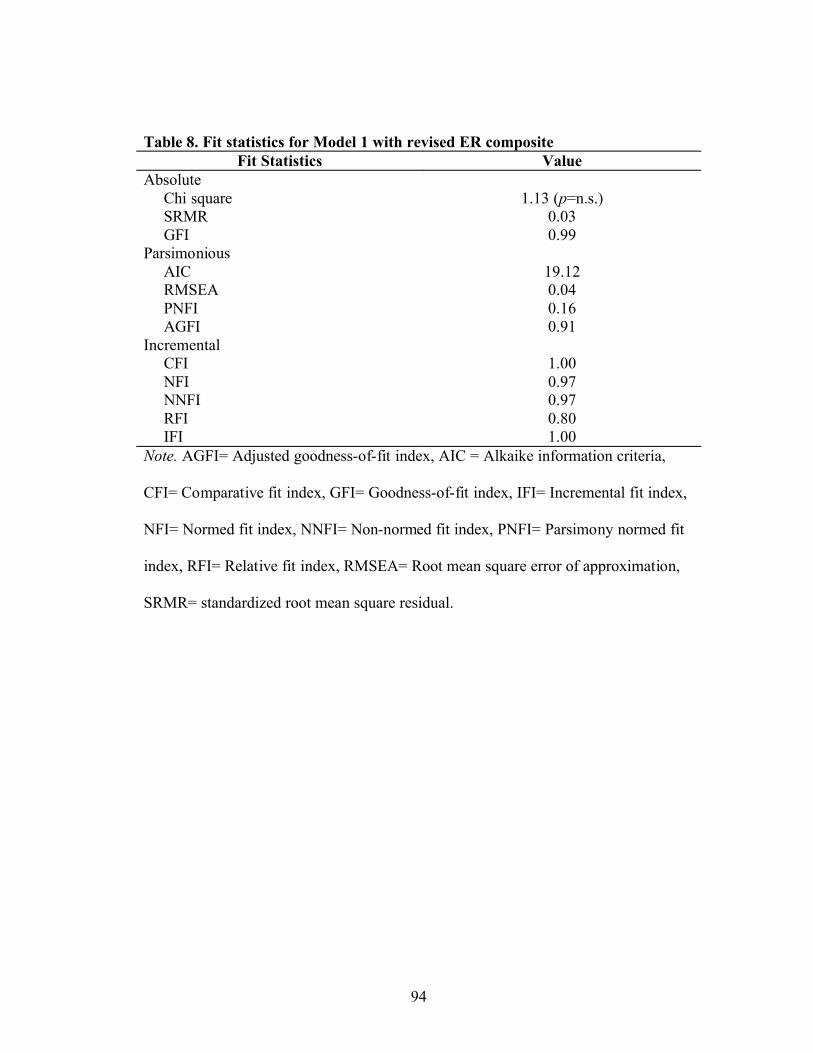
94
Table 8. Fit statistics for Model 1 with revised ER compositeFit Statistics Value
Absolute Chi square 1.13 (p=n.s.)SRMR 0.03GFI 0.99
ParsimoniousAIC 19.12RMSEA 0.04PNFI 0.16AGFI 0.91
Incremental CFI 1.00NFI 0.97NNFI 0.97RFI 0.80IFI 1.00
Note. AGFI= Adjusted goodness-of-fit index, AIC = Alkaike information criteria,
CFI= Comparative fit index, GFI= Goodness-of-fit index, IFI= Incremental fit index,
NFI= Normed fit index, NNFI= Non-normed fit index, PNFI= Parsimony normed fit
index, RFI= Relative fit index, RMSEA= Root mean square error of approximation,
SRMR= standardized root mean square residual.
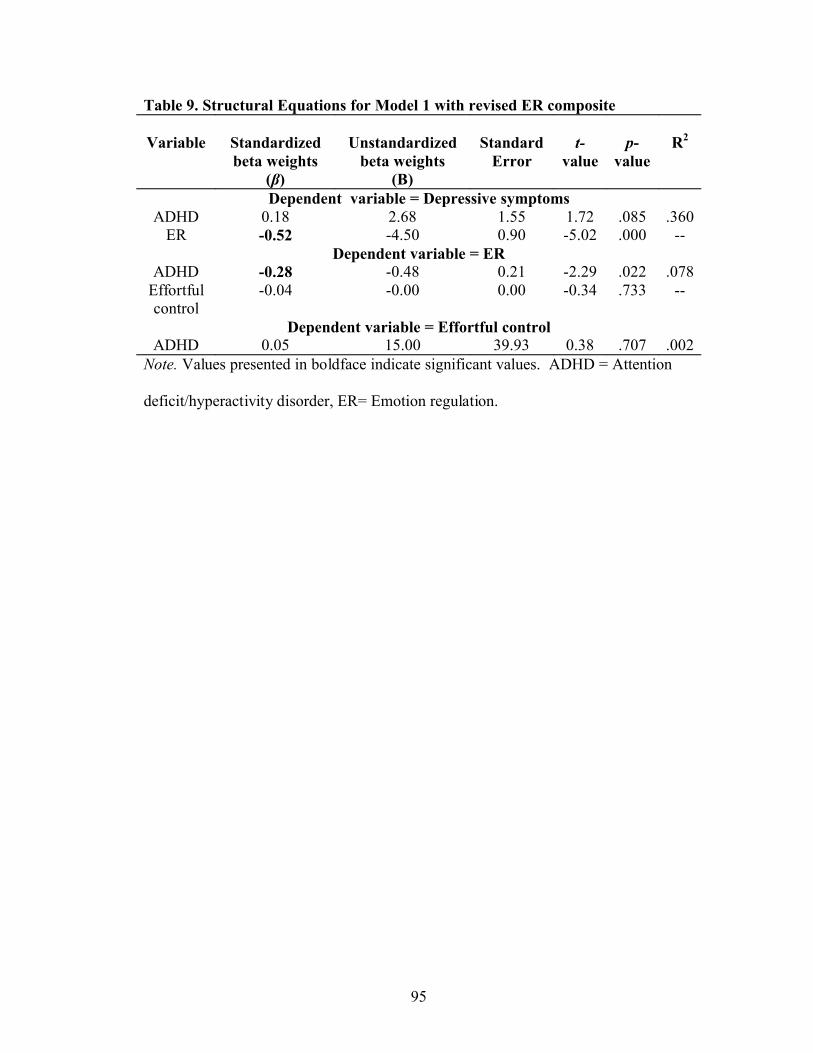
95
Table 9. Structural Equations for Model 1 with revised ER composite
Variable Standardized beta weights
(β)
Unstandardizedbeta weights
(B)
Standard Error
t-value
p-value
R2
Dependent variable = Depressive symptomsADHD 0.18 2.68 1.55 1.72 .085 .360
ER -0.52 -4.50 0.90 -5.02 .000 --Dependent variable = ER
ADHD -0.28 -0.48 0.21 -2.29 .022 .078Effortful control
-0.04 -0.00 0.00 -0.34 .733 --
Dependent variable = Effortful controlADHD 0.05 15.00 39.93 0.38 .707 .002
Note. Values presented in boldface indicate significant values. ADHD = Attention
deficit/hyperactivity disorder, ER= Emotion regulation.
96
Bibliography
Abela, J.R.Z., & Hankin, B.L. (2007). Handbook of Child and Adolescent
Depression. Guilford Press.
Abramson, L., Metalsky, G., & Alloy, L. (1989). Hopelessness depression: A theory-
based subtype of depression. Psychological Review, 96(2), 358-372.
Ahadi, S., & Rothbart, M. (1994). Temperament, development, and the Big Five. The
developing structure of temperament and personality from infancy to
adulthood (pp. 189-207). Hillsdale, NJ, England: Lawrence Erlbaum
Associates, Inc.
Ambrosini, PJ. (2000). Historical Development and Present Status of the Schedule for
Affective Disorders and Schizophrenia for School-Age Children (K-SADS).
Journal of the American Academy of Child & Adolescent Psychiatry, 39, 49-
58.
American Psychiatric Association. (1987). Diagnostic and statistical manual of
mental disorders (3rd ed. revised). Washington, DC: Author.
American Psychiatric Association. (1994). Diagnostic and statistical manual of
mental disorders (4th edition). Washington, DC: Author.
American Psychiatric Association. (2000). Diagnostic and statistical manual of
mental (4th edition, text-revised). Washington, DC: Author.
Anderson, J., Williams, S., McGee, R., & Silva, P. (1987). DSM-III disorders in
preadolescent children: Prevalence in a large sample from the general
population. Archives of General Psychiatry, 44(1), 69-76.
97
Anderson, R.N. & Smith, B.L. (2003). Deaths: Leading causes for 2001. National
Vital Statistics Report, 52, 1-96.
Anestis, M.D., Selby, E.A., Fink, E., & Joiner, T.E. (2007). The multifaceted role of
distress tolerance in dysregulated eating behaviors. International Journal of
Eating Disorders, 40(8), 718-726.
Angold, A., & Costello, E. (1993). Depressive comorbidity in children and
adolescents: Empirical, theoretical, and methodological issues. American
Journal of Psychiatry, 150(12), 1779-1791.
Angold, A., Costello, E., Erkanli, A., & Worthman, C. (1999). Pubertal changes in
hormone levels and depression in girls. Psychological Medicine, 29(5), 1043-
1053.
Angold, A., Erkanli, A., Silberg, J., Eaves, L., & Costello, E. (2002). Depression
scale scores in 8-17-year-olds: Effects of age and gender. Journal of Child
Psychology and Psychiatry, 43(8), 1052-1063.
Apter, A., & King, R.A. (2006). Management of the depressed suicidal child or
adolescent. Child and Adolescent Psychiatric Clinic of North America, 15(4).
Archibald, S., & Kerns, K. (1999). Identification and description of new tests of
executive functioning in children. Child Neuropsychology, 5(2), 115-129.
Avenevoli, S., Knight, E., Kessler, R., & Merikangas, K. (2008). Epidemiology of
depression in children and adolescents. Handbook of depression in children
and adolescents (pp. 6-32). New York, NY US: Guilford Press.
Baddeley, A. (2003). Working Memory: Looking Back and Looking Forward. Nature
Reviews Neuroscience, 4(10), 829-839.
98
Baddeley, A., & Larsen, J. (2007). The phonological loop: Some answers and some
questions. The Quarterly Journal of Experimental Psychology, 60(4), 512-
518.
Bagwell, C., Molina, B., Kashdan, T., Pelham, W., & Hoza, B. (2006). Anxiety and
mood disorders in adolescents with childhood attention-deficit/hyperactivity
disorder. Journal of Emotional and Behavioral Disorders, 14(3), 178-187.
Baker, T.B., Piper, M.E., McCarthy, D.E., Majeskie, M.R., & Fiore, M.C. (2004).
Addiction motivation reformulated: An affective processing model of negative
reinforcement. Psychological Review, 111, 33-51.
Barkley, R. (1997b). ADHD and the nature of self-control. New York: Guilford Press.
Barkley, R. A. (1997). Behavioral inhibition, sustained attention, and executive
functions: Constructing a unifying theory of ADHD. Psychological Bulletin, 121,
65–94.
Baron, R., & Kenny, D. (1986). The moderator–mediator variable distinction in social
psychological research: Conceptual, strategic, and statistical considerations.
Journal of Personality and Social Psychology, 51(6), 1173-1182.
Bauermeister, J., Zimmerman, M., Barnett, T., & Caldwell, C. (2007). Working in
high school and adaptation in the transition to young adulthood among
African American youth. Journal of Youth and Adolescence, 36(7), 877-890.
Biederman, J., Ball, S., Monuteaux, M., Mick, E., Spencer, T., McCreary, M., et al.
(2008). New insights into the comorbidity between ADHD and major
99
depression in adolescent and young adult females. Journal of the American
Academy of Child & Adolescent Psychiatry, 47(4), 426-434.
Biederman, J., Faraone, S., Keenan, K., & Knee, D. (1990). Family-genetic and
psychosocial risk factors in DSM-III attention deficit disorder. Journal of the
American Academy of Child & Adolescent Psychiatry, 29(4), 526-533.
Biederman, J., Monuteaux, M., Mick, E., Spencer, T., Wilens, T., Klein, K., et al.
(2006). Psychopathology in Females with Attention-Deficit/Hyperactivity
Disorder: A Controlled, Five-Year Prospective Study. Biological Psychiatry,
60(10), 1098-1105.
Biederman, J., Newcorn, J., & Sprich, S. (1991). Comorbidity of attention deficit
hyperactivity disorder with conduct, depressive, anxiety, and other disorders.
American Journal of Psychiatry, 148(5), 564-577.
Billings, R., & Wroten, S. (1978). Use of path analysis in industrial/organizational
psychology: Criticisms and suggestions. Journal of Applied Psychology,
63(6), 677-688.
Bird, H., Canino, G., Rubio-Stipec, M., & Gould, M. (1988). Estimates of the
prevalence of childhood maladjustment in a community survey in Puerto
Rico: The use of combined measures. Archives of General Psychiatry, 45(12),
1120-1126.
Birmaher, B., Bridge, J.A., Williamson, D.E., Brent, D.A., Dahl, R.E., Axelson, D.A.
et al. (2004). Psychosocial functioning in youths at high risk to develop major
100
depressive disorder. Journal of the American Academy of Child & Adolescent
Psychiatry, 43(7), 839-846.
Birmaher, B., Ryan, N., Williamson, D., & Brent, D. (1996). Childhood and
adolescent depression: A review of the past 10 years, Part I. Journal of the
American Academy of Child & Adolescent Psychiatry, 35(11), 1427-1439.
Birmaher, B., Ryan, N., Williamson, D., & Brent, D. (1996). Childhood and
adolescent depression: A review of the past 10 years, Part II. Journal of the
American Academy of Child & Adolescent Psychiatry, 35(12), 1575-1583.
Blachman, D., & Hinshaw, S. (2002). Patterns of friendship among girls with and
without attention-deficit/hyperactivity disorder. Journal of Abnormal Child
Psychology, 30(6), 625-640.
Blackman, G., Ostrander, R., & Herman, K. (2005). Children with ADHD and
depression: A multisource, multimethod assessment of clinical, social, and
academic functioning. Journal of Attention Disorders, 8(4), 195-207.
Blasi, G., Goldberg, T., Elvevåg, B., Rasetti, R., Bertolino, A., Cohen, J., et al.
(2007). Differentiating allocation of resources and conflict detection within
attentional control processing. European Journal of Neuroscience, 25(2), 594-
602.
Bond, L., Toumbourou, J., Thomas, L., Catalano, R., & Patton, G. (2005). Individual,
Family, School, and Community Risk and Protective Factors for Depressive
101
Symptoms in Adolescents: A Comparison of Risk Profiles for Substance Use
and Depressive Symptoms. Prevention Science, 6(2), 73-88.
Boone, K., Miller, B., Lesser, I., & Hill, E. (1990). Performance on frontal lobe tests
in healthy, older individuals. Developmental Neuropsychology, 6(3), 215-223.
Boonstra, A., Oosterlaan, J., Sergeant, J., & Buitelaar, J. (2005). Executive
functioning in adult ADHD: A meta-analytic review. Psychological Medicine:
A Journal of Research in Psychiatry and the Allied Sciences, 35(8), 1097-
1108.
Bridge, J., Barbe, R., Birmaher, B., Kolko, D., & Brent, D. (2005). Emergent
Suicidality in a Clinical Psychotherapy Trial for Adolescent Depression. The
American Journal of Psychiatry, 162(11), 2173-2175.
Bridge, J.A., Goldstein, T.R., & Brent, D.A., (2006). Adolescent suicide and suicidal
behavior. Journal of Child Psychology and Psychiatry, 47 (3/4), 372–394.
Bridges, L., Denham, S., & Ganiban, J. (2004). Definitional Issues in Emotion
Regulation Research. Child Development, 75(2), 340-345.
Brown, R., Lejuez, C., Kahler, C., & Strong, D. (2002). Distress tolerance and
duration of past smoking cessation attempts. Journal of Abnormal
Psychology, 111(1), 180-185.
102
Brown, R., Lejuez, C., Kahler, C., Strong, D., & Zvolensky, M. (2005). Distress
tolerance and early smoking lapse. Clinical Psychology Review, 25(6), 713-
733.
Butler, S., Arredondo, D., & McCloskey, V. (1995). Affective comorbidity in
children and adolescents with attention deficit hyperactivity disorder. Annals
of Clinical Psychiatry, 7(2), 51-55.
Byrne, Barbara (1998). Structural equation modeling with LISREL, PRELIS, and
SIMPLIS. Hillsdale, NJ: Lawrence Erlbaum.
Calkins, S., & Dedmon, S. (2000). Physiological and behavioral regulation in two-
year-old children with aggressive/destructive behavior problems. Journal of
Abnormal Child Psychology: An official publication of the International
Society for Research in Child and Adolescent Psychopathology, 28(2), 103-
118.
Calkins, S., & Fox, N. (2002). Self-regulatory processes in early personality
development: A multilevel approach to the study of childhood social
withdrawal and aggression. Development and Psychopathology, 14(3), 477-
498.
Calkins, S., Dedmon, S., Gill, K., Lomax, L., & Johnson, L. (2002). Frustration in
infancy: Implications for emotion regulation, physiological processes, and
temperament. Infancy, 3(2), 175-197.
103
Campbell, J. M. (1998). Internal and external validity of seven Wechsler Intelligence
Scale for Children--Third Edition short forms in a sample of psychiatric
inpatients. Psychological Assessment, 10, 431-434.
Campbell-Sills, L., Barlow, D., Brown, T., & Hofmann, S. (2006). Acceptability and
suppression of negative emotion in anxiety and mood disorders. Emotion,
6(4), 587-595.
Capaldi, D. (1992). Co-occurrence of conduct problems and depressive symptoms in
early adolescent boys: II. A 2-year follow-up at Grade 8. Development and
Psychopathology, 4(1), 125-144.
Carlson, S., & Moses, L. (2001). Individual differences in inhibitory control and
children's theory of mind. Child Development, 72(4), 1032-1053.
Carlson, S., & Wang, T. (2007). Inhibitory control and emotion regulation in
preschool children. Cognitive Development, 22(4), 489-510.
Cattell, R. B. (1966). The scree test for the number of factors. Multivariate
Behavioral Research, 1, 245-276.
Chaplin, T., Cole, P., & Zahn-Waxler, C. (2005). Parental Socialization of Emotion
Expression: Gender Differences and Relations to Child Adjustment. Emotion,
5(1), 80-88.
Chronis, A. M., Lahey, B. B., Pelham, W. E., Kipp, H., Baumann, B., & Lee, S. S.
(2003a). Psychopathology and substance abuse in parents of young children
104
with Attention Deficit/Hyperactivity Disorder. Journal of the American
Academy of Child and Adolescent Psychiatry, 42, 1425–1432.
Cicchetti, D., Ganiban, J., & Barnett, D. (1991). Contributions from the study on high
risk populations understanding the development of emotion regulation. In K.
Dodge, & J. Garber (Eds.). The development of emotion regulation (pp. 15-
48). New York: Cambridge University Press.
Claude, D., & Firestone, P. (1995). The development of ADHD boys: A 12-year
follow-up. Canadian Journal of Behavioural Science, 27(2), 226-249.
Cohen, J., Dunbar, K., & McClelland, J. (1990). On the control of automatic
processes: A parallel distributed processing account of the Stroop effect.
Psychological Review, 97(3), 332-361.
Cole, D. A., & Carpentieri, S. (1990). Social status and the comorbidity of child
depression and conduct disorder. Journal of Consulting and Clinical
Psychology, 58, 748-757.
Cole, P., Martin, S., & Dennis, T. (2004). Emotion Regulation as a Scientific
Construct: Methodological Challenges and Directions for Child Development
Research. Child Development, 75(2), 317-333.
Cole, P., Michel, M., & Teti, L. (1994). The development of emotion regulation and
dysregulation: A clinical perspective. Monographs of the Society for Research
in Child Development, 59(2), 73.
105
Copeland, W., Shanahan, L., Costello, J., & Angold, A. (2009). Childhood and
adolescent psychiatric disorders as predictors of young adult disorders.
Archives of General Psychiatry, 66(7), 764-772.
Corkum, P., & Siegel, L. (1993). Is the Continuous Performance Task a valuable
research tool for use with children with attention-deficit-hyperactivity
disorder?. Journal of Child Psychology and Psychiatry, 34(7), 1217-1239.
Costello, E., Foley, D., & Angold, A. (2006). 10-year research update review: The
epidemiology of child and adolescent psychiatric disorders: II. developmental
epidemiology. Journal of the American Academy of Child & Adolescent
Psychiatry, 45(1), 8-25.
Costello, E., Mustillo, S., Erkanli, A., Keeler, G., & Angold, A. (2003). Prevalence
and Development of Psychiatric Disorders in Childhood and Adolescence.
Archives of General Psychiatry, 60(8), 837-844.
Daughters, S. B., Lejuez, C. W., Bornovalova, M. A., Kahler, C. W., Strong, D. R., &
Brown, R. A. (2005). Distress tolerance as a predictor of early treatment
dropout in a residential substance abuse treatment facility. Journal of
Abnormal Psychology, 114, 729-734.
Daughters, S. B., Lejuez, C. W., Kahler, C. W., Strong, D. R., & Brown, R. A.
(2005). Psychological distress tolerance and duration of most recent
abstinence attempt among residential treatment seeking substance abusers.
Psychology of Addictive Behaviors, 19, 208-211.
106
Daughters, S.B., Reynolds, E.K., MacPherson, L., Kahler, C.W., Danielson, C.K.,
Zvolensky, M., Lejuez, C.W. (2009). Negative Reinforcement and Early
Adolescent Externalizing and Internalizing Symptoms: The Moderating Role
of Gender and Ethnicity. Journal of Child Psychology and Psychiatry.
Davidson, R. (1998). Anterior electrophysiological asymmetries, emotion, and
depression: Conceptual and methodological conundrums. Psychophysiology,
35(5), 607-614.
Daviss, W. (2008). A review of co-morbid depression in pediatric ADHD: Etiologies,
phenomenology, and treatment. Journal of Child and Adolescent
Psychopharmacology, 18(6), 565-571.
Daviss, W., Diler, R., & Birmaher, B. (2009). Associations of lifetime depression
with trauma exposure, other environmental adversities, and impairment in
adolescents with ADHD. Journal of Abnormal Child Psychology: An official
publication of the International Society for Research in Child and Adolescent
Psychopathology, 37(6), 857-871.
Desimone, R., & Duncan, J. (1995). Neural mechanisms of selective visual attention.
Annual Review of Neuroscience, 18, 193-222.
Dodge, K. (1991). Emotion and social information processing. The development of
emotion regulation and dysregulation (pp. 159-181). New York, NY, US:
Cambridge University Press.
107
Douglas, V.I. (1983). Attention and cognitive problems. In M. Rutter (Ed.),
Developmental Neuropsychiatry (pp. 280-329). New York: Guilford Press.
Eisenberg, N. & Spinrad, T.L. (2004). Emotion-related regulation: Sharpening the
definition. Child Development, 75, 334-339.
Eisenberg, N., Cumberland, A., Spinrad, T., Fabes, R., Shepard, S., Reiser, M., et al.
(2001). The relations of regulation and emotionality to children's externalizing
and internalizing problem behavior. Child Development, 72(4), 1112-1134.
Eisenberg, N., Fabes, R., Guthrie, I., & Murphy, B. (1996). The relations of
regulation and emotionality to problem behavior in elementary school
children. Development and Psychopathology, 8(1), 141-162.
Eisenberg, N., Sadovsky, A., Spinrad, T., Fabes, R., Losoya, S., Valiente, C., et al.
(2005). The Relations of Problem Behavior Status to Children's Negative
Emotionality, Effortful Control, and Impulsivity: Concurrent Relations and
Prediction of Change. Developmental Psychology, 41(1), 193-211.
Elia, J., Ambrosini, P., & Berrettini, W. (2008). ADHD characteristics: I. Concurrent
co-morbidity patterns in children & adolescents. Child and Adolescent
Psychiatry and Mental Health, 2,
Fabiano, G. A., Pelham, W. E., Waschbusch, D., Gnagy, E. M., , Lahey, B. B.,
Chronis, A. M., Onyango, A. N., Kipp, H., Lopez-Williams, A., & Burrows-
MacLean, L. (2006). A practical impairment measure: psychometric
properties of the impairment rating scale in three samples of children with
108
attention-deficit/hyperactivity disorder. Journal of Clinical Child and
Adolescent Psychology, 35, 369-385.
Feng, X., Keenan, K., Hipwell, A., Henneberger, A., Rischall, M., Butch, J., et al.
(2009). Longitudinal associations between emotion regulation and depression
in preadolescent girls: Moderation by the caregiving environment.
Developmental Psychology, 45(3), 798-808.
Field, A. (2004). Discovering Statistics Using SPSS-2nd edition. London. Sage
Publications.
Fischer, M., Barkley, R., Smallish, L., & Fletcher, K. (2002). Young adult follow-up
of hyperactive children: Self-reported psychiatric disorders, comorbidity, and
the role of childhood conduct problems and teen CD. Journal of Abnormal
Child Psychology, 30(5), 463-475.
Fox, N., & Calkins, S. (2003). The development of self-control of emotion: Intrinsic
and extrinsic influences. Motivation and Emotion, 27(1), 7-26.
Garber, J., Braafladt, N., & Weiss, B. (1995). Affect regulation in depressed and
nondepressed children and young adolescents. Development and
Psychopathology, 7(1), 93-115.
Garber, J., Braafladt, N., & Zeman, J. (1991). The regulation of sad affect: An
information-processing perspective. The development of emotion regulation
and dysregulation (pp. 208-240). New York, NY US: Cambridge University
Press.
109
Garson, G. David (2009). "Structural Equation Modeling", from Statnotes: Topics in
Multivariate Analysis. Retrieved from
http://faculty.chass.ncsu.edu/garson/pa765/statnote.htm.
Gelfand, L., Mensinger, J., & Tenhave, T. (2009). Mediation analysis: A retrospective
snapshot of practice and more recent directions. Journal of General
Psychology, 136(2), 153-176.
Gerardi, G., Rothbart, M.K., Posner, M.I., Kepler, S. (1996). The development of
attentional control: Performance on a spatial Stroop-like task at 24, 30, and
36–38 months of age. Poster session presented at the annual meeting of the
International Society for Infant Studies, Providence; Rhode Island.
Gerardi-Caulton, G. (2000). Sensitivity to spatial conflict and the development of
self-regulation in children 24-36 months of age. Developmental Science, 3(4),
397-404.
Gittelman, R., Mannuzza, S., Shenker, R., & Bonagura, N. (1985). Hyperactive boys
almost grown up: I. Psychiatric status. Archives of General Psychiatry,
42(10), 937-947.
Gotlib, I., & Hammen, C. (2009). Handbook of depression (2nd ed.). New York, NY
US: Guilford Press.
110
Gratz, K. (2003). Risk factors for and functions of deliberate self-harm: An empirical
and conceptual review. Clinical Psychology: Science and Practice, 10(2),
192-205.
Gratz, K. L., Tull, M. T., Reynolds, E. K., Daughters, S. B., & Lejuez, C. W.
(Submitted for publication) Extending extant models of the pathogenesis of
borderline personality disorder to childhood borderline pathology: The roles
of affective dysfunction, disinhibition, and self- and emotion-regulation
deficits.
Gratz, K., & Roemer, L. (2004). Multidimensional assessment of emotion regulation
and dysregulation: Development, factor structure, and initial validation of the
difficulties in emotion regulation scale. Journal of Psychopathology and
Behavioral Assessment, 26(1), 41-54.
Gratz, K., Rosenthal, M., Tull, M., Lejuez, C., & Gunderson, J. (2006). An
Experimental Investigation of Emotion Dysregulation in Borderline
Personality Disorder. Journal of Abnormal Psychology, 115(4), 850-855.
Gross, J., & John, O. (2003). Individual differences in two emotion regulation
processes: Implications for affect, relationships, and well-being. Journal of
Personality and Social Psychology, 85(2), 348-362.
Hair, J.F., Black, W.C., Babin, B.J., Anderson, R.E., & Tatham, R.L. (2006).
Multivariate Data Analysis-6th Edition. New Jersey, Pearson-Prentice Hill.
Hankin, B., Abramson, L., Moffitt, T., Silva, P., McGee, R., & Angell, K. (1998).
Development of depression from preadolescence to young adulthood:
111
Emerging gender differences in a 10-year longitudinal study. Journal of
Abnormal Psychology, 107(1), 128-140.
Harris, K., Boots, M., Talbot, J & Vance A. (2006). Comparison of Psychosocial
Correlates in Primary School Age Children with Attention
Deficit/Hyperactivity Disorder- Combined Type, with and without Dysthymic
Disorder. Child Psychiatry and Human Development, 36(4), 419-426.
Hart, E. L., Lahey, B.B., Loeber, R., & Hanson, K. S. (1994). Criterion validity of
informants in the diagnosis of disruptive behavior disorders in children: A
preliminary study. Journal of Consulting and Clinical Psychology, 62, 410-
414.
Hilt, L., & Nolen-Hoeksema, S. (2009). The emergence of gender differences in
depression in adolescence. Handbook of depression in adolescents (pp. 111-
135). New York, NY US: Routledge/Taylor & Francis Group.
Hinshaw, S., Owens, E., Sami, N., & Fargeon, S. (2006). Prospective follow-up of
girls with attention-deficit/hyperactivity disorder into adolescence: Evidence
for continuing cross-domain impairment. Journal of Consulting and Clinical
Psychology, 74(3), 489-499.
Homack, S., & Riccio, C. (2004). A meta-analysis of the sensitivity and specificity of
the Stroop Color and Word Test with children. Archives of Clinical
Neuropsychology, 19(6), 725-743.
112
Hoza, B., Gerdes, A., Hinshaw, S., Arnold, L., Pelham, W., Molina, B., et al. (2004).
Self-Perceptions of Competence in Children With ADHD and Comparison
Children. Journal of Consulting and Clinical Psychology, 72(3), 382-391.
Hoza, B., Gerdes, A., Mrug, S., Hinshaw, S., Bukowski, W., Gold, J., et al. (2005).
Peer-Assessed Outcomes in the Multimodal Treatment Study of Children
With Attention Deficit Hyperactivity Disorder. Journal of Clinical Child and
Adolescent Psychology, 34(1), 74-86.
Hu, L., & Bentler, P. (1995). Evaluating model fit. Structural equation modeling:
Concepts, issues, and applications (pp. 76-99). Thousand Oaks, CA US: Sage
Publications, Inc.
Hu, L., & Bentler, P. (1999). Cutoff criteria for fit indexes in covariance structure
analysis: Conventional criteria versus new alternatives. Structural Equation
Modeling, 6(1), 1-55.
Izard, C. (1977). Human Emotions. Plenum Press, New York.
Jaccard, J., & Wan, C. (1996). LISREL approaches to interaction effects in multiple
regression. Thousand Oaks, CA US: Sage Publications, Inc.
Jacobson & Gould (2009). Suicide and nonsuicidal self-injurious behaviors among
youth: Risk and protective factors. Handbook of depression in adolescents.
Nolen-Hoeksema, S. (Ed.); Hilt, L.M. (Ed.); pp. 207-235. New York, NY, US:
Routledge/Taylor & Francis Group.
113
James, A., Lai, F., & Dahl, C. (2004). Attention deficit hyperactivity disorder and
suicide: A review of possible associations. Acta Psychiatrica Scandinavica,
110(6), 408-415.
James, L. R., & Brett, J. M. (1984). Mediators, moderators and tests for mediation.
Journal of Applied Psychology, 69, 307-321.
James, L. R., Mulaik, S. A., & Brett, J. M. (2006). A tale of two methods.
Organizational Research Methods, 9(2), 233–244.
Jensen, J., & Garfinkel, B. (1988). Neuroendocrine aspects of attention deficit
hyperactivity disorder. Neurologic Clinics, 6(1), 111-129.
Jensen, P. S., Rubio-Stipec, M., Canino, G., Bird, H. R., Dulcan, M. K., Schwab-
Stone, M. E., et al. (1999). Parent and child contributions to diagnosis of
mental disorder: Are both informants always necessary? Journal of the
American Academy of Child and Adolescent Psychiatry, 38, 1569-1579.
Jensen, P. S., Shervette, R. E., Xenakis, S. N., & Richters, J. (1993). Anxiety and
depressive disorders in attention deficit disorder with hyperactivity: New
findings. American Journal of Psychiatry, 150, 1203-1209.
Jensen, P., Martin, D., & Cantwell, D. (1997). Comorbidity in ADHD: Implications
for research, practice, and DSM-V. Journal of the American Academy of Child
& Adolescent Psychiatry, 36(8), 1065-1079.
Jensen, P.S., Mrazek, D., Knapp, P.K., Steinberg, L., Pfeffer, C., Schowalter, J., &
Shapiro, T. (1997). Evolution and Revolution in Child Psychiatry: ADHD as a
Disorder of Adaptation, Journal of the American Academy of Child and
Adolescent Psychiatry, 36, 1672-1679.
114
Johnston, C., & Mash, E. J. (2001). Families of children with attention-
deficit/hyperactivity disorder: Review and recommendations for future
research. Clinical Child and Family Psychology Review, 4, 183-207.
Jones, L., Rothbart, M., & Posner, M. (2003). Development of executive attention in
preschool children. Developmental Science, 6(5), 498-504.
Jöreskog, K. G. & Sörbom, D. (1997). LISREL 8: A guide to the program and
applications. Chicago, IL: SPSS Inc.
Kaminer, Yifrah (Ed.); Bukstein, Oscar G. (Ed.); Adolescent substance abuse:
Psychiatric comorbidity and high-risk behaviors. New York, NY, US:
Routledge/Taylor & Francis Group, 2008.
Kane, M., & Engle, R. (2003). Working-memory capacity and the control of
attention: The contributions of goal neglect, response competition, and task set
to Stroop interference. Journal of Experimental Psychology: General, 132(1),
47-70.
Kashani, J., & Sherman, D. (1988). Childhood depression: Epidemiology, etiological
models, and treatment implications. Integrative Psychiatry, 6(1), 1-21.
Kastner, S., & Ungerleider, L. (2001). The neural basis of biased competition in
human visual cortex. Neuropsychologia, 39(12), 1263-1276.
Katz, L., & Gottman, J. (1991). Marital discord and child outcomes: A social
psychophysiological approach. The development of emotion regulation and
115
dysregulation (pp. 129-155). New York, NY, US: Cambridge University
Press.
Kaufman, J., Birmaher, B., Brent, D., et al. (1997), Schedule for Affective Disorders
and Schizophrenia for School-Age Children-Present and Lifetime Version (K-
SADS-PL): initial reliability and validity data. Journal of the American Academy
of Child & Adolescent Psychiatry, 36, 980-988.
Kazdin, A. (1989b). Childhood depression. Journal of Child and Psychology and
Psychiatry, 31, 121-160.
Kazdin, A. (1990). Childhood depression. Journal of Child Psychology and
Psychiatry, 31(1), 121-160.
Kazdin, A.E., French, N.H., Unis, A.S., Esveldt-Dawson, K., & Sherick, R.B. (1983).
Hopelessness, depression, and suicidal intent among psychiatrically disturbed
inpatient children. Journal of Consulting and Clinical Psychology, 51, 504-
510.
Keenan, K. (2000). Emotion dysregulation as a risk factor for child psychopathology.
Clinical Psychology: Science and Practice, 7(4), 418-434.
Keenan-Miller, Danielle; Hammen, Constance L.; Brennan, Patricia A. (2007).
Health outcomes related to early adolescent depression. Journal of Adolescent
Health, 41(3), 256-262.
Kenny, D.A. (2010). “Mediation”. http://davidakenny.net/cm/mediate.htm.
116
Kessler, R. (2002). Epidemiology of depression. Handbook of depression (pp. 23-42).
New York, NY US: Guilford Press.
Kessler, R., Avenevoli, S., & Merikangas, K. (2001). Mood disorders in children and
adolescents: An epidemiologic perspective. Biological Psychiatry, 49(12),
1002-1014.
Kim, K., Conger, R., Elder, G., & Lorenz, F. (2003). Reciprocal influences between
stressful life events and adolescent internalizing and externalizing problems.
Child Development, 74(1), 127-143.
Klein, R., & Mannuzza, S. (1991). Long-term outcome of hyperactive children: A
review. Journal of the American Academy of Child & Adolescent Psychiatry,
30(3), 383-387.
Kopp, C. (1989). Regulation of distress and negative emotions: A developmental
view. Developmental Psychology, 25(3), 343-354.
Kovacs, M. (1992) Children’s Depression Inventory manual. North Tonawanda, NY:
Multi-Health Systems.
Kovacs, M. (1996). Presentation and course of major depressive disorder during
childhood and later years of the life span. Journal of the American Academy of
Child & Adolescent Psychiatry, 35(6), 705-715.
Kovacs, M., & Beck, A. T. (1977). An empirical-clinical approach toward a
definition of childhood depression. In J. G. Schulterbrandt & A. Raskin
(Eds.), Depression in childhood (pp. 1-25). New York: Raven Press.
117
Kovacs, M., & Goldston, D. (1991). Cognitive and social cognitive development of
depressed children and adolescents. Journal of the American Academy of
Child & Adolescent Psychiatry, 30(3), 388-392.
Kovacs, M., Sherrill, J., George, C., Pollock, M., Tumuluru, R., & Ho, V. (2006).
Contextual Emotion-Regulation Therapy for Childhood Depression:
Description and Pilot Testing of a New Intervention. Journal of the American
Academy of Child & Adolescent Psychiatry, 45(8), 892-903.
Ladouceur, C., Dahl, R., Williamson, D., Birmaher, B., Ryan, N., & Casey, B.
(2005). Altered Emotional Processing in Pediatric Anxiety, Depression, and
Comorbid Anxiety-Depression. Journal of Abnormal Child Psychology: An
official publication of the International Society for Research in Child and
Adolescent Psychopathology, 33(2), 165-177.
Lahey, B.B., Chronis, A.M., Lee, S., Loney, J., Pelham, W.E., & Hartung. C.M.
(2007). Are There Sex Differences in the Predictive Validity of DSM-IV
ADHD Among Younger Children? Journal of Clinical Child and Adolescent
Psychology.
Lansbergen, M., Kenemans, J., & van Engeland, H. (2007). Stroop interference and
attention-deficit/hyperactivity disorder: A review and meta-analysis.
Neuropsychology, 21(2), 251-262.

118
Larson, R., Raffaelli, M., Richards, M., Ham, M., & Jewell, L. (1990). Ecology of
depression in late childhood and early adolescence: A profile of daily states
and activities. Journal of Abnormal Psychology, 99(1), 92-102.
Laurent, J., Catanzaro, S., Joiner, T., Rudolph, K., Potter, K., Lambert, S., et al.
(1999). A measure of positive and negative affect for children: Scale
development and preliminary validation. Psychological Assessment, 11(3),
326-338.
Lavigne, J., LeBailly, S., Hopkins, J., Gouze, K., & Binns, H. (2009). The prevalence
of ADHD, ODD, depression, and anxiety in a community sample of 4-year-
olds. Journal of Clinical Child and Adolescent Psychology, 38(3), 315-328.
Lawrence, V., Houghton, S., Tannock, R., Douglas, G., Durkin, K., & Whiting, K.
(2002). ADHD outside the laboratory: Boys' executive function performance
on tasks in videogame play and on a visit to the zoo. Journal of Abnormal
Child Psychology, 30(5), 447-462.
Lee, S., Lahey, B., Owens, E., & Hinshaw, S. (2008). Few preschool boys and girls
with ADHD are well-adjusted during adolescence. Journal of Abnormal Child
Psychology: An official publication of the International Society for Research
in Child and Adolescent Psychopathology, 36(3), 373-383.
Lejuez, C.W., Kahler, C.W., & Brown, R.A. (2003). A modified computer version of
the Paced Auditory Serial Addition Task (PASAT) as a laboratory-based
stressor. The Behavior Therapist, 26(4), 290-293.
119
Lewinsohn, P. M., Rohde, P., & Seeley, J. R. (1993). Psychosocial characteristics of
adolescents with a history of suicide attempt. Journal of the American
Academy of Child and Adolescent Psychiatry, 32, 60-68.
Lewinsohn, P.M., Hops, H., Roberts, R.E., Seeley, J.R., & Andrews, J.A. (1993).
Adolescent psychopathology: I. Prevalence, and incidence of depression and
other DSM-III-R disorders in high school students. Journal of Abnormal
Psychology, 102, 133-244.
Lewinsohn, P.M., Rohde, P., Seeley, J.R., & Baldwin, C.L. (2001). Gender
differences in suicide attempts from adolescence to young adulthood. Journal
of the American Academy of Child and Adolescent Psychology, 40 (4), 427–
434.
Lijffijt, M., Kenemans, J., Verbaten, M., & van Engeland, H. (2005). A Meta-
Analytic Review of Stopping Performance in Attention-Deficit/Hyperactivity
Disorder: Deficient Inhibitory Motor Control?. Journal of Abnormal
Psychology, 114(2), 216-222.
Lilienfeld, S. (2003). Comorbidity Between and Within Childhood Externalizing and
Internalizing Disorders: Reflections and Directions. Journal of Abnormal
Child Psychology, 31(3), 285-291.
Linehan, M. (1993). Skills training manual for treating borderline personality
disorder. New York, NY US: Guilford Press.
Little, T., Card, N., Bovaird, J., Preacher, K., & Crandall, C. (2007). Structural
equation modeling of mediation and moderation with contextual factors.
120
Modeling contextual effects in longitudinal studies (pp. 207-230). Mahwah,
NJ US: Lawrence Erlbaum Associates Publishers.
Losier, B., McGrath, P., & Klein, R. (1996). Error patterns of the Continuous
Performance Test in non-medicated and medicated samples of children with
and without ADHD: A meta-analytic review. Journal of Child Psychology
and Psychiatry, 37(8), 971-987.
Maedgen, J., & Carlson, C. (2000). Social functioning and emotional regulation in the
attention deficit hyperactivity disorder subtypes. Journal of Clinical Child
Psychology, 29(1), 30-42.
Mannuzza, S. & Gittelman, R. (1984). The adolescent outcome of hyperactive girls.
Psychiatry Research, 13, 19-29.
Mannuzza, S., Klein, R., Bessler, A., Malloy, P., & LaPadula, M. (1998). Adult
psychiatric status of hyperactive boys grown up. The American Journal of
Psychiatry, 155(4), 493-498.
Melnick, S.M. & Hinshaw, S.P. (2000). Emotion regulation and parenting in AD/HD
and comparison boys: Linkages with social behaviors and peer preference.
Journal of Abnormal Child Psychology, 28, 73-86.
Mendelson, W., Johnson, N., & Stewart, M. (1971). Hyperactive children as
teenagers: A follow-up study. Journal of Nervous and Mental Disease,
153(4), 273-279.
121
Mennin, D., Heimberg, R., Turk, C., & Fresco, D. (2005). Preliminary evidence for
an emotion dysregulation model of generalized anxiety disorder. Behaviour
Research and Therapy, 43(10), 1281-1310.
Milberger, S., Biederman, J., Faraone, S., & Murphy, J. (1995). Attention deficit
hyperactivity disorder and comorbid disorder: Issues of overlapping
symptoms. American Journal of Psychiatry, 152(12), 1793-1799.
Neumann, A., van Lier, P. A. C., Gratz, K. L., & Koot, H. M. (in press).
Multidimensional assessment of emotion regulation difficulties in adolescents
using the Difficulties in Emotion Regulation Scale. Assessment.
Nigg, J. T., & Hinshaw, S. P. (1998). Parental personality and psychopathology
associated with antisocial behaviors in childhood attention-deficit
hyperactivity disorder. Journal of Child Psychology and Psychiatry, 39, 145-
159.
Nigg, J.T. (2000). On inhibition/disinhibition in developmental psychopathology:
Views from cognitive and personality psychology and a working inhibition
taxonomy. Psychological Bulletin, 126, 220-246.
Norvilitis, J., Casey, R., Brooklier, K., & Bonello, P. (2000). Emotion appraisal in
children with attention-deficit/hyperactivity disorder and their parents.
Journal of Attention Disorders, 4(1), 15-26.
Oosterlaan, J., Logan, G., & Sergeant, J. (1998). Response inhibition in CD, anxious,
and control children: A meta-analysis of studies with the stop task. Journal of
Child Psychology and Psychiatry, 39(3), 411-425.
122
Ostrander, R., & Herman, K. (2006). Potential Cognitive, Parenting, and
Developmental Mediators of the Relationship Between ADHD and
Depression. Journal of Consulting and Clinical Psychology, 74(1), 89-98.
Patterson, G., & Stoolmiller, M. (1991). Replications of a dual failure model for boys'
depressed mood. Journal of Consulting and Clinical Psychology, 59(4), 491-
498.
Pelham, W. E., Gnagy, E. M., Greenslade, K. E., & Milich, R. (1992). Teacher
ratings of DSM-III-R symptoms for the disruptive behavior disorders. Journal
of the American Academy of Child and Adolescent Psychiatry, 31, 210-218.
Pelham, W., & Bender, M. (1982). Peer relationships in hyperactive children:
Description and treatment. Advances in Learning & Behavioral Disabilities, 1,
365-436.
Pérez-Edgar, K., & Fox, N. A. (2000, July). The Impact of Frontal Asymmetry and
Attentional Control on Social Reticence. Poster presented at the International
Conference on Infant Studies, Brighton, England.
Piacentini, J. C., Cohen, P., & Cohen, J. (1992). Combining discrepant diagnostic
information from multiple sources: Are complex algorithms better than simple
ones? Journal of Abnormal Child Psychology, 20, 51-63.
Piacentini, J. C., Cohen, P., & Cohen, J. (1992). Combining discrepant diagnostic
information from multiple sources: Are complex algorithms better than simple
ones? Journal of Abnormal Child Psychology, 20, 51-63.
Plutick, R. (1980). Emotions: A psychoevolutionary synthesis, New York: NY.
Harper & Row.
123
Quinn, E., Brandon, T., & Copeland, A. (1996). Is task persistence related to smoking
and substance abuse? The application of learned industriousness theory to
addictive behaviors. Experimental and Clinical Psychopharmacology, 4(2),
186-190.
Reynolds, C. R., & Kamphaus, R. W. (2004). Behavior Assessment System for
Children, Second Edition (BASC-2). Circle Pines, MN: American Guidance
Service.
Rice, F., Lifford, K.J., Thomas, H.V. & Thapar, A. (2007). Mental health and
functional outcomes of maternal and adolescent reports of adolescent
depressive symptoms, Journal of the American Academy of Child &
Adolescent Psychiatry, 46(9), 1162-1170.
Rohde, P., Lewinsohn, P., & Seeley, J. (1994). Response of depressed adolescents to
cognitive-behavioral treatment: Do differences in initial severity clarify the
comparison of treatments?. Journal of Consulting and Clinical Psychology,
62(4), 851-854.
Rohde, P., Lewinsohn, P.M., & Seeley, J.R. (1991). Comorbidity of unipolar
depression: II. Comorbidity with other mental disorders in adolescents and
adults. Journal of Abnormal Psychology, 100, 214-222.
Rosenbaum, M., & Baker, E. (1984). Self-control behavior in hyperactive and
nonhyperactive children. Journal of Abnormal Child Psychology, 12(2), 303-
317.
124
Rothbart, M., Ahadi, S., Hersey, K., & Fisher, P. (2001). Investigations of
temperament at three to seven years: The Children's Behavior Questionnaire.
Child Development, 72(5), 1394-1408.
Rothbart, M., Posner, M., & Boylan, A. (1990). Regulatory mechanisms in infant
development. The development of attention: Research and theory (pp. 47-66).
Oxford, England: North-Holland.
Rothbart, M.K. (1989). Temperament and development. In G.A. Kohnstamm, J.E.
Bates & M.K. Rothbart (Eds.), Temperament in childhood (pp. 187-247).
Chichester, England: Wiley.
Rothbart, M.K., & Posner, M. (1985). Temperament and the development of self-
regulation. In Hartlafe, L.C., & Telzrow, C.F. (Eds.), The neuropsychology of
individual differences: A developmental perspective (pp. 93-123). New York:
Plenum.
Rude, S.S., McCarthy, C.J. (2003). Emotion regulation in depressed and depression
vulnerable college students. Cognition and Emotion, 17(5), 799-806.
Saylor, C.F., Finch, A.J., Baskin, C.H., Furey, W. & Kelly, M.M. (1984). Construct
validity for measures of childhood depression: Application of multitrait-
multimethod methodology. Journal of Consulting and Clinical Psychology,
52, 977-985.
Scheres, A., Oosterlaan, J., Geurts, H., Morein-Zamir, S., Meiran, N., Schut, H., et al.
(2004). Executive functioning in boys with ADHD: Primarily an inhibition
deficit?. Archives of Clinical Neuropsychology, 19(4), 569-594.
125
Schmeichel, B., Volokhov, R., & Demaree, H. (2008). Working memory capacity and
the self-regulation of emotional expression and experience. Journal of
Personality and Social Psychology, 95(6), 1526-1540.
Schumacker, R. E., & Lomax, R. G. (2004). A beginner’s guide to structural equation
modeling. Mahwah, NJ: Lawrence Erlbaum.
Schwartz, K., & Verhaeghen, P. (2008). ADHD and Stroop interference from age 9 to
age 41 years: A meta-analysis of developmental effects. Psychological
Medicine: A Journal of Research in Psychiatry and the Allied Sciences,
38(11), 1607-1616.
Scime, M., & Norvilitis, J. (2006). Task performance and response to frustration in
children with attention deficit hyperactivity disorder. Psychology in the
Schools, 43(3), 377-386.
Shaffer, D., Fisher, P., Dulcan, M., & Davies, M. (1996). The NIMH Diagnostic
Interview Schedule for Children Version 2.3 (DISC-2.3): Description,
acceptability, prevalence rates, and performance in the MECA study. Journal
of the American Academy of Child & Adolescent Psychiatry, 35(7), 865-877.
Shaw, D., & Winslow, E. (1997). Precursors and correlates of antisocial behavior
from infancy to preschool. Handbook of antisocial behavior (pp. 148-158).
Hoboken, NJ US: John Wiley & Sons Inc.
126
Shields, A. M., & Cicchetti, D. (1997). Emotion regulation in school-age children:
The development of a new criterion Q-sort scale. Developmental Psychology,
33, 906-916.
Shiner, R., & Caspi, A. (2003). Personality differences in childhood and adolescence:
Measurement, development, and consequences. Journal of Child Psychology
and Psychiatry, 44(1), 2-32.
Silk, J., Steinberg, L., & Morris, A. (2003). Adolescents' emotion regulation in daily
fife: Links to depressive symptoms and problem behavior. Child
Development, 74(6), 1869-1880.
Singh, S., Ellis, C., Winton, A., Singh, N., Leung, J., & Oswald, D. (1998).
Recognition of facial expressions of emotion by children with attention-deficit
hyperactivity disorder. Behavior Modification, 22(2), 128-142.
Sonuga-Barke, E., Dalen, L., Daley, D., & Remington, B. (2002). Are planning,
working memory, and inhibition associated with individual differences in
preschool ADHD symptoms?. Developmental Neuropsychology, 21(3), 255-
272.
Souza, I., Pinheiro, M., Denardin, D., Mattos, P., & Rohde, L. (2004). Attention-
Deficit/Hyperactivity Disorder and comorbidity in Brazil: Comparisons
between two referred samples. European Child & Adolescent Psychiatry,
13(4), 243-248.
127
Spreen, O., & Strauss, E. (1998). A compendium of neuropsychological tests:
Administration, norms, and commentary (2nd ed.). New York, NY US:
Oxford University Press.
Stage, F., Carter, H., & Nora, A. (2004). Path Analysis: An Introduction and Analysis
of a Decade of Research. Journal of Educational Research, 98(1), 5-12.
Stolberg, R., Clark, D., & Bongar, B. (2002). Epidemiology, assessment, and
management of suicide in depressed patients. Handbook of depression (pp.
581-601). New York, NY, US: Guilford Press.
Strong, D.R., Lejuez, C.W., Daughters, S., Marinello, M., Kahler, C.W., & Brown,
R.A. (2003). The Computerized Mirror Tracing Task, Version 1. Unpublished
manual.
Stroop, J.R. (1935). Studies of interference in serial verbal reactions. Journal of
Experimental Psychology, 28, 643-662.
Tabachnick, B. G., & Fidell, L. S. (2001). Using Multivariate Statistics (4th ed.).
Needham Heights, MA: Allyn and Bacon.
Tabachnick, B., & Fidell, L. (2007). Using multivariate statistics (5th ed.). Boston,
MA: Allyn & Bacon/Pearson Education.
Thoits, P. (1985). Self-labeling processes in mental illness: The role of emotional
deviance. American Journal of Sociology, 91(2), 221-249.
Thompson, R. (1994). Emotion regulation: A theme in search of definition.
Monographs of the Society for Research in Child Development, 59(2), 25.
128
van Mourik, R., Oosterlaan, J., & Sergeant, J. (2005). The Stroop revisited: A meta-
analysis of interference control in AD/HD. Journal of Child Psychology and
Psychiatry, 46(2), 150-165.
Verstraeten, K., Vasey, M., Raes, F., & Bijttebier, P. (2009). Temperament and risk
for depressive symptoms in adolescence: Mediation by rumination and
moderation by effortful control. Journal of Abnormal Child Psychology: An
official publication of the International Society for Research in Child and
Adolescent Psychopathology, 37(3), 349-361.
Walcott, C., & Landau, S. (2004). The Relation Between Disinhibition and Emotion
Regulation in Boys with Attention Deficit Hyperactivity Disorder. Journal of
Clinical Child and Adolescent Psychology, 33(4), 772-782.
Waller, G., Corstorphine, E., & Mountford, V. (2007). The role of emotional abuse in
the eating disorders: Implications for treatment. Eating Disorders: The
Journal of Treatment & Prevention, 15(4), 317-331.
Watson, D., Clark, L., & Tellegen, A. (1988). Development and validation of brief
measures of positive and negative affect: The PANAS scales. Journal of
Personality and Social Psychology, 54(6), 1063-1070.
Watson, D., Kotov, R., & Gamez, W. (in press). Basic dimensions of temperament in
relation to personality and psychopathology. In R.F. Krueger & J. Tackett
(Eds.), Personality and psychopathology. New York: Guilford Press.
Wechsler, D. (1991). Wechsler Intelligence Scale for Children – Third Edition:
Manual. San Antonio: The Psychological Corporation.
129
Weis, R., & Smenner, L. (2007). Construct validity of the Behavioral Assessment
System for Children (BASC) Self-report of personality. Journal of
Psychoeducational Assessment, 25(2), 111-126.
Weissman, M., Wolk, S., Wickramaratne, P., Goldstein, R., Adams, P., Greenwald,
S., et al. (1999). Children with prepubertal-onset major depressive disorder
and anxiety grown up. Archives of General Psychiatry, 56(9), 794-801.
Weller, E.B., Weller, R.A., & Svadjian, H. (1996). Mood disorders. In: Lewis, M.,
(Ed). Child and Adolescent Psychiatry: A comprehensive textbook. Baltimore:
Williams & Wilkins, pp. 650-5.
Zeman, J., Shipman, K., & Suveg, C. (2002). Anger and sadness regulation:
Predictions to internalizing and externalizing symptoms in children. Journal
of Clinical Child and Adolescent Psychology, 31(3), 393-398.
Related Documents