EMOTION BASED IMAGE MUSICALIZATION Sicheng Zhao † , Hongxun Yao † , Fanglin Wang ‡ , Xiaolei Jiang † , Wei Zhang † † School of Computer Science and Technology, Harbin Institute of Technology, China. ‡ School of Computing, National University of Singapore, Singapore. [email protected], [email protected] ABSTRACT Playing appropriate music when watching images can make the images vivid and bring people into their intrinsic world. In this paper, we propose to musicalize images based on their emotions. Most of previous works on image emotion anal- ysis mainly used elements-of-art based low-level visual fea- tures, which are vulnerable to the arrangements of elements. Here we propose to extract visual features, inspired by the concept of principles-of-art, to recognize image emotions. To enrich the descriptive power, a dimensional perspective is in- troduced to emotion modeling. Experiments on the IAPS dataset demonstrate the superiority of the proposed method in comparison to the state-of-the-art methods for emotion re- gression. The music in MST dataset with approximate emo- tions to the recognized image emotions is selected to musical- ize these images. The user study results show its effectiveness and popularity of the image musicalization method. Index Terms— Emotion recognition, image musicaliza- tion, dimensional model, elements and principles of art 1. INTRODUCTION Nowadays, with the widespread use of digital cameras, every- one becomes an “artist”, capturing every aspect of their life by images to express their emotions and to share with their friends. When demonstrating images, accompanying with ap- propriate music can make pictures vivid and bring people bet- ter feelings. In particular, the musicality of images assists in disrupting the standard ordering of vision as the dominant force of perception in audiovisual forms, giving birth to a spe- cific kind of audio-vision in which music and image mutually remediate each other [1][2]. Many people have frequently merged images into videos attached with related music, using professional softwares, such as Premiere, Ulead Video Stu- dio, and Movie Maker. In this paper, we investigate the problem of automatic im- age musicalization based on emotions. While emotion recog- nition in music is relative mature [3][4][5], emotion analysis in images is still in its infancy. The work is supported by the National Natural Science Foundation of China (No. 61071180) and Key Program (No. 61133003). ,PDJHV 6HOHFWHG VRQJ +HDW 2Q 7KH 6WUHHW 6HOHFWHG VRQJ ,V 7KLV 7KH :RUOG :H &UHDWHG ,PDJHV Fig. 1. The illustration of image musicalization results. The red and blue points in the left denote the VA emotion values of images and music. The yellow and black rectangles denote the sub-regions with emotions of happiness and sadness. The first and third rows in the right are some images in the sub- regions, while the second and fourth rows are the selected music, represented by its bilinear channel time domain wave forms, to musicalize the images. Generally, there are two categories of emotion models: categorical emotion states (CES) and dimensional emotion space (DES). CES models emotions to be a few basic cat- egories [6] [7] [8] [9], such as sadness, fear, happiness, etc. DES employs valence-arousal-dominance emotion s- pace [10], natural-temporal-energetic connotative space [11], or valence-arousal (VA) emotion space [12] [13] to represent emotions. CES in the classification task is easier for users to understand and label, while DES in the regression task is more flexible and richer in descriptive power. Emotion inten- sity level is added to CES to make emotions more descriptive and interpretable in [14]. Similar to [12][13], we adopt VA space to predict emotions aroused in humans from images, where valence represents the positive or negative aspects of emotions, from pleasant to unpleasant, while arousal depicts the intensity of emotions, from excited to peaceful. How to extract features for image emotions is the key problem. Popular features in previous works are elements- of-art based low-level visual features, such as color, texture, lines [7], shape [13], etc. Obviously, these features are not

Welcome message from author
This document is posted to help you gain knowledge. Please leave a comment to let me know what you think about it! Share it to your friends and learn new things together.
Transcript
EMOTION BASED IMAGE MUSICALIZATION
Sicheng Zhao†, Hongxun Yao†, Fanglin Wang‡, Xiaolei Jiang†, Wei Zhang†
†School of Computer Science and Technology, Harbin Institute of Technology, China.‡School of Computing, National University of Singapore, Singapore.
[email protected], [email protected]
ABSTRACTPlaying appropriate music when watching images can make
the images vivid and bring people into their intrinsic world.
In this paper, we propose to musicalize images based on their
emotions. Most of previous works on image emotion anal-
ysis mainly used elements-of-art based low-level visual fea-
tures, which are vulnerable to the arrangements of elements.
Here we propose to extract visual features, inspired by the
concept of principles-of-art, to recognize image emotions. To
enrich the descriptive power, a dimensional perspective is in-
troduced to emotion modeling. Experiments on the IAPS
dataset demonstrate the superiority of the proposed method
in comparison to the state-of-the-art methods for emotion re-
gression. The music in MST dataset with approximate emo-
tions to the recognized image emotions is selected to musical-
ize these images. The user study results show its effectiveness
and popularity of the image musicalization method.
Index Terms— Emotion recognition, image musicaliza-
tion, dimensional model, elements and principles of art
1. INTRODUCTION
Nowadays, with the widespread use of digital cameras, every-
one becomes an “artist”, capturing every aspect of their life
by images to express their emotions and to share with their
friends. When demonstrating images, accompanying with ap-
propriate music can make pictures vivid and bring people bet-
ter feelings. In particular, the musicality of images assists
in disrupting the standard ordering of vision as the dominant
force of perception in audiovisual forms, giving birth to a spe-
cific kind of audio-vision in which music and image mutually
remediate each other [1][2]. Many people have frequently
merged images into videos attached with related music, using
professional softwares, such as Premiere, Ulead Video Stu-
dio, and Movie Maker.
In this paper, we investigate the problem of automatic im-
age musicalization based on emotions. While emotion recog-
nition in music is relative mature [3][4][5], emotion analysis
in images is still in its infancy.
The work is supported by the National Natural Science Foundation of
China (No. 61071180) and Key Program (No. 61133003).
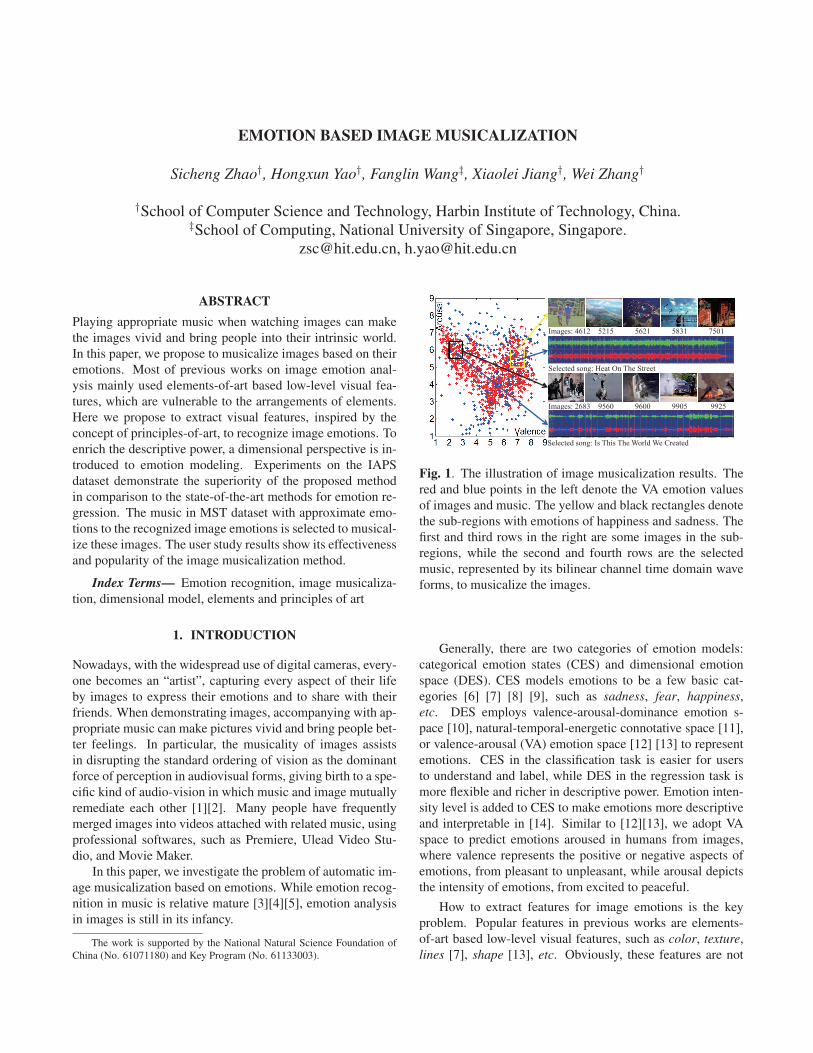
Fig. 1. The illustration of image musicalization results. The
red and blue points in the left denote the VA emotion values
of images and music. The yellow and black rectangles denote
the sub-regions with emotions of happiness and sadness. The
first and third rows in the right are some images in the sub-
regions, while the second and fourth rows are the selected
music, represented by its bilinear channel time domain wave
forms, to musicalize the images.
Generally, there are two categories of emotion models:
categorical emotion states (CES) and dimensional emotion
space (DES). CES models emotions to be a few basic cat-
egories [6] [7] [8] [9], such as sadness, fear, happiness,
etc. DES employs valence-arousal-dominance emotion s-
pace [10], natural-temporal-energetic connotative space [11],
or valence-arousal (VA) emotion space [12] [13] to represent
emotions. CES in the classification task is easier for users
to understand and label, while DES in the regression task is
more flexible and richer in descriptive power. Emotion inten-
sity level is added to CES to make emotions more descriptive
and interpretable in [14]. Similar to [12][13], we adopt VA
space to predict emotions aroused in humans from images,
where valence represents the positive or negative aspects of
emotions, from pleasant to unpleasant, while arousal depicts
the intensity of emotions, from excited to peaceful.
How to extract features for image emotions is the key
problem. Popular features in previous works are elements-
of-art based low-level visual features, such as color, texture,
lines [7], shape [13], etc. Obviously, these features are not

Image MusicalizationPrinciples-of-art Emotion FeaturesSymmetry Emphasis Movement
Harmony Variety Gradation
nput
Im
ages
Imag
e E
mot
ions
Feature Extraction
Comparison and Matching
In
Music Set Music Emotions
I
Fig. 2. The framework of our proposed method. Our main
works are image emotion features based on principles of art
and image musicalization, lying in the blue solid rectangles.
invariant to their different arrangements. Therefore, elements
must be carefully arranged and orchestrated into meaningful
regions and images to describe specific semantics and emo-
tions. The rules, tools or guidelines of arranging and orches-
trating the elements of art in an artwork are known as the prin-
ciples of art, which consider various artistic aspects including
balance, emphasis, harmony, variety, gradation, movement,rhythm, and proportion [15][16].
Inspired by this observation, we propose to formulate and
implement the principles-of-art systematically, based on relat-
ed art theory and computer vision research, and combine them
together to construct our image emotion features. Then, the
recognized music emotions are compared and matched with
the emotions of images to select the music with approximate
emotions for the musicalization task. The framework of our
method is shown in Fig. 2.
2. PRINCIPLES-OF-ART BASED FEATURES
In this section, we first introduce the concepts and meanings
of principles-of-art, under the art theory in [15][16], and then
represent six of them by mathematical methods.
2.1. The theory of principles of art
Balance refers to the feeling of equilibrium or stability of
an art work, including symmetrical, asymmetrical and radial
ones. Emphasis, also known as contrast, is used to stress the
difference of certain elements, which can be accomplished by
using sudden and abrupt changes in elements. Harmony refers
to a way of combining similar elements (such as shapes, col-or, etc.) in an artwork to accent their similarities, which could
be accomplished by using repetition and gradual changes. Va-
riety is used to create complicated relationships by combining
different elements. A picture made up of many different hues,
lines, textures, and shapes would be described as a complex
picture, which increases visual interests. However, harmo-
ny and variety are not opposites. A careful blend of them
is essential to the success of an art work. Gradation refer-
s to combine elements by using a series of gradual changes.
Fig. 3. Symmetry detection of gray scale images using
method in [17]. The first row shows images in bilateral sym-
metry with symmetry axis and symmetrical feature points.
The second row shows images in rotational symmetry with
symmetry center and symmetrical feature points.
Movement is used to create the feeling of action, which is
achieved through placement of elements to make eyes follow
a certain path. Rhythm is a principle that is closely related to
movement. Proportion is used to describe the relationship of
certain elements to the whole and to each other. [15][16]
2.2. Representation of artistic principles
To effectively extract emotion features, we formulate the first
six principles, without considering rhythm and proportion, as
they are ambiguously defined.
2.2.1. Balance
Since the asymmetrical balance is difficult to measure and it
can be seen as the reverse measurement of symmetry, in this
paper we only consider symmetry, including bilateral symme-
try, rotational symmetry [17] and radial symmetry [18] [19].
To detect bilateral symmetry and rotational symmetry, we
use the symmetry detection method in [17], which is based on
matching symmetrical pairs of feature points, represented by
a point vector describing its location in x, y coordinates, its
orientation and (optionally) scale. We compute the symmetry
number, radius, angle and strength of the maximum symme-
try for bilateral symmetry, the symmetry number, center and
strength of the maximum symmetry for rotational symmetry,
as shown in Fig. 3. Based on the symmetry detection method
in [18], we compute the distribution of symmetry map after
radial symmetry transformation for radial symmetry.
2.2.2. Emphasis
We adopt Itten color contrasts [20] and the rate of focused
attention (RFA) in [21] to measure the principle of emphasis.
Itten defined strategies for successful color combination-
s [20]. Seven methodologies were devised to coordinate col-
ors using the hue’s contrasting properties, including contrast
of saturation, contrast of light and dark, contrast of extension,
contrast of complements, contrast of hue, contrast of warm
and cold and simultaneous contrast. We calculate six color

Fig. 4. Images of different texture gradations, but with similar
content meanings and emotions.
contrast by the mathematical expressions in [7] and represent
the contrast of extension as the standard deviation of the pixel
amount of the 11 basic colors as in 2.2.4.
RFA is defined as the attention focus on some prede-
fined aesthetic templates or statistical distributions according
to image’s saliency map. Here we adopt Sun’s response map
method [22] to estimate the saliency. Besides the statistic
subject mask coincidence with Rule of the third composition
method, defined in [7], we use another two diagonal aesthetic
templates [23]. A 3 dimensional RFA vector is obtained,
RFA(i) =
∑Widx=1
∑Heiy=1 Saliency(x, y)Maski(x, y)
∑Widx=1
∑Heiy=1 Saliency(x, y)
, (1)
where Wid and Hei denote the width and height of image I ,
Saliency(x, y) and Maski(x, y) are the saliency value and
mask value at pixel (x, y), respectively.
2.2.3. Harmony
Inspired by Kass’ idea of smoothed filters for local his-
togram [24], we compute the harmony intensity of each
pixel on its hue and gradient direction in a neighborhood.
We divide the circular hue or gradient direction equally in-
to eight parts, which are separated into two adjacent groups
c = {i1, i2, . . . , ik|0 ≤ ij ≤ 7, j = 1, 2, . . . , k} and I \ c,where ik+1 ≡ ik+1(mod8), I = {0, 1, . . . , 7}. The harmony
intensity at pixel p(x, y) is defined as
H(x, y) = minc
e−|hm(c)−hm(I\c)||im(c)− im(I \ c)|, (2)
where hm(c) = maxi∈c
hi(c), im(c) = argmaxi∈c
hi(c), hi(c)
is the hue or gradient direction in groups c. The harmony
intensity of the whole image is the sum of all pixels.
2.2.4. Variety
Each color has a special meaning and is used in certain ways
by artists. We count how many basic color kinds (black, blue,
brown, green, gray, orange, pink, purple, red, white, and yel-low) are present and the pixel amount of each color using the
algorithm proposed by Weijer et al. [25].
Fig. 5. (a) Eye scan path, (b) saliency map estimated by [22].
Gradient depicts the changes of values and directions of
pixels in an image. We calculate the distribution of gradient
statistically. For directions, we count the number of pixels in
the eight regions equally divided of the circle. For lengths, we
divide the relative maximum length (RML) into equally eight
parts, by computing RML as RML = μ + 5σ, where μ and
σ are the mean and standard deviation of the gradient matrix,
respectively.
2.2.5. Gradation
We adopt pixel-wise windowed total variation (WTV) and
windowed inherent variation (WIA) proposed by Xu et al. [26]
and their combination to measure gradation for each pixel.
While WTV incorporates modules, WIA captures the overall
spatial variation. It has been proved that in the relative to-
tal variation (RTV) opposite gradients in a window cancel out
each other (Fig. 4). We compute the sum of RTV, WTV and
WIA to measure the relative gradation and absolute gradation
of an image as follows:
RG =∑
pRTV (p) =
∑p
(Dx(p)
Lx(p) + ε+
Dy(p)
Ly(p) + ε
), (3)
AGTx =∑
pDx(p), AGTy =
∑pDy(p), (4)
AGIx =∑
pLx(p), AGIy =
∑pLy(p), (5)
where Dx(p), Dy(p), Lx(p) and Ly(p) are the WTA and WIAfor pixel p(x, y) in the x and y directions, respectively.
2.2.6. Movement
Based on super Gaussian component analysis, Sun et al. [22]
obtained a response map by filtering the original image and
adopted the winner-takes-all principle to select and locate the
simulated fixation point and estimate a saliency map. We cal-
culate the distribution of eye scan path (Fig. 5), which is ob-
tained using Sun’s method with a fixed initial projection vec-
tor, to measure the principle of movement.
Finally, we combine the representation of the six princi-
ples into one feature vector consistently. The dimensions of
each principle are 60, 16, 2, 60, 9, and 16, respectively.

3. IMAGE MUSICALIZATION
While each image is a single frame, music is a continuous
sequence. How to compare the emotions of one point in VA
space with a sequence and how to musicalize images from
a sequence to a frame are the key problems. As our image
musicalizatioin is an application for entertainment purpose,
here we simply assign one pairwise VA values to represent
the global emotion of each music sequence.
3.1. Music emotion prediction
We use the regression strategy in [4] and feature extraction
method in [5] to predict the emotions in music. The fea-
tures include Mel-frequency cepstral coefficients (MFCCs),
Octave-based spectral contrast, Statistical spectrum descrip-
tors, EchoNest, and Chromagram with the dimensions of 20,
14, 4, 40 and 12, respectively. Support vector regression
(SVR) is adopted as the regressor for direct estimation of the
VA values in music.
3.2. The algorithm of image musicalization
As the emotions of the given images are disordered, we adopt
the “Locally consistent, globally choppy” principle to readjust
the showing order of the images. That is, first we specify the
first image or randomly select one to be shown, then the mu-
sic with emotions most approximate with the image emotions
is selected to play. As music is sequential, to keep coherence,
we choose the images with emotions most approximate with
the showing image to be shown until the music is over or the
emotion similarity is greater than the threshold or users stop
the process. Next we select one unshown image randomly
to be shown, and so circulates until the unshown image set
is empty or users stop the musicalization algorithm. The de-
tails are given in Algorithm 1, in which T , NI , NM , and
ML1×NM represent the time interval between two adjacent
images when shown, the count of images and music, music
length, NearestM(e), NearestI(e) are the models to find
the unplayed music and images with approximate emotion e.
Usually the reciprocal of Euclidean distance between two e-
motions is enough for similarity measure.
4. EXPERIMENTS
To validate the effectiveness of our proposed method, we car-
ry out two experiments, predicting the VA emotion scores on
the IAPS dataset [27] and musicalizing images using music
in the MST dataset [5].
4.1. Predicting VA emotion scores
The International Affective Picture System (IAPS) [27] is a
standard emotion evoking image set in psychology. It con-
sists of 1,182 documentary-style natural color images de-
Algorithm 1: Emotion based image musicalization
Input: The image set IS, the music set MSOutput: Playing list of the musicalized images
1 Initialization: Image count IC = 1; Image being played
PI = 1; Play time PT = 0; Image count NI = #(IS);2 Recognize emotions of IS and MS, with results denoted by
EIS and EMS;
3 while IC �= NI do4 Show PI;
5 PM = NearestM(EIS(PI));6 Play PM ; PT = T ;
7 while PT < ML(PM) and IC �= NI do8 if PI ′ = NearestI(EIS(PI)) is not Null then9 Show PI ′; PT+ = T ; IC ++;
10 else11 break;
12 end13 end14 Randomly assign an unshown image to PI;
15 end
Table 1. MSE for VA dimensions in IAPS dataset.Machajdik[7] Principles Combination
Valence 1.49 1.31 1.27
Arousal 1.06 0.85 0.82
picting complex scenes, such as portraits, babies, animals,
landscapes, pollution, etc. Each image is associated with an
empirically derived mean and standard deviation of valence,
arousal and dominance ratings, in the range of (1, 9).
We use SVR with RBF kernel to model the VA dimen-
sions on the IAPS dataset, and compute the mean squared er-
ror (MSE) of each dimension as the evaluation measurement.
The lower the MSE is, the better the regression is. We com-
pare our method with Machajdik’s features [7] and the com-
bination, using 5-cross validation. From Table 1, we can see
that (1) both valence and arousal are more accurately mod-
eled by our principles-of-art features than Machajdik’s fea-
tures; (2) both our principles-of-art features and Machajdik
features predict arousal better. However, there is little im-
provement (3.05% and 3.53% decrease of MSE for valence
and arousal) by combining them together, indicating that the
principle features provide a strong enough ability in under-
standing image emotions. Some regression results are given
in Fig. 6, demonstrating the effectiveness of our image emo-
tion prediction method.
We also do the VA emotion regression task using each
of the six principles. From the MSE results in Table 2, we
find that variety, emphasis, gradation and balance have high-
er correlations with valence, while emphasis, variety, harmo-ny and movement are more correlated with arousal.

Fig. 6. Emotion prediction results of our method. The black
plus signs and blue circles represent the ground truth and our
predicted values of image emotions, respectively.
4.2. Musicalizing images
Music dataset and preprocessing. The MoodSwings Turk
(MST) dataset [5] is an emotion evoking music set, which
contains 240 15-second song clips of different genres. Per-
second VA emotions are labeled for each clip by 7 to 23 part-
ners. Besides the VA values, the dataset also provides the
name of the song, the name of the artist, the name of the al-
bum, the user ID, the time (in seconds) in the song and the
acoustic features of each song.
We map the range of valence and arousal from (-160, 160)
to (1, 9) for comparison, and compute the average valence and
arousal of the 15 seconds for each clip. As most of the 15-
second clips are the chorus parts that represent the songs and
express a certain dominant emotion, we regard the prediction
emotion of each clip as the emotion of the entire song. The
MSE for Valence dimension is 1.28 and for Arousal is 2.10.
For better comparison, we project the predicted emotions
from DES to CES, based on their relationship in [28]. Totally
we get 15, 4, 5, 15, 6, 10, 8 and 14 musicalization pairs for
the discrete emotion of amusement (Amu), anger (Ang), awe,
contentment (Con), disgust (Dis), excitement (Exi), fear (Fea)
and sadness (Sad), respectively.
Comparison methods and measurement. As we konw,
this is the first work for image musicalization. We compare
our method with two baseline methods: (a) we played ran-
dom music when showing emotional images; (b) we invited
one graduate to select music for emotional images, based on
music tones , without any information about music content.
Because the evaluation of emotion based image musical-
ization is rather subjective, and there are no ground truths,
we use user study to evaluate the effectiveness. We invited
100 participants in our user study. They were mostly under-
graduates or graduates between the ages of 20 and 30, 40 fe-
males and 60 males, without particular experience of image
and music emotions. We asked the users to select which mu-
Amu Ang Awe Con Dis Exi Fea Sad0.0
0.1
0.2
0.3
0.4
0.5
0.6
Ave
rage
per
cent
age
per c
lass Random Ours Human
Fig. 7. User study results.
Table 2. MSE of each principle for VA dimensions in IAPS.Ban Emp Har Var Gra Mov
Valence 1.85 1.72 2.16 1.67 1.78 2.37
Arousal 1.52 0.98 1.12 1.07 1.61 1.15
sicalization results they consider is the best: Random, Human
or Ours? No information of different methods was provided.
For each method, we compute the average percentage
(AP ) of being selected of each emotion by
AP (j) =1
Np ·Nj
∑k∈Pj
Njk (6)
where j, Njk, Nj , Np and Pj represent the jth discrete emo-
tion, the number of users selecting the kth pair of emotion j,
the number of musicalizatin pairs of emotion j, the total num-
ber of users and the set of musicalization pairs of emotion j.
Here Np = 100.
User study results. A summary of user study results is
presented in Fig. 7. Several conclusions can be drawn from
the comparison. First, our method outperforms the other two
methods on average, because we consider the average emo-
tion prediction. Second, the music selected by our method is
much better than the randomly selected ones for image mu-
sicalization task. Third, our method is better than Human in
5 out of 8 emotions. As emotions are rather subjective, our
method performs better for those images with strong emo-
tions and Human can pick up the images with emotions not
that strong. The comparison results show the effectiveness
and popularity of our methods.
Examples of musicalization results. The overall illus-
tration of the musicalization results of our proposed method
is shown in Fig. 1. Some detailed examples of the results are
listed in Fig. 8. Intuitively, the images and selected music (at
least in the rhythm level) have similar emotions, demonstrat-
ing that the proposed method can be used for automatic image
musicalization task.

Fig. 8. Examples of image musicalization of our method. Below the images are the selected songs, together with the artists.
5. CONCLUSION
In this paper, we draw inspirations from principles-of-art to
extract features for image emotion analysis. Experimental re-
sults show its superior performance over the state-of-the-art
approaches in the emotion regression task. Music with ap-
proximate emotions are then selected to musicalize the im-
ages. Evaluations demonstrate the effectiveness of the pro-
posed image musicalization method. In the future, we will
continue our efforts to quantize the principles using more ef-
fective measurements, improve the efficiency for real time im-
plementation and model the music emotions sequentially.
6. REFERENCES
[1] M. B. Korsgaard, “Creation and erasure: music video as a signaletic
form of practice,” Journal of Aesthetics & Culture, vol. 4, 2012.
[2] M. Chion and W. Murch, Audio-vision, Columbia University Press,
1994.
[3] Y. Yang and H. H Chen, “Machine recognition of music emotion: A
review,” ACM TIST, vol. 3, no. 3, 2012.
[4] Y. Yang, Y. Lin, Y. Su, and H. H Chen, “A regression approach to music
emotion recognition,” IEEE TASLP, vol. 16, no. 2, pp. 448–457, 2008.
[5] E. M Schmidt and Y. E Kim, “Modeling musical emotion dynamics
with conditional random fields,” in ISMIR, 2011, pp. 777–782.
[6] S. Zhao, H. Yao, and X. Sun, “Video classification and recommenda-
tion based on affective analysis of viewers,” Neurocomputing, vol. 119,
pp. 101–110, 2013.
[7] J. Machajdik and A. Hanbury, “Affective image classification using
features inspired by psychology and art theory,” in ACM Multimedia,
2010, pp. 83–92.
[8] S. Zhao, H. Yao, X. Sun, P. Xu, X. Liu, and R. Ji, “Video indexing
and recommendation based on affective analysis of viewers,” in ACMMultimedia, 2011, pp. 1473–1476.
[9] S. Zhao, H. Yao, and X. Sun, “Affective video classification based on
spatio-temporal feature fusion,” in ICIG, 2011, pp. 795–800.
[10] H. Schlosberg, “Three dimensions of emotion,” Psychological review,
vol. 61, no. 2, 1954.
[11] S. Benini, L. Canini, and R. Leonardi, “A connotative space for sup-
porting movie affective recommendation,” IEEE TMM, vol. 13, no. 6,
pp. 1356–1370, 2011.
[12] S. Zhang, Q. Tian, Q. Huang, W. Gao, and S. Li, “Utilizing affective
analysis for efficient movie browsing,” in ICIP, 2009, pp. 1853–1856.
[13] X. Lu, P. Suryanarayan, R. B Adams Jr, J. Li, M. G Newman, and
J. Z Wang, “On shape and the computability of emotions,” in ACMMultimedia, 2012, pp. 229–238.
[14] S. Zhao, H. Yao, X. Sun, X. Jiang, and P. Xu, “Flexible presentation of
videos based on affective content analysis,” in Advances in MultimediaModeling, 2013, pp. 368–379.
[15] R. G. Collingwood, The principles of art, vol. 11, Oxford University
Press, USA, 1958.
[16] J. A Hobbs, R. A Salome, and K. Vieth, The visual experience, Davis
Publications, 1995.
[17] G. Loy and J. Eklundh, “Detecting symmetry and symmetric constel-
lations of features,” in ECCV, 2006, pp. 508–521.
[18] G. Loy and A. Zelinsky, “Fast radial symmetry for detecting points of
interest,” IEEE TPAMI, vol. 25, no. 8, pp. 959–973, 2003.
[19] J. Ni, M. K. Singh, and C. Bahlmann, “Fast radial symmetry detection
under affine transformations,” in CVPR, 2012, pp. 932–939.
[20] J. Itten and E. V. Haagen, The art of color: the subjective experienceand objective rationale of color, Van Nostrand Reinhold New York,
NY, USA, 1973.
[21] X. Sun, H. Yao, R. Ji, and S. Liu, “Photo assessment based on computa-
tional visual attention model,” in ACM Multimedia, 2009, pp. 541–544.
[22] X. Sun, H. Yao, and R. Ji, “What are we looking for: Towards statistical
modeling of saccadic eye movements and visual saliency,” in CVPR,
2012, pp. 1552–1559.
[23] L. Liu, R. Chen, L. Wolf, and D. Cohen-Or, “Optimizing photo com-
position,” in Computer Graphics Forum, 2010, vol. 29, pp. 469–478.
[24] M. Kass and J. Solomon, “Smoothed local histogram filters,” ACMTOG, vol. 29, no. 4, pp. 100, 2010.
[25] J. V. D. Weijer, C. Schmid, and J. Verbeek, “Learning color names from
real-world images,” in CVPR, 2007, pp. 1–8.
[26] L. Xu, Q. Yan, Y. Xia, and J. Jia, “Structure extraction from texture via
relative total variation,” ACM TOG, vol. 31, no. 6, pp. 139, 2012.
[27] Peter J Lang et al., International affective picture system (IAPS): Af-fective ratings of pictures and instruction manual, NIMH, Center for
the Study of Emotion & Attention, 2005.
[28] H. L. Wang and L. Cheong, “Affective understanding in film,” IEEETCSVT, vol. 16, no. 6, pp. 689–704, 2006.
Related Documents