Sterilization of sterile tanks Emma Wärlinge Department of Chemical Engineering,, Lund University, P. O. Box 124, SE-221 00 Lund, Sweden March 2 007 Abstract In the product portfolio of Tetra Pak, Tetra Alsafe is a system, including a buffer tank and auxiliary equipment for supply and removal of steam and air, respectively, used in aseptic applications. The pre-sterilization of the tank is conducted with steam. In the first part of the sterilization sequence air is removed in cycles of feeding steam into the tank and then draining a part of the air/steam mixture together with condensate. This study focuses on this process and uses measurements of temperature, pressure and mass of condensate to develop a model that calculates the velocities of the steam, condensation rate and the efficiency of the air evacuation. The results show that the velocities in the valves vary between 100 and 400 m/s both when steam enters and exits the tank. Calculations based on the flow gives that 9 kg out of the 14 kg fed to the tank are still in the tank at the end of the air-removal cycle. All condensate that is formed will exit the tank in the two final draining periods. It is proposed that they are prolonged with ten seconds to drain more condensate and air Introduction In the product portfolio of Tetra Pak, Tetra Alsafe is an intermediate storage tank that is placed in dairies to buffer fluid flow, see Fel! Hittar inte referenskälla. . The tank is of aseptic design and needs to be cleaned and sterilized before the product enters the tank. The sterilization is conducted with steam that condenses and heats the tank. When a standardized temperature is obtained and withheld for a certain duration of time, a sufficient level of microorganism reduction is obtained. 1 The first target of the sterilization process is to remove air from the tank that could restrict the sterilization. This study will look at this process to gain knowledge about the steam velocities in the different parts of the system, condensation rate and air evacuation efficiency. Measurements of pressure, temperature and discharged condensate are the basis for calculating velocities, condensation rate and air evacuation to be able to optimize the sterilization. Figure 1 Tetra Alsafe LA 2 Background Steam is an efficient medium for sterilization which is widely used in the food processing and health care sectors. When steam condenses at a surface latent heat is released and transferred to the material. The presence of air has a big impact on the sterilization and results in an insufficient temperature increase since a given pressure implies a higher temperature than what really is obtained. 3 Air can also be entrapped in corners which prevent the steam to reach all surfaces. If no condensation occurs on the surface it will not be h eated satisfactorily. 4 In the system studied here, the steam is introduced as a high velocity flow that mixes with the air in the system. The flow then continues to valves or steam traps that will drain the steam, air and condensate. 3 Sterilizing Tetra Alsafe is performend in three cycles of feeding steam into the tank and then part of the mix will be drained. After this the tank will be heated by the steam to a target temperature of 125 o C and kept above this for 30 min. Flow of compressible fluids Calculations on flow of a compressible fluid, such as steam, are more complicated than those on a non- compressible fluid because the variation of density because of changes in temperature and pressure has to be taken into account. 5 For a flow through an orifice, or a section of smaller diameter, with the variables stated in Figure 2, an expression for the flow and velocity through a

Welcome message from author
This document is posted to help you gain knowledge. Please leave a comment to let me know what you think about it! Share it to your friends and learn new things together.
Transcript

8/22/2019 Emma Warlinge - Sterilization of Sterile Tanks
http://slidepdf.com/reader/full/emma-warlinge-sterilization-of-sterile-tanks 1/6
Sterilization of sterile tanks
Emma Wärlinge
Department of Chemical Engineering,, Lund University, P. O. Box 124, SE-221 00 Lund, Sweden
March 2007
Abstract
In the product portfolio of Tetra Pak, Tetra Alsafe is a system, including a buffer tank
and auxiliary equipment for supply and removal of steam and air, respectively, used in
aseptic applications. The pre-sterilization of the tank is conducted with steam. In the
first part of the sterilization sequence air is removed in cycles of feeding steam into the
tank and then draining a part of the air/steam mixture together with condensate. This
study focuses on this process and uses measurements of temperature, pressure and mass
of condensate to develop a model that calculates the velocities of the steam,
condensation rate and the efficiency of the air evacuation. The results show that the
velocities in the valves vary between 100 and 400 m/s both when steam enters and exits
the tank. Calculations based on the flow gives that 9 kg out of the 14 kg fed to the tank
are still in the tank at the end of the air-removal cycle. All condensate that is formed
will exit the tank in the two final draining periods. It is proposed that they are prolonged
with ten seconds to drain more condensate and air
Introduction
In the product portfolio of Tetra Pak, Tetra Alsafe isan intermediate storage tank that is placed in dairies
to buffer fluid flow, see Fel! Hittar inte
referenskälla.. The tank is of aseptic design and
needs to be cleaned and sterilized before the productenters the tank. The sterilization is conducted withsteam that condenses and heats the tank. When astandardized temperature is obtained and withheld
for a certain duration of time, a sufficient level of microorganism reduction is obtained.
1
The first target of the sterilization process is toremove air from the tank that could restrict the
sterilization. This study will look at this process togain knowledge about the steam velocities in thedifferent parts of the system, condensation rate and air evacuation efficiency. Measurements of pressure,temperature and discharged condensate are the basisfor calculating velocities, condensation rate and air
evacuation to be able to optimize the sterilization.
Figure 1 Tetra Alsafe LA2
Background
Steam is an efficient medium for sterilization whichis widely used in the food processing and health care
sectors. When steam condenses at a surface latentheat is released and transferred to the material. The
presence of air has a big impact on the sterilizationand results in an insufficient temperature increasesince a given pressure implies a higher temperaturethan what really is obtained.3 Air can also be
entrapped in corners which prevent the steam toreach all surfaces. If no condensation occurs on thesurface it will not be heated satisfactorily.
4
In the system studied here, the steam is
introduced as a high velocity flow that mixes withthe air in the system. The flow then continues tovalves or steam traps that will drain the steam, air and condensate.3 Sterilizing Tetra Alsafe is performend in three cycles of feeding steam into thetank and then part of the mix will be drained. After
this the tank will be heated by the steam to a targettemperature of 125
oC and kept above this for 30
min.
Flow of compressible fluids
Calculations on flow of a compressible fluid, such assteam, are more complicated than those on a non-compressible fluid because the variation of density because of changes in temperature and pressure has
to be taken into account.5
For a flow through an orifice, or a section of
smaller diameter, with the variables stated in Figure2, an expression for the flow and velocity through a
8/22/2019 Emma Warlinge - Sterilization of Sterile Tanks
http://slidepdf.com/reader/full/emma-warlinge-sterilization-of-sterile-tanks 2/6
cross section of the orifice can be derived from thegeneral energy equation.
Figure 2 Tank, orifice and variables
For a non-isothermal flow the relation between
pressure and volume (ν) can be expressed as
constant where k depends on the heat
transfer between fluid and the surroundings and ν isthe specific volume. If the flow can be described as
reversible, k can be approximated to be equal to γ which is the ratio of the specific heats of the gasaccording to Equation 1.
=⋅ k P ν
v
p
C
C k ≡≈ γ
Eq. 1
The discharge velocity is described by Equation 2and the mass rate of flow by Equation 3 for isentropic conditions. CD is a correction factor for friction and A0 is the area of the smallest passage in
the orifice.5
( )
⎥⎥⎦
⎤
⎢⎢⎣
⎡
⎟⎟ ⎠
⎞
⎜⎜⎝
⎛
−−=
− γ γ
ν γ
γ 1
1
2
11 11
2
P
P
Pu
Eq. 2
( )
⎥⎥⎦
⎤
⎢⎢⎣
⎡⎟⎟ ⎠
⎞⎜⎜⎝
⎛ −
−⎟⎟ ⎠
⎞⎜⎜⎝
⎛ =
− γ γ γ
ν γ
γ
ν
1
1
211
1
1
2
1
0 11
2
P
PP
P
P AC Q D Eq. 3
Material & Method
The volume of the tank used in the measurements is12 m3. In the first step of the sterilization sequencethe steam and product inlet pipers are drained from
old condensate with steam. Then the air removalcycles begin. In P1, P2 and P3 (see Table 1) 2.7
barg steam enters the tank through the valve placed in the middle of the tank in Figure 3. This valvesplits the flow into the side of the tank and throughthe CIP pipes that lead to the top of the tank. The
flow will continue until the tank has reached thetarget value in Table 1.
Table 1 Explanation to the abbreviations and target
values
Abbreviation Explanation Target value
P1 Pressurise 1 1 barg
D1 Drain 1 60 s
P2 Pressurise 2 1.8 barg
D2 Drain 2 20 s
P3 Pressurise 3 2 bargD3 Drain 3 10s
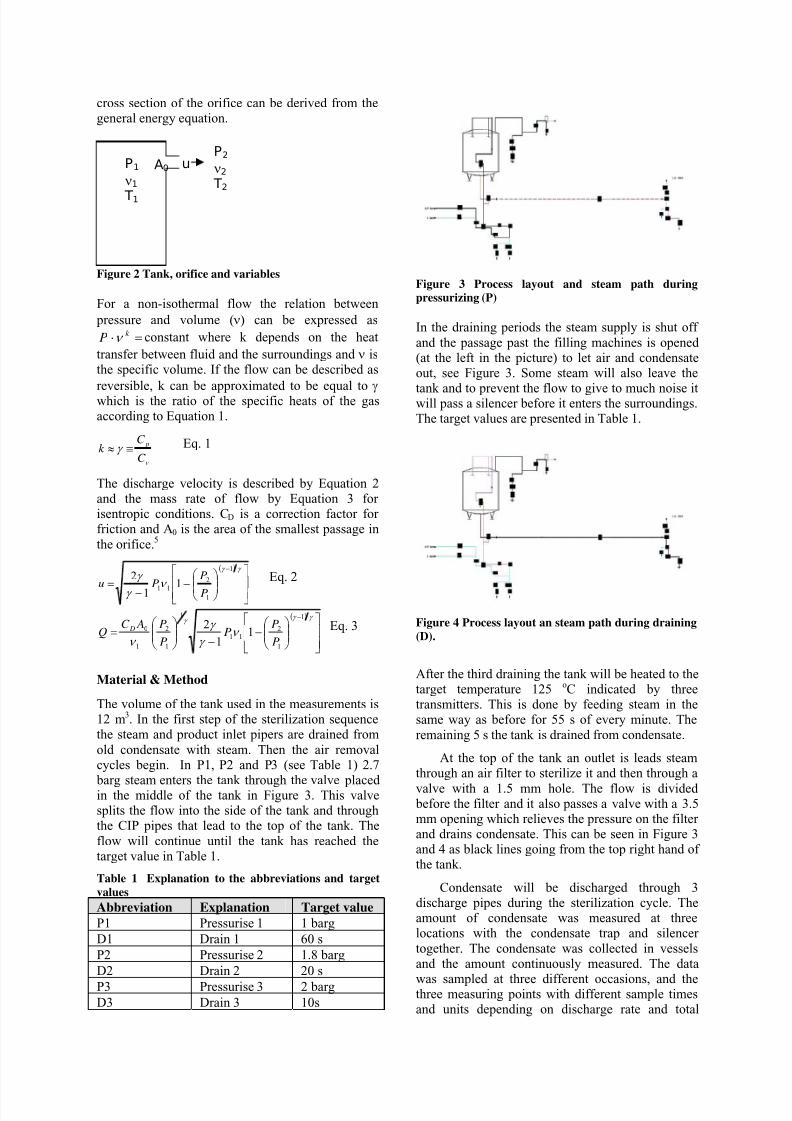
Figure 3 Process layout and steam path during
pressurizing (P)
In the draining periods the steam supply is shut off
and the passage past the filling machines is opened (at the left in the picture) to let air and condensateout, see Figure 3. Some steam will also leave the
tank and to prevent the flow to give to much noise itwill pass a silencer before it enters the surroundings.The target values are presented in Table 1.
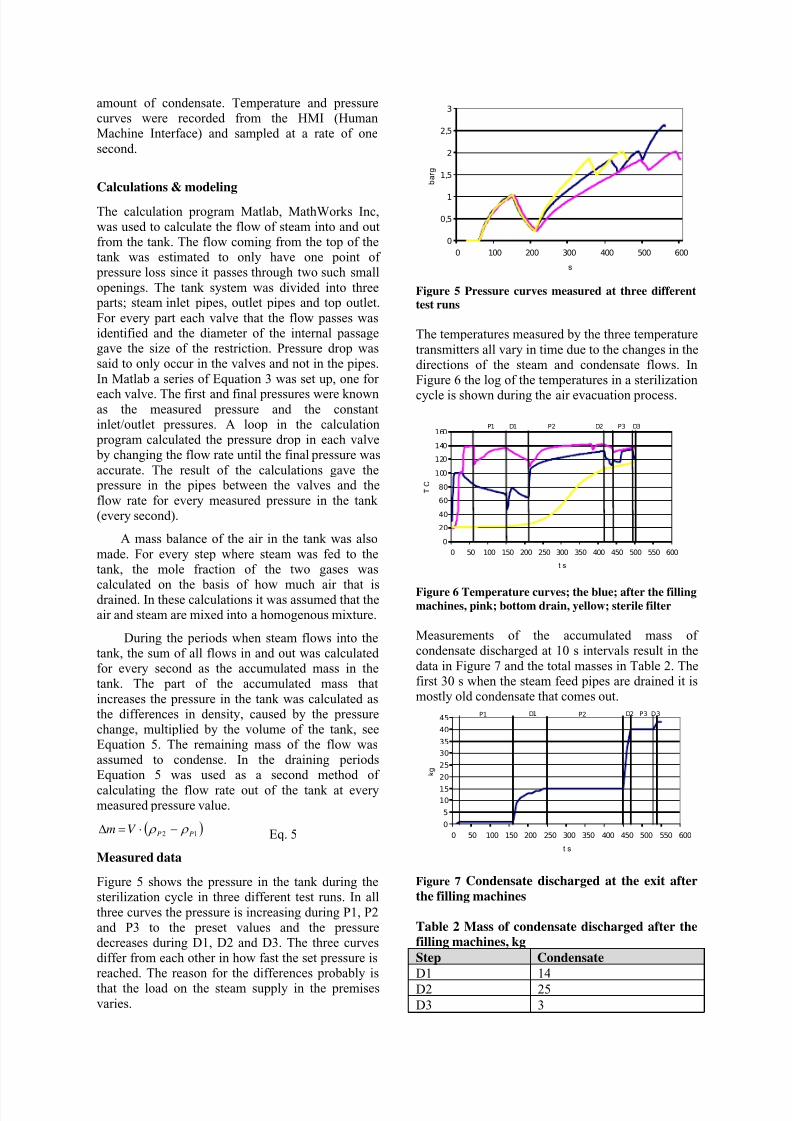
Figure 4 Process layout an steam path during draining
(D).
After the third draining the tank will be heated to thetarget temperature 125 oC indicated by threetransmitters. This is done by feeding steam in thesame way as before for 55 s of every minute. The
remaining 5 s the tank is drained from condensate.
At the top of the tank an outlet is leads steamthrough an air filter to sterilize it and then through a
valve with a 1.5 mm hole. The flow is divided before the filter and it also passes a valve with a 3.5mm opening which relieves the pressure on the filter and drains condensate. This can be seen in Figure 3and 4 as black lines going from the top right hand of the tank.
Condensate will be discharged through 3discharge pipes during the sterilization cycle. Theamount of condensate was measured at threelocations with the condensate trap and silencer
together. The condensate was collected in vesselsand the amount continuously measured. The data
was sampled at three different occasions, and thethree measuring points with different sample timesand units depending on discharge rate and total
P2
ν2 T2
P1
ν1 T1
A0 u
8/22/2019 Emma Warlinge - Sterilization of Sterile Tanks
http://slidepdf.com/reader/full/emma-warlinge-sterilization-of-sterile-tanks 3/6
amount of condensate. Temperature and pressurecurves were recorded from the HMI (HumanMachine Interface) and sampled at a rate of one
second.
Calculations & modeling
The calculation program Matlab, MathWorks Inc,was used to calculate the flow of steam into and outfrom the tank. The flow coming from the top of thetank was estimated to only have one point of pressure loss since it passes through two such small
openings. The tank system was divided into three parts; steam inlet pipes, outlet pipes and top outlet.
For every part each valve that the flow passes wasidentified and the diameter of the internal passagegave the size of the restriction. Pressure drop wassaid to only occur in the valves and not in the pipes.
In Matlab a series of Equation 3 was set up, one for
each valve. The first and final pressures were knownas the measured pressure and the constantinlet/outlet pressures. A loop in the calculation program calculated the pressure drop in each valve by changing the flow rate until the final pressure was
accurate. The result of the calculations gave the pressure in the pipes between the valves and the
flow rate for every measured pressure in the tank (every second).
A mass balance of the air in the tank was also
made. For every step where steam was fed to thetank, the mole fraction of the two gases was
calculated on the basis of how much air that isdrained. In these calculations it was assumed that theair and steam are mixed into a homogenous mixture.
During the periods when steam flows into thetank, the sum of all flows in and out was calculated for every second as the accumulated mass in thetank. The part of the accumulated mass that
increases the pressure in the tank was calculated asthe differences in density, caused by the pressurechange, multiplied by the volume of the tank, seeEquation 5. The remaining mass of the flow wasassumed to condense. In the draining periodsEquation 5 was used as a second method of
calculating the flow rate out of the tank at everymeasured pressure value.
( 12 PPV m ) ρ ρ −⋅=∆ Eq. 5
Measured data
Figure 5 shows the pressure in the tank during thesterilization cycle in three different test runs. In all
three curves the pressure is increasing during P1, P2and P3 to the preset values and the pressuredecreases during D1, D2 and D3. The three curvesdiffer from each other in how fast the set pressure isreached. The reason for the differences probably isthat the load on the steam supply in the premises
varies.
0
0,5
1
1,5
2
2,5
3
0 100 200 300 400 500 600
s
b a r g
Figure 5 Pressure curves measured at three different
test runs
The temperatures measured by the three temperature
transmitters all vary in time due to the changes in thedirections of the steam and condensate flows. InFigure 6 the log of the temperatures in a sterilization
cycle is shown during the air evacuation process.
0
20
40
60
80
100
120
140
160
0 50 100 150 200 250 300 350 400 450 500 550 600
t s
T C
P1 D2P2D1 D3P3
Figure 6 Temperature curves; the blue; after the fillingmachines, pink; bottom drain, yellow; sterile filter
Measurements of the accumulated mass of condensate discharged at 10 s intervals result in the
data in Figure 7 and the total masses in Table 2. Thefirst 30 s when the steam feed pipes are drained it ismostly old condensate that comes out.
0
5
10
15
20
25
30
35
40
45
0 50 100 150 200 250 300 350 400 450 500 550 600
t s
k g
P1 D1 P2 D2 P3 D3
Figure 7 Condensate discharged at the exit after
the filling machines
Table 2 Mass of condensate discharged after the
filling machines, kg
Step Condensate
D1 14
D2 25
D3 3

8/22/2019 Emma Warlinge - Sterilization of Sterile Tanks
http://slidepdf.com/reader/full/emma-warlinge-sterilization-of-sterile-tanks 4/6
Condensate in the pipes at the top of the tank will beable to exit the tank through a silencer and steamtrap at the top of the tank at all times. Measurements
show that it will take until P2 before condensate willde discharged here, see Figure 8 The total mass of condensate is presented in Table 4.
0
50
100
150
200
250
300
0 100 200 300 400 500 600
t s
g
P2 P3D2 D3
Figure 8 Condensate discharged from the top of the
tank, pink; steam trap, blue; silencer
Table 3 Mass of condensate discharged at the top, g
Exit Condensate
Steam trap 70 g
Silencer 265 g
Steam inlet analysis
This is the part of the piping system that begins atthe steam entry point at the left below the tank and continues to a split where one part goes into the tank
and one part goes down to a outlet point through asteam trap.
The velocities in the valves are based on themeasurements of the pressure in the tank and theresult can be viewed in Figure 9. The placement of
the numbered valves can be seen in Figure 10.During P1, P2 and P3 the flow will pass throughseveral valves that each will result in a pressuredrop, hence an increase in velocity. This means thatthe velocity of steam going into the tank will notonly change in time but also in every valve it passes.
0,0
50,0
100,0
150,0
200,0
250,0
300,0
350,0
400,0
450,0
0 100 200 300 400 500 600
t s
v m / s
1
2-
3
4
5
2L
7
Figure 9 Velocity in valves involved in P1-P3
The three periods that can be seen in Figure 9
represent the velocities in the valves that the steamflow passes during P1, P2 and P3 on the way intothe tank. The first valve that the flow passes is the
line with the lowest velocity and the proceedingvalves are the corresponding lines going upwards inthe picture. In time the velocity in every valve will
decrease because the pressure in the tank becomeshigher which creates a smaller pressure gradient.
Figure 10 Explanations to the valve numbers
In Figure 11 the total flow rate of steam that goes
into the tank in P1, P2 and P3 has been plotted together with the part that raises the pressure and the part that condenses. The rate of condensation is quiterapid in the beginning of P1. This might be because
the temperature in the tank is still low and themajority of the steam that enters is allowed tocondense. In P2 and P3 the condensation follows thesame patters as P1 but the increase is not as high because the tank has a higher temperature. The totalmasses steam that condenses (integral of the flow) is
presented in Table 5.
0,00000
0,05000
0,10000
0,15000
0,20000
0,25000
0,30000
0 50 100 150 200 250 300 350 400 450 500 550 600
t s
Q k
g / s
P1 P2 P3
Figure 11 The total flow rate in to the tank (black) , the
condensation rate (purple) and the pressure increasing
(blue)
Table 5 Mass of condensate formed in P1-P3, kg
Step P1 P2 P3
Condensate 14.2 33.9 6.1
The maximum flow rate into the tank will occur inthe beginning of P1 and P2 because the pressure inthe tank is the lowest here. The maximum flow rateis 0.25 kg/s (900 kg/h).
The pressure measurements show that the boiler that delivers steam to the tank has a big impact onhow long the sterilization takes. A steam supply thatdoes not provide a sufficient flow rate of steam willslow down the pressure dependent steps (P1, P2 and
P3).
8/22/2019 Emma Warlinge - Sterilization of Sterile Tanks
http://slidepdf.com/reader/full/emma-warlinge-sterilization-of-sterile-tanks 5/6
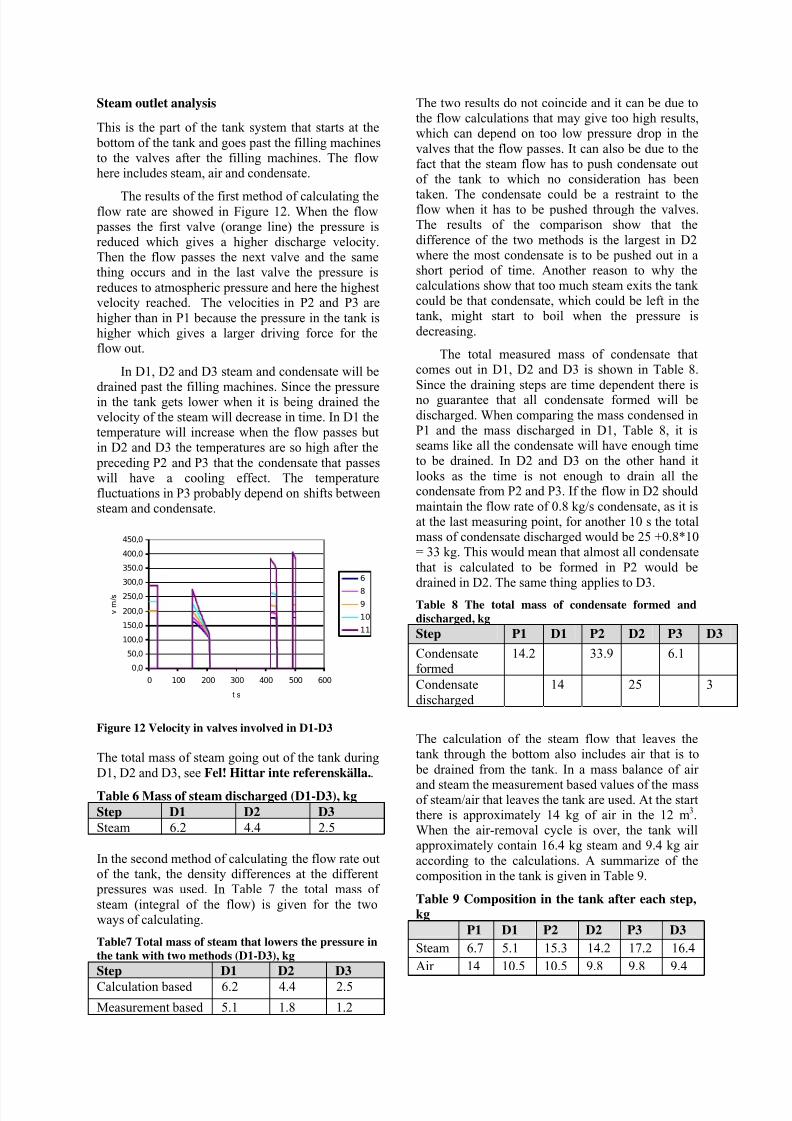
Steam outlet analysis
This is the part of the tank system that starts at the
bottom of the tank and goes past the filling machinesto the valves after the filling machines. The flowhere includes steam, air and condensate.
The results of the first method of calculating theflow rate are showed in Figure 12. When the flow passes the first valve (orange line) the pressure isreduced which gives a higher discharge velocity.Then the flow passes the next valve and the samething occurs and in the last valve the pressure is
reduces to atmospheric pressure and here the highestvelocity reached. The velocities in P2 and P3 are
higher than in P1 because the pressure in the tank ishigher which gives a larger driving force for theflow out.
In D1, D2 and D3 steam and condensate will be
drained past the filling machines. Since the pressurein the tank gets lower when it is being drained thevelocity of the steam will decrease in time. In D1 thetemperature will increase when the flow passes butin D2 and D3 the temperatures are so high after the
preceding P2 and P3 that the condensate that passeswill have a cooling effect. The temperaturefluctuations in P3 probably depend on shifts betweensteam and condensate.
0,0
50,0
100,0
150,0
200,0
250,0
300,0
350,0
400,0
450,0
0 100 200 300 400 500 600
t s
v m / s
6
8
9
10
11
Figure 12 Velocity in valves involved in D1-D3
The total mass of steam going out of the tank during
D1, D2 and D3, see Fel! Hittar inte referenskälla..
Table 6 Mass of steam discharged (D1-D3), kg
Step D1 D2 D3
Steam 6.2 4.4 2.5
In the second method of calculating the flow rate outof the tank, the density differences at the different pressures was used. In Table 7 the total mass of
steam (integral of the flow) is given for the twoways of calculating.
Table7 Total mass of steam that lowers the pressure in
the tank with two methods (D1-D3), kg
Step D1 D2 D3
Calculation based 6.2 4.4 2.5
Measurement based 5.1 1.8 1.2
The two results do not coincide and it can be due tothe flow calculations that may give too high results,which can depend on too low pressure drop in the
valves that the flow passes. It can also be due to thefact that the steam flow has to push condensate outof the tank to which no consideration has been
taken. The condensate could be a restraint to theflow when it has to be pushed through the valves.The results of the comparison show that the
difference of the two methods is the largest in D2where the most condensate is to be pushed out in ashort period of time. Another reason to why thecalculations show that too much steam exits the tank could be that condensate, which could be left in thetank, might start to boil when the pressure is
decreasing.
The total measured mass of condensate thatcomes out in D1, D2 and D3 is shown in Table 8.
Since the draining steps are time dependent there isno guarantee that all condensate formed will be
discharged. When comparing the mass condensed inP1 and the mass discharged in D1, Table 8, it isseams like all the condensate will have enough timeto be drained. In D2 and D3 on the other hand it
looks as the time is not enough to drain all thecondensate from P2 and P3. If the flow in D2 should
maintain the flow rate of 0.8 kg/s condensate, as it isat the last measuring point, for another 10 s the totalmass of condensate discharged would be 25 +0.8*10= 33 kg. This would mean that almost all condensate
that is calculated to be formed in P2 would be
drained in D2. The same thing applies to D3.Table 8 The total mass of condensate formed and
discharged, kg
Step P1 D1 P2 D2 P3 D3
Condensateformed
14.2 33.9 6.1
Condensate
discharged
14 25 3
The calculation of the steam flow that leaves thetank through the bottom also includes air that is to
be drained from the tank. In a mass balance of air
and steam the measurement based values of the massof steam/air that leaves the tank are used. At the startthere is approximately 14 kg of air in the 12 m3.When the air-removal cycle is over, the tank willapproximately contain 16.4 kg steam and 9.4 kg air
according to the calculations. A summarize of thecomposition in the tank is given in Table 9.
Table 9 Composition in the tank after each step,
kg
P1 D1 P2 D2 P3 D3
Steam 6.7 5.1 15.3 14.2 17.2 16.4
Air 14 10.5 10.5 9.8 9.8 9.4

8/22/2019 Emma Warlinge - Sterilization of Sterile Tanks
http://slidepdf.com/reader/full/emma-warlinge-sterilization-of-sterile-tanks 6/6
The calculations on this part of the system indicatethat the time dependent steps D2 and D3 are tooshort to evacuate any significant amount of air. It is
also shown that air in the system will lower thetemperature in the tank and makes the heating lessefficient. Another thing that would benefit from
longer draining periods would be the draining of condensate. As it is now all condensate will bedrained in D1 but not in the shorter D2 and D3.
Top outlet analysis
The constant flow out from the top of the tank goes
through two valves that restrict the flow with holeswith the diameters 1.5 mm and 3.5 mm. When
calculating this flow, pressure drop was estimated toonly occur in these valves because of their small passages. Calculations, according to Equation 2, of the velocity of the steam and air through these
valves are the same and can be seen in the plot in
Figure 13. In P1 the rising pressure in the tank willgive an increasing flow out of the top towards theatmospheric pressure. In D1 the flow will decrease because of the decreasing pressure in the tank.
After 294 s the increase in velocity will stop becausethe velocity of sound is reached and the flow willstay choked for the rest of the time. The temperaturetransmitter that reaches 125 o C last is this one which
is a result of the small flow of steam that passed through here. The total mass of the flow calculated
as the integral of the flow rate is 3 kg of steam and air mixture with varying composition. This means
that not a great deal of air will exit the tank here.
0
100
200
300
400
500
600
0 50 100 150 200 250 300 350 400 450 500 550
t s
v m / s
P1 D2P2D1 P3 D3
Figure 13 Velocity of steam out through the top of the
tank
Conclusions
The main output from this report is the velocities of the steam in the valves. The velocities vary between100 and 400 m/s both when steam enters and exitsthe tank. The velocity increases as the steam movesout from the tank and the highest velocities arefound in D3 when the pressure in the tank is the
highest.
The results of the flow calculations show that14.2 kg of steam condenses P1. This is the sameamount of condensate that is drained from the tank
in D1. In P2/D2 and P3/D3 these amounts are notthe same. 33.9 kg condenses in P2 and 25 kg aredrained in D2. In P3 6.1 kg condenses and 3 kg are
drained in D3. The explanation to why the massesare so different could be that the time for thedischarge in D2 and D3 are too short to drain all the
condensate that is formed. It is purposed that adding10 more seconds to both D1 and D2, up to 30 and 20s respectively, would result in total draining of the
condensate.The calculations on the flow of steam out of the
tank in D1, D2 and D3 show that more than themeasured pressure increase in the tank admits exitsthe tank. This is probably due to the condensate thatwill act as a constriction for the steam which will
result in a smaller flow.On the basis of the flow calculations out of the
tank, the mass of air that is left in the tank wasestimated. The result is that 9 kg out of the original
14 kg are still in the tank at the end of the air-removal cycle. If the time of D2 and D3 should be
prolonged to take out more condensate it would alsohave the effect that more air would be drained fromthe tank.
The flow rate at the top of the tank is too smallsince the temperature by the transmitter after air filter is increasing very slowly. No significant
amount of air will be drained from the top.
The complete work and suggestions for future work can be found in the Master thesis report6.
Acknowledgement
This work was carried out at as a Master work at
Tetra Pak with PhD Fredrik Innings as supervisor,who is gratefully acknowledged along with Prof.Anders Axelsson , Dpt of Chemical EngineeringLTH, who was examiner.
Literature cited
1 Lewis, M & Heppell, N (2000), Packaging
Systems, Continuous Thermal Processing of Foods,available at Knovel.com
2 Media Box, http://neworbis.tetrapak.com/irj/portal
3 Wise, W (2005), Succeed at steam sterilization
Chemical Processing,
4 Schneider, PM, et al (2005), Performance of
various steam sterilization indicators under optimum
and sub-optimum exposure conditions, AmericanJournal of Infection Control, Vol 33
5 Coulson, JM & Richardson, JF (1995), Chemical
Engineering, vol 1, Oxford: Butterworth-Heineman.
6 Wärlinge, E (2007), Sterilization of sterile tanks,
LTH, Lund.
Related Documents