Emma Timmins-Schiffman’s Lab Notebook University of Washington School of Aquatic and Fishery Sciences Roberts Lab 2009 - 2014

Welcome message from author
This document is posted to help you gain knowledge. Please leave a comment to let me know what you think about it! Share it to your friends and learn new things together.
Transcript
Emma Timmins-Schiffman’s Lab Notebook
University of WashingtonSchool of Aquatic and Fishery Sciences
Roberts Lab
2009 - 2014

2

3

Emma's NotebookeditFebruary 6, 2014
Secondary stress: GlycogenRecalculated glycogen content as µg glyc/mg tissue. For glycogen calculated as µg/µl multiplied by (200 µl/[mg glycogen used in extraction].200 µl is the volume in which the glycogen pellets were reconstituted. This correction made the means among the 3 treatments even moresimilar and an anova with pCO2 as a fixed factor yielded a p-value of 0.4.
Bioinformatics: iPiGjimmy converted some of my files to mzIdentML. First file I tried was 103B_251_QE_02.pep.mzid (peptide spectrum matches file). ensemblgenes table file = S. purpuratus from USCS (screenshot of download saved) - other option could be sea hare. Amino acid sequences = sameentries for download as genes table except table = RefSeq genes. No uniprot ID mapping file is available for S. purpuratus so uploaded a blanktxt file because I couldn't delete the file path that was already there. For FASTA file downloaded S. purpuratus peptides: ftp://ftp.ensemblgenomes.org/pub/metazoa/release-21/fasta/strongylocentrotus_purpuratus/pep/
Tried running iPiG with all the files Jimmy converted but always got an error about DatabaseName not being complete or Duplicate uniquevalue [] declared for identity constraint... I think I need to get rid of the uniprot ID-mapping file but I'm not sure how. If I don't change the filepath, then it still doesn't work.
January 31, 2014Bioinformatics: Module 3Heard back from the iPiG developer and he pointed me in the direction of ProCon, which converts SEQUEST output into mxIdentML.http://www.medizinisches-proteom-center.de/index.php/de/software-top/137-proteomics-conversion-tool-proconI think I need to configure it first in command line (both generally and for sequest file conversion). Navigated to config file and ran:./ProCon.properties MassSpecContactName=Emma MassSpecInstitution=UniversityofWashingtonMassSpecEmailPhoneFax=emmats@uw.edu DataSetContactName=Emma DataSetInstitution=UniversityofWashingtonDataSetEmailPhoneFax=emmats@uw.edu
got following error:./ProCon.properties: line 1: E.: command not found./ProCon.properties: line 2: Proteom-Center,: command not found: No such file or directory: +49/234/32-22427: command not found: line 4: Eisenacher./ProCon.properties: line 5: Proteom-Center,: command not found
Following workflow for conversion of sequest outfiles to mzIdentML. For select folder with Sequest...selected a prot.xls file. Clicked parseSEQUEST out folder. Left default file (procon_mzIdentML.mzid) for output file and clicked export. Error: no Sequest import, export ofmzIdentML only possible for Sequest out folder, but none imported. Hmmmm.....
Sam said to configure files manually. Opened Procon.properties in textwrangler and entered my contact info. Then opened log4j.properties andreplaced \\ withI've contacted Jimmy about the specific SEQUEST massvalues file. I also need to ask him about the sequest url and server name propertiesfile.
January 29, 2014Bioinformatics: Module 3navigated to ipig folder in applications and ran graphical user interface: ./ipigguiJimmy sent me a sample mzIdentML from a mascot search (F003766.mzid)Defaults for all other settings: genes table = knownGeneHuman.txt, amino acid sequences table = knownGenePep.txt, uniprot ID-mapping =HUMAN_9606_..., proteome fasta = HUMANFiles downloaded following iPiG wiki instructions: http://sourceforge.net/p/ipig/wiki/Input%20Formats/ .
January 28, 2014Secondary stress: GlycogenRedid samples from 1/25 that were too concentrated (diluted them 1:60 this time). There was not enough hydrolysis enzyme mix for the lastreplicate of 24, so it was only done in duplicate (the last being a sample blank control). Redid stats (ANOVA) and there is no difference amongtreatments. Below are means with 95% CI. 4

treatments. Below are means with 95% CI.
January 25, 2014Secondary stress: GlycogenFollowed manufacturer's protocol for calculation of glycogen concentration (µg/µl) in oyster tissues. If the reaction turned brown for any of theoysters, the results were not included in the analysis (the concentration of the glycogen exceeded the limits of the reaction). The background
was subtracted from each absorbance value. Coefficient of variation was <20% for all samples so all 3 replicates were included in averages.
For both plates, the standard curve was completely linear and the equation of the trendline was used to calculate glycogen concentration foreach unknown sample. Samples concentrations were corrected for the 1:30 dilution and for the reaction volume.
There was no different in glycogen content among the 3 pCO2 treatment levels (400, 800, 2800 µatm). However, 4 of the samples that weretoo concentrated to measure at a 1:30 dilution were from the 400 µatm treatment and this may indicate that there was more glycogen contentin the control treatment.
The following samples were excluded from analysis and will have to be rerun at a lower concentration: 3, 12, 15, 234, 24
January 24, 2014Secondary stress: GlycogenDid glycogen assay (sigma kit) on n = 8 samples from each of 3 pCO2 treatments (previously extracted by Sam) - 400, 800, and 2800 µatm.Samples were run in triplicate except for 0 standard and sample blanks. Sample blanks were a mixture of multiple samples to which nohydrolysis enzyme was added. All samples were diluted 1:30. I will have to redo a few samples at lower dilution because they maxed out thereaction (samples turned brown).
Bioinformatics: Module 3making a .bed file from mass spec datahttp://www.plosone.org/article/info%3Adoi%2F10.1371%2Fjournal.pone.0050246
January 23, 2014Secondary stress: proteomicsSR did a blastp of oyster proteins against the mouse proteome to get a single species annotation (file is qdod_proteome_blastp in cnidarian).Make | into delimiters.
5
Make | into delimiters.tr "|" "\t" </Volumes/web/cnidarian/qdod_proteome_blastp.txt /Volumes/web/oyster/proteomics/oyster_blastp_mouseUploaded dataset, kept only columns that are useful and renamed them:SELECT [Column1] AS [CGI ID],[Column3] AS [SPID],[Column4] AS [Mouse Protein],[Column13] AS [e-value] FROM [[email protected]].[table_oyster_blastp_mouse]Uploaded lists of differentially expressed proteins for each treatment. Joined to blastp output:SELECT DISTINCT * FROM [[email protected]].[distinct oyster blastp mouse]LEFT JOIN [[email protected]].[OA_CGIDs.txt]ON [[email protected]].[distinct oyster blastp mouse].[CGI ID]=[[email protected]].[OA_CGIDs.txt].OA LEFT JOIN [[email protected]].[400MechS_CGIDs.txt]ON [[email protected]].[distinct oyster blastp mouse].[CGI ID]=[[email protected]].[400MechS_CGIDs.txt].[400MechS]LEFT JOIN [[email protected]].[2800MechS_CGIDs.txt]ON [[email protected]].[distinct oyster blastp mouse].[CGI ID]=[[email protected]].[2800MechS_CGIDs.txt].[2800MechS]
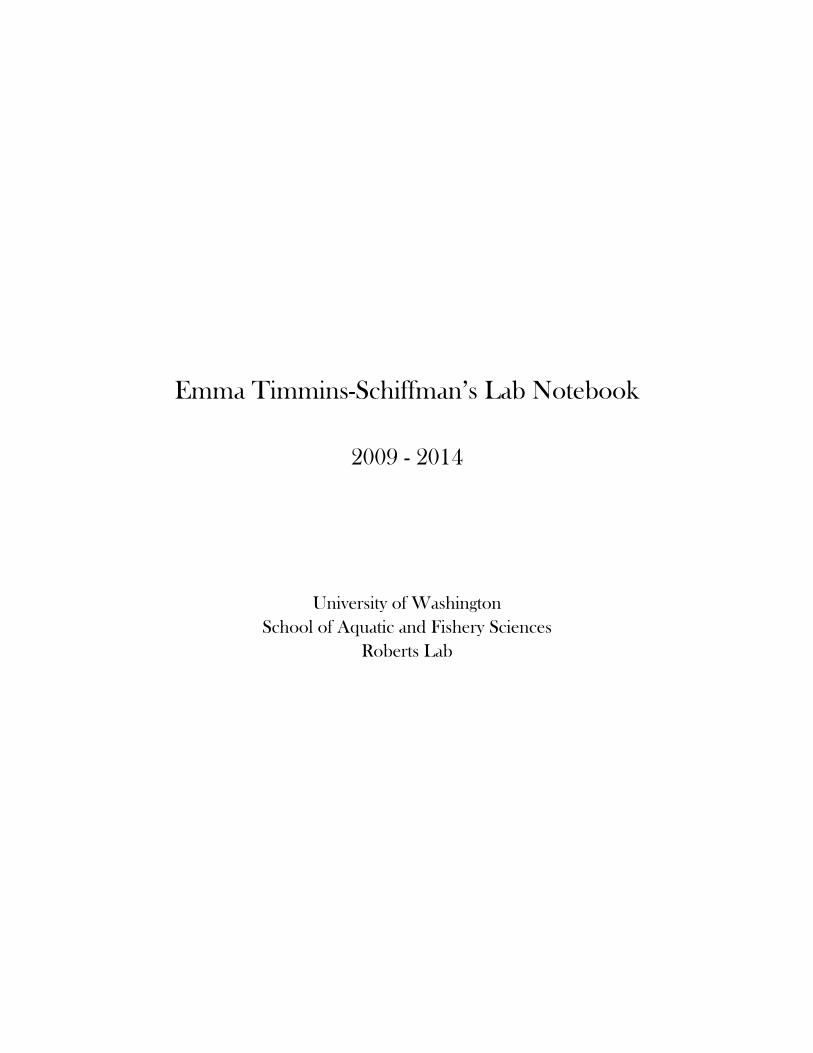
In Cytoscape, followed same steps as Jan 21 but did not use expression data as node attributes becausethis doesn't affect the layout (organic yfiles).OA
mechanical stress at 400 µatm
6
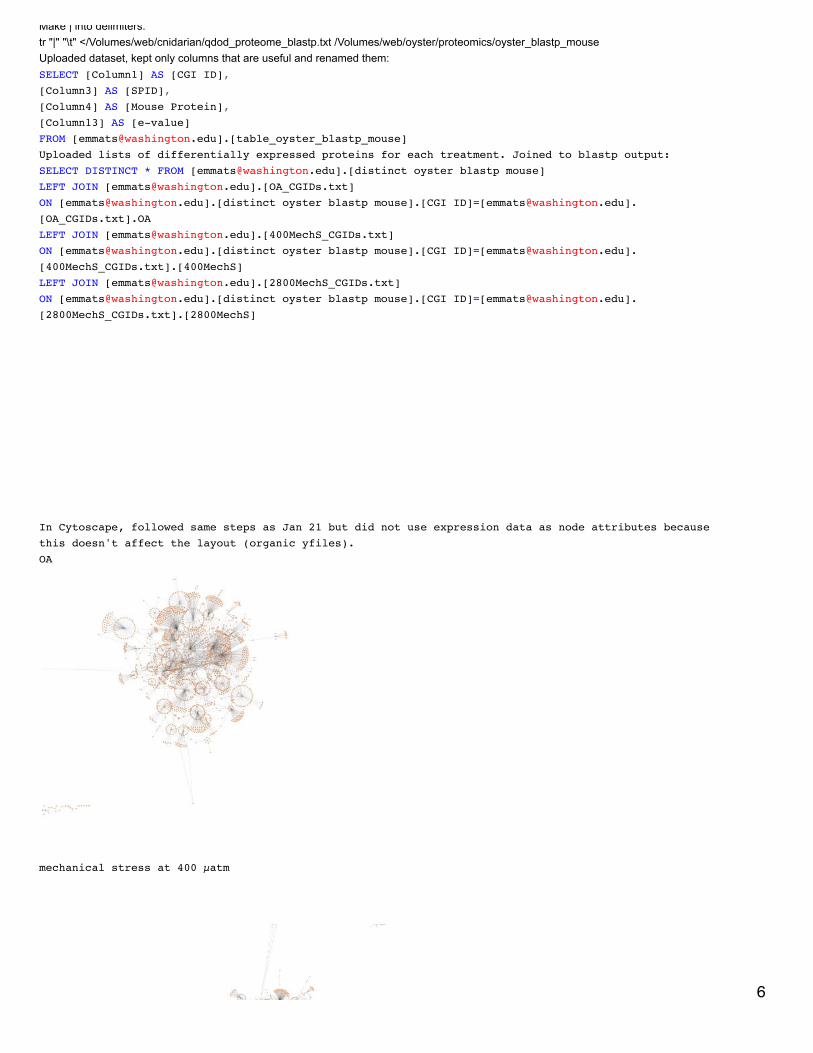
mechanical stress at 2800 µatm
January 22, 2014Secondary stress: GlycogenGlycogen content assay using Sigma's MAK016 kit. Followed manufacturer's protocol for absorbance assay. Samples were run in duplicate.The 3 samples I extracted (3, 219, and 366) were also run at full concentration and diluted 1:2, 1:10, and 1:20 in water. After the masterreaction mix was added, wells were mixed by pipetting up and down. I think this created too many bubbles and affected the replication for myplate read later.Some of the samples maxed out the assay and it turned brown (instead of fuschia): All samples at full concentration and 1:2, sample 3 at 1:10.It also seems that for the first row (the standards) within each duplicate every other sample is lower than its partner. Mac votes "plate effect"and for the next plate I will avoid the external columns and rows.I also think I will need to dilute the samples 1:30 in order to be within the range for the curve. I might add an extra standard on the high end ofthe curve to make sure.
January 21, 2014Secondary stress: proteomicsFurther exploration of possible protein-protein interaction network software. Navigator is a no-go due to limitations on annotations from multiplespecies. I've installed APID2NET v. 1.52 plugin in cytoscape, but it is only approved to work with an older version of cytoscape. APID seemsperfect because it provides an option to find interactions between proteins from different species.APID retrieval -> search list from file -> selected file OA for string (list of swissprot IDs for differentially expressed proteins in response toelevated pCO2)in search filter dialogue box, checked "search interspecies protein..." and "search hypothetical protein...", connexion levels = 1, experimentalmethods = 1in search list, selected find all. After results loaded, clicked Paint. APID Session -> save session -> OA APIDThis seems to have worked! More to come....In the NODE GO I can get a list of the frequencies of all GO terms represented in the network. I'm having trouble figuring out how tomanipulate the network and actually zoom in to specific parts. Could be a versioning issue?Imported list of differentially expressed swissprot IDs for response to mechanical stress and response to mechanical stress at elevated pCO2and followed same steps as above.Networks are here: https://www.evernote.com/shard/s242/sh/dec36fe0-46c0-4dad-815c-653ceed3aac4/7797ffb673aa690ea0f35afc1b765fd5
Downloaded cytoscape 3.0.2 and chose new network. Then import network from public databases. data source: interaction database universal cliententer search conditions: pasted list of swissprot IDs for differentially expressed proteins in response to OA 7
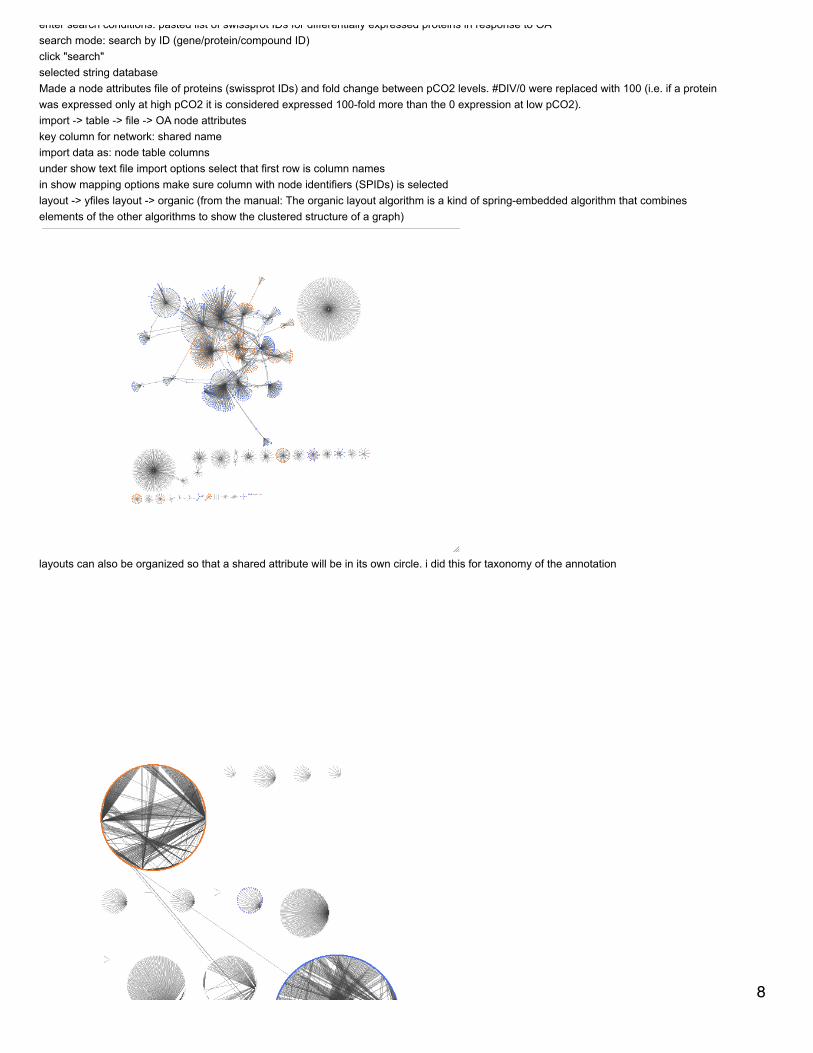
enter search conditions: pasted list of swissprot IDs for differentially expressed proteins in response to OAsearch mode: search by ID (gene/protein/compound ID)click "search"selected string databaseMade a node attributes file of proteins (swissprot IDs) and fold change between pCO2 levels. #DIV/0 were replaced with 100 (i.e. if a proteinwas expressed only at high pCO2 it is considered expressed 100-fold more than the 0 expression at low pCO2).import -> table -> file -> OA node attributeskey column for network: shared nameimport data as: node table columnsunder show text file import options select that first row is column namesin show mapping options make sure column with node identifiers (SPIDs) is selectedlayout -> yfiles layout -> organic (from the manual: The organic layout algorithm is a kind of spring-embedded algorithm that combineselements of the other algorithms to show the clustered structure of a graph)
layouts can also be organized so that a shared attribute will be in its own circle. i did this for taxonomy of the annotation
8
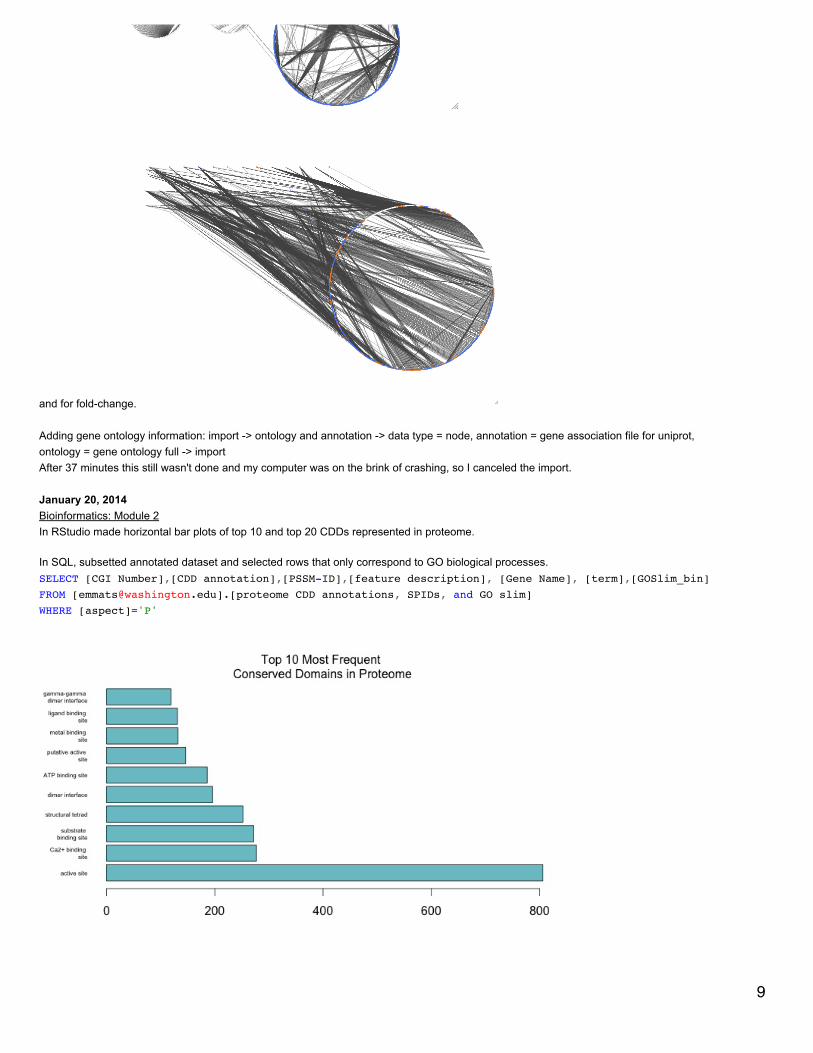
and for fold-change.
Adding gene ontology information: import -> ontology and annotation -> data type = node, annotation = gene association file for uniprot,ontology = gene ontology full -> importAfter 37 minutes this still wasn't done and my computer was on the brink of crashing, so I canceled the import.
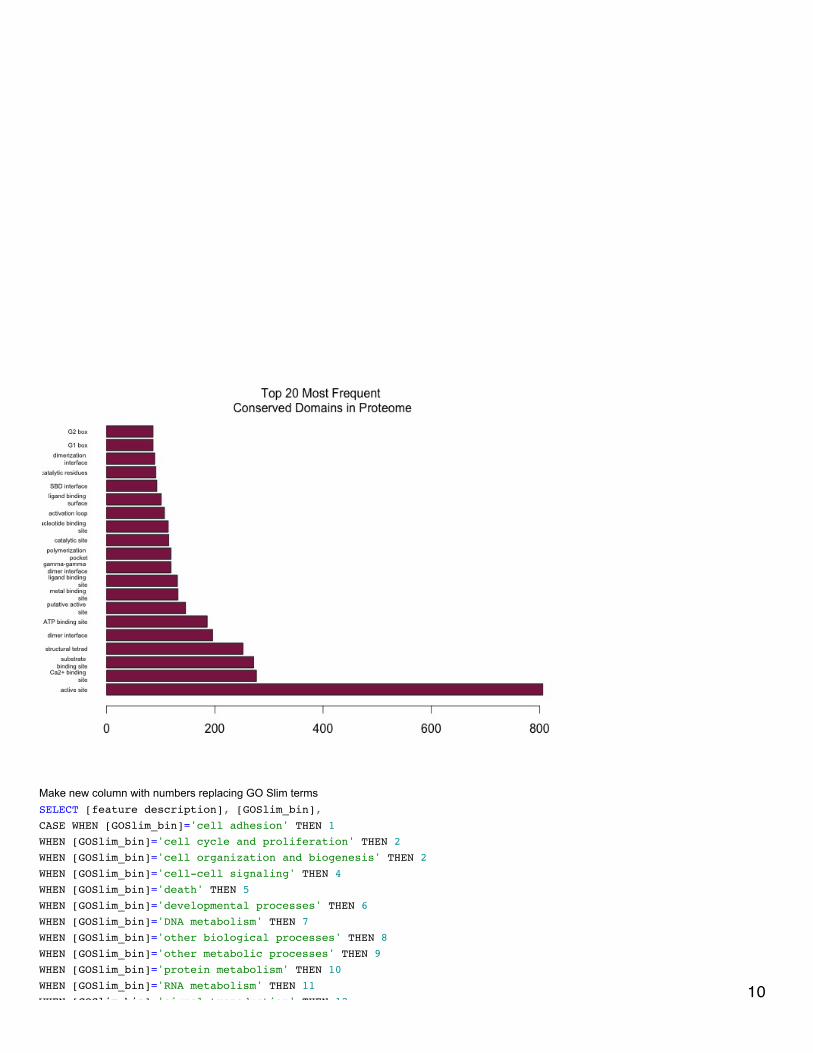
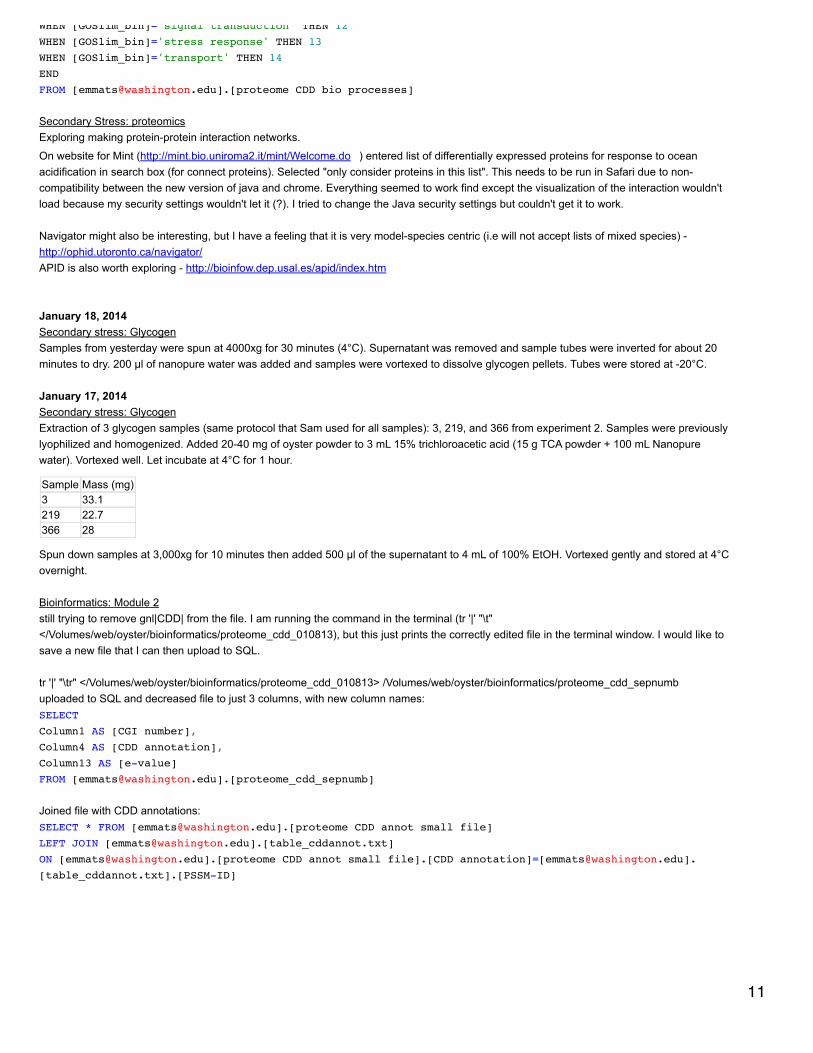
January 20, 2014Bioinformatics: Module 2In RStudio made horizontal bar plots of top 10 and top 20 CDDs represented in proteome.
In SQL, subsetted annotated dataset and selected rows that only correspond to GO biological processes.SELECT [CGI Number],[CDD annotation],[PSSM-ID],[feature description], [Gene Name], [term],[GOSlim_bin]FROM [[email protected]].[proteome CDD annotations, SPIDs, and GO slim]WHERE [aspect]='P'
9
Make new column with numbers replacing GO Slim termsSELECT [feature description], [GOSlim_bin],CASE WHEN [GOSlim_bin]='cell adhesion' THEN 1WHEN [GOSlim_bin]='cell cycle and proliferation' THEN 2WHEN [GOSlim_bin]='cell organization and biogenesis' THEN 2WHEN [GOSlim_bin]='cell-cell signaling' THEN 4WHEN [GOSlim_bin]='death' THEN 5WHEN [GOSlim_bin]='developmental processes' THEN 6WHEN [GOSlim_bin]='DNA metabolism' THEN 7WHEN [GOSlim_bin]='other biological processes' THEN 8WHEN [GOSlim_bin]='other metabolic processes' THEN 9WHEN [GOSlim_bin]='protein metabolism' THEN 10WHEN [GOSlim_bin]='RNA metabolism' THEN 11WHEN [GOSlim_bin]='signal transduction' THEN 12
10
WHEN [GOSlim_bin]='signal transduction' THEN 12WHEN [GOSlim_bin]='stress response' THEN 13WHEN [GOSlim_bin]='transport' THEN 14ENDFROM [[email protected]].[proteome CDD bio processes]
Secondary Stress: proteomicsExploring making protein-protein interaction networks.
On website for Mint (http://mint.bio.uniroma2.it/mint/Welcome.do ) entered list of differentially expressed proteins for response to oceanacidification in search box (for connect proteins). Selected "only consider proteins in this list". This needs to be run in Safari due to non-compatibility between the new version of java and chrome. Everything seemed to work find except the visualization of the interaction wouldn'tload because my security settings wouldn't let it (?). I tried to change the Java security settings but couldn't get it to work.
Navigator might also be interesting, but I have a feeling that it is very model-species centric (i.e will not accept lists of mixed species) -http://ophid.utoronto.ca/navigator/APID is also worth exploring - http://bioinfow.dep.usal.es/apid/index.htm
January 18, 2014Secondary stress: GlycogenSamples from yesterday were spun at 4000xg for 30 minutes (4°C). Supernatant was removed and sample tubes were inverted for about 20minutes to dry. 200 µl of nanopure water was added and samples were vortexed to dissolve glycogen pellets. Tubes were stored at -20°C.
January 17, 2014Secondary stress: GlycogenExtraction of 3 glycogen samples (same protocol that Sam used for all samples): 3, 219, and 366 from experiment 2. Samples were previouslylyophilized and homogenized. Added 20-40 mg of oyster powder to 3 mL 15% trichloroacetic acid (15 g TCA powder + 100 mL Nanopurewater). Vortexed well. Let incubate at 4°C for 1 hour.
Sample Mass (mg)3 33.1219 22.7366 28
Spun down samples at 3,000xg for 10 minutes then added 500 µl of the supernatant to 4 mL of 100% EtOH. Vortexed gently and stored at 4°Covernight.
Bioinformatics: Module 2still trying to remove gnl|CDD| from the file. I am running the command in the terminal (tr '|' "\t"</Volumes/web/oyster/bioinformatics/proteome_cdd_010813), but this just prints the correctly edited file in the terminal window. I would like tosave a new file that I can then upload to SQL.
tr '|' "\tr" </Volumes/web/oyster/bioinformatics/proteome_cdd_010813> /Volumes/web/oyster/bioinformatics/proteome_cdd_sepnumbuploaded to SQL and decreased file to just 3 columns, with new column names:SELECT Column1 AS [CGI number],Column4 AS [CDD annotation],Column13 AS [e-value]FROM [[email protected]].[proteome_cdd_sepnumb]
Joined file with CDD annotations:SELECT * FROM [[email protected]].[proteome CDD annot small file]LEFT JOIN [[email protected]].[table_cddannot.txt]ON [[email protected]].[proteome CDD annot small file].[CDD annotation]=[[email protected]].[table_cddannot.txt].[PSSM-ID]
11
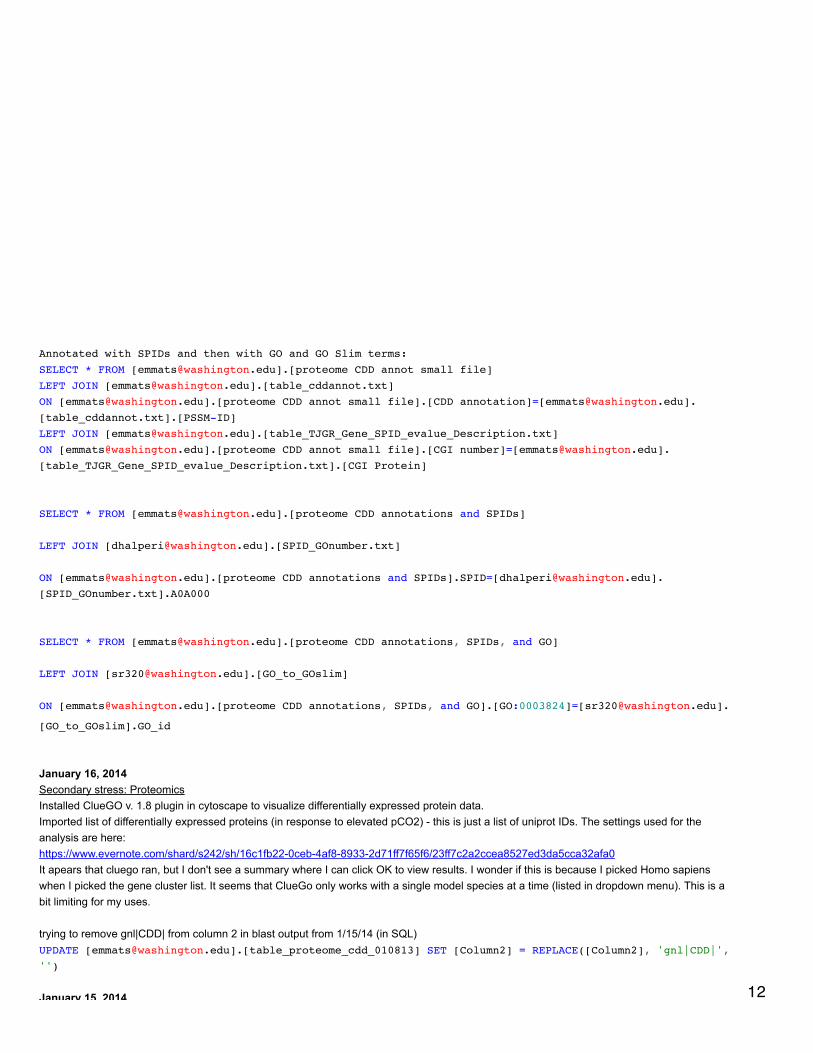
Annotated with SPIDs and then with GO and GO Slim terms:SELECT * FROM [[email protected]].[proteome CDD annot small file]LEFT JOIN [[email protected]].[table_cddannot.txt]ON [[email protected]].[proteome CDD annot small file].[CDD annotation]=[[email protected]].[table_cddannot.txt].[PSSM-ID]LEFT JOIN [[email protected]].[table_TJGR_Gene_SPID_evalue_Description.txt]ON [[email protected]].[proteome CDD annot small file].[CGI number]=[[email protected]].[table_TJGR_Gene_SPID_evalue_Description.txt].[CGI Protein]
SELECT * FROM [[email protected]].[proteome CDD annotations and SPIDs]
LEFT JOIN [[email protected]].[SPID_GOnumber.txt]
ON [[email protected]].[proteome CDD annotations and SPIDs].SPID=[[email protected]].[SPID_GOnumber.txt].A0A000
SELECT * FROM [[email protected]].[proteome CDD annotations, SPIDs, and GO]
LEFT JOIN [[email protected]].[GO_to_GOslim]
ON [[email protected]].[proteome CDD annotations, SPIDs, and GO].[GO:0003824]=[[email protected]].
[GO_to_GOslim].GO_id
January 16, 2014Secondary stress: ProteomicsInstalled ClueGO v. 1.8 plugin in cytoscape to visualize differentially expressed protein data.Imported list of differentially expressed proteins (in response to elevated pCO2) - this is just a list of uniprot IDs. The settings used for theanalysis are here:https://www.evernote.com/shard/s242/sh/16c1fb22-0ceb-4af8-8933-2d71ff7f65f6/23ff7c2a2ccea8527ed3da5cca32afa0It apears that cluego ran, but I don't see a summary where I can click OK to view results. I wonder if this is because I picked Homo sapienswhen I picked the gene cluster list. It seems that ClueGo only works with a single model species at a time (listed in dropdown menu). This is abit limiting for my uses.
trying to remove gnl|CDD| from column 2 in blast output from 1/15/14 (in SQL)UPDATE [[email protected]].[table_proteome_cdd_010813] SET [Column2] = REPLACE([Column2], 'gnl|CDD|','')
January 15, 2014 12

edit
January 15, 2014Bioinformatics: Module 1Reran deltablast with max target seqs = 5 to get multiple conserved domains per protein query. note: max_hsps_per_subject argument doesnot work with deltablast.
./deltablast -num_threads 8 -out /Users/Emma/Documents/cddblast/proteome_cdd_011513 -db /Users/Shared/Apps/ncbi-blast-2.2.29+/bin/cdd_delta -outfmt 6 -evalue 1E-10 -max_target_seqs 5 -query /Users/Emma/Documents/oyster.v9_90.fa.txt
error = Segmentation fault: 11I'm not sure what this means but the output file is empty. I guess I won't get to see multiple conserved domains for my proteins :(
downloaded CDD annotations from here: http://www.ncbi.nlm.nih.gov/Ftp/ information on column names found here: http://www.biowebdb.org/cdd/README Uploaded cddannot to sqlshare
January 14, 2014Secondary stress: ProteomicsUsing String v 9.1 to create a protein interaction network.Uploaded file of differentially expressed (swissprot IDs, at least 2-fold) proteins in the OA response to string under the "multiple names" tab.Chose auto-detect for organism and for interactors chose proteins. This forced me to choose a single organism for the interaction network.Repeated same steps as above except chose eukaryota as organism, however this still forces me to choose an organism on the next page.Tried again asking for COGs as interactor, this seemed to work.Where I am now: I've downloaded the tab delim txt file from String and uploaded it as a protein interaction network into Cytoscape with column1 as the source and column 2 as the target (based on this comment from a discussion board: If you download the "Text Summary" .txt file fromSTRING (instead of trying the "Graph Layout" .dat file), you can import it into Cytoscape using the table import function (File->Import->Networkfrom Table (Test/MS Excel)...). The first two columns contain the interactions and the rest contain the weights of different interaction types fromSTRING. Unfortunately, the specific layout of the string network is not easy to import into Cytoscape right now, but the interactions are.). Iwould like to upload protein expression data as node attributes, but my network file is based on COGs and my protein expression is SPIDs. I'mhaving trouble finding a way to link COGs with SPIDs because it seem that NCBI doesn't maintain these files (here's the list of files I found:http://www.ncbi.nlm.nih.gov/COG/ ).I've also uploaded just a list of proteins (swiss prot IDs) but since there are no interactions between the proteins nothing happens when I
upload expression information and try to do a directed layout.
January 9, 2014Bioinformatics: Module 1Moved CDD database from Eagle to bin folder on local computer and reran code. It seems to be working this time../deltablast -num_threads 8 -out /Users/Emma/Documents/cddblast/proteome_cdd_010813 -db /Users/Shared/Apps/ncbi-blast-2.2.29+/bin/cdd_delta -outfmt 6 -evalue 1E-10 -max_target_seqs 1 -query /Volumes/web-1/oyster/oyster_v9_aa_format1.fasta
January 8, 2014Bioinformatics: Module 1blastp of oyster proteome against conserved domains database../blastp -num_threads 8 -out /Users/Emma/Documents/cddblast/proteome_cdd_010813 -db /Volumes/web-1/whale/blast/db/cdd_delta -outfmt6 -evalue 1E-10 -max_target_seqs 1 -query /Users/Emma/Documents/oyster.v9_90.fa.txt
oops, wrong blast and wrong query file. Here is new code:./deltablast -num_threads 8 -out /Users/Emma/Documents/cddblast/proteome_cdd_010813 -db /Volumes/web-1/whale/blast/db/cdd_delta -outfmt 6 -evalue 1E-10 -max_target_seqs 1 -query /Volumes/web-1/oyster/oyster_v9_aa_format1.fasta
but got following error:BLAST Database error: No alias or index file found for protein database [cdd_delta] in search path [/Users/Shared/Apps/ncbi-blast-2.2.29+/bin::]
December 20, 2013Secondary stress: proteomicsI played around a bit with protein-protein interaction network stuff today. I tried Nascent and something called ENT. It looks like a limitation for alot of these packages is that my data is annotated from multiple model species.For Nascent I tried to make C. gigas both the source (annotation) and target (networked) animal, basing the calculation on sequence similarity.That returned empty results. Same thing when I tried to make M. musculus the source animal. Seems like this might be a good bioinformaticsproject. 13

Moving on to iPath, I made 3 separate plots for 2-fold differentially expressed proteins from each treatment condition. Red = expressed higherin stress condition and blue = lower, line width = 20.I also made blots for all proteins expressed higher across all 3 stress conditions and all expressed lower. blue = OA only, yellow = mech stressonly, red = OA + mech stress, green = protein changes for both OA only and Mech stress only (i.e. for proteins shared across responses color= combination of the single response colors, brown = across all 3). These plots are harder to understand by just quickly looking at them, so Ithink the 3-plot approach is more useful.
December 19, 2013Secondary Stress: ProteomicsMade heat maps for each treatment comparison with proteins at least 2-fold differentially expressed. If a protein had no annotation, it wasmarked as "Unannotated #". If two proteins had the same annotation a letter was added (i.e. a, b,...). Data were log-transformed and clusteringwas done for columns and rows using euclidean distance. For each heat map treatment groups clustered together.
Playing around with Cytoscape...The user manual is not that awesome (i.e. major terms are not defined). I figured out that I need to create anetwork of protein-protein interactions. There's a R package for that! WGCNA : http://labs.genetics.ucla.edu/horvath/CoexpressionNetwork/Rpackages/WGCNA/#WGCNAIntro
First will use GO Terms as trait data. Annotated 2-fold differentially expressed proteins with GO terms.SELECT * FROM [[email protected]].[2-fold diff proteins for venn]LEFT JOIN [[email protected]].[SPID_GOnumber.txt]ON [[email protected]].[2-fold diff proteins for venn].SPID=[[email protected]].[SPID_GOnumber.txt].A0A000
Ran Select Distinct for file to get rid of redundant entries. Created file with diff expressed proteins for OA only associated with GO terms(removed proteins that had no associated GO term).
There are too many 0 values for WGCNA to work. I tried it with oysters with at least 4, 5, and 6 oysters required to have expression data foreach protein but it was still too many 0s. I've contacted one of the package developers to see if he might be able to give me a hint.
December 18, 2013Secondary Stress: ProteomicsAnalysis of proteomics data to include proteins that are at least 2-fold differentially expressed. Compiled a list of proteins with at least a 2-foldchange (up or down) from the file NSAF avg SpC. The list is called 2-fold protein list.csv and I made sure that all proteins with q-value < 0.1were included (only 1 from 2800 mech stress comparison was not in the list because of <2-fold difference in expression). Uploaded list to SQLand joined with file of NSAF and SPID annotations.SELECT * FROM [[email protected]].[2-fold_protein_list.csv]LEFT JOIN [[email protected]].[NSAF based on avg SpC with SPIDs]ON [[email protected]].[2-fold_protein_list.csv].Protein=[[email protected]].[NSAF based on avgSpC with SPIDs].[All Proteins]
In Excel, removed annotations that were >1E-10. Separated proteins by treatment comparison and for eachtreatment removed proteins that were expressed in <2 oysters within a single treatment (i.e. if theprotein was expressed in just 1 oyster in each treatment it was removed).In response to OA + mechanical stress, 137 proteins were expressed lower or not at all compared to 2800µatm only and 149 were elevated under the dual stress. 138 proteins were expressed less in the mechanicalstress alone compared to 400 µatm and 107 were expressed higher. In response to OA only, 136 proteins areexpressed less at elevated pCO2 and 148 are expressed more.A venn diagram was executed in eulerAPE for the at least 2-fold differentially expressed proteins among treatment comparisons. A non-redundant list of all 2-fold proteins was generated and then lists of diff exp proteins from individual treatment comparisons were joined to themaster list.SELECT * FROM [[email protected]].[all_2-fold_proteins.txt]LEFT JOIN [[email protected]].[OA_2-fold.txt]ON [[email protected]].[all_2-fold_proteins.txt].Protein=[[email protected]].[OA_2-fold.txt].ProteinLEFT JOIN [[email protected]].[400MechS_2-fold.txt]ON [[email protected]].[all_2-fold_proteins.txt].Protein=[[email protected]].[400MechS_2-fold.txt].ProteinLEFT JOIN [[email protected]].[2800MechS_2-fold.txt]ON [[email protected]].[all_2-fold_proteins.txt].Protein=[[email protected]].[2800MechS_2- 14

fold.txt].Protein
DAVID enrichment analysis on 2-fold differentially expressed proteins. Non-redundant lists of SPIDs werecreated for each treatment comparison (3 lists) and for the entire gill proteome (1347 SPIDs). With thesignificance cutoff of p<0.075, the significantly enriched GO terms for the treatment comparisons are the
following:OA - vitamin metabolic process, visual perception, sensory perception of light stimulus, dorsal closure,cell-cell junction organization, transcription, regulation of transcription DNA-dependent, homophiliccell adhesion, regulation of transcription400MechS - regulation of RNA Metabolic process, regulation of transcription DNA-dependent, gametegeneration2800MechS - cellular polysaccharide biosynthetic process, transcription, polysaccharide metabolicprocess, cellular polysaccharide metabolic processDecember 17, 2013Proteomics: BrestI could see enough in the development of the films from the western blot to see that the antibody worked well and made a nice band. However,I messed up something with the revelation and cannot do an expression comparison.
December 16, 2013Proteomics: BrestWestern blot with primary antibody phosphorylated site for MAPKAPK-2 (Thr222), CST #3316. Product is 49 kDa, antibody made in rabbit.Samples are the same used for Nov 26 and gel layouts are the same except there is no control and I included samples 41 and 44 on both gels(although on gel 2 there is only 20 µl of 41 and 15 µl of 44, on gel 1 there is 25 µl of each). 41 and 44 are in the last 2 wells of each gel. I madenew SDS 10% and new 10x electrophoresis buffer this morning.Primary antibody was diluted 1:1000 in PBS-1% tween-5% BSA.
December 13, 2013Proteomics: BrestThe blots did not turn out. I did very long exposure times (up to 1/2 hour) with the film. I can see that there are a couple of very faint bands.Charlotte thinks that the problem is the primary antibody that was used once before. We are going to order new antibody and she may redo theblot for me in January.Next step: redo one of the blots that I previously did (probably antibody 2793) with the samples prepared yesterday.
December 12, 2013Proteomics: BrestThe blots that I did Dec 3-4 and Dec 11-12 both failed to show expression of AMPKa (the antibody bound to the dye front on the membranesfrom 12/3-4). I am re-preparing samples to do the blot today with antibody #2603 (otherwise known as 23A3). Samples are diluted in lysisbuffer to 2.24 mg/ml (to 50 µl) and I prepared new loading buffer (16.65 µl added to each sample).The well for sample 266 had a little blip at the bottom, which may affect the shape of the band.The primary antibody diluted in PBS-tween-BSA was used once before.
December 11, 2013Proteomics: BrestDay 2 of western blot. This particular form of AMPKa does not seem to be expressed in oyster gill tissue. I left films to develop in the cassettefor 4 and 8 minutes and the band for the ampk-treated control cells turned out very well, but there was no expression in any of my samples.Tomorrow I will use the other antibody that is supposed to be similar to this one (#2603) to see if I get the same results.
(Re)did quantifications for previous 2 blots. I think there is a chemiluminescence problem with membrane 2 from Dec 4 and with sample 41 onmembrane 1. I will redo membrane 2, but no need to redo 41 since it is a mech stress sample and I'm not including those in this analysis.Based on ANOVA, there is no difference in expression among treatments (excluding 2800 MS) of AMPKa (antibody 2793), phosphorylation siteof AMPKa for full-length protein, or for phosphorylation site of truncated protein (p > 0.05).
The ladder I've been using is a BioRad precision plus protein dual color standard, #151-0374.
December 10, 2013Proteomics: BrestDay 1 of western blot using AMPKa primary antibody (CST #5832). The first gels I made this morning did not polymerize so I had to make newones, which seem to have worked out fine. I used the same samples that were prepared for the Nov 26 western blot (still enough left for onemore blot!) and the CST AMPK control cells, treated.
December 9, 201315
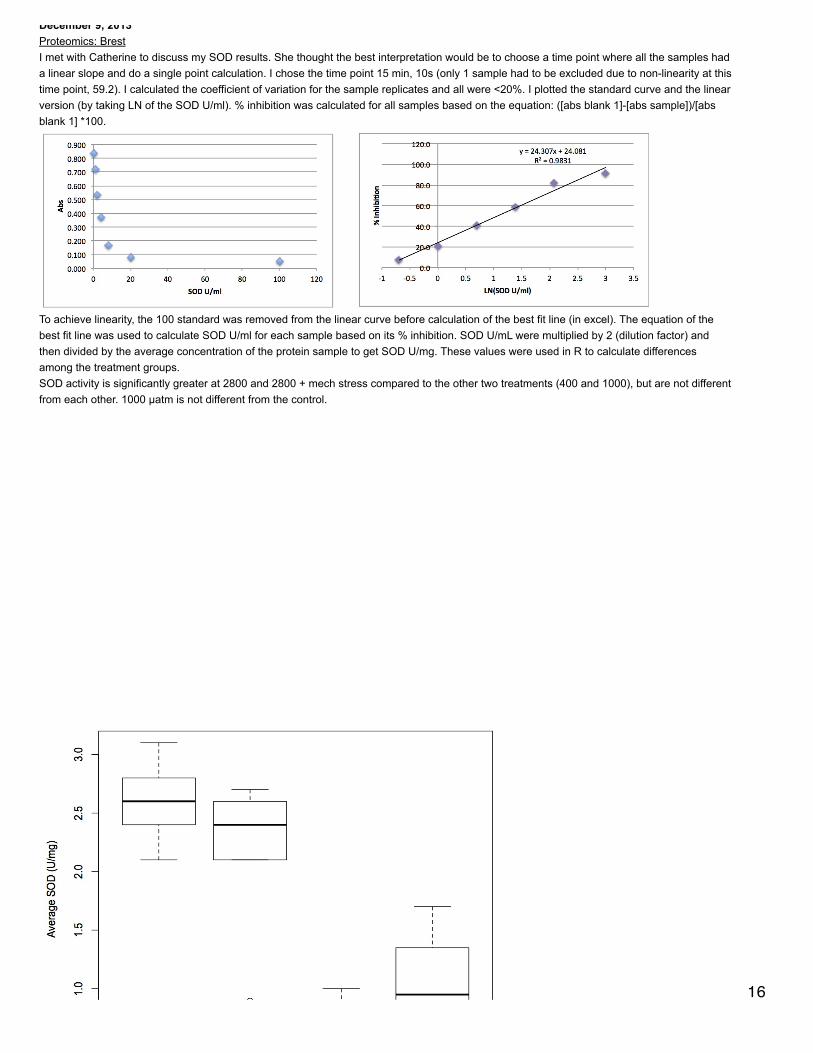
December 9, 2013Proteomics: BrestI met with Catherine to discuss my SOD results. She thought the best interpretation would be to choose a time point where all the samples hada linear slope and do a single point calculation. I chose the time point 15 min, 10s (only 1 sample had to be excluded due to non-linearity at thistime point, 59.2). I calculated the coefficient of variation for the sample replicates and all were <20%. I plotted the standard curve and the linearversion (by taking LN of the SOD U/ml). % inhibition was calculated for all samples based on the equation: ([abs blank 1]-[abs sample])/[absblank 1] *100.
To achieve linearity, the 100 standard was removed from the linear curve before calculation of the best fit line (in excel). The equation of thebest fit line was used to calculate SOD U/ml for each sample based on its % inhibition. SOD U/mL were multiplied by 2 (dilution factor) andthen divided by the average concentration of the protein sample to get SOD U/mg. These values were used in R to calculate differencesamong the treatment groups.SOD activity is significantly greater at 2800 and 2800 + mech stress compared to the other two treatments (400 and 1000), but are not differentfrom each other. 1000 µatm is not different from the control.
16

These results are in contrast to the previous no difference in GST activity among all 4 treatments.
December 4, 2013Proteomics: BrestDay 2 of western blot. Secondary antibody is goat anti-mouse. Blot seems to have worked well, but the oyster AMPKa is much smaller than the 17

one in the control. It looks like all samples express AMPK at about the same level, but I will do quantifications next week.Charlotte says that it is the truncated form that reacted with the antibody, not the total protein (that's why it's smaller). The control is ~55kDaand the oyster truncated form is 10-15 kDa. (This is in fact much much smaller than the truncated form that Eric saw in his work, which seemsweird...)
December 3, 2013Proteomics: BrestDay 1 of western blot. Same samples used (and in same order) as Nov 26. Gel 1 tore a little bit, but will hopefully turn out ok. Since sampleshad already been prepped on 11/26, I just reheated them for 5 minutes at 100°C before leaving on bench for 10 min and then storing on ice.Primary antibody = CST #2793, anti-AMPK alpha in mouse. Antibody is diluted 1/1000 (50 µl in 50 ml of PBS-tween-5% BSA).
Did quantifications of western blot from 11/26-11/27. I quantified 2 different images for each membrane. Global background was set based onthe image background for each membrane photo.
December 2, 2013
Proteomics: BrestSOD activity assay of samples extraction in lysis buffer (TL). All samples run in triplicate and diluted 1:2 in dilution buffer from kit.Manufacturer's protocol followed except ddH2O was not put in the blank 1 and 3 wells. Used standard curve but also ran kinetic protocol,reading plate ever 1 min 10s over 20 minutes. 20 µl of lysis buffer was put in wells for blank 2.
Some of the reaction curves for the SOD assay had data points that were obviously incorrect (i.e. were scatter randomly about the plot insteadof in a linear relationship). If no part of the plot was linear, the data will not be used. If the plot became linear after the random scattering, thenonly the linear portion of the plot will be used. Here is a list of samples that had to be completely deleted (sample number.replicate): 14.2, 28.3,34.2, 47.1, 278.1, 376.1. The 2 lowest concentration standards (0.5 and 0.25) needed to have points removed because the reaction curveplateaued after a certain point. Most of the samples that had points removed had them removed from the beginning of the kinetic reaction. Thesamples that had points deleted were: 34.1, 38.2, 38.3, 41.1, 44.3, 56.1, 56.3, 59.2, 236.3, 266.1, 266.2, 278.2, 278.3, 367.1, 367.2, 367.3,373.2, 373.3, 376.3, 379.1, 379.3. Overall, I think it was a good call to do the kinetic reaction curves since so many of the samples hadinaccurate starting absorbance values.Slopes of the linear curves were calculated for each sample, blank, and standard. Slopes for blanks 2 and 3 were 0. Calculated coefficient ofvariation (standard dev/mean) of the triplicate slopes for each sample. If CV>20%, the outlier slope was excluded from further calculations.Sample 47 shows too much variability to be included. I calculated the inhibition rate according to the equation in the manufacturer's protocol,which ends up being ([slope for blank 1]-[slope for sample])/[slope for blank 1] *100 since slopes for other blanks = 0. However, this resulted ininhibition rates ranging from >100% to >2000%, which doesn't make any sense.I plotted the standard concentrations against the average slope values for each standard (excluded 0.5 and 0.25) and fitted the logarithmiccurve in Excel. I used the logarithmic eqn to calculate concentrations based on slope values for the other samples. I also plotted the linearrelationship between LN(standard concentration)~slope average and derived sample concentrations. I think the latter is more accuratebecause the former results in negative sample concentrations.
November 27, 2013Proteomics: BrestSecond day of western blot started Nov 26. Photos were successfully developed and the blots worked really well - I don't need to redo them! Iwill quantify them tomorrow.The control is ~65 kDa, the larger band is ~75 and the smaller bad is ~37.
November 26, 2013Proteomics: BrestWestern blot using AMPK phosphorylated Thr172 as previously described. Samples used are those extracted in tampon de lyse Nov 13 and18. Samples were prepared by diluting all of them to 2.235 mg/ml (based on least concentrated sample's concentration) in tampon de lyse tomake 100 µl. 33.3 µl of loading buffer (475 µl loading dye + 25 µl beta mercaptoethanol) was added to each sample, vortexed, heated at~100°C for 10 minutes, incubated at RT for 10 min, vortexed, spun down, and stored on ice. Samples were almost immediately loaded intoprepared gels. Order of gels are left to right when looking at the gel from behind. 5 µl of ladder was loaded, 10 µl of control, and 25 µl of eachsample. On each gel, there are 2 protein samples from 400 µatm, 2 from 1000, 3 from 2800, and 1 from 2800 + mechanical stress. 2 additional2800 + MS samples were prepared and not loaded (47 and 28) and samples 38 and 34 were not prepared. Upper corner near ladder is cut ongel 1, all other 3 corners are cut on gel 2.Gel 1 order: ladder, AMPK treated control (cell signaling technologies), 278, 236, 373, 367, 17, 56, 59, 41Gel 2 order: ladder, control, 233, 266, 379, 376, 53, 14, 50, 44
November 25, 2013Proteomics: BrestSOD activity assay using kit of samples extracted in lysis buffer, diluted 1:10 in kit dilution buffer. With 1:10 dilution, sample concentrationswere at the very end of the standard curve. Additionally, on reading the protocol more carefully, apparently the enzyme working solution is not 18
were at the very end of the standard curve. Additionally, on reading the protocol more carefully, apparently the enzyme working solution is notgood after 3 weeks at 4°C. Ours has definitely been around longer than this so I need to follow up with Catherine. I'm also having trouble withpost-assay calculations...I will redo the assay with less dilute samples and may try the kinetic method instead of the standard curve.
November 22, 2013Proteomics: BrestRan GST assay in triplicate for all the samples extracted in Triton buffer. Activities were calculated using the equation in the manufacturer'sprotocol. Activities were corrected for different starting concentrations by dividing the activity (µmol/ml/min) by the sample concentration(mg/ml). The entire 20 minutes of the reaction was used to calculate activity since the entire curve was linear. Using ANOVA and binomialGLM, there are no significant differences among the treatment groups. If you squint, there is a slight suppression of activity at 1000 and 2800µatm compared to control and then activity becomes elevated again at 2800 + mechanical stress. However, due to low sample sizes and someinter-individual variability it's hard to tell if the trends are "real".
November 21, 2013Proteomics: BrestTest of GST and SOD enzymatic assays with most recently extracted samples. I chose 2 samples that have the lowest concentrations and onewith a higher concentration for each test (n=3 samples tested total). For SOD this was 278, 38, and 50 and for GST 382, 272, and 361. Allsamples run in duplicate.For SOD, followed manufacturer's protocol but did not do a standard curve because Catherine was gone and I couldn't find the SOD standard.Samples were diluted both 1:2 and 1:10. It seems that the assay will still work with samples diluted 1:10, based on the values from October 9.Followed the manufacturer's protocol for GST. For the GST control, used 4 µl of GST diluted 1:10 or 1:5. Used 20 µl undiluted sample. Assaywas run for 20 minutes with reads every 50s. It looks like the 1:5 dilution of the control gives a good, linear curve. The 3 samples all showed alinear response, although 361 had by far the steepest curve (being the more concentrated sample). But even the least concentrated (382 at 1.7mg/ml) had a linear kinetic response.
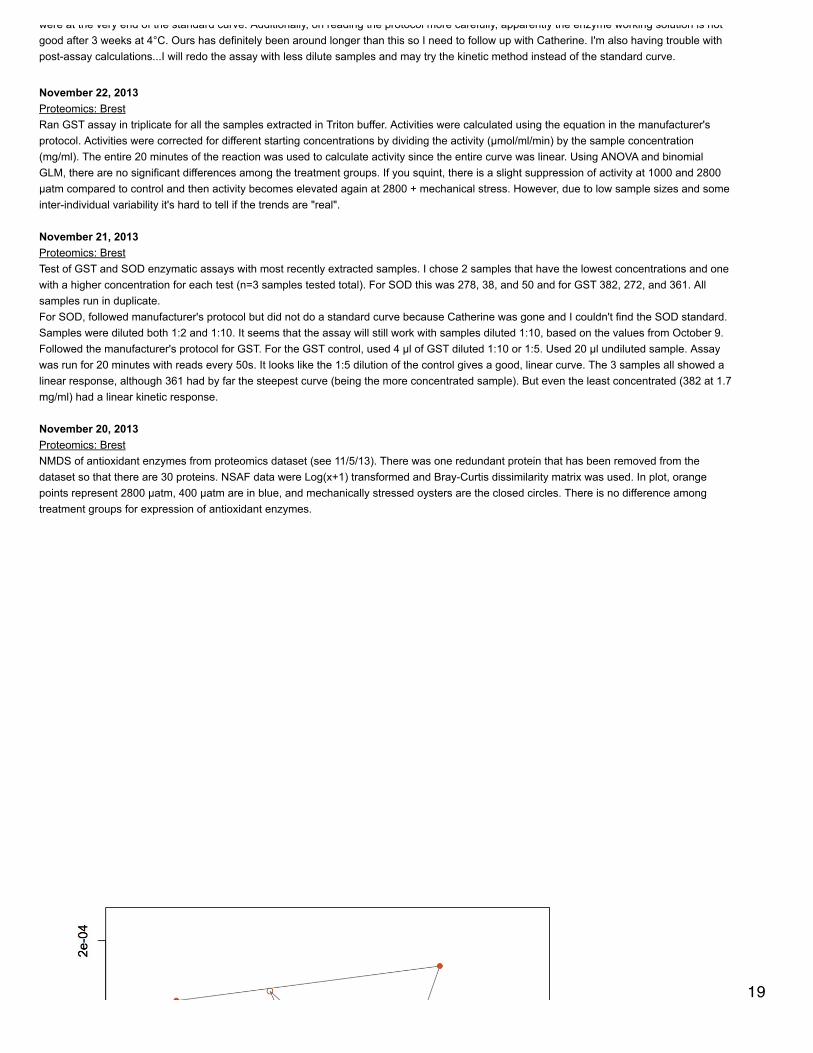
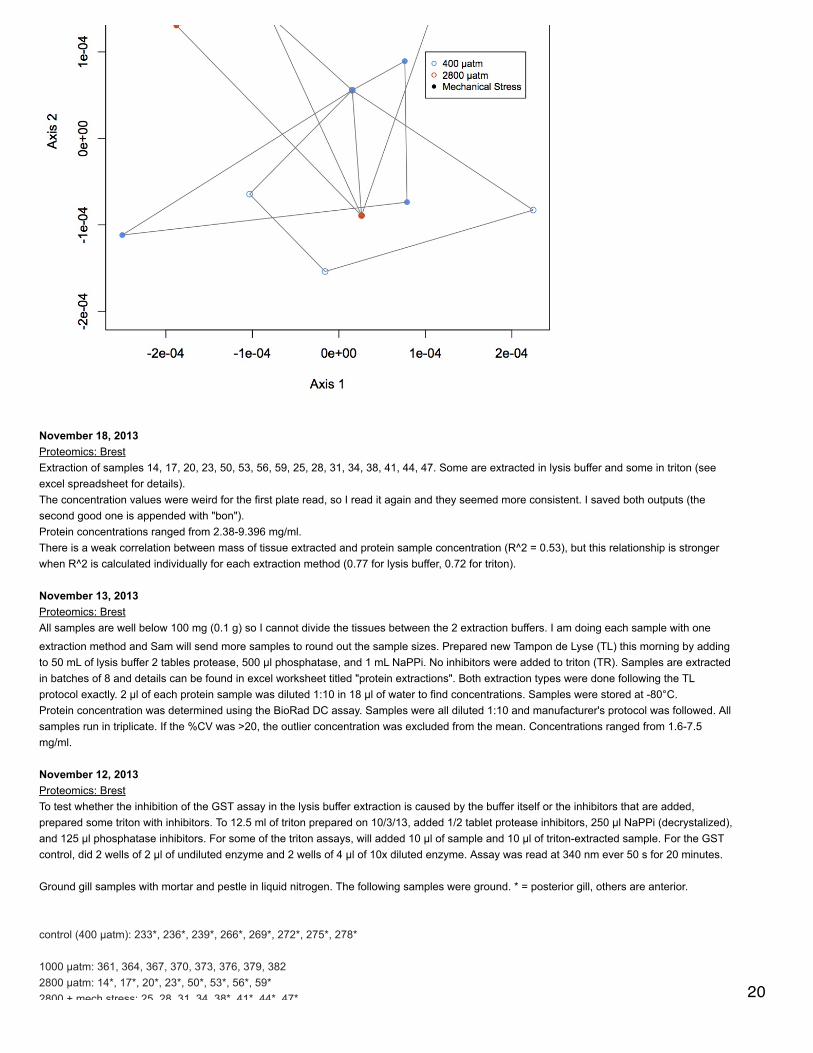
November 20, 2013Proteomics: BrestNMDS of antioxidant enzymes from proteomics dataset (see 11/5/13). There was one redundant protein that has been removed from thedataset so that there are 30 proteins. NSAF data were Log(x+1) transformed and Bray-Curtis dissimilarity matrix was used. In plot, orangepoints represent 2800 µatm, 400 µatm are in blue, and mechanically stressed oysters are the closed circles. There is no difference amongtreatment groups for expression of antioxidant enzymes.
19
November 18, 2013Proteomics: BrestExtraction of samples 14, 17, 20, 23, 50, 53, 56, 59, 25, 28, 31, 34, 38, 41, 44, 47. Some are extracted in lysis buffer and some in triton (seeexcel spreadsheet for details).The concentration values were weird for the first plate read, so I read it again and they seemed more consistent. I saved both outputs (thesecond good one is appended with "bon").Protein concentrations ranged from 2.38-9.396 mg/ml.There is a weak correlation between mass of tissue extracted and protein sample concentration (R^2 = 0.53), but this relationship is strongerwhen R^2 is calculated individually for each extraction method (0.77 for lysis buffer, 0.72 for triton).
November 13, 2013Proteomics: BrestAll samples are well below 100 mg (0.1 g) so I cannot divide the tissues between the 2 extraction buffers. I am doing each sample with one
extraction method and Sam will send more samples to round out the sample sizes. Prepared new Tampon de Lyse (TL) this morning by addingto 50 mL of lysis buffer 2 tables protease, 500 µl phosphatase, and 1 mL NaPPi. No inhibitors were added to triton (TR). Samples are extractedin batches of 8 and details can be found in excel worksheet titled "protein extractions". Both extraction types were done following the TLprotocol exactly. 2 µl of each protein sample was diluted 1:10 in 18 µl of water to find concentrations. Samples were stored at -80°C.Protein concentration was determined using the BioRad DC assay. Samples were all diluted 1:10 and manufacturer's protocol was followed. Allsamples run in triplicate. If the %CV was >20, the outlier concentration was excluded from the mean. Concentrations ranged from 1.6-7.5mg/ml.
November 12, 2013Proteomics: BrestTo test whether the inhibition of the GST assay in the lysis buffer extraction is caused by the buffer itself or the inhibitors that are added,prepared some triton with inhibitors. To 12.5 ml of triton prepared on 10/3/13, added 1/2 tablet protease inhibitors, 250 µl NaPPi (decrystalized),and 125 µl phosphatase inhibitors. For some of the triton assays, will added 10 µl of sample and 10 µl of triton-extracted sample. For the GSTcontrol, did 2 wells of 2 µl of undiluted enzyme and 2 wells of 4 µl of 10x diluted enzyme. Assay was read at 340 nm ever 50 s for 20 minutes.
Ground gill samples with mortar and pestle in liquid nitrogen. The following samples were ground. * = posterior gill, others are anterior.
control (400 µatm): 233*, 236*, 239*, 266*, 269*, 272*, 275*, 278*
1000 µatm: 361, 364, 367, 370, 373, 376, 379, 382 2800 µatm: 14*, 17*, 20*, 23*, 50*, 53*, 56*, 59*2800 + mech stress: 25, 28, 31, 34, 38*, 41*, 44*, 47* 20

2800 + mech stress: 25, 28, 31, 34, 38*, 41*, 44*, 47*367 fell on the floor but was still processedhalf of 41 was flung across the room so i will probably need a replacement
These samples were not mailed with the previous batch and need to be sent
1000 + mechanical stress: 385, 389, 392, 395, 398, 401, 404, 407
November 8, 2013Proteomics: BrestReceived GST kit and did assay of samples extracted Oct 3 and concentrations done Oct 9. Followed manufacturer's protocol for 96-wellformat. GST control was diluted 10x in sample buffer. Samples were run undiluted (4 µl) and diluted 10x in milliQ water (4 µl). Activity was readat 340 nm every 50 s for 10 min. At these concentrations it looks like the triton extractions work much better than the lysis buffer extractions. Overall, activity values were prettyweak (2-3 times what was measured in the blanks). I'm going to redo this on Tuesday using greater concentrations of the GST control(undiluted, diluted 5x, 10x, 20x), and greater concentrations of the different samples (undiluted for all, 4 µl, 10 µl, 20 µl).Note for future assays: aliquot samples into wells first and add enzyme solution last because plate is supposed to be loaded immediately afterall is put together.
November 5, 2013Proteomics: BrestCreated list of antioxidant proteins that were sequenced in proteomics (from supp table S3 from manuscript). Searched for the following termsto make list: superoxide, catalase, glutathione, dual oxidase, peroxidase, peroxiredoxin, thioredoxin, glutathione reductase. This resulted in 31proteins (some CGI numbers have identical annotations - need to do alignments to determine if really different proteins). In response to OA,glutathione S-transferase omega-1 and dual oxidase 2 were expressed >2-fold in high pCO2 vs low pCO2 and mitochondrial glutathione
reductase (n=2), glutathione S-transferase 3 (n=2), another glutathione S-transferase omega-1, and thioredoxin domain-containing protein 16were expressed only at high pCO2. A GST omega-1, GST mu 3, and dual oxidase 2 were downregulated at elevated pCO2. For response tomechanical stress alone GST omega-1 was upreg at least 2-fold and glutathione reductase (n=2), GST 3 (n=2), GST omega-1, dual oxidase 2,thioredoxin domain-containing protein 16 were all expressed only after mech stress. GST P2, GST omega-1, dual oxidase 2, and thioredoxindomain-containing protein 17 were all downreg after mech stress. In response to OA + mech stress GST A, GST 3, and thioredoxin domain-containing protein 17 were upreg at least 2-fold while GST omega-1, GST 3, GST Mu 3, dual oxidase 2 (n=2), and thioredoxin domain-containing protein were expressed only after mech stress. GST A and GST omega-1 were at least 2-fold down reg.
October 29, 2013Proteomics: BrestDay 2 of western blot. I made new PBS + tween because Charlotte thinks that one source of poor images for the blots is bacteria growing inthe PBS. The images turned out well, although there is still some background. Yanouk thinks this is due to using the older (small) bottles ofchemiluminescent reagent.
October 28, 2013Proteomics: BrestCharlotte finished up the blots started 10/24 on the 25th and they turned out well.Day 1 of western blot for samples 39, 42, 45, 48, 51, 54 (gel 1) and 94, 97, 100, 103, 106, 109 (gel 2). corner near the ladder is cut for gel 1and all 3 other corners are cut for gel 2. The control A1 (see 9/25) was used for both gels. Samples were diluted (see 9/18) and prepared inloading buffer before loading on gels.A new primary antibody solution was used.
October 24, 2013Proteomics: BrestDay 1 of western blot (same samples as 10/22 but in numerical order and only 1 ladder on each gel). Prepared new témoin (positive controlA1). To 25 µl of protein added 8.3 µl of loading buffer. Mixed, heated at ~100°C for 10 minutes, cooled at RT, spun down and stored on ice untilgel was loaded (13.3 µl of control loaded onto gel).Samples were previously prepared in loading buffer and so were denatured at 100°C for just 5 minutes.for gel 1 (samples 38-53), upper corner on ladder side (right when facing gel) is cut. for gel 2 (samples 93-107) all 3 corners except uppercorner on ladder side are cut.
October 23, 2013Proteomics: BrestDay 2 of western blot. I had forgotten to add SDS to the electrophoresis buffer yesterday. When I noticed, I added some and finished runningthe gel but it ended up making the bands kind of smeary. At least the revelation of the gels worked ( made new developing reagents), but theblots need to be redone.
21
blots need to be redone.
October 22, 2013Proteomics: BrestDay 1 of western blot (previously described). Gel 1 samples (in order): ladder, témoin, 38, 41, 44, 50, 47, 53. Gel 2 samples (in order): ladder,ladder, témoin, 93, 96, 99, 102, 105, 107. Primary antibody had been used once before. Membrane 1 upper corner near ladder is cut,membrane 2 2 corners opposite ladder are cut.
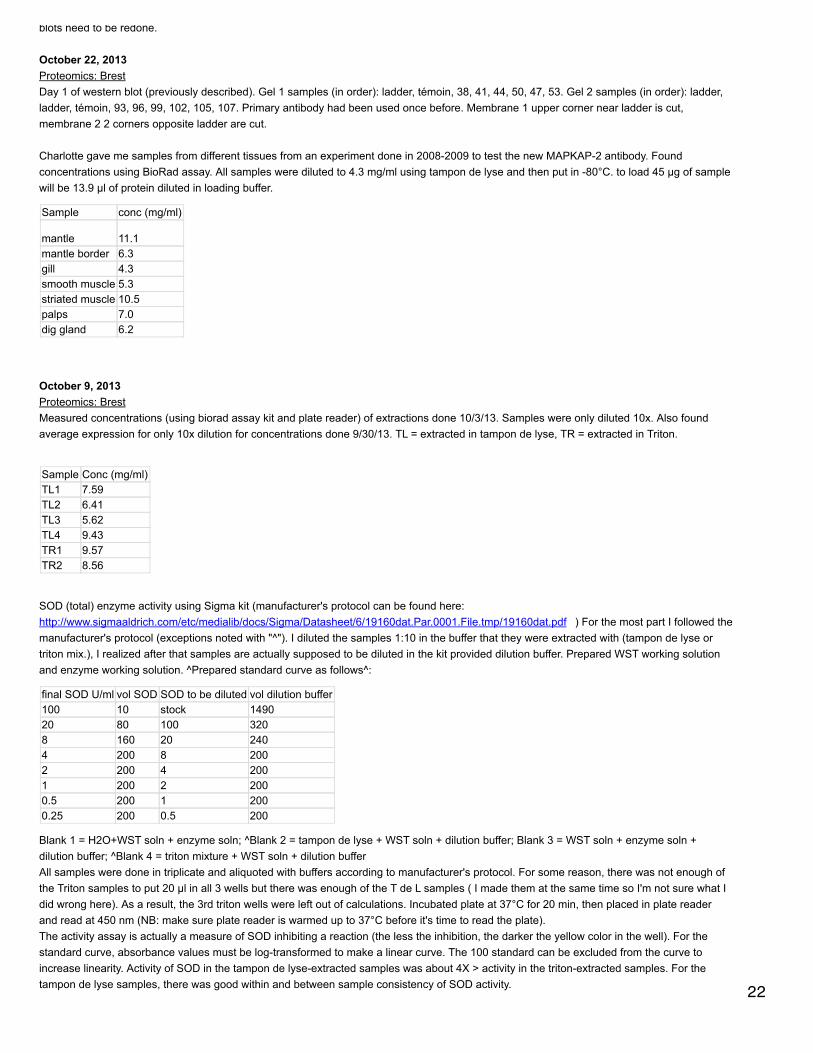
Charlotte gave me samples from different tissues from an experiment done in 2008-2009 to test the new MAPKAP-2 antibody. Foundconcentrations using BioRad assay. All samples were diluted to 4.3 mg/ml using tampon de lyse and then put in -80°C. to load 45 µg of samplewill be 13.9 µl of protein diluted in loading buffer.
Sample conc (mg/ml)
mantle 11.1mantle border 6.3gill 4.3smooth muscle 5.3striated muscle 10.5palps 7.0dig gland 6.2
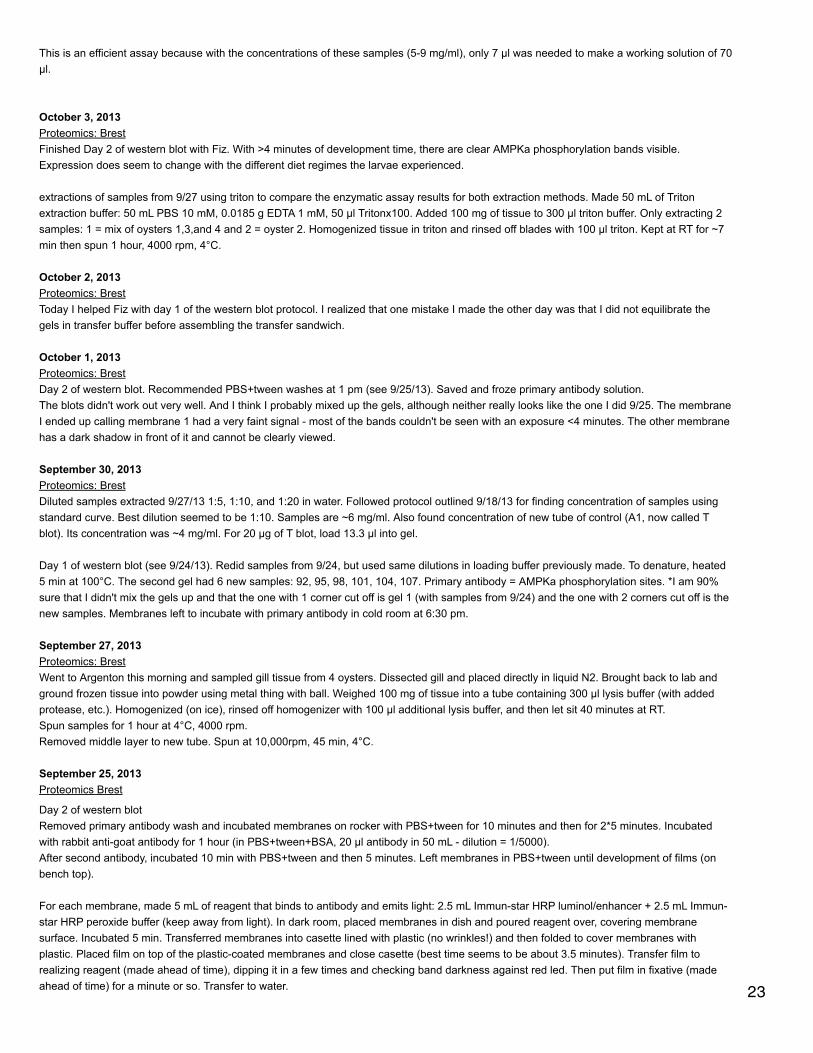
October 9, 2013Proteomics: BrestMeasured concentrations (using biorad assay kit and plate reader) of extractions done 10/3/13. Samples were only diluted 10x. Also foundaverage expression for only 10x dilution for concentrations done 9/30/13. TL = extracted in tampon de lyse, TR = extracted in Triton.
Sample Conc (mg/ml)TL1 7.59TL2 6.41TL3 5.62TL4 9.43TR1 9.57TR2 8.56
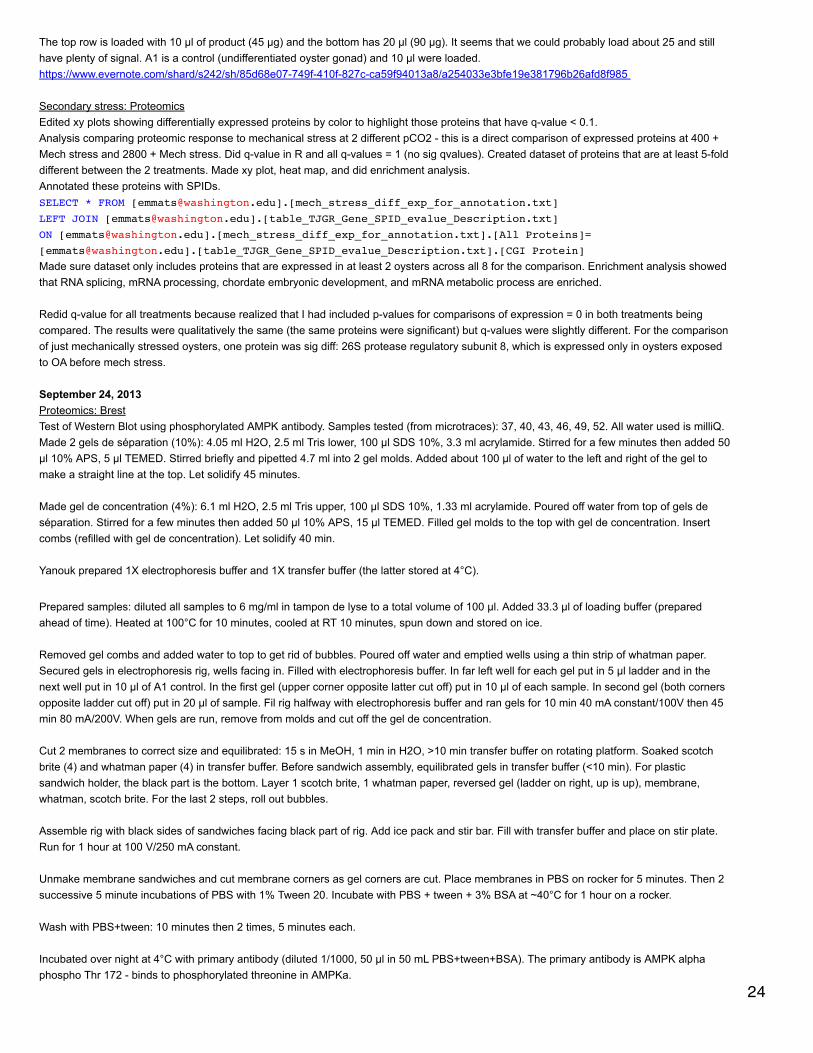
SOD (total) enzyme activity using Sigma kit (manufacturer's protocol can be found here:http://www.sigmaaldrich.com/etc/medialib/docs/Sigma/Datasheet/6/19160dat.Par.0001.File.tmp/19160dat.pdf ) For the most part I followed themanufacturer's protocol (exceptions noted with "^"). I diluted the samples 1:10 in the buffer that they were extracted with (tampon de lyse ortriton mix.), I realized after that samples are actually supposed to be diluted in the kit provided dilution buffer. Prepared WST working solutionand enzyme working solution. ^Prepared standard curve as follows^:
final SOD U/ml vol SOD SOD to be diluted vol dilution buffer100 10 stock 149020 80 100 3208 160 20 2404 200 8 2002 200 4 2001 200 2 2000.5 200 1 2000.25 200 0.5 200
Blank 1 = H2O+WST soln + enzyme soln; ^Blank 2 = tampon de lyse + WST soln + dilution buffer; Blank 3 = WST soln + enzyme soln +dilution buffer; ^Blank 4 = triton mixture + WST soln + dilution bufferAll samples were done in triplicate and aliquoted with buffers according to manufacturer's protocol. For some reason, there was not enough ofthe Triton samples to put 20 µl in all 3 wells but there was enough of the T de L samples ( I made them at the same time so I'm not sure what Idid wrong here). As a result, the 3rd triton wells were left out of calculations. Incubated plate at 37°C for 20 min, then placed in plate readerand read at 450 nm (NB: make sure plate reader is warmed up to 37°C before it's time to read the plate).The activity assay is actually a measure of SOD inhibiting a reaction (the less the inhibition, the darker the yellow color in the well). For thestandard curve, absorbance values must be log-transformed to make a linear curve. The 100 standard can be excluded from the curve toincrease linearity. Activity of SOD in the tampon de lyse-extracted samples was about 4X > activity in the triton-extracted samples. For thetampon de lyse samples, there was good within and between sample consistency of SOD activity. 22
This is an efficient assay because with the concentrations of these samples (5-9 mg/ml), only 7 µl was needed to make a working solution of 70µl.
October 3, 2013Proteomics: BrestFinished Day 2 of western blot with Fiz. With >4 minutes of development time, there are clear AMPKa phosphorylation bands visible.Expression does seem to change with the different diet regimes the larvae experienced.
extractions of samples from 9/27 using triton to compare the enzymatic assay results for both extraction methods. Made 50 mL of Tritonextraction buffer: 50 mL PBS 10 mM, 0.0185 g EDTA 1 mM, 50 µl Tritonx100. Added 100 mg of tissue to 300 µl triton buffer. Only extracting 2samples: 1 = mix of oysters 1,3,and 4 and 2 = oyster 2. Homogenized tissue in triton and rinsed off blades with 100 µl triton. Kept at RT for ~7min then spun 1 hour, 4000 rpm, 4°C.
October 2, 2013Proteomics: BrestToday I helped Fiz with day 1 of the western blot protocol. I realized that one mistake I made the other day was that I did not equilibrate thegels in transfer buffer before assembling the transfer sandwich.
October 1, 2013Proteomics: BrestDay 2 of western blot. Recommended PBS+tween washes at 1 pm (see 9/25/13). Saved and froze primary antibody solution.The blots didn't work out very well. And I think I probably mixed up the gels, although neither really looks like the one I did 9/25. The membraneI ended up calling membrane 1 had a very faint signal - most of the bands couldn't be seen with an exposure <4 minutes. The other membranehas a dark shadow in front of it and cannot be clearly viewed.
September 30, 2013Proteomics: BrestDiluted samples extracted 9/27/13 1:5, 1:10, and 1:20 in water. Followed protocol outlined 9/18/13 for finding concentration of samples usingstandard curve. Best dilution seemed to be 1:10. Samples are ~6 mg/ml. Also found concentration of new tube of control (A1, now called Tblot). Its concentration was ~4 mg/ml. For 20 µg of T blot, load 13.3 µl into gel.
Day 1 of western blot (see 9/24/13). Redid samples from 9/24, but used same dilutions in loading buffer previously made. To denature, heated5 min at 100°C. The second gel had 6 new samples: 92, 95, 98, 101, 104, 107. Primary antibody = AMPKa phosphorylation sites. *I am 90%sure that I didn't mix the gels up and that the one with 1 corner cut off is gel 1 (with samples from 9/24) and the one with 2 corners cut off is thenew samples. Membranes left to incubate with primary antibody in cold room at 6:30 pm.
September 27, 2013Proteomics: BrestWent to Argenton this morning and sampled gill tissue from 4 oysters. Dissected gill and placed directly in liquid N2. Brought back to lab andground frozen tissue into powder using metal thing with ball. Weighed 100 mg of tissue into a tube containing 300 µl lysis buffer (with addedprotease, etc.). Homogenized (on ice), rinsed off homogenizer with 100 µl additional lysis buffer, and then let sit 40 minutes at RT.Spun samples for 1 hour at 4°C, 4000 rpm.Removed middle layer to new tube. Spun at 10,000rpm, 45 min, 4°C.
September 25, 2013Proteomics Brest
Day 2 of western blotRemoved primary antibody wash and incubated membranes on rocker with PBS+tween for 10 minutes and then for 2*5 minutes. Incubatedwith rabbit anti-goat antibody for 1 hour (in PBS+tween+BSA, 20 µl antibody in 50 mL - dilution = 1/5000).After second antibody, incubated 10 min with PBS+tween and then 5 minutes. Left membranes in PBS+tween until development of films (onbench top).
For each membrane, made 5 mL of reagent that binds to antibody and emits light: 2.5 mL Immun-star HRP luminol/enhancer + 2.5 mL Immun-star HRP peroxide buffer (keep away from light). In dark room, placed membranes in dish and poured reagent over, covering membranesurface. Incubated 5 min. Transferred membranes into casette lined with plastic (no wrinkles!) and then folded to cover membranes withplastic. Placed film on top of the plastic-coated membranes and close casette (best time seems to be about 3.5 minutes). Transfer film torealizing reagent (made ahead of time), dipping it in a few times and checking band darkness against red led. Then put film in fixative (madeahead of time) for a minute or so. Transfer to water. 23
The top row is loaded with 10 µl of product (45 µg) and the bottom has 20 µl (90 µg). It seems that we could probably load about 25 and stillhave plenty of signal. A1 is a control (undifferentiated oyster gonad) and 10 µl were loaded.https://www.evernote.com/shard/s242/sh/85d68e07-749f-410f-827c-ca59f94013a8/a254033e3bfe19e381796b26afd8f985
Secondary stress: ProteomicsEdited xy plots showing differentially expressed proteins by color to highlight those proteins that have q-value < 0.1.Analysis comparing proteomic response to mechanical stress at 2 different pCO2 - this is a direct comparison of expressed proteins at 400 +Mech stress and 2800 + Mech stress. Did q-value in R and all q-values = 1 (no sig qvalues). Created dataset of proteins that are at least 5-folddifferent between the 2 treatments. Made xy plot, heat map, and did enrichment analysis.Annotated these proteins with SPIDs.SELECT * FROM [[email protected]].[mech_stress_diff_exp_for_annotation.txt]LEFT JOIN [[email protected]].[table_TJGR_Gene_SPID_evalue_Description.txt]ON [[email protected]].[mech_stress_diff_exp_for_annotation.txt].[All Proteins]=[[email protected]].[table_TJGR_Gene_SPID_evalue_Description.txt].[CGI Protein]Made sure dataset only includes proteins that are expressed in at least 2 oysters across all 8 for the comparison. Enrichment analysis showedthat RNA splicing, mRNA processing, chordate embryonic development, and mRNA metabolic process are enriched.
Redid q-value for all treatments because realized that I had included p-values for comparisons of expression = 0 in both treatments beingcompared. The results were qualitatively the same (the same proteins were significant) but q-values were slightly different. For the comparisonof just mechanically stressed oysters, one protein was sig diff: 26S protease regulatory subunit 8, which is expressed only in oysters exposedto OA before mech stress.
September 24, 2013Proteomics: BrestTest of Western Blot using phosphorylated AMPK antibody. Samples tested (from microtraces): 37, 40, 43, 46, 49, 52. All water used is milliQ.Made 2 gels de séparation (10%): 4.05 ml H2O, 2.5 ml Tris lower, 100 µl SDS 10%, 3.3 ml acrylamide. Stirred for a few minutes then added 50µl 10% APS, 5 µl TEMED. Stirred briefly and pipetted 4.7 ml into 2 gel molds. Added about 100 µl of water to the left and right of the gel tomake a straight line at the top. Let solidify 45 minutes.
Made gel de concentration (4%): 6.1 ml H2O, 2.5 ml Tris upper, 100 µl SDS 10%, 1.33 ml acrylamide. Poured off water from top of gels deséparation. Stirred for a few minutes then added 50 µl 10% APS, 15 µl TEMED. Filled gel molds to the top with gel de concentration. Insertcombs (refilled with gel de concentration). Let solidify 40 min.
Yanouk prepared 1X electrophoresis buffer and 1X transfer buffer (the latter stored at 4°C).
Prepared samples: diluted all samples to 6 mg/ml in tampon de lyse to a total volume of 100 µl. Added 33.3 µl of loading buffer (preparedahead of time). Heated at 100°C for 10 minutes, cooled at RT 10 minutes, spun down and stored on ice.
Removed gel combs and added water to top to get rid of bubbles. Poured off water and emptied wells using a thin strip of whatman paper.Secured gels in electrophoresis rig, wells facing in. Filled with electrophoresis buffer. In far left well for each gel put in 5 µl ladder and in thenext well put in 10 µl of A1 control. In the first gel (upper corner opposite latter cut off) put in 10 µl of each sample. In second gel (both cornersopposite ladder cut off) put in 20 µl of sample. Fil rig halfway with electrophoresis buffer and ran gels for 10 min 40 mA constant/100V then 45min 80 mA/200V. When gels are run, remove from molds and cut off the gel de concentration.
Cut 2 membranes to correct size and equilibrated: 15 s in MeOH, 1 min in H2O, >10 min transfer buffer on rotating platform. Soaked scotchbrite (4) and whatman paper (4) in transfer buffer. Before sandwich assembly, equilibrated gels in transfer buffer (<10 min). For plasticsandwich holder, the black part is the bottom. Layer 1 scotch brite, 1 whatman paper, reversed gel (ladder on right, up is up), membrane,whatman, scotch brite. For the last 2 steps, roll out bubbles.
Assemble rig with black sides of sandwiches facing black part of rig. Add ice pack and stir bar. Fill with transfer buffer and place on stir plate.Run for 1 hour at 100 V/250 mA constant.
Unmake membrane sandwiches and cut membrane corners as gel corners are cut. Place membranes in PBS on rocker for 5 minutes. Then 2successive 5 minute incubations of PBS with 1% Tween 20. Incubate with PBS + tween + 3% BSA at ~40°C for 1 hour on a rocker.
Wash with PBS+tween: 10 minutes then 2 times, 5 minutes each.
Incubated over night at 4°C with primary antibody (diluted 1/1000, 50 µl in 50 mL PBS+tween+BSA). The primary antibody is AMPK alphaphospho Thr 172 - binds to phosphorylated threonine in AMPKa.
24
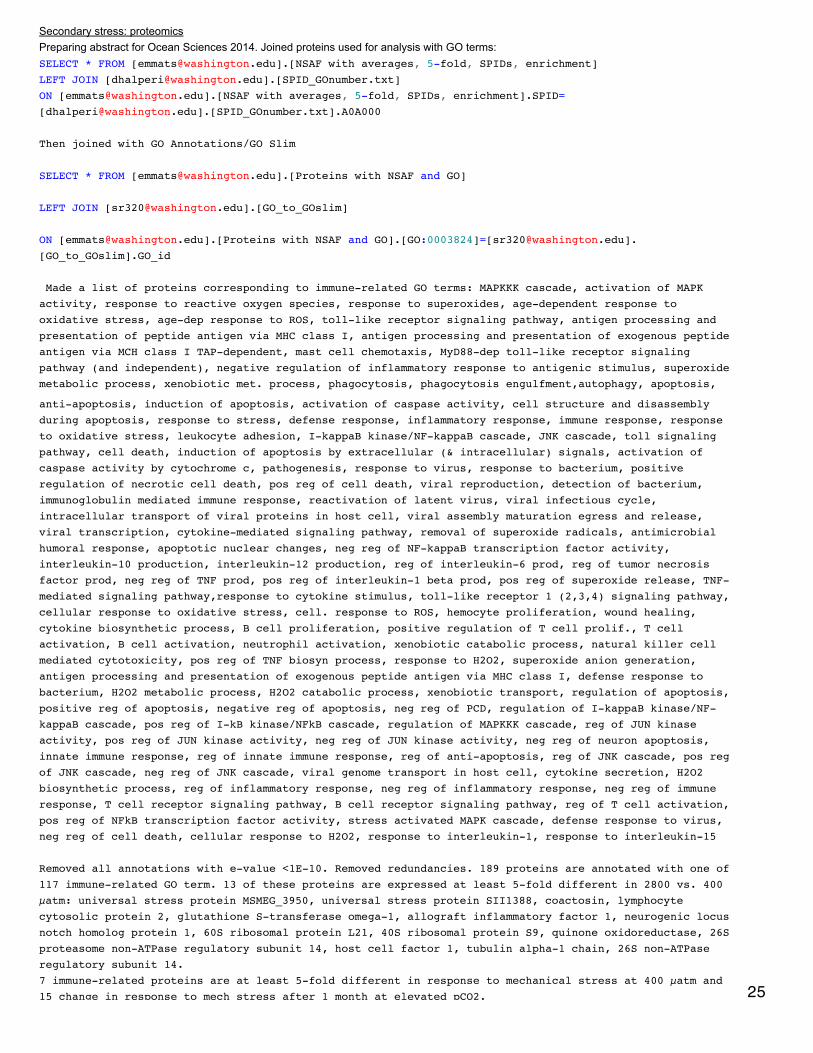
Secondary stress: proteomicsPreparing abstract for Ocean Sciences 2014. Joined proteins used for analysis with GO terms:SELECT * FROM [[email protected]].[NSAF with averages, 5-fold, SPIDs, enrichment]LEFT JOIN [[email protected]].[SPID_GOnumber.txt]ON [[email protected]].[NSAF with averages, 5-fold, SPIDs, enrichment].SPID=[[email protected]].[SPID_GOnumber.txt].A0A000
Then joined with GO Annotations/GO Slim
SELECT * FROM [[email protected]].[Proteins with NSAF and GO]
LEFT JOIN [[email protected]].[GO_to_GOslim]
ON [[email protected]].[Proteins with NSAF and GO].[GO:0003824]=[[email protected]].[GO_to_GOslim].GO_id
Made a list of proteins corresponding to immune-related GO terms: MAPKKK cascade, activation of MAPKactivity, response to reactive oxygen species, response to superoxides, age-dependent response tooxidative stress, age-dep response to ROS, toll-like receptor signaling pathway, antigen processing andpresentation of peptide antigen via MHC class I, antigen processing and presentation of exogenous peptideantigen via MCH class I TAP-dependent, mast cell chemotaxis, MyD88-dep toll-like receptor signalingpathway (and independent), negative regulation of inflammatory response to antigenic stimulus, superoxidemetabolic process, xenobiotic met. process, phagocytosis, phagocytosis engulfment,autophagy, apoptosis,
anti-apoptosis, induction of apoptosis, activation of caspase activity, cell structure and disassemblyduring apoptosis, response to stress, defense response, inflammatory response, immune response, responseto oxidative stress, leukocyte adhesion, I-kappaB kinase/NF-kappaB cascade, JNK cascade, toll signalingpathway, cell death, induction of apoptosis by extracellular (& intracellular) signals, activation ofcaspase activity by cytochrome c, pathogenesis, response to virus, response to bacterium, positiveregulation of necrotic cell death, pos reg of cell death, viral reproduction, detection of bacterium,immunoglobulin mediated immune response, reactivation of latent virus, viral infectious cycle,intracellular transport of viral proteins in host cell, viral assembly maturation egress and release,viral transcription, cytokine-mediated signaling pathway, removal of superoxide radicals, antimicrobialhumoral response, apoptotic nuclear changes, neg reg of NF-kappaB transcription factor activity,interleukin-10 production, interleukin-12 production, reg of interleukin-6 prod, reg of tumor necrosisfactor prod, neg reg of TNF prod, pos reg of interleukin-1 beta prod, pos reg of superoxide release, TNF-mediated signaling pathway,response to cytokine stimulus, toll-like receptor 1 (2,3,4) signaling pathway,cellular response to oxidative stress, cell. response to ROS, hemocyte proliferation, wound healing,cytokine biosynthetic process, B cell proliferation, positive regulation of T cell prolif., T cellactivation, B cell activation, neutrophil activation, xenobiotic catabolic process, natural killer cellmediated cytotoxicity, pos reg of TNF biosyn process, response to H2O2, superoxide anion generation,antigen processing and presentation of exogenous peptide antigen via MHC class I, defense response tobacterium, H2O2 metabolic process, H2O2 catabolic process, xenobiotic transport, regulation of apoptosis,positive reg of apoptosis, negative reg of apoptosis, neg reg of PCD, regulation of I-kappaB kinase/NF-kappaB cascade, pos reg of I-kB kinase/NFkB cascade, regulation of MAPKKK cascade, reg of JUN kinaseactivity, pos reg of JUN kinase activity, neg reg of JUN kinase activity, neg reg of neuron apoptosis,innate immune response, reg of innate immune response, reg of anti-apoptosis, reg of JNK cascade, pos regof JNK cascade, neg reg of JNK cascade, viral genome transport in host cell, cytokine secretion, H2O2biosynthetic process, reg of inflammatory response, neg reg of inflammatory response, neg reg of immuneresponse, T cell receptor signaling pathway, B cell receptor signaling pathway, reg of T cell activation,pos reg of NFkB transcription factor activity, stress activated MAPK cascade, defense response to virus,neg reg of cell death, cellular response to H2O2, response to interleukin-1, response to interleukin-15
Removed all annotations with e-value <1E-10. Removed redundancies. 189 proteins are annotated with one of117 immune-related GO term. 13 of these proteins are expressed at least 5-fold different in 2800 vs. 400µatm: universal stress protein MSMEG_3950, universal stress protein SII1388, coactosin, lymphocytecytosolic protein 2, glutathione S-transferase omega-1, allograft inflammatory factor 1, neurogenic locusnotch homolog protein 1, 60S ribosomal protein L21, 40S ribosomal protein S9, quinone oxidoreductase, 26Sproteasome non-ATPase regulatory subunit 14, host cell factor 1, tubulin alpha-1 chain, 26S non-ATPaseregulatory subunit 14.7 immune-related proteins are at least 5-fold different in response to mechanical stress at 400 µatm and15 change in response to mech stress after 1 month at elevated pCO2. 25

15 change in response to mech stress after 1 month at elevated pCO2.
Revisions of data for manuscript. Verified that proteins differentially expressed according to q-valueare included in the 5-fold data sets for OA and mech stress at 400. 2 proteins are not included in themech stress at 2800 data set, so I am adding them in (CGI#s 10023513 and 10005784) and redoingenrichment, heat map, and venn diagram for this treatment comparison.
September 18, 2013Proteomics: BrestTotal protein concentration using the BioRad DC assay. First needed to determine the dilution factor for the pooled whole body samples. Idiluted 3 samples (95, 38, 47) 1:2 to make further dilutions 1:5 (40 µl 1:2 + 60 µl H2O), 10 (20 1:2 + 80 H2O), 20 (10 1:2 + 90 H2O) and 40 (2.5
1:2 + 97.5 H2O). Standards are 0 µg BSA/ml, 250, 500, 750, 1000, and 1500. All samples are measured in triplicate. 5 µl of each standard orsample is aliquoted into 3 wells in a welled plate to go on the plate reader. 25 µl of solution A' is added to each well (A' = 1 ml solution A + 20 µlsolution S). 200 µl of solution B is added to each well. Plate is gently agitated for 5 s on desktop and then left to incubate at RT for 15 minutes.Plate is then loaded into reader and KC4 software is used to analyze.KC4 instructions:click "new"click "wizard"enter plate layout - sample designator, dilution factorread plateafter plate is read, click "curves" and choose M750save asexport to excelload standard curve, table with curve fit, and table with concentrations x dil.
the samples diluted 20x fell in the middle of the curve. Diluted the rest of the extracted samples 1:20 by putting 5 µl of extracted protein in 95 µlwater. Repeated same steps as above (had to use 2 plates to accommodate all the samples). A few samples had one well (out of 3) that didnot change color yellow -> blue after 15 minutes so did not enter them as samples in the plate wizard. NB: the software automatically does notinclude replicates in the mean that are way far off the range of the other 2. Plate data saved as microtraces 1 & 2 18092013.
Secondary stress: proteomicsQuery from yesterday never finished running so I killed it. Steven has a perl script that will do the same thing and he is going to fix table S6.
Working on pathway representation for manuscript. I'm playing around with ipath now. I've made a file of all the proteins expressed at least 5-fold different between treatments. Proteins that change in response to OA are in red, in response to mech stress at 400 µatm are blue, and inresponse to mech stress at 2800 µatm in yellow. If proteins change in response to more than one stress, they are the combination of thosecolors: OA + mech at 400 = purple, OA + mech at 2800 = orange, both mech = green, all 3 = black. If the proteins are expressed higher in thestress treatment(s), the lines are thickest. If they are expressed lower, the lines are thinnest. If they do not change in the same direction thelines are an intermediate weight.Made another version of the same plot, but this time all proteins have same line weight and lighter lines represent down-reg and darker linesrepresent up-reg. If down vs. up is not consistent for proteins responding to >1 treatment, then color is dark.
September 17, 2013Proteomics: BrestExtracted 6 more of Yanouk's samples as described 9/12/13: 95, 96, 97, 98, 100, 107. Samples were thawed overnight at 4°C. After secondspin, samples were left for ~1 hour on ice (layers were still separated).
Claudie showed me how to use the BIO Rad DC protein assay kit for measuring protein concentration.
Secondary Stress: proteomicsEditing supplementary table S6. Uploaded table successfully to new SQL share. I'm trying to put each spid in its own row. I found code to dothis here: http://stackoverflow.com/questions/5493510/turning-a-comma-separated-string-into-individual-rows
I'm not sure if this actually works yet because it is still running...
;with tmp(Comparison, [Enriched GO Term], PValue, [Fold Enrichment], FDR, Proteins, DataItem) as (SELECT Comparison, [Enriched GO Term], PValue, [Fold Enrichment], FDR, LEFT(Proteins, CHARINDEX(',',Proteins+',')-1),STUFF(Proteins, 1, CHARINDEX(',', Proteins+','),'')
FROM [[email protected]].[Supplementary_Table_S6.txt] UNION ALL SELECT Comparison, [Enriched GO Term], PValue, [Fold Enrichment], FDR, LEFT(Proteins, CHARINDEX(',',
26

SELECT Comparison, [Enriched GO Term], PValue, [Fold Enrichment], FDR, LEFT(Proteins, CHARINDEX(',',Proteins+',')-1),STUFF(Proteins, 1, CHARINDEX(',', Proteins+','),'')FROM tmp WHERE Proteins > '')SELECT Comparison, [Enriched GO Term], PValue, [Fold Enrichment], FDR, DataItemFROM tmpORDER BY ComparisonOPTION (maxrecursion 0)
September 16, 2013Proteomics: BrestI extracted 10 more of Yanouk's samples as described 9/12/13. Sample numbers were: 40, 44, 47, 93, 99, 92, 101, 103, 104, 109.
September 12, 2013Proteomics: BrestExtraction of Yanouk's samples from 15 days of pesticide exposure (16 pooled spat per sample): 41, 42, 38, 39, 51, 54, 45, 50,104, 106 (104and 106 were digested in lysis buffer today by YE)Previously, Yanouk homogenized the tissue samples and incubated them in lysis buffer with protease inhibitors, phosphatase inhibitors, andNaPPi (sodium pyrophosphate, another phosphatase inhibitor).Thawed samples on ice. Transferred to new tubes. Spun 1 hour, 3000xg, 4°C. Removed middle layer into 2 eppendorfs (except for 104 and106, which had smaller volumes and were aliquoted into one tube). Centrifuged at 10,000xg, 45 minutes, 4°C. (Before centrifugations,centrifuges were precooled to 4°C.)After centrifugation, if samples were in separate tubes they were combined into 1 5-mL tube, vortexed, and then aliquoted into 2 eppendorfs.Stored at -80°C.
Downloaded MKK2 sequences from multiple species/taxa. Exported as fasta to do alignment in ClustalX. Made tree in Geneious: costmatrix=Blosum62, gap open penalty = 12, gap extension penalty = 3, alignment type = global alignment with free end gaps, genetic distancemodel = jukes-cantor, tree build method = neighbor-joining, outgroup = none.
27

Tree can be found here: https://www.evernote.com/shard/s242/sh/d16f1229-e12d-446d-bfb5-e9c0489e185f/4f889303abb956068fbe8f51e8e4cee0 Invertebrates cluster together, as do mammals and fish. The one species each frombirds (duck) and reptiles (sea turtle) cluster together probably because there aren't enough representatives of each group to give good support.
September 11, 2013Proteomics: BrestWe have decided to investigate GST and MAP kinase-activated protein kinase. Used pearson's correlation coefficient to determine whichproteins change expression similarly to MAPKK. With a cutoff of |0.70|, 9 proteins are positively correlated with MAPKK and 0 are negativelycorrelated. Correlated proteins are: 3 unknown, aminoacylase 1, ras-related protein rab-10, annexin a7, tubulin beta chain, uncharacterizedoxidoreductase YajO, lysosomal alpha-glucosidase.
28

To find MAPKK isoforms, uploaded blast output for entire proteome (see 9/9/13) to SQL and renamed columns. Selected data that onlycorresponded to MAPKK as query.SELECT * FROM [[email protected]].[Brest_proteins_blastpout]WHERE Query='CGI_10003308'
4 proteins have >40% identification with MAPKK (this is an arbitrary cut-off that I have selected, itseems pretty liberal). In Geneious, aligned these protein sequences with the MAPKK sequence. Only 2 ofthem really shared sequence similarity with MAPKK in its active regions (the first 200 aa). Neither ofthese proteins were identified in the experiment as being expressed. CGI_10026336 is a map kinase-activated protein kinase 5 (the one we have identified is MAPKK 2) and CGI_10012098 is calcium/calmodulinprotein kinase 1.
September 10, 2013Proteomics: BrestI've taken stock of the remaining samples from the OA/mech stress experiment. 3 tissue samples were taken for each oyster: anterior gill,posterior gill, whole body (i.e. remaining body tissues).
Treatment #AntGill #PostGill #WholeBody Tank400 0 11 8 103B400+mech 8 4 8 103B600 16 16 16 102B600+mech 8 8 8 102B800 16 16 16 104A800+mech 8 8 8 104A1000 16 16 8 104B100+mech 8 8 8 104B1200 16 16 16 103A1200+mech 8 8 8 103A2800 1 12 8 101B2800+mech 8 4 8 101B
September 9, 2013Proteomics: BrestInstalled new version of ncbi blast (2.2.28+) on my computer. Navigated to bin folder within blast../makeblastdb -in /Users/emmatimminsschiffman/Documents/Dissertation/proteomics/Brest/oyster_v9_aa_format1.fasta -dbtype prot -out/Users/emmatimminsschiffman/Documents/Dissertation/proteomics/Brest/proteomeDB
./blastp -num_threads 2 -out /Users/emmatimminsschiffman/Documents/Dissertation/proteomics/Brest/Brest_proteins_blastpout -db/Users/emmatimminsschiffman/Documents/Dissertation/proteomics/Brest/proteomeDB -outfmt 6 -evalue 1 -max_target_seqs 100 -query/Users/emmatimminsschiffman/Documents/Dissertation/proteomics/Brest/oyster_v9_aa_format1.fasta
./blastp -num_threads 2 -out /Users/emmatimminsschiffman/Documents/Dissertation/proteomics/Brest/Brest_proteins_blastpout_12prot -db/Users/emmatimminsschiffman/Documents/Dissertation/proteomics/Brest/proteomeDB -outfmt 6 -evalue 1 -max_target_seqs 100 -query/Users/emmatimminsschiffman/Documents/Dissertation/proteomics/Brest/12proteins.fasta
Renamed column names for blastp output
SELECT
[Column1] AS [Query],
[Column2] AS [Subject],29
edit
[Column3] AS [perc ID],
[Column4] AS [align lengths],
[Column5] AS [mismatches],
[Column6] AS [gap openings],
[Column7] AS [query start],
[Column8] AS [query end],
[Column9] AS [subject start],
[Column10] AS [subject end],
[Column11] AS [e-value],
[Column12] AS [bit score]
FROM [[email protected]].[table_Brest_proteins_blastpout_12prot]
September 6, 2013Proteomics: BrestCreated list of proteins that show differences between treatment groups from OA/mech stress experiment(https://docs.google.com/spreadsheet/ccc?key=0An4PXFyBBnDEdC1VZWNGaGhIbmZjQnFrX3dhaHB0N0E#gid=0 ). These proteins have agood e-value (low), are expressed across multiple oysters, and are interesting physiologically. Entered entire protein sequences into Geneious(proteomics > Brest) and created a database of the C. gigas proteome (v9). Searched each protein sequence agains the entire proteome tolook for isoforms with the following paramters: blastp, max hits = 20, max e-value = 1e-10, word size = 3, matrix = BLOSUM62, gap cost = 111, # CPUs = 1.The first search of alpha L-fucosidase returned 13 results. The first 3 include the actual sequence and 2 very similar sequences (e-value =0).However, the 10 other sequences look pretty different from the query and I'm having a hard time deciding what a "true" isoform is. I'm going tothink about this....Aligned alpha L-fucosidase with the entire proteome using geneious alignment: cost matrix = Blosum62, gap open penalty = 12, gap extensionpenalty = 3, global slignment with free end gaps, refinement iterations = 2. This didn't work because there was not enough memory.
August 26, 2013Secondary stress: proteomicsBased on the Venn diagram (8/19/13), there are 7 proteins that are shared between the two mechanical stress responses that are not sharedwith the OA response. All of these proteins change expression in the same direction for the two mechanical stress responses (at differentpCO2). Two of them were unnanotated and both of these were down-regulated: CGI_1004918 and CGI_10027073. Prohormone-4,kyphoscoliosis peptidase (cytoskeleton), and SAM domain and HD domain-containing protein 1 (immune) were all expressed less after mechstress. Apolipophorin (lipid transport), and 60S ribosomal protein L13 were both expressed more after mech stress.
Editing supplementary file 4.Averaged NSAF across biological reps for each treatment:https://sqlshare.escience.washington.edu/sqlshare#s=query/emmats%40washington.edu/NSAF%20with%20averages%20per%20treatment Calculated fold change for each treatment comparison:(this step to be done at a later date, for now will be done in Excel)Joined with file indicating which proteins are >5-fold differently expressed:https://sqlshare.escience.washington.edu/sqlshare#s=query/emmats%40washington.edu/NSAF%20with%20averages%2C%205-fold Joined with SPID annotations:https://sqlshare.escience.washington.edu/sqlshare#s=query/emmats%40washington.edu/NSAF%20averages%2C%205-fold%2C%20SPID Joined with file indicating which proteins contribute to enrichment in >5-fold differently expressed protein sets:https://sqlshare.escience.washington.edu/sqlshare#s=query/emmats%2540washington.edu/NSAF%20with%20averages%252C%205-fold%252C%20SPIDs%252C%20enrichment&q=
Manually added column (in excel) or proteins that have q-value < 0.1.
Made xy plots for comparing expression (similar to 8/23/13). NSAF have been transformed to log(NSAF*10000). Points are color-coded 30

Made xy plots for comparing expression (similar to 8/23/13). NSAF have been transformed to log(NSAF*10000). Points are color-codedaccording to fold change.
August 23, 2013Secondary stress: proteomicsMade xy plots of the average expression across oysters for treatment comparisons: 2800 vs 400 µatm, 400 vs 400 + mech stress, 2800 vs2800 + mech stress. The blue line on the plots is the 1:1 line.
31

32

Made heat maps for each treatment comparison with all proteins (except for each set of treatments removed proteins that had 0 expressionacross all 8 oysters, on the order of ~160 proteins per dataset). The data were log transformed before making the heat maps. Oysters did notcluster within treatment groups and the heat maps were mostly entirely blue.
August 20, 2013Secondary stress: proteomicsUsed proteomics data of proteins that have at least 8 spec counts across all injections, but did not use the additional cutoff of a minimum of 2unique peptides per protein. Did NMDS and calculated q-values. NMDS showed no difference between treatments -https://www.evernote.com/shard/s242/sh/40edb789-22fc-47ca-b86b-49822b68a789/b8b11a712c5453f53bccd8d47b0f700d . Only one q-valuewas significant - response to mechanical stress at 400 µatm. This is technically an unannotated protein since the e-value = 5e-6, but it might benatterin-4 with SPID Q66S13.
August 19, 2013 33

August 19, 2013Secondary stress: ProteomicsMade a file of proteins that are at least 5-fold different (including proteins that are expressed in only one treatment and not the other). This is339 proteins across all 3 treatment comparisons. Not all of these proteins were annotated with SPIDs which could bias downstream analyses.SELECT * FROM [[email protected]].[5-fold diff expressed proteins.txt]LEFT JOIN [[email protected]].[NSAF based on avg SpC with SPIDs]
ON [[email protected]].[5-fold diff expressed proteins.txt].Protein=[[email protected]].[NSAFbased on avg SpC with SPIDs].[All Proteins]
Removed proteins from dataset that are expressed in only one oyster. This does not represent true differential expression, but rather mayreflect an anomalous oyster. This results in 69 proteins expressed higher in response to mechanical stress at 2800 µatm and 53 proteinsexpressed lower. 64 proteins are elevated in response to ocean acidification and 56 are decreased at least 5-fold. 47 proteins are higher inresponse to mechanical stress at 400 µatm and 54 are lower.
Proteins expression values were log-transformed before making heat maps. Euclidean distance was used to cluster rows (proteins) andcolumns (oysters). For OA response, low and high pCO2 oysters clustered within treatment groups. Below is the heat map for response toocean acidification. Oysters labeled NSAF.CG2-11 are high pCO2 are NSAF.CG221-230 are low pCO2.
34

Making a Venn diagram to visualize overlap of proteins involved in >5-fold response to different treatments. Put protein names correspondingto each treatment comparison in new columns.SELECT [Protein], [Comparison],(CASE WHEN [Comparison]='OA' THEN [Protein] end) AS [OA5x],(CASE WHEN [Comparison]='400MechS' THEN [Protein] end) AS [400Mech5x],(CASE WHEN [Comparison]='2800MechS' THEN [Protein] end) AS [2800Mech5x]FROM [[email protected]].[5-fold diff expressed proteins.txt]GROUP BY [Protein], [Comparison]
Redid enrichment analysis in DAVID v. 6.7. Used 5-fold proteins (n=339 across all treatments) as gene lists and entire gill proteome (n=1616)as background. Below is the enrichment plot of >5-fold OA response proteins.
35
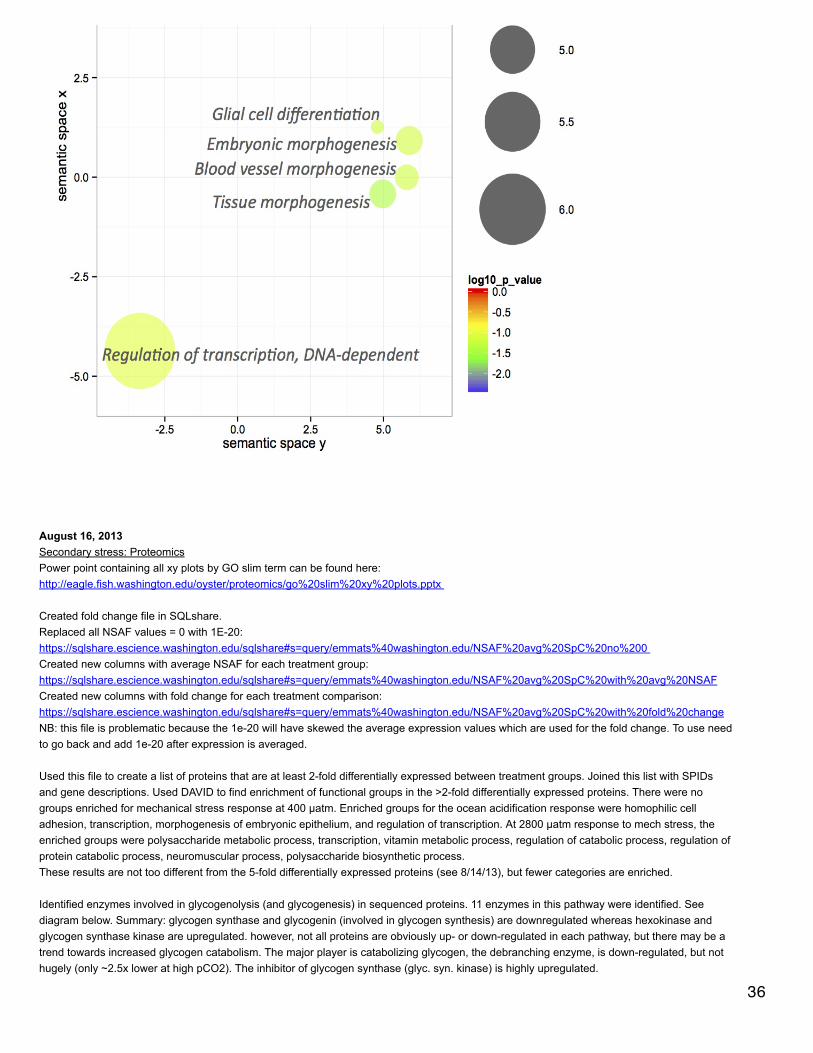
August 16, 2013Secondary stress: ProteomicsPower point containing all xy plots by GO slim term can be found here:http://eagle.fish.washington.edu/oyster/proteomics/go%20slim%20xy%20plots.pptx
Created fold change file in SQLshare.Replaced all NSAF values = 0 with 1E-20:https://sqlshare.escience.washington.edu/sqlshare#s=query/emmats%40washington.edu/NSAF%20avg%20SpC%20no%200 Created new columns with average NSAF for each treatment group:https://sqlshare.escience.washington.edu/sqlshare#s=query/emmats%40washington.edu/NSAF%20avg%20SpC%20with%20avg%20NSAFCreated new columns with fold change for each treatment comparison:https://sqlshare.escience.washington.edu/sqlshare#s=query/emmats%40washington.edu/NSAF%20avg%20SpC%20with%20fold%20changeNB: this file is problematic because the 1e-20 will have skewed the average expression values which are used for the fold change. To use needto go back and add 1e-20 after expression is averaged.
Used this file to create a list of proteins that are at least 2-fold differentially expressed between treatment groups. Joined this list with SPIDsand gene descriptions. Used DAVID to find enrichment of functional groups in the >2-fold differentially expressed proteins. There were nogroups enriched for mechanical stress response at 400 µatm. Enriched groups for the ocean acidification response were homophilic celladhesion, transcription, morphogenesis of embryonic epithelium, and regulation of transcription. At 2800 µatm response to mech stress, theenriched groups were polysaccharide metabolic process, transcription, vitamin metabolic process, regulation of catabolic process, regulation ofprotein catabolic process, neuromuscular process, polysaccharide biosynthetic process.These results are not too different from the 5-fold differentially expressed proteins (see 8/14/13), but fewer categories are enriched.
Identified enzymes involved in glycogenolysis (and glycogenesis) in sequenced proteins. 11 enzymes in this pathway were identified. Seediagram below. Summary: glycogen synthase and glycogenin (involved in glycogen synthesis) are downregulated whereas hexokinase andglycogen synthase kinase are upregulated. however, not all proteins are obviously up- or down-regulated in each pathway, but there may be atrend towards increased glycogen catabolism. The major player is catabolizing glycogen, the debranching enzyme, is down-regulated, but nothugely (only ~2.5x lower at high pCO2). The inhibitor of glycogen synthase (glyc. syn. kinase) is highly upregulated.
36
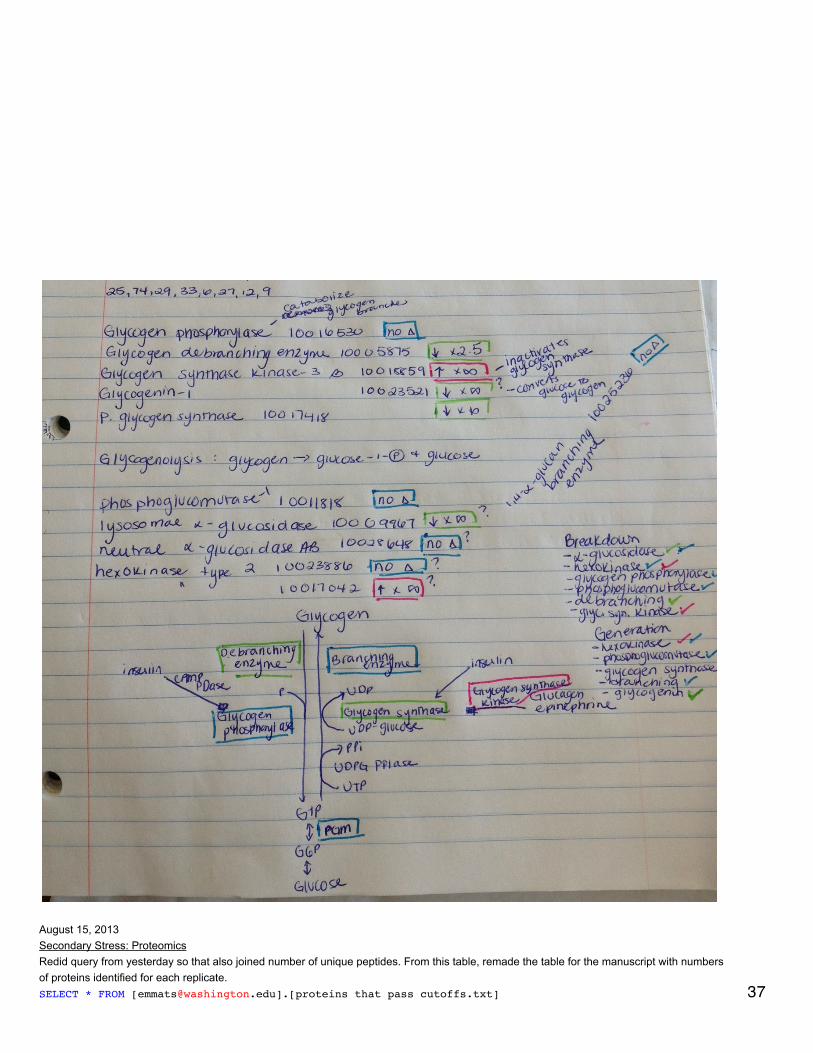
August 15, 2013Secondary Stress: ProteomicsRedid query from yesterday so that also joined number of unique peptides. From this table, remade the table for the manuscript with numbersof proteins identified for each replicate.SELECT * FROM [[email protected]].[proteins that pass cutoffs.txt] 37
LEFT JOIN [[email protected]].[NSAF tech reps]ON [[email protected]].[proteins that pass cutoffs.txt].[All Proteins]=[[email protected]].[NSAFtech reps].[All Proteins]LEFT JOIN [[email protected]].[Average spec counts with cutoffs]ON [[email protected]].[proteins that pass cutoffs.txt].[All Proteins]=[[email protected]].[Average spec counts with cutoffs].[All Proteins]
Annotated file of NSAF expression values with SPIDs with GO and GO Slim terms.SELECT distinct * FROM [[email protected]].[NSAF based on avg SpC with SPIDs]LEFT JOIN [[email protected]].[SPID_GOnumber.txt]ON [[email protected]].[NSAF based on avg SpC with SPIDs].SPID=[[email protected]].[SPID_GOnumber.txt].A0A000
SELECT distinct * FROM [[email protected]].[NSAF avg SpC with GO]LEFT JOIN [[email protected]].[GO_to_GOslim]ON [[email protected]].[NSAF avg SpC with GO].[GO:0003824]=[[email protected]].[GO_to_GOslim].GO_id
Keep only unique entries that are biological processesSELECT DISTINCT * FROM [[email protected]].[NSAF avg SpC with GO slim]WHERE [aspect]='P'
Created file of unique GO Slim associations with proteins
SELECT DISTINCT [All Proteins], [NSAF CG2], [NSAF CG5], [NSAF CG8], [NSAF CG11], [NSAF CG26], [NSAFCG29], [NSAF CG32], [NSAF CG35], [NSAF CG221], [NSAF CG224], [NSAF CG227], [NSAF CG230], [NSAF CG242],[NSAF CG245], [NSAF CG248], [NSAF CG251], [SPID], [evalue], [Gene Name], [GOSlim_bin]
FROM [[email protected]].[NSAF avg SpC biological processes]
August 14, 2013Secondary stress: ProteomicsAnnotated entire gill proteome (just proteins that made cutoffs of at least 2 unique peptides and at least 8 spec counts) with SPIDs.
SELECT * FROM [[email protected]].[NSAF avg SpC.csv]
LEFT JOIN [[email protected]].[table_TJGR_Gene_SPID_evalue_Description.txt]
ON [[email protected]].[NSAF avg SpC.csv].[All Proteins]=[[email protected]].[table_TJGR_Gene_SPID_evalue_Description.txt].[CGI Protein]
Created list of unique SPIDs corresponding to gill proteome and used this as background in DAVID. Created plots in Revigo of enrichedcategories of differentially expressed proteins for treatment comparisons (differentially = >5-fold up or down).Enrichment of 5-fold different OA response proteins:https://www.evernote.com/shard/s242/sh/151a6b3c-65cb-4308-8c19-77a50dc099a4/61f71f805da2d42e7b5e4406226121e0 Enrichment of 5-fold different mechanical stress response proteins at 400 µatm:https://www.evernote.com/shard/s242/sh/3938fc75-b118-4f71-a204-c50c03dfaf71/0513e7d89c29505c3670d2f67cebda13Enrichment of 5-fold different mechanical stress response proteins at 2800 µatm:https://www.evernote.com/shard/s242/sh/3fc062ba-efc2-4d24-92df-4db038f31429/d74514ba124e1b3c7a928702829fa93d
Joined together list of 1616 proteins for final analysis with technical replicate data to create table of number of proteins identified in eachreplicate...This is incorrect because some of the proteins in the technical replicate data have <2 unique peptides. Need to fix this discrepancyand redo.
August 13, 2013Secondary stress: ProteomicsAnnotated proteins with >5-fold change between treatment groups with SPIDs in SQLshare.SELECT * FROM [[email protected]].[greater than 5 fold change.txt]LEFT JOIN [[email protected]].[table_TJGR_Gene_SPID_evalue_Description.txt] 38
LEFT JOIN [[email protected]].[table_TJGR_Gene_SPID_evalue_Description.txt]ON [[email protected]].[greater than 5 fold change.txt].Protein=[[email protected]].[table_TJGR_Gene_SPID_evalue_Description.txt].[CGI Protein]
Removed annotations with evalue >1E-10. Some SPIDs didn't have protein descriptions so manually filled those in using Uniprot website.
August 12, 2013Secondary stress: Proteomicsusing qprot to find differentially expressed proteinsDownloaded and installed GNU (http://www.gnu.org/software/gsl/ )../configuremake allsudo make installThen navigated to qprot 1.2.2 folder and did sudo make all. In qprot bin folder ran: ./qprot-param qspecOA 2000 10000 1. Got Segmentation error after running above code. NB: command line does not seem to want <>, extension on input file, or indication of numberof threads to run.
Continuation of analysis of NSAF data for spec counts averaged across technical replicates.In Excel, got p-values for differential expression between 400 and 2800 µatm and ran through q-value in R. One protein had a q-value ~0.008and another had a q-value ~0.08, all others >0.3.To get fold change, found average expression within each treatment group. If average was 0, changed to 1E-20 (minimum average for eachtreatment group - 400 and 2800 µatm - was E-6). Divided average expression between treatment groups to get fold change. 193 proteins were
expressed >5-fold more at 2800 µatm and 175 were expression >5-fold less at 2800 µatm. For mechanical stress at 400 µatm, 190 were up-regulated at least 5-fold and 192 were down-regulated at least 5-fold. 2 proteins had q-value = 0.05 in response to mech stress, the rest were>0.46. 205 proteins were >5-fold upregulated in response to mech stress at 2800 µatm and 168 were >5-fold down-regulated. 9 proteins had aq-value <0.07 (5 were <0.05) in response to mechanical stress at 2800 µatm.
August 8, 2013Secondary stress: ProteomicsTo create an input file for qspec, uploaded all proteins (n=1616) that pass spectral count cutoffs to SQLshare. Joined with protein lengths andaverage SpC per protein. Still couldn't get qspec online to accept my input file and could not get the command line to work.
In R, plotted expression at high pCO2 against low pCO2 with 95% CIs and line of best fit. This is to identify potentially differentially expressedproteins. I'm not sure why so many proteins fall outside the 95% CI polygon, more to come...
39

40

August 6, 2013Secondary stress: ProteomicsContinued analysis of NSAF data with technical replicates separated so n=12 per treatment instead of n=4. There was a significant proteomicshift between treatment groups using this approach (p<0.05 ANOSIM).
Redid workflow to produce NSAF based on average of spectral counts across technical replicates instead of summing them. In Excel, deletedany NSAF values (per oyster) for proteins that had <2 unique peptide matches (1616 proteins). With this new calculation of NSAF (tech repsaveraged for each oyster) there is no significant difference in proteome expression between treatment comparisons (ANOSIM p>0.05).
41
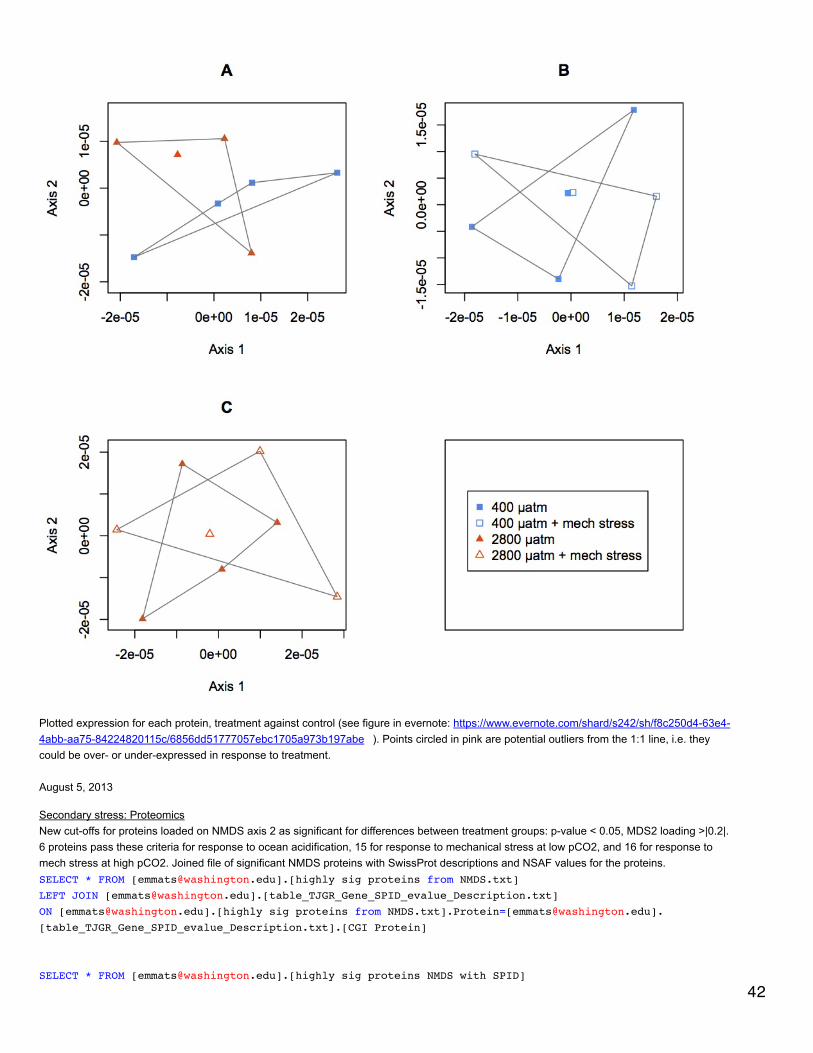
Plotted expression for each protein, treatment against control (see figure in evernote: https://www.evernote.com/shard/s242/sh/f8c250d4-63e4-4abb-aa75-84224820115c/6856dd51777057ebc1705a973b197abe ). Points circled in pink are potential outliers from the 1:1 line, i.e. theycould be over- or under-expressed in response to treatment.
August 5, 2013
Secondary stress: ProteomicsNew cut-offs for proteins loaded on NMDS axis 2 as significant for differences between treatment groups: p-value < 0.05, MDS2 loading >|0.2|.6 proteins pass these criteria for response to ocean acidification, 15 for response to mechanical stress at low pCO2, and 16 for response tomech stress at high pCO2. Joined file of significant NMDS proteins with SwissProt descriptions and NSAF values for the proteins.SELECT * FROM [[email protected]].[highly sig proteins from NMDS.txt]LEFT JOIN [[email protected]].[table_TJGR_Gene_SPID_evalue_Description.txt]ON [[email protected]].[highly sig proteins from NMDS.txt].Protein=[[email protected]].[table_TJGR_Gene_SPID_evalue_Description.txt].[CGI Protein]
SELECT * FROM [[email protected]].[highly sig proteins NMDS with SPID]
42
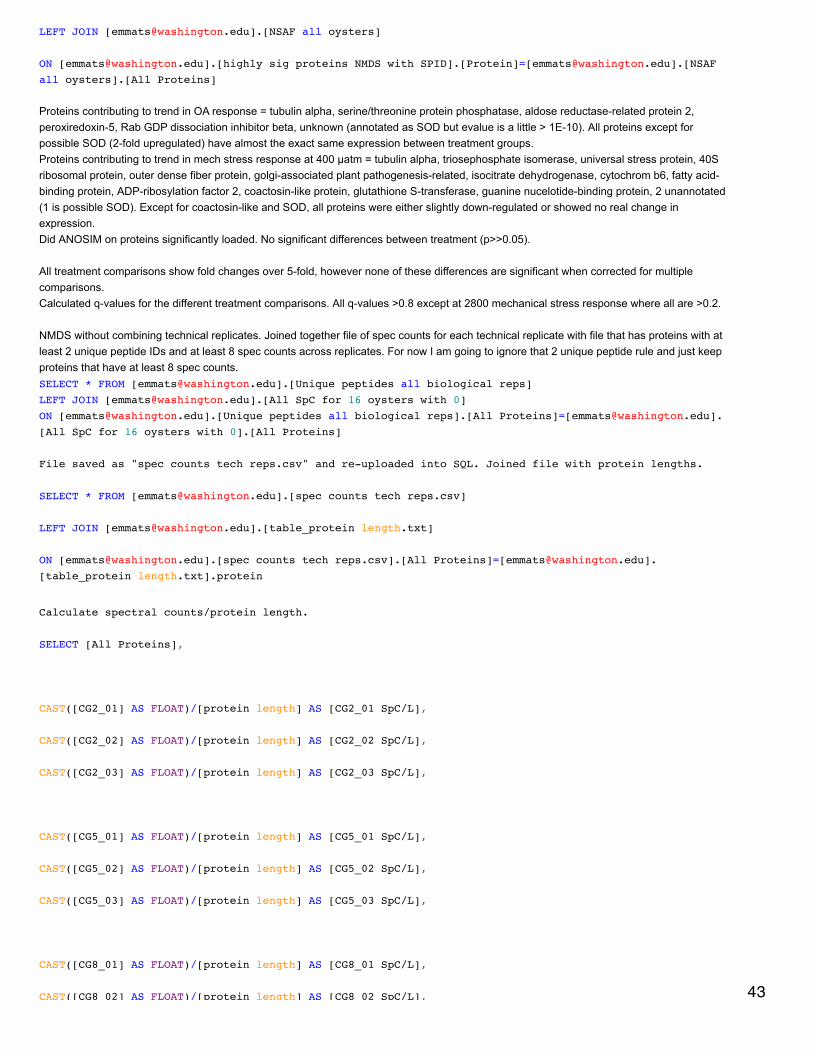
LEFT JOIN [[email protected]].[NSAF all oysters]
ON [[email protected]].[highly sig proteins NMDS with SPID].[Protein]=[[email protected]].[NSAFall oysters].[All Proteins]
Proteins contributing to trend in OA response = tubulin alpha, serine/threonine protein phosphatase, aldose reductase-related protein 2,peroxiredoxin-5, Rab GDP dissociation inhibitor beta, unknown (annotated as SOD but evalue is a little > 1E-10). All proteins except forpossible SOD (2-fold upregulated) have almost the exact same expression between treatment groups.Proteins contributing to trend in mech stress response at 400 µatm = tubulin alpha, triosephosphate isomerase, universal stress protein, 40Sribosomal protein, outer dense fiber protein, golgi-associated plant pathogenesis-related, isocitrate dehydrogenase, cytochrom b6, fatty acid-binding protein, ADP-ribosylation factor 2, coactosin-like protein, glutathione S-transferase, guanine nucelotide-binding protein, 2 unannotated(1 is possible SOD). Except for coactosin-like and SOD, all proteins were either slightly down-regulated or showed no real change inexpression.Did ANOSIM on proteins significantly loaded. No significant differences between treatment (p>>0.05).
All treatment comparisons show fold changes over 5-fold, however none of these differences are significant when corrected for multiplecomparisons.Calculated q-values for the different treatment comparisons. All q-values >0.8 except at 2800 mechanical stress response where all are >0.2.
NMDS without combining technical replicates. Joined together file of spec counts for each technical replicate with file that has proteins with atleast 2 unique peptide IDs and at least 8 spec counts across replicates. For now I am going to ignore that 2 unique peptide rule and just keepproteins that have at least 8 spec counts.SELECT * FROM [[email protected]].[Unique peptides all biological reps]LEFT JOIN [[email protected]].[All SpC for 16 oysters with 0]ON [[email protected]].[Unique peptides all biological reps].[All Proteins]=[[email protected]].[All SpC for 16 oysters with 0].[All Proteins]
File saved as "spec counts tech reps.csv" and re-uploaded into SQL. Joined file with protein lengths.
SELECT * FROM [[email protected]].[spec counts tech reps.csv]
LEFT JOIN [[email protected]].[table_protein length.txt]
ON [[email protected]].[spec counts tech reps.csv].[All Proteins]=[[email protected]].[table_protein length.txt].protein
Calculate spectral counts/protein length.
SELECT [All Proteins],
CAST([CG2_01] AS FLOAT)/[protein length] AS [CG2_01 SpC/L],
CAST([CG2_02] AS FLOAT)/[protein length] AS [CG2_02 SpC/L],
CAST([CG2_03] AS FLOAT)/[protein length] AS [CG2_03 SpC/L],
CAST([CG5_01] AS FLOAT)/[protein length] AS [CG5_01 SpC/L],
CAST([CG5_02] AS FLOAT)/[protein length] AS [CG5_02 SpC/L],
CAST([CG5_03] AS FLOAT)/[protein length] AS [CG5_03 SpC/L],
CAST([CG8_01] AS FLOAT)/[protein length] AS [CG8_01 SpC/L],
CAST([CG8_02] AS FLOAT)/[protein length] AS [CG8_02 SpC/L], 43

CAST([CG8_02] AS FLOAT)/[protein length] AS [CG8_02 SpC/L],
CAST([CG8_03] AS FLOAT)/[protein length] AS [CG8_03 SpC/L],
CAST([CG11_01] AS FLOAT)/[protein length] AS [CG11_01 SpC/L],
CAST([CG11_02] AS FLOAT)/[protein length] AS [CG11_02 SpC/L],
CAST([CG11_03] AS FLOAT)/[protein length] AS [CG11_03 SpC/L],
CAST([CG26_01] AS FLOAT)/[protein length] AS [CG26_01 SpC/L],
CAST([CG26_02] AS FLOAT)/[protein length] AS [CG26_02 SpC/L],
CAST([CG26_03] AS FLOAT)/[protein length] AS [CG26_03 SpC/L],
CAST([CG29_01] AS FLOAT)/[protein length] AS [CG29_01 SpC/L],
CAST([CG29_02] AS FLOAT)/[protein length] AS [CG29_02 SpC/L],
CAST([CG29_03] AS FLOAT)/[protein length] AS [CG29_03 SpC/L],
CAST([CG32_01] AS FLOAT)/[protein length] AS [CG32_01 SpC/L],
CAST([CG32_02] AS FLOAT)/[protein length] AS [CG32_02 SpC/L],
CAST([CG32_03] AS FLOAT)/[protein length] AS [CG32_03 SpC/L],
CAST([CG35_01] AS FLOAT)/[protein length] AS [CG35_01 SpC/L],
CAST([CG35_02] AS FLOAT)/[protein length] AS [CG35_02 SpC/L],
CAST([CG35_03] AS FLOAT)/[protein length] AS [CG35_03 SpC/L],
CAST([CG221_01] AS FLOAT)/[protein length] AS [CG221_01 SpC/L],
CAST([CG221_02] AS FLOAT)/[protein length] AS [CG221_02 SpC/L],
CAST([CG221_03] AS FLOAT)/[protein length] AS [CG221_03 SpC/L],
CAST([CG224_01] AS FLOAT)/[protein length] AS [CG224_01 SpC/L],
CAST([CG224_02] AS FLOAT)/[protein length] AS [CG224_02 SpC/L],
CAST([CG224_03] AS FLOAT)/[protein length] AS [CG224_03 SpC/L],
44
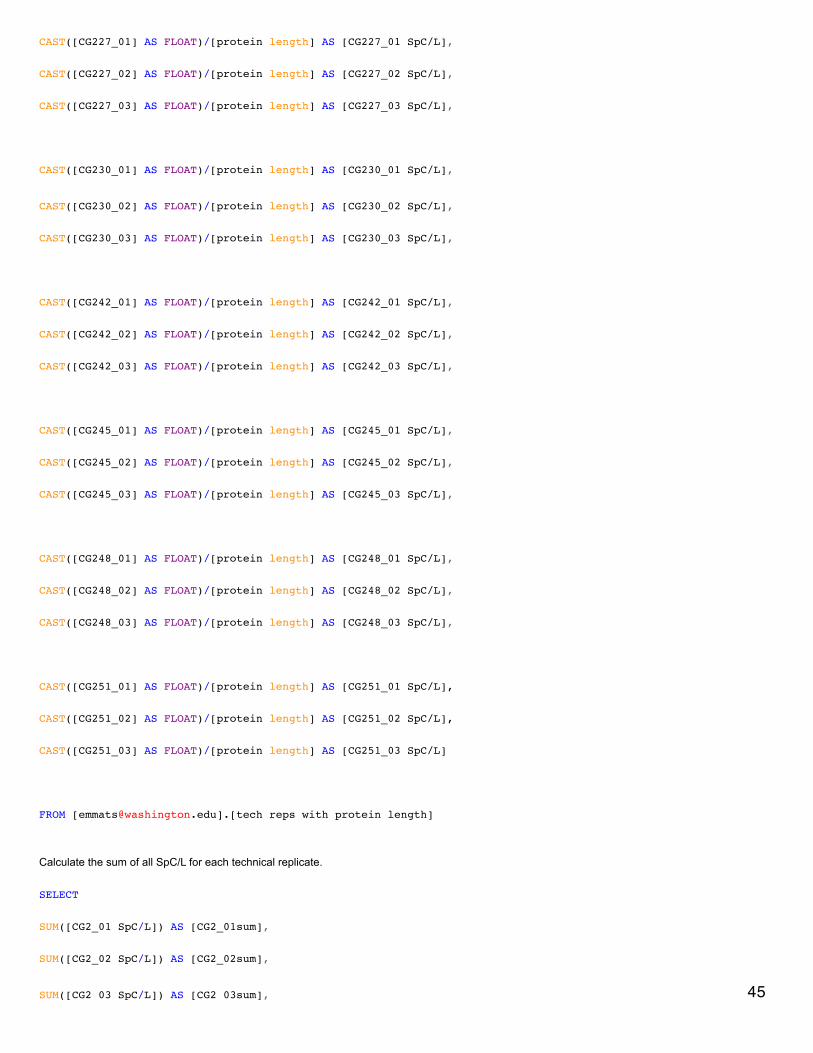
CAST([CG227_01] AS FLOAT)/[protein length] AS [CG227_01 SpC/L],
CAST([CG227_02] AS FLOAT)/[protein length] AS [CG227_02 SpC/L],
CAST([CG227_03] AS FLOAT)/[protein length] AS [CG227_03 SpC/L],
CAST([CG230_01] AS FLOAT)/[protein length] AS [CG230_01 SpC/L],
CAST([CG230_02] AS FLOAT)/[protein length] AS [CG230_02 SpC/L],
CAST([CG230_03] AS FLOAT)/[protein length] AS [CG230_03 SpC/L],
CAST([CG242_01] AS FLOAT)/[protein length] AS [CG242_01 SpC/L],
CAST([CG242_02] AS FLOAT)/[protein length] AS [CG242_02 SpC/L],
CAST([CG242_03] AS FLOAT)/[protein length] AS [CG242_03 SpC/L],
CAST([CG245_01] AS FLOAT)/[protein length] AS [CG245_01 SpC/L],
CAST([CG245_02] AS FLOAT)/[protein length] AS [CG245_02 SpC/L],
CAST([CG245_03] AS FLOAT)/[protein length] AS [CG245_03 SpC/L],
CAST([CG248_01] AS FLOAT)/[protein length] AS [CG248_01 SpC/L],
CAST([CG248_02] AS FLOAT)/[protein length] AS [CG248_02 SpC/L],
CAST([CG248_03] AS FLOAT)/[protein length] AS [CG248_03 SpC/L],
CAST([CG251_01] AS FLOAT)/[protein length] AS [CG251_01 SpC/L],
CAST([CG251_02] AS FLOAT)/[protein length] AS [CG251_02 SpC/L],
CAST([CG251_03] AS FLOAT)/[protein length] AS [CG251_03 SpC/L]
FROM [[email protected]].[tech reps with protein length]
Calculate the sum of all SpC/L for each technical replicate.
SELECT
SUM([CG2_01 SpC/L]) AS [CG2_01sum],
SUM([CG2_02 SpC/L]) AS [CG2_02sum],
SUM([CG2_03 SpC/L]) AS [CG2_03sum], 45

SUM([CG2_03 SpC/L]) AS [CG2_03sum],
SUM([CG5_01 SpC/L]) AS [CG5_01sum],
SUM([CG5_02 SpC/L]) AS [CG5_02sum],
SUM([CG5_03 SpC/L]) AS [CG5_03sum],
SUM([CG8_01 SpC/L]) AS [CG8_01sum],
SUM([CG8_02 SpC/L]) AS [CG8_02sum],
SUM([CG8_03 SpC/L]) AS [CG8_03sum],
SUM([CG11_01 SpC/L]) AS [CG11_01sum],
SUM([CG11_02 SpC/L]) AS [CG11_02sum],
SUM([CG11_03 SpC/L]) AS [CG11_03sum],
SUM([CG26_01 SpC/L]) AS [CG26_01sum],
SUM([CG26_02 SpC/L]) AS [CG26_02sum],
SUM([CG26_03 SpC/L]) AS [CG26_03sum],
SUM([CG29_01 SpC/L]) AS [CG29_01sum],
SUM([CG29_02 SpC/L]) AS [CG29_02sum],
SUM([CG29_03 SpC/L]) AS [CG29_03sum],
SUM([CG32_01 SpC/L]) AS [CG32_01sum],
SUM([CG32_02 SpC/L]) AS [CG32_02sum],
SUM([CG32_03 SpC/L]) AS [CG32_03sum],
SUM([CG35_01 SpC/L]) AS [CG35_01sum],
SUM([CG35_02 SpC/L]) AS [CG35_02sum],
SUM([CG35_03 SpC/L]) AS [CG35_03sum],
SUM([CG221_01 SpC/L]) AS [CG221_01sum],
SUM([CG221_02 SpC/L]) AS [CG221_02sum],
SUM([CG221_03 SpC/L]) AS [CG221_03sum],
SUM([CG224_01 SpC/L]) AS [CG224_01sum],
SUM([CG224_02 SpC/L]) AS [CG224_02sum],
SUM([CG224_03 SpC/L]) AS [CG224_03sum],
SUM([CG227_01 SpC/L]) AS [CG227_01sum],
SUM([CG227_02 SpC/L]) AS [CG227_02sum],
SUM([CG227_03 SpC/L]) AS [CG227_03sum], 46
SUM([CG230_01 SpC/L]) AS [CG230_01sum],
SUM([CG230_02 SpC/L]) AS [CG230_02sum],
SUM([CG230_03 SpC/L]) AS [CG230_03sum],
SUM([CG242_01 SpC/L]) AS [CG242_01sum],
SUM([CG242_02 SpC/L]) AS [CG242_02sum],
SUM([CG242_03 SpC/L]) AS [CG242_03sum],
SUM([CG245_01 SpC/L]) AS [CG245_01sum],
SUM([CG245_02 SpC/L]) AS [CG245_02sum],
SUM([CG245_03 SpC/L]) AS [CG245_03sum],
SUM([CG248_01 SpC/L]) AS [CG248_01sum],
SUM([CG248_02 SpC/L]) AS [CG248_02sum],
SUM([CG248_03 SpC/L]) AS [CG248_03sum],
SUM([CG251_01 SpC/L]) AS [CG251_01sum],
SUM([CG251_02 SpC/L]) AS [CG251_02sum],
SUM([CG251_03 SpC/L]) AS [CG251_03sum]
FROM [[email protected]].[tech reps SpC-L]
Calculated NSAF
SELECT [All Proteins],
SPC.[CG2_01 SpC/L]/allspc.[CG2_01sum] AS [CG2_01 NSAF],
SPC.[CG2_02 SpC/L]/allspc.[CG2_02sum] AS [CG2_02 NSAF],
SPC.[CG2_03 SpC/L]/allspc.[CG2_03sum] AS [CG2_03 NSAF],
SPC.[CG5_01 SpC/L]/allspc.[CG5_01sum] AS [CG5_01 NSAF],
SPC.[CG5_02 SpC/L]/allspc.[CG5_02sum] AS [CG5_02 NSAF],
SPC.[CG5_03 SpC/L]/allspc.[CG5_03sum] AS [CG5_03 NSAF],
SPC.[CG8_01 SpC/L]/allspc.[CG8_01sum] AS [CG8_01 NSAF],
SPC.[CG8_02 SpC/L]/allspc.[CG8_02sum] AS [CG8_02 NSAF],
SPC.[CG8_03 SpC/L]/allspc.[CG8_03sum] AS [CG8_03 NSAF],
SPC.[CG11_01 SpC/L]/allspc.[CG11_01sum] AS [CG11_01 NSAF],
SPC.[CG11_02 SpC/L]/allspc.[CG11_02sum] AS [CG11_02 NSAF],
SPC.[CG11_03 SpC/L]/allspc.[CG11_03sum] AS [CG11_03 NSAF],
SPC.[CG26_01 SpC/L]/allspc.[CG26_01sum] AS [CG26_01 NSAF],47
SPC.[CG26_01 SpC/L]/allspc.[CG26_01sum] AS [CG26_01 NSAF],
SPC.[CG26_02 SpC/L]/allspc.[CG26_02sum] AS [CG26_02 NSAF],
SPC.[CG26_03 SpC/L]/allspc.[CG26_03sum] AS [CG26_03 NSAF],
SPC.[CG29_01 SpC/L]/allspc.[CG29_01sum] AS [CG29_01 NSAF],
SPC.[CG29_02 SpC/L]/allspc.[CG29_02sum] AS [CG29_02 NSAF],
SPC.[CG29_03 SpC/L]/allspc.[CG29_03sum] AS [CG29_03 NSAF],
SPC.[CG32_01 SpC/L]/allspc.[CG32_01sum] AS [CG32_01 NSAF],
SPC.[CG32_02 SpC/L]/allspc.[CG32_02sum] AS [CG32_02 NSAF],
SPC.[CG32_03 SpC/L]/allspc.[CG32_03sum] AS [CG32_03 NSAF],
SPC.[CG35_01 SpC/L]/allspc.[CG35_01sum] AS [CG35_01 NSAF],
SPC.[CG35_02 SpC/L]/allspc.[CG35_02sum] AS [CG35_02 NSAF],
SPC.[CG35_03 SpC/L]/allspc.[CG35_03sum] AS [CG35_03 NSAF],
SPC.[CG221_01 SpC/L]/allspc.[CG221_01sum] AS [CG221_01 NSAF],
SPC.[CG221_02 SpC/L]/allspc.[CG221_02sum] AS [CG221_02 NSAF],
SPC.[CG221_03 SpC/L]/allspc.[CG221_03sum] AS [CG221_03 NSAF],
SPC.[CG224_01 SpC/L]/allspc.[CG224_01sum] AS [CG224_01 NSAF],
SPC.[CG224_02 SpC/L]/allspc.[CG224_02sum] AS [CG224_02 NSAF],
SPC.[CG224_03 SpC/L]/allspc.[CG224_03sum] AS [CG224_03 NSAF],
SPC.[CG227_01 SpC/L]/allspc.[CG227_01sum] AS [CG227_01 NSAF],
SPC.[CG227_02 SpC/L]/allspc.[CG227_02sum] AS [CG227_02 NSAF],
SPC.[CG227_03 SpC/L]/allspc.[CG227_03sum] AS [CG227_03 NSAF],
SPC.[CG230_01 SpC/L]/allspc.[CG230_01sum] AS [CG230_01 NSAF],
SPC.[CG230_02 SpC/L]/allspc.[CG230_02sum] AS [CG230_02 NSAF],
SPC.[CG230_03 SpC/L]/allspc.[CG230_03sum] AS [CG230_03 NSAF],
SPC.[CG242_01 SpC/L]/allspc.[CG242_01sum] AS [CG242_01 NSAF],
SPC.[CG242_02 SpC/L]/allspc.[CG242_02sum] AS [CG242_02 NSAF],
SPC.[CG242_03 SpC/L]/allspc.[CG242_03sum] AS [CG242_03 NSAF],
SPC.[CG245_01 SpC/L]/allspc.[CG245_01sum] AS [CG245_01 NSAF],
SPC.[CG245_02 SpC/L]/allspc.[CG245_02sum] AS [CG245_02 NSAF],
SPC.[CG245_03 SpC/L]/allspc.[CG245_03sum] AS [CG245_03 NSAF],
SPC.[CG248_01 SpC/L]/allspc.[CG248_01sum] AS [CG248_01 NSAF], 48

SPC.[CG248_02 SpC/L]/allspc.[CG248_02sum] AS [CG248_02 NSAF],
SPC.[CG248_03 SpC/L]/allspc.[CG248_03sum] AS [CG248_03 NSAF],
SPC.[CG251_01 SpC/L]/allspc.[CG251_01sum] AS [CG251_01 NSAF],
SPC.[CG251_02 SpC/L]/allspc.[CG251_02sum] AS [CG251_02 NSAF],
SPC.[CG251_03 SpC/L]/allspc.[CG251_03sum] AS [CG251_03 NSAF]
FROM [[email protected]].[tech reps SpC-L] spc,
[[email protected]].[SpC-L sum tech reps] allspc
49
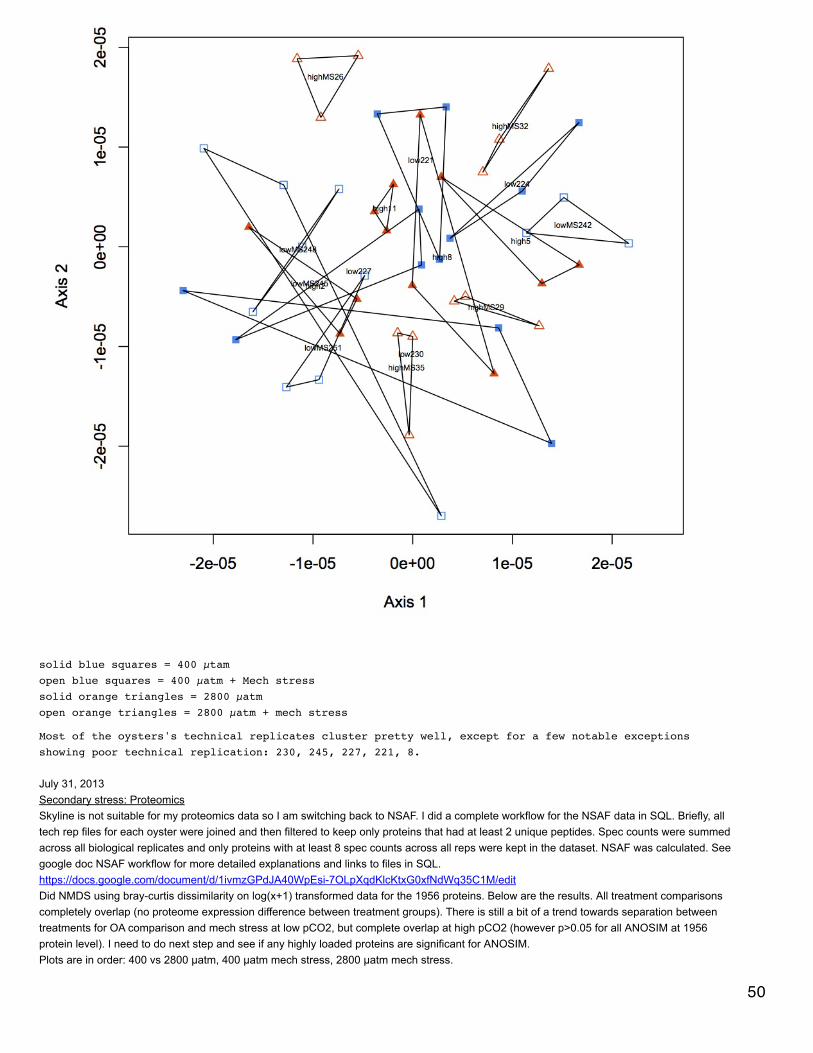
solid blue squares = 400 µtamopen blue squares = 400 µatm + Mech stresssolid orange triangles = 2800 µatmopen orange triangles = 2800 µatm + mech stress
Most of the oysters's technical replicates cluster pretty well, except for a few notable exceptionsshowing poor technical replication: 230, 245, 227, 221, 8.
July 31, 2013Secondary stress: ProteomicsSkyline is not suitable for my proteomics data so I am switching back to NSAF. I did a complete workflow for the NSAF data in SQL. Briefly, alltech rep files for each oyster were joined and then filtered to keep only proteins that had at least 2 unique peptides. Spec counts were summedacross all biological replicates and only proteins with at least 8 spec counts across all reps were kept in the dataset. NSAF was calculated. Seegoogle doc NSAF workflow for more detailed explanations and links to files in SQL.https://docs.google.com/document/d/1ivmzGPdJA40WpEsi-7OLpXqdKlcKtxG0xfNdWq35C1M/editDid NMDS using bray-curtis dissimilarity on log(x+1) transformed data for the 1956 proteins. Below are the results. All treatment comparisonscompletely overlap (no proteome expression difference between treatment groups). There is still a bit of a trend towards separation betweentreatments for OA comparison and mech stress at low pCO2, but complete overlap at high pCO2 (however p>0.05 for all ANOSIM at 1956protein level). I need to do next step and see if any highly loaded proteins are significant for ANOSIM.Plots are in order: 400 vs 2800 µatm, 400 µatm mech stress, 2800 µatm mech stress.
50

51
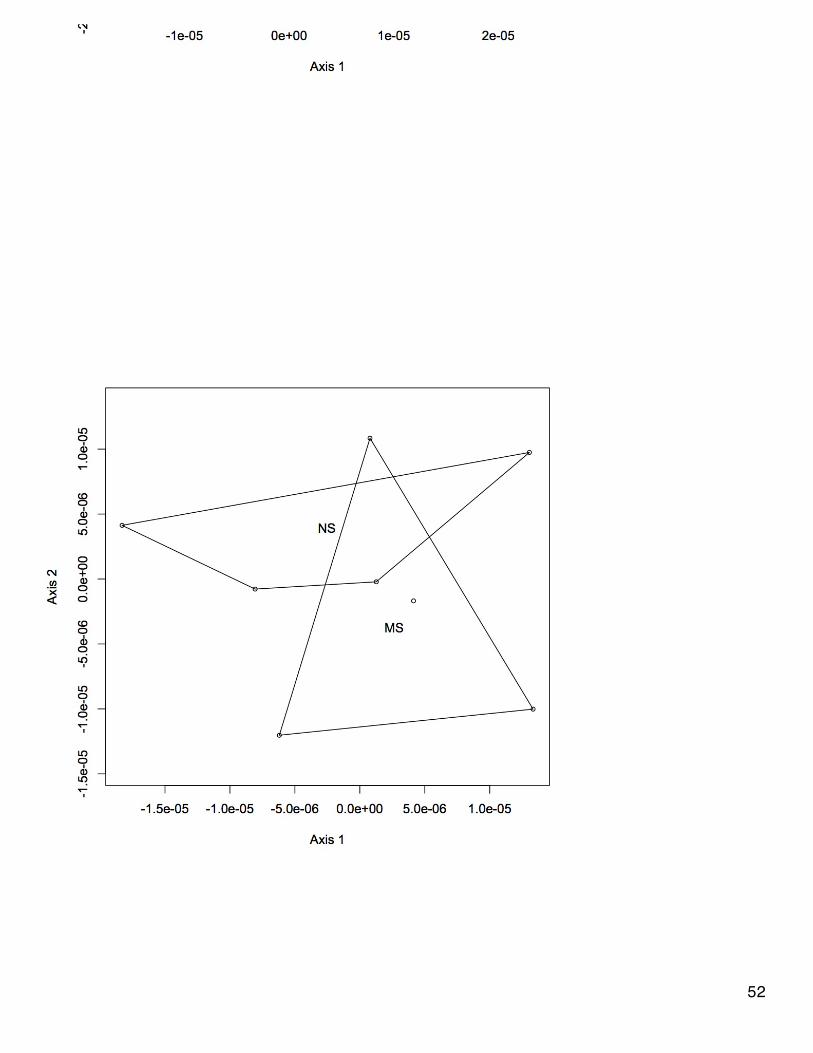
52

July 29, 2013Secondary stress: proteomicsWith the same cut-offs for significance for loadings as before (p-value < 0.01, MDS2 loading >0.9), 35 proteins contribute to the OA response,37 proteins contribute to the mechanical stress response at 400 µatm, and 28 contribute to mech stress response at 2800 µatm (although thegroups almost completely overlap on the NMDS). ANOSIM at level of all 2677 proteins is still not significant for all 3 treatment comparisons.Joined file of sig NMDS proteins with SPID descriptions and protein expression values.SELECT * FROM [[email protected]].[sig proteins from NMDS.csv]LEFT JOIN [table_TJGR_Gene_SPID_evalue_Description.txt]ON [[email protected]].[sig proteins from NMDS.csv].protein=[table_TJGR_Gene_SPID_evalue_Description.txt].[CGI protein]
53

SELECT * FROM [[email protected]].[sig NMDS proteins with SPID]
LEFT JOIN [3 peps per protein area avgd]
ON [sig NMDS proteins with SPID].protein=[3 peps per protein area avgd].protein
For ANOSIM based on just the proteins with sig loadings on the second MDS axis, the proteomic expression between high and high MS is stillnon sig, non significant for MS response at low pCO2 and significant response to OA.Made a heat map of the 35 proteins in the OA response (annotated and unannotated).
July 26, 2013Secondary stress: proteomicsOriginal input file had some peptides of charge state >2, so had to redo everything with fixed input file.SR discovered that for some proteins, a peptide was sequenced multiple times and so had multiple expression values. From the unique proteinassociations file in SQLshare, I summed the expression values for all identical peptides.SELECT [peptide sequence], SUM([2_01 TotalArea]) AS CG2_01, SUM([2_02 TotalArea]) AS CG2_02, SUM([2_03TotalArea]) AS CG2_03, SUM([5_01 TotalArea]) AS CG5_01, SUM([5_02 TotalArea]) AS CG5_02, SUM([5_03TotalArea]) AS CG5_03, SUM([8_01 TotalArea]) AS CG8_01, SUM([8_02 TotalArea]) AS CG8_02, SUM([8_03TotalArea]) AS CG8_03, SUM([11_01 TotalArea]) AS CG11_01, SUM([11_02 TotalArea]) AS CG11_02, SUM([11_03
TotalArea]) AS CG11_03, SUM([26_01 TotalArea]) AS CG26_01, SUM([26_02 TotalArea]) AS CG26_02, SUM([26_03TotalArea]) AS CG26_03, SUM([29_01 TotalArea]) AS CG29_01, SUM([29_02 TotalArea]) AS CG29_02, SUM([29_03TotalArea]) AS CG29_03, SUM([32_01 TotalArea]) AS CG32_01, SUM([32_02 TotalArea]) AS CG32_02, SUM([32_03TotalArea]) AS CG32_03, SUM([35_01 TotalArea]) AS CG35_01, SUM([35_02 TotalArea]) AS CG35_02, SUM([35_03TotalArea]) AS CG35_03, SUM([221_01 TotalArea]) AS CG221_01, SUM([221_02 TotalArea]) AS CG221_02,SUM([221_03 TotalArea]) AS CG221_03, SUM([224_01 TotalArea]) AS CG224_01, SUM([224_02 TotalArea]) ASCG224_02, SUM([224_03 TotalArea]) AS CG224_03, SUM([227_01 TotalArea]) AS CG227_01, SUM([227_02TotalArea]) AS CG227_02, SUM([227_03 TotalArea]) AS CG227_03, SUM([230_01 TotalArea]) AS CG230_01,SUM([230_02 TotalArea]) AS CG230_02, SUM([230_03 TotalArea]) AS CG230_03,SUM([242_01 TotalArea]) AS CG242_01, SUM([242_02 TotalArea]) AS CG242_02, SUM([242_03 TotalArea]) ASCG242_03, SUM([245_01 TotalArea]) AS CG245_01, SUM([245_02 TotalArea]) AS CG245_02, SUM([245_03TotalArea]) AS CG245_03, SUM([248_01 TotalArea]) AS CG248_01, SUM([248_02 TotalArea]) AS CG248_02,SUM([248_03 TotalArea]) AS CG248_03, SUM([251_01 TotalArea]) AS CG251_01, SUM([251_02 TotalArea]) ASCG251_02, SUM([251_03 TotalArea]) AS CG251_03
FROM [[email protected]].[unique protein associations]GROUP BY [peptide sequence]
The file now needs to be rejoined with the unique peptide-protein association file. 54

SELECT * FROM [[email protected]].[Total peptide areas]
LEFT JOIN (SELECT protein, [peptide sequence] FROM [[email protected]].[unique proteinassociations])X
ON [[email protected]].[Total peptide areas].[peptide sequence]= X.[peptide sequence]
Now I need to redo all the analyses...(Files saved in one folder titled Re-analysis 072613)To calculate q-values for all the proteins I did t-tests between treatments: 400 vs. 2800, 400 withmechanical stress, and 2800 with mechanical stress. 24 proteins were differentially expressed in responseto OA (q-value <0.20), 9 were differentially expressed in response to mech stress at 400 µatm, and 0 weredifferentially expressed in response to mech stress at 2800 µatm. Joined these differentially expressedproteins with swissprot IDs and gene descriptions.
SELECT * FROM [[email protected]].[sig qvalues OA and lowMS.txt]
LEFT JOIN [table_TJGR_Gene_SPID_evalue_Description.txt]
ON [[email protected]].[sig qvalues OA and lowMS.txt].protein=[table_TJGR_Gene_SPID_evalue_Description.txt].[CGI Protein]
For response to mech stress at 400, all 10 proteins are down-regulated (1.5-2.7 fold). For response toOA, 5 proteins are up-regulated (2.4-5.6 fold) and 57 are down-regulated (1.1-5.9 fold).
I redid the NMDS with the new data. The plots look pretty much the same .
July 25, 201355

July 25, 2013secondary stress: proteomicscitric acid/krebs cycle investigationSome of the proteins that had highly significant loadings in the NMDS of 400 vs. 2800 µatm oysters are involved in the citric acid cycle. TCAproduces CO2 and electron donors for oxidative phosphorylation in the e- transport chain that synthesize ATP. Citrate synthase and isocitratedehydrogenase were both down-regulated and significant for the NMDS. Malate dehydrogenase was identified as a protein in the gill proteomebut its expression was not affected by pCO2. Downstream of the cycle, NADH dehydrogenase (transfers e- to respiratory chain) was alsodown-regulated as well as mitochondrial ATP synthase, which were both implicated as important to OA response in the NMDS. Succinyl-CoAligase subunit B, mitochondrial catalyzes a reaction in the opposite direction in TCA and was also down-regulated, but was no implicated in thesignificant loadings for the NMDS. Both malate dehydrogenase (CGI_10015004) and succinyl-CoA ligase (CGI_10003696) had eigenvector p-values <0.05 but >0.01 of 0.03 and 0.50, respectively. They also had strong, positive loadings on the second MDS axis of 0.82 for malatedehydrogenase and 0.62 for succinyl CoA ligase. Qvalues for each were 0.60 (MD) and 0.30 (SCL).
July 22, 2013secondary stress: proteomicsTook file created May 15, 2013 that joined proteins significant from NMDS with KEGG IDs. Going to create 1 input file for iPath2 for significant
proteins from OA response and mechanical stress response at low pCO2. Proteins that are differentially expressed >10-fold have a line widthof 100, >5-fold have width 75, >2-fold have width 50, and <2-fold have width 25. For pCO2 response, proteins expressed less at high pCO2 arehighlighted in yellow and those expressed more at high pCO2 are highlighted in orange. Proteins expressed more during mech stress at 400µatm are in dark blue and those expressed less are in light blue. Only proteins with e-values from blast >1E-10 are used.This didn't end up working very well so I'm going to stick with the original iPath2 output for now (treatment responses on separate plots).
July 19, 2013Secondary stress: proteomicsRedid SQL workflow so that no part of it is done in excel. All files that are part of the workflow have the tag "published" so I know not to edit ordelete them. Below is the workflow with the code. File names are in brackets.
Input file #1 [__pep peak areas all oysters.txt__ ]: expression values per peptide for each technical replicate (n=48 columns ofdata). This file is derived from the raw output from Skyline (see __Supp Data__ SX)
Input file #2[__ProtPep for all oysters.txt]__ : associations between peptides and proteins, derived from ProteinProphet output(see __Supp Data__ SX+1)
Query 1Join input file #1 to input file #2 to create [__peptide peak areas with protein associations__ ]
SELECT * FROM [[email protected]].[ProtPep for all oysters.txt]LEFT JOIN [pep peak areas all oysters.txt]ON [ProtPep for all oysters.txt].[peptide sequence]=[pep peak areas all oysters.txt].PeptideSequence
Query 22. From file peptide peak areas with protein associations (see step 1), remove peptides that match to multiple proteins[__unique protein associations__ ]
SELECT * FROM [[email protected]].[peptide peak areas with protein associations] WHERE [peptidesequence] IN(SELECT [peptide sequence]FROM [[email protected]].[peptide peak areas with protein associations]GROUP BY [peptide sequence]HAVING COUNT (*) <2)
Query 33. Remove retention time data from the file from step 2 [__Peptide peak areas for unique peptides__ ]
SELECT protein, [peptide sequence], [2_01 TotalArea], [2_02 TotalArea], [2_03 TotalArea], [5_01TotalArea], [5_02 TotalArea], [5_03 TotalArea], [8_01 TotalArea],[8_02 TotalArea], [8_03 TotalArea],[11_01 TotalArea], [11_02 TotalArea], [11_03 TotalArea], [26_01 TotalArea], [26_02 TotalArea], [26_03TotalArea], [29_01 TotalArea], [29_02 TotalArea], [29_03 TotalArea], [32_01 TotalArea], [32_02 56
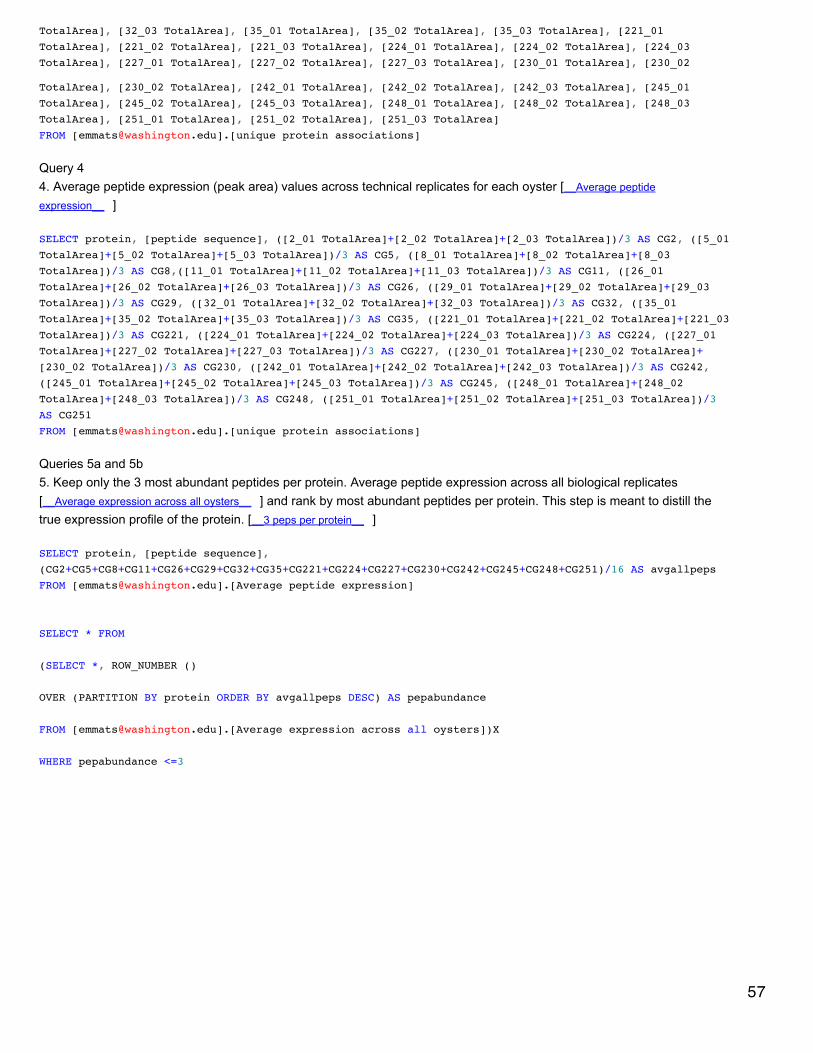
TotalArea], [32_03 TotalArea], [35_01 TotalArea], [35_02 TotalArea], [35_03 TotalArea], [221_01TotalArea], [221_02 TotalArea], [221_03 TotalArea], [224_01 TotalArea], [224_02 TotalArea], [224_03TotalArea], [227_01 TotalArea], [227_02 TotalArea], [227_03 TotalArea], [230_01 TotalArea], [230_02
TotalArea], [230_02 TotalArea], [242_01 TotalArea], [242_02 TotalArea], [242_03 TotalArea], [245_01TotalArea], [245_02 TotalArea], [245_03 TotalArea], [248_01 TotalArea], [248_02 TotalArea], [248_03TotalArea], [251_01 TotalArea], [251_02 TotalArea], [251_03 TotalArea]FROM [[email protected]].[unique protein associations]
Query 44. Average peptide expression (peak area) values across technical replicates for each oyster [__Average peptide
expression__ ]
SELECT protein, [peptide sequence], ([2_01 TotalArea]+[2_02 TotalArea]+[2_03 TotalArea])/3 AS CG2, ([5_01TotalArea]+[5_02 TotalArea]+[5_03 TotalArea])/3 AS CG5, ([8_01 TotalArea]+[8_02 TotalArea]+[8_03TotalArea])/3 AS CG8,([11_01 TotalArea]+[11_02 TotalArea]+[11_03 TotalArea])/3 AS CG11, ([26_01TotalArea]+[26_02 TotalArea]+[26_03 TotalArea])/3 AS CG26, ([29_01 TotalArea]+[29_02 TotalArea]+[29_03TotalArea])/3 AS CG29, ([32_01 TotalArea]+[32_02 TotalArea]+[32_03 TotalArea])/3 AS CG32, ([35_01TotalArea]+[35_02 TotalArea]+[35_03 TotalArea])/3 AS CG35, ([221_01 TotalArea]+[221_02 TotalArea]+[221_03TotalArea])/3 AS CG221, ([224_01 TotalArea]+[224_02 TotalArea]+[224_03 TotalArea])/3 AS CG224, ([227_01TotalArea]+[227_02 TotalArea]+[227_03 TotalArea])/3 AS CG227, ([230_01 TotalArea]+[230_02 TotalArea]+[230_02 TotalArea])/3 AS CG230, ([242_01 TotalArea]+[242_02 TotalArea]+[242_03 TotalArea])/3 AS CG242,([245_01 TotalArea]+[245_02 TotalArea]+[245_03 TotalArea])/3 AS CG245, ([248_01 TotalArea]+[248_02TotalArea]+[248_03 TotalArea])/3 AS CG248, ([251_01 TotalArea]+[251_02 TotalArea]+[251_03 TotalArea])/3AS CG251FROM [[email protected]].[unique protein associations]
Queries 5a and 5b5. Keep only the 3 most abundant peptides per protein. Average peptide expression across all biological replicates[__Average expression across all oysters__ ] and rank by most abundant peptides per protein. This step is meant to distill thetrue expression profile of the protein. [__3 peps per protein__ ]
SELECT protein, [peptide sequence],(CG2+CG5+CG8+CG11+CG26+CG29+CG32+CG35+CG221+CG224+CG227+CG230+CG242+CG245+CG248+CG251)/16 AS avgallpepsFROM [[email protected]].[Average peptide expression]
SELECT * FROM
(SELECT *, ROW_NUMBER ()
OVER (PARTITION BY protein ORDER BY avgallpeps DESC) AS pepabundance
FROM [[email protected]].[Average expression across all oysters])X
WHERE pepabundance <=3
57

Query 66. Join list of 3 most abundant peptides per protein (step 5b) to list of average peptide expression (step 4). [__3 peps per
protein with expression__ ]
SELECT * FROM [[email protected]].[3 peps per protein]LEFT JOIN [[email protected]].[Average peptide expression]ON [[email protected]].[3 peps per protein].[peptide sequence]=[[email protected]].[Averagepeptide expression].[peptide sequence]
Query 77. Average the expression values of the 3 most abundant peptides per protein to go from expression based on peptides toexpression based on proteins. [__3 peps per protein area avgd__ ]
SELECT protein,avg(CAST(CG2 AS FLOAT)),avg(CAST(CG5 AS FLOAT)),avg(CAST(CG8 AS FLOAT)),avg(CAST(CG11 AS FLOAT)),avg(CAST(CG26 AS FLOAT)),avg(CAST(CG29 AS FLOAT)),avg(CAST(CG32 AS FLOAT)),avg(CAST(CG35 AS FLOAT)),avg(CAST(CG221 AS FLOAT)),avg(CAST(CG224 AS FLOAT)),avg(CAST(CG227 AS FLOAT)),avg(CAST(CG230 AS FLOAT)),avg(CAST(CG242 AS FLOAT)),avg(CAST(CG245 AS FLOAT)),avg(CAST(CG248 AS FLOAT)),avg(CAST(CG251 AS FLOAT))FROM [[email protected]].[3 peps per protein with expression]
58
FROM [[email protected]].[3 peps per protein with expression]GROUP BY protein
July 16, 2013Secondary stress: proteomicsTook list of proteins that have a qvalue < 0.2 (see 7/15/13) and joined them with SPID and SPID descriptions in SQLshare.SELECT * FROM [[email protected]].[proteins significant by qvalue.txt]LEFT JOIN [table_Cg proteome db evalue -10.txt]ON [proteins significant by qvalue.txt].protein=[table_Cg proteome db evalue -10.txt].Protein
SELECT * FROM [[email protected]].[proteins sig by qvalue with SPID]LEFT JOIN [[email protected]].[qDOD Cgigas Gene Descriptions (Swiss-prot)]ON [proteins sig by qvalue with SPID].SPID=[qDOD Cgigas Gene Descriptions (Swiss-prot)].SPID
59

Removed all annotations with evalue > 1E-10.
July 15, 2013Secondary stress: proteomicsCalculating q-values associated with false discovery rate for differential expression between treatments (see 7/2 and 7/3/13). Based on Storey2002 (http://onlinelibrary.wiley.com/store/10.1111/1467-9868.00346/asset/1467-9868.00346.pdf?v=1&t=hj5vvfya&s=3d50dcd3825c0a5c826fc723ebf74863174bcf1d ) and usingdefinition of qvalue from the paper: "minimum pFDR [positive false discovery rate] that can occur when rejecting a statistic with a value t for theset of nested rejection regions"
Also of use, Storey & Tibshirani 2003, Statistical significance for genomewide studies:"The q value for a particular feature is the expected proportion offalse positives incurred when calling that feature significant. Therefore, calculating theqvalues for each feature and thresholding themat q-value level produces a set of significant features so that aproportion of is expected to be false positives. Typically, the pvalue is described as the probability of a null feature being as ormore extreme than the observed one. ‘‘As or more extreme’’ in thissetup means that it would appear higher on the list. The q value ofa particular feature can be described as the expected proportion offalse positives among all features as or more extreme than theobserved one"
"In our analysis, thresholding genes with q values 0.05 yields 160genes significant for differential expression. This means that 8 ofthe 160 genes called significant are expected to be false positives."
"In the example60
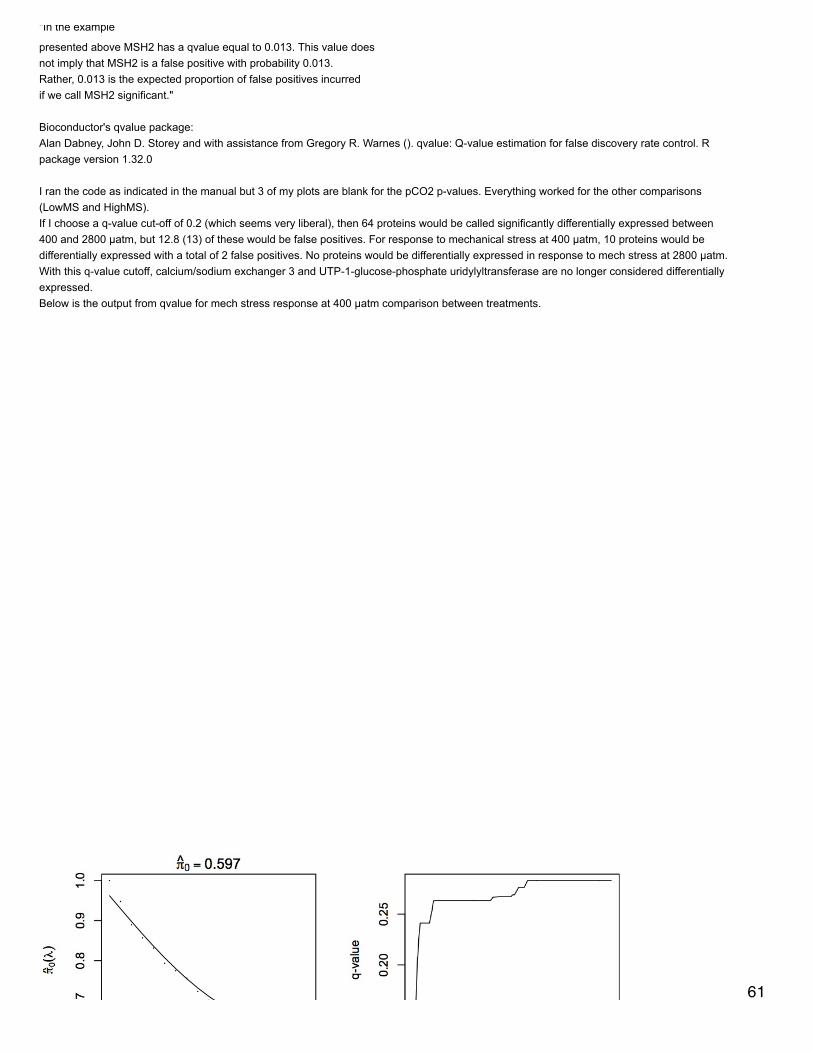
"In the example
presented above MSH2 has a qvalue equal to 0.013. This value doesnot imply that MSH2 is a false positive with probability 0.013.Rather, 0.013 is the expected proportion of false positives incurredif we call MSH2 significant."
Bioconductor's qvalue package:Alan Dabney, John D. Storey and with assistance from Gregory R. Warnes (). qvalue: Q-value estimation for false discovery rate control. Rpackage version 1.32.0
I ran the code as indicated in the manual but 3 of my plots are blank for the pCO2 p-values. Everything worked for the other comparisons(LowMS and HighMS).If I choose a q-value cut-off of 0.2 (which seems very liberal), then 64 proteins would be called significantly differentially expressed between400 and 2800 µatm, but 12.8 (13) of these would be false positives. For response to mechanical stress at 400 µatm, 10 proteins would bedifferentially expressed with a total of 2 false positives. No proteins would be differentially expressed in response to mech stress at 2800 µatm.With this q-value cutoff, calcium/sodium exchanger 3 and UTP-1-glucose-phosphate uridylyltransferase are no longer considered differentiallyexpressed.Below is the output from qvalue for mech stress response at 400 µatm comparison between treatments.
61

July 9, 2013Secondary stress: proteomicsDownloaded supp table 24 from Zhang et al. 2012 (proteins identified in shell) to see if any showed up in the differentially expressed proteins inthe different treatment comparisons (see 7/2/13 and 7/3/13). In SQLshare joined the list of zhang proteins to the differential expression files forall treatments (2 steps because 2 different files).SELECT * FROM [[email protected]].[Zhang Supp 24 shell proteins.txt]LEFT JOIN [table_differential expression pCO2 and lowMS skyline.txt]ON [Zhang Supp 24 shell proteins.txt].[Shell Protein]=[table_differential expression pCO2 and lowMS
skyline.txt].protein
62
SELECT * FROM [[email protected]].[shell proteins with pCO2 lowMS diff exp]LEFT JOIN [table_differential expression high MS.txt]ON [shell proteins with pCO2 lowMS diff exp].[Shell Protein]=[table_differential expression highMS.txt].protein
final file is called shell proteins with all treatment comparisons.For each treatment, a handful of these proteins were differentially expressed (for t.test p<0.050), butnone of them showed a large fold-difference between treatment comparisons (all <3-fold).
July 8, 2013Primer design for Etilet & AhmedMost C. gigas primers are from published papers:HSP90 - Choi et al.CYP1A1 - Boutet et al.myc homolog - David et al. 2005Barnacle primers (Balanus glandula) designed from congener NCBI sequences in NCBI. Arginine kinase and elongation factor are based on B.glandula sequences and hsp70 is B. amphitrite.Arginine kinase: product length = 221 bp, Tm = 60°C, primer lengths = 20 bp (42-61 and 262-243), based on sequence AY543686
Elongation factor: product length = 178 bp, Tm = 60°C, primer lengths = 20bp (115-134, 292-273), based on sequence AY543685Hsp70: product length = 99 bp, Tm = 60°C, primer lengths = 20 bp (1315-1334, 1413-1394), based on sequence AY150182
Papers on Na/Ca exchanger:http://www.annualreviews.org/doi/abs/10.1146/annurev.physiol.62.1.111http://physrev.physiology.org/content/86/1/155.short
July 3, 2013Secondary stress: proteomicsRedid plots from 7/1/13 with error bars (standard deviation ^-7) and annotated with GO terms.
63

64

197 proteins are differentially expressed in mechanically stressed oysters at 2800 µatm (p-value for t-test <0.50). 10 of these are more highlyexpressed in stressed oysters (all less than 4-fold) and 187 are down-regulated in stressed oysters (5 of these are > 10-fold down-regulated:Zinc finger MYND domain-containing protein 12, sodium/calcium exchanger 3, UTP-glucose-1-phosphate uridylyltransferase, uncharacterizedprotein C45G9.7 in C. elegans, PITH domain-containing protein GA19395). Both Na/Ca exchanger and UTP-glucose-etc. were expressedsignificantly higher at 2800 compared to 400 µatm, so their down-regulation during mechanical stress is interesting (see 7/2/13).
Explored the correlation between spec counts and NSAF. Ranked each protein for both methods of counts so that 1 = greatest expressionvalue. See plot here . (https://www.evernote.com/shard/s242/sh/05e99501-2200-4ecd-b300-37227b1393e0/a19eb3eaf9b985e535ad7b0070347870 )
July 2, 2013Secondary stress: proteomicsI did a type 2, 2-tailed t-test of the Skyline data for 2800 vs 400 µatm and stress vs unstressed at 400 µatm. Not all of the highly up- or down-regulated proteins (see 7/1/13) were significantly differentially expressed. 295 proteins were differentially expressed in response to OA
(p<0.050), 23 of these are expressed highly at 2800 µatm compared to 400 and 272 are expressed less at 2800 µatm. Guanine nucleotide-binding protein G(s) subunit alpha is significantly differentially expressed (23-fold lower at 2800 µatm, p=0.014) as well as sodium/calciumexchanger 3 (40-fold higher, p=0034), and UTP-glucose-1-phosphate uridylyltransferase (13-fold higher, p=0.036).272 proteins are differentially expressed in response to stress at 400 µatm, 9 are expressed highly during mechanical stress and 263 are lessexpressed during stress. None of the highly differentially regulated proteins (see 7/1/13) are significantly differentially expressed.
July 1, 2014Secondary stress: proteomicsFurther investigation into Skyline data. I am working on comparing Skyline and NSAF results.For all the Skyline proteins that contributed to a stress response (either high pCO2 or mech stress at 400 µatm), I made up-down plots showingthe expression of each protein (summed across biological replicates). Bars in blue are proteins that are upregulated in the treatment conditionand red are proteins that are downregulated.
65

Across all proteins, for both NSAF and Skyline, I performed the following: [sum expression for high pCO2]/[sum expression for low pCO2]. The3 proteins that were > 10-fold up-regulated at 2800 µatm were not ones that had shown up in the NMDS: sodium/calcium exchanger 3,vacuolar protein sorting-associated protein 33A, UTP-glucose-1-phosphate uridylyltransferase. The same was true for the 3 proteins that weredown-regulated >10-fold in the Skyline data: pre-mRNA splicing factor 38A, aldo-keto reductase family 1 member B10, guanine nucleotide-binding protein G(s) subunit alpha.Out of the 20 proteins that were most up-regulated in the Skyline data for response to pCO2, only 3 of them were also upregulated in the NSAFdata. Of the 10 proteins most up-regulated in the NSAF data, only 3 were also upregulated in the Skyline data.
Repeated the same steps for proteins expressed at 400 µatm + mech stress and 400 µatm (no stress).
66
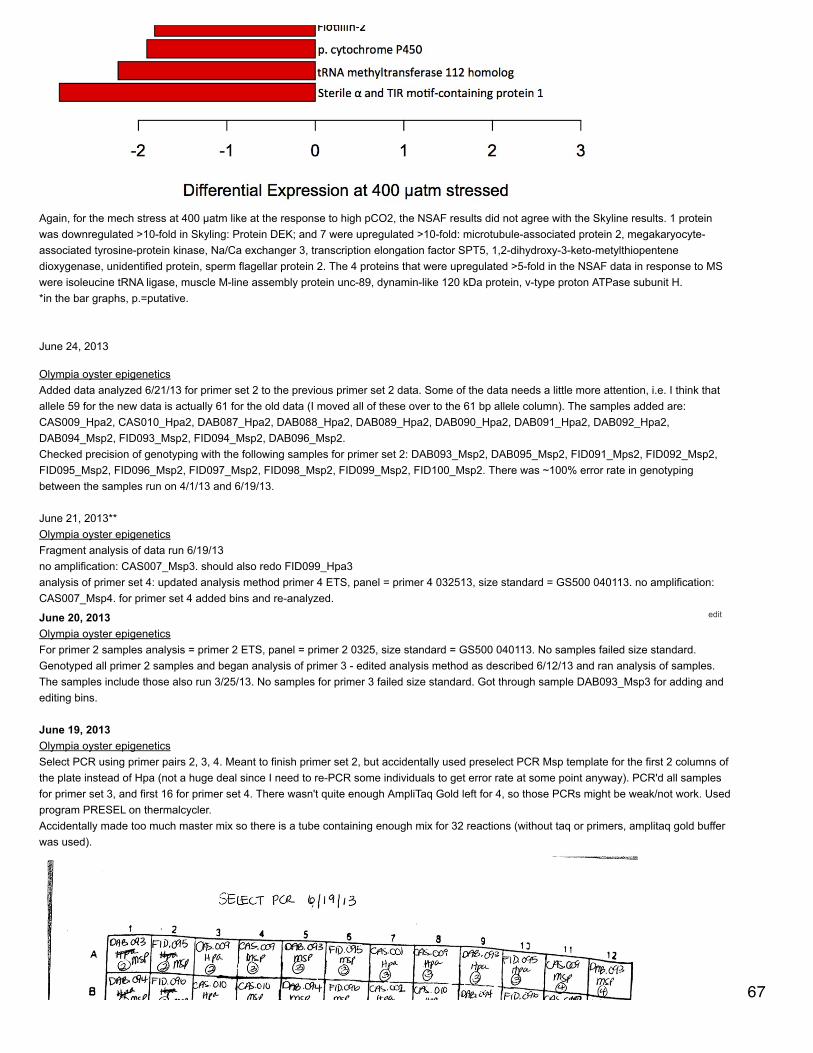
edit
Again, for the mech stress at 400 µatm like at the response to high pCO2, the NSAF results did not agree with the Skyline results. 1 proteinwas downregulated >10-fold in Skyling: Protein DEK; and 7 were upregulated >10-fold: microtubule-associated protein 2, megakaryocyte-associated tyrosine-protein kinase, Na/Ca exchanger 3, transcription elongation factor SPT5, 1,2-dihydroxy-3-keto-metylthiopentenedioxygenase, unidentified protein, sperm flagellar protein 2. The 4 proteins that were upregulated >5-fold in the NSAF data in response to MSwere isoleucine tRNA ligase, muscle M-line assembly protein unc-89, dynamin-like 120 kDa protein, v-type proton ATPase subunit H.*in the bar graphs, p.=putative.
June 24, 2013
Olympia oyster epigeneticsAdded data analyzed 6/21/13 for primer set 2 to the previous primer set 2 data. Some of the data needs a little more attention, i.e. I think thatallele 59 for the new data is actually 61 for the old data (I moved all of these over to the 61 bp allele column). The samples added are:CAS009_Hpa2, CAS010_Hpa2, DAB087_Hpa2, DAB088_Hpa2, DAB089_Hpa2, DAB090_Hpa2, DAB091_Hpa2, DAB092_Hpa2,DAB094_Msp2, FID093_Msp2, FID094_Msp2, DAB096_Msp2.Checked precision of genotyping with the following samples for primer set 2: DAB093_Msp2, DAB095_Msp2, FID091_Mps2, FID092_Msp2,FID095_Msp2, FID096_Msp2, FID097_Msp2, FID098_Msp2, FID099_Msp2, FID100_Msp2. There was ~100% error rate in genotypingbetween the samples run on 4/1/13 and 6/19/13.
June 21, 2013**Olympia oyster epigeneticsFragment analysis of data run 6/19/13no amplification: CAS007_Msp3. should also redo FID099_Hpa3analysis of primer set 4: updated analysis method primer 4 ETS, panel = primer 4 032513, size standard = GS500 040113. no amplification:CAS007_Msp4. for primer set 4 added bins and re-analyzed.
June 20, 2013Olympia oyster epigeneticsFor primer 2 samples analysis = primer 2 ETS, panel = primer 2 0325, size standard = GS500 040113. No samples failed size standard.Genotyped all primer 2 samples and began analysis of primer 3 - edited analysis method as described 6/12/13 and ran analysis of samples.The samples include those also run 3/25/13. No samples for primer 3 failed size standard. Got through sample DAB093_Msp3 for adding andediting bins.
June 19, 2013Olympia oyster epigeneticsSelect PCR using primer pairs 2, 3, 4. Meant to finish primer set 2, but accidentally used preselect PCR Msp template for the first 2 columns ofthe plate instead of Hpa (not a huge deal since I need to re-PCR some individuals to get error rate at some point anyway). PCR'd all samplesfor primer set 3, and first 16 for primer set 4. There wasn't quite enough AmpliTaq Gold left for 4, so those PCRs might be weak/not work. Usedprogram PRESEL on thermalcycler.Accidentally made too much master mix so there is a tube containing enough mix for 32 reactions (without taq or primers, amplitaq gold bufferwas used).
67
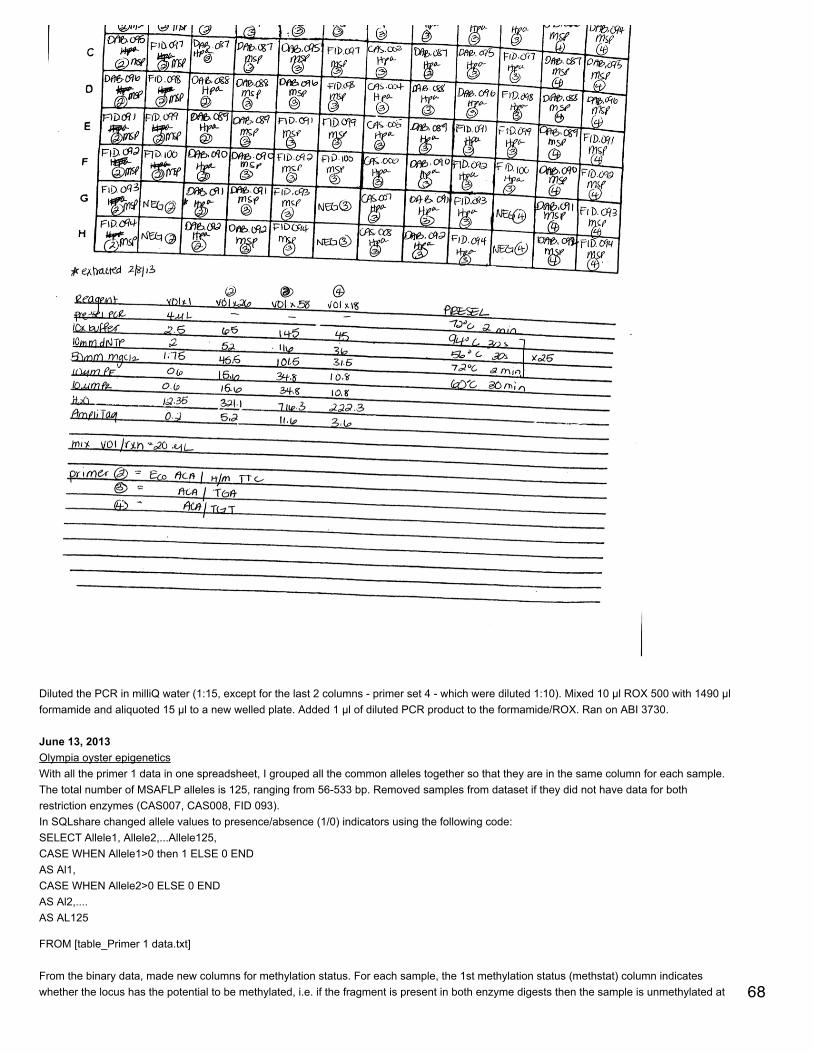
Diluted the PCR in milliQ water (1:15, except for the last 2 columns - primer set 4 - which were diluted 1:10). Mixed 10 µl ROX 500 with 1490 µlformamide and aliquoted 15 µl to a new welled plate. Added 1 µl of diluted PCR product to the formamide/ROX. Ran on ABI 3730.
June 13, 2013Olympia oyster epigeneticsWith all the primer 1 data in one spreadsheet, I grouped all the common alleles together so that they are in the same column for each sample.The total number of MSAFLP alleles is 125, ranging from 56-533 bp. Removed samples from dataset if they did not have data for bothrestriction enzymes (CAS007, CAS008, FID 093).In SQLshare changed allele values to presence/absence (1/0) indicators using the following code:SELECT Allele1, Allele2,...Allele125,CASE WHEN Allele1>0 then 1 ELSE 0 ENDAS Al1,CASE WHEN Allele2>0 ELSE 0 ENDAS Al2,....AS AL125
FROM [table_Primer 1 data.txt]
From the binary data, made new columns for methylation status. For each sample, the 1st methylation status (methstat) column indicateswhether the locus has the potential to be methylated, i.e. if the fragment is present in both enzyme digests then the sample is unmethylated at 68
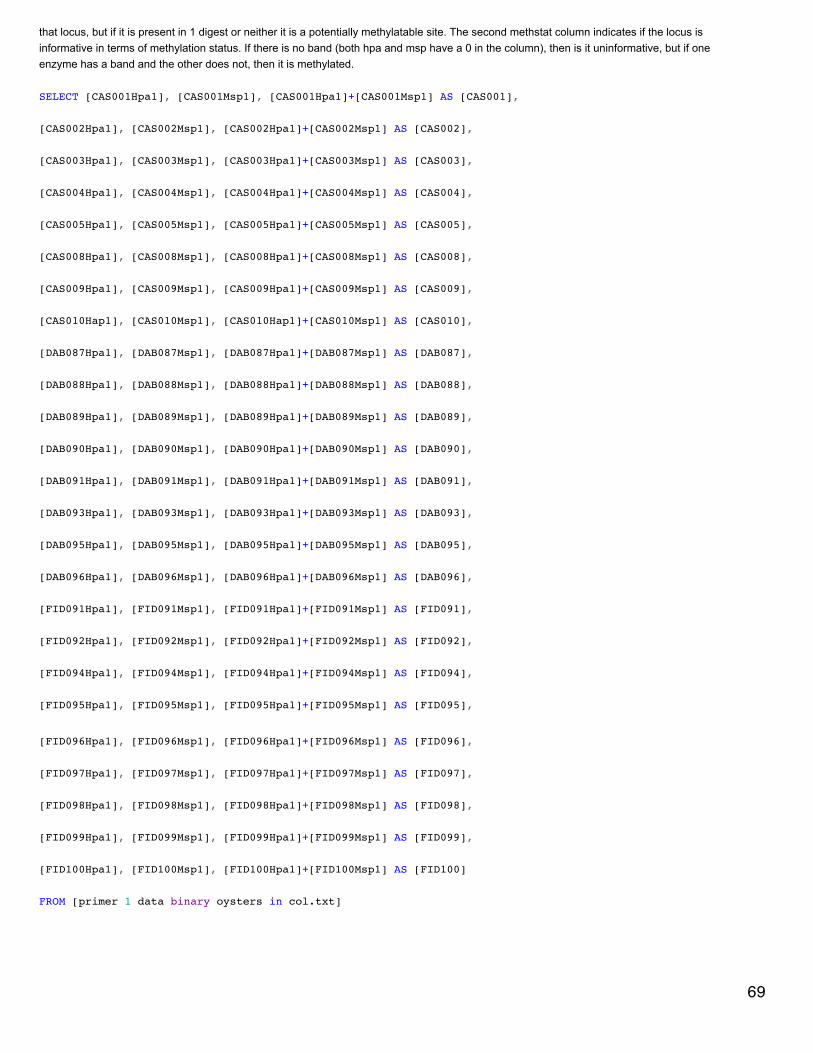
that locus, but if it is present in 1 digest or neither it is a potentially methylatable site. The second methstat column indicates if the locus isinformative in terms of methylation status. If there is no band (both hpa and msp have a 0 in the column), then is it uninformative, but if oneenzyme has a band and the other does not, then it is methylated.
SELECT [CAS001Hpa1], [CAS001Msp1], [CAS001Hpa1]+[CAS001Msp1] AS [CAS001],
[CAS002Hpa1], [CAS002Msp1], [CAS002Hpa1]+[CAS002Msp1] AS [CAS002],
[CAS003Hpa1], [CAS003Msp1], [CAS003Hpa1]+[CAS003Msp1] AS [CAS003],
[CAS004Hpa1], [CAS004Msp1], [CAS004Hpa1]+[CAS004Msp1] AS [CAS004],
[CAS005Hpa1], [CAS005Msp1], [CAS005Hpa1]+[CAS005Msp1] AS [CAS005],
[CAS008Hpa1], [CAS008Msp1], [CAS008Hpa1]+[CAS008Msp1] AS [CAS008],
[CAS009Hpa1], [CAS009Msp1], [CAS009Hpa1]+[CAS009Msp1] AS [CAS009],
[CAS010Hap1], [CAS010Msp1], [CAS010Hap1]+[CAS010Msp1] AS [CAS010],
[DAB087Hpa1], [DAB087Msp1], [DAB087Hpa1]+[DAB087Msp1] AS [DAB087],
[DAB088Hpa1], [DAB088Msp1], [DAB088Hpa1]+[DAB088Msp1] AS [DAB088],
[DAB089Hpa1], [DAB089Msp1], [DAB089Hpa1]+[DAB089Msp1] AS [DAB089],
[DAB090Hpa1], [DAB090Msp1], [DAB090Hpa1]+[DAB090Msp1] AS [DAB090],
[DAB091Hpa1], [DAB091Msp1], [DAB091Hpa1]+[DAB091Msp1] AS [DAB091],
[DAB093Hpa1], [DAB093Msp1], [DAB093Hpa1]+[DAB093Msp1] AS [DAB093],
[DAB095Hpa1], [DAB095Msp1], [DAB095Hpa1]+[DAB095Msp1] AS [DAB095],
[DAB096Hpa1], [DAB096Msp1], [DAB096Hpa1]+[DAB096Msp1] AS [DAB096],
[FID091Hpa1], [FID091Msp1], [FID091Hpa1]+[FID091Msp1] AS [FID091],
[FID092Hpa1], [FID092Msp1], [FID092Hpa1]+[FID092Msp1] AS [FID092],
[FID094Hpa1], [FID094Msp1], [FID094Hpa1]+[FID094Msp1] AS [FID094],
[FID095Hpa1], [FID095Msp1], [FID095Hpa1]+[FID095Msp1] AS [FID095],
[FID096Hpa1], [FID096Msp1], [FID096Hpa1]+[FID096Msp1] AS [FID096],
[FID097Hpa1], [FID097Msp1], [FID097Hpa1]+[FID097Msp1] AS [FID097],
[FID098Hpa1], [FID098Msp1], [FID098Hpa1]+[FID098Msp1] AS [FID098],
[FID099Hpa1], [FID099Msp1], [FID099Hpa1]+[FID099Msp1] AS [FID099],
[FID100Hpa1], [FID100Msp1], [FID100Hpa1]+[FID100Msp1] AS [FID100]
FROM [primer 1 data binary oysters in col.txt]
69

SELECT CAS001,
CASE WHEN CAS001=2 then 'NM' WHEN CAS001=1 then 'M' else 'U' END
AS CAS001MethStat,
CASE WHEN CAS002=2 then 'NM' WHEN CAS002=1 then 'M' else 'U' END
AS CAS002MethStat,
CASE WHEN CAS003=2 then 'NM' WHEN CAS003=1 then 'M' else 'U' END
AS CAS003MethStat,
CASE WHEN CAS004=2 then 'NM' WHEN CAS004=1 then 'M' else 'U' END
AS CAS004MethStat,
CASE WHEN CAS005=2 then 'NM' WHEN CAS005=1 then 'M' else 'U' END
AS CAS005MethStat,
CASE WHEN CAS008=2 then 'NM' WHEN CAS008=1 then 'M' else 'U' END
AS CAS008MethStat,
CASE WHEN CAS009=2 then 'NM' WHEN CAS009=1 then 'M' else 'U' END
AS CAS009MethStat,
CASE WHEN CAS010=2 then 'NM' WHEN CAS010=1 then 'M' else 'U' END
AS CAS010MethStat,
CASE WHEN DAB087=2 then 'NM' WHEN DAB087=1 then 'M' else 'U' END
AS DAB087MethStat,
CASE WHEN DAB088=2 then 'NM' WHEN DAB088=1 then 'M' else 'U' END
AS DAB088MethStat,
CASE WHEN DAB089=2 then 'NM' WHEN DAB089=1 then 'M' else 'U' END
AS DAB089MethStat, 70

CASE WHEN DAB090=2 then 'NM' WHEN DAB090=1 then 'M' else 'U' END
AS DAB090MethStat,
CASE WHEN DAB091=2 then 'NM' WHEN DAB091=1 then 'M' else 'U' END
AS DAB091MethStat,
CASE WHEN DAB093=2 then 'NM' WHEN DAB093=1 then 'M' else 'U' END
AS DAB093MethStat,
CASE WHEN DAB095=2 then 'NM' WHEN DAB095=1 then 'M' else 'U' END
AS DAB095MethStat,
CASE WHEN DAB096=2 then 'NM' WHEN DAB096=1 then 'M' else 'U' END
AS DAB096MethStat,
CASE WHEN FID091=2 then 'NM' WHEN FID091=1 then 'M' else 'U' END
AS FID091MethStat,
CASE WHEN FID092=2 then 'NM' WHEN FID092=1 then 'M' else 'U' END
AS FID092MethStat,
CASE WHEN FID094=2 then 'NM' WHEN FID094=1 then 'M' else 'U' END
AS FID094MethStat,
CASE WHEN FID095=2 then 'NM' WHEN FID095=1 then 'M' else 'U' END
AS FID095MethStat,
CASE WHEN FID096=2 then 'NM' WHEN FID096=1 then 'M' else 'U' END
AS FID096MethStat,
CASE WHEN FID097=2 then 'NM' WHEN FID097=1 then 'M' else 'U' END
AS FID097MethStat,
CASE WHEN FID098=2 then 'NM' WHEN FID098=1 then 'M' else 'U' END
AS FID098MethStat,
71
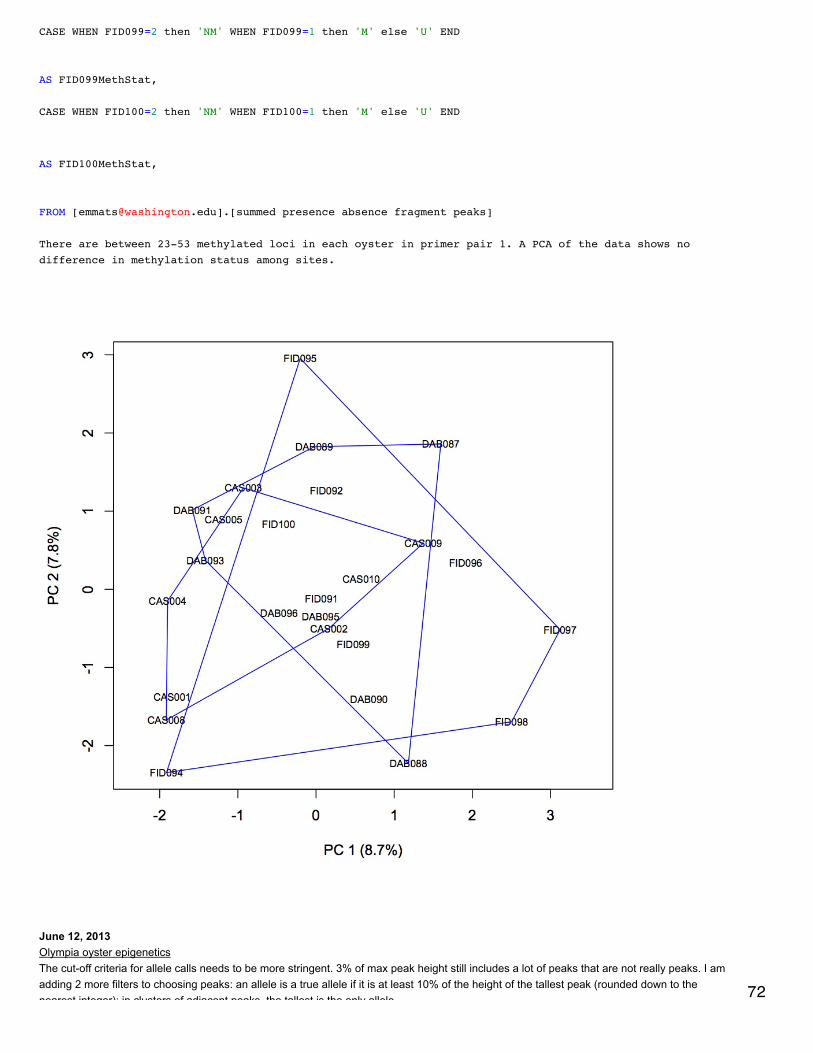
CASE WHEN FID099=2 then 'NM' WHEN FID099=1 then 'M' else 'U' END
AS FID099MethStat,
CASE WHEN FID100=2 then 'NM' WHEN FID100=1 then 'M' else 'U' END
AS FID100MethStat,
FROM [[email protected]].[summed presence absence fragment peaks]
There are between 23-53 methylated loci in each oyster in primer pair 1. A PCA of the data shows nodifference in methylation status among sites.
June 12, 2013Olympia oyster epigeneticsThe cut-off criteria for allele calls needs to be more stringent. 3% of max peak height still includes a lot of peaks that are not really peaks. I amadding 2 more filters to choosing peaks: an allele is a true allele if it is at least 10% of the height of the tallest peak (rounded down to thenearest integer); in clusters of adjacent peaks, the tallest is the only allele. 72
nearest integer); in clusters of adjacent peaks, the tallest is the only allele.Edited analysis method for primer 1 so that common alleles are not deleted. Also provided cut-off for calling peaks. This only works with "Namealleles using labels". Click Edit labels and enter 400 and 600 as thresholds and 0, Check, 1 as Labels. This will result in no peaks under 400RFU being called and peaks under 600 will need to be manually checked. Data exported as Primer 1 040113 Genotypes Table2. Repeated forprimer 1 data from 3/25/13. Repeated the same steps for primer 2, including the data from 3/25/13 in the 040113 project.
June 11, 2013Olympia oyster epigeneticsFragment analysis/epigenotyping of data run 4/2/13 (rerun of run from 4/1, projects are saved as prime 1 040113 and primer 2 040113).For primer 1: analysis method = primer 1 ETS, panel = primer 1.2, size standard = GS500 040113.The size standard is bad for samples DAB092_Msp1, DAB094_Msp1, and FID093_Msp1. None of these samples have any data in them sothey will have to be rerun. I am deleting them from the project. I have also deleted all of the negative controls and blanks from the project (afterensuring that there was no spurious amplification in any of them).Project was reanalyzed without the above samples. None of the size quality indicators were red (although about 1/3 are yellow).For calling peaks, I am going to use the method outlined in Snell-Rood et al. 2013. All potential peaks will be called and then, based on peakheights, quality filtering will be performed outside of GeneMapper. I am still removing allele calls that are obviously not peaks. This means thata peak must have an obvious and clear sharp peak morphology to be called as a MSAFLP allele. Everything >500 bp is also deleted (althoughnone of these resemble true allele peaks).
Added primer 2 samples from run 4/2/13 to project Primer 2 040113. Analysis method = primer 2 ETS, panel = primer 1 0325, size standard=GS500. Edited analysis method so that common alleles are not deleted. A lot of the size standards came back with warnings, so analyzedwith GS500 040113 (does not have peaks for 250 or 340). Deleted the following samples from the project since they failed the size standard:CAS008_Msp2, DAB094_Msp2, FID094_Msp2, CAS008_Hpa2. FID093_Msp2 also did not amplify and needs to be redone.Edited bins so that all allele peaks were included in a bin and saved panel (primer 2 0325). Reanalyzed data.
Exported the genotypes from primer 1 Hpa and Msp. Reformatted the data in Excel so that each allele is a row name and the column headersare individual samples (oysters) - the data in the cells are peak heights for each of the alleles. Checked to see if any called peaks are <3% ofthe maximum peak height for each sample (none of them were).
June 10, 2013Secondary stress: transcriptomicsDan helped me find the problem in my dataset "library reads mapped to isotigs", which is the file with the total mapped reads for each isotig.The numbers that were >999 have quotes around them in the file. I think this is because in Excel the format was set to "general" for the cells. Ichanged it to "number" and re-uploaded the file, redoing the last query from 6/7/13.For some of the CGIDs, there are more than 1 matching isotig. Total reads for isotigs were summed within corresponding CGIDs.
SELECT CGID
,sum([EM2A])
,sum([EM2B])
,sum([EM2C])
,sum([EM2D])
,sum([EM2E])
,sum([EM2F])
,sum([EM2G])
,sum([EM2H])
FROM [[email protected]].[isotigs with CGIDs and total reads mapped]
GROUP BY CGID
73
Joined the above file (summed total reads per CGID) with the list of proteins that were significantlyloaded along axis 2 in the proteomics NMDS, i.e. proteins that are responsible for expression differencesbetween treatment groups. Out of the 107 proteins, only 30 of them have gene expression for RNA-Seq.
SELECT * FROM [[email protected]].[highly significant NMDS loadings.txt]
LEFT JOIN [CGIDs with summed total reads]
ON [[email protected]].[highly significant NMDS loadings.txt].Protein=[CGIDs with summed totalreads].CGID
June 7, 2013
Secondary stress: transcriptomicsI want to look at the gene expression of the proteins that are highly significant for the differences in expression between treatment groups (see5/14/13). I made a blast database of the C. gigas proteome sequences (Zhang et al. 2012 data).
./makeblastdb -in /Volumes/web-2/oyster/oyster_v9_aa_format1.fasta -dbtype prot -out/Users/Emma/Documents/gigas_rnaseq/CGID_proteindb
Then I did a blastx of all the RNA-seq isotigs (Isotigs_consensus_sequences.fasta, see 12/3 and 12/13/12) against the protein database to getassociations between isotig contig numbers and CGIDs../blastx -num_threads 8 -out /Users/Emma/Documents/gigas_rnaseq/blastx_isotigswithCGIDs -db/Users/Emma/Documents/gigas_rnaseq/CGID_proteindb -outfmt 6 -evalue 1E-5 -max_target_seqs 1 -query/Users/Emma/Documents/Isotig_consensus_sequences.fasta
In SQLshare, joined blastx results with RPKM.
SELECT * FROM [[email protected]].[isotig blastx against CGID 060713.txt]
LEFT JOIN [RPKM all oysters.txt]
ON [[email protected]].[isotig blastx against CGID 060713.txt].[Isotig]=[RPKM all oysters.txt].[Feature ID]
Created 2 new datasets with RPKM values: the first in which RPKM values for each oyster are averagedacross isotigs for each CGID and the second in which RPKM values are summed across isotigs.
SELECT CGID
,avg(CAST([RPKM A] AS FLOAT))
,avg(CAST([RPKM B] AS FLOAT))
,avg(CAST([RPKM C] AS FLOAT)) 74

,avg(CAST([RPKM C] AS FLOAT))
,avg(CAST([RPKM D] AS FLOAT))
,avg(CAST([RPKM E] AS FLOAT))
,avg(CAST([RPKM F] AS FLOAT))
,avg(CAST([RPKM G] AS FLOAT))
,avg(CAST([RPKM H] AS FLOAT))
FROM [[email protected]].[isotigs with CGIDs and RPKM]
GROUP BY CGID
SELECT CGID
,sum([RPKM A]),sum([RPKM B]),sum([RPKM C]),sum([RPKM D]),sum([RPKM E]),sum([RPKM F]),sum([RPKM G]),sum([RPKM H])FROM [[email protected]].[isotigs with CGIDs and RPKM]GROUP BY CGID
For now, workflow will be continued with the dataset that sums RPKM across isotigs.
Joined list of highly significant eigenvector loading proteins (see 5/14/13) with the summed RPKM per CGID.
SELECT * FROM [[email protected]].[highly significant NMDS loadings.txt]LEFT JOIN [cgid with RPKM summed]ON [[email protected]].[highly significant NMDS loadings.txt].Protein=[cgid with RPKM summed].CGID
Followed the same workflow for total reads as was done for RPKM (for DESeq, the data need to be expressedin total reads, RPKM will be used for heatmaps).
SELECT * FROM [[email protected]].[isotig blastx against CGID 060713.txt]
LEFT JOIN [library reads mapped to isotigs.txt]
ON [[email protected]].[isotig blastx against CGID 060713.txt].Isotig=[library reads mapped to 75

ON [[email protected]].[isotig blastx against CGID 060713.txt].Isotig=[library reads mapped toisotigs.txt].[Feature ID]
errors trying to sum as done above. when try just summing:
Operand data type varchar is invalid for sum operatorwhen try to cast as float:Problem running query: Error converting data type varchar to float.
Heatmaps were made in R using pheatmap: clustering of samples (oysters) and variables (genes), average linkage clustering, euclideandistance, expression data are log+1 transformed. Not all the proteins from the proteomics data (this is just the subset with sig loadings in theNMDS) were represented in the RNA-seq data. Clustering did not follow treatment for any of the comparisons - only pCO2 is shown becausethat is really the only relevant one since no mechanically stressed oysters were sequenced using RNA-seq (although I looked at the expressionof those genes as well). Expression levels at the transcriptomic level are different from expression levels at the proteomic level.
June 4, 2013Secondary Stress: Buoyant weightCreated a new file that contains just data for BW for oysters at the beginning of the experiment and the end (29 days later). File name = oystermeasurements BW.csv. Used this file to plot BW at the beginning and end of the experiment with 95% confidence intervals. Instructions andcode for how to do this are from Cookbook for R (http://www.cookbook-r.com/Graphs/Plotting_means_and_error_bars_(ggplot2)/#Helperfunctions).
76

For the heat maps made 5/28, I annotated the groups of proteins. The pheatmap in R clusters proteins by similar expression profiles. I wastrying to see if there were certain biological processes represented within those clusters. I looked at all the GO terms associated with proteinsin each cluster and annotated those clusters with the most dominant processes found across multiple proteins.
May 28, 2013Secondary Stress: Proteomics and buoyant weight
Did the same calculations for BW as I did previously for oyster length and width (see May 10, 2013). BW relative growth rate is greatest foroysters held at 400 µatm and least for oysters from 1000 µatm. 95% confidence intervals were also calculated using the following command inR: qnorm(0.975)*[stand dev of data]/sqrt(sample size). 95% were similar across time points for all 3 treatments.
77

Made heat maps of protein expression for proteins that are responsible for treatment response (see May 14, 2013) using pheatmap in R. Rowsand columns are clustered using Euclidean distance and the average clustering method. Skyline expression data was log-transformed beforeuse in the heat map. Below is an example from the pCO2 response data.
78
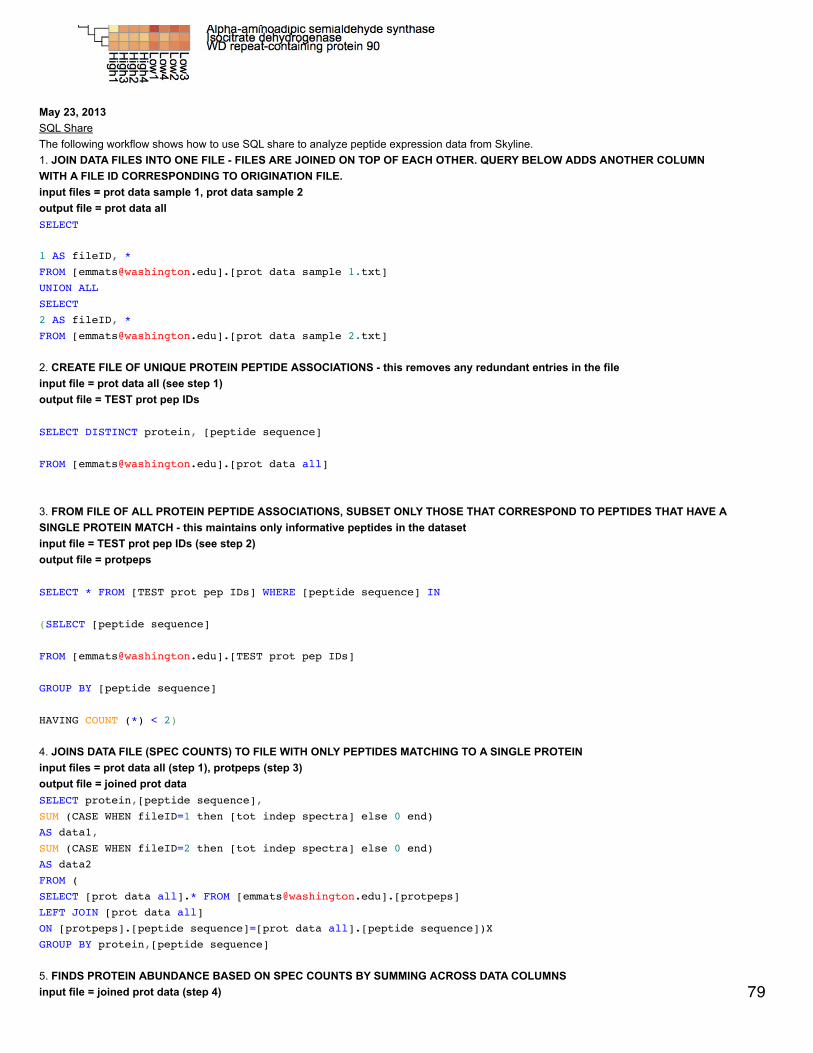
May 23, 2013SQL ShareThe following workflow shows how to use SQL share to analyze peptide expression data from Skyline.1. JOIN DATA FILES INTO ONE FILE - FILES ARE JOINED ON TOP OF EACH OTHER. QUERY BELOW ADDS ANOTHER COLUMNWITH A FILE ID CORRESPONDING TO ORIGINATION FILE.input files = prot data sample 1, prot data sample 2output file = prot data allSELECT
1 AS fileID, * FROM [[email protected]].[prot data sample 1.txt]UNION ALLSELECT 2 AS fileID, * FROM [[email protected]].[prot data sample 2.txt]
2. CREATE FILE OF UNIQUE PROTEIN PEPTIDE ASSOCIATIONS - this removes any redundant entries in the fileinput file = prot data all (see step 1)output file = TEST prot pep IDs
SELECT DISTINCT protein, [peptide sequence]
FROM [[email protected]].[prot data all]
3. FROM FILE OF ALL PROTEIN PEPTIDE ASSOCIATIONS, SUBSET ONLY THOSE THAT CORRESPOND TO PEPTIDES THAT HAVE ASINGLE PROTEIN MATCH - this maintains only informative peptides in the datasetinput file = TEST prot pep IDs (see step 2)output file = protpeps
SELECT * FROM [TEST prot pep IDs] WHERE [peptide sequence] IN
(SELECT [peptide sequence]
FROM [[email protected]].[TEST prot pep IDs]
GROUP BY [peptide sequence]
HAVING COUNT (*) < 2)
4. JOINS DATA FILE (SPEC COUNTS) TO FILE WITH ONLY PEPTIDES MATCHING TO A SINGLE PROTEINinput files = prot data all (step 1), protpeps (step 3)output file = joined prot dataSELECT protein,[peptide sequence],SUM (CASE WHEN fileID=1 then [tot indep spectra] else 0 end)AS data1,SUM (CASE WHEN fileID=2 then [tot indep spectra] else 0 end)AS data2FROM (SELECT [prot data all].* FROM [[email protected]].[protpeps]LEFT JOIN [prot data all]ON [protpeps].[peptide sequence]=[prot data all].[peptide sequence])XGROUP BY protein,[peptide sequence]
5. FINDS PROTEIN ABUNDANCE BASED ON SPEC COUNTS BY SUMMING ACROSS DATA COLUMNSinput file = joined prot data (step 4) 79

output file = sum spec counts
SELECT protein, [peptide sequence], data1+data2 AS sumallspecFROM [[email protected]].[joined prot data]
6. ORDERS PROTEINS BY SPEC COUNTS (DESCENDING) AND THEN KEEPS ONLY FIRST 3 PEPTIDES (MOST ABUNDANT) FOREACH PROTEINinput file = sum spec counts (step 5)output file = top 3 abundant peptidesSELECT * FROM (SELECT *, ROW_NUMBER () OVER (PARTITION BY protein ORDER BY sumallspec DESC) AS pepabundanceFROM [[email protected]].[sum spec counts])xWHERE pepabundance <= 3
To do next but not included in this workflow:7. Join file top 3 abundant peptides (step 6) to file joined prot data (step 4) to create file of protein IDs, peptides, and data for individual oysters8. Average peptide expression values for each protein so expression is on a per-protein basis (average across rows)9. Average peptide expression values across technical replicates (average across columns)
May 15, 2013Secondary Stress: ProteomicsDid separate anosims for the highly significant proteins within their specific comparisons (see 5/14/13): low vs. low X MS, high vs. high X MS,low vs. high. The 57 proteins are differentially expressed between low and high pCO2 (p=0.027) and the 22 proteins are differentiallyexpressed in response to MS at low pCO2 (p=0.03), but expression is not different for the 28 proteins in response to MS at high pCO2.
Joined the list of highly significant eigenvector proteins with kegg pathway IDs in SQL.SELECT * FROM [[email protected]].[highly significant proteins for anosim.csv]LEFT JOIN [table_Cgigas_proteomev9_kegg_match]ON [highly significant proteins for anosim.csv].Protein=[table_Cgigas_proteomev9_kegg_match].Column1
Loaded each list of KEGG IDs (for the 3 separate treatment comparisons) into iPath2 and saved as pngfiles.
May 14, 2013Secondary Stress: ProteomicsJoined files in SQL share to annotate Skyline daily data with kegg annotations:SELECT * FROM [[email protected]].[Skyline daily with SPID]LEFT JOIN [table_Cgigas_proteomev9_kegg_match]ON [Skyline daily with SPID].protein=[table_Cgigas_proteomev9_kegg_match].[Column1]Peptide peak areas were averaged across technical replicates and then across biological replicates so that each treatment has an expressionvalue associated with each KEGG term. There are 2365 unique KEGG terms represented by this dataset (kegg with skyline dailyexpressions.txt).
Met with Julian to talk about how to determine which proteins (eigenvectors) are responsible for separation between treatment groups along aspecific axis in NMDS. In the vector output (loadings), MDS1 and MDS2 refer to loadings on specific axes (1 and 2, respectively). Narrow downimportant proteins by p-value (choose <0.05 p-value for the number of variables that I have) and choose vectors with the highest (abs. value)loadings on the axis of interest. These will be the tails of the distribution of loadings - the extreme "outlier" values. These are the most importantvariables. Can choose them based on % of total or based on overall number of proteins of interest. For displaying, can create just those
vectors on the plot or can list the important variables at the axis corners. Do ANOSIM on these most important variables. Also compare withPCoA (bray-curtis, log-transformed) since this method has axes that are independent of each other and can easily be separated. Does PCoAshow the same patterns as NMDS?
p-value cutoff for NMDS loadings (output of eigenvector loadings is in 3 peps per protein area avgd) = 0.0099MDS2 cutoff > or = |0.90|For high vs. low pCO2, 57 proteins are highly significant. For High pCO2 vs. high x MS 28 proteins are highly significant and for low pCO2 vslow x MS, 22 proteins are highlyt significant.Joined this file of highly significant eigenvector loadings with SPIDs, descriptions, GO, and GO slim terms in SQL.SELECT * FROM [[email protected]].[highly significant NMDS loadings.txt]LEFT JOIN [table_Cg proteome db evalue -10.txt]ON [highly significant NMDS loadings.txt].Protein=[table_Cg proteome db evalue -10.txt].Protein
80

ON [highly significant NMDS loadings.txt].Protein=[table_Cg proteome db evalue -10.txt].Protein
SELECT * FROM [[email protected]].[highly sig loadings with SPID]
LEFT JOIN [[email protected]].[qDOD Cgigas Gene Descriptions (Swiss-prot)]
ON [highly sig loadings with SPID].SPID=[qDOD Cgigas Gene Descriptions (Swiss-prot)].SPID
SELECT * FROM [[email protected]].[highly sig loadings with gene descriptions]LEFT JOIN [[email protected]].[SPID_GOnumber.txt]ON [highly sig loadings with gene descriptions].SPID=[[email protected]].[SPID_GOnumber.txt].A0A000
SELECT * FROM [[email protected]].[highly sig loadings with GO]LEFT JOIN [[email protected]].[GO_to_GOslim]ON [highly sig loadings with GO].[GO:0003824]=[[email protected]].[GO_to_GOslim].GO_id
May 10, 2013Secondary Stress: oyster measurementsYesterday I made files of oyster length, width, and adjusted buoyant weight from the sampling data from 2/11/12. The files only include oystersfrom treatments of pCO2 400, 1000, and 2800 µatm. For the time 0 data point, there is n=48 oysters for each treatment. for the time 1 monthdata point, there are n=48 for length and width (heat shocked oysters were included) but only 24 for buoyant weight because there is notforceps correction for the HS'd oysters in the data sheet.I am going to calculate the relative growth rate for length, width and buoyant weight from time =0 to 1 month later. This is based on theequation in Hoffmann & Poorter 2002 (http://aob.oxfordjournals.org/content/90/1/37.full.pdf ), where they found that taking the ln of all theweights in a group and then taking the average was less biased than taking the ln of the average. Also calculated 95% CI for lengths andwidths at time 0 and 1 month exposure for all 3 treatments (https://docs.google.com/spreadsheet/ccc?key=0An4PXFyBBnDEdHZTTm5QU2dtOFB6cWRndVdnajhJZGc&usp=sharing ).
81

Secondary Stress: EpigeneticsThe MeDip procedure is taken from this paper: Guerror-Basagna et al.http://www.plosone.org/article/info%3Adoi%2F10.1371%2Fjournal.pone.0013100Jen designed primers for the medip PCR for caspase-3, catalase, cathepsin B, MAPK, and superoxide dismutase (SR IDs 1522-1531). AllPCR products have at least one CpG in them. I created a database in Geneious of the oyster genome (v9_90) and searched all the primers(individually) against it. The top hit by far for each primer was the sequence it was designed for. When primers had a decent hit to anothersequence, it was never the entire sequence of the primer that aligned and the other primer in the pair did not align to that same undesiredsequence.
May 3, 2013Secondary Stress: Epigenetics and ProteomicsAnnotated the proteins associated with significant eigenvectors from the NMDS of low vs. high pCO2 (see 4/29) with SPID descriptions in SQL.
SELECT * FROM [[email protected]].[sig eigenvectors pCO2 SPID]LEFT JOIN [table_TJGR_Gene_SPID_evalue_Description.txt]ON [sig eigenvectors pCO2 SPID].CGID=[table_TJGR_Gene_SPID_evalue_Description.txt].[CGI Protein]
From this information, chose 49 proteins that looked interesting. Looked up their descriptions in Uniprot and narrowed down the list ofinteresting proteins to: catalase, heat shock protein 70 B2, peroxiredoxin-6, 60 kDa heat shock protein mitochondrial, v-type proton ATP-asecatalytic subunit A, caspase-3, heat shock protein beat-1, mitogen-activated protein kinase 7, superoxide dismutase [Cu-Zn] chloroplastic,cathepsin F, v-type proton ATP-ase subunit G, programmed cell death protein 5, cathepsin B. From these proteins we (Jen) are going to designprimers for medip qPCR. The sequence amplified needs to contain at least one CpG so that if methylation is present it can be detected.Amplified fragments can be up to 700 bp long.
April 29, 2013Secondary Stress: ProteomicsThe file made 4/26 would not download completely. Contacted SQL support and they gave me a query that would work. Importantly, the avgcommand does not take the true average, but the average of the closest integers to the values in the data. The new query takes the trueaverage.SELECT protein, avg(CAST([11_01 TotalArea] AS FLOAT)), avg(CAST([11_02 TotalArea] AS FLOAT)), avg(CAST([11_03 TotalArea] AS FLOAT)), avg(CAST([2_01 TotalArea] AS FLOAT)), avg(CAST([2_02 TotalArea] AS FLOAT)), avg(CAST([2_03 TotalArea] AS FLOAT)), avg(CAST([5_01 TotalArea] AS FLOAT)), avg(CAST([5_02 TotalArea] AS FLOAT)), avg(CAST([5_03 TotalArea] AS FLOAT)), avg(CAST([8_01 TotalArea] AS FLOAT)), avg(CAST([8_02 TotalArea] AS FLOAT)), avg(CAST([8_03 TotalArea] AS FLOAT)), avg(CAST([26_01 TotalArea] AS FLOAT)), avg(CAST([26_02 TotalArea] AS FLOAT)), avg(CAST([26_02 TotalArea] AS FLOAT)), avg(CAST([26_03 TotalArea] AS FLOAT)), avg(CAST([29_01 TotalArea] AS FLOAT)), avg(CAST([29_02 TotalArea] AS FLOAT)), avg(CAST([29_03 TotalArea] AS FLOAT)), avg(CAST([32_01 TotalArea] AS FLOAT)) 82

, avg(CAST([32_01 TotalArea] AS FLOAT)), avg(CAST([32_02 TotalArea] AS FLOAT)), avg(CAST([32_03 TotalArea] AS FLOAT)), avg(CAST([35_01 TotalArea] AS FLOAT)), avg(CAST([35_02 TotalArea] AS FLOAT)), avg(CAST([35_03 TotalArea] AS FLOAT)), avg(CAST([221_01 TotalArea] AS FLOAT)), avg(CAST([221_02 TotalArea] AS FLOAT)), avg(CAST([221_03 TotalArea] AS FLOAT)), avg(CAST([224_01 TotalArea] AS FLOAT)), avg(CAST([224_02 TotalArea] AS FLOAT)), avg(CAST([224_03 TotalArea] AS FLOAT))
, avg(CAST([227_01 TotalArea] AS FLOAT)), avg(CAST([227_02 TotalArea] AS FLOAT)), avg(CAST([227_03 TotalArea] AS FLOAT)), avg(CAST([230_01 TotalArea] AS FLOAT)), avg(CAST([230_02 TotalArea] AS FLOAT)), avg(CAST([230_02 TotalArea] AS FLOAT)), avg(CAST([242_01 TotalArea] AS FLOAT)), avg(CAST([242_02 TotalArea] AS FLOAT)), avg(CAST([242_03 TotalArea] AS FLOAT)), avg(CAST([245_01 TotalArea] AS FLOAT)), avg(CAST([245_02 TotalArea] AS FLOAT)), avg(CAST([245_03 TotalArea] AS FLOAT)), avg(CAST([248_01 TotalArea] AS FLOAT)), avg(CAST([248_02 TotalArea] AS FLOAT)), avg(CAST([248_03 TotalArea] AS FLOAT)), avg(CAST([251_01 TotalArea] AS FLOAT)), avg(CAST([251_02 TotalArea] AS FLOAT)), avg(CAST([251_03 TotalArea] AS FLOAT))FROM [[email protected]].[3 peps per protein.txt]GROUP BY protein
2677 proteins are in the Skyline dataset. Averaged Skyline peptide areas across technical replicates. Made NMDS plots of all treatmentstogether, low vs. high pCO2, low pCO2 vs. low MS, and high pCO2 vs high MS. ANOSIM showed no significant differences among proteomicprofiles for the different treatments (although low vs. high pCO2 was p=0.06). Also found eigenvector loadings for each plot to determinesignificance of the contribution of each protein in contributing to the division of the objects (oysters) in multivariate space.All Treatments
83
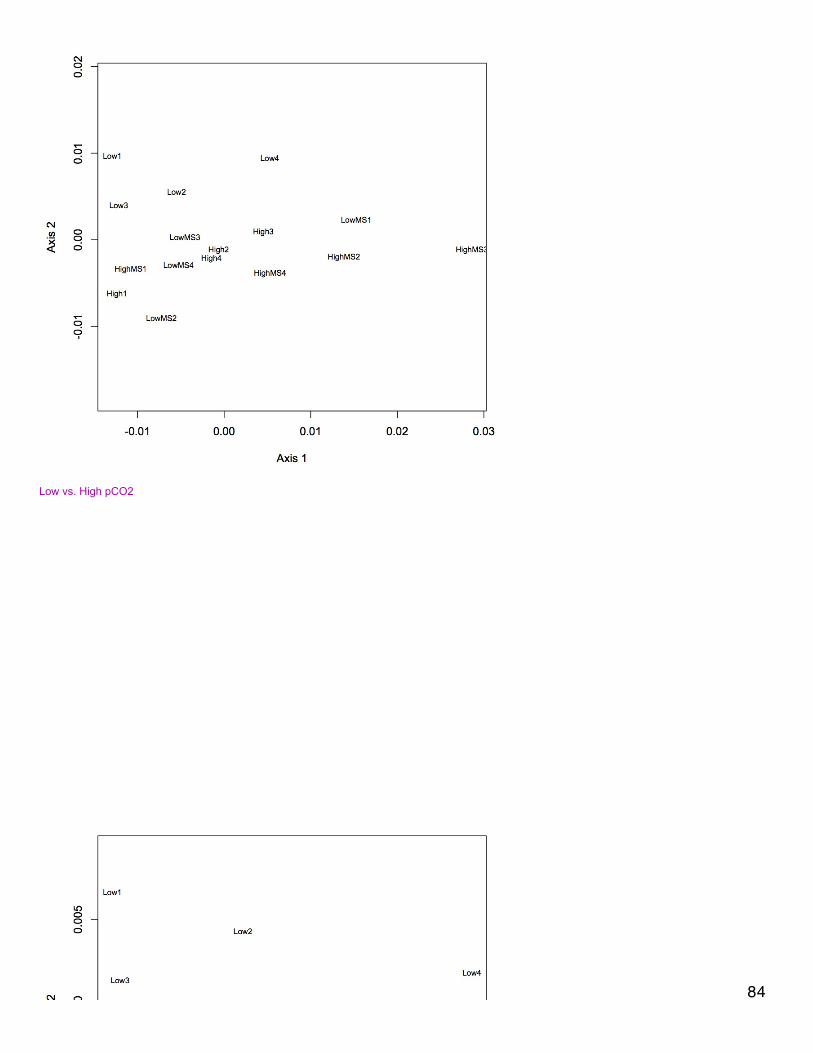
Low vs. High pCO2
84
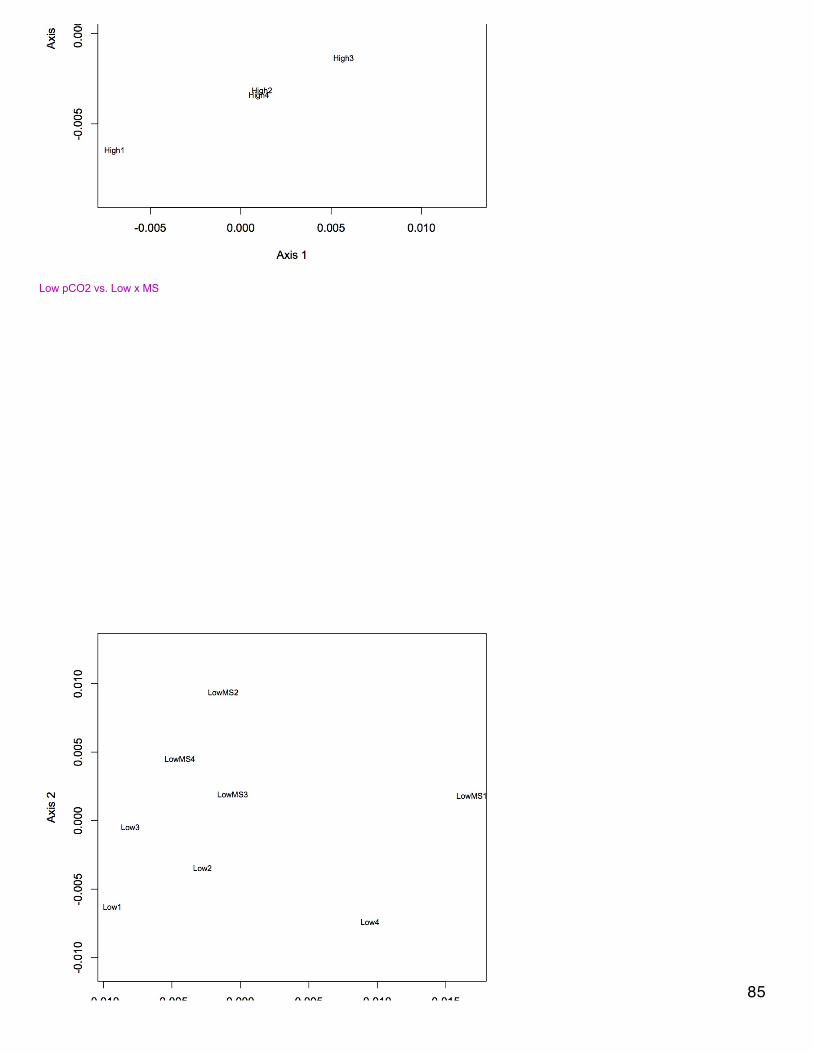
Low pCO2 vs. Low x MS
85

High pCO2 vs. High x MS
Annotated the gill proteome with SPID in SQL share. Also annotated with GO and GO Slim terms.SELECT * FROM [[email protected]].[3 peps per protein area avgd]LEFT JOIN [Cg proteome db evalue -10.txt]ON [3 peps per protein area avgd].protein=[Cg proteome db evalue -10.txt].Protein
SELECT * FROM [[email protected]].[gill proteome with SPID.txt]LEFT JOIN [[email protected]].[SPID_GOnumber.txt]ON [gill proteome with SPID.txt].SPID=[[email protected]].[SPID_GOnumber.txt].A0A000 86
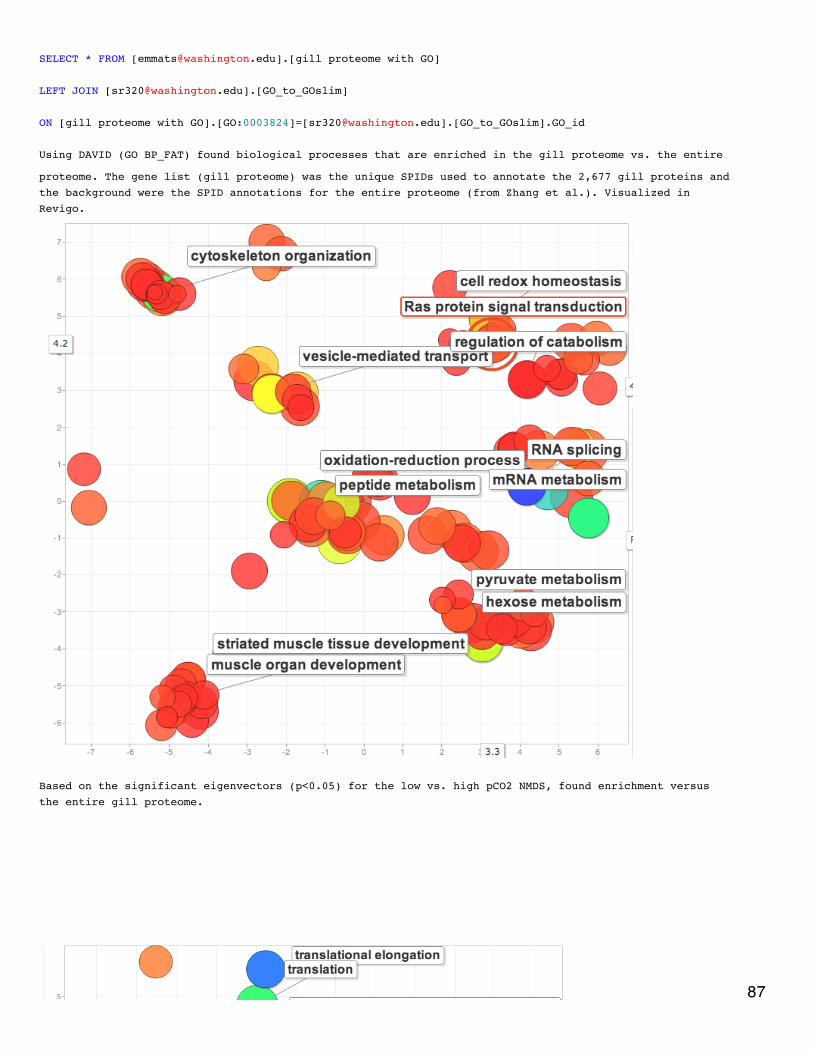
SELECT * FROM [[email protected]].[gill proteome with GO]
LEFT JOIN [[email protected]].[GO_to_GOslim]
ON [gill proteome with GO].[GO:0003824]=[[email protected]].[GO_to_GOslim].GO_id
Using DAVID (GO BP_FAT) found biological processes that are enriched in the gill proteome vs. the entire
proteome. The gene list (gill proteome) was the unique SPIDs used to annotate the 2,677 gill proteins andthe background were the SPID annotations for the entire proteome (from Zhang et al.). Visualized inRevigo.
Based on the significant eigenvectors (p<0.05) for the low vs. high pCO2 NMDS, found enrichment versusthe entire gill proteome.
87

Compared the list of proteins corresponding to significant eigenvectors for low pCO2 vs. low x MS andhigh pCO2 vs. high X MS. For the proteins unique to the high X MS response (i.e. were not shared betweenthe 2 lists), found the enrichment of biological processes compared to the entire gill proteome.
88

April 26, 2013Secondary Stress: ProteomicsFor the Skyline output, removed all peptides that matched to multiple proteins. Then kept only top 3 most abundant peptides per protein(abundance was determined based on total area across all replicates).Averaged peptide peak areas by protein in SQLSELECT protein, avg([11_01 TotalArea]), avg([11_02 TotalArea]), avg([11_03 TotalArea]), avg([2_01TotalArea]), avg([2_02 TotalArea]), avg([2_03 TotalArea]), avg([5_01 TotalArea]), avg([5_02 TotalArea]),avg([5_03 TotalArea]), avg([8_01 TotalArea]), avg([8_02 TotalArea]), avg([8_03 TotalArea]), avg([26_01TotalArea]), avg([26_02 TotalArea]), avg([26_02 TotalArea]), avg([26_03 TotalArea]), avg([29_01TotalArea]), avg([29_02 TotalArea]), avg([29_03 TotalArea]), avg([32_01 TotalArea]), avg([32_02TotalArea]), avg([32_03 TotalArea]), avg([35_01 TotalArea]), avg([35_02 TotalArea]), avg([35_03TotalArea]), avg([221_01 TotalArea]), avg([221_02 TotalArea]), avg([221_03 TotalArea]), avg([224_01TotalArea]), avg([224_02 TotalArea]), avg([224_03 TotalArea]), avg([227_01 TotalArea]), avg([227_02TotalArea]), avg([227_03 TotalArea]), avg([230_01 TotalArea]), avg([230_02 TotalArea]), avg([230_02TotalArea]), avg([242_01 TotalArea]), avg([242_02 TotalArea]), avg([242_03 TotalArea]), avg([245_01TotalArea]), avg([245_02 TotalArea]), avg([245_03 TotalArea]), avg([248_01 TotalArea]), avg([248_02TotalArea]), avg([248_03 TotalArea]), avg([251_01 TotalArea]), avg([251_02 TotalArea]), avg([251_03TotalArea]) FROM [[email protected]].[3 peps per protein.txt]Group by protein
April 18, 2013Secondary Stress: ProteomicsCreated a list of non-redundant protein-peptide associations. This is a combination of all the peptide sequences and their associated proteinssequenced across all injections. The file is called ProtPep for all oysters.Joined ProtPep file with file of all peak areas for sequenced peptides. This file has been edited so that peak areas are only for the precursor ion(not M+1 or M+2) and #N/A were replaced with 0. The joined file is peptide peak areas with associated proteins.
April 17, 2013Secondary Stress: ProteomicsCreated a report template called Oyster Report 1 that includes the information: Peptide sequence, precursor best retention time, precursor totalarea, protein name, precursor charge, percursor Mz, transition product charge, transition product Mz, transition fragmentation, checked box forpivot replicate name. Exported all samples and replicates using this template.
April 16, 2013Secondary Stress: ProteomicsBrendan gave me access to Skyline daily, a beta version of Skyline that has a lot of improvements compared to the public release. He hadfixed it so that it would take all my data files. I set up all the settings today (see below, also saved in a text file) and imported all the raw datafiles. The library is called Oyster_proteins_daily. All of the v9 "interact" files were used to construct the library (the C. gigas v9 proteome wasused in Sequest and only proteins with a probability of at least 0.9 were included - check that actually 0.9). In the spectral library explorer,clicked "add all" to ad all the peptides to the protein/peptide tree (did not include peptides that do not match the current filters). Selected all thepeptides in the tree then Edit > Refine to remove duplicate peptides and empty proteins.
Peptide SettingsDigestion: Enzyme = Trypsin [KR | P]Max missed cleavages = 2Background proteome = NoneModifications: Carbamidomethyl (C), Oxidation (M) - variable 89

Max variable mods = 3Max neutral losses = 1Isotop label type = heavyInternal standard type = heavyLibrary: Keep redundant libraryCut-off score = 0.95Pick peptides matching Library
Transition SettingsPredition: Precursor mass = MonoisotopicProduct ion mass = MonoisotopicCollision energy = Thermo TSQ VantageDeclustering potential = NoneFilter: Precursor charges = 2,3,4Ion charges = 1,2,3Ion types = pProduct ions: From m/z/ > precursorTo 3 ionsAlways add N-terminal to Proline
Auto-select all matching transitionsLibrary: Ion match tolerance = 0.5 ThDo not check "If a library spectrum is available, pick its most intense ions"Instrument: Min m/z = 50 Th, Max m/z = 2000 ThMethod match tolerance m/z = 0.055 ThFull-Scan: Isotope peaks included = CountPrecursor mass analyzer = OrbitrapPeaks = 3Resolving power = 60,000 at 400 ThIsotope labeling enrichment = DefaultAcquisition method = NoneUse only scans within 5 minutes of MS/MS IDs
April 13, 2013Secondary Stress: ProteomicsProteins were analyzed only if they had at least 2 unique peptide hits in a technical replicate and if they had at least 8 spectral counts across allreplicates. Calculated NSAF for all proteins and analyzed using NMDS. Made NMDS (kept all proteins for analysis) of all 4 treatments, MS athigh and low pCO2, and just comparison of pCO2. (R file is called NSAF proteomics.) ANOSIM was done for all 4 treatments, low pCO2 vs.MS, high pCO2 vs. MS, and high vs. low pCO2.
90
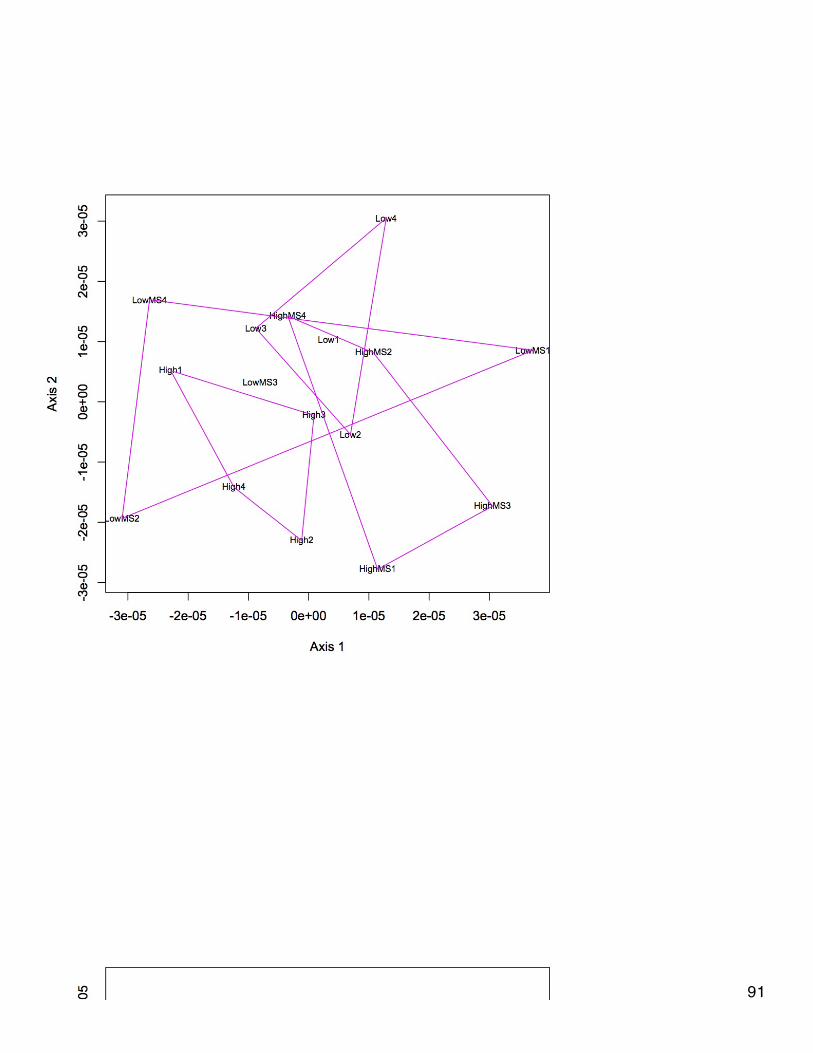
91

92
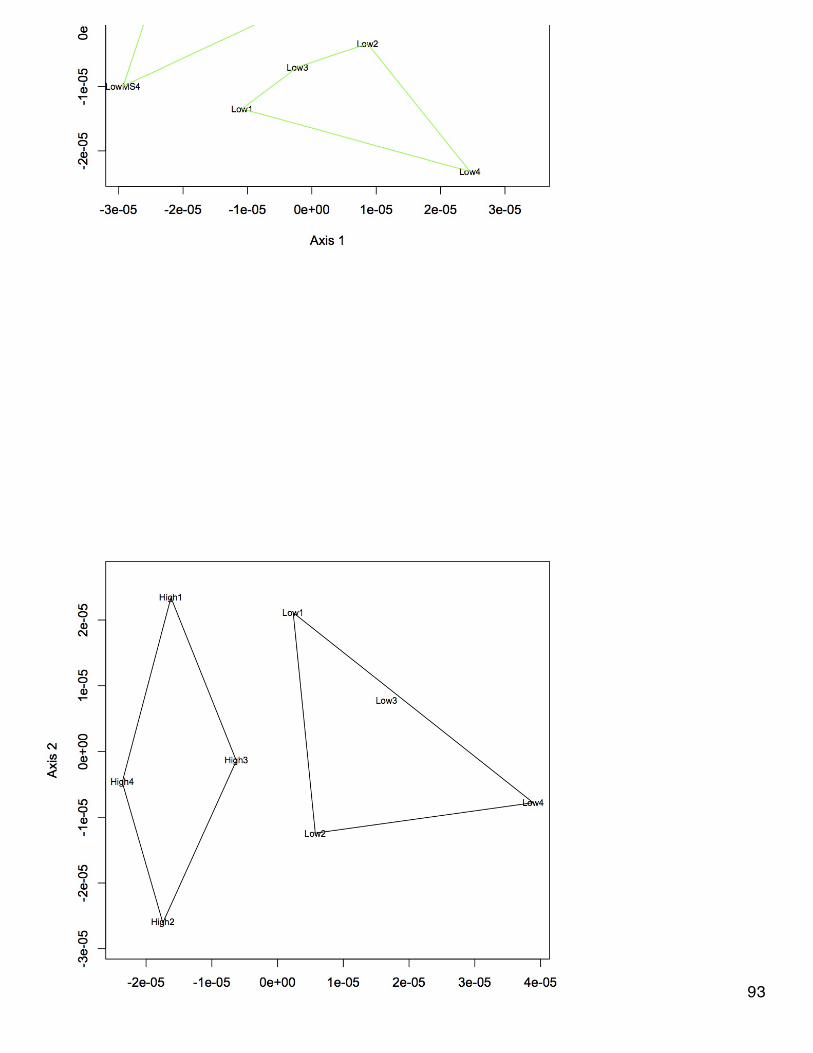
93
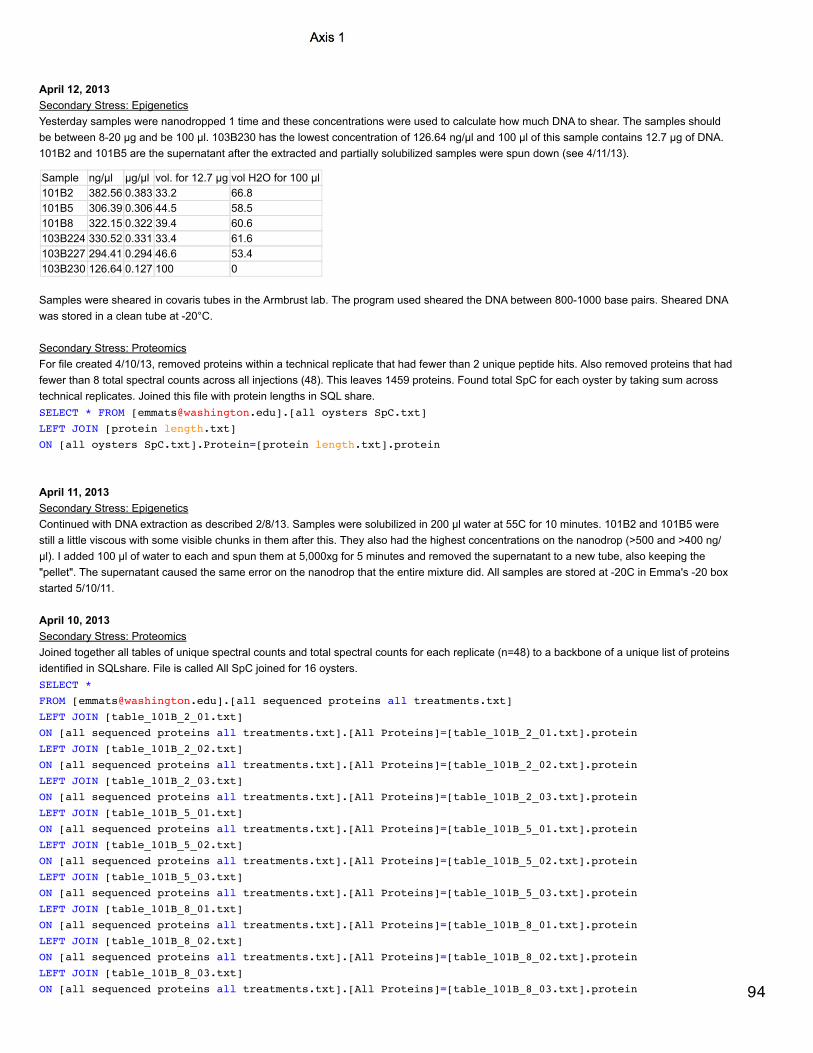
April 12, 2013Secondary Stress: EpigeneticsYesterday samples were nanodropped 1 time and these concentrations were used to calculate how much DNA to shear. The samples shouldbe between 8-20 µg and be 100 µl. 103B230 has the lowest concentration of 126.64 ng/µl and 100 µl of this sample contains 12.7 µg of DNA.101B2 and 101B5 are the supernatant after the extracted and partially solubilized samples were spun down (see 4/11/13).
Sample ng/µl µg/µl vol. for 12.7 µg vol H2O for 100 µl101B2 382.56 0.383 33.2 66.8101B5 306.39 0.306 44.5 58.5101B8 322.15 0.322 39.4 60.6103B224 330.52 0.331 33.4 61.6103B227 294.41 0.294 46.6 53.4103B230 126.64 0.127 100 0
Samples were sheared in covaris tubes in the Armbrust lab. The program used sheared the DNA between 800-1000 base pairs. Sheared DNAwas stored in a clean tube at -20°C.
Secondary Stress: ProteomicsFor file created 4/10/13, removed proteins within a technical replicate that had fewer than 2 unique peptide hits. Also removed proteins that hadfewer than 8 total spectral counts across all injections (48). This leaves 1459 proteins. Found total SpC for each oyster by taking sum acrosstechnical replicates. Joined this file with protein lengths in SQL share.SELECT * FROM [[email protected]].[all oysters SpC.txt]LEFT JOIN [protein length.txt]ON [all oysters SpC.txt].Protein=[protein length.txt].protein
April 11, 2013Secondary Stress: EpigeneticsContinued with DNA extraction as described 2/8/13. Samples were solubilized in 200 µl water at 55C for 10 minutes. 101B2 and 101B5 werestill a little viscous with some visible chunks in them after this. They also had the highest concentrations on the nanodrop (>500 and >400 ng/µl). I added 100 µl of water to each and spun them at 5,000xg for 5 minutes and removed the supernatant to a new tube, also keeping the"pellet". The supernatant caused the same error on the nanodrop that the entire mixture did. All samples are stored at -20C in Emma's -20 boxstarted 5/10/11.
April 10, 2013Secondary Stress: ProteomicsJoined together all tables of unique spectral counts and total spectral counts for each replicate (n=48) to a backbone of a unique list of proteinsidentified in SQLshare. File is called All SpC joined for 16 oysters.SELECT * FROM [[email protected]].[all sequenced proteins all treatments.txt]LEFT JOIN [table_101B_2_01.txt]ON [all sequenced proteins all treatments.txt].[All Proteins]=[table_101B_2_01.txt].proteinLEFT JOIN [table_101B_2_02.txt]ON [all sequenced proteins all treatments.txt].[All Proteins]=[table_101B_2_02.txt].proteinLEFT JOIN [table_101B_2_03.txt]ON [all sequenced proteins all treatments.txt].[All Proteins]=[table_101B_2_03.txt].proteinLEFT JOIN [table_101B_5_01.txt]ON [all sequenced proteins all treatments.txt].[All Proteins]=[table_101B_5_01.txt].proteinLEFT JOIN [table_101B_5_02.txt]ON [all sequenced proteins all treatments.txt].[All Proteins]=[table_101B_5_02.txt].proteinLEFT JOIN [table_101B_5_03.txt]ON [all sequenced proteins all treatments.txt].[All Proteins]=[table_101B_5_03.txt].proteinLEFT JOIN [table_101B_8_01.txt]ON [all sequenced proteins all treatments.txt].[All Proteins]=[table_101B_8_01.txt].proteinLEFT JOIN [table_101B_8_02.txt]ON [all sequenced proteins all treatments.txt].[All Proteins]=[table_101B_8_02.txt].proteinLEFT JOIN [table_101B_8_03.txt]ON [all sequenced proteins all treatments.txt].[All Proteins]=[table_101B_8_03.txt].proteinLEFT JOIN [table_101B_11_01.txt]
94

LEFT JOIN [table_101B_11_01.txt]ON [all sequenced proteins all treatments.txt].[All Proteins]=[table_101B_11_01.txt].proteinLEFT JOIN [table_101B_11_02.txt]ON [all sequenced proteins all treatments.txt].[All Proteins]=[table_101B_11_02.txt].protein
LEFT JOIN [table_101B_11_03.txt]ON [all sequenced proteins all treatments.txt].[All Proteins]=[table_101B_11_03.txt].proteinLEFT JOIN [table_101B_26_01.txt]ON [all sequenced proteins all treatments.txt].[All Proteins]=[table_101B_26_01.txt].proteinLEFT JOIN [table_101B_26_02.txt]ON [all sequenced proteins all treatments.txt].[All Proteins]=[table_101B_26_02.txt].proteinLEFT JOIN [table_101B_26_03.txt]ON [all sequenced proteins all treatments.txt].[All Proteins]=[table_101B_26_03.txt].proteinLEFT JOIN [table_101B_29_01.txt]ON [all sequenced proteins all treatments.txt].[All Proteins]=[table_101B_29_01.txt].proteinLEFT JOIN [table_101B_29_02.txt]ON [all sequenced proteins all treatments.txt].[All Proteins]=[table_101B_29_02.txt].proteinLEFT JOIN [table_101B_29_03.txt]ON [all sequenced proteins all treatments.txt].[All Proteins]=[table_101B_29_03.txt].proteinLEFT JOIN [table_101B_32_01.txt]ON [all sequenced proteins all treatments.txt].[All Proteins]=[table_101B_32_01.txt].proteinLEFT JOIN [table_101B_32_02.txt]ON [all sequenced proteins all treatments.txt].[All Proteins]=[table_101B_32_02.txt].proteinLEFT JOIN [table_101B_32_03.txt]ON [all sequenced proteins all treatments.txt].[All Proteins]=[table_101B_32_03.txt].proteinLEFT JOIN [table_101B_35_01.txt]ON [all sequenced proteins all treatments.txt].[All Proteins]=[table_101B_35_01.txt].proteinLEFT JOIN [table_101B_35_02.txt]ON [all sequenced proteins all treatments.txt].[All Proteins]=[table_101B_35_02.txt].proteinLEFT JOIN [table_101B_35_03.txt]ON [all sequenced proteins all treatments.txt].[All Proteins]=[table_101B_35_03.txt].proteinLEFT JOIN [table_103B_221_01.txt]ON [all sequenced proteins all treatments.txt].[All Proteins]=[table_103B_221_01.txt].proteinLEFT JOIN [table_103B_221_02.txt]ON [all sequenced proteins all treatments.txt].[All Proteins]=[table_103B_221_02.txt].proteinLEFT JOIN [table_103B_221_03.txt]ON [all sequenced proteins all treatments.txt].[All Proteins]=[table_103B_221_03.txt].proteinLEFT JOIN [table_103B_224_01.txt]ON [all sequenced proteins all treatments.txt].[All Proteins]=[table_103B_224_01.txt].proteinLEFT JOIN [table_103B_224_02.txt]ON [all sequenced proteins all treatments.txt].[All Proteins]=[table_103B_224_02.txt].proteinLEFT JOIN [table_103B_224_03.txt]ON [all sequenced proteins all treatments.txt].[All Proteins]=[table_103B_224_03.txt].proteinLEFT JOIN [table_103B_227_01.txt]ON [all sequenced proteins all treatments.txt].[All Proteins]=[table_103B_227_01.txt].proteinLEFT JOIN [table_103B_227_02.txt]ON [all sequenced proteins all treatments.txt].[All Proteins]=[table_103B_227_02.txt].proteinLEFT JOIN [table_103B_227_03.txt]ON [all sequenced proteins all treatments.txt].[All Proteins]=[table_103B_227_03.txt].proteinLEFT JOIN [table_103B_230_01.txt]ON [all sequenced proteins all treatments.txt].[All Proteins]=[table_103B_230_01.txt].proteinLEFT JOIN [table_103B_230_02.txt]ON [all sequenced proteins all treatments.txt].[All Proteins]=[table_103B_230_02.txt].protein
LEFT JOIN [table_103B_230_03.txt]ON [all sequenced proteins all treatments.txt].[All Proteins]=[table_103B_230_03.txt].proteinLEFT JOIN [table_103B_242_01.txt]ON [all sequenced proteins all treatments.txt].[All Proteins]=[table_103B_242_01.txt].proteinLEFT JOIN [table_103B_242_02.txt]ON [all sequenced proteins all treatments.txt].[All Proteins]=[table_103B_242_02.txt].proteinLEFT JOIN [table_103B_242_03.txt]ON [all sequenced proteins all treatments.txt].[All Proteins]=[table_103B_242_03.txt].proteinLEFT JOIN [table_103B_245_01.txt] 95

edit
LEFT JOIN [table_103B_245_01.txt]ON [all sequenced proteins all treatments.txt].[All Proteins]=[table_103B_245_01.txt].proteinLEFT JOIN [table_103B_245_02.txt]ON [all sequenced proteins all treatments.txt].[All Proteins]=[table_103B_245_02.txt].proteinLEFT JOIN [table_103B_245_03.txt]ON [all sequenced proteins all treatments.txt].[All Proteins]=[table_103B_245_03.txt].proteinLEFT JOIN [table_103B_248_01.txt]ON [all sequenced proteins all treatments.txt].[All Proteins]=[table_103B_248_01.txt].proteinLEFT JOIN [table_103B_248_02.txt]ON [all sequenced proteins all treatments.txt].[All Proteins]=[table_103B_248_02.txt].proteinLEFT JOIN [table_103B_248_03.txt]ON [all sequenced proteins all treatments.txt].[All Proteins]=[table_103B_248_03.txt].proteinLEFT JOIN [table_103B_251_01.txt]ON [all sequenced proteins all treatments.txt].[All Proteins]=[table_103B_251_01.txt].proteinLEFT JOIN [table_103B_251_02.txt]ON [all sequenced proteins all treatments.txt].[All Proteins]=[table_103B_251_02.txt].proteinLEFT JOIN [table_103B_251_03.txt]ON [all sequenced proteins all treatments.txt].[All Proteins]=[table_103B_251_03.txt].protein
Secondary Stress: EpigeneticsExtracted DNA from 6 oysters to do medip. These 6 oysters are part of the 16 that were used for proteomics in August 2012. Posterior gilltissue was used from high pCO2 sample numbers 101B2, 101B5, 101B8 and low pCO2 number 103B224, 103B227, and 103B230. Gill tissuewas homogenized in 0.5 mL of DNazol using a sterile pestle. 0.5 mL more DNazol and 2.35 µl proteinase K were added and tubes wereinverted to mix. Tubes were incubated on the rotating thingy overnight at room temperature.
April 2, 2013Oly EpigeneticsThe reason the data looked terrible yesterday was because the polymer in the ABI hadn't been changed recently. Bruce did maintenance andre-ran the plate. I still had to run the modified size standard without the 250 and 340 peaks because they were still low quality. Size qualityfailed for samples DAB092_Msp1, DAB094_Msp1, FID093_MSp1. Added some new bins to the primer 1 panel and saved as primer 1.2.FID094_Hpa1
April 1, 2013Oly EpigeneticsMade a dilution plate (1:15) of the primer 1 select PCR and columns 1-5 of the primer 2 select PCR (see 3/29/13). Ran this plate on the ABI3730 as described previously.The size standards were not very good on this run for some reason (I used the ROX 500, same as last time, so I'm not sure what went wrong).Went through and corrected the incorrect size standard peaks. The size standard was good for the last time I ran samples, so I will use thelocations of these previous peaks to call the correct peaks this time (used data from 3/25/13).
Size Standard Peak Location 3/25
35 94250 108075 1370100 1640139 2090150 2202160 2315200 2787250 3355300 3995340 4470350 4593400 5230450 5813490 6298500 6397
the 35 bp peak is called incorrectly in at least one sample, so changed analysis method peak detector range to start at 940. The problem withthe size standard seems to be at peaks 340 and possibly 250. Made new size standard (GS500 040113) without peak 340 and analyzed data.Also got rid of size standard peaks >400.The MSAFLP data looks really bad too, so something went wrong.I also looked at the data from primer set 2. The size standard also looks bad, especially at peaks 35, 250, 340, and >400. The MSAFLP peaksare also unreadable. 96
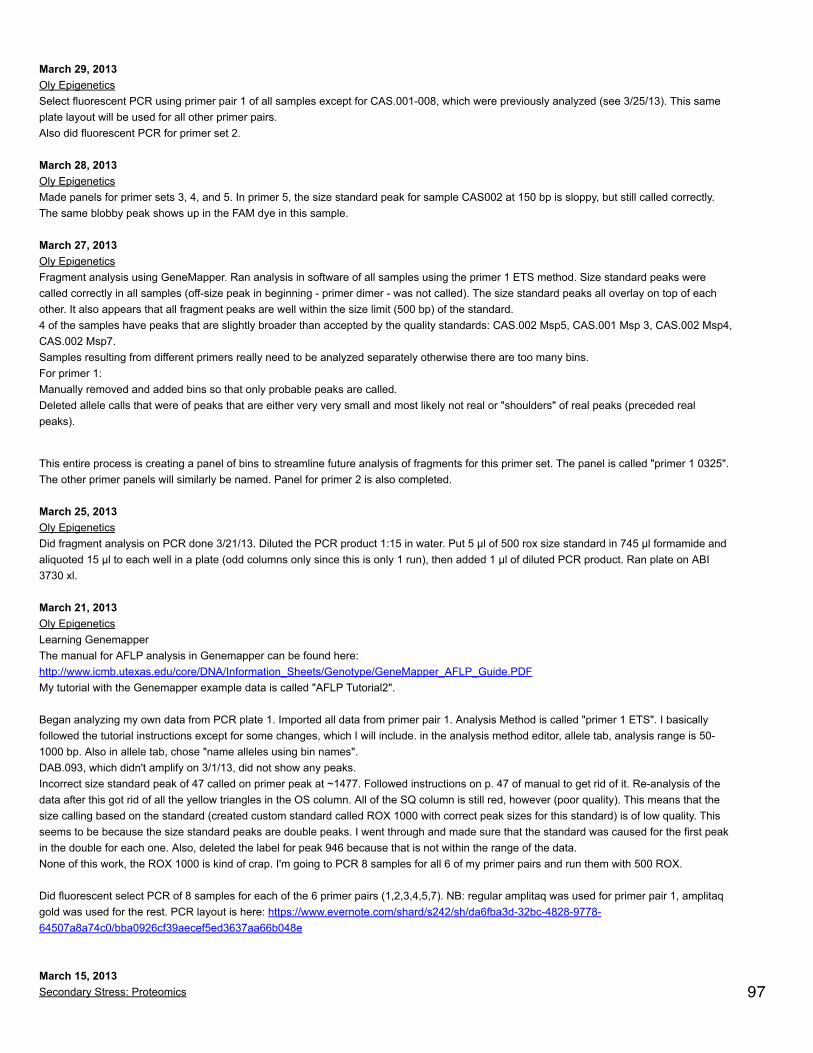
are also unreadable.
March 29, 2013Oly EpigeneticsSelect fluorescent PCR using primer pair 1 of all samples except for CAS.001-008, which were previously analyzed (see 3/25/13). This sameplate layout will be used for all other primer pairs.Also did fluorescent PCR for primer set 2.
March 28, 2013Oly EpigeneticsMade panels for primer sets 3, 4, and 5. In primer 5, the size standard peak for sample CAS002 at 150 bp is sloppy, but still called correctly.The same blobby peak shows up in the FAM dye in this sample.
March 27, 2013Oly EpigeneticsFragment analysis using GeneMapper. Ran analysis in software of all samples using the primer 1 ETS method. Size standard peaks werecalled correctly in all samples (off-size peak in beginning - primer dimer - was not called). The size standard peaks all overlay on top of eachother. It also appears that all fragment peaks are well within the size limit (500 bp) of the standard.4 of the samples have peaks that are slightly broader than accepted by the quality standards: CAS.002 Msp5, CAS.001 Msp 3, CAS.002 Msp4,CAS.002 Msp7. Samples resulting from different primers really need to be analyzed separately otherwise there are too many bins.For primer 1:Manually removed and added bins so that only probable peaks are called.Deleted allele calls that were of peaks that are either very very small and most likely not real or "shoulders" of real peaks (preceded realpeaks).
This entire process is creating a panel of bins to streamline future analysis of fragments for this primer set. The panel is called "primer 1 0325".The other primer panels will similarly be named. Panel for primer 2 is also completed.
March 25, 2013Oly EpigeneticsDid fragment analysis on PCR done 3/21/13. Diluted the PCR product 1:15 in water. Put 5 µl of 500 rox size standard in 745 µl formamide andaliquoted 15 µl to each well in a plate (odd columns only since this is only 1 run), then added 1 µl of diluted PCR product. Ran plate on ABI3730 xl.
March 21, 2013Oly EpigeneticsLearning GenemapperThe manual for AFLP analysis in Genemapper can be found here:http://www.icmb.utexas.edu/core/DNA/Information_Sheets/Genotype/GeneMapper_AFLP_Guide.PDFMy tutorial with the Genemapper example data is called "AFLP Tutorial2".
Began analyzing my own data from PCR plate 1. Imported all data from primer pair 1. Analysis Method is called "primer 1 ETS". I basicallyfollowed the tutorial instructions except for some changes, which I will include. in the analysis method editor, allele tab, analysis range is 50-1000 bp. Also in allele tab, chose "name alleles using bin names".DAB.093, which didn't amplify on 3/1/13, did not show any peaks.Incorrect size standard peak of 47 called on primer peak at ~1477. Followed instructions on p. 47 of manual to get rid of it. Re-analysis of thedata after this got rid of all the yellow triangles in the OS column. All of the SQ column is still red, however (poor quality). This means that thesize calling based on the standard (created custom standard called ROX 1000 with correct peak sizes for this standard) is of low quality. Thisseems to be because the size standard peaks are double peaks. I went through and made sure that the standard was caused for the first peakin the double for each one. Also, deleted the label for peak 946 because that is not within the range of the data.None of this work, the ROX 1000 is kind of crap. I'm going to PCR 8 samples for all 6 of my primer pairs and run them with 500 ROX.
Did fluorescent select PCR of 8 samples for each of the 6 primer pairs (1,2,3,4,5,7). NB: regular amplitaq was used for primer pair 1, amplitaqgold was used for the rest. PCR layout is here: https://www.evernote.com/shard/s242/sh/da6fba3d-32bc-4828-9778-64507a8a74c0/bba0926cf39aecef5ed3637aa66b048e
March 15, 2013Secondary Stress: Proteomics 97
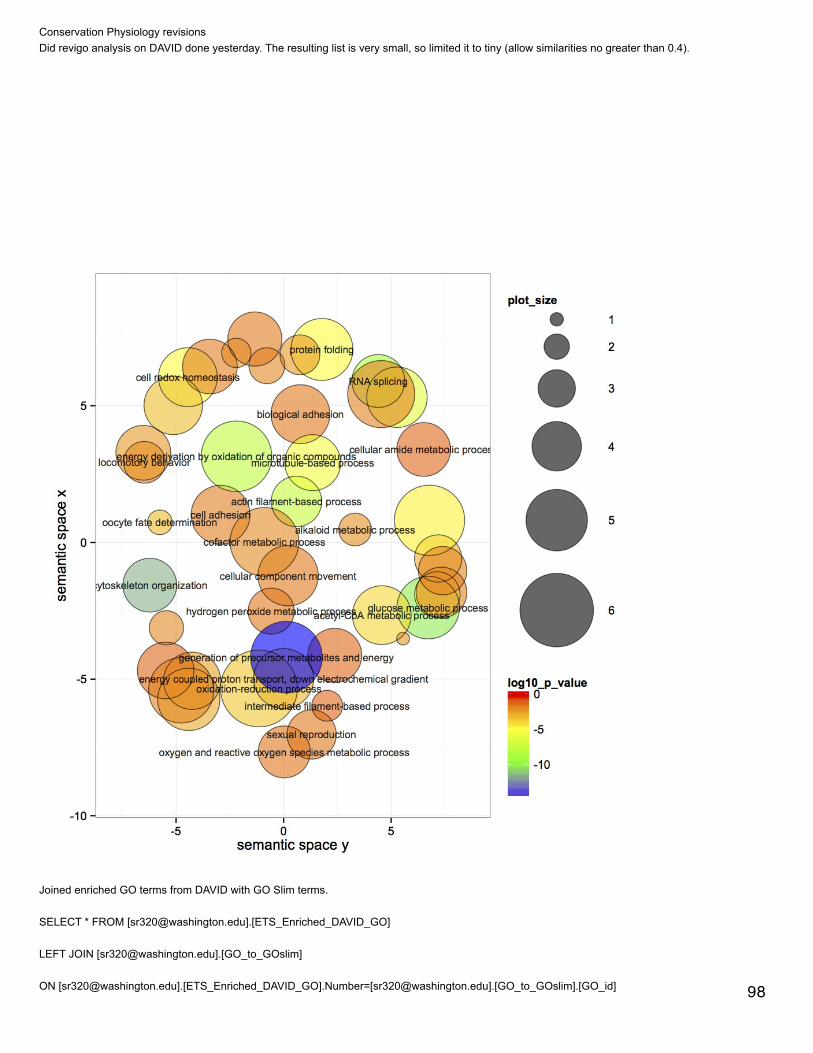
Conservation Physiology revisionsDid revigo analysis on DAVID done yesterday. The resulting list is very small, so limited it to tiny (allow similarities no greater than 0.4).
Joined enriched GO terms from DAVID with GO Slim terms.
SELECT * FROM [[email protected]].[ETS_Enriched_DAVID_GO]
LEFT JOIN [[email protected]].[GO_to_GOslim]
ON [[email protected]].[ETS_Enriched_DAVID_GO].Number=[[email protected]].[GO_to_GOslim].[GO_id] 98
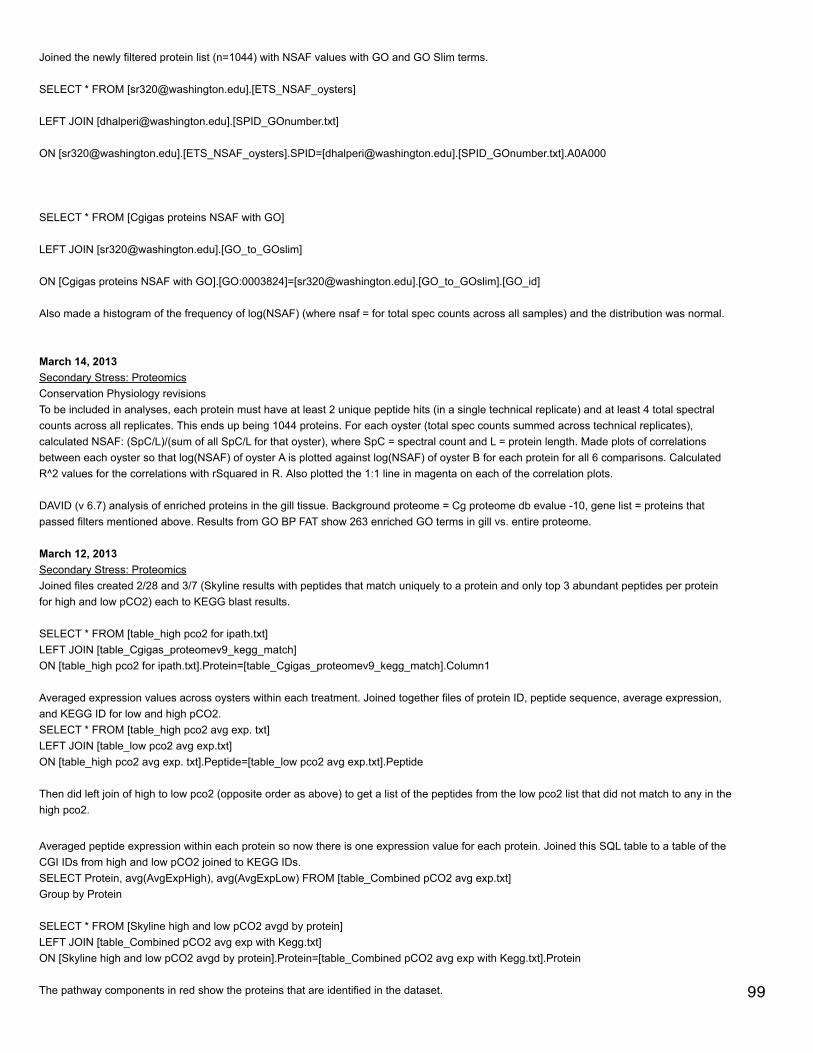
Joined the newly filtered protein list (n=1044) with NSAF values with GO and GO Slim terms.
SELECT * FROM [[email protected]].[ETS_NSAF_oysters]
LEFT JOIN [[email protected]].[SPID_GOnumber.txt]
ON [[email protected]].[ETS_NSAF_oysters].SPID=[[email protected]].[SPID_GOnumber.txt].A0A000
SELECT * FROM [Cgigas proteins NSAF with GO]
LEFT JOIN [[email protected]].[GO_to_GOslim]
ON [Cgigas proteins NSAF with GO].[GO:0003824]=[[email protected]].[GO_to_GOslim].[GO_id]
Also made a histogram of the frequency of log(NSAF) (where nsaf = for total spec counts across all samples) and the distribution was normal.
March 14, 2013Secondary Stress: ProteomicsConservation Physiology revisionsTo be included in analyses, each protein must have at least 2 unique peptide hits (in a single technical replicate) and at least 4 total spectralcounts across all replicates. This ends up being 1044 proteins. For each oyster (total spec counts summed across technical replicates),calculated NSAF: (SpC/L)/(sum of all SpC/L for that oyster), where SpC = spectral count and L = protein length. Made plots of correlationsbetween each oyster so that log(NSAF) of oyster A is plotted against log(NSAF) of oyster B for each protein for all 6 comparisons. CalculatedR^2 values for the correlations with rSquared in R. Also plotted the 1:1 line in magenta on each of the correlation plots.
DAVID (v 6.7) analysis of enriched proteins in the gill tissue. Background proteome = Cg proteome db evalue -10, gene list = proteins thatpassed filters mentioned above. Results from GO BP FAT show 263 enriched GO terms in gill vs. entire proteome.
March 12, 2013Secondary Stress: ProteomicsJoined files created 2/28 and 3/7 (Skyline results with peptides that match uniquely to a protein and only top 3 abundant peptides per proteinfor high and low pCO2) each to KEGG blast results.
SELECT * FROM [table_high pco2 for ipath.txt]LEFT JOIN [table_Cgigas_proteomev9_kegg_match]ON [table_high pco2 for ipath.txt].Protein=[table_Cgigas_proteomev9_kegg_match].Column1
Averaged expression values across oysters within each treatment. Joined together files of protein ID, peptide sequence, average expression,and KEGG ID for low and high pCO2.SELECT * FROM [table_high pco2 avg exp. txt]LEFT JOIN [table_low pco2 avg exp.txt]ON [table_high pco2 avg exp. txt].Peptide=[table_low pco2 avg exp.txt].Peptide
Then did left join of high to low pco2 (opposite order as above) to get a list of the peptides from the low pco2 list that did not match to any in thehigh pco2.
Averaged peptide expression within each protein so now there is one expression value for each protein. Joined this SQL table to a table of theCGI IDs from high and low pCO2 joined to KEGG IDs.SELECT Protein, avg(AvgExpHigh), avg(AvgExpLow) FROM [table_Combined pCO2 avg exp.txt]Group by Protein
SELECT * FROM [Skyline high and low pCO2 avgd by protein]LEFT JOIN [table_Combined pCO2 avg exp with Kegg.txt]ON [Skyline high and low pCO2 avgd by protein].Protein=[table_Combined pCO2 avg exp with Kegg.txt].Protein
The pathway components in red show the proteins that are identified in the dataset. 99

https://www.evernote.com/shard/s242/sh/b59a5540-9104-4cb3-a773-bdd48874854c/4f93f4e691036d065e332c461abc6547
The pathway components in purple show components that are expressed more at low pCO2, those in green are expressed more at highpCO2. The input file for this is called ipath input 1.https://www.evernote.com/shard/s242/sh/98249a09-9873-4405-9d14-ca0edeb8e60a/9d84d6b9889cd5ad1ea297038db3cf23
Oly EpigeneticsPrepared dilution plate (1:15) of PCR plate 1 done on 3/1/13. Diluted 10 µl of ROX 1000 in 1490 µl Formamide. Aliquoted 15 µl of theformamide-ROX into sequencing plate and added 1 µl of diluted PCR product to each well. Did fragment analysis on ABI 3730xl.
March 8, 2013Secondary Stress: ProteomicsRevisions of Conservation Physiology paperFor all low pCO2 (no MS) oysters, made new files with one column of protein ID, one column of unique peptide hits, and 1 column of totalspectral count. Combined all the unique protein identifications across these files into a file of all proteins sequenced.
March 7, 2013Secondary Stress: ProteomicsFor peptides with Skyline expression values for the low pCO2 oysters, created a file similar to that created for high pCO2 2/28/13. Removedpeptides that mapped to multiple proteins. Peak areas for technical replicates were averaged for each oyster. Based on the total peak areaacross all biological and technical replicates, retained only the 3 most abundant peptides for each protein.Checked on the status of the KEGG blast - about 15,000 matches have been made so it is just over halfway done.
To further investigate correlations between spectral counts, uploaded files of spec counts per peptide for all low and all high pCO2 oysters toSQL and joined to a "backbone" of all unique peptides across all 8 samples.
SELECT [table_peptide IDs for low and high pco2.txt].*,[table_101B2_01_speccounts.txt].*,[table_101B2_02_speccounts.txt].*, [table_101B2_03_speccounts.txt].*, [table_101B5_01_speccounts.txt].*,[table_101B5_02_speccounts.txt].*, [table_101B5_03_speccounts.txt].*, [table_101B8_01_speccounts.txt].*,[table_101B8_02_speccounts.txt].*, [table_101B8_03_speccounts.txt].*, [table_101B11_01_speccounts.txt].*,[table_101B11_02_speccounts.txt].*, [table_101B11_03_speccounts.txt].*,[table_103B221_01_speccounts.txt].*, [table_103B221_02_speccounts.txt].*,[table_103B221_03_speccounts.txt].*, [table_103B224_01_speccounts.txt].*,[table_103B224_02_speccounts.txt].*, [table_103B224_03_speccounts.txt].*,[table_103B227_01_speccounts.txt].*, [table_103B227_02_speccounts.txt].*,[table_103B227_03_speccounts.txt].*, [table_103B230_01_speccounts.txt].*,[table_103B230_02_speccounts.txt].*, [table_103B230_03_speccounts.txt].*
FROM [table_peptide IDs for low and high pco2.txt]
LEFT JOIN [table_101B2_01_speccounts.txt]
ON [table_101B2_01_speccounts.txt].ProtPep=[table_peptide IDs for low and high pco2.txt].Column1
LEFT JOIN [table_101B2_02_speccounts.txt]
ON [table_101B2_02_speccounts.txt].ProtPep=[table_peptide IDs for low and high pco2.txt].Column1
LEFT JOIN [table_101B2_03_speccounts.txt]
ON [table_101B2_03_speccounts.txt].ProtPep=[table_peptide IDs for low and high pco2.txt].Column1
LEFT JOIN [table_101B5_01_speccounts.txt]
ON [table_101B5_01_speccounts.txt].ProtPep=[table_peptide IDs for low and high pco2.txt].Column1
LEFT JOIN [table_101B5_02_speccounts.txt]
ON [table_101B5_02_speccounts.txt].ProtPep=[table_peptide IDs for low and high pco2.txt].Column1
LEFT JOIN [table_101B5_03_speccounts.txt] 100

LEFT JOIN [table_101B5_03_speccounts.txt]
ON [table_101B5_03_speccounts.txt].ProtPep=[table_peptide IDs for low and high pco2.txt].Column1
LEFT JOIN [table_101B8_01_speccounts.txt]
ON [table_101B8_01_speccounts.txt].ProtPep=[table_peptide IDs for low and high pco2.txt].Column1
LEFT JOIN [table_101B8_02_speccounts.txt]
ON [table_101B8_02_speccounts.txt].ProtPep=[table_peptide IDs for low and high pco2.txt].Column1
LEFT JOIN [table_101B8_03_speccounts.txt]
ON [table_101B8_03_speccounts.txt].ProtPep=[table_peptide IDs for low and high pco2.txt].Column1
LEFT JOIN [table_101B11_01_speccounts.txt]
ON [table_101B11_01_speccounts.txt].ProtPep=[table_peptide IDs for low and high pco2.txt].Column1
LEFT JOIN [table_101B11_02_speccounts.txt]
ON [table_101B11_02_speccounts.txt].ProtPep=[table_peptide IDs for low and high pco2.txt].Column1
LEFT JOIN [table_101B11_03_speccounts.txt]
ON [table_101B11_03_speccounts.txt].ProtPep=[table_peptide IDs for low and high pco2.txt].Column1
LEFT JOIN [table_103B221_01_speccounts.txt]
ON [table_103B221_01_speccounts.txt].ProtPep=[table_peptide IDs for low and high pco2.txt].Column1
LEFT JOIN [table_103B221_02_speccounts.txt]
ON [table_103B221_02_speccounts.txt].ProtPep=[table_peptide IDs for low and high pco2.txt].Column1
LEFT JOIN [table_103B221_03_speccounts.txt]
ON [table_103B221_03_speccounts.txt].ProtPep=[table_peptide IDs for low and high pco2.txt].Column1
LEFT JOIN [table_103B224_01_speccounts.txt]
ON [table_103B224_01_speccounts.txt].ProtPep=[table_peptide IDs for low and high pco2.txt].Column1
LEFT JOIN [table_103B224_02_speccounts.txt]
ON [table_103B224_02_speccounts.txt].ProtPep=[table_peptide IDs for low and high pco2.txt].Column1
LEFT JOIN [table_103B224_03_speccounts.txt]
ON [table_103B224_03_speccounts.txt].ProtPep=[table_peptide IDs for low and high pco2.txt].Column1
LEFT JOIN [table_103B227_01_speccounts.txt]
ON [table_103B227_01_speccounts.txt].ProtPep=[table_peptide IDs for low and high pco2.txt].Column1
LEFT JOIN [table_103B227_02_speccounts.txt]
ON [table_103B227_02_speccounts.txt].ProtPep=[table_peptide IDs for low and high pco2.txt].Column1
LEFT JOIN [table_103B227_03_speccounts.txt] 101

ON [table_103B227_03_speccounts.txt].ProtPep=[table_peptide IDs for low and high pco2.txt].Column1
LEFT JOIN [table_103B230_01_speccounts.txt]
ON [table_103B230_01_speccounts.txt].ProtPep=[table_peptide IDs for low and high pco2.txt].Column1
LEFT JOIN [table_103B230_02_speccounts.txt]
ON [table_103B230_02_speccounts.txt].ProtPep=[table_peptide IDs for low and high pco2.txt].Column1
LEFT JOIN [table_103B230_03_speccounts.txt]
ON [table_103B230_03_speccounts.txt].ProtPep=[table_peptide IDs for low and high pco2.txt].Column1
Graph of correlation (each dot represents a peptide) of sums of spec counts for high and low pCO2. The pink line is the 1:1 line.
March 5, 2013Bioinformatics: Assignment 8Converted vcf file to gff in iPlant (VCG to GFF3). Uploaded to galaxy and viewed using trackster against the C. gigas genome. this results in anerror, so I am visualizing in igv.
https://www.evernote.com/shard/s242/sh/48c52c8f-20ff-4f48-b06c-2fa80c96b331/fb9850f68bde673132e703385a5f27f2
Converted GFF To a BED file in galaxy and viewed the SNPs using circster: https://www.evernote.com/shard/s242/sh/1447ebee-81d5-4c30-b90b-1043c9a5d7d6/a05c491eef8c4fd7d77b2c6d9debe404 . I also viewed in trackster (name = SNPs).
102
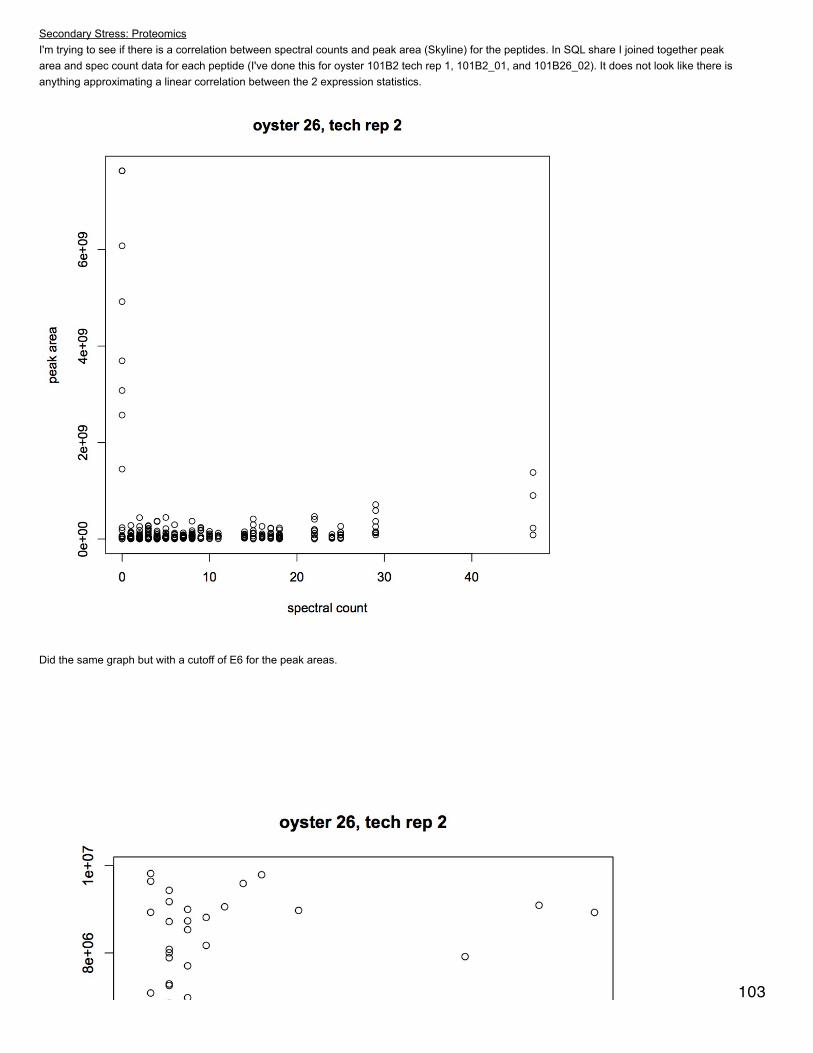
Secondary Stress: ProteomicsI'm trying to see if there is a correlation between spectral counts and peak area (Skyline) for the peptides. In SQL share I joined together peakarea and spec count data for each peptide (I've done this for oyster 101B2 tech rep 1, 101B2_01, and 101B26_02). It does not look like there isanything approximating a linear correlation between the 2 expression statistics.
Did the same graph but with a cutoff of E6 for the peak areas.
103

Associating C. gigas proteins with KEGG IDs. Downloaded KEGG ID sequences (see 2/28/13) and made a blast db.
./makeblastdb -in /Users/Emma/Documents/kegg/KEGG_IDs.txt -dbtype prot -out /Users/Emma/Documents/kegg/kegg_db_030513
blastp of oyster proteome (from genome project) against KEGG db../blastp -num_threads 8 -out /Users/Emma/Documents/kegg/Cgigas_proteomev9_kegg_match -db/Users/Emma/Documents/kegg/kegg_db_030513 -outfmt 6 -evalue 1E-5 -max_target_seqs 1 -query/Volumes/web/oyster/oyster_v9_aa_format1.fasta
March 4, 2013Secondary Stress: Fatty acidsI met with Mike Brett this morning to discuss my results. He says the analysis so far looks good and there's really tight replication acrosssamples so he thinks the data are good overall. He suggested that I look at total lipids per dry weight for the oysters to see if there is adifference in overall fat content.
Oly EpigeneticsMade a dilution plate to run a dilution test of the fluorescent select PCR done 3/1/13. Used columns 2 and 6 from the PCR plate and dilutedeach of these 1:10, 1:20, 1:50 in nanopure water (this is 6 columns, 48 samples, equal to one run on the 3730xl). I mixed 5 µl ROX1000 sizestandard with 745 µl formamide and aliquoted 15 µl of this into each well for sequencing. Then added 1 µl of PCR product to theformamide/ROX mixture. Plate was run with a long run on the 3730 xl. It looks like somewhere between then 1:10 and 1:20 dilutions will workbest. Identified the size peaks in the ROX1000 (https://www.evernote.com/shard/s242/sh/d54bd104-56f7-47ae-98d4-ad10cf23f643/2cc6cf532fa88f13b3058805f7a03c82 ). I had stored the ROX at -20°C because it arrived on ice, but it should be stored at 4°C(it has been moved to the fridge).
Bioinformatics: Assignment 8Can't figure out how to use the SNP output from 2/28/13. Mac says that SR said to use Find SNPs - mpileup in iPlant. Used C. gigas genomeas reference and RNASeq output accepted hits.bam as the bam file. First 26 lines of file need to be removed, however galaxy isn't workingright now...
Secondary Stress: ProteomicsWorked with Brendan to figure out why Skyline can't upload all the raw files at once. I was able to upload ~70% of the raw files. Brendanfigured out that one of the reasons why all the peptides weren't registering in the library was because the instrument max in the transitionsettings needs to be at 2,000. 104

March 1, 2013Oly EpigeneticsSelect PCR with fluorescent primers. I am using only the DAB.091 sample extracted 2/8/13. PCR reaction was prepared as follows for Msp andHpa for primer pair 1 and Msp only for primer pair 2: 4 µl pre-select PCR product, 2.5 µl 10X amplitaq buffer (no salt), 2 µl 10 mM dNTPs, 1.75µl 50 mM MgCl2, 0.6 µl of each 10 µM primer (Eco primer is fluorescent), 12.35 µL H2O, 0.2 µl amplitaq. Total reaction volume = 24 µl. PCRwas run on thermalcycler protocol PRESEL (see 2/12/13). New primer working stocks were made for H/M select primers TCG and TGC.3 µl of PCR product was mixed with 5 µl loading dye and run for 30 minutes on a 1% agarose gel with EtBr at 100 V. Both primer pairsamplified product on the gel and there was no contamination in the negative controls. One sample (DAB.093) did not amplify.
https://www.evernote.com/shard/s242/sh/261907da-76e6-4372-ad30-5f57e20667a4/7e4679b8ab89bfd85430f53c43e8c87b
105
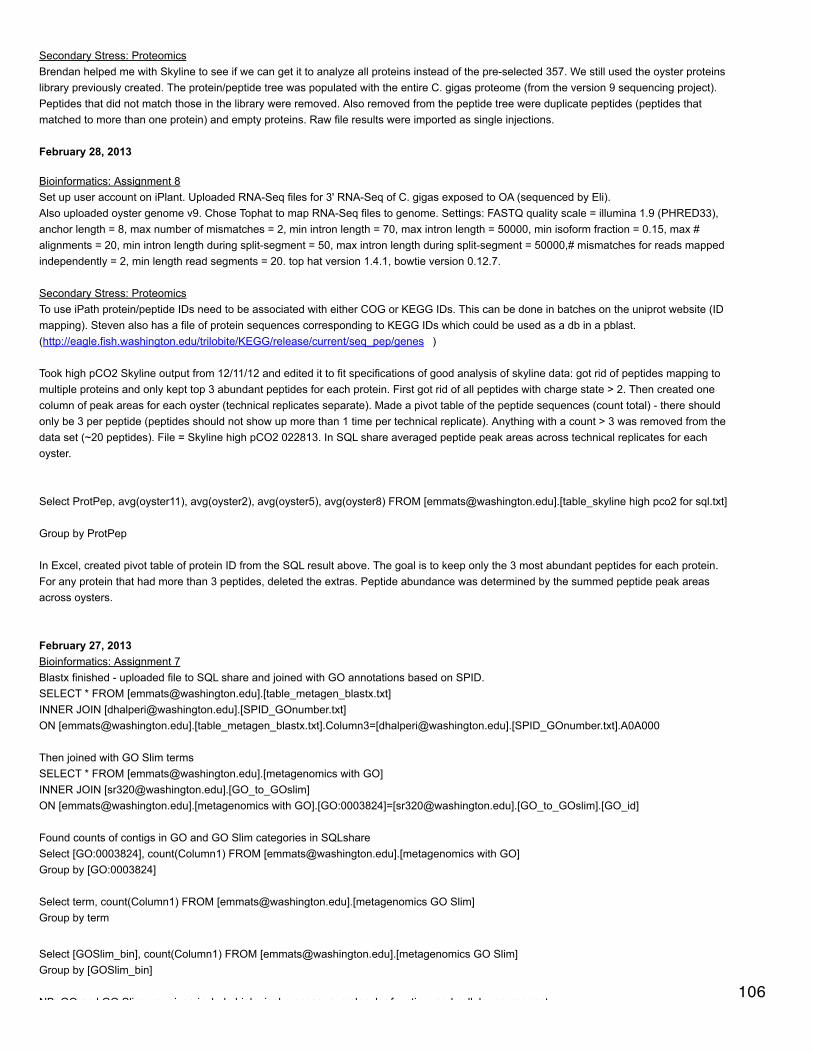
Secondary Stress: ProteomicsBrendan helped me with Skyline to see if we can get it to analyze all proteins instead of the pre-selected 357. We still used the oyster proteinslibrary previously created. The protein/peptide tree was populated with the entire C. gigas proteome (from the version 9 sequencing project).Peptides that did not match those in the library were removed. Also removed from the peptide tree were duplicate peptides (peptides thatmatched to more than one protein) and empty proteins. Raw file results were imported as single injections.
February 28, 2013
Bioinformatics: Assignment 8Set up user account on iPlant. Uploaded RNA-Seq files for 3' RNA-Seq of C. gigas exposed to OA (sequenced by Eli).Also uploaded oyster genome v9. Chose Tophat to map RNA-Seq files to genome. Settings: FASTQ quality scale = illumina 1.9 (PHRED33),anchor length = 8, max number of mismatches = 2, min intron length = 70, max intron length = 50000, min isoform fraction = 0.15, max #alignments = 20, min intron length during split-segment = 50, max intron length during split-segment = 50000,# mismatches for reads mappedindependently = 2, min length read segments = 20. top hat version 1.4.1, bowtie version 0.12.7.
Secondary Stress: ProteomicsTo use iPath protein/peptide IDs need to be associated with either COG or KEGG IDs. This can be done in batches on the uniprot website (IDmapping). Steven also has a file of protein sequences corresponding to KEGG IDs which could be used as a db in a pblast.(http://eagle.fish.washington.edu/trilobite/KEGG/release/current/seq_pep/genes )
Took high pCO2 Skyline output from 12/11/12 and edited it to fit specifications of good analysis of skyline data: got rid of peptides mapping tomultiple proteins and only kept top 3 abundant peptides for each protein. First got rid of all peptides with charge state > 2. Then created onecolumn of peak areas for each oyster (technical replicates separate). Made a pivot table of the peptide sequences (count total) - there shouldonly be 3 per peptide (peptides should not show up more than 1 time per technical replicate). Anything with a count > 3 was removed from thedata set (~20 peptides). File = Skyline high pCO2 022813. In SQL share averaged peptide peak areas across technical replicates for eachoyster.
Select ProtPep, avg(oyster11), avg(oyster2), avg(oyster5), avg(oyster8) FROM [[email protected]].[table_skyline high pco2 for sql.txt]
Group by ProtPep
In Excel, created pivot table of protein ID from the SQL result above. The goal is to keep only the 3 most abundant peptides for each protein.For any protein that had more than 3 peptides, deleted the extras. Peptide abundance was determined by the summed peptide peak areasacross oysters.
February 27, 2013Bioinformatics: Assignment 7Blastx finished - uploaded file to SQL share and joined with GO annotations based on SPID.SELECT * FROM [[email protected]].[table_metagen_blastx.txt]INNER JOIN [[email protected]].[SPID_GOnumber.txt]ON [[email protected]].[table_metagen_blastx.txt].Column3=[[email protected]].[SPID_GOnumber.txt].A0A000
Then joined with GO Slim termsSELECT * FROM [[email protected]].[metagenomics with GO]INNER JOIN [[email protected]].[GO_to_GOslim]ON [[email protected]].[metagenomics with GO].[GO:0003824]=[[email protected]].[GO_to_GOslim].[GO_id]
Found counts of contigs in GO and GO Slim categories in SQLshareSelect [GO:0003824], count(Column1) FROM [[email protected]].[metagenomics with GO]Group by [GO:0003824]
Select term, count(Column1) FROM [[email protected]].[metagenomics GO Slim]Group by term
Select [GOSlim_bin], count(Column1) FROM [[email protected]].[metagenomics GO Slim]Group by [GOSlim_bin]
NB: GO and GO Slim groupings include biological processes, molecular function, and cellular component.106

NB: GO and GO Slim groupings include biological processes, molecular function, and cellular component.
Secondary Stress: Fatty acidsRedid NMDS with new 237 data (sample was diluted and rerun). 237 is no longer an outlier, ANOSIM is still insignificant for among treatmentcomparison.
107

Plotted average FA proportions (each FA is represented as proportion of all FAs) for each of the FAs of interest by treatment. Treatment on thex-axis are in order: Low (400 µatm), Mid (1000), and high (2800). Did ANOVAs for each of these FAs and none were significant.
108

Secondary Stress:ProteomicsMade a heat map of the proteins that contribute to the high pCO2xMS response. Based on the loadings from the NMDS, determined whichproteins were significant in the distribution of oysters in multivariate space for high pCO2 vs. high pCO2xMS. Did the same for low pCO2 andMS so that I could find the overlap of general MS response proteins (those proteins that were significant for MS response at both high and lowpCO2). Used skyline peptide data as expression values and made a heat map (non-transformed and log-transformed expression data) for theproteins that were responsible for the oyster response to the combined stressor. The heat map isn't terribly informative so I am not including ithere, but the R code is in the proteomics figures for ms script.
February 26, 2013Bioinformatics: Assignment 7Downloaded metagenomics fasta file and did blastn (megablast) against ncbi nucleotide database../blastn -query /Users/Emma/Documents/module_7/sequences_module7.fa -db /Users/Shared/data/blast/db/nt -out/Users/Emma/Documents/module_7/metagen_blastn -max_target_seqs 1 -outfmt 6 -num_threads 8
In text wrangler, replaced all | with spaces. Uploaded the output file to galaxy and used metagenomics tools to retrieve taxonomic informationbased on the gene ID in column 3 (e.g. 160338813). On the resulting file, summarized taxonomic data. Most of the sequences are bacteria(9225), followed by Archaea (922), eukaryotes (628), viruses (544), and fungi (155). Drew phylogeny of taxonomic information (saved inevernote).
Ran blastx on metagnomics data../blastx -num_threads 8 -out /Users/Emma/Documents/module_7/metagen_blastx -db/Users/Emma/Documents/bioinfo_assignment_1/uniprot_db_010913 -outfmt 6 -evalue 1E-5 -max_target_seqs 1 -query/Users/Emma/Documents/module_7/sequences_module7.fa
Secondary Stress: ShellGot back the first round of shell data from Gary Dickinson. He did mass and length of both valves as well as nacre area ratio. He is working onhardness tests. For the left valve, the mass was slightly less at 1000 and 2800 µatm compared to 400 (the mean mass was the lowest at1000), but the differences were not significant. The left valve length was longest at 1000, followed by 2800 and 400, but again not significantlyso. The left valve nacre ratio was very similar between 400 and 1000, but lower at 2800 (NS). The mass of the right valve was greatest at 2800and lowest at 1000 (NS). The right valve length was greatest at 1000 and lowest at 2800 (NS). The nacre area ratio was significantly differentamong treatments: highest at 1000 and lowest at 400.
February 20, 2013Secondary Stress: ProteomicsI am trying to determine which proteins are responsible for the different responses to mechanical stress at high and low pCO2. (This work is allsaved in the folder "figures for NSA".) To do this, I first joined the lists of peptides (with SPID annotations) that had significant eigen vectorloadings on the NMDS (for each pCO2 response to MS) together. I then determined which peptides overlapped between low and high pCO2and which were unique in the MS response at each treatment. I compared these 2 lists at the protein level and determined which proteins weredriving the differing responses at the 2 pCO2. These proteins were then annotated to the GO and GO Slim levels.
February 19, 2013Bioinformatics: Assignment 6Joined CDS file for oyster genome to file of methylated CGs to get counts of methylated exons. Will then join this to previous file of methylatedCGs, unmethylated CGs, and number of exons, and all CGs all joined to mRNA. I can calculate number of methylated introns from thisjoining...There are no CGI IDs in the methylated CG file and I would rather work on my NSA talk then learn the necessary steps in Galaxy to fixthis problem.But check out my plots on evernote! https://www.evernote.com/shard/s242/sh/2843c91e-ebda-45db-a1b6-cdedd65545c3/d0ce0e17d6636eab2590c820fc651af1https://www.evernote.com/shard/s242/sh/c39fc246-034e-472e-81bc-ea68ada73063/2c5cb70f962826341faa2f23a7f4e14e 109
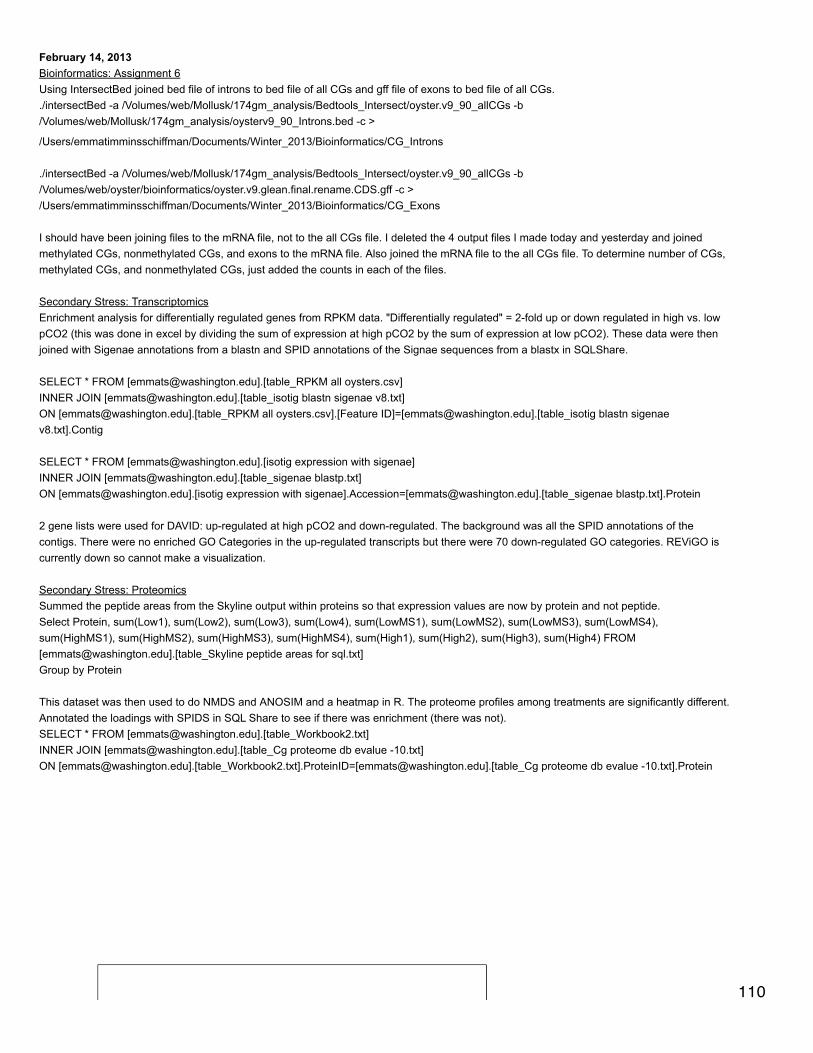
February 14, 2013Bioinformatics: Assignment 6Using IntersectBed joined bed file of introns to bed file of all CGs and gff file of exons to bed file of all CGs../intersectBed -a /Volumes/web/Mollusk/174gm_analysis/Bedtools_Intersect/oyster.v9_90_allCGs -b/Volumes/web/Mollusk/174gm_analysis/oysterv9_90_Introns.bed -c >
/Users/emmatimminsschiffman/Documents/Winter_2013/Bioinformatics/CG_Introns
./intersectBed -a /Volumes/web/Mollusk/174gm_analysis/Bedtools_Intersect/oyster.v9_90_allCGs -b/Volumes/web/oyster/bioinformatics/oyster.v9.glean.final.rename.CDS.gff -c >/Users/emmatimminsschiffman/Documents/Winter_2013/Bioinformatics/CG_Exons
I should have been joining files to the mRNA file, not to the all CGs file. I deleted the 4 output files I made today and yesterday and joinedmethylated CGs, nonmethylated CGs, and exons to the mRNA file. Also joined the mRNA file to the all CGs file. To determine number of CGs,methylated CGs, and nonmethylated CGs, just added the counts in each of the files.
Secondary Stress: TranscriptomicsEnrichment analysis for differentially regulated genes from RPKM data. "Differentially regulated" = 2-fold up or down regulated in high vs. lowpCO2 (this was done in excel by dividing the sum of expression at high pCO2 by the sum of expression at low pCO2). These data were thenjoined with Sigenae annotations from a blastn and SPID annotations of the Signae sequences from a blastx in SQLShare.
SELECT * FROM [[email protected]].[table_RPKM all oysters.csv]INNER JOIN [[email protected]].[table_isotig blastn sigenae v8.txt]ON [[email protected]].[table_RPKM all oysters.csv].[Feature ID]=[[email protected]].[table_isotig blastn sigenaev8.txt].Contig
SELECT * FROM [[email protected]].[isotig expression with sigenae]INNER JOIN [[email protected]].[table_sigenae blastp.txt]ON [[email protected]].[isotig expression with sigenae].Accession=[[email protected]].[table_sigenae blastp.txt].Protein
2 gene lists were used for DAVID: up-regulated at high pCO2 and down-regulated. The background was all the SPID annotations of thecontigs. There were no enriched GO Categories in the up-regulated transcripts but there were 70 down-regulated GO categories. REViGO iscurrently down so cannot make a visualization.
Secondary Stress: ProteomicsSummed the peptide areas from the Skyline output within proteins so that expression values are now by protein and not peptide.Select Protein, sum(Low1), sum(Low2), sum(Low3), sum(Low4), sum(LowMS1), sum(LowMS2), sum(LowMS3), sum(LowMS4),sum(HighMS1), sum(HighMS2), sum(HighMS3), sum(HighMS4), sum(High1), sum(High2), sum(High3), sum(High4) FROM[[email protected]].[table_Skyline peptide areas for sql.txt]Group by Protein
This dataset was then used to do NMDS and ANOSIM and a heatmap in R. The proteome profiles among treatments are significantly different.Annotated the loadings with SPIDS in SQL Share to see if there was enrichment (there was not).SELECT * FROM [[email protected]].[table_Workbook2.txt]INNER JOIN [[email protected]].[table_Cg proteome db evalue -10.txt]ON [[email protected]].[table_Workbook2.txt].ProteinID=[[email protected]].[table_Cg proteome db evalue -10.txt].Protein
110

111
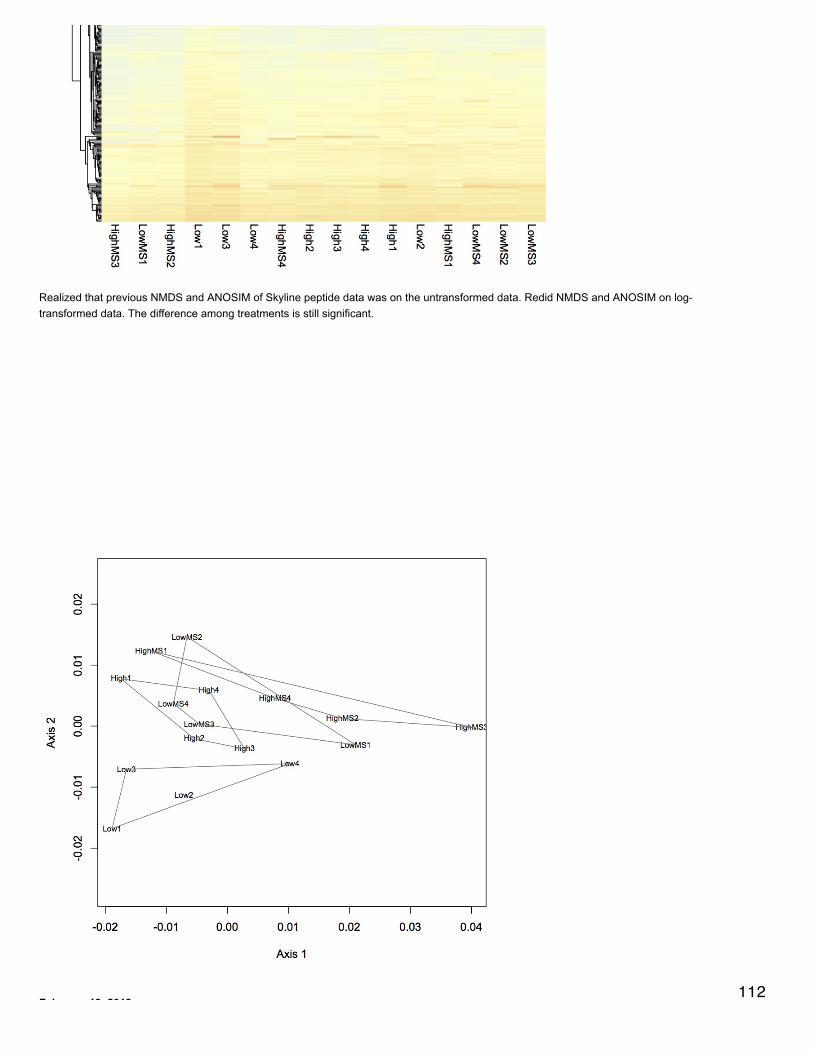
Realized that previous NMDS and ANOSIM of Skyline peptide data was on the untransformed data. Redid NMDS and ANOSIM on log-transformed data. The difference among treatments is still significant.
February 13, 2013112
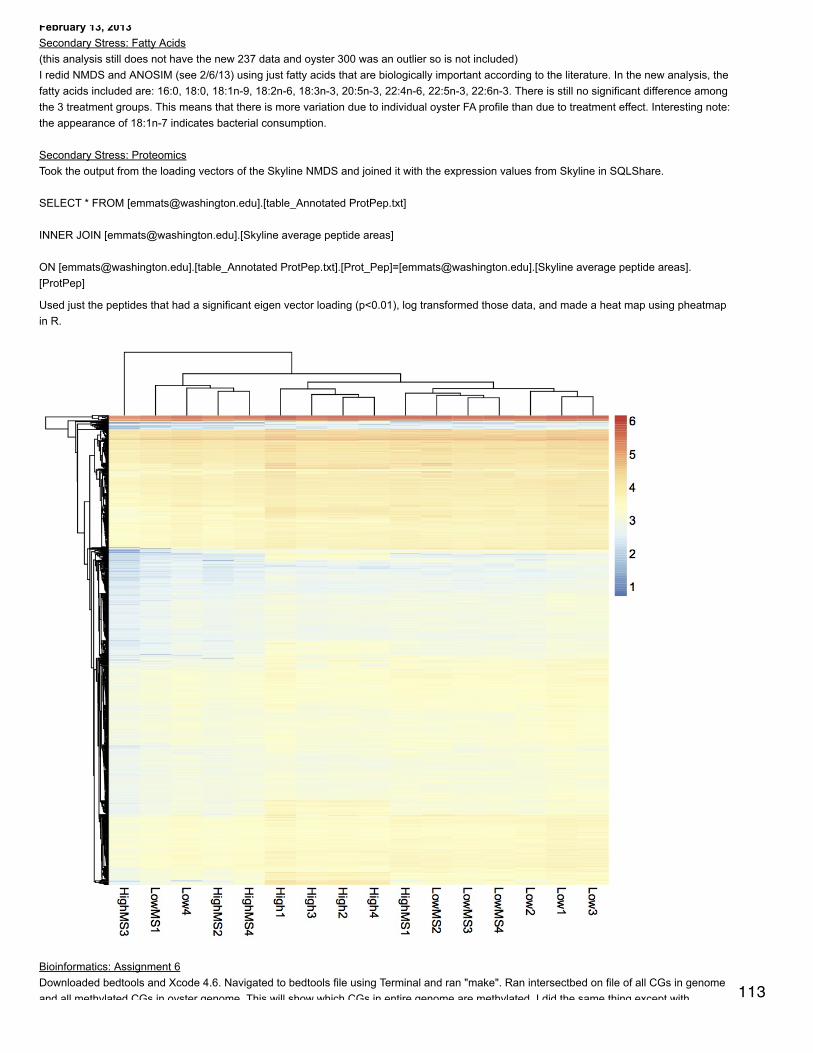
February 13, 2013Secondary Stress: Fatty Acids(this analysis still does not have the new 237 data and oyster 300 was an outlier so is not included)I redid NMDS and ANOSIM (see 2/6/13) using just fatty acids that are biologically important according to the literature. In the new analysis, thefatty acids included are: 16:0, 18:0, 18:1n-9, 18:2n-6, 18:3n-3, 20:5n-3, 22:4n-6, 22:5n-3, 22:6n-3. There is still no significant difference amongthe 3 treatment groups. This means that there is more variation due to individual oyster FA profile than due to treatment effect. Interesting note:the appearance of 18:1n-7 indicates bacterial consumption.
Secondary Stress: ProteomicsTook the output from the loading vectors of the Skyline NMDS and joined it with the expression values from Skyline in SQLShare.
SELECT * FROM [[email protected]].[table_Annotated ProtPep.txt]
INNER JOIN [[email protected]].[Skyline average peptide areas]
ON [[email protected]].[table_Annotated ProtPep.txt].[Prot_Pep]=[[email protected]].[Skyline average peptide areas].[ProtPep]
Used just the peptides that had a significant eigen vector loading (p<0.01), log transformed those data, and made a heat map using pheatmapin R.
Bioinformatics: Assignment 6Downloaded bedtools and Xcode 4.6. Navigated to bedtools file using Terminal and ran "make". Ran intersectbed on file of all CGs in genomeand all methylated CGs in oyster genome. This will show which CGs in entire genome are methylated. I did the same thing except with 113
and all methylated CGs in oyster genome. This will show which CGs in entire genome are methylated. I did the same thing except withunmethylated CGs in entire genome and all CGs.
./intersectBed -a /Volumes/web/Mollusk/174gm_analysis/Bedtools_Intersect/oyster.v9_90_allCGs -b
/Volumes/web/Mollusk/174gm_analysis/MethylatedCG_BED.bed -c >/Users/emmatimminsschiffman/Documents/Winter_2013/Bioinformatics/All_CGs_MethylatedCG
./intersectBed -a /Volumes/web/Mollusk/174gm_analysis/Bedtools_Intersect/oyster.v9_90_allCGs -b/Volumes/web/Mollusk/174gm_analysis/NoMethCG_BED.bed -c >/Users/emmatimminsschiffman/Documents/Winter_2013/Bioinformatics/All_CGs_NonMethCG
February 12, 2013Secondary Stress: Fatty AcidsRetrieved freeze dried samples and GC-ready samples from CEE. They are now in the -20°C behind Sam's bench. Sean ran the 50% diluted237 today and is sending me the data.
Olympia Oyster EpigeneticsAdded 175µl water to digestion-ligation that went overnight. Used this template to do a pre-select PCR (the protocol has been modified to useAmpliTaq). For each reaction: 4 µl digested DNA, 2.5 µl 10X AmpliTaq buffer (no MgCl2 added), 2 µl 10 mM dNTP, 0.2 µl AmpliTaq, 1.75 µl 50mM MgCl2, 0.6 µl 10 µM preselect EcoRI primer, 0.6 µl 10 µM preselect H/M primer, 12.35 µl H2O (20 µl master mix and 4 µl template perwell). Cycling parameters: 72 °C 2 minutes; 25 times 94°C 30s, 56°C 30s, 72°C 2 minutes; 60°C 30 minutes (saved as PRESEL on 96-wellplate thermalcycler).Made 1% agarose gel with EtBr. Mixed 10 µl of PCR product with 3 µl of Bioline 5x loading dye. Ran negative control for Msp and CAS.001and DAB.087 for both Msp and Hpa. Gel ran for ~30 minutes at 100 V. Gel photo: https://www.evernote.com/shard/s242/sh/3672bf89-2caf-4501-aa46-9ad619826ca0/fc3a1962cbb52144fd1e4abc32bf292aThere were smears in all 4 samples and nothing present in the negative control.Proceeded to select PCR. I am only PCRing a subset of samples to test out the select primer pairs. Mac previously ordered 7 primer pairs so Iam making sure that they work well with Olys. Primer pairs are listed in the table below and each primer is designated by a specific 3-nucleotide tag. H/M TCG and TGC may be mixed up. Select PCR was done using the same recipe as preselect PCR and the same cyclingparameters. PCR plate layout can be found here: https://www.evernote.com/shard/s242/sh/2fe19c66-17f9-4757-872d-1ea789cd9430/c13eb04c4d23084f67658ab932f4f7e6
Pair EcoRI primer H/M primer1 AAC TTA2 ACA TTC3 ACA TGA4 ACA TGT5 ACA TGC6 ACA TAC7 ACG TCG
Ran the samples on a 1.5% agarose gel with EtBr at 100V for ~40 minutes. All primer pairs amplified the pre-select PCR product. I tested bothDAB.091 samples and both of them had amplification. Gel image here: https://www.evernote.com/shard/s242/sh/6738a26d-4fe1-43f7-a026-2baa830cb1a5/2d45335c74a81f02ce632f4847df4183
February 11, 2013Olympia Oyster EpigeneticsFinished 3 DNA extractions started yesterday. See 2/8/13 for details. There is still not pellet in DAB.091, but continued with extraction anyway.The 2 FID samples were resolubilized in 200 ul of water and DAB.091 with 100 ul. Nanodrop dataDAB.091 still has a very low concentration, but the other 2 samples are much better. Going forward I will probably analyze both extracted
samples of DAB.091 and just the new FID.97 and FID.100.Day 2 of MSAFLP protocol. Made dilutions of adapters in T4 ligase buffer:Hpa/Msp adapters = 4.2 µl H/M adapter I, 4.2 µl H/M adapter II (both at 0.24 ng/µl), 5 µl 10x T4 ligase buffer, 36.6 µl H2O.Eco RI = 3.7 µl Eco adapters I and II (at 0.27 ng/µl), 5 µl 10x T4 ligase buffer, 37.6 µl H2O.Incubated adapter mixes at 95°C for 2 minutes and let cool for 45 minutes on benchtop. Realized at next step that I did not have enough of theH/M adapter, so I made 2x more batches of it as described above.Made dilutions of T4 ligase and Eco RI adapter:T4 ligase = 1 uL T4 ligase, 50 ul 10x T4 buffer, 449 ul H2O.EcoRI adapter = 10 ul EcoRI (40 pm/ul, see above), 90 ul H2O
114
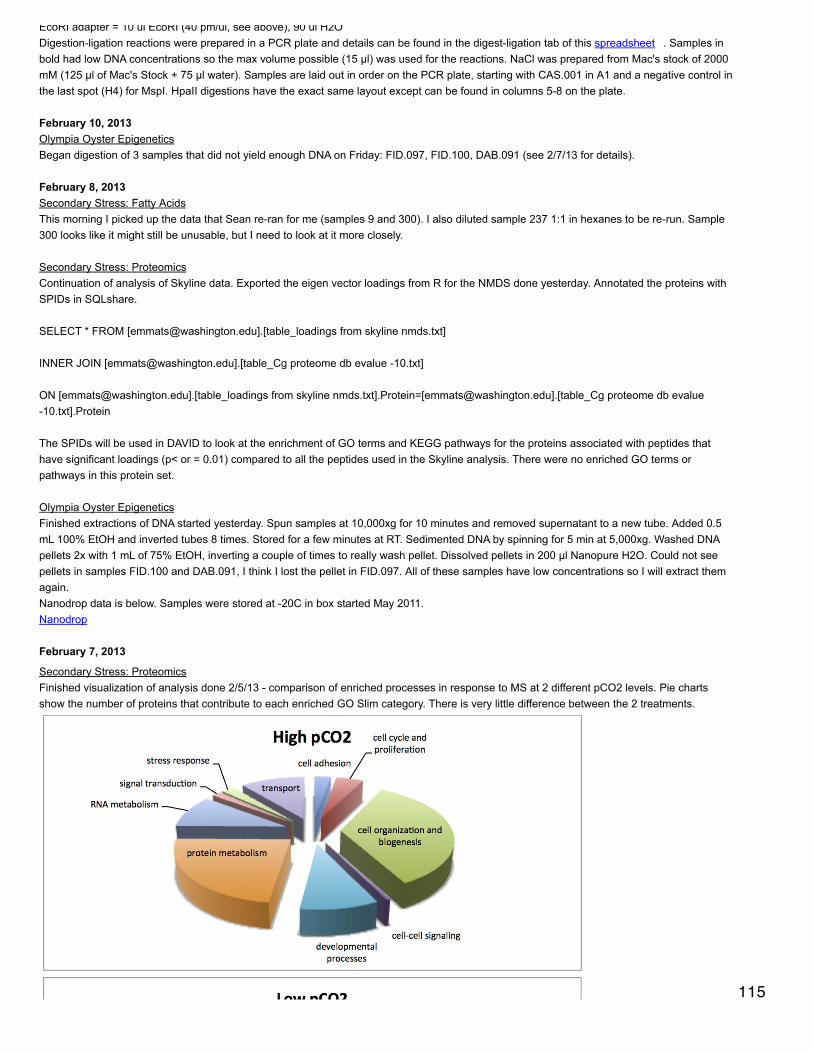
EcoRI adapter = 10 ul EcoRI (40 pm/ul, see above), 90 ul H2ODigestion-ligation reactions were prepared in a PCR plate and details can be found in the digest-ligation tab of this spreadsheet . Samples inbold had low DNA concentrations so the max volume possible (15 µl) was used for the reactions. NaCl was prepared from Mac's stock of 2000mM (125 µl of Mac's Stock + 75 µl water). Samples are laid out in order on the PCR plate, starting with CAS.001 in A1 and a negative control inthe last spot (H4) for MspI. HpaII digestions have the exact same layout except can be found in columns 5-8 on the plate.
February 10, 2013Olympia Oyster EpigeneticsBegan digestion of 3 samples that did not yield enough DNA on Friday: FID.097, FID.100, DAB.091 (see 2/7/13 for details).
February 8, 2013Secondary Stress: Fatty AcidsThis morning I picked up the data that Sean re-ran for me (samples 9 and 300). I also diluted sample 237 1:1 in hexanes to be re-run. Sample300 looks like it might still be unusable, but I need to look at it more closely.
Secondary Stress: ProteomicsContinuation of analysis of Skyline data. Exported the eigen vector loadings from R for the NMDS done yesterday. Annotated the proteins withSPIDs in SQLshare.
SELECT * FROM [[email protected]].[table_loadings from skyline nmds.txt]
INNER JOIN [[email protected]].[table_Cg proteome db evalue -10.txt]
ON [[email protected]].[table_loadings from skyline nmds.txt].Protein=[[email protected]].[table_Cg proteome db evalue-10.txt].Protein
The SPIDs will be used in DAVID to look at the enrichment of GO terms and KEGG pathways for the proteins associated with peptides thathave significant loadings (p< or = 0.01) compared to all the peptides used in the Skyline analysis. There were no enriched GO terms orpathways in this protein set.
Olympia Oyster EpigeneticsFinished extractions of DNA started yesterday. Spun samples at 10,000xg for 10 minutes and removed supernatant to a new tube. Added 0.5mL 100% EtOH and inverted tubes 8 times. Stored for a few minutes at RT. Sedimented DNA by spinning for 5 min at 5,000xg. Washed DNApellets 2x with 1 mL of 75% EtOH, inverting a couple of times to really wash pellet. Dissolved pellets in 200 µl Nanopure H2O. Could not seepellets in samples FID.100 and DAB.091, I think I lost the pellet in FID.097. All of these samples have low concentrations so I will extract themagain.Nanodrop data is below. Samples were stored at -20C in box started May 2011.Nanodrop
February 7, 2013
Secondary Stress: ProteomicsFinished visualization of analysis done 2/5/13 - comparison of enriched processes in response to MS at 2 different pCO2 levels. Pie chartsshow the number of proteins that contribute to each enriched GO Slim category. There is very little difference between the 2 treatments.
115

NMDS of all proteomic samples shows that there are differences in the proteomic profiles of the LowMS and HighMS oysters, which may meanthat responses to MS are different at the different pCO2. Dropped low abundance proteins and did log(x+1) transformation, bray-curtisdissimilarity coefficient. ANOSIM showed no significant difference between these 2 groups (R=0.05208, p=0.355). I redid the analysis withoutdropping low abundance proteins and got the same result.
Analysis of Skyline data - in Excel calculated average areas for peptides for each oyster. This was accomplished by creating pivot tables (1 foreach oyster) with the protein-peptide name as the descriptor and the average total area (across technical replicates) as the value. Joined all ofthese tables together in SQLshare.
SELECT * FROM [[email protected]].[table_average areas for lowpCO2 and MS.csv]
INNER JOIN [[email protected]].[table_average areas for highpCO2MS.csv]
ON [[email protected]].[table_average areas for lowpCO2 and MS.csv].ProtPep=[[email protected]].[table_average areas forhighpCO2MS.csv].ProtPep
SELECT * FROM [[email protected]].[skyline joining 1]
INNER JOIN [[email protected]].[table_average areas for highpCO2.csv]
ON [[email protected]].[skyline joining 1].ProtPep=[[email protected]].[table_average areas for highpCO2.csv].ProtPep
Used this joined file to do a NMDS and ANOSIM. Data were Log(x+1) transformed and the bray-curtis dissimilarly coefficient was used. Thereis a significant difference among the treatment groups (p=0.001).
116
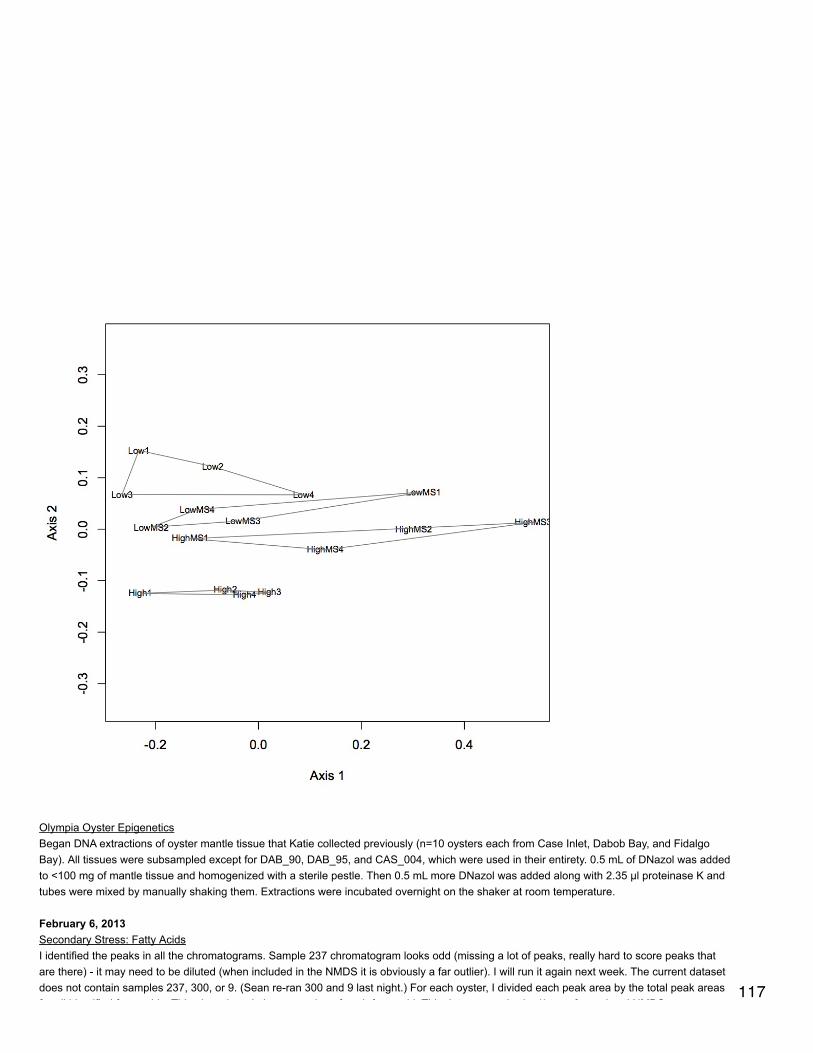
Olympia Oyster EpigeneticsBegan DNA extractions of oyster mantle tissue that Katie collected previously (n=10 oysters each from Case Inlet, Dabob Bay, and FidalgoBay). All tissues were subsampled except for DAB_90, DAB_95, and CAS_004, which were used in their entirety. 0.5 mL of DNazol was addedto <100 mg of mantle tissue and homogenized with a sterile pestle. Then 0.5 mL more DNazol was added along with 2.35 µl proteinase K andtubes were mixed by manually shaking them. Extractions were incubated overnight on the shaker at room temperature.
February 6, 2013Secondary Stress: Fatty AcidsI identified the peaks in all the chromatograms. Sample 237 chromatogram looks odd (missing a lot of peaks, really hard to score peaks thatare there) - it may need to be diluted (when included in the NMDS it is obviously a far outlier). I will run it again next week. The current datasetdoes not contain samples 237, 300, or 9. (Sean re-ran 300 and 9 last night.) For each oyster, I divided each peak area by the total peak areasfor all identified fatty acids. This gives the relative proportion of each fatty acid. This dataset was log(x+1) transformed and NMDS was
117
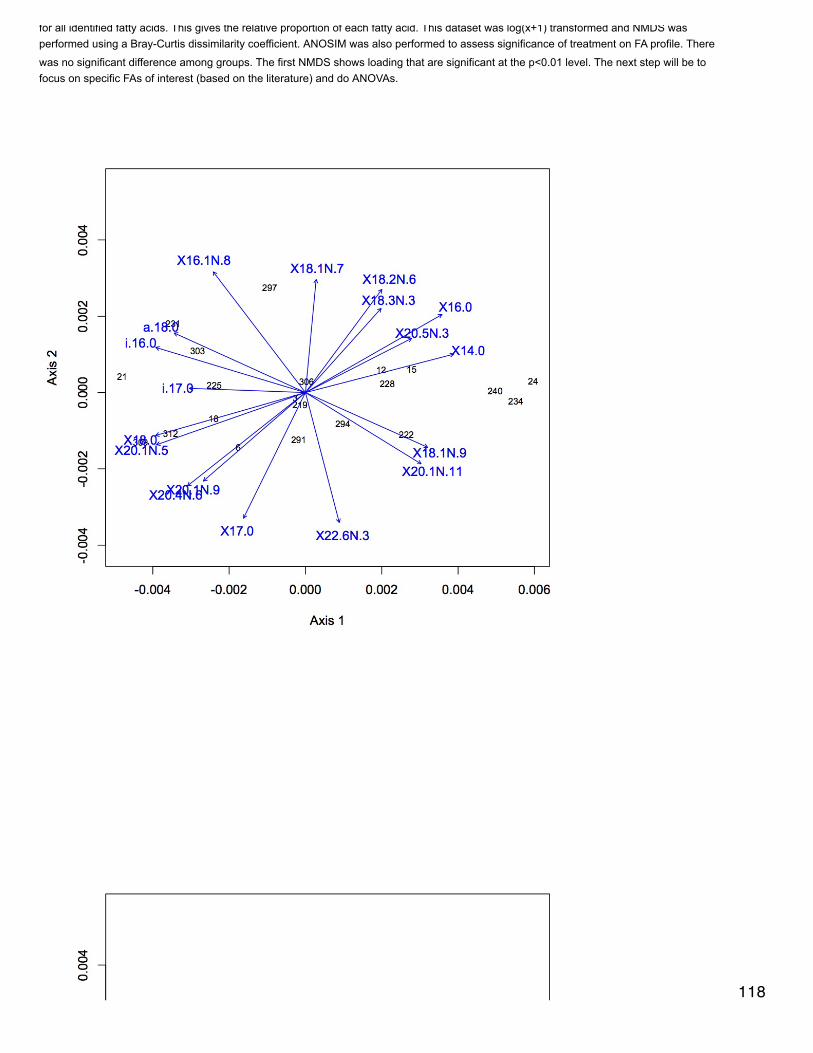
for all identified fatty acids. This gives the relative proportion of each fatty acid. This dataset was log(x+1) transformed and NMDS wasperformed using a Bray-Curtis dissimilarity coefficient. ANOSIM was also performed to assess significance of treatment on FA profile. There
was no significant difference among groups. The first NMDS shows loading that are significant at the p<0.01 level. The next step will be tofocus on specific FAs of interest (based on the literature) and do ANOVAs.
118
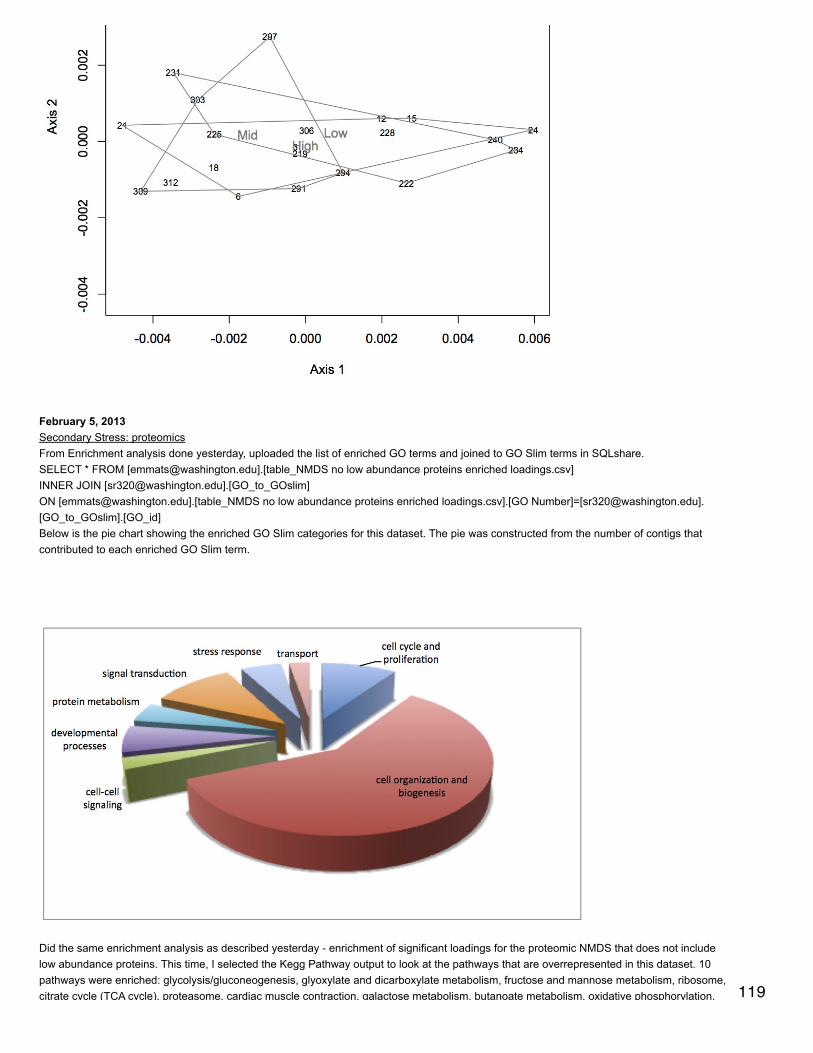
February 5, 2013Secondary Stress: proteomicsFrom Enrichment analysis done yesterday, uploaded the list of enriched GO terms and joined to GO Slim terms in SQLshare.SELECT * FROM [[email protected]].[table_NMDS no low abundance proteins enriched loadings.csv]INNER JOIN [[email protected]].[GO_to_GOslim]ON [[email protected]].[table_NMDS no low abundance proteins enriched loadings.csv].[GO Number]=[[email protected]].[GO_to_GOslim].[GO_id]Below is the pie chart showing the enriched GO Slim categories for this dataset. The pie was constructed from the number of contigs thatcontributed to each enriched GO Slim term.
Did the same enrichment analysis as described yesterday - enrichment of significant loadings for the proteomic NMDS that does not includelow abundance proteins. This time, I selected the Kegg Pathway output to look at the pathways that are overrepresented in this dataset. 10pathways were enriched: glycolysis/gluconeogenesis, glyoxylate and dicarboxylate metabolism, fructose and mannose metabolism, ribosome,citrate cycle (TCA cycle), proteasome, cardiac muscle contraction, galactose metabolism, butanoate metabolism, oxidative phosphorylation. 119
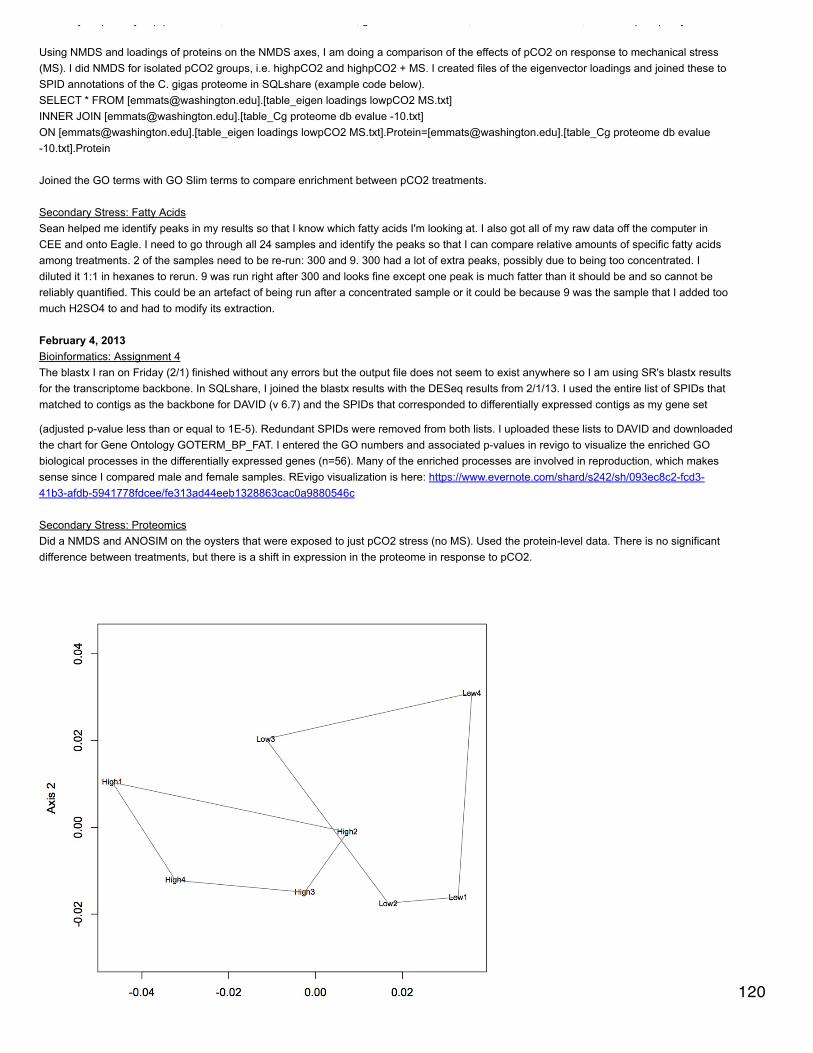
citrate cycle (TCA cycle), proteasome, cardiac muscle contraction, galactose metabolism, butanoate metabolism, oxidative phosphorylation.
Using NMDS and loadings of proteins on the NMDS axes, I am doing a comparison of the effects of pCO2 on response to mechanical stress(MS). I did NMDS for isolated pCO2 groups, i.e. highpCO2 and highpCO2 + MS. I created files of the eigenvector loadings and joined these toSPID annotations of the C. gigas proteome in SQLshare (example code below).SELECT * FROM [[email protected]].[table_eigen loadings lowpCO2 MS.txt]INNER JOIN [[email protected]].[table_Cg proteome db evalue -10.txt]ON [[email protected]].[table_eigen loadings lowpCO2 MS.txt].Protein=[[email protected]].[table_Cg proteome db evalue-10.txt].Protein
Joined the GO terms with GO Slim terms to compare enrichment between pCO2 treatments.
Secondary Stress: Fatty AcidsSean helped me identify peaks in my results so that I know which fatty acids I'm looking at. I also got all of my raw data off the computer inCEE and onto Eagle. I need to go through all 24 samples and identify the peaks so that I can compare relative amounts of specific fatty acidsamong treatments. 2 of the samples need to be re-run: 300 and 9. 300 had a lot of extra peaks, possibly due to being too concentrated. Idiluted it 1:1 in hexanes to rerun. 9 was run right after 300 and looks fine except one peak is much fatter than it should be and so cannot bereliably quantified. This could be an artefact of being run after a concentrated sample or it could be because 9 was the sample that I added toomuch H2SO4 to and had to modify its extraction.
February 4, 2013Bioinformatics: Assignment 4The blastx I ran on Friday (2/1) finished without any errors but the output file does not seem to exist anywhere so I am using SR's blastx resultsfor the transcriptome backbone. In SQLshare, I joined the blastx results with the DESeq results from 2/1/13. I used the entire list of SPIDs thatmatched to contigs as the backbone for DAVID (v 6.7) and the SPIDs that corresponded to differentially expressed contigs as my gene set
(adjusted p-value less than or equal to 1E-5). Redundant SPIDs were removed from both lists. I uploaded these lists to DAVID and downloadedthe chart for Gene Ontology GOTERM_BP_FAT. I entered the GO numbers and associated p-values in revigo to visualize the enriched GObiological processes in the differentially expressed genes (n=56). Many of the enriched processes are involved in reproduction, which makessense since I compared male and female samples. REvigo visualization is here: https://www.evernote.com/shard/s242/sh/093ec8c2-fcd3-41b3-afdb-5941778fdcee/fe313ad44eeb1328863cac0a9880546c
Secondary Stress: ProteomicsDid a NMDS and ANOSIM on the oysters that were exposed to just pCO2 stress (no MS). Used the protein-level data. There is no significantdifference between treatments, but there is a shift in expression in the proteome in response to pCO2.
120

Used loadings file from 2/1/13 and joined with Cg proteome blastx results in SQL share.
SELECT * FROM [[email protected]].[table_no low abundance sig loadings.csv]
INNER JOIN [[email protected]].[table_Cg proteome db evalue -10.txt]
ON [[email protected]].[table_no low abundance sig loadings.csv].protein=[[email protected]].[table_Cg proteome db evalue-10.txt].Protein
The background for DAVID is the SPIDs from the file Cg proteome db evalue -10 (so low abundance proteins are not excluded) and the "gene"set is taken from the significant loadings mentioned above. 52 gene ontology terms were enriched (GOTERM BP FAT). VIsualization in revigocan be seen in evernote: https://www.evernote.com/shard/s242/sh/a25e7b20-6531-483d-bcc3-04c3d64e13e9/77de8e809f0a1f71f5f6c1eaad50b1ae . Downloaded R code to make better plot.
February 3, 2013Secondary Stress: Fatty AcidsRemoved last 8 samples and replaced caps before storage at -20°C. Turned off air and H2 gas cylinders.
February 2, 2013Secondary Stress: Fatty AcidsRemoved the samples run yesterday and replaced caps (caps used in run have a hole in them from the autosampler which could lead toevaporation during storage). Loaded last 8 samples to run.
February 1, 2013Secondary Stress: Fatty AcidsThe samples did not run yesterday because the hydrogen was not turned on for the GC. I turned on the H2 this morning and restarted thesamples.
Secondary Stress: ProteomicsTook list of proteins that had significant NMDS loadings (in folder "for heat map") where significant means p < or = 0.01 and joined with spectralcounts in SQLshare. From this file, created an input file to make a heat map using pheatmap in R. clustered both rows and columns usingaverage linkage and euclidean distance. There is no obvious pattern in the expression of these proteins within treatment groups.
121
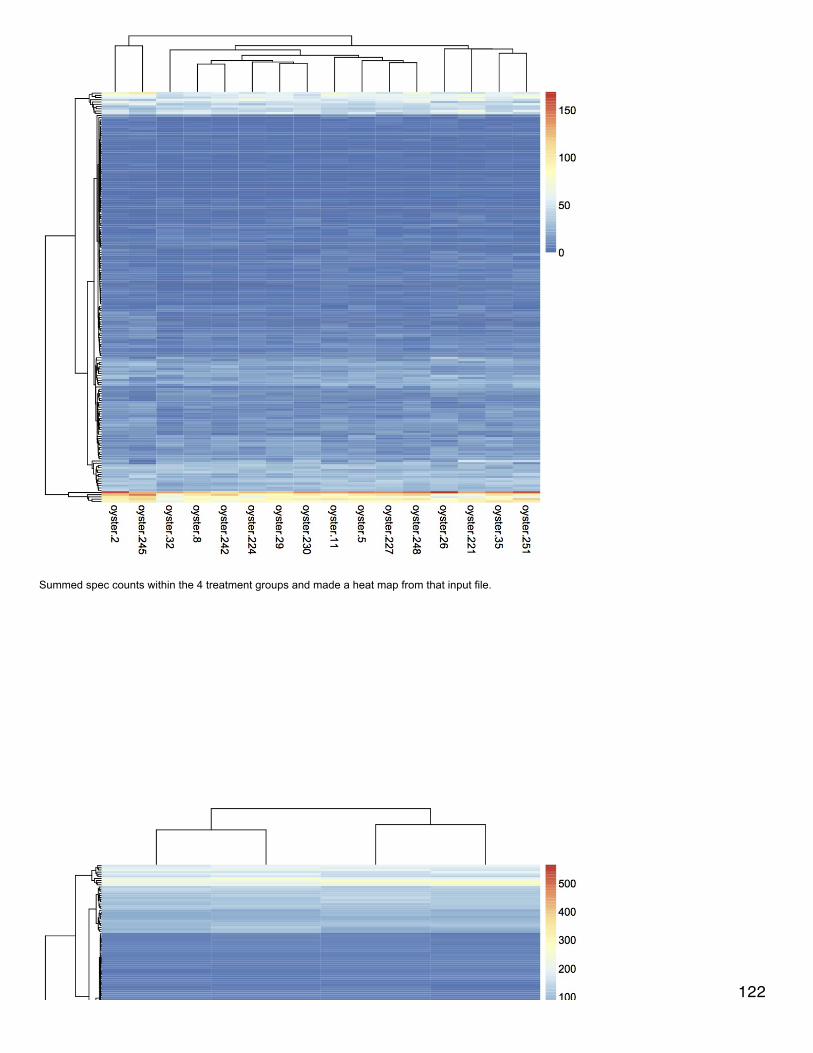
Summed spec counts within the 4 treatment groups and made a heat map from that input file.
122

Did NMDS for proteomics at GO Slim level. There was no significant effect of treatment on proteome expression.
Bioinformatics: Assignment 4Took Steven's mapped reads (http://eagle.fish.washington.edu/cnidarian/fish546/fish546_CLCexperiment_readcounts.xls ) and created a fileof total reads for each sample (male 106, male 108, female 106, female 108). Only kept contigs that had at least 10 reads across all 4samples. Did DESeq on dataset (genes in red are differentially expressed).
123
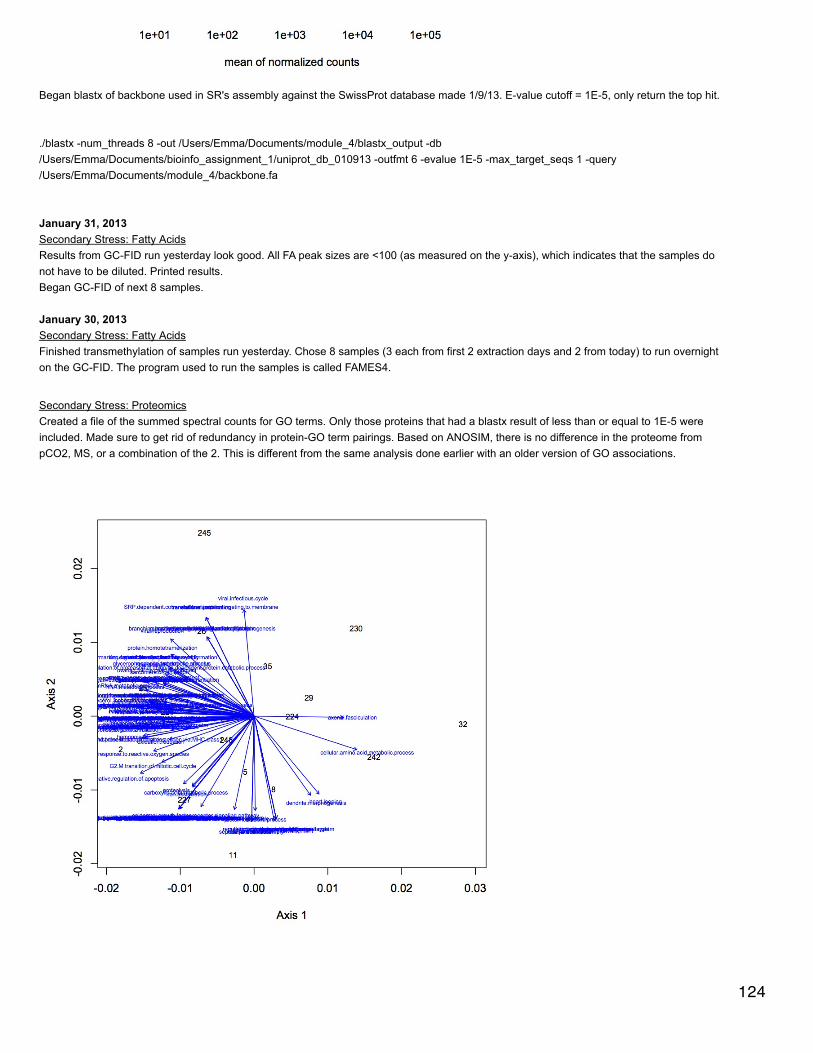
Began blastx of backbone used in SR's assembly against the SwissProt database made 1/9/13. E-value cutoff = 1E-5, only return the top hit.
./blastx -num_threads 8 -out /Users/Emma/Documents/module_4/blastx_output -db/Users/Emma/Documents/bioinfo_assignment_1/uniprot_db_010913 -outfmt 6 -evalue 1E-5 -max_target_seqs 1 -query/Users/Emma/Documents/module_4/backbone.fa
January 31, 2013Secondary Stress: Fatty AcidsResults from GC-FID run yesterday look good. All FA peak sizes are <100 (as measured on the y-axis), which indicates that the samples donot have to be diluted. Printed results.Began GC-FID of next 8 samples.
January 30, 2013Secondary Stress: Fatty AcidsFinished transmethylation of samples run yesterday. Chose 8 samples (3 each from first 2 extraction days and 2 from today) to run overnighton the GC-FID. The program used to run the samples is called FAMES4.
Secondary Stress: ProteomicsCreated a file of the summed spectral counts for GO terms. Only those proteins that had a blastx result of less than or equal to 1E-5 wereincluded. Made sure to get rid of redundancy in protein-GO term pairings. Based on ANOSIM, there is no difference in the proteome frompCO2, MS, or a combination of the 2. This is different from the same analysis done earlier with an older version of GO associations.
124

125
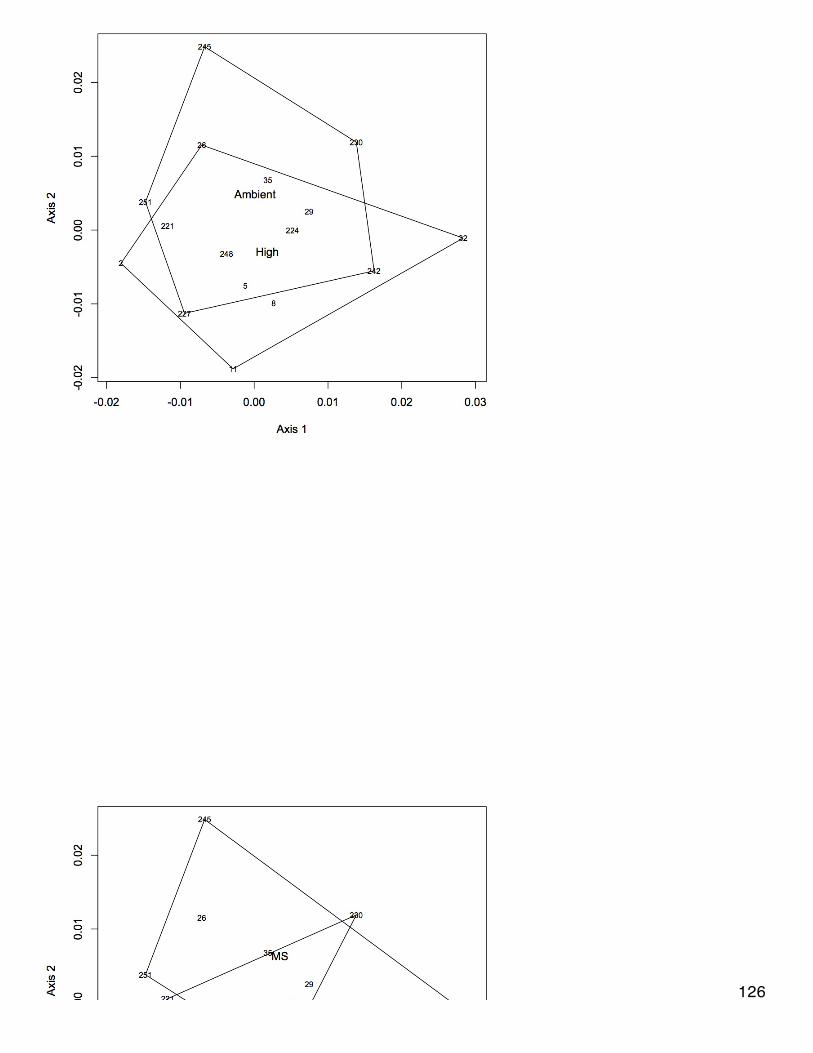
126

January 29, 2013Secondary Stress: Fatty AcidsBegan extractions of the last 8 oysters: Exp2.6, 15, 18, 219, 222, 225, 291, 309. Samples were left in 50°C water bath overnight andtransmethylation will be finished tomorrow.
January 28, 2013Secondary Stress: Proteomics and RNA-SeqJoined tables in SQLshare to annotate proteome and transcriptome to GO Slim level. Queries for the joining can be found in my evernote(https://www.evernote.com/Home.action#st=p&n=66b4781b-152a-4a13-b275-6688b3fd3ede ).
January 24, 2013Bioinformatics: Assignment 3Hummingbird had to be rebooted, so I re-ran the code from yesterday with one change: decreased the jellyfish memory from 20,000 G to 2,000G.Hummingbird does not have enough disk space to run TrinityI downloaded the data file and trinity to the mac mini. I entered the exact same code as I did on Hummingbird (using 2,000 G for jellyfishmemory) and I got the error below.
Can't exec "/Users/Emma/Desktop/trinityrnaseq_r2012-10-05/trinity-plugins/jellyfish/bin/jellyfish": No such file or directory at ./Trinity.pl line1311.
Error, cmd: /Users/Emma/Desktop/trinityrnaseq_r2012-10-05/trinity-plugins/jellyfish/bin/jellyfish count -t 2 -m 25 -s 306783378285 --both-strands single.fa died with ret -1 at ./Trinity.pl line 1315.
I forgot to run "make" to set up the trinity app. After doing that, Steven got the code to work and it is running.
With Claire, I started an assembly of the same data on CLC. We tried trimming it first, but trimming just got rid of >99% of the data, so we areassembling the untrimmed reads with a minimum contig length of 200 (see her notebook for more details).
January 23, 2013Secondary Stress: Fatty AcidStarted next group of fatty acid extractions, samples = Exp2.9, 24, 228, 231, 234, 294, 300, 306. Took samples all the way through incubationat 50°C overnight (in transmethylation procedure). Samples sat for ~1 hour before being sonicated the first time because someone else wasusing the sonicator. For the 2 mL addition of 1% H2SO4 in MeOH (transmethylation procedure), the pipette lost its vacuum and 10 mL fell intosample 9. Tomorrow I will divide this sample into 3 separate tubes and continue the extraction on all 3, combining the separate fractions at theend.
Secondary Stress: ProteomicsMade venn diagrams to compare biological variation within treatments. Used 3 of the 4 oysters for each treatment and figured out in how manyoysters each protein was identified. Used EulerAPE to make the venns. Only the venn diagrams for high pCO2 + MS and low pCO2 + MS wereexact. The venn diagrams pretty much looked the same across treatments. The one for high pCO2 + MS is below. Proteins used had at least10 spectral counts across all oysters.
127
Used Venny to create a diagram comparing the proteins identified across all 4 treatments. Proteins used for the Venn had at least 10 speccounts across all oysters.
128
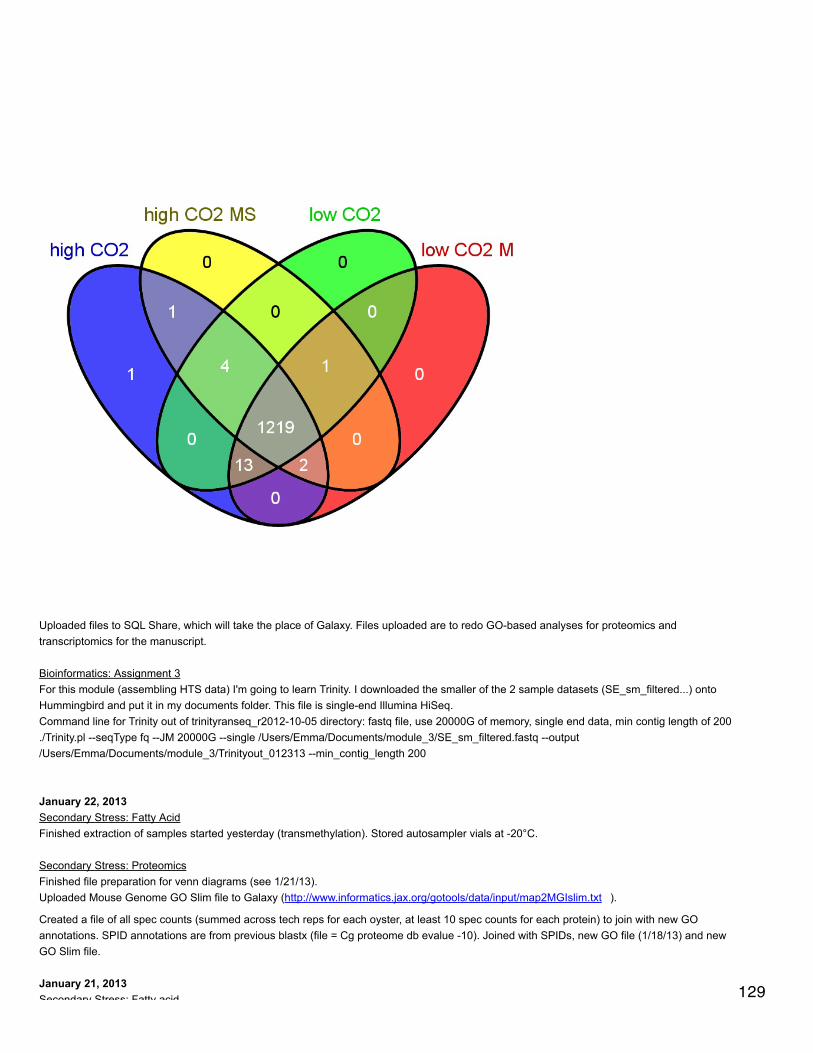
Uploaded files to SQL Share, which will take the place of Galaxy. Files uploaded are to redo GO-based analyses for proteomics andtranscriptomics for the manuscript.
Bioinformatics: Assignment 3For this module (assembling HTS data) I'm going to learn Trinity. I downloaded the smaller of the 2 sample datasets (SE_sm_filtered...) ontoHummingbird and put it in my documents folder. This file is single-end Illumina HiSeq.Command line for Trinity out of trinityranseq_r2012-10-05 directory: fastq file, use 20000G of memory, single end data, min contig length of 200./Trinity.pl --seqType fq --JM 20000G --single /Users/Emma/Documents/module_3/SE_sm_filtered.fastq --output/Users/Emma/Documents/module_3/Trinityout_012313 --min_contig_length 200
January 22, 2013Secondary Stress: Fatty AcidFinished extraction of samples started yesterday (transmethylation). Stored autosampler vials at -20°C.
Secondary Stress: ProteomicsFinished file preparation for venn diagrams (see 1/21/13).Uploaded Mouse Genome GO Slim file to Galaxy (http://www.informatics.jax.org/gotools/data/input/map2MGIslim.txt ).
Created a file of all spec counts (summed across tech reps for each oyster, at least 10 spec counts for each protein) to join with new GOannotations. SPID annotations are from previous blastx (file = Cg proteome db evalue -10). Joined with SPIDs, new GO file (1/18/13) and newGO Slim file.
January 21, 2013Secondary Stress: Fatty acid 129

Secondary Stress: Fatty acidFirst round of fatty acid extractions on freeze-dried samples (1/15/13): Exp2.3, 12, 21, 237, 240, 303, 312, 297. Followed protocol uploaded1/10/13. Before weighing out 2.5 mg of freeze dried tissue, mixed the samples around to try to get a representative sample of all that washomogenized. Sample 21 broke in the centrifuge after the first fraction had been removed (i.e. after addition of 2.7 mL chloroform). Continuedwith extraction of just the 1 fraction of 21 but may re-extract it later since the second fraction does contain a good concentration of FAs,although the first has the large majority. Left samples in 50°C water bath overnight.
Secondary Stress: ProteomicsI am making Venn diagrams to show the overlap in proteins identified across technical replicates. For each oyster (3 technical replicates), Icreated a backbone of non-redundant protein IDs that were sequenced across all replicates. I then joined each replicate file to the backboneand kept only proteins that had at least 3 spectral counts across the 3 tech reps. I found the number of proteins that were identified in all 3replicates, those that were in just 2 replicates, and those found in a single replicate. So far I have only done this for oysters 101B2, 5, 8, and 11because Galaxy has stopped working. I used eulerAPE to make the venn diagrams. For all 4 oysters so far, the venns were inexact. Anexample (for 101B11) is below. While making the input files for the venn diagrams, I found that files 101B11_01 and 101B11_03 had not beenedited correctly and so previous analyses using these files might be incorrect (the protein ID column still had multiple proteins per cell,separated by commas).
January 18, 2013
Secondary Stress: Proteomics and RNA-SeqContinuation of acquiring and editing new GOA files. Uploaded both information and association files from EMBL into Galaxy (selected"tabular" as file format, this is necessary to make Galaxy recognize columns). for the gp_information file, cut the first 18 lines of the file. Thenremoved columns 1, 2, 7,8,9,10, and 11. Named this file swissprot gene information 011813. Removed the first 19 lines (header) of thegp_association file and edited the file so that only the columns containing the SPID and GO term remained (swissprot goa 011813).
Bioinformatics: Assignment 2Joined blastx file with new swissprot info and GOA files (see above). Exported and created file of just the GO terms - uploaded this file tocateGOrizer.
MeDipHere are the results from yesterday's medip. It looks like methylation status varies for the genes at the different temperature treatments.
130

January 17, 2013Bioinformatics: Assignment 2Made pie charts for the GO molecular function and cellular components (continuation of 1/9/13 analysis). Pie charts are made from non-redundant associations between contigs and GO terms based on SPID annotations. The first chart is the cellular components and the secondis the molecular functions.
131

MeDip qPCRMeDip qPCR of Claire's heat shocked C. gigas samples from class (methylated and unmethylated fractions, control, HS 35C, and HS 40C).See below for qPCR protocol. Exported data to qPCR miner following Mac's instructions (https://www.evernote.com/shard/s74/sh/dd4fbb95-67d2-410f-8749-51a47b76afbf/eec394e2cbad896cf383e97486efab9d ).
132

January 16, 2013Secondary Stress: Proteomics and RNA-Seq
Created a new history in Galaxy: Cg proteomics - new GO. I am going to use the new GO and SPID files downloaded yesterday to re-annotateand analyze some of the files used for the RNA-Seq and proteomics analysis. I want to make sure my annotations are up to date for themanuscript. The gene information file that I removed the header from yesterday does not maintain the integrity of its columns when uploaded toGalaxy. I am uploading the original file from EMBL and will manipulate it in Galaxy to get the format correct.
Attempt of pathway analysis using R package CePa. Tried both methods of pathway analysis as outlined in publication (Gu & Wang 2013):gene set analysis (GSA) and over-representation analysis (ORA). For GSA, used SPID annotations to identify proteins. The data used havealready been filtered to have at least 10 spec counts across replicates. If multiple proteins matched to the same SPID, the spectral counts weresummed. The final spreadsheet (all protein spid expression for CePa.csv) has SPIDs as row names and individual oysters as column headers.There were no significant pathways identified for a comparison between high and low pCO2. Also did the GSA for the effect of MS Across bothpCO2 treatments and the effect of MS at just ambient pCO2: there were no significant pathways. For the ORA, used the enriched gene setsidentified on 12/11/12. Ran CePa for all gene sets - genes enriched at high pCO2, during MS at high pCO2, at ambient, and ambient MS.There were no significant pathways. R code can be found in my evernote (https://www.evernote.com/Home.action#b=6020fc12-578e-45b7-ae19-e768926a10c9&st=p&n=3e120664-9b18-4b4c-95aa-61214bea9010 ).
I'm going to re-do heat maps for transcriptomics and proteomics using only genes/proteins that contribute significantly to differentiationbetween treatment groups. Made a file of the proteins that are significant for the proteomics (without low abundance proteins) NMDS at the0.05 and 0.01 levels. In Galaxy, joined this file to a file with spec counts across all biological replicates.
Secondary Stress: Fatty acidsRemoved samples from freeze dryer and put lids back on. A chunk of sample 24 was lost (it looked like gill and mantle). Homogenized thefreeze dried tissues with a pestle, rinsing with EtOH and nanopure water between samples (followed by drying pestle thoroughly on a cleankimwipe). Stored samples at -20C.
January 15, 2013Bioinformatics: Assignment 1Continuation of Part B from 1/9/13. Instead of trying to do a tblastn, will translate the database (unknown contigs from part A) and do a blastp.Uploaded fasta of contings to Galaxy. Used the emboss tool transeq to make protein sequences from the nucleotide sequences: all 6 frames,standard code (defaults for other options). Filel = transeq on unknown transcriptome 31545.fasta.Made blast database from the translated transcriptome../makeblastdb -in /Users/Emma/Documents/bioinfo_assignment_1/transeq_on_unknown_transcriptome_31545.fasta -dbtype prot -out/Users/Emma/Documents/bioinfo_assignment_1/Protein_database_for_Part_B
Ran blastp of protamine sequences against protein database. Tried with e-value cutoff of 1E-5 and got 0 results. Upped e-value cut-off to 1 andgot only 1 hit. With e-value cutoff of 1000 got 3 hits../blastp -num_threads 8 -out /Users/Emma/Documents/bioinfo_assignment_1/protamine_seq_orthologs -db/Users/Emma/Documents/bioinfo_assignment_1/Protein_database_for_Part_B -outfmt 6 -evalue 1000 -max_target_seqs 1 -query/Users/Emma/Documents/bioinfo_assignment_1/protamine_sequences.fasta.txt
Secondary Stress: ProteomicsDownloaded gene information and gene association files from EMBL (www.ebi.ac.uk/GOA/downloads.html). I will use these files to redo theGO analyses for the transcriptomics and proteomics that I plan on including in the manuscript. The gp information file gives the genename/annotation for the swiss prot IDs. The gene association file gives the GO terms associated with each SPID. In the gp info file, there is an18-line header that probably wouldn't mesh well with Galaxy. I can't delete it in excel or text wrangler because the file won't load completely ineither application. It opens in text edit, but the app crashes every time I try to delete something. I ended up reading the file into R, skipping thefirst 18 lines, and then exporting it as a tab-delimited file. This is pretty inelegant because there are a number of columns that are useless(including 3 blank ones at the end of the file), but I can't figure out how to get rid of them.
gp.info<-read.table('gp_information.goa_uniprot', skip=18, sep='\t', fill=T)
write.table(gp.info, file='swissprot gene annotation 011513', sep="\t", quote=FALSE, col.names=c("UniProtKB", "Swiss-Prot", "Accession","Gene Abbrev", "Gene name", "Gene Abbrev2", "protein", "taxon ID", " '', " '', " ''))
Secondary Stress: Fatty acidsMorgan Bond helped me set up the freeze dryer to freeze dry my oyster tissues. My original plan was to do just the digestive gland, but most ofmy oysters were too small to subsample the DG effectively so I am doing the whole body tissue (minus the gill which was previously sampled 133

for transcriptomics and proteomics). For 400 uatm I am using samples 3*, 6*, 9*, 12*, 15, 18, 21, and 24 (*denotes an oyster also sequencedfor proteomics). For 1000 uatm I am using samples 291, 294, 297, 300, 303, 306, 309, 312. For 2800 uatm I am using samples 219, 222*,225*, 228*, 231*, 234, 237, and 240. Samples were kept on dry ice until they were placed in the freeze dryer. To use the freeze dryer, turn on(switch in back), put plastic cylinder on top, and then press "condense button" (this cools it down). Place the metal tray on top of the cylinderand put the rubber gasket on the lid. Place the samples on the tray (my samples are in 2 mL screw cap tubes with the lids removed) and putthe lid over the tray. Press "vacuum" to bring the pressure down. Shortly after pressing "vacuum" one of the samples (24) popped out of itstube so we stopped the vacuum and put it back in. After starting up again about 6 samples started poking out of their tubes, but only oneeventually came out the entire way (sample 225). Sam noted that if I had poked holes in the tube lids then the air still could have escaped butthe tissue would have been trapped.
January 11, 2013Secondary Stress: Fatty acidsLearned how to do day 2 of FA extraction (transmethylation). Set up a time next week to freeze dry samples so that they can be extracted.
January 10, 2013Secondary Stress: Fatty acidsLearned how to do day 1 of fatty acid extraction. Protocol uploaded here (http://eagle.fish.washington.edu/oyster/FA%20protocol.pdf ) and(http://eagle.fish.washington.edu/oyster/FA%20transmethylation.pdf ).
Secondary Stress: ProteomicsResearch into how to represent relationships among proteins in response to OA stress (i.e. pathway analysis). On the raw total counts(summed across tech reps for each oyster, at least 10 spec counts for protein to be included) made a Pearson's correlation coefficient matrix.Plotted the matrix in R using levelplot in lattice.
134

This graph isn't very easy to read and you can't see any pattern among the proteins. I've looked a bit in other papers and it seems that ifpathway analysis is done, the authors use IPA. This has been done in non-model vertebrates (pied flycatchers, whitefish), but not ininvertebrates. In bees, a pathway was constructed but just out of the few proteins that were highly correlated with behavioral traits of interest. Icould go a similar route and try to make a pathway from the proteins that are differentially expressed due to ocean acidification and/ormechanical stress.
January 9, 2013Bioinformatics: AssignmentDownloaded files from Eagle for parts a and b of assignment (a =http://eagle.fish.washington.edu/cnidarian/fish546/Unknown_Transcriptome_31545_contigs.fa , b =http://eagle.fish.washington.edu/cnidarian/fish546/protamine_sequences.fasta )On Mac mini opened terminal and navigated to ncbi blast application (cd /Users/Shared/Apps/ncbi-blast-2.2.27+/bin). This is the folder wherethe blast applications are located.Part Adownloaded Swiss Prot database from www.ebi.ac.uk (at the very bottom of the page, the fasta file for UniProtKB/Swiss_Prot). File is calleduniprot_sprot_010913.fasta Made database of these sequences called uniprot_db_010913./makeblastdb -in /Users/Emma/Documents/bioinfo_assignment_1/uniprot_sprot_010913.fasta -dbtype prot -out/Users/Emma/Documents/bioinfo_assignment_1/uniprot_db_010913
Successfully created database. Ran blastx of nucleotide queries against the swiss prot db../blastx -num_threads 8 -out /Users/Emma/Documents/bioinfo_assignment_1/blastx_output -db/Users/Emma/Documents/bioinfo_assignment_1/uniprot_db_010913 -outfmt 6 -evalue 1E-5 -max_target_seqs 1 -query/Users/Emma/Documents/bioinfo_assignment_1/Unknown_Transcriptome_31545_contigs.fa.txt
Notifications popped up in Terminal during blast: Selenocysteine (U) at position ... replaced by X.Blastx finished. Uploaded output of blastx to Galaxy and joined with files of Swiss Prot titles, Go and GO Slim terms.
Part BWill need to do a tblastn of the protein sequences (protamine_sequences.fasta) against a database made from the nucleotide sequences in thepart A file.Made a blast database of the nucleotide sequences using the following code:./makeblastdb -in /Users/Emma/Documents/bioinfo_assignment_1/Unknown_Transcriptome_31545_contigs.fa.txt -dbtype nucl -out/Users/Emma/Documents/bioinfo_assingnment_1/Nucleotide_database_for_Part_B
135
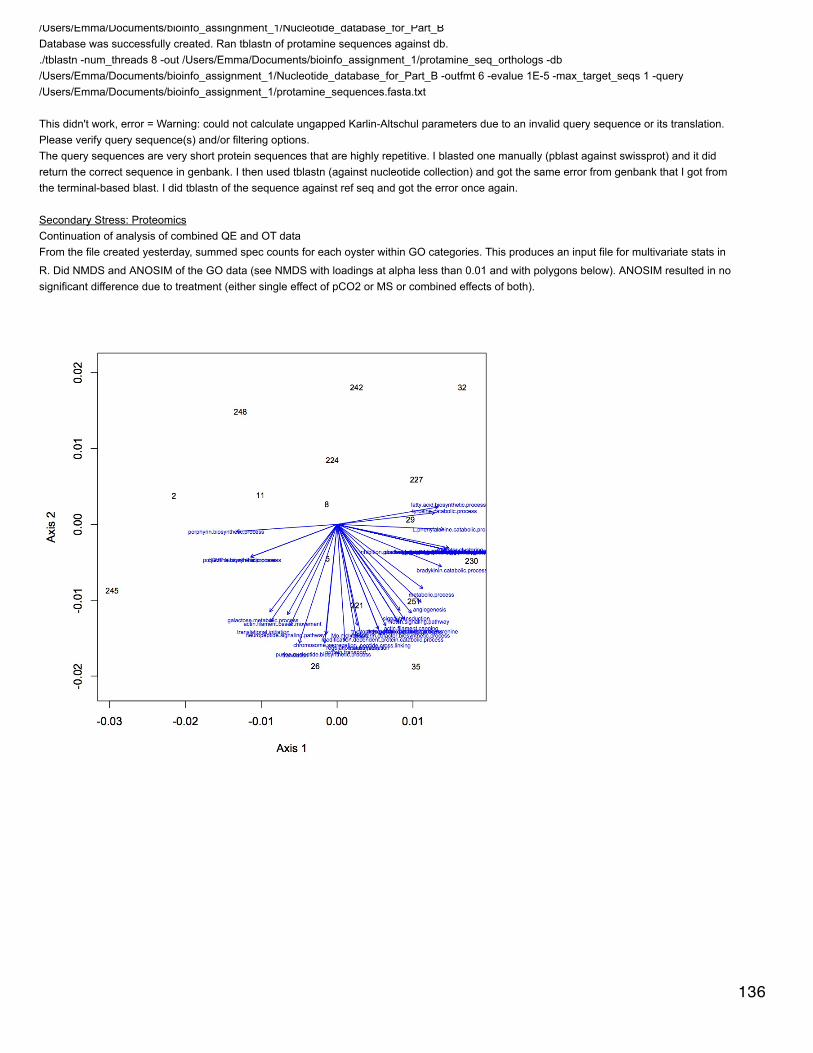
/Users/Emma/Documents/bioinfo_assingnment_1/Nucleotide_database_for_Part_BDatabase was successfully created. Ran tblastn of protamine sequences against db../tblastn -num_threads 8 -out /Users/Emma/Documents/bioinfo_assignment_1/protamine_seq_orthologs -db/Users/Emma/Documents/bioinfo_assignment_1/Nucleotide_database_for_Part_B -outfmt 6 -evalue 1E-5 -max_target_seqs 1 -query/Users/Emma/Documents/bioinfo_assignment_1/protamine_sequences.fasta.txt
This didn't work, error = Warning: could not calculate ungapped Karlin-Altschul parameters due to an invalid query sequence or its translation.Please verify query sequence(s) and/or filtering options.The query sequences are very short protein sequences that are highly repetitive. I blasted one manually (pblast against swissprot) and it didreturn the correct sequence in genbank. I then used tblastn (against nucleotide collection) and got the same error from genbank that I got fromthe terminal-based blast. I did tblastn of the sequence against ref seq and got the error once again.
Secondary Stress: ProteomicsContinuation of analysis of combined QE and OT dataFrom the file created yesterday, summed spec counts for each oyster within GO categories. This produces an input file for multivariate stats in
R. Did NMDS and ANOSIM of the GO data (see NMDS with loadings at alpha less than 0.01 and with polygons below). ANOSIM resulted in nosignificant difference due to treatment (either single effect of pCO2 or MS or combined effects of both).
136
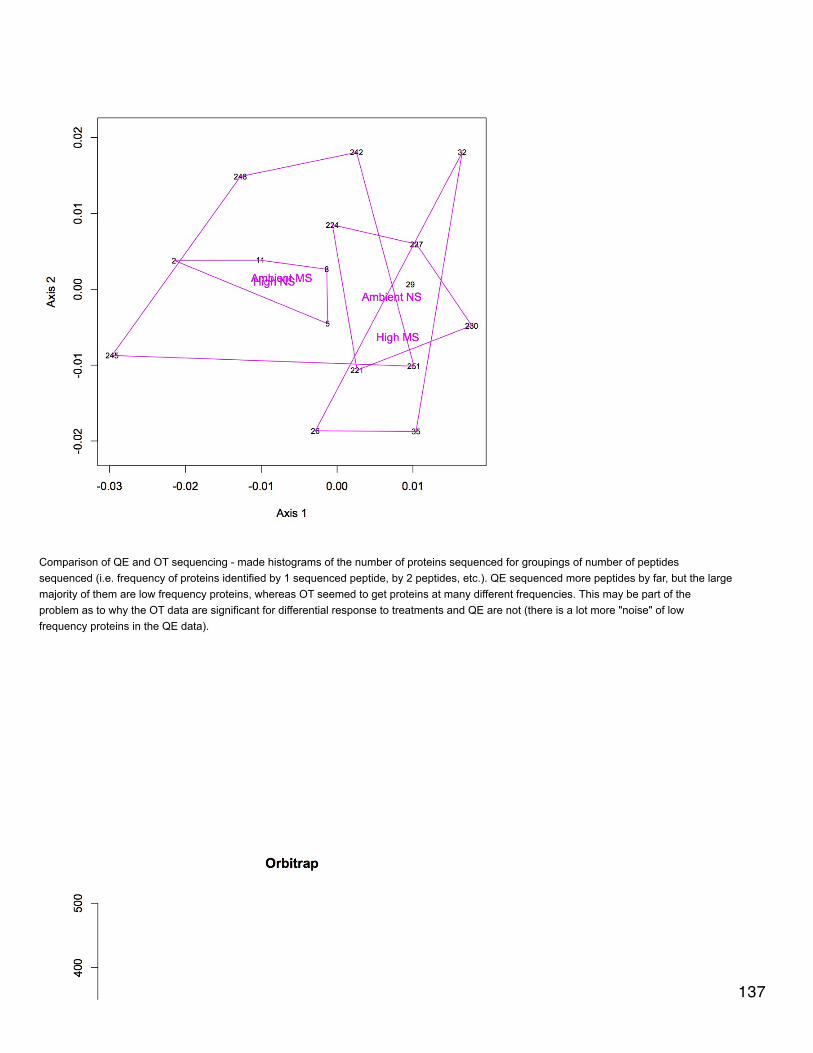
Comparison of QE and OT sequencing - made histograms of the number of proteins sequenced for groupings of number of peptidessequenced (i.e. frequency of proteins identified by 1 sequenced peptide, by 2 peptides, etc.). QE sequenced more peptides by far, but the largemajority of them are low frequency proteins, whereas OT seemed to get proteins at many different frequencies. This may be part of theproblem as to why the OT data are significant for differential response to treatments and QE are not (there is a lot more "noise" of lowfrequency proteins in the QE data).
137
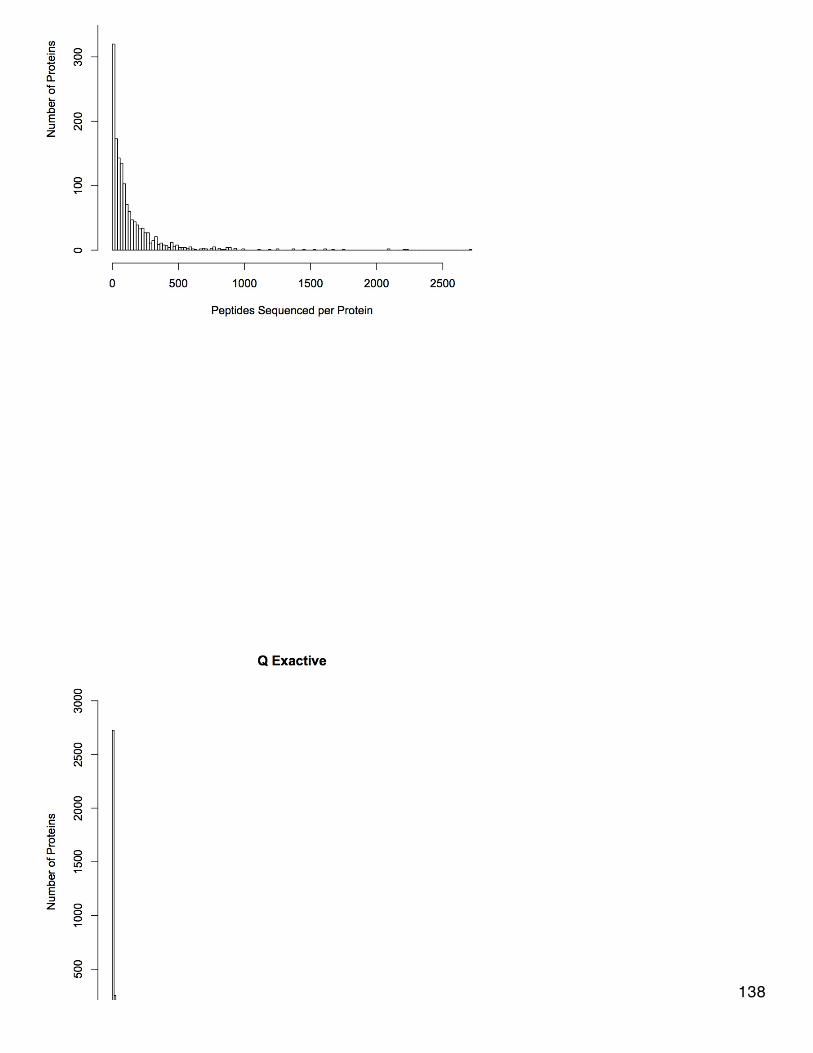
138

January 8, 2013Secondary Stress: ProteomicsAnalysis of combined QE and OT dataMade a file of proteins that were sequenced by both platforms and uploaded to Galaxy (4,296 proteins). This file has been filtered to removeredundancies. To this combined proteome joined files of spec counts for QE and OT data.Created a worksheet for just the total spec counts for each protein across replicates on both QE and OT. In cells that contained ".", replacedwith a 0. Removed proteins that had fewer than 10 spec counts across all replicates on both platforms (n=1792).Summed spec counts across platforms for each oyster. Using Bray-Curtis dissimilarity did NMDS and ANOSIM in R. (Did the same analysesfor all proteins together and for dataset of removed low abundance proteins - expressed in fewer than 8 oysters. The results were similar forboth and the NMDS below is for the entire protein dataset.) There was no significant different when considering only pCO2, only MS, orcombined pCO2 + MS.
Uploaded file of summed spec counts to Galaxy (summed spec counts for annotation). This file includes only proteins that have at least 10spectral hits across replicates and platforms. Annotated file with SPIDs, GO, and GO Slim terms. At this time I will focus only on theannotations that correspond to GO biological processes. Created separate worksheets with the CG ID, columns for the total spec counts foreach oyster, and either the corresponding GO or GO Slim term. Removed redundancies. Next step is to sum the spec counts within GO or GOSlim categories to make input file for NMDS. 139

January 7, 2013Secondary Stress: ProteomicsQE mzXML files are downloaded to eagle. Moved xml files to the same folder on eagle (only moved the v9 interact files, those that weresearched against the oyster genome and have been filtered for high probability peptides).Set up Skyline as described 12/11/12. Library made of v9 peptides is called "QE proteins".I can't get Skyline to work with the QE data. I'm going to abandon this avenue for now and move on to analysis of the combined dataset. Itseems like there might be some information on the Skyline support forum if I want to continue later.
Secondary Stress: RNA-SeqContinuation of analysis from 1/4/13Did cluster analysis and NMDS on RPKM dataset with low abundance transcripts dropped (transcripts must be expressed in a minimum of 4
oysters to be included in analysis).
140

Did ANOSIM on NMDS from 1/4/13 and from today - neither showed a significant difference between treatments. Based on the NMDS, thisdoesn't really make sense....Need to revisit this analysis.
January 4, 2013Secondary Stress: RNA-SeqAnalysis of RNA-Seq data (targeted 3') using RPKM instead of total reads mapped. RPKM corrects for transcript length and is a more "correct"measure of expression than total reads per gene. See 12/13/12 for description of the files used in this analysis. I'm going to basically repeat thestatistics I did on the total reads of these files and use RPKM instead.I made one document that has all of the RPKM values per oyster (n=8) for each contig (n=115999). Document is called "joined RPKM.xlsx".Removed contigs that had total RPKM across all oysters = 0 (n=3284). Ran DESeq analysis in R (first had to round down all RPKM values inExcel to nearest integer). There were 38 differentially expressed genes between low and high pCO2 with an adjusted pvalue of <0.1 (seegraphs below).
Variance Dispersion
141
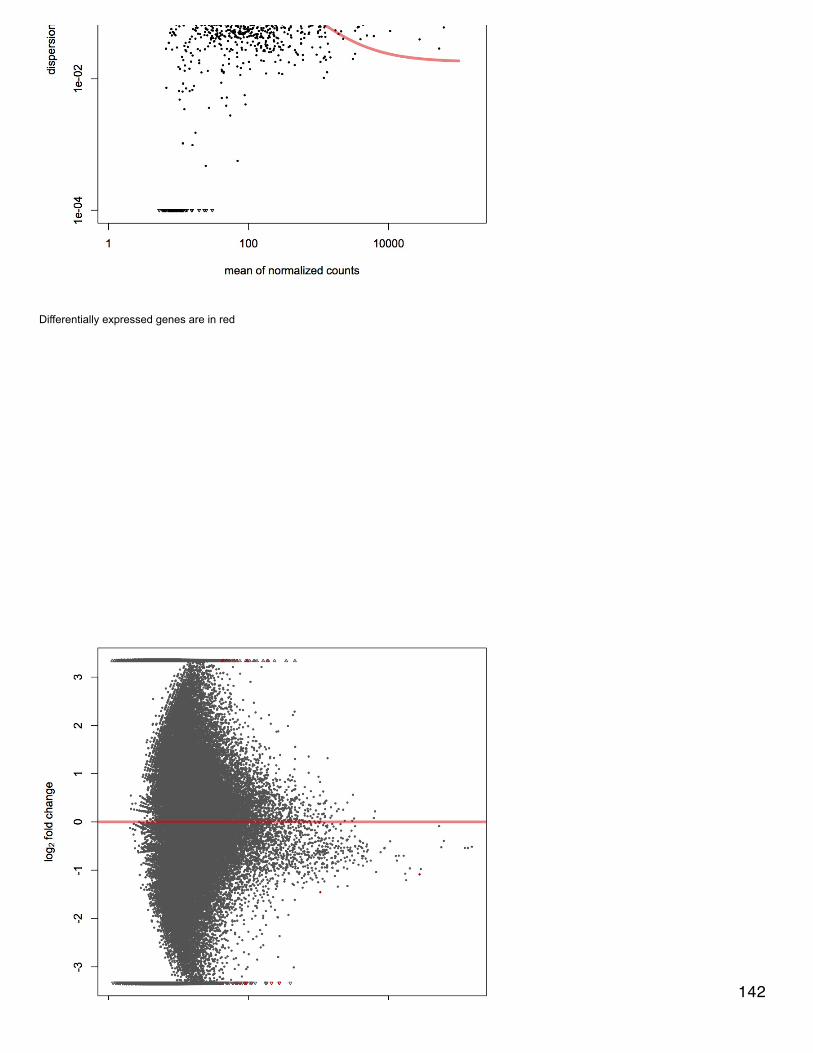
Differentially expressed genes are in red
142
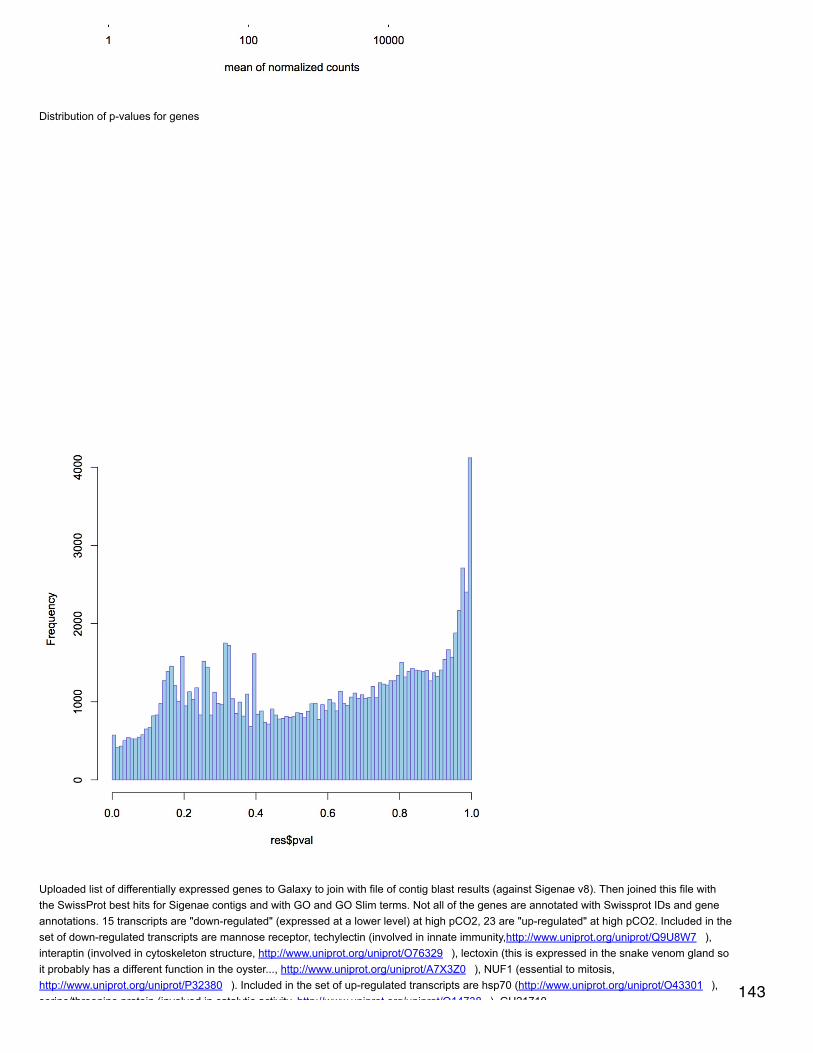
Distribution of p-values for genes
Uploaded list of differentially expressed genes to Galaxy to join with file of contig blast results (against Sigenae v8). Then joined this file withthe SwissProt best hits for Sigenae contigs and with GO and GO Slim terms. Not all of the genes are annotated with Swissprot IDs and geneannotations. 15 transcripts are "down-regulated" (expressed at a lower level) at high pCO2, 23 are "up-regulated" at high pCO2. Included in theset of down-regulated transcripts are mannose receptor, techylectin (involved in innate immunity,http://www.uniprot.org/uniprot/Q9U8W7 ),interaptin (involved in cytoskeleton structure, http://www.uniprot.org/uniprot/O76329 ), lectoxin (this is expressed in the snake venom gland soit probably has a different function in the oyster..., http://www.uniprot.org/uniprot/A7X3Z0 ), NUF1 (essential to mitosis,http://www.uniprot.org/uniprot/P32380 ). Included in the set of up-regulated transcripts are hsp70 (http://www.uniprot.org/uniprot/O43301 ),serine/threonine protein (involved in catalytic activity, http://www.uniprot.org/uniprot/Q14738 ), GH21710
143

serine/threonine protein (involved in catalytic activity, http://www.uniprot.org/uniprot/Q14738 ), GH21710(http://www.uniprot.org/uniprot/B4J675 ), metallothionein (http://www.uniprot.org/uniprot/P23038 ), smc domain protein (structuralmaintenance of chromosomes).
hierarchical clustering of transcriptomic data
NMDS using bray-curtis
144

editJanuary 3, 2013Secondary Stress: ProteomicsAnalysis of QE datadownloaded mzXML files for QE data onto Mac mini PC from the server where Jimmy uploaded them. The xml files were previouslydownloaded.
Enrichment analysis of differentially expressed proteins in QE data for ambient vs. high pCO2 only (MS samples included but notacknowledged as different treatment). Made a list of all of the unique SPIDs that correspond to the proteins that had at least 10 spectral hitsacross replicates - this is the background for DAVID. Made 4 gene lists for analysis: 1) SPIDs corresponding to proteins that were differentiallyexpressed according to a t-test, 2) SPIDs of proteins that were at least 2-fold up-regulated, 3) proteins at least 2-fold down-regulated, 4) all 3previous categories combined.For category 1 (t-test), enriched GO terms were protein folding, peripheral nervous system development, mitotic cell cycle, macromolecularcomplex assembly, cell cycle process, macromolecular complex subunit organization, protein complex biogenesis.For category 2 (up-reg at least 2 fold): protein heterooligomerization, regulation of transcription, regulation of transcription DNA-dependent,transcription, protein complex biogenesis, protein complex assembly, macromolecular complex subunit organization, regulation of RNAmetabolic process, macromolecular complex assembly, pyrimidine nucleotide biosynthetic process, pyrimidine nucleotide metabolic process,regulation of transcription from RNA polymerase II promoter, positive regulation of nucleobase, nucleoside, nucleotide and nucleic acidmetabolic process.
For category 3 (down-reg at least 2 fold): muscle organ development, cellular protein localization, muscle tissue development, skeletal muscleorgan development, cellular macromolecular localization, intracellular protein transport, induction of apoptosis, protein import, regulation oftranscription DNA-dependent.For category 4: mitotic cell cycle checkpoint, protein complex assembly, protein complex biogenesis, regulation of transcription DNA-dependent, cell cycle checkpoint, macromolecular complex assembly, macromolecular complex subunit organization, pyrimidine nucleotidemetabolic process, pyrimidine nucleotide biosynthetic process, membrane organization, response to abiotic stimulus, protein import, proteinoligomerization, detection of stimulus, enzyme linked receptor protein signaling pathway, positive regulation of nitrogen compound metabolicprocess, positive regulation of transcription from RNA polymerase II promoter, sulfur amino acid metabolic process.
January 2, 2013Secondary Stress: ProteomicsAnalysis of QE dataFrom stats done 12/20/12, made list of unique protein IDs of differentially expressed proteins (for each treatment comparison the protein iseither differentially expressed according to the t-test with p<0.05, or according to fold change of at least 2 up- or down-regulated). This is 1,086proteins. Made a fasta file of the protein sequences (from genome v9) corresponding to these CGI IDs in Geneious. 145
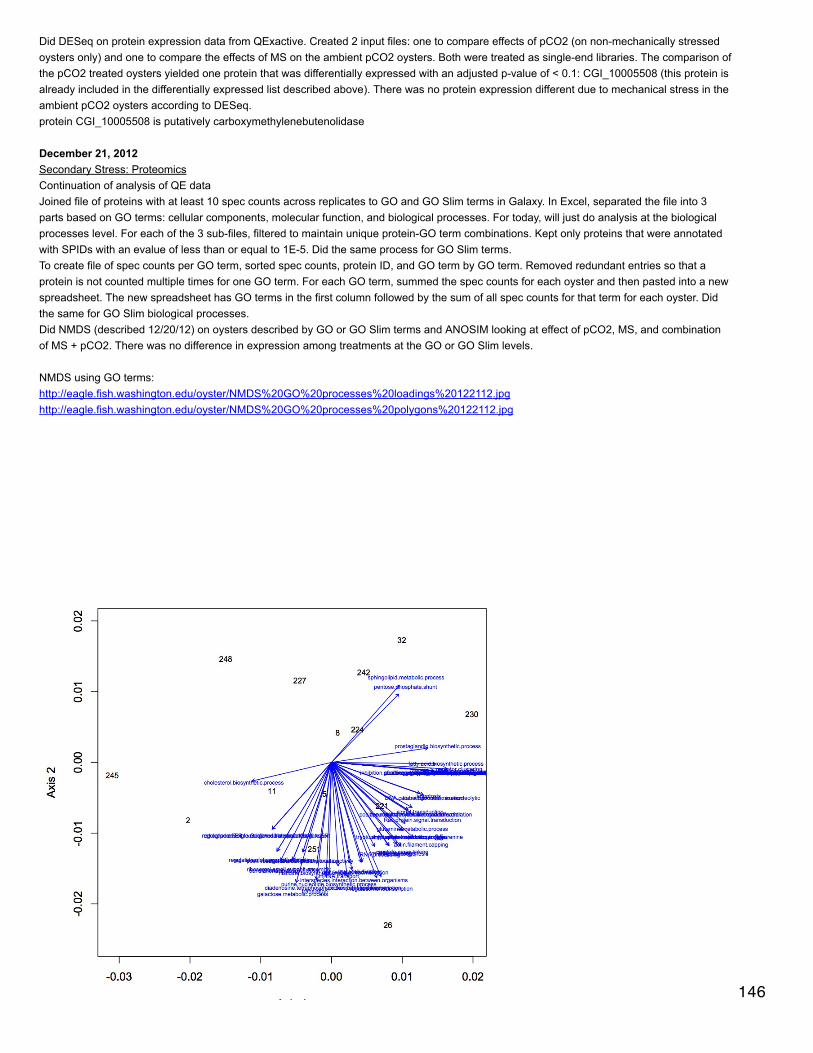
Did DESeq on protein expression data from QExactive. Created 2 input files: one to compare effects of pCO2 (on non-mechanically stressedoysters only) and one to compare the effects of MS on the ambient pCO2 oysters. Both were treated as single-end libraries. The comparison ofthe pCO2 treated oysters yielded one protein that was differentially expressed with an adjusted p-value of < 0.1: CGI_10005508 (this protein isalready included in the differentially expressed list described above). There was no protein expression different due to mechanical stress in theambient pCO2 oysters according to DESeq.protein CGI_10005508 is putatively carboxymethylenebutenolidase
December 21, 2012Secondary Stress: ProteomicsContinuation of analysis of QE dataJoined file of proteins with at least 10 spec counts across replicates to GO and GO Slim terms in Galaxy. In Excel, separated the file into 3parts based on GO terms: cellular components, molecular function, and biological processes. For today, will just do analysis at the biologicalprocesses level. For each of the 3 sub-files, filtered to maintain unique protein-GO term combinations. Kept only proteins that were annotatedwith SPIDs with an evalue of less than or equal to 1E-5. Did the same process for GO Slim terms.To create file of spec counts per GO term, sorted spec counts, protein ID, and GO term by GO term. Removed redundant entries so that aprotein is not counted multiple times for one GO term. For each GO term, summed the spec counts for each oyster and then pasted into a newspreadsheet. The new spreadsheet has GO terms in the first column followed by the sum of all spec counts for that term for each oyster. Didthe same for GO Slim biological processes.Did NMDS (described 12/20/12) on oysters described by GO or GO Slim terms and ANOSIM looking at effect of pCO2, MS, and combinationof MS + pCO2. There was no difference in expression among treatments at the GO or GO Slim levels.
NMDS using GO terms:http://eagle.fish.washington.edu/oyster/NMDS%20GO%20processes%20loadings%20122112.jpghttp://eagle.fish.washington.edu/oyster/NMDS%20GO%20processes%20polygons%20122112.jpg
146

NMDS using GO Slim:http://eagle.fish.washington.edu/oyster/NMDS%20GO%20slim%20processes%20loadings%20122112.jpghttp://eagle.fish.washington.edu/oyster/NMDS%20GO%20slim%20processes%20polygons%20122112.jpg
147

148
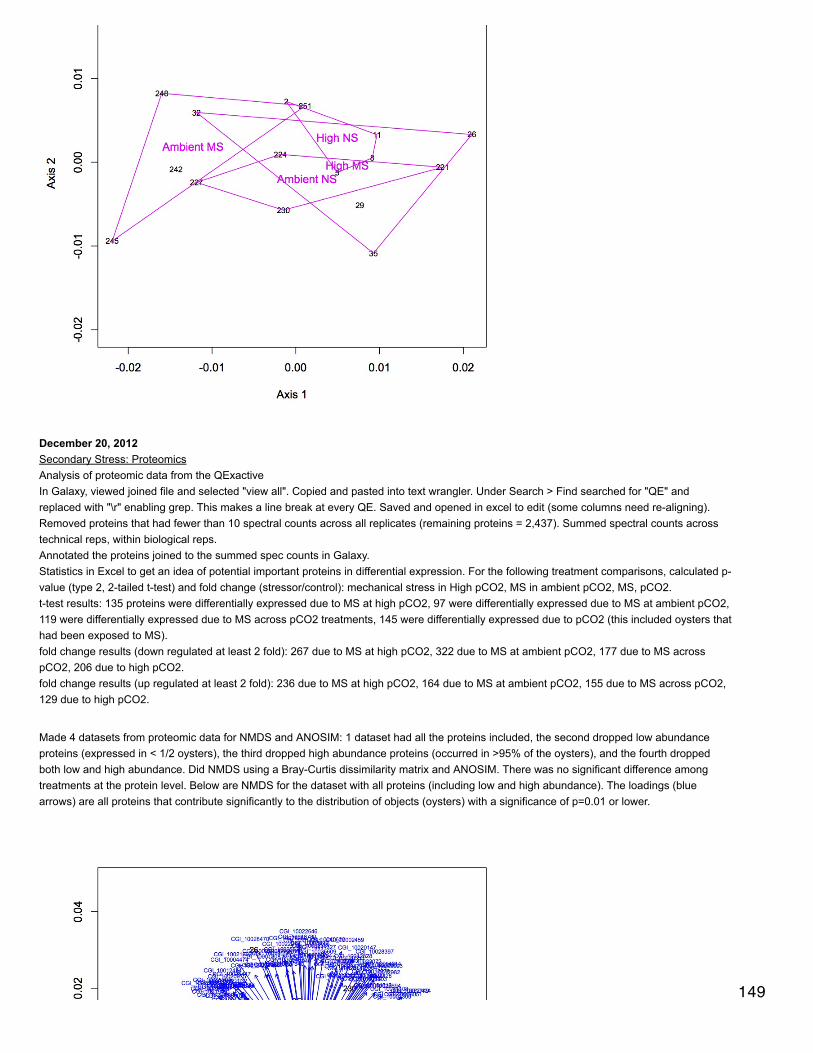
December 20, 2012Secondary Stress: ProteomicsAnalysis of proteomic data from the QExactiveIn Galaxy, viewed joined file and selected "view all". Copied and pasted into text wrangler. Under Search > Find searched for "QE" andreplaced with "\r" enabling grep. This makes a line break at every QE. Saved and opened in excel to edit (some columns need re-aligning).Removed proteins that had fewer than 10 spectral counts across all replicates (remaining proteins = 2,437). Summed spectral counts acrosstechnical reps, within biological reps.Annotated the proteins joined to the summed spec counts in Galaxy.Statistics in Excel to get an idea of potential important proteins in differential expression. For the following treatment comparisons, calculated p-value (type 2, 2-tailed t-test) and fold change (stressor/control): mechanical stress in High pCO2, MS in ambient pCO2, MS, pCO2.t-test results: 135 proteins were differentially expressed due to MS at high pCO2, 97 were differentially expressed due to MS at ambient pCO2,119 were differentially expressed due to MS across pCO2 treatments, 145 were differentially expressed due to pCO2 (this included oysters thathad been exposed to MS).fold change results (down regulated at least 2 fold): 267 due to MS at high pCO2, 322 due to MS at ambient pCO2, 177 due to MS acrosspCO2, 206 due to high pCO2.fold change results (up regulated at least 2 fold): 236 due to MS at high pCO2, 164 due to MS at ambient pCO2, 155 due to MS across pCO2,129 due to high pCO2.
Made 4 datasets from proteomic data for NMDS and ANOSIM: 1 dataset had all the proteins included, the second dropped low abundanceproteins (expressed in < 1/2 oysters), the third dropped high abundance proteins (occurred in >95% of the oysters), and the fourth droppedboth low and high abundance. Did NMDS using a Bray-Curtis dissimilarity matrix and ANOSIM. There was no significant difference amongtreatments at the protein level. Below are NMDS for the dataset with all proteins (including low and high abundance). The loadings (bluearrows) are all proteins that contribute significantly to the distribution of objects (oysters) with a significance of p=0.01 or lower.
149

150
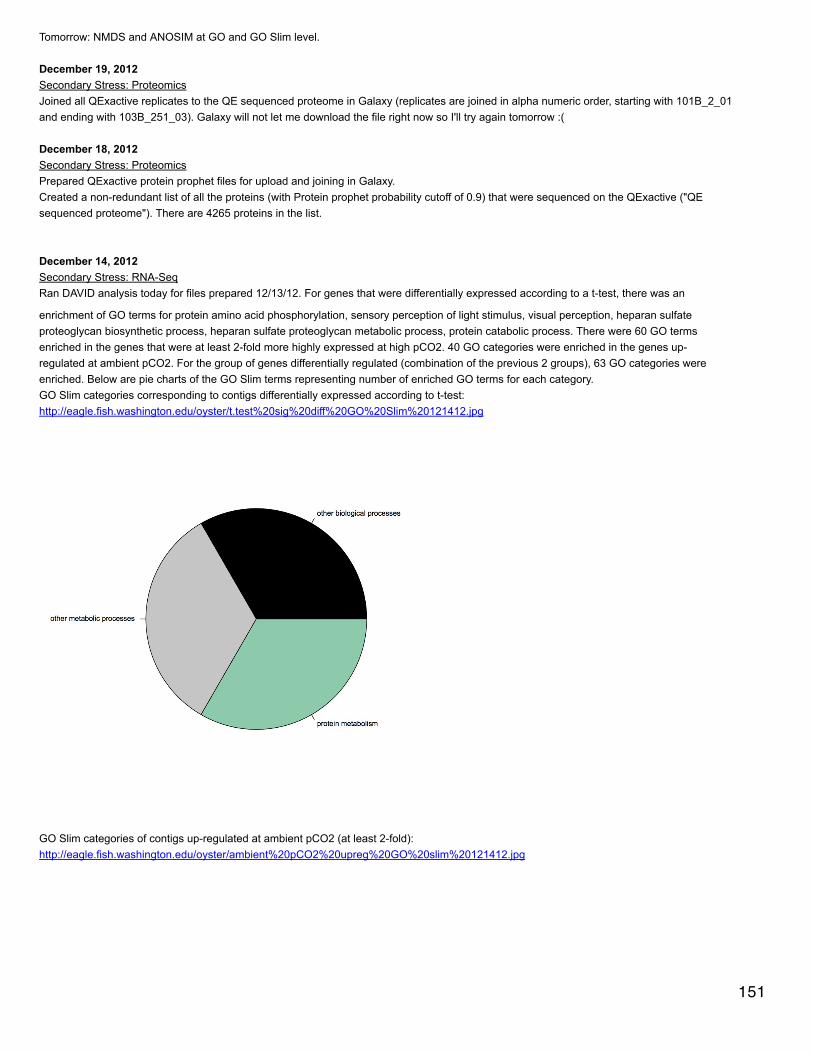
Tomorrow: NMDS and ANOSIM at GO and GO Slim level.
December 19, 2012Secondary Stress: ProteomicsJoined all QExactive replicates to the QE sequenced proteome in Galaxy (replicates are joined in alpha numeric order, starting with 101B_2_01and ending with 103B_251_03). Galaxy will not let me download the file right now so I'll try again tomorrow :(
December 18, 2012Secondary Stress: ProteomicsPrepared QExactive protein prophet files for upload and joining in Galaxy.Created a non-redundant list of all the proteins (with Protein prophet probability cutoff of 0.9) that were sequenced on the QExactive ("QEsequenced proteome"). There are 4265 proteins in the list.
December 14, 2012Secondary Stress: RNA-SeqRan DAVID analysis today for files prepared 12/13/12. For genes that were differentially expressed according to a t-test, there was an
enrichment of GO terms for protein amino acid phosphorylation, sensory perception of light stimulus, visual perception, heparan sulfateproteoglycan biosynthetic process, heparan sulfate proteoglycan metabolic process, protein catabolic process. There were 60 GO termsenriched in the genes that were at least 2-fold more highly expressed at high pCO2. 40 GO categories were enriched in the genes up-regulated at ambient pCO2. For the group of genes differentially regulated (combination of the previous 2 groups), 63 GO categories wereenriched. Below are pie charts of the GO Slim terms representing number of enriched GO terms for each category.GO Slim categories corresponding to contigs differentially expressed according to t-test:http://eagle.fish.washington.edu/oyster/t.test%20sig%20diff%20GO%20Slim%20121412.jpg
GO Slim categories of contigs up-regulated at ambient pCO2 (at least 2-fold):http://eagle.fish.washington.edu/oyster/ambient%20pCO2%20upreg%20GO%20slim%20121412.jpg
151

GO Slim categories of contigs up-regulated at high pCO2 (at least 2-fold):http://eagle.fish.washington.edu/oyster/high%20pCO2%20upreg%20GO%20Slim%20121412.jpg
152

GO Slim categories of contigs differentially regulated at least 2-fold:http://eagle.fish.washington.edu/oyster/diff%20reg%20GO%20Slim%20121412.jpg
153

NMDS and ANOSIM at contig, GO, and GO slim levels excluding oyster D. No better resolution was achieved, ANOSIM for GO and GO Slimlevels was insignificant.NMDS of contigs without oyster D: http://eagle.fish.washington.edu/oyster/NMDS%20contigs%20no%20oyster%20D%20121412.jpg
NMDS of GO terms without oyster D: http://eagle.fish.washington.edu/oyster/NMDS%20GO%20no%20oyster%20D%20121412.jpg
154
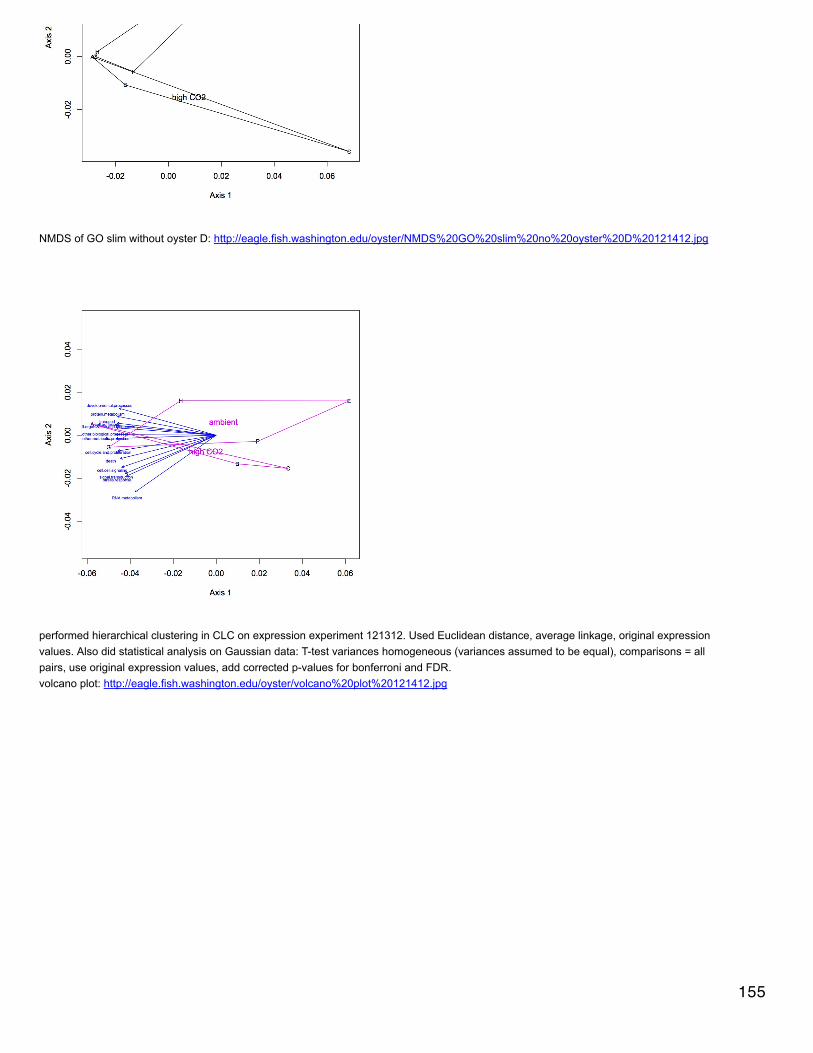
NMDS of GO slim without oyster D: http://eagle.fish.washington.edu/oyster/NMDS%20GO%20slim%20no%20oyster%20D%20121412.jpg
performed hierarchical clustering in CLC on expression experiment 121312. Used Euclidean distance, average linkage, original expressionvalues. Also did statistical analysis on Gaussian data: T-test variances homogeneous (variances assumed to be equal), comparisons = allpairs, use original expression values, add corrected p-values for bonferroni and FDR.volcano plot: http://eagle.fish.washington.edu/oyster/volcano%20plot%20121412.jpg
155
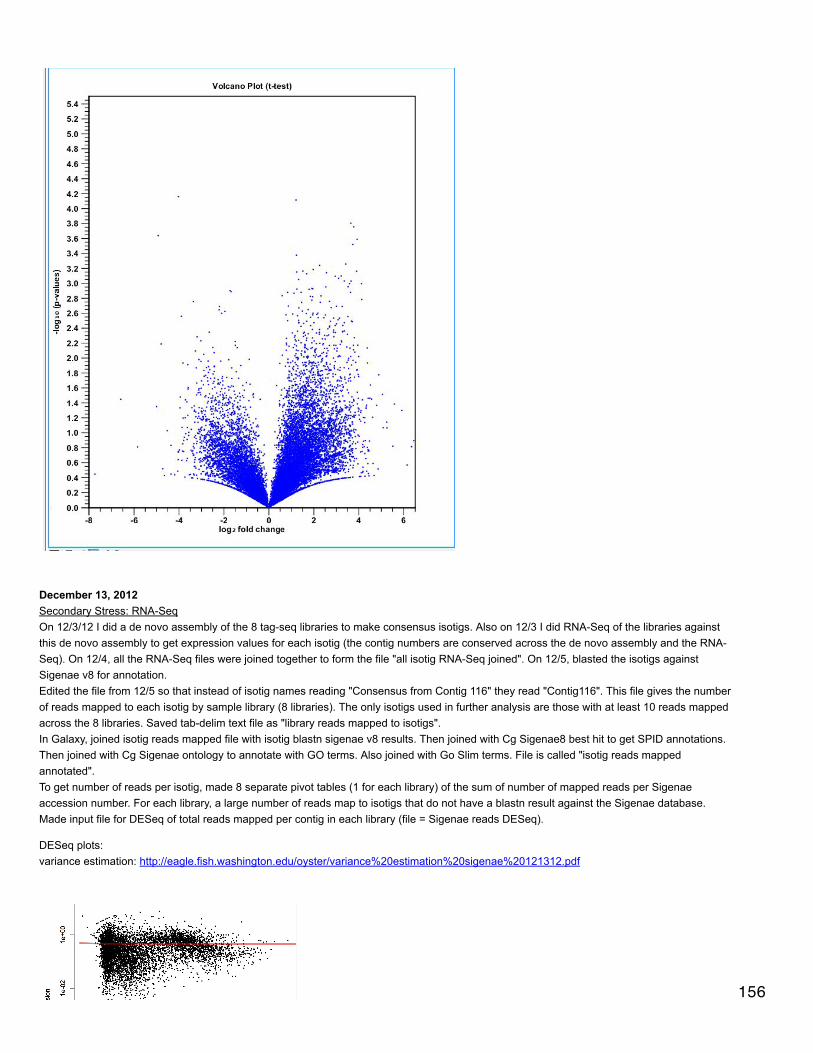
December 13, 2012Secondary Stress: RNA-SeqOn 12/3/12 I did a de novo assembly of the 8 tag-seq libraries to make consensus isotigs. Also on 12/3 I did RNA-Seq of the libraries againstthis de novo assembly to get expression values for each isotig (the contig numbers are conserved across the de novo assembly and the RNA-Seq). On 12/4, all the RNA-Seq files were joined together to form the file "all isotig RNA-Seq joined". On 12/5, blasted the isotigs againstSigenae v8 for annotation.Edited the file from 12/5 so that instead of isotig names reading "Consensus from Contig 116" they read "Contig116". This file gives the numberof reads mapped to each isotig by sample library (8 libraries). The only isotigs used in further analysis are those with at least 10 reads mappedacross the 8 libraries. Saved tab-delim text file as "library reads mapped to isotigs".In Galaxy, joined isotig reads mapped file with isotig blastn sigenae v8 results. Then joined with Cg Sigenae8 best hit to get SPID annotations.Then joined with Cg Sigenae ontology to annotate with GO terms. Also joined with Go Slim terms. File is called "isotig reads mappedannotated".To get number of reads per isotig, made 8 separate pivot tables (1 for each library) of the sum of number of mapped reads per Sigenaeaccession number. For each library, a large number of reads map to isotigs that do not have a blastn result against the Sigenae database.Made input file for DESeq of total reads mapped per contig in each library (file = Sigenae reads DESeq).
DESeq plots:variance estimation: http://eagle.fish.washington.edu/oyster/variance%20estimation%20sigenae%20121312.pdf
156
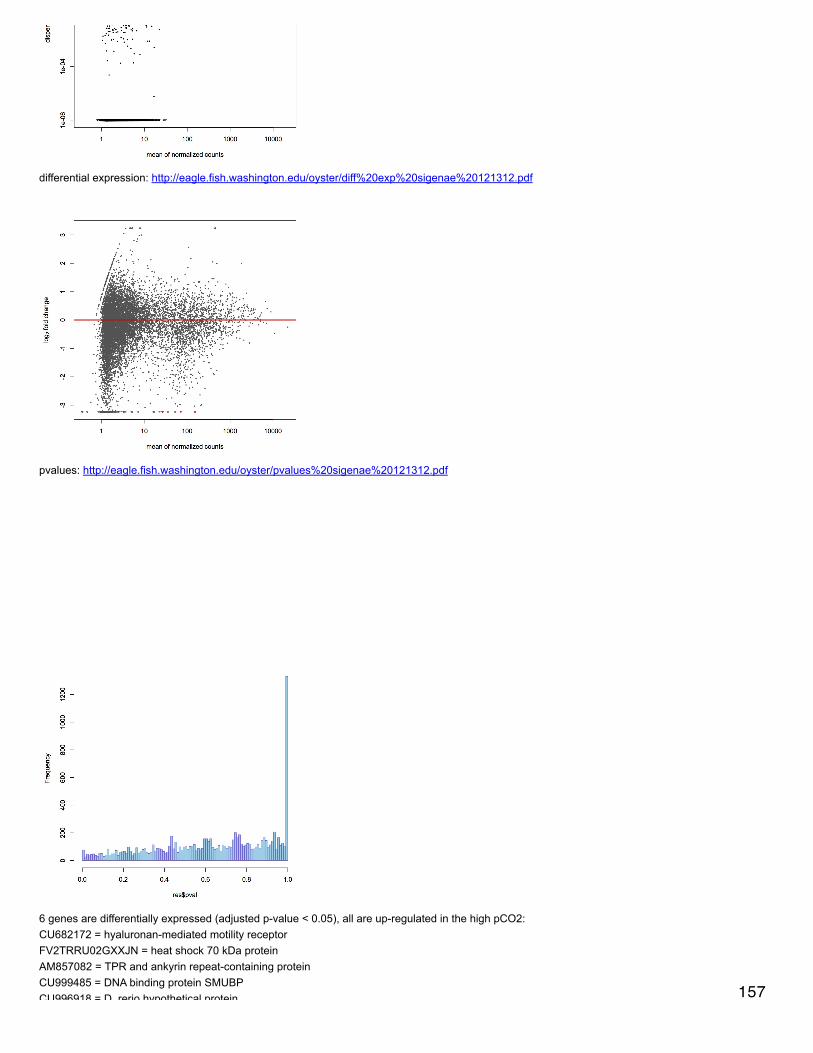
differential expression: http://eagle.fish.washington.edu/oyster/diff%20exp%20sigenae%20121312.pdf
pvalues: http://eagle.fish.washington.edu/oyster/pvalues%20sigenae%20121312.pdf
6 genes are differentially expressed (adjusted p-value < 0.05), all are up-regulated in the high pCO2:CU682172 = hyaluronan-mediated motility receptorFV2TRRU02GXXJN = heat shock 70 kDa proteinAM857082 = TPR and ankyrin repeat-containing proteinCU999485 = DNA binding protein SMUBPCU996918 = D. rerio hypothetical protein 157
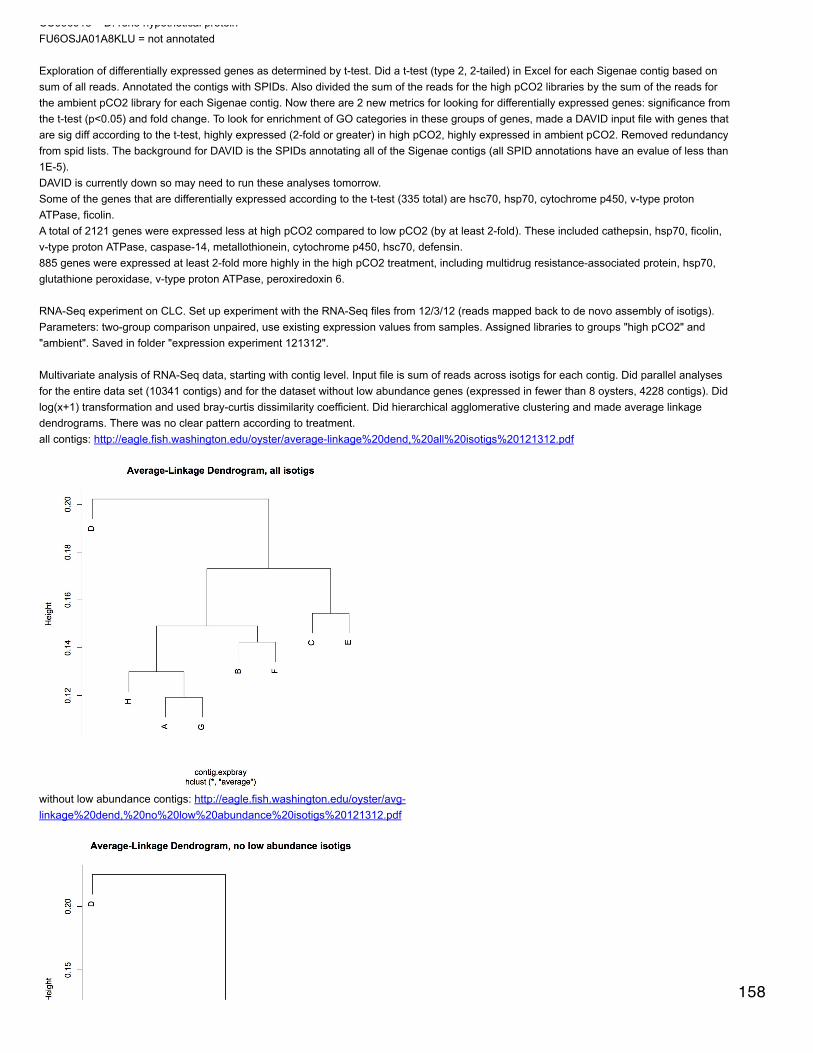
CU996918 = D. rerio hypothetical proteinFU6OSJA01A8KLU = not annotated
Exploration of differentially expressed genes as determined by t-test. Did a t-test (type 2, 2-tailed) in Excel for each Sigenae contig based onsum of all reads. Annotated the contigs with SPIDs. Also divided the sum of the reads for the high pCO2 libraries by the sum of the reads forthe ambient pCO2 library for each Sigenae contig. Now there are 2 new metrics for looking for differentially expressed genes: significance fromthe t-test (p<0.05) and fold change. To look for enrichment of GO categories in these groups of genes, made a DAVID input file with genes thatare sig diff according to the t-test, highly expressed (2-fold or greater) in high pCO2, highly expressed in ambient pCO2. Removed redundancyfrom spid lists. The background for DAVID is the SPIDs annotating all of the Sigenae contigs (all SPID annotations have an evalue of less than1E-5).DAVID is currently down so may need to run these analyses tomorrow.Some of the genes that are differentially expressed according to the t-test (335 total) are hsc70, hsp70, cytochrome p450, v-type protonATPase, ficolin.A total of 2121 genes were expressed less at high pCO2 compared to low pCO2 (by at least 2-fold). These included cathepsin, hsp70, ficolin,v-type proton ATPase, caspase-14, metallothionein, cytochrome p450, hsc70, defensin.885 genes were expressed at least 2-fold more highly in the high pCO2 treatment, including multidrug resistance-associated protein, hsp70,glutathione peroxidase, v-type proton ATPase, peroxiredoxin 6.
RNA-Seq experiment on CLC. Set up experiment with the RNA-Seq files from 12/3/12 (reads mapped back to de novo assembly of isotigs).Parameters: two-group comparison unpaired, use existing expression values from samples. Assigned libraries to groups "high pCO2" and"ambient". Saved in folder "expression experiment 121312".
Multivariate analysis of RNA-Seq data, starting with contig level. Input file is sum of reads across isotigs for each contig. Did parallel analysesfor the entire data set (10341 contigs) and for the dataset without low abundance genes (expressed in fewer than 8 oysters, 4228 contigs). Didlog(x+1) transformation and used bray-curtis dissimilarity coefficient. Did hierarchical agglomerative clustering and made average linkagedendrograms. There was no clear pattern according to treatment.all contigs: http://eagle.fish.washington.edu/oyster/average-linkage%20dend,%20all%20isotigs%20121312.pdf
without low abundance contigs: http://eagle.fish.washington.edu/oyster/avg-linkage%20dend,%20no%20low%20abundance%20isotigs%20121312.pdf
158
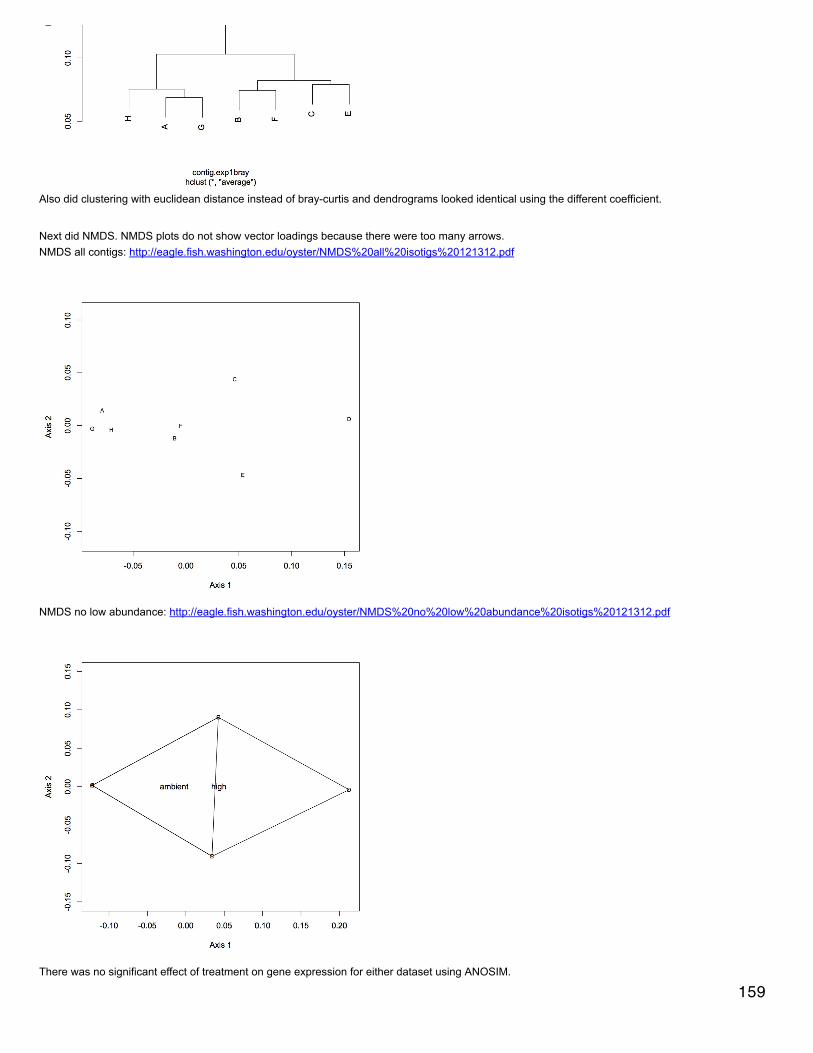
Also did clustering with euclidean distance instead of bray-curtis and dendrograms looked identical using the different coefficient.
Next did NMDS. NMDS plots do not show vector loadings because there were too many arrows.NMDS all contigs: http://eagle.fish.washington.edu/oyster/NMDS%20all%20isotigs%20121312.pdf
NMDS no low abundance: http://eagle.fish.washington.edu/oyster/NMDS%20no%20low%20abundance%20isotigs%20121312.pdf
There was no significant effect of treatment on gene expression for either dataset using ANOSIM.
159
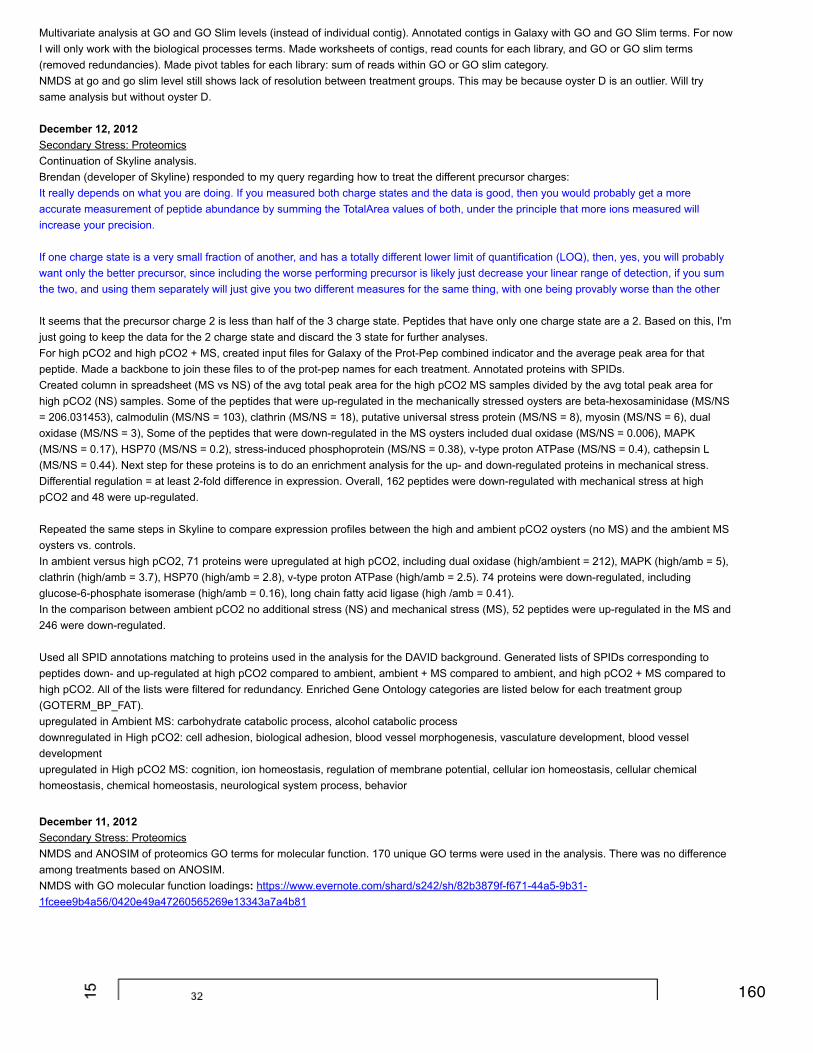
Multivariate analysis at GO and GO Slim levels (instead of individual contig). Annotated contigs in Galaxy with GO and GO Slim terms. For nowI will only work with the biological processes terms. Made worksheets of contigs, read counts for each library, and GO or GO slim terms(removed redundancies). Made pivot tables for each library: sum of reads within GO or GO slim category.NMDS at go and go slim level still shows lack of resolution between treatment groups. This may be because oyster D is an outlier. Will trysame analysis but without oyster D.
December 12, 2012Secondary Stress: ProteomicsContinuation of Skyline analysis.Brendan (developer of Skyline) responded to my query regarding how to treat the different precursor charges:It really depends on what you are doing. If you measured both charge states and the data is good, then you would probably get a moreaccurate measurement of peptide abundance by summing the TotalArea values of both, under the principle that more ions measured willincrease your precision.
If one charge state is a very small fraction of another, and has a totally different lower limit of quantification (LOQ), then, yes, you will probablywant only the better precursor, since including the worse performing precursor is likely just decrease your linear range of detection, if you sumthe two, and using them separately will just give you two different measures for the same thing, with one being provably worse than the other
It seems that the precursor charge 2 is less than half of the 3 charge state. Peptides that have only one charge state are a 2. Based on this, I'mjust going to keep the data for the 2 charge state and discard the 3 state for further analyses.For high pCO2 and high pCO2 + MS, created input files for Galaxy of the Prot-Pep combined indicator and the average peak area for thatpeptide. Made a backbone to join these files to of the prot-pep names for each treatment. Annotated proteins with SPIDs.Created column in spreadsheet (MS vs NS) of the avg total peak area for the high pCO2 MS samples divided by the avg total peak area forhigh pCO2 (NS) samples. Some of the peptides that were up-regulated in the mechanically stressed oysters are beta-hexosaminidase (MS/NS= 206.031453), calmodulin (MS/NS = 103), clathrin (MS/NS = 18), putative universal stress protein (MS/NS = 8), myosin (MS/NS = 6), dualoxidase (MS/NS = 3), Some of the peptides that were down-regulated in the MS oysters included dual oxidase (MS/NS = 0.006), MAPK(MS/NS = 0.17), HSP70 (MS/NS = 0.2), stress-induced phosphoprotein (MS/NS = 0.38), v-type proton ATPase (MS/NS = 0.4), cathepsin L(MS/NS = 0.44). Next step for these proteins is to do an enrichment analysis for the up- and down-regulated proteins in mechanical stress.Differential regulation = at least 2-fold difference in expression. Overall, 162 peptides were down-regulated with mechanical stress at highpCO2 and 48 were up-regulated.
Repeated the same steps in Skyline to compare expression profiles between the high and ambient pCO2 oysters (no MS) and the ambient MSoysters vs. controls.In ambient versus high pCO2, 71 proteins were upregulated at high pCO2, including dual oxidase (high/ambient = 212), MAPK (high/amb = 5),clathrin (high/amb = 3.7), HSP70 (high/amb = 2.8), v-type proton ATPase (high/amb = 2.5). 74 proteins were down-regulated, includingglucose-6-phosphate isomerase (high/amb = 0.16), long chain fatty acid ligase (high /amb = 0.41).In the comparison between ambient pCO2 no additional stress (NS) and mechanical stress (MS), 52 peptides were up-regulated in the MS and246 were down-regulated.
Used all SPID annotations matching to proteins used in the analysis for the DAVID background. Generated lists of SPIDs corresponding topeptides down- and up-regulated at high pCO2 compared to ambient, ambient + MS compared to ambient, and high pCO2 + MS compared tohigh pCO2. All of the lists were filtered for redundancy. Enriched Gene Ontology categories are listed below for each treatment group(GOTERM_BP_FAT).upregulated in Ambient MS: carbohydrate catabolic process, alcohol catabolic processdownregulated in High pCO2: cell adhesion, biological adhesion, blood vessel morphogenesis, vasculature development, blood vesseldevelopmentupregulated in High pCO2 MS: cognition, ion homeostasis, regulation of membrane potential, cellular ion homeostasis, cellular chemicalhomeostasis, chemical homeostasis, neurological system process, behavior
December 11, 2012Secondary Stress: ProteomicsNMDS and ANOSIM of proteomics GO terms for molecular function. 170 unique GO terms were used in the analysis. There was no differenceamong treatments based on ANOSIM.NMDS with GO molecular function loadings: https://www.evernote.com/shard/s242/sh/82b3879f-f671-44a5-9b31-1fceee9b4a56/0420e49a47260565269e13343a7a4b81
160

http://eagle.fish.washington.edu/oyster/GO%20function%20NMDS%20with%20loadings.pdf
NMDS with GO molecular function polygons:https://www.evernote.com/shard/s242/sh/215f7268-5a83-48f5-91ce-62e765ce76ec/58b3abc34a9df224d24d68cebf2c0ca1http://eagle.fish.washington.edu/oyster/GO%20function%20NMDS%20with%20polygons.pdf
161
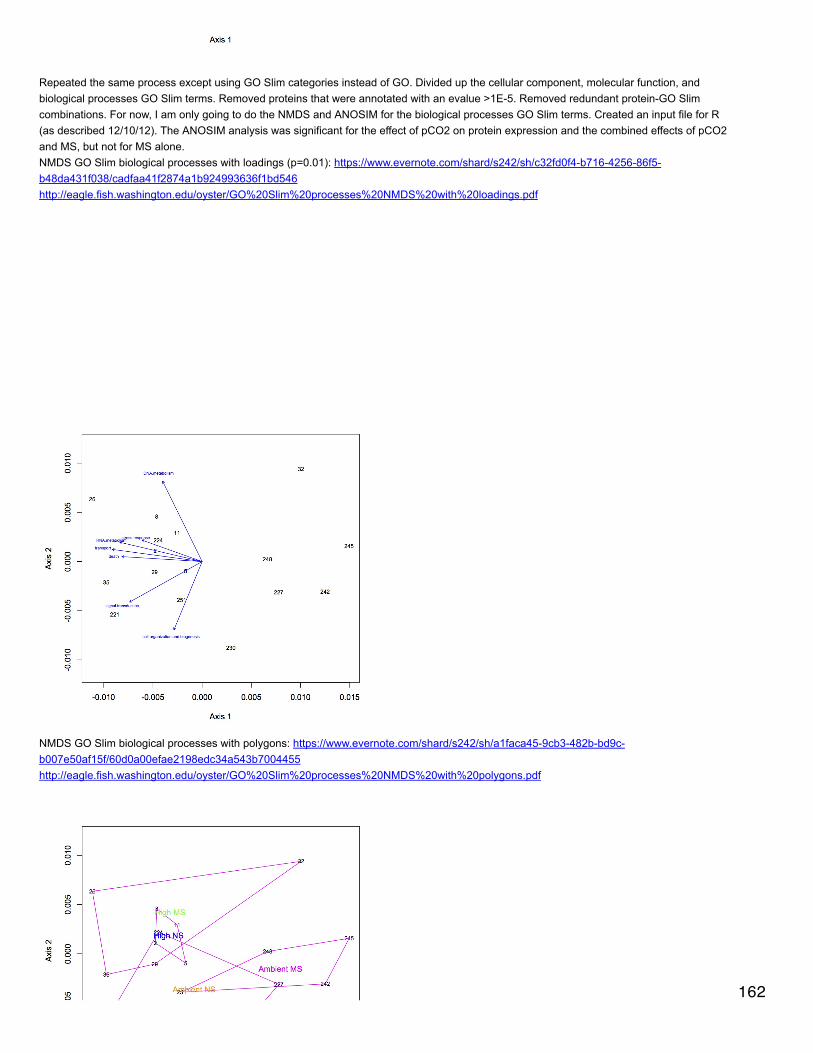
Repeated the same process except using GO Slim categories instead of GO. Divided up the cellular component, molecular function, andbiological processes GO Slim terms. Removed proteins that were annotated with an evalue >1E-5. Removed redundant protein-GO Slimcombinations. For now, I am only going to do the NMDS and ANOSIM for the biological processes GO Slim terms. Created an input file for R(as described 12/10/12). The ANOSIM analysis was significant for the effect of pCO2 on protein expression and the combined effects of pCO2and MS, but not for MS alone.NMDS GO Slim biological processes with loadings (p=0.01): https://www.evernote.com/shard/s242/sh/c32fd0f4-b716-4256-86f5-b48da431f038/cadfaa41f2874a1b924993636f1bd546http://eagle.fish.washington.edu/oyster/GO%20Slim%20processes%20NMDS%20with%20loadings.pdf
NMDS GO Slim biological processes with polygons: https://www.evernote.com/shard/s242/sh/a1faca45-9cb3-482b-bd9c-b007e50af15f/60d0a00efae2198edc34a543b7004455http://eagle.fish.washington.edu/oyster/GO%20Slim%20processes%20NMDS%20with%20polygons.pdf
162
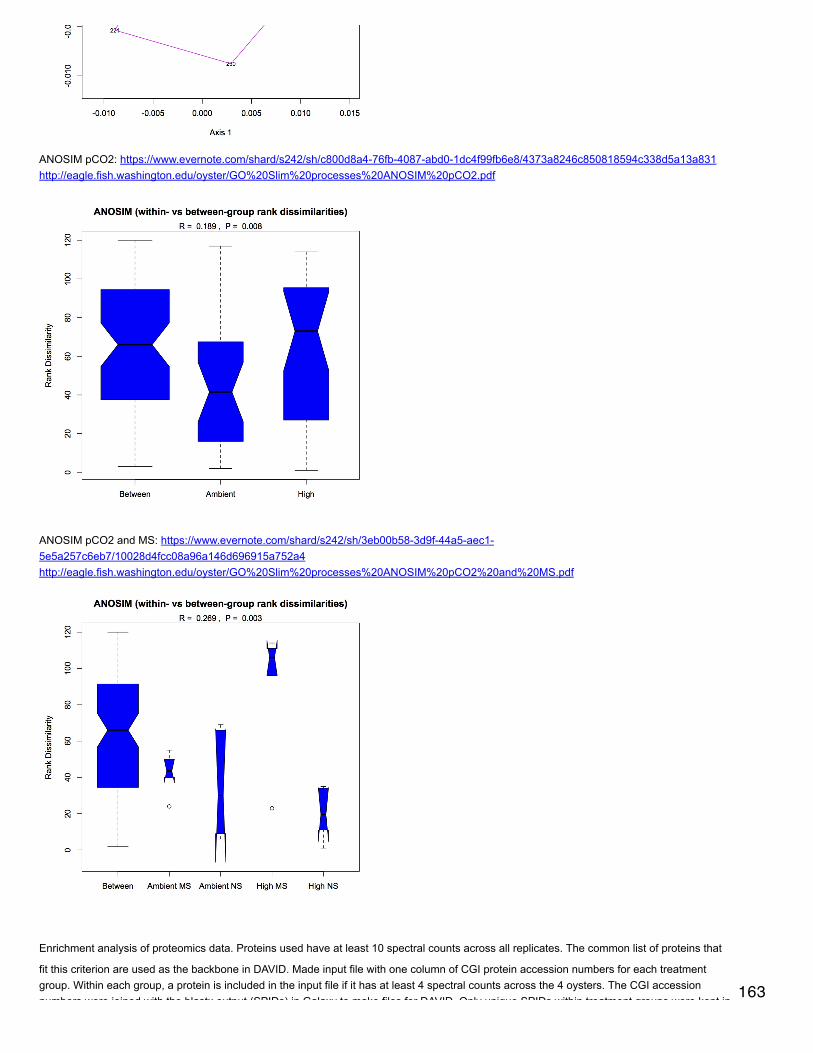
ANOSIM pCO2: https://www.evernote.com/shard/s242/sh/c800d8a4-76fb-4087-abd0-1dc4f99fb6e8/4373a8246c850818594c338d5a13a831http://eagle.fish.washington.edu/oyster/GO%20Slim%20processes%20ANOSIM%20pCO2.pdf
ANOSIM pCO2 and MS: https://www.evernote.com/shard/s242/sh/3eb00b58-3d9f-44a5-aec1-5e5a257c6eb7/10028d4fcc08a96a146d696915a752a4http://eagle.fish.washington.edu/oyster/GO%20Slim%20processes%20ANOSIM%20pCO2%20and%20MS.pdf
Enrichment analysis of proteomics data. Proteins used have at least 10 spectral counts across all replicates. The common list of proteins that
fit this criterion are used as the backbone in DAVID. Made input file with one column of CGI protein accession numbers for each treatmentgroup. Within each group, a protein is included in the input file if it has at least 4 spectral counts across the 4 oysters. The CGI accessionnumbers were joined with the blastx output (SPIDs) in Galaxy to make files for DAVID. Only unique SPIDs within treatment groups were kept in
163

numbers were joined with the blastx output (SPIDs) in Galaxy to make files for DAVID. Only unique SPIDs within treatment groups were kept inthe final file for DAVID (v. 6.7).The only GO term that was enriched (GOTERM_BP_FAT) was for high pCO2 + MS (regulation of transcription).
Analysis of proteins of interest in Skyline.Downloaded zipped files (from Jimmy, mzXML_OT1, pepxml_OT1, pepxml_QE) from proteomics server onto "Mac" mini. These files extract tothe files needed to build libraries in Skyline.Also put protein of interest fasta file (see 12/6/12) onto Eagle to download and use in Skyline.Settings > Peptide settings> Enzyme: Trypsin [KR|P]max missed cleavages = 2background proteome = nonePeptide settings > modifications > edit structural modifications: choose oxidation (M) from the drop-down list, check variable box.Peptide settings > library > build: name = oyster proteins, keep redundant library, cut-off score = 0.95, lab authority =roberts.fish.washington.edu. Selected all "v9" interact files (these are the files that were searched against the genome and have been filteredfor more probable proteins). pick peptides matching library.Settings > transition settings > Filter: precursor charges = 2,3,4; ion charges = 1,2,3; ion types =p; auto-select all matching transitions.transition settings > library: uncheck if a library spectrum is available, pick its most intense ionstransition settings > full-scan: isotope peaks included = count; precursor mass analyzer = orbitrap; peaks = 3, resolving power = 60,000 at 400,use only scans within 5 minutes of MS/MS IDs.File > import > FASTA to import proteins of interest determined by prior analysis (C. gigas proteins for Skyline.fasta).Settings: Integrate allView > peak areas: replicate comparisonView > peak areas: right click and normalize to > noneAll raw data files were imported as single injections.Created export format for report titled "Oyster report". All 4 treatments are exported as separate csv files (in folder Skyline output 121012). InExcel, created worksheet of protein name, peptide sequence, sample name, total area, and cvtotalarea. Removed redundant entries. Creatednew column next to total area called prot-pep and concatenated the protein name and peptide sequence. Then selected the prot-pep andtotalarea columns and made a pivot table with the prot-pep name as the row labels and the total area as the sum values (make sure to selectsum!). This gives a table with the total sum of the peptide peak areas for each peptide (i.e. expression). Made another pivot table except withthe average of the total area for each peptide.There were redundancies in the original output file (some of the peptides had multiple peak areas for a sample), so re-exported the file with thecolumns: precursors charge, precursors isotope label type, precursors modified sequence. New file is called Skyline high pCO2 additions.csv.Also exported results for high pCO2 with mechanical stress.The redundancy is caused by different precursor charges (2 vs 3). I'm not sure how to deal with this yet...
December 10, 2012Secondary Stress: ProteomicsDid ANOSIM on protein expression visualized in NMDS 12/7/12. Created csv file with 3 columns describing the 16 oysters (oyster names infirst column). One column had just the pCO2 treatment designators, one column had just MS, and one had the combination of the 2 stresses.ANOSIM was performed 3 separate times using the 3 columns as grouping variables for protein expression. For each analysis p>0.05, soprotein expression did not explain differences between groups in a statistically significant way.
Repeat of NMDS and ANOSIM on protein expression data except proteins will be grouped functionally (by GO and GO Slim terms) and speccounts will be summed within functional groups. 2 files were made in Galaxy: one with proteins annotated to GO and one with annotations toGO Slim.
Divided up the analyses for GO and GO Slim based on GO type (component, function, process). Only kept annotations that had an e-value forthe blastx of less than or equal to 1E-5. Removed redundant protein-GO combinations. The input file for R is structured with oyster number(n=16) as row names, GO terms as column headers, and individual cells containing the total spec counts for each oyster in that GO category.There were 219 unique GO terms for biological processes that contributed to the NMDS.NMDS with GO term loadings: https://www.evernote.com/shard/s242/sh/50166277-b274-4ae5-a89b-00ec1803fed0/5359bc7c29c75f6446ae9c5d94256d26http://eagle.fish.washington.edu/oyster/GO%20NMDS%20with%20loadings.pdf
164
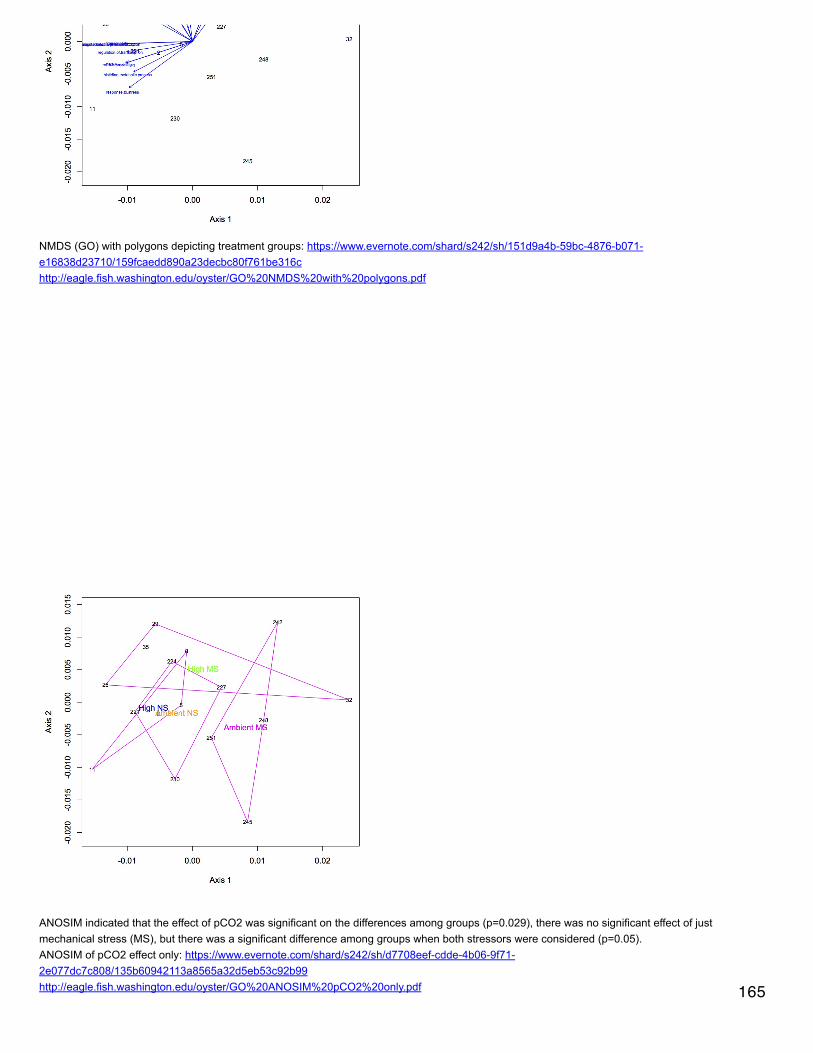
NMDS (GO) with polygons depicting treatment groups: https://www.evernote.com/shard/s242/sh/151d9a4b-59bc-4876-b071-e16838d23710/159fcaedd890a23decbc80f761be316chttp://eagle.fish.washington.edu/oyster/GO%20NMDS%20with%20polygons.pdf
ANOSIM indicated that the effect of pCO2 was significant on the differences among groups (p=0.029), there was no significant effect of justmechanical stress (MS), but there was a significant difference among groups when both stressors were considered (p=0.05).ANOSIM of pCO2 effect only: https://www.evernote.com/shard/s242/sh/d7708eef-cdde-4b06-9f71-2e077dc7c808/135b60942113a8565a32d5eb53c92b99http://eagle.fish.washington.edu/oyster/GO%20ANOSIM%20pCO2%20only.pdf 165
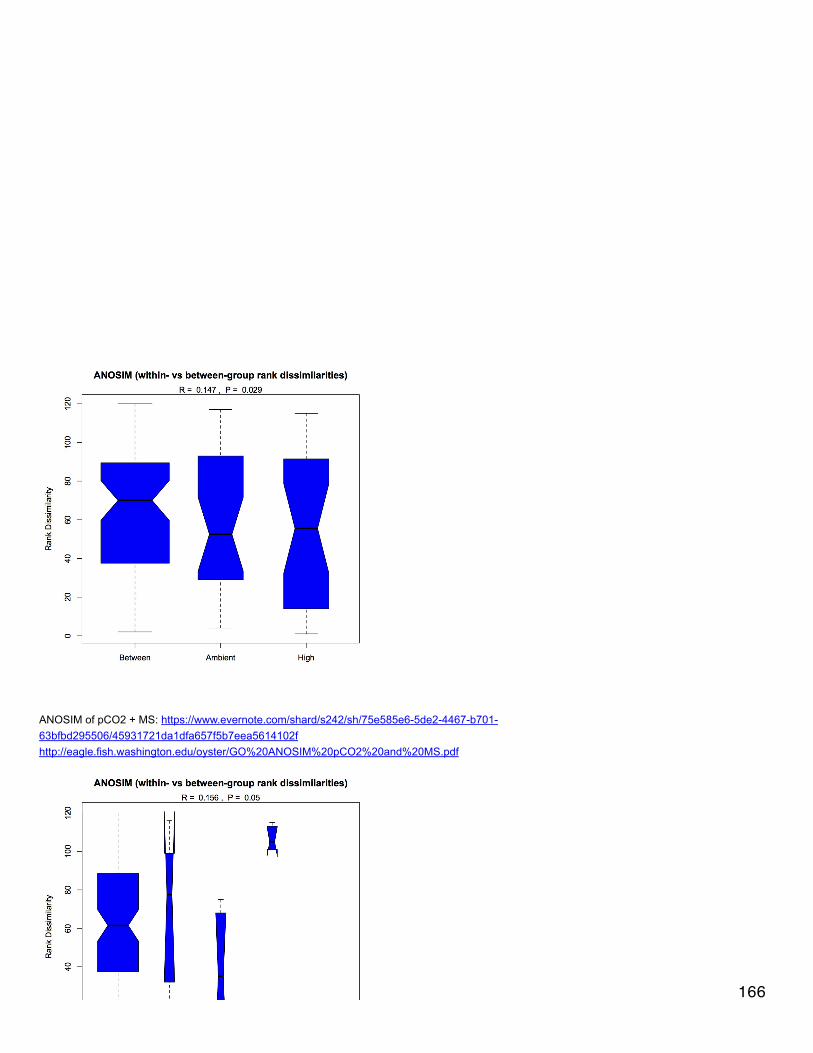
ANOSIM of pCO2 + MS: https://www.evernote.com/shard/s242/sh/75e585e6-5de2-4467-b701-63bfbd295506/45931721da1dfa657f5b7eea5614102fhttp://eagle.fish.washington.edu/oyster/GO%20ANOSIM%20pCO2%20and%20MS.pdf
166

There are 98 individual GO terms corresponding to cellular components used in the multivariate analysis. After ANOSIM, there is no significantdifference in protein express (for cellular components) among treatment groups.NMDS with GO term loadings: https://www.evernote.com/shard/s242/sh/15800bfb-bd93-434d-815d-4b04ffb04f7b/f96eba07f7a7b54e18b803b4d711f94fhttp://eagle.fish.washington.edu/oyster/GO%20components%20NMDS%20with%20loadings.pdf
NMDS with polygons: https://www.evernote.com/shard/s242/sh/8eaffd1c-f368-4d9d-985b-29f9e39f6736/9b62e0d175f214144db4135a4111541ahttp://eagle.fish.washington.edu/oyster/GO%20components%20NMDS%20with%20polygons.pdf
167
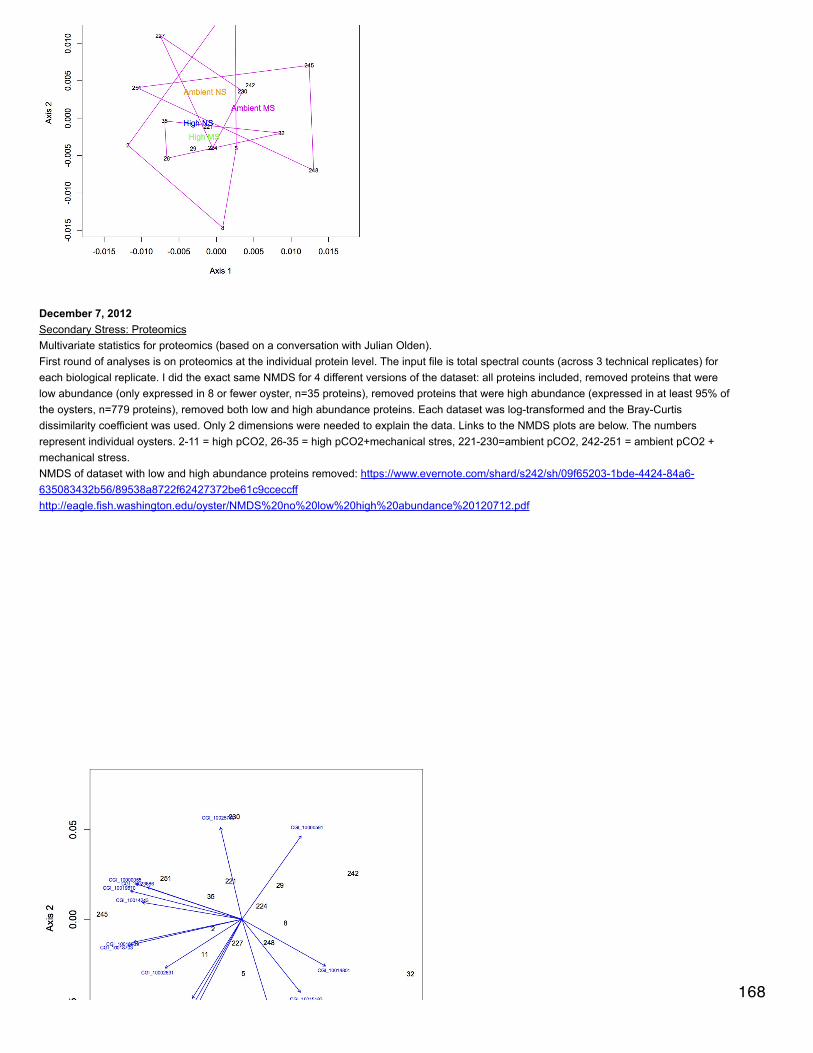
December 7, 2012Secondary Stress: ProteomicsMultivariate statistics for proteomics (based on a conversation with Julian Olden).First round of analyses is on proteomics at the individual protein level. The input file is total spectral counts (across 3 technical replicates) foreach biological replicate. I did the exact same NMDS for 4 different versions of the dataset: all proteins included, removed proteins that werelow abundance (only expressed in 8 or fewer oyster, n=35 proteins), removed proteins that were high abundance (expressed in at least 95% ofthe oysters, n=779 proteins), removed both low and high abundance proteins. Each dataset was log-transformed and the Bray-Curtisdissimilarity coefficient was used. Only 2 dimensions were needed to explain the data. Links to the NMDS plots are below. The numbersrepresent individual oysters. 2-11 = high pCO2, 26-35 = high pCO2+mechanical stres, 221-230=ambient pCO2, 242-251 = ambient pCO2 +mechanical stress.NMDS of dataset with low and high abundance proteins removed: https://www.evernote.com/shard/s242/sh/09f65203-1bde-4424-84a6-635083432b56/89538a8722f62427372be61c9cceccffhttp://eagle.fish.washington.edu/oyster/NMDS%20no%20low%20high%20abundance%20120712.pdf
168

low abundance removed: https://www.evernote.com/shard/s242/sh/cae42bdb-14a9-4e1a-8fa4-e1475a8f1fad/bd876271d6ad157e9380ef200f9f9606http://eagle.fish.washington.edu/oyster/NMDS%20no%20low%20abundance%20120712.pdf
high abundance removed: https://www.evernote.com/shard/s242/sh/b32c814b-4041-47d9-a7ee-d26622fd26dd/0ac4a5868af643dedcf73183e19cf037http://eagle.fish.washington.edu/oyster/NMDS%20no%20high%20abundance%20120712.pdf 169
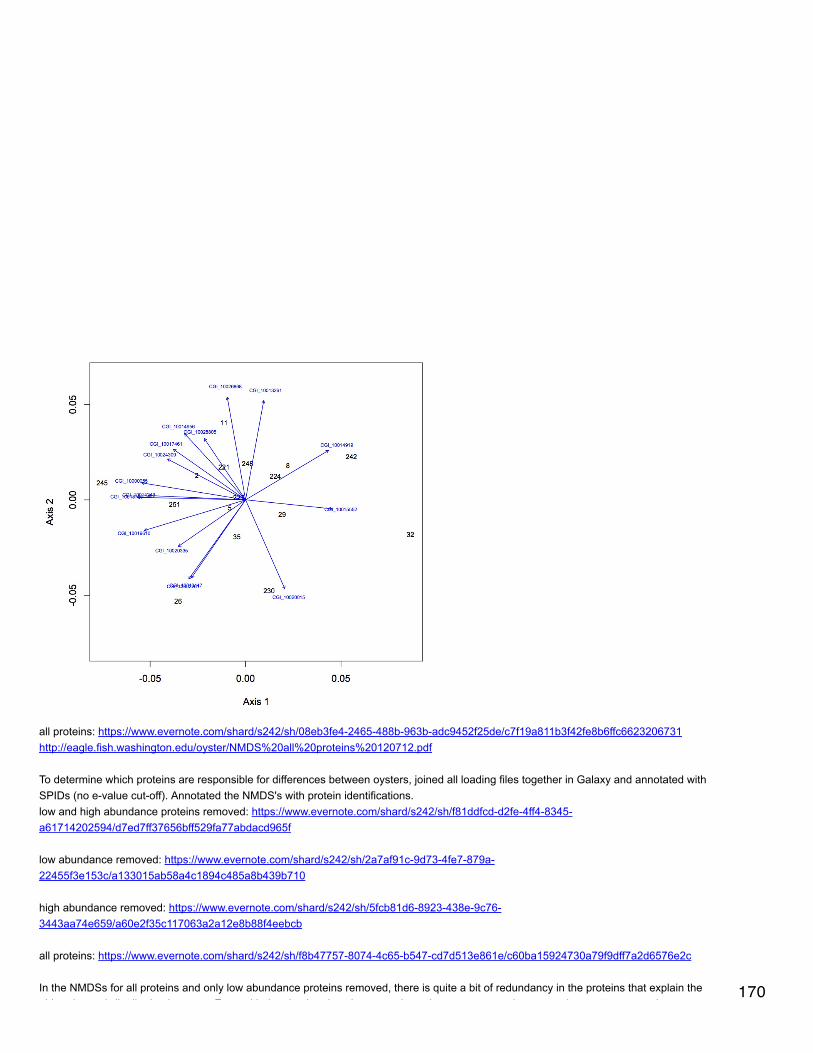
all proteins: https://www.evernote.com/shard/s242/sh/08eb3fe4-2465-488b-963b-adc9452f25de/c7f19a811b3f42fe8b6ffc6623206731http://eagle.fish.washington.edu/oyster/NMDS%20all%20proteins%20120712.pdf
To determine which proteins are responsible for differences between oysters, joined all loading files together in Galaxy and annotated withSPIDs (no e-value cut-off). Annotated the NMDS's with protein identifications.low and high abundance proteins removed: https://www.evernote.com/shard/s242/sh/f81ddfcd-d2fe-4ff4-8345-a61714202594/d7ed7ff37656bff529fa77abdacd965f
low abundance removed: https://www.evernote.com/shard/s242/sh/2a7af91c-9d73-4fe7-879a-22455f3e153c/a133015ab58a4c1894c485a8b439b710
high abundance removed: https://www.evernote.com/shard/s242/sh/5fcb81d6-8923-438e-9c76-3443aa74e659/a60e2f35c117063a2a12e8b88f4eebcb
all proteins: https://www.evernote.com/shard/s242/sh/f8b47757-8074-4c65-b547-cd7d513e861e/c60ba15924730a79f9dff7a2d6576e2c
In the NMDSs for all proteins and only low abundance proteins removed, there is quite a bit of redundancy in the proteins that explain theobject (oyster) distribution in space. Even with the simpler plots, however, there does not seem to be a very clear pattern emerging.
170
object (oyster) distribution in space. Even with the simpler plots, however, there does not seem to be a very clear pattern emerging.
December 6, 2012Secondary Stress: ProteomicsJoined all protein prophet files together and then summed across technical replicates so that each biological replicated is represented by one
column. Kept only the proteins that had at least 10 spectral counts across biological replicates. Did 2-tailed, type 2 t-tests in excel to identifyproteins of interest for the following treatment groups: effect of mechanical stress in high pCO2 only, effect of mechanical stress in ambientonly, effect of mechanical stress over both pCO2 groups, effect of pCO2 over all 16 oysters. Annotated the proteins with SPIDs anddescriptions in Galaxy.70 proteins were differentially expressed in the oysters exposed to mechanical stress (MS) at high pCO2. Some potential proteins of interestinclude hsp90, hsp70, multidrug resistance protein.60 proteins were differentially expressed in the oysters exposed to MS at ambient pCO2. Some of these were the same as those differentiallyexpressed at high pCO2, but they were the minority. Some differentially expressed proteins were Toll-interacting protein, cytochrome c oxidase,hsp7067 proteins were differentially expressed in response to MS across pCO2 treatments. Most of these were differentially expressed in at leastone pCO2 treatment.67 proteins were differentially expressed in response to pCO2 and most of these were not differentially expressed in response to MS. Theseproteins included stress-induced phosphoprotein 1, v-type proton ATPase, hsp105, cathepsin L.These combine results produce 219 unique proteins that are differentially expressed due to either pCO2, mechanical stress, or a combination.These 219 proteins will be used to create a protein and peptide tree in Skyline. I will also add proteins to the list from the statistics doneyesterday on ambient vs. high pCO2 for a total of 357 proteins.Downloaded the fasta file of the v9 proteome (local) from crassostreome and uploaded into Geneious. Manually made individual sequencedocuments for the proteins of interest to export as a single fasta file (C. gigas proteins for Skyline.fasta).
December 5, 2012Secondary Stress: RNA-SeqThe output file from yesterday is uninformative because there are spaces in the contig names so for each query name it only picked up the firstword (Consensus). Reformatted the file so that contig names are Contig1, Contig2, etc. and reran the blastn on the Mac mini with the outputfile called blastn_isotigs_120512.
Secondary Stress: ProteomicsTo compare the effects of elevated pCO2 on the proteome, uploaded all replicates to Galaxy for just high pCO2 (no mechanical stress,samples Exp2.2, 5, 8, 11) and samples for just ambient pCO2 (221, 224, 227, 230). Within each treatment group, joined replicates based onprotein identification number. (High pCO2 files were accidentally uploaded into the wrong workflow - C. gigas 3' RNA-Seq.)Edited the Galaxy files so that they were just columns for total spectral counts for each replicate. Uploaded these files back into Galaxy andjoined the 2 pCO2 treatments. Created a file so that each biological replicate (n=8) had just one column which contained the sum of totalspectral counts for each protein. Analyzed this data in DESeq just to see what would happen. 56 proteins were "differentially expressed"according to DESeq, all of them downregulated (actually not expressed) at high pCO2 except for 1 protein. Annotated these proteins withSPIDs in Galaxy. Among the proteins down-regulated at high pCO2 were carbonic anhydrase (important for calcification), hsp70, complementcomponent 1Q (immune response), cytochrome c oxidase, dual oxidase (regulated production of ROS).Did a t-test of the summed total spectral counts to compare expression between the 2 pCO2 treatments (2-tailed, type 2 in Excel). 268 proteinsshowed differential expression using this method. Annotated the proteins in Galaxy. Removed proteins that had <10 spectral counts across the8 replicates. This left 168 proteins with a significant t-test p value (<0.05). Most of the same proteins identified by DESeq were shown to bedifferentially expressed by the t-test method as well, except carbonic anhydrase was just over the threshold of non-significance (p=0.057).Other proteins that were not identified with DESeq were v-type proton ATPase, Toll-interacting protein, uncharacterized oxidoreductase, MAPkinase-activated protein kinase 2, stress-induced phosphoprotein.
December 4, 2012Secondary Stress: RNA-SeqLess than 50% of the reads mapped back to the consensus isotigs for each sample (EM2A-EM2H). Of the reads that mapped back, the largemajority for each sample mapped uniquely to one isotig.Exported all 8 RNA-Seq files as csv and resaved them as tab-delimited text files with names e.g. EM2A isotig RNA-Seq.txt. Uploaded to
Galaxy. Joined all RNA-Seq files together based on contig number to make file "all isotig RNA-Seq joined". Exported to excel. Removed allisotigs that had less than 10 total reads mapped across all 8 samples - this is the file for DESeq (isotig RNA-Seq for deseq.csv).Isotig 100818 is differentially expressed.There is definitely redundancy in the isotigs (i.e. some of them map to the same transcript). I need to remove this redundancy by combiningisotigs that map to the same transcript and redo the DESeq.
Exported the consensus sequences from the de novo assembly (the isotigs). Uploaded the fastq file to Galaxy and made it into a fasta file.Saved fasta file to Eagle so that it is accessible from the Mac mini when Eagle is mounted as a server. Created database of Sigenae v8 on the
171
Saved fasta file to Eagle so that it is accessible from the Mac mini when Eagle is mounted as a server. Created database of Sigenae v8 on theMac mini by using the following in the Terminal (in the directory ncbi-blast-2.2.27+ in subfolder bin). Downloaded sigenae v8 transcriptome fromcrassostreome and made it into a database using makeblastdb. Ran blastn using the following code to blast the isotig consensus sequencesagainst the sigenae db with a evalue cut-off of 1E-5, only the top hit returned../blastn -num_threads 8 -out [output file directory and name] -db [db directory and name] -outfmt 6 -evalue 1E-5 -max_target_seqs 1 -query[directory and name for isotig contigs] -task blastnOutput file is on Eagle (http://eagle.fish.washington.edu/oyster/blastn_isotigs_120412 ).
Secondary Stress: ProteomicsEdited all of the Protein Prophet output files so that they can be uploaded into Galaxy.
December 3, 2012Secondary Stress: ProteomicsI have been uploading raw files into Skyline for analysis. Files were uploading without a problem until I tried to upload 101B_35 (see 11/30/12).I tried a few other files and get the same error. to make sure that it is a Skyline problem and not a file corruption problem, I created a newSkyline session called "test", uploaded one xml file as the library, and imported the 101B_35_01 as a results file. The file uploadedsuccessfully, so there is a problem with Skyline.Confirmed that the problem is not enough memory in the computer. With more memory I should be able to upload more files. There's also apossibility of partitioning the number of transitions and creating different documents for the different partitions (I'm not really sure what thismeans or what it would do to my analysis).
Secondary Stress: RNA-SeqSR has done some work with the 3'-targeted data (see his notebook, Cgigas tag-seq). The idea is to do a de novo assembly to create isotigsand then map the isotigs to the transcriptome using strict parameters.In CLC, did a de novo assembly of the reads trimmed for quality and virus sequence. Mismatch cost = 2, insertion cost = 3, deletion cost = 3,length fraction = 0.8, similarity = 0.95, vote conflict resolution, ignore non-specific matches, minimum contig length = 75. Saved in folder 'denovo 120312'.of the 9,283,995 reads, 3,741,778 assembled into contigs with an average length of 95.25 (356,400,475 bases). The total number of contigsassembled = 115,999 with an average length of 126. The number of reads making up the isotigs ranged from 2-1,222,730 (this last is contig61969). Selected all contigs and "open consensus" to create consensus sequences of the isotigs (saved in the same folder).Mapped the extracted consensus isotigs to the Sigenae v8 transcriptome. Mismatch cost = 2, insertion cost = 3, deletion cost = 3, lengthfraction = 0.5, similarity = 0.95, vote conflict resolution, ignore non-specific matches.Did the same mapping to reference except changed the similarity to 1 and to 0.8. Also mapped to the genome v9 (0.95 similarity).
Sigenae mapping, similarity = 0.95: Out of 115,999 isotigs, 42,647 mapped to Sigenae transcriptome with an average length of 129.64 (26,290references). Again, it looks like the isotigs mapped all across gene sequences (i.e. they did not fall just at the 3' end). The number of isotigsmapping to a gene ranged from 1-22.
Sigenae mapping, similarity = 0.8: Out of 115,999 contigs, 47,976 mapped to the transcriptome with an average length of 129 (27,971references). The number of isotigs mapping to a gene ranged from 1-34. Some isotigs mapped just on one end of a transcript (ES789949,DW713967), but many transcripts had isotigs mapping to multiple areas.
Sigenae mapping, similarity = 1: 28,889 isotigs mapped to the transcriptome with an average length of 128.41 (19,466 references). Thenumber of isotigs mapping to a gene ranged from 1-21. Again, it looks like most transcripts had isotigs mapping to multiple areas, not just the 3'end.
genome mapping, similarity = 0.95: 74,149 isotigs mapped to the genome with an average length of 125.53 (1,657 references).
Preparing data to do DESeq. Did RNA-Seq on all the trimmed files, mapping back to the consensus sequences from the de novo assembly.max number of mismatches = 2, min length fraction = 0.9, max number of hits for a read = 10, expression value = RPKM. Saved outputs inRNA Seq folder under de novo 120312.
November 30, 2012Secondary Stress: ProteomicsTrying to decrease the amount of time and memory it takes to import raw files into Skyline.Settings > Transition settings > full scan > retention time filtering: use only scans within 5 minutes of MS/MS IDs.. This should significantlyreduce the amount of time/memory it takes to import raw files.This change has significantly reduced the memory the computer uses to import raw files. I will need to go back and change 101B_11 and101B_32, which were imported without the chromatogram limits.
172
When I tried to import the file 101B_35_01, I got an error message: Failed to build a cache for "...Sklyine 112812.sky.", Failed to create cache"...Skyline 112812.skyd." Skyline ran out of memory.From looking at the online help forum, it seems that this message means that there is something wrong with the actual data file.
November 28, 2012Secondary Stress: ProteomicsCreated new library of pepXML files using the v9 interact files (these are filtered for high probability of peptide identification). The library iscalled "interact" and is made up of all biological and technical replicates. Made changes in peptide settings and transition settings as previouslydescribed. In Spectral library explorer, added all peptides to the peptide tree and included the peptides that did not match the filter settings.There are 25,710 peptides total. Saved the Skyline session as Skyline 112812.Imported raw data files. File > Import > Results > Add single-injection replicates in files > 101B_11_01.Settings > check Integrate allChanged peak areas settings as described 11/26/12.Imported other 2 technical replicates as additional replicates for 101B_11_01.
November 26, 2012Secondary Stress: ProteomicsAnalysis of protein expression in Skyline.Created spectral library in Sklyline using xml file from 101B_2_01 as described 11/21/12. File used was in the v9 subfolder of 20120821_OT1.Repeated the same steps to add the spectral library for 101B_2_02 except used the file from the 20120821_OT1 folder (I wanted to see ifeither spectral library would include annotations for protein IDs, neither did so I deleted this library). Created spectral libraries for 101B_2_02and 101B_2_03 using the v9 XML file.Made library for 101B_5 by adding files for all 3 technical replicates. This seemed to work, so created a library called Cg Gill and added allpepXML files to it from v9 folder. This resulted in 0 spectra being found to put in the library. Made a library called 101B with all of the pepXMLfiles from high pCO2 oysters. This library has over 112,000 spectra in it. Saved the Skyline document as Skyline 112612.
File > Import > Results > Add one new replicate: Name 101B_2_01, optimizing none.Settings: Selected (to check) "integrate all"
View > peak areas > Replicate comparison: right click in window and make sure under Normalize to "none" is checked and Show expected andShow dot products are checked.File > Import > Results > Add files to existing replicate: 101B_2_01, selected raw file for 101B_2_02. Repeated for 3rd technical replicate.
Emailed with Jimmy and the v9 subfolder contains SEQUEST results from searching the spectra against the genome database. The pepXMLfiles not in that subfolder are from searches against the translated Sigenae database. From here on out, only pepXML files in the v9 subfolderwill be used for analyses.
November 21, 2012Secondary Stress: ProteomicsAnalysis of protein expression in Skyline.Settings > Peptide settings > Digestion: enzyme = trypsin [KR/P], max missed cleavages = 2, background proteome = none.Peptide settings > Modifications: Carbamidomethyl cysteine and Oxidation (M). Check Variable box.Peptide settings > Library > Build: name = 101B_11_01, check Keep redundant library, cut-off score = 0.95, lab authority =roberts.fish.washington.edu. Next > Add files: Add the orbitrap mzXML file.Peptide settings > Library: check 101B_11_01, Pick peptides matching = Library.individual libraries for each replicate need to be built one at a time.
Settings > Transition settings > Filter: Precursor charges = 2,3,4, Ion charges = 1,2,3, ion types = p, check auto select all matching transitions.Transition settings > Library: uncheck if a library spectrum is available pick its most intense ions.Transition settings > Full-scan: isotope peaks included = count, precursor mass analyzer = orbitrap, peaks = 3, resolving power = 60,000 at400
In spectral library explorer, clicked Add all to add all peptides (357 peptides did not match the current filter settings, chose to include them).
Repeated above steps for 101B_11_02 library.
November 20, 2012**Secondary Stress: RNA-SeqRan experiment in clc on the RNA-Seq (transcriptome) to compare expression between the 2 pCO2 levels. Filtered the data so that only genesremained that showed at least 2-fold difference between the two treatments (~24,000 genes, compared to original 82,000). Exported this file asa .csv. Added column to file that compares expression values using a t-test. Uploaded file to Galaxy and joined with gene annotations of theSigenae IDs, GO, and GO Slim. Looked through genes that had a p-value (from t test) of less than 0.05 and highlighted genes of interest in 173
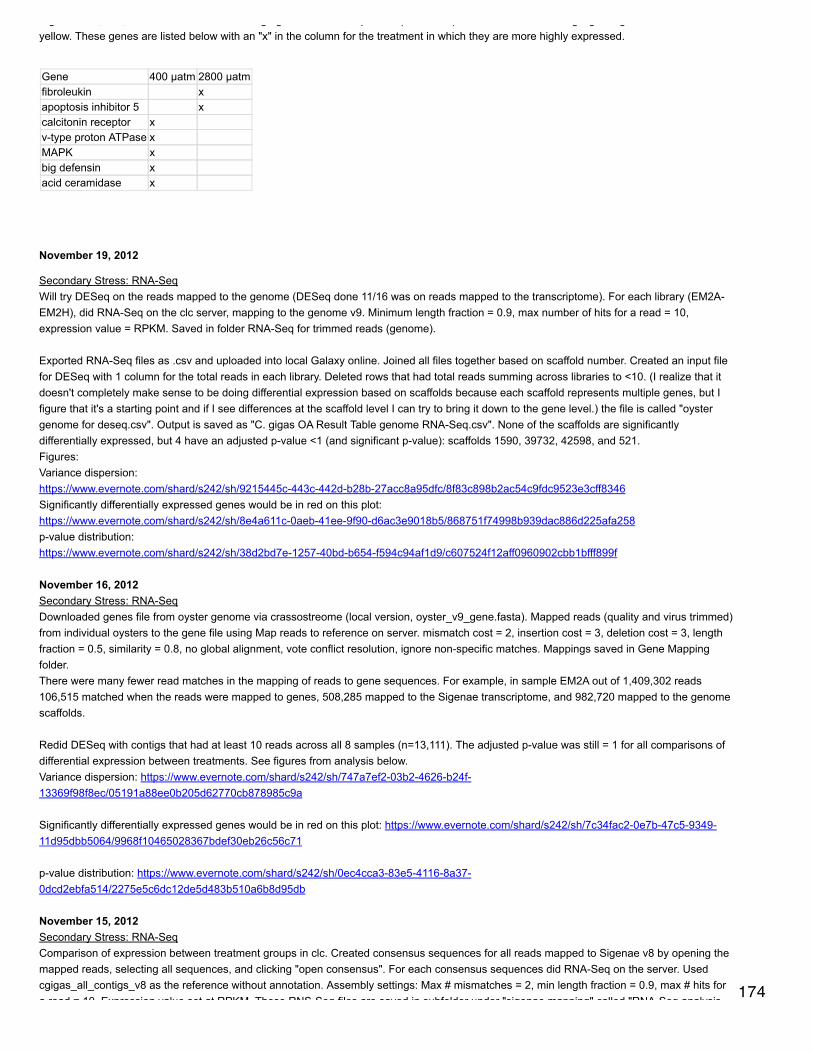
Sigenae IDs, GO, and GO Slim. Looked through genes that had a p-value (from t test) of less than 0.05 and highlighted genes of interest inyellow. These genes are listed below with an "x" in the column for the treatment in which they are more highly expressed.
Gene 400 µatm 2800 µatmfibroleukin xapoptosis inhibitor 5 xcalcitonin receptor xv-type proton ATPase xMAPK xbig defensin xacid ceramidase x
November 19, 2012
Secondary Stress: RNA-SeqWill try DESeq on the reads mapped to the genome (DESeq done 11/16 was on reads mapped to the transcriptome). For each library (EM2A-EM2H), did RNA-Seq on the clc server, mapping to the genome v9. Minimum length fraction = 0.9, max number of hits for a read = 10,expression value = RPKM. Saved in folder RNA-Seq for trimmed reads (genome).
Exported RNA-Seq files as .csv and uploaded into local Galaxy online. Joined all files together based on scaffold number. Created an input filefor DESeq with 1 column for the total reads in each library. Deleted rows that had total reads summing across libraries to <10. (I realize that itdoesn't completely make sense to be doing differential expression based on scaffolds because each scaffold represents multiple genes, but Ifigure that it's a starting point and if I see differences at the scaffold level I can try to bring it down to the gene level.) the file is called "oystergenome for deseq.csv". Output is saved as "C. gigas OA Result Table genome RNA-Seq.csv". None of the scaffolds are significantlydifferentially expressed, but 4 have an adjusted p-value <1 (and significant p-value): scaffolds 1590, 39732, 42598, and 521.Figures:Variance dispersion:https://www.evernote.com/shard/s242/sh/9215445c-443c-442d-b28b-27acc8a95dfc/8f83c898b2ac54c9fdc9523e3cff8346Significantly differentially expressed genes would be in red on this plot:https://www.evernote.com/shard/s242/sh/8e4a611c-0aeb-41ee-9f90-d6ac3e9018b5/868751f74998b939dac886d225afa258p-value distribution:https://www.evernote.com/shard/s242/sh/38d2bd7e-1257-40bd-b654-f594c94af1d9/c607524f12aff0960902cbb1bfff899f
November 16, 2012Secondary Stress: RNA-SeqDownloaded genes file from oyster genome via crassostreome (local version, oyster_v9_gene.fasta). Mapped reads (quality and virus trimmed)from individual oysters to the gene file using Map reads to reference on server. mismatch cost = 2, insertion cost = 3, deletion cost = 3, lengthfraction = 0.5, similarity = 0.8, no global alignment, vote conflict resolution, ignore non-specific matches. Mappings saved in Gene Mappingfolder.There were many fewer read matches in the mapping of reads to gene sequences. For example, in sample EM2A out of 1,409,302 reads106,515 matched when the reads were mapped to genes, 508,285 mapped to the Sigenae transcriptome, and 982,720 mapped to the genomescaffolds.
Redid DESeq with contigs that had at least 10 reads across all 8 samples (n=13,111). The adjusted p-value was still = 1 for all comparisons ofdifferential expression between treatments. See figures from analysis below.Variance dispersion: https://www.evernote.com/shard/s242/sh/747a7ef2-03b2-4626-b24f-13369f98f8ec/05191a88ee0b205d62770cb878985c9a
Significantly differentially expressed genes would be in red on this plot: https://www.evernote.com/shard/s242/sh/7c34fac2-0e7b-47c5-9349-11d95dbb5064/9968f10465028367bdef30eb26c56c71
p-value distribution: https://www.evernote.com/shard/s242/sh/0ec4cca3-83e5-4116-8a37-0dcd2ebfa514/2275e5c6dc12de5d483b510a6b8d95db
November 15, 2012Secondary Stress: RNA-SeqComparison of expression between treatment groups in clc. Created consensus sequences for all reads mapped to Sigenae v8 by opening themapped reads, selecting all sequences, and clicking "open consensus". For each consensus sequences did RNA-Seq on the server. Usedcgigas_all_contigs_v8 as the reference without annotation. Assembly settings: Max # mismatches = 2, min length fraction = 0.9, max # hits fora read = 10. Expression value set at RPKM. These RNS-Seq files are saved in subfolder under "sigenae mapping" called "RNA-Seq analysis
174
a read = 10. Expression value set at RPKM. These RNS-Seq files are saved in subfolder under "sigenae mapping" called "RNA-Seq analysis(consensus seqs)".Did RNA-Seq for the trimmed reads (quality and for virus). Same parameters as above. Results saved in folder "RNA-Seq for trimmed reads".
Exported these files as tab-delimited text.
DESeq wasn't loading because I needed to update my R package. R was updated and I was able to load DESeq. Following the user manual(http://bioconductor.org/packages/devel/bioc/vignettes/DESeq/inst/doc/DESeq.pdf ), I am putting together an input file and starting myanalysis with the files created from the RNA-Seq of the trimmed reads (see above). The expression values in the input file need to be rawcounts of sequence reads (total reads in clc terminology). The rows of the file should be individual transcripts and each column should be theexpression values for a sample. Made this file in Galaxy by joining all of the RNA-Seq files together. Removed all rows that had 0 expressionacross all samples, formatted cells as "general" (otherwise R does not recognize cell contents as numbers), and saved as csv file "oyster fordeseq".
November 14, 2012Secondary Stress: RNA-SeqAdded sequence for virus PhiX174 as adapter to be trimmed since it is possibly part of the sequence information. Eli sent a file with its genomesequence. In clc: Edit > Preferences > Data. At the bottom of the adapter trimming table, click "Add row". Adapter is called Illumina phiX,entered entire genome as sequence, strand=plus, alignment score = 2,3,10,4, action= remove adapter. Eli also said that "GGG" or "GGGG"may be present at the 5' end of some of the sequences, but I'm not sure how to tell clc to only trim "G" repeats at the 5' end and Eli said itshouldn't be a problem. Saved these trimmed reads in the folder PhiX trimmed. ~100% of the original reads were still present after trimming,meaning that there was not much virus sequence in the reads.
Downloaded cgigas_all_contigs_v8.fa to use as reference for assembly of trimmed reads (Sigenae transcriptome). Mapped the doubly trimmedreads to the transcriptome (individually) and saved in Sigenae mapping folder: mismatch cost = 2, insertion cost = 3, deletion cost = 3, lengthfraction = 0.5, similarity = 0.8, no global alignment, vote conflict resolution, ignore non-specific matches.
Exported mapping file (.sam) for EM2B to Eagle. Uploaded to local Galaxy on the web and named EM2B Sigenae. Visualized in Tracksterusing Sigenae contigs v8. There was an error in visualization, so redid the same steps on the public Galaxy website.
Exploring IGV: downloaded IGV from website. Loaded C. gigas Sigenae v8 as a "genome" in IGV by selecting Load genome from URL fromthe File menu. Downloaded EM2B file mapped to Sigenae and created index file in igv: File > run igvtools, command = index, browse for fileand hit run. Index file is saved in same folder as .sam file. Loaded .sam file into IGV by going File > Load File. Contigs can be viewedindividually with mapped reads. The multicolored bar at the bottom of the screen is the contig sequence, the gray bars are the mapped reads.The colors in the gray bars are SNPs between the reads and the contig.See IGV view here:https://www.evernote.com/shard/s242/sh/05aa2bb4-441b-4655-9976-3e479c98fb91/0076c89fc20d887a4b05fc94f11e106c
Decided to go ahead and try to do RNA-Seq to see what happens. I would like to try this in the R package DESeq. I tried to install DESeq but itseems that the website is currently down (I found on a discussion board that this is likely to happen). I'll try to install it again tomorrow.
November 13, 2012Secondary Stress: RNA-SeqThe local Galaxy mapping started on the Mac mini on Nov 7 is still running.Downloaded and unzipped files on the PC in the lab to start workflow in clc. Logged into clc server and created directory: C. gigas OA RNA-Seq. Imported sequence files (EM2A-EM2H) into this directory by importing high throughput sequencing files and choosing Illumina as the datatype. Also imported oyster.v9_90 genome file to use as reference (this was imported just through the normal file import).Mapped EM2A to oyster genome v9. Parameters were: mismatch cost =2, insertion cost = 3, deletion cost = 3, length fraction = 0.5, similarity =0.8, no global alignment, vote conflict resolution, random non-specific matches. Saved mapping in sub-folder EM2A (this mapping was donelocally). Queued EM2B-EM2H to map to the reference with the same parameters but on the server.Exported mapped reads at .sam files and uploaded to Galaxy. In Galaxy, .sam files can be converted to interval files and then to BED files. (Wediscovered that sam files have the same depth info as bed files so the conversion may not be necessary.) Both sam and bed files can be
visualized in Trackster (saved visualization as EM2A SAM1). Saved oyster.v9_90 as a reference genome in Galaxy. Viewed sam and bed fileswith genome as reference. Added oyster v9 annotations for CDS (exons) and mRNA (gene sequence, probably does not include UTR) astracks in the visualization. A lot of the reads seem to fall into improbably areas on the gene. We will try mapping cleaner reads to thetranscriptome (from Sigenae).Example of visualization:https://www.evernote.com/shard/s242/sh/e5261617-2ed7-43c9-a7a7-79e72db5d705/0a8e9fc59b201a0a8f26bc5ddd60c6ef
Quality trimmed the reads in clc: trim using quality scores, limit = 0.05, trim ambiguos nucleotides, maximum number of ambiguities = 2,discard reads less than 50. About 70-75% of the reads for each sample were retained after trimming (see below). Mapped these trimmed readsto the genome. Next steps: remove barcodes and other excess sequences. 175
to the genome. Next steps: remove barcodes and other excess sequences.Trim report:https://www.evernote.com/shard/s242/sh/4bbfb2be-3afa-478a-aa89-fac20a77e145/5704e8d29c98a658396bd609fce14c6ehttps://www.evernote.com/shard/s242/sh/eeb61897-f3c8-462e-9927-214170636888/9ade273133af8f8ab5db524995dae33d
November 7, 2012Secondary Stress: RNA-SeqData from NGS run by Eli Meyer is on Eagle (http://eagle.fish.washington.edu/oyster/gigas_rnaseq.tar.gz ). The sample IDs are explained inthe table below. Began analysis of sequence data on local Galaxy on the Mac Mini. Created an admin account on the mini and opened terminalto launch Galaxy. In terminal, entered the following code:cd /Userscd Sharedcd Appscd galaxy-dist./run/.shOpened a web browser and entered address: localhost:8080Username for the local Galaxy is my gmail address.Saved unzipped fastq files in Documents on Mac mini and also on my laptop. Uploaded the first file (EM2A.fastq) to Galaxy on the mini. This istaking a really long time, so decided to start running on Geneious on the mini.
Geneious:Downloaded C. gigas genome from crassostreome (oyster.v9_90, fasta file) and uploaded into Geneious. Also uploaded EM2A. Mapped EM2Asequenced to genome reference. Sensitivity = medium-low sensitivity/fast, fine tuning = none (fast/read mapping), no trimming sequences,saved in sub-folder, and saved contigs...Oops, not enough memory to perform the assembly.
Local Galaxy:Uploaded oyster.v9_90 to galaxy as well. Named history "C. gigas 3' RNA-Seq". Made oyster genome into a reference sequence: under"Visualization" at the top of the page, chose new visualization, and then clicked add a custom build. Named the reference "C. gigas genomev9". Uploaded other fastq data files into history. Under tool heading "NGS: QC & manipulation" used the FASTQ to FASTA converter to makeall files FASTA.Mapped EM2B to the reference genome using the NGS Mapping tool Lastz (for mapping short reads to a reference). Output = tabular,commonly used settings, mapping mode =Illumina 95% identity, ept min and max reporting and coverage reporting the same (0, 100, 0).
Meyer ID BC # ETS ID pCO2EM2A BC1 Exp2.1 2800EM2B BC51 Exp2.4 28002C 52 7 28002D 53 10 28002E 57 217 4002F 58 220 4002G 54 235 4002H 55 238 400
October 31, 2012Bioinformatics: Pinto Ab NGSOly SRA files were successfully transferred the second time. The correct accession number for the Oly and Pinto RNA-Seq data isSRA057107.
October 30, 2012Proteomics: Analysis for ManuscriptCompared protein identifications across technical replicates. Created csv file tech reps for plotting which has a column for each technicalreplicates across all 4 biological replicates. Each cell with a number in it for a technical replicate means that protein was identified in thatparticular injection (proteins are listed in the far lefthand column). The matches across replicates were summed in the far righthand column andall columns were sorted based on number of matches. Graphed in R, color coding for biological rep(https://www.evernote.com/shard/s242/sh/47cb9fd2-873e-4ac9-a238-61220a48e04f/548adcdfa1cd42c0ca3963457e4062b9 ).
Plotted average spectral counts (proxy for protein expression) versus the number of times that protein was identified (or number of matches).The csv file is called spec counts tech reps (https://www.evernote.com/shard/s242/sh/092028b9-8e41-40fd-aeaa-701e31af3c77/324139ae3e2e0e5673fa76375a88590a ). Did the same plot but using total spectral counts instead of average and got sameresult (not shown).
October 29, 2012176
October 29, 2012Proteomics: Analysis for ManuscriptThese analyses were done only for the Orbitrap data.Used Venny to create a Venn diagram comparing proteins expressed across biological replicates. From excel file ambient gill proteome joinedto all replicates, got the list of protein IDs for expressed proteins for each oyster. For every protein that was expressed per oyster, copied thelist into Venny.
Compared the 10 proteins that are expressed the most highly across biological replicates. From average spectral counts across technicalreplicates, determined which proteins were in the top 10 for each oyster. Protein annotations are provided by SPIDs. No oyster had a uniqueprotein in this category. 8 proteins were included in the top 10 across all oysters.
Bioinformatics: Pinto Ab NGSGot an email informing me that the Oly SRA files uploaded to NCBI were corrupted (original upload done August 10, 2012). Downloaded thefastq files again (http://eagle.fish.washington.edu/whale/index.php?dir=&sort=date&order=desc ). Files were renamed Olurida_R1 and Olurida_R2. In SRAsubmission, flow cell and lane numbers were kept the same (since it is the same data). Generated new checksums using MD5 software.Transferred files using FileZilla 2.
October 4, 2012Secondary Stress: Fatty acidsThrough conversations with Louise Copeman (NOAA, Newport, OR) and Michael Brett (UW) I've been learning a little bit about fatty acidanalysis and what it can tell me about oysters and ocean acidification. Louise suggested that I investigate lipid class analysis as well as/insteadof FA because it gives a good condition index (look at total lipid, storage vs. membrane lipids). She is set up to do this at OSU. If I did theextractions myself, lipid class analysis would be ~$80/sample and FAs would be $40/sample.Michael Brett thinks that FAs can still give me some very useful and interesting information. FAs give insight into nutritional physiology and the
quality of nutrition that an animal is getting. Lipid class tells you more the quantity of lipids being stored and which lipids are being stored.(During a FA analysis lipids are methylated so you don't know where they came from.) Lipid class analysis would should where the FAs end upand could answer the question: does OA affect the oyster's ability to withstand periods of low food? If I were to do FA with the Brett lab and dothe work myself, it would cost $15/sample.
October 2, 2012Bioinformatics: Pinto Ab NGSSteven ran blast comparisons of both transcriptomes vs. Lottia gigantea proteins yesterday. In OrthoDB, got conserved proteins across allmetazoans with a single copy in Lottia. SR did a tblastn of O. lurida and H. kamtschatkana contigs against this db of protein sequences (30Lottia sequences total). O. lurida had 28 matches with an e-value less than 1E-5 and H. kamtschatkana had 2 matches.For each contig that matched to a L. gigantea protein, translated in all 6 frames using standard sequence translation (Geneious). Aligned all 6translations with the protein sequence: Geneious alignment, cost matrix = BLOSUM 6, gap open penalty = 12, gap extension penalty = 3,global alignment with free end gaps, 2 refinement iterations. From the alignment, determined the correct translation. Calculated the % of theprotein that is covered by each sequenced contig.Calculated # of SNPs per contig. SR had a table of all SNPs (http://aquacul4.fish.washington.edu/~steven/armina/OlyOSNPsAnnotated.txtand http://aquacul4.fish.washington.edu/~steven/armina/HkamSNPsAnnotated.txt ). Downloaded table, put contig names in a column andmade pivot table of column of contig names. Since each snp is a unique entry, a contig with multiple SNPs is entered multiple times. Took theaverage of the number of occurrences of/SNPs in each contig. for O. lurida this is 3.04, for H. kam this is 1.95.
October 1, 2012Bioinformatics: Pinto Ab NGSComputed contig lengths for assembles of Pinto and Oly transcriptomes to create histograms. Imported assembled contig FASTAs into Galaxyand used tool "compute sequence length" under FASTA manipulation. Kept all title characters. Exported contig length files (one column =contig name, second column = each contigs length) and made histograms in R.
Proteomics: Analysis for ManuscriptUploaded protein prophet files to server for archiving. Server address is afp://128.95.149.204. Mount "web" to archive data. Created folder"oyster" and subfolder "proteomics" and copied all data into proteomics. Can be found here: http://128.95.149.204/oyster/index.php?dir=proteomics%2F
September 28, 2012Proteomics: Analysis for manuscriptDid analysis of technical replicates to visualize variability with samples. For each oyster (103 B 221, 224, 227, 230), averaged the total numberof independent spectra into a column called "average spectra". Created a csv file for R with protein name, total independent spectra for eachtechnical replicate, and average spectra. Sorted all columns by average spectra, larges to smallest. Plotted each column of total independentspectra: replicate 1 = black, rep 2 = blue, rep 3 = green. Below is the plot for 103B230.
177

spectra: replicate 1 = black, rep 2 = blue, rep 3 = green. Below is the plot for 103B230.
Uploaded with Skitch!
BioinformaticsDownloaded new SwissProt associations database for annotations (SwissProt IDs linked with gene descriptions/annotations). Went to EMBLwebsite and clicked on UniProtKB.
September 24, 2012Proteomics: Analysis for manuscriptDownloaded proteome from the genome sequencing webpage . SR annotated the proteome with SwissProt IDs with an e-value cut off of1E-10.Jimmy re-ran SEQUEST searches of Orbitrap (OT) and QExactive (QE) data against the new database. downloaded all files with proteinprobability of at least 0.9. Further analysis is only on proteins from 103B 221, 224, 227, and 230 (ambient, not mechanical stress). All proteinprophet files were annotated with SPIDS and joined to the proteome downloaded from the genome. 178

edit
Made file of proteome for just the samples being analyzed (proteome 2). This is a list of unique contigs representing all the proteins sequencedin the triplicate injections of the 4 samples. Proteins are included only if they have at least 4 spectral counts across samples (1,672 proteins).Using DAVID v. 6.7 did enrichment analysis of gill proteome sequenced vs. entire proteome downloaded.Also did enrichment analysis of each oyster (across replicates) vs. proteome 2 to compare inter-individual variability. For all revigo filesdownloaded, they are the tables from the Gene Ontology BP FAT.Visualized entire gill proteome by joining to GO terms, filtering out unique entries of contig-GO combinations, and putting in revigo. The numberused in revigo was number of spectral counts across oysters/replicates.
September 18, 2012Bioinformatics: Pinto Ab NGSUsed the same background and gene list files as before and uploaded to DAVID. For the contigs with 0 matches across species, downloadedthe Gene onotology enrichment files BP1, BP2, BP3, BP4, and BP5. Used BP2 to make a pie chart using number of contigs as the size of thepie wedges. This is the new orphan gene pie chart for the manuscript.Annotated files of SNPs discovered in each species (H. kamtschatkana and O. lurida) with SPID descriptions, GO and GO Slim. The files forpinto and oly can be found at the links on dropbox.Uploaded files with orphan genes for each species annotated with SPIDs and gene descriptions to Galaxy. Annotated with GO and GO Slimterms in Galaxy. Created list of non-redundant orphan contig-GO Slim terms and from that list made a pivot table and pie chart of GO Slimsthat are represented within each group of orphan genes.
September 12, 2012Secondary Stress: TranscriptomicsMailed sample for NGS to Eli Meyer. Sample numbers are listed below (n=4 each for ambient and elevated pCO2) with BC-MPX barcodenumbers in parentheses. For each sample, thawed, flicked to mix, and aliquoted 5 µl into an eppie tube so that all samples were pooled in 1tube. Mailed the tube on dry ice.Samples:Exp2.1 (1-1)Exp2.4 (51-1)Exp2.7 (52-1)Exp2.10 (53-1)Exp2.217 (57-2)Exp2.220 (58-2)Exp2.235 (54-3)Exp2.238 (55-3)
August 30, 2012Secondary Stress: ProteomicsRedid PCA using a variance-covariance matrix. Also did PCA for the proteins just involved in stress response (averaged spectral counts withintreatments) and for individual oysters (n=16) for all proteins.For the PCA of all proteins and spectral counts averaged within treatments, the following eigenvector loadings were the highest:PC1: AY256853.p.cg.8_4 (superoxide dismutase) -0.138ES789884.p.cg.8_8 (alpha tubulin) 0.249CU686207.p.cg.8_8 (myosin) -0.117CU991685.p.cg.8_6 (unknown) -0.410
PC2: BQ427067.p.cg.8_5 (actin) 0.107BQ426898.p.cg.9_7 (unknown) 0.118CU984218.p.cg.8_6 (peroxiredoxin 6) -0.151BQ426757.p.cg.8_14 (myosin) 0.144
PC3: ES789884.p.cg.8_8 (alpha tubulin) -0.101BQ426898.p.cg.9_7 (unknown) -0.175FU6OSJA01BC2WI.p.cg.8_3 (unknown) -0.152CU989410.p.cg.8_6 (unknown) -0.115FU6OSJA02I1J4K.p.cg.8_7 (60s ribosomal protein) -0.109
Enrichment analysis of protein sets that are 2- and 4-fold differentially expressed between treatments. Calculated differential expressionbetween treatments using the spectral counts averaged within treatment groups. Made protein sets for the following comparisons (separatelists for >4-fold and >2-fold expression differences): ambient pCO2 vs. high; high pCO2 vs. high mechanical stress; ambient pCO2 vs. ambientmechanical stress. For each comparison, the spectral counts for the second stressor listed were divided by the first (i.e. the question is whichproteins are up-regulated in high pCO2 and under mechanical stress within both pCO2 treatments). Uploaded this list to Galaxy and joined withblastp results to get SPIDs associated with the contig numbers. Used the SPIDs as input into DAVID's functional analysis tool and exported theGO FAT table to put into REVIGO.
179
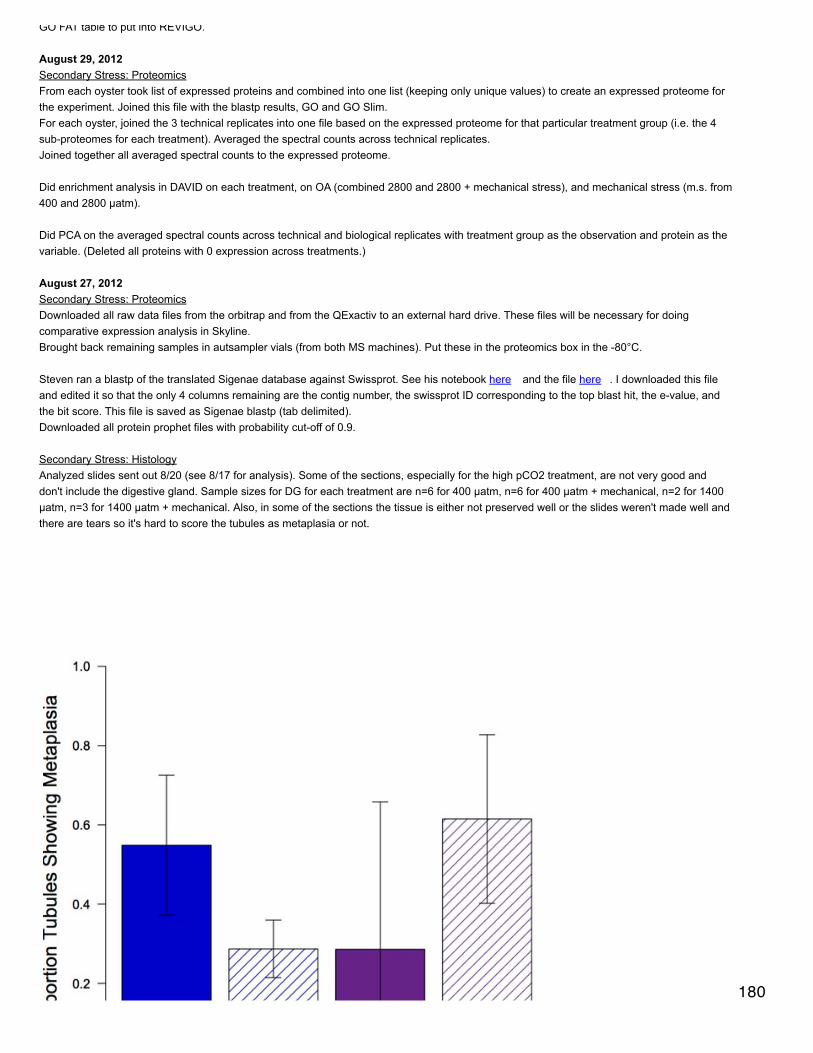
GO FAT table to put into REVIGO.
August 29, 2012Secondary Stress: ProteomicsFrom each oyster took list of expressed proteins and combined into one list (keeping only unique values) to create an expressed proteome forthe experiment. Joined this file with the blastp results, GO and GO Slim.For each oyster, joined the 3 technical replicates into one file based on the expressed proteome for that particular treatment group (i.e. the 4sub-proteomes for each treatment). Averaged the spectral counts across technical replicates.Joined together all averaged spectral counts to the expressed proteome.
Did enrichment analysis in DAVID on each treatment, on OA (combined 2800 and 2800 + mechanical stress), and mechanical stress (m.s. from400 and 2800 µatm).
Did PCA on the averaged spectral counts across technical and biological replicates with treatment group as the observation and protein as thevariable. (Deleted all proteins with 0 expression across treatments.)
August 27, 2012Secondary Stress: ProteomicsDownloaded all raw data files from the orbitrap and from the QExactiv to an external hard drive. These files will be necessary for doingcomparative expression analysis in Skyline.Brought back remaining samples in autsampler vials (from both MS machines). Put these in the proteomics box in the -80°C.
Steven ran a blastp of the translated Sigenae database against Swissprot. See his notebook here and the file here . I downloaded this fileand edited it so that the only 4 columns remaining are the contig number, the swissprot ID corresponding to the top blast hit, the e-value, andthe bit score. This file is saved as Sigenae blastp (tab delimited).Downloaded all protein prophet files with probability cut-off of 0.9.
Secondary Stress: HistologyAnalyzed slides sent out 8/20 (see 8/17 for analysis). Some of the sections, especially for the high pCO2 treatment, are not very good anddon't include the digestive gland. Sample sizes for DG for each treatment are n=6 for 400 µatm, n=6 for 400 µatm + mechanical, n=2 for 1400µatm, n=3 for 1400 µatm + mechanical. Also, in some of the sections the tissue is either not preserved well or the slides weren't made well andthere are tears so it's hard to score the tubules as metaplasia or not.
180

Uploaded with Skitch!
August 23, 2012Secondary Stress: ProteomicsAll samples have now gone through the first injection (2nd injection has started) and there was strong peptide signal for all. The 3rd standardhas run and looks good: the 2 standard peaks are still separate and the signal is clean after the high organic wash, but there is still somecarryover signal before the wash.
Overview of software Skyline for doing relative protein expression between samples (more robust than spectral counting because takes areaunder the spectral curve for comparison). Only runs on PCs. Use MS1 Full-Scan Filtering (pdf of manual). Notes: 1) use mzxml andpeptide.xml files for library, raw files are imported as the data to generate the protein expression profiles 2) in peptide settings structuralmodifications only include carbamidomethyl cysteine and methionine oxidation.
In Peptide profit, the number after an amino acid indicates that it has been modified. These modifications (circled in pink) frequently occurduring sample preparation.
Uploaded with Skitch!
In Peptide Prophet file can view the sensitivity/probability curve (just click on probability in the row of the peptide you are interested in). This isgood for supporting why a certain probability cutoff was chosen. Gives false discovery rate for each probability. Sensitivity = fraction of allcorrect assignments passing filter; error = fraction of peptide assignments passing filter that are incorrect.
Uploaded with Skitch!
In Peptide Profit file can also generate 3D image of the peptides. Green-red corresponds to peptide probability. Blue dots are peptides thatwere not identified in the database search. The x-axis is the time of the chromatography. Contamination would be seen as dark horizontal lines 181

across the plot.
Uploaded with Skitch!
Sensitivity/error can also be found in the protein profit file.
Uploaded with Skitch!
Notes on standardization of MS data (from discussions with Jimmy and Priska):-can normalize spectral counts to length of protein since longer proteins will have greater hits-can create histogram of number of spectral counts on the x-axis and proteins on the y-axis and just analyze the middle of that distribution-can normalize to housekeeping proteins - i like this one best. you can choose a few housekeeping proteins (actin, tubulin, etc.) and use thespectral counts for those proteins to create a scalar to correct spectral counts for other proteins that are potentially differentially expressed.
August 22, 2012Secondary Stress: Proteomics 182
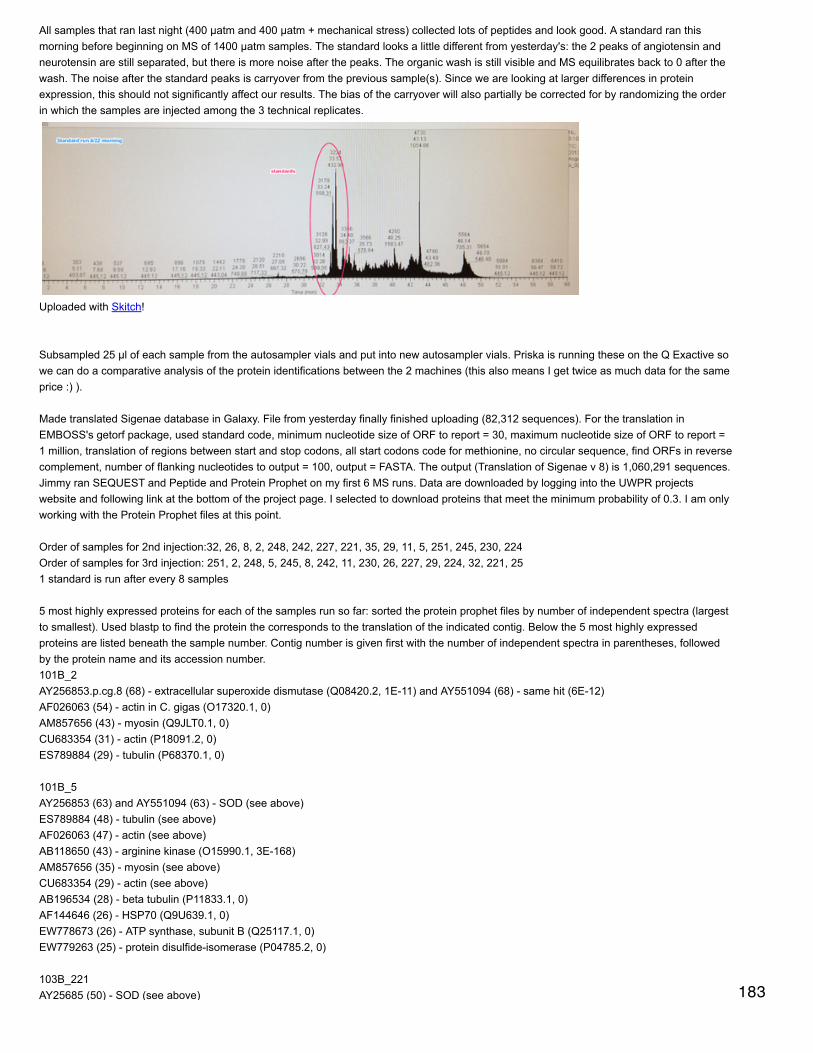
All samples that ran last night (400 µatm and 400 µatm + mechanical stress) collected lots of peptides and look good. A standard ran thismorning before beginning on MS of 1400 µatm samples. The standard looks a little different from yesterday's: the 2 peaks of angiotensin andneurotensin are still separated, but there is more noise after the peaks. The organic wash is still visible and MS equilibrates back to 0 after thewash. The noise after the standard peaks is carryover from the previous sample(s). Since we are looking at larger differences in proteinexpression, this should not significantly affect our results. The bias of the carryover will also partially be corrected for by randomizing the orderin which the samples are injected among the 3 technical replicates.
Uploaded with Skitch!
Subsampled 25 µl of each sample from the autosampler vials and put into new autosampler vials. Priska is running these on the Q Exactive sowe can do a comparative analysis of the protein identifications between the 2 machines (this also means I get twice as much data for the sameprice :) ).
Made translated Sigenae database in Galaxy. File from yesterday finally finished uploading (82,312 sequences). For the translation inEMBOSS's getorf package, used standard code, minimum nucleotide size of ORF to report = 30, maximum nucleotide size of ORF to report =1 million, translation of regions between start and stop codons, all start codons code for methionine, no circular sequence, find ORFs in reversecomplement, number of flanking nucleotides to output = 100, output = FASTA. The output (Translation of Sigenae v 8) is 1,060,291 sequences.Jimmy ran SEQUEST and Peptide and Protein Prophet on my first 6 MS runs. Data are downloaded by logging into the UWPR projectswebsite and following link at the bottom of the project page. I selected to download proteins that meet the minimum probability of 0.3. I am onlyworking with the Protein Prophet files at this point.
Order of samples for 2nd injection:32, 26, 8, 2, 248, 242, 227, 221, 35, 29, 11, 5, 251, 245, 230, 224Order of samples for 3rd injection: 251, 2, 248, 5, 245, 8, 242, 11, 230, 26, 227, 29, 224, 32, 221, 251 standard is run after every 8 samples
5 most highly expressed proteins for each of the samples run so far: sorted the protein prophet files by number of independent spectra (largestto smallest). Used blastp to find the protein the corresponds to the translation of the indicated contig. Below the 5 most highly expressedproteins are listed beneath the sample number. Contig number is given first with the number of independent spectra in parentheses, followedby the protein name and its accession number.101B_2AY256853.p.cg.8 (68) - extracellular superoxide dismutase (Q08420.2, 1E-11) and AY551094 (68) - same hit (6E-12)AF026063 (54) - actin in C. gigas (O17320.1, 0)AM857656 (43) - myosin (Q9JLT0.1, 0)CU683354 (31) - actin (P18091.2, 0)ES789884 (29) - tubulin (P68370.1, 0)
101B_5AY256853 (63) and AY551094 (63) - SOD (see above)ES789884 (48) - tubulin (see above)AF026063 (47) - actin (see above)AB118650 (43) - arginine kinase (O15990.1, 3E-168)AM857656 (35) - myosin (see above)CU683354 (29) - actin (see above)AB196534 (28) - beta tubulin (P11833.1, 0)AF144646 (26) - HSP70 (Q9U639.1, 0)EW778673 (26) - ATP synthase, subunit B (Q25117.1, 0)EW779263 (25) - protein disulfide-isomerase (P04785.2, 0)
103B_221AY25685 (50) - SOD (see above) 183
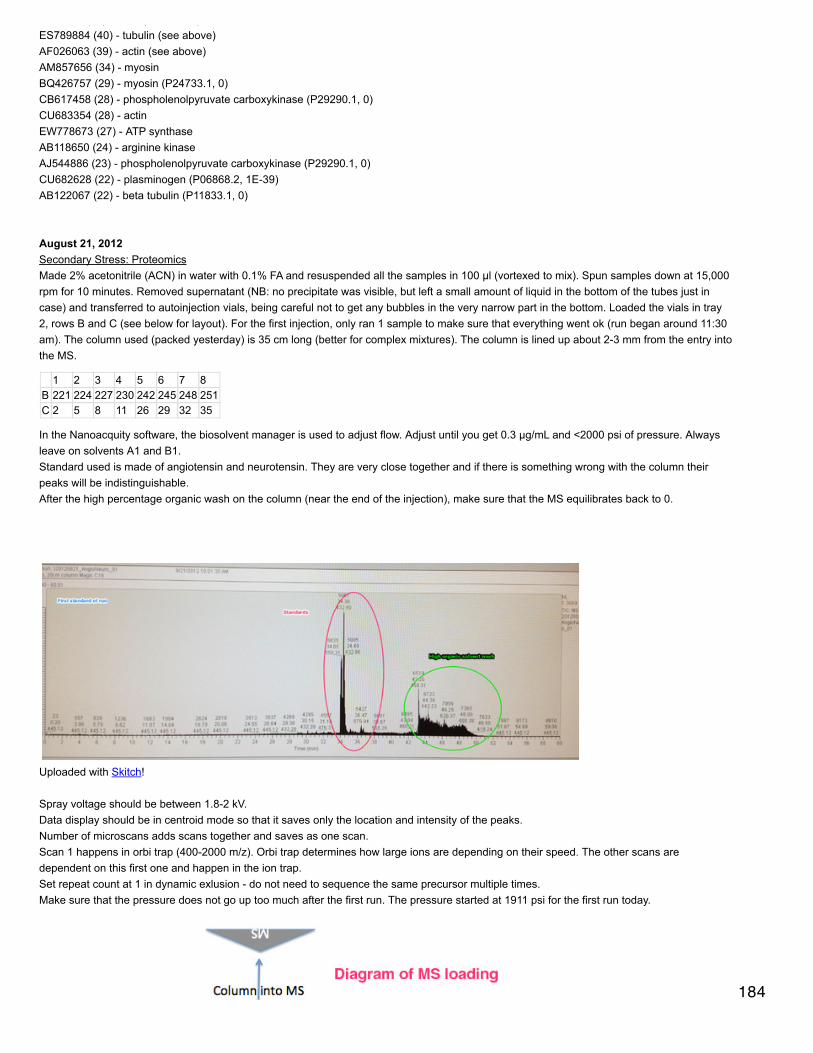
AY25685 (50) - SOD (see above)ES789884 (40) - tubulin (see above)AF026063 (39) - actin (see above)AM857656 (34) - myosinBQ426757 (29) - myosin (P24733.1, 0)CB617458 (28) - phospholenolpyruvate carboxykinase (P29290.1, 0)CU683354 (28) - actinEW778673 (27) - ATP synthaseAB118650 (24) - arginine kinaseAJ544886 (23) - phospholenolpyruvate carboxykinase (P29290.1, 0)CU682628 (22) - plasminogen (P06868.2, 1E-39)AB122067 (22) - beta tubulin (P11833.1, 0)
August 21, 2012Secondary Stress: ProteomicsMade 2% acetonitrile (ACN) in water with 0.1% FA and resuspended all the samples in 100 µl (vortexed to mix). Spun samples down at 15,000rpm for 10 minutes. Removed supernatant (NB: no precipitate was visible, but left a small amount of liquid in the bottom of the tubes just incase) and transferred to autoinjection vials, being careful not to get any bubbles in the very narrow part in the bottom. Loaded the vials in tray2, rows B and C (see below for layout). For the first injection, only ran 1 sample to make sure that everything went ok (run began around 11:30am). The column used (packed yesterday) is 35 cm long (better for complex mixtures). The column is lined up about 2-3 mm from the entry intothe MS.
1 2 3 4 5 6 7 8B 221 224 227 230 242 245 248 251C 2 5 8 11 26 29 32 35
In the Nanoacquity software, the biosolvent manager is used to adjust flow. Adjust until you get 0.3 µg/mL and <2000 psi of pressure. Alwaysleave on solvents A1 and B1.Standard used is made of angiotensin and neurotensin. They are very close together and if there is something wrong with the column theirpeaks will be indistinguishable.After the high percentage organic wash on the column (near the end of the injection), make sure that the MS equilibrates back to 0.
Uploaded with Skitch!
Spray voltage should be between 1.8-2 kV.Data display should be in centroid mode so that it saves only the location and intensity of the peaks.Number of microscans adds scans together and saves as one scan.Scan 1 happens in orbi trap (400-2000 m/z). Orbi trap determines how large ions are depending on their speed. The other scans aredependent on this first one and happen in the ion trap.Set repeat count at 1 in dynamic exlusion - do not need to sequence the same precursor multiple times.Make sure that the pressure does not go up too much after the first run. The pressure started at 1911 psi for the first run today.
184
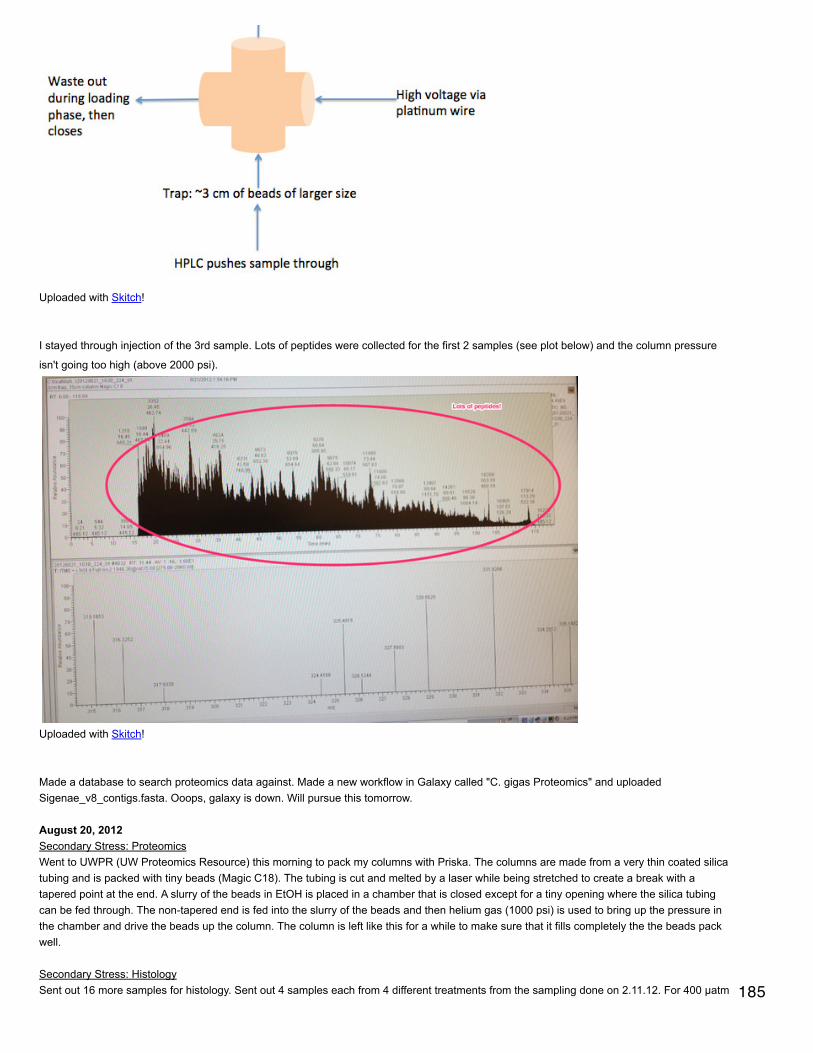
Uploaded with Skitch!
I stayed through injection of the 3rd sample. Lots of peptides were collected for the first 2 samples (see plot below) and the column pressure
isn't going too high (above 2000 psi).
Uploaded with Skitch!
Made a database to search proteomics data against. Made a new workflow in Galaxy called "C. gigas Proteomics" and uploadedSigenae_v8_contigs.fasta. Ooops, galaxy is down. Will pursue this tomorrow.
August 20, 2012Secondary Stress: ProteomicsWent to UWPR (UW Proteomics Resource) this morning to pack my columns with Priska. The columns are made from a very thin coated silicatubing and is packed with tiny beads (Magic C18). The tubing is cut and melted by a laser while being stretched to create a break with atapered point at the end. A slurry of the beads in EtOH is placed in a chamber that is closed except for a tiny opening where the silica tubingcan be fed through. The non-tapered end is fed into the slurry of the beads and then helium gas (1000 psi) is used to bring up the pressure inthe chamber and drive the beads up the column. The column is left like this for a while to make sure that it fills completely the the beads packwell.
Secondary Stress: HistologySent out 16 more samples for histology. Sent out 4 samples each from 4 different treatments from the sampling done on 2.11.12. For 400 µatm 185
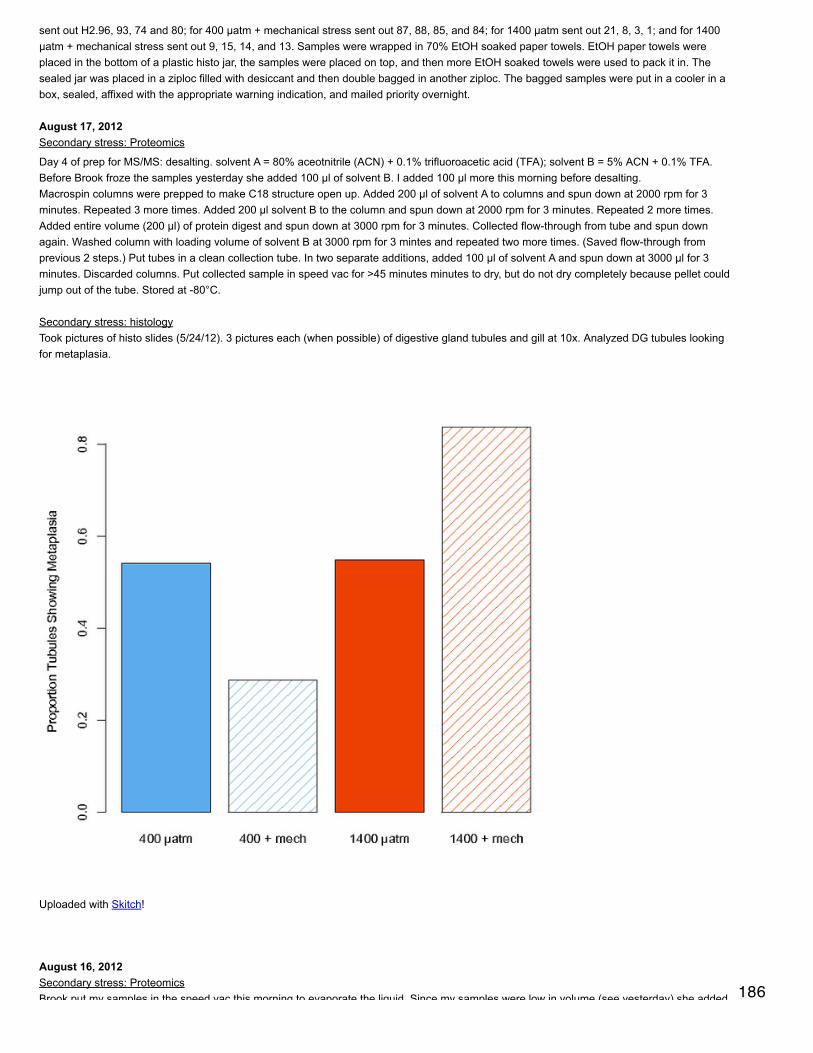
sent out H2.96, 93, 74 and 80; for 400 µatm + mechanical stress sent out 87, 88, 85, and 84; for 1400 µatm sent out 21, 8, 3, 1; and for 1400µatm + mechanical stress sent out 9, 15, 14, and 13. Samples were wrapped in 70% EtOH soaked paper towels. EtOH paper towels wereplaced in the bottom of a plastic histo jar, the samples were placed on top, and then more EtOH soaked towels were used to pack it in. Thesealed jar was placed in a ziploc filled with desiccant and then double bagged in another ziploc. The bagged samples were put in a cooler in abox, sealed, affixed with the appropriate warning indication, and mailed priority overnight.
August 17, 2012Secondary stress: Proteomics
Day 4 of prep for MS/MS: desalting. solvent A = 80% aceotnitrile (ACN) + 0.1% trifluoroacetic acid (TFA); solvent B = 5% ACN + 0.1% TFA.Before Brook froze the samples yesterday she added 100 µl of solvent B. I added 100 µl more this morning before desalting.Macrospin columns were prepped to make C18 structure open up. Added 200 µl of solvent A to columns and spun down at 2000 rpm for 3minutes. Repeated 3 more times. Added 200 µl solvent B to the column and spun down at 2000 rpm for 3 minutes. Repeated 2 more times.Added entire volume (200 µl) of protein digest and spun down at 3000 rpm for 3 minutes. Collected flow-through from tube and spun downagain. Washed column with loading volume of solvent B at 3000 rpm for 3 mintes and repeated two more times. (Saved flow-through fromprevious 2 steps.) Put tubes in a clean collection tube. In two separate additions, added 100 µl of solvent A and spun down at 3000 µl for 3minutes. Discarded columns. Put collected sample in speed vac for >45 minutes minutes to dry, but do not dry completely because pellet couldjump out of the tube. Stored at -80°C.
Secondary stress: histologyTook pictures of histo slides (5/24/12). 3 pictures each (when possible) of digestive gland tubules and gill at 10x. Analyzed DG tubules lookingfor metaplasia.
Uploaded with Skitch!
August 16, 2012Secondary stress: ProteomicsBrook put my samples in the speed vac this morning to evaporate the liquid. Since my samples were low in volume (see yesterday) she added 186
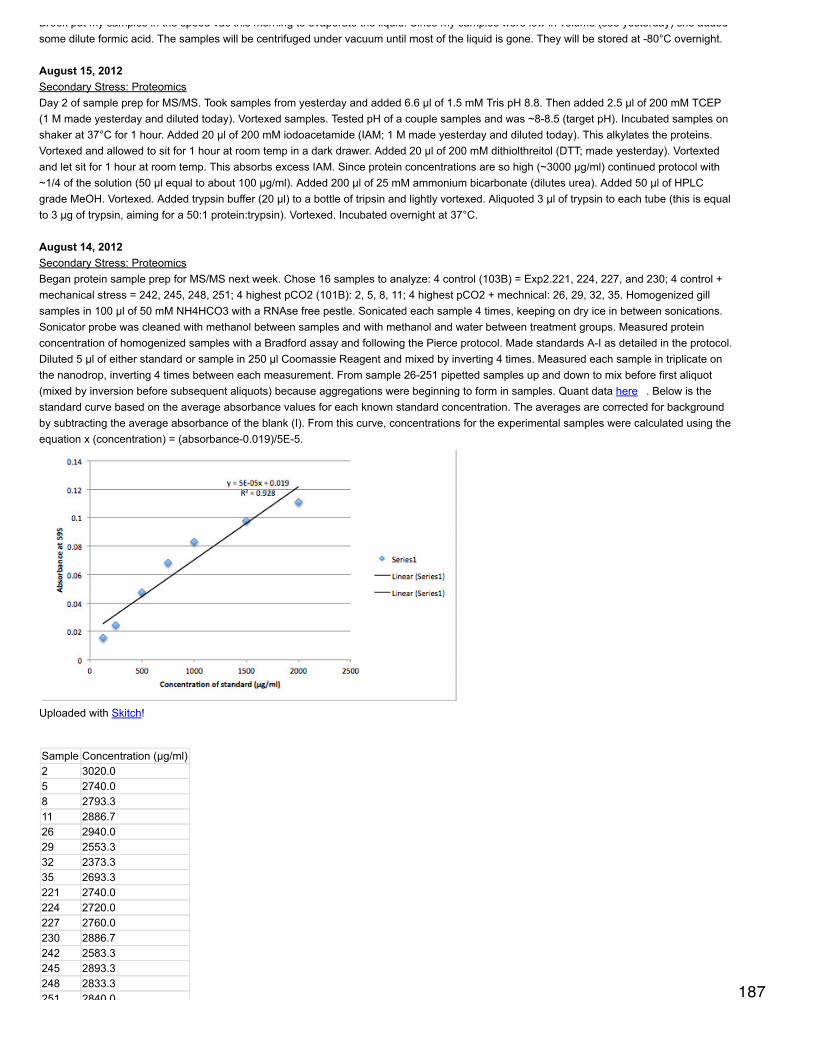
Brook put my samples in the speed vac this morning to evaporate the liquid. Since my samples were low in volume (see yesterday) she addedsome dilute formic acid. The samples will be centrifuged under vacuum until most of the liquid is gone. They will be stored at -80°C overnight.
August 15, 2012Secondary Stress: ProteomicsDay 2 of sample prep for MS/MS. Took samples from yesterday and added 6.6 µl of 1.5 mM Tris pH 8.8. Then added 2.5 µl of 200 mM TCEP(1 M made yesterday and diluted today). Vortexed samples. Tested pH of a couple samples and was ~8-8.5 (target pH). Incubated samples onshaker at 37°C for 1 hour. Added 20 µl of 200 mM iodoacetamide (IAM; 1 M made yesterday and diluted today). This alkylates the proteins.Vortexed and allowed to sit for 1 hour at room temp in a dark drawer. Added 20 µl of 200 mM dithiolthreitol (DTT; made yesterday). Vortextedand let sit for 1 hour at room temp. This absorbs excess IAM. Since protein concentrations are so high (~3000 µg/ml) continued protocol with~1/4 of the solution (50 µl equal to about 100 µg/ml). Added 200 µl of 25 mM ammonium bicarbonate (dilutes urea). Added 50 µl of HPLCgrade MeOH. Vortexed. Added trypsin buffer (20 µl) to a bottle of tripsin and lightly vortexed. Aliquoted 3 µl of trypsin to each tube (this is equalto 3 µg of trypsin, aiming for a 50:1 protein:trypsin). Vortexed. Incubated overnight at 37°C.
August 14, 2012Secondary Stress: ProteomicsBegan protein sample prep for MS/MS next week. Chose 16 samples to analyze: 4 control (103B) = Exp2.221, 224, 227, and 230; 4 control +mechanical stress = 242, 245, 248, 251; 4 highest pCO2 (101B): 2, 5, 8, 11; 4 highest pCO2 + mechnical: 26, 29, 32, 35. Homogenized gillsamples in 100 µl of 50 mM NH4HCO3 with a RNAse free pestle. Sonicated each sample 4 times, keeping on dry ice in between sonications.Sonicator probe was cleaned with methanol between samples and with methanol and water between treatment groups. Measured proteinconcentration of homogenized samples with a Bradford assay and following the Pierce protocol. Made standards A-I as detailed in the protocol.Diluted 5 µl of either standard or sample in 250 µl Coomassie Reagent and mixed by inverting 4 times. Measured each sample in triplicate onthe nanodrop, inverting 4 times between each measurement. From sample 26-251 pipetted samples up and down to mix before first aliquot(mixed by inversion before subsequent aliquots) because aggregations were beginning to form in samples. Quant data here . Below is thestandard curve based on the average absorbance values for each known standard concentration. The averages are corrected for backgroundby subtracting the average absorbance of the blank (I). From this curve, concentrations for the experimental samples were calculated using theequation x (concentration) = (absorbance-0.019)/5E-5.
Uploaded with Skitch!
Sample Concentration (µg/ml)2 3020.05 2740.08 2793.311 2886.726 2940.029 2553.332 2373.335 2693.3221 2740.0224 2720.0227 2760.0230 2886.7242 2583.3245 2893.3248 2833.3251 2840.0 187
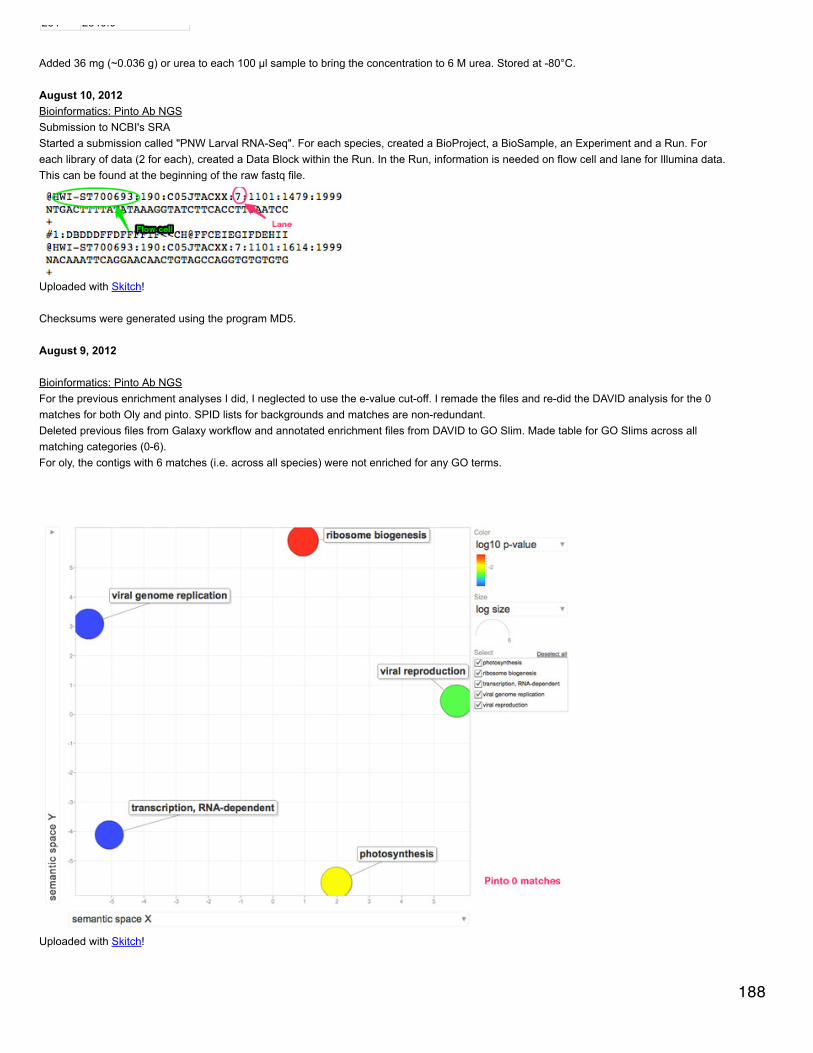
251 2840.0
Added 36 mg (~0.036 g) or urea to each 100 µl sample to bring the concentration to 6 M urea. Stored at -80°C.
August 10, 2012Bioinformatics: Pinto Ab NGSSubmission to NCBI's SRAStarted a submission called "PNW Larval RNA-Seq". For each species, created a BioProject, a BioSample, an Experiment and a Run. Foreach library of data (2 for each), created a Data Block within the Run. In the Run, information is needed on flow cell and lane for Illumina data.This can be found at the beginning of the raw fastq file.
Uploaded with Skitch!
Checksums were generated using the program MD5.
August 9, 2012
Bioinformatics: Pinto Ab NGSFor the previous enrichment analyses I did, I neglected to use the e-value cut-off. I remade the files and re-did the DAVID analysis for the 0matches for both Oly and pinto. SPID lists for backgrounds and matches are non-redundant.Deleted previous files from Galaxy workflow and annotated enrichment files from DAVID to GO Slim. Made table for GO Slims across allmatching categories (0-6).For oly, the contigs with 6 matches (i.e. across all species) were not enriched for any GO terms.
Uploaded with Skitch!
188
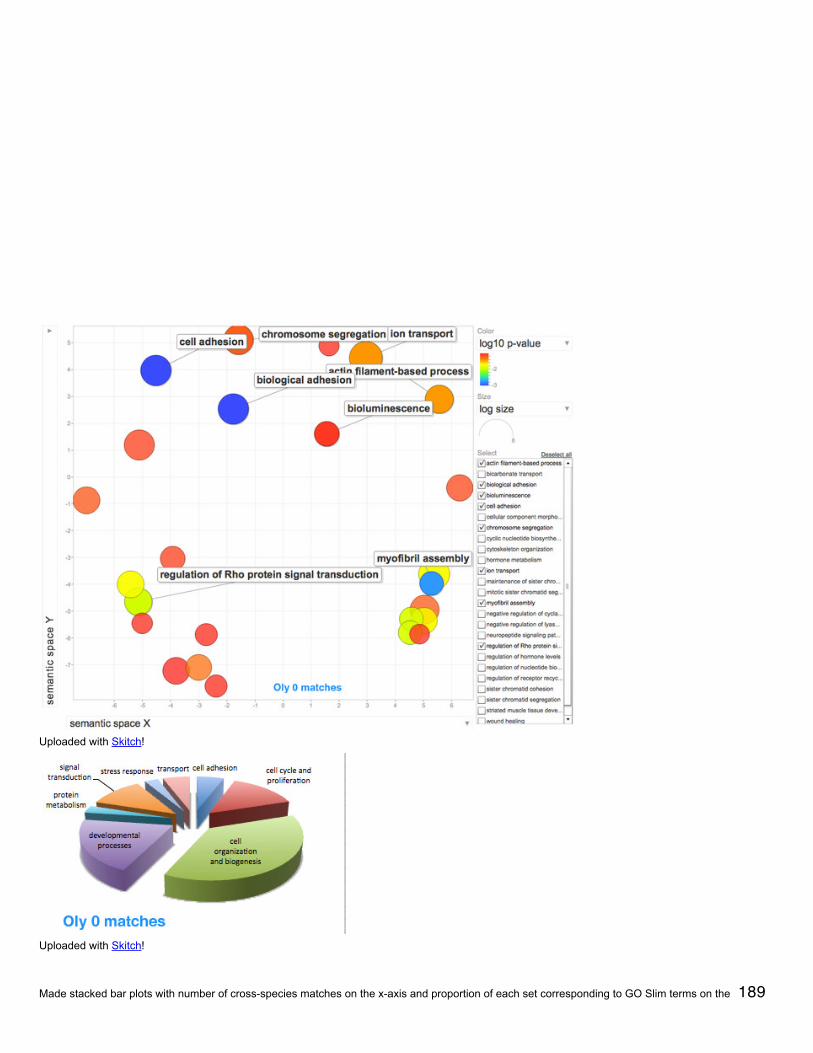
Uploaded with Skitch!
Uploaded with Skitch!
Made stacked bar plots with number of cross-species matches on the x-axis and proportion of each set corresponding to GO Slim terms on the 189

y. The colors correspond to the following Go Slims:cell adhesion = light browncell cycle & proliferation = light bluecell organization and biogenesis = violetcell-cell signaling = pale green
death = light coraldevelopmental processes = tanprotein metabolism = tealRNA metabolism = dark yellowsignal transduction = light lavenderstress response = dark redtransport = pink
Uploaded with Skitch!
190

Uploaded with Skitch!
Also made stacked bar plots of GO Slim terms corresponding to number of matches not based on enrichment. Filtered contig number and itsassociated GO Slim by SPID and discarded all contigs that didn't meet the cut-off (1e-5). Kept only unique contig-GO Slim associations (HkamGO Slim, Oly GO Slim). Did the same for contigs and number of cross-species matches (Hkam matches, Oly matches). Uploaded both ofthese files to Galaxy and joined based on contig number.
August 7, 2012Olympia oyster OASEM on Carolyn's Oly larvae from her May experiment. Larvae had been stored in EtOH so I sucked up a little bit of larvae (there were largenumbers of them at the bottom of each tube) and streaked them across the SEM stub. The EtOH was allowed to evaporate off before loadingsample in SEM. Took pictures of the samples 400-D2L and 2200-8 (pictures are saved in the SEM folder "Emma T-S" in "Oly Larvae"). Foreach larva took a picture of the entire shell at 500x and took a picture of the growth lines on the shell at 3000x. For 400-D2L the following photo
numbers are of the same larvae: (1,2,9), (3,4,8), (5-7), (11&12), (13&14), (15&16), (17-19), (20-23), (24&25), (26&27), (28-30), (31&32),(33&34), (35&36), (37-39), (40&41), (42&43), (44&45), (46-48). For 2200-8, the pictures were all taken consecutively and pictures of a newlarva begin with a picture of the entire shell followed by zoomed in pictures. The layout of the samples on the stubs is below:
400-D2L 400-D1L 400-8400-7 400-6 1000-81000-7 1000-6 1600-81600-7 1600-6 2200-8
August 3, 2012Oyster Transport: Willapa BayWent down to Willapa Bay to pick up 400 oysters to use as broodstock in the cross-generation OA study. The oysters had been collected(multiple year classes) by Alan Trimble from 2 different locations in Willapa (Baby Island and another one). We collected 200 from each groupand kept them separate throughout cleaning and transport. We picked the oysters at low tide (~9 am) and then brought them to the WDFWoffice to clean. For each oyster, we scraped off epibionts, with special attention paid to oyster drills and their eggs. Oysters were then soaked infresh water for 10 minutes to make sure they were closed and transferred to a dilute bleach solution for 1 hour (20.8 mL of bleach in 5 gallonsof fresh water). We tried to keep them in the shade throughout. After the bleach soak, we rinsed the oysters with fresh water, they werechecked by a WDFW employee, and we packed them in coolers covered with a damp towel and ice packs. We then drove them up toBainbridge Island and handed them off to Joth.
191
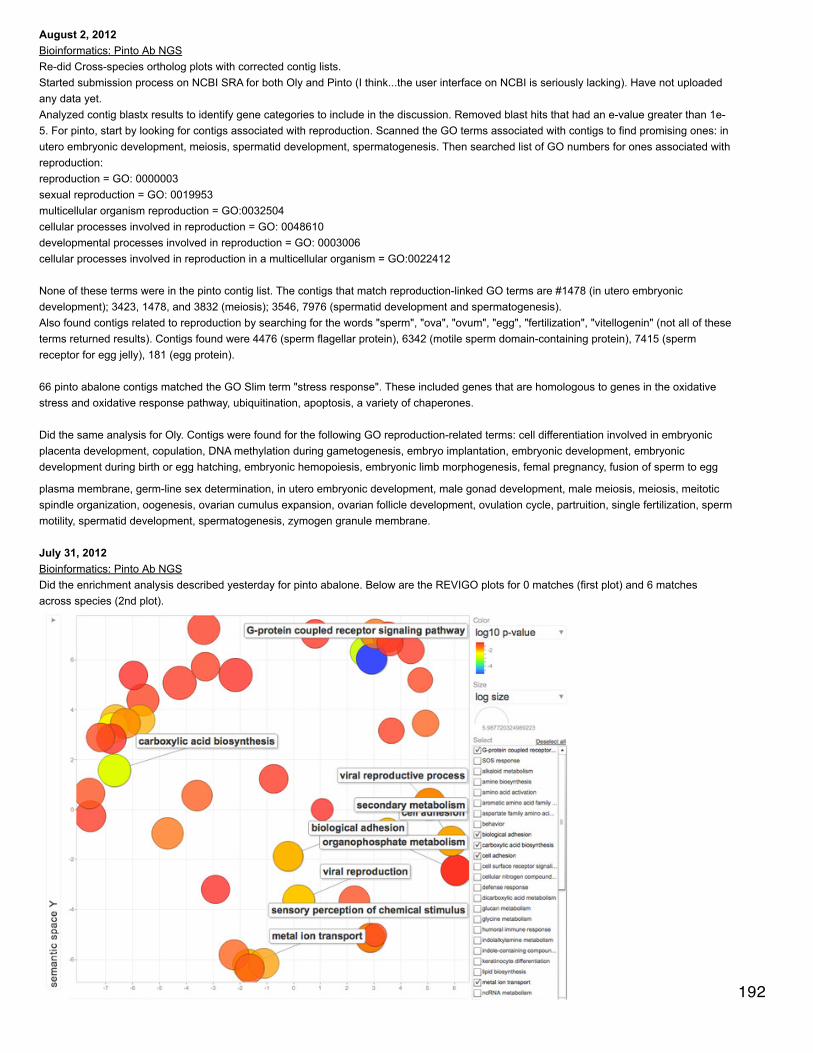
August 2, 2012Bioinformatics: Pinto Ab NGSRe-did Cross-species ortholog plots with corrected contig lists.Started submission process on NCBI SRA for both Oly and Pinto (I think...the user interface on NCBI is seriously lacking). Have not uploadedany data yet.Analyzed contig blastx results to identify gene categories to include in the discussion. Removed blast hits that had an e-value greater than 1e-5. For pinto, start by looking for contigs associated with reproduction. Scanned the GO terms associated with contigs to find promising ones: inutero embryonic development, meiosis, spermatid development, spermatogenesis. Then searched list of GO numbers for ones associated withreproduction:reproduction = GO: 0000003sexual reproduction = GO: 0019953multicellular organism reproduction = GO:0032504cellular processes involved in reproduction = GO: 0048610developmental processes involved in reproduction = GO: 0003006cellular processes involved in reproduction in a multicellular organism = GO:0022412
None of these terms were in the pinto contig list. The contigs that match reproduction-linked GO terms are #1478 (in utero embryonicdevelopment); 3423, 1478, and 3832 (meiosis); 3546, 7976 (spermatid development and spermatogenesis).Also found contigs related to reproduction by searching for the words "sperm", "ova", "ovum", "egg", "fertilization", "vitellogenin" (not all of theseterms returned results). Contigs found were 4476 (sperm flagellar protein), 6342 (motile sperm domain-containing protein), 7415 (spermreceptor for egg jelly), 181 (egg protein).
66 pinto abalone contigs matched the GO Slim term "stress response". These included genes that are homologous to genes in the oxidativestress and oxidative response pathway, ubiquitination, apoptosis, a variety of chaperones.
Did the same analysis for Oly. Contigs were found for the following GO reproduction-related terms: cell differentiation involved in embryonicplacenta development, copulation, DNA methylation during gametogenesis, embryo implantation, embryonic development, embryonicdevelopment during birth or egg hatching, embryonic hemopoiesis, embryonic limb morphogenesis, femal pregnancy, fusion of sperm to egg
plasma membrane, germ-line sex determination, in utero embryonic development, male gonad development, male meiosis, meiosis, meitoticspindle organization, oogenesis, ovarian cumulus expansion, ovarian follicle development, ovulation cycle, partruition, single fertilization, spermmotility, spermatid development, spermatogenesis, zymogen granule membrane.
July 31, 2012Bioinformatics: Pinto Ab NGSDid the enrichment analysis described yesterday for pinto abalone. Below are the REVIGO plots for 0 matches (first plot) and 6 matchesacross species (2nd plot).
192
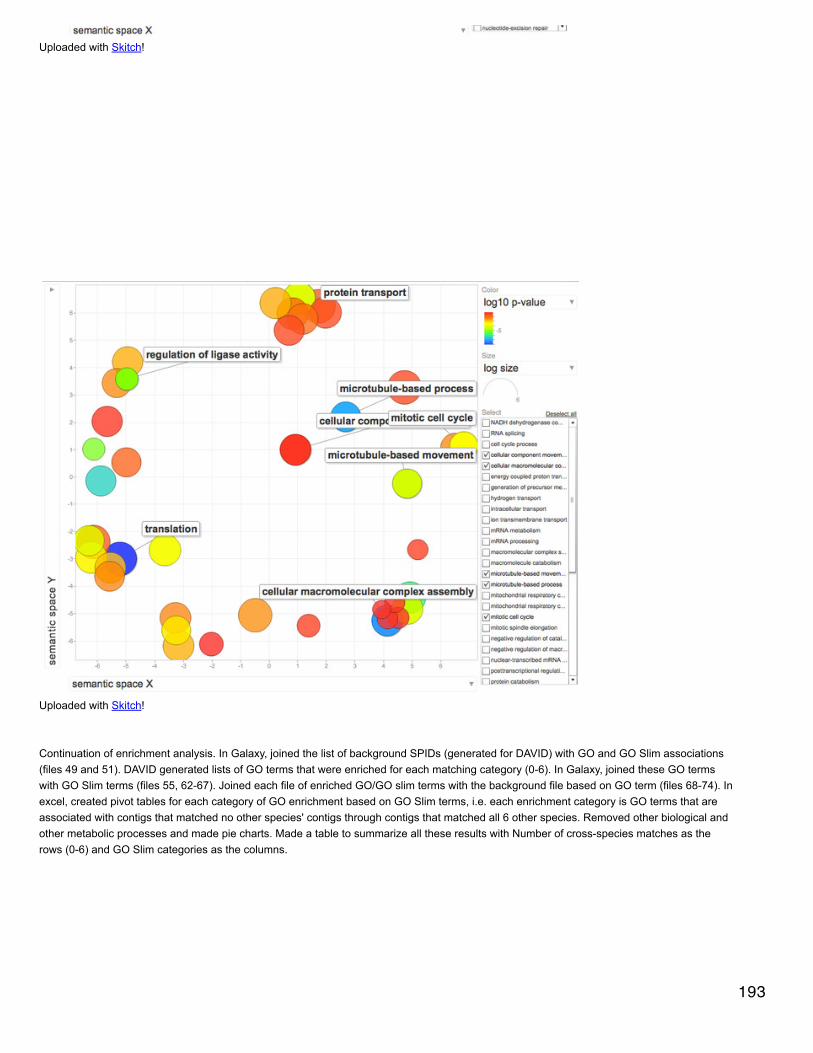
Uploaded with Skitch!
Uploaded with Skitch!
Continuation of enrichment analysis. In Galaxy, joined the list of background SPIDs (generated for DAVID) with GO and GO Slim associations(files 49 and 51). DAVID generated lists of GO terms that were enriched for each matching category (0-6). In Galaxy, joined these GO termswith GO Slim terms (files 55, 62-67). Joined each file of enriched GO/GO slim terms with the background file based on GO term (files 68-74). Inexcel, created pivot tables for each category of GO enrichment based on GO Slim terms, i.e. each enrichment category is GO terms that areassociated with contigs that matched no other species' contigs through contigs that matched all 6 other species. Removed other biological andother metabolic processes and made pie charts. Made a table to summarize all these results with Number of cross-species matches as therows (0-6) and GO Slim categories as the columns.
193
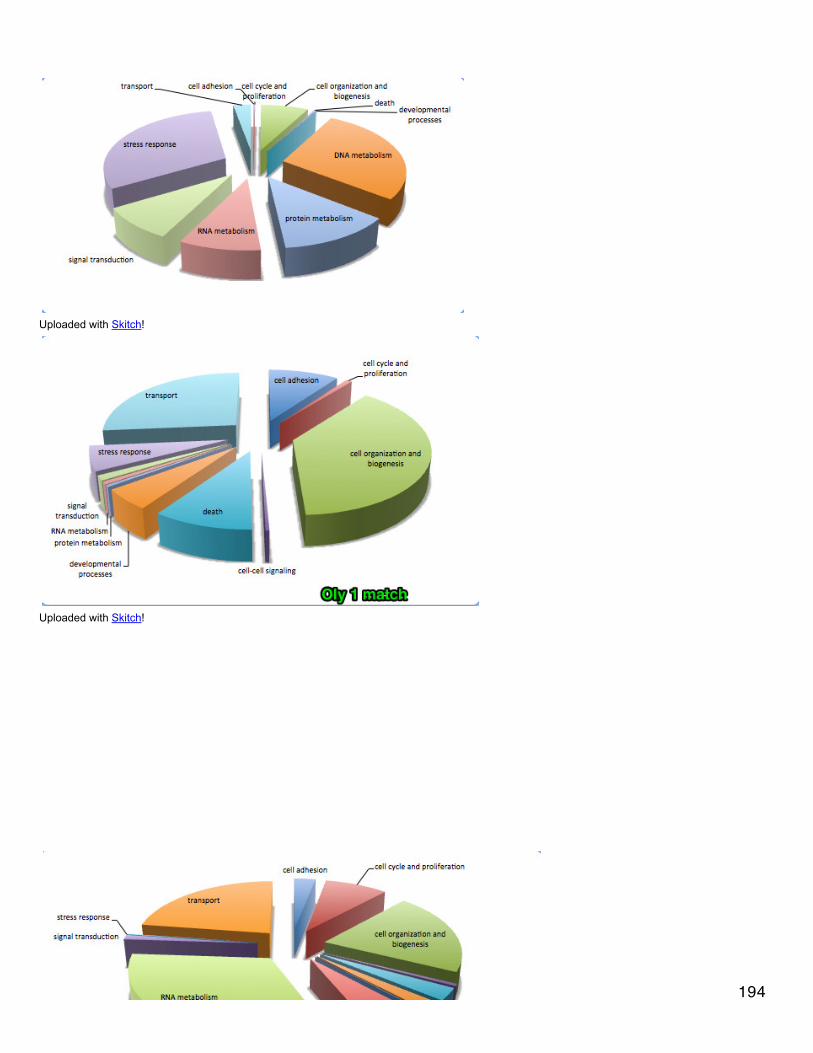
Uploaded with Skitch!
Uploaded with Skitch!
194

Uploaded with Skitch!
Uploaded with Skitch!
Uploaded with Skitch!
195
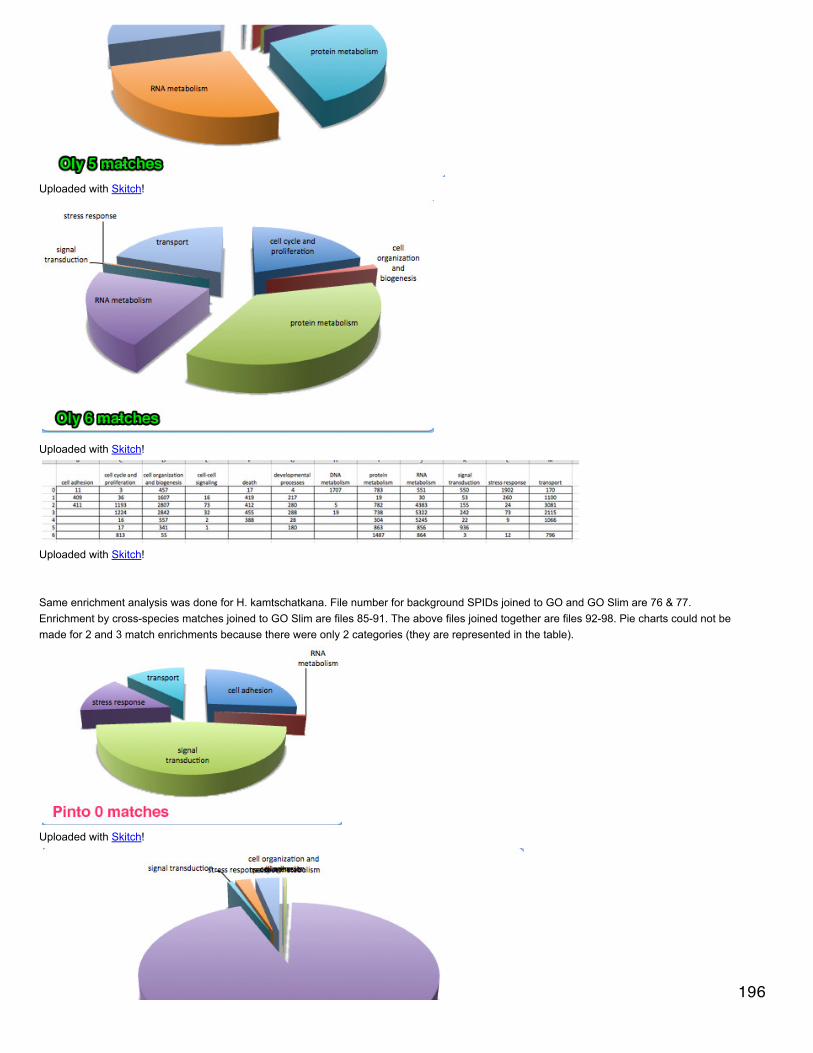
Uploaded with Skitch!
Uploaded with Skitch!
Uploaded with Skitch!
Same enrichment analysis was done for H. kamtschatkana. File number for background SPIDs joined to GO and GO Slim are 76 & 77.Enrichment by cross-species matches joined to GO Slim are files 85-91. The above files joined together are files 92-98. Pie charts could not bemade for 2 and 3 match enrichments because there were only 2 categories (they are represented in the table).
Uploaded with Skitch!
196

Uploaded with Skitch!
Uploaded with Skitch!
Uploaded with Skitch!
Uploaded with Skitch!
197

Uploaded with Skitch!
July 30, 2012Bioinformatics: Pinto Ab NGSMade box plots of evalues by GO Slim term for pinto and Oly. Only GO Slim terms that correspond to biological processes were included.Redundant contig-GO Slim pairings were removed. Log evalues were plotted in the box plots. Whiskers on box plot extend to most extremevalues. For log evalues, all unknown numbers (#NUM!) were replaced by 0 (these correspond to evalues=0).
Uploaded with Skitch!
198

Uploaded with Skitch!
Enrichment analysis for contigs that match to 0-6 other species. Removed blast hits that did not make e-value cut-off (1e-5) and found howmany matches each O. lurida or H. kamtschatkana contig had across species. In DAVID, uploaded all gene SPIDs as background and then did7 different analyses with genes with 6, 5, 4, 3, 2, 1, or 0 matches across other species blast results. So far this analysis has been completed forO. lurida, not for H. kamtschatkana. Below are the REVIGO visualizations (with p-values from DAVID) for contigs that don't match to any otherspecies (0 matches) and the second plot is contigs that match across all species comparisons.
199

Uploaded with Skitch!
Uploaded with Skitch!
July 27, 2012Bioinformatics: Pinto Ab NGSSteven did blast of O. lurida transcriptome against H. kamtschatkana. See his notebook .In Galaxy, added this new blastn to the Oly contig file joined with other blast results (Galaxy 155).
Original files used to join in Galaxy and do downstream analyses were the files that resulted from the blastx search against SwissProt. Thismeans that some of the contigs are missing if they did not match up with a SPID. Need to redo all the joining in galaxy using the original list ofcontig names and redo necessary analyses downstream.Started new Galaxy work flow called PNW Genomics. (1) Uploaded contig list to Galaxy (2) as well as file of SwissProt blast results (3)
200

Started new Galaxy work flow called PNW Genomics. (1) Uploaded contig list to Galaxy (2) as well as file of SwissProt blast results (3)annotated to gene name. (4) Annotated to GO and (5) then to GO Slim. Took file from (3) and (6) joined with other species blast files. Filenames below:H. kamtschatkana(1) Haliotis kam contig list(2) & (3) pinto SPID -> Galaxy 10(4) Galaxy 11(5) Galaxy 13(6) Galaxy 22-27
O. lurida
(1) Ostrea lur contig list(2) & (3) oly SPID -> Galaxy 37(4) Galaxy 38(5) Galaxy 39(6) Galaxy 40-45
July 26, 2012Bioinformatics: Pinto Ab NGSFound Pearson correlation coefficients across bit scores for multi-species blast, for both Oly and Pinto. Did not limit bit scores by e-value, so alldata were used for analyses. When there was no bit score, entered "NA". Used R for analysis and function cor.test. All pairwise correlationswere positive and significant (p < 2.2e-16). Plotted correlation coefficients by species. Species are laid out on the x-axis and then for eachspecies, the correlation coefficient for bit scores with another species is plotted and color coded. There is redundancy in these graphs since forthe correlation with H. midae is plotted for C. gigas and the correlation for C. gigas is plotted for H. midae. The first plot shows the correlationsfor pinto and the second is for oly.
Uploaded with Skitch!
201
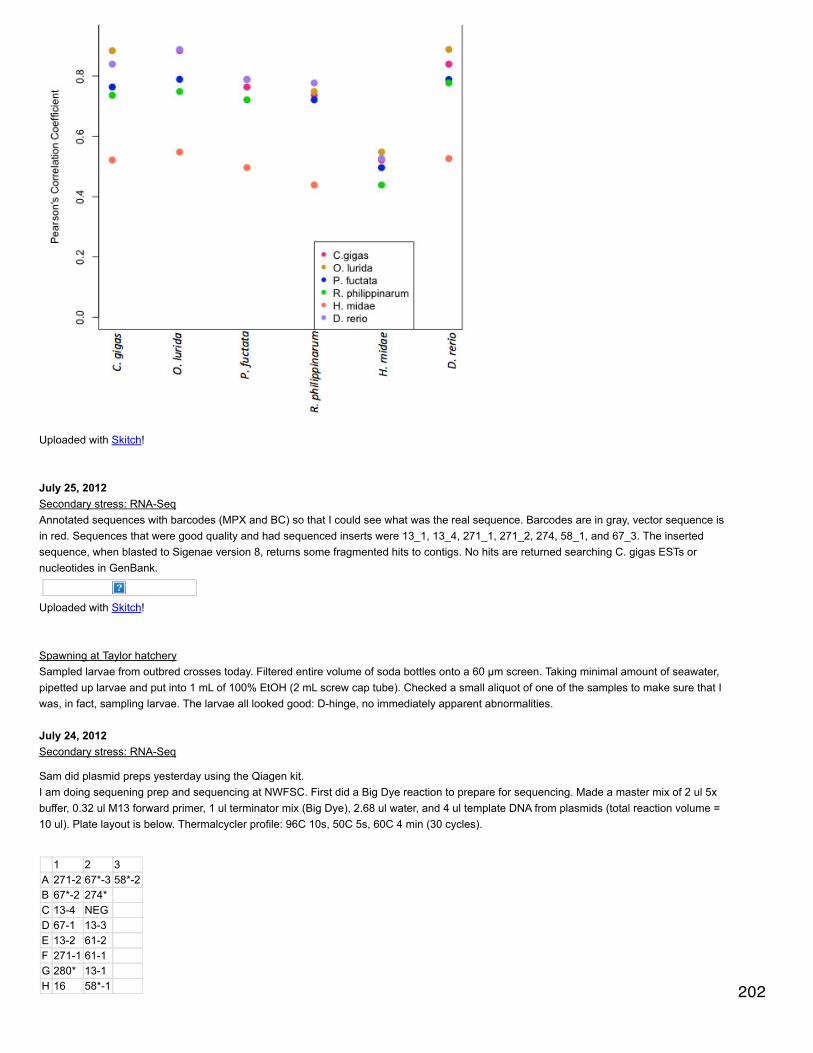
Uploaded with Skitch!
July 25, 2012Secondary stress: RNA-SeqAnnotated sequences with barcodes (MPX and BC) so that I could see what was the real sequence. Barcodes are in gray, vector sequence isin red. Sequences that were good quality and had sequenced inserts were 13_1, 13_4, 271_1, 271_2, 274, 58_1, and 67_3. The insertedsequence, when blasted to Sigenae version 8, returns some fragmented hits to contigs. No hits are returned searching C. gigas ESTs ornucleotides in GenBank.
Uploaded with Skitch!
Spawning at Taylor hatcherySampled larvae from outbred crosses today. Filtered entire volume of soda bottles onto a 60 µm screen. Taking minimal amount of seawater,pipetted up larvae and put into 1 mL of 100% EtOH (2 mL screw cap tube). Checked a small aliquot of one of the samples to make sure that Iwas, in fact, sampling larvae. The larvae all looked good: D-hinge, no immediately apparent abnormalities.
July 24, 2012Secondary stress: RNA-Seq
Sam did plasmid preps yesterday using the Qiagen kit.I am doing sequening prep and sequencing at NWFSC. First did a Big Dye reaction to prepare for sequencing. Made a master mix of 2 ul 5xbuffer, 0.32 ul M13 forward primer, 1 ul terminator mix (Big Dye), 2.68 ul water, and 4 ul template DNA from plasmids (total reaction volume =10 ul). Plate layout is below. Thermalcycler profile: 96C 10s, 50C 5s, 60C 4 min (30 cycles).
1 2 3A 271-2 67*-3 58*-2B 67*-2 274*C 13-4 NEGD 67-1 13-3E 13-2 61-2F 271-1 61-1G 280* 13-1H 16 58*-1 202

Cleaned up Big Dye reaction using Agencourt CleanSEQ. Resuspended magnetic beads and aliquoted 10 ul of beads per well. Added 42 ul85% EtOH and pipetted up and down 7 times to mix well. Placed on magnetic plate for a few minutes, then removed EtOH. Washed 2 moretimes with 100 ul of EtOH, letting sit about 30 s between each wash. Let dry completely at room temperature. Added 40 ul of 0.1 mM EDTA andlet sit for a couple of minutes. Briefly spun down plate and loaded on ABI 3100.
July 23, 2012Spawning at Taylor hatcheryHelped in spawning of inbred lines of C. gigas. Oysters were originally wild broodstock from Canada (pipestem) that were randomly selected tocreate inbred lines. Spawning was 1:1 within families (i.e. 1 male from family 1 was spawned with 1 female from family 1). We also made 10outbred crosses to test the parentage assignment of our microsatellite panel (female x male): 16x6, 49x29, 75x15, 15x18, 70x58, 18x73, 6x49,29x16, 4x70, and 58x4. For each cross, females were strip spawned and eggs were washed through an 80 ul to a 20 ul sieve. The eggs werethen homogenized and counted on a coulter counter to create a beaker of 800 mL of 1.2 million eggs. Eggs were left to sit on the counter for atleast 30 minutes so that they could "round" up. Males were strip spawned and sperm were left to activate for ~ 5 minutes before dilute sperm(~2 mL) was used to fertilize eggs. Fertilization was allowed to progress for 30 minutes before fertilized eggs were put into buckets. Theoutbred crosses were done in the morning and in the afternoon were transferred to 2 L soda bottles and transferred back to Seattle (only about1/4 of the fertilized eggs were brought back, so ~300,000). For each adult spawned, I took a sample of adductor muscle for USC and a sampleof mantle for Sea Grant genotyping efforts. Samples are stored in screw cap tubes in 95% EtOH. Sample labels are the following: 12x4 meansthat in 2012 they are used in the 4th spawn, male or female, 10x9 means that in 2010 they resulted from the 9th spawn, e.g. 1x1 means thatthey are used in the family 1 inbred cross.Bottles of fertilized embryos were put in the basement. Sammi will aerate tomorrow morning.July 22, 2012Secondary stress: RNA-Seq3:30 pmFrom gridded plate (7/20/12) picked bacteria with toothpick and put in 3 mL of LB+Kan broth (7/20/12). Grew up at 37C, 200 rpm.
July 20, 2012Secondary stress: RNA-SeqCloningNot many colonies grew on the plates and there are very few white colonies. Will pick and sequence all white colonies that are there.Made liquid culture broth (1XLB + Kanmyacin): 100 mL 5X LB lab stock, 400 mL nano pure water, 500 µl 50 mg/mL Kanmyacin.Restreaked white colonies onto gridded plate. Warmed plate at 37°C before restreaking. Some of the colonies may have had a tiny bit of blue
in them and are indicated with a "*". 2 blue colonies (1 from 274 and 1 from 280) were streaked as negative controls. Restreaked colonies are274*, 4 from 13, 67, 67*, 2 from 58*, 2 from 61, 16, 2 from 271, 280*. Plate was put in incubator at 37°C.
Bioinformatics: Pinto Ab NGSMade plots to demonstrate the Oly or Pinto contigs that are shared between transcriptomes across multiple species (based on BLAST results).These plots only include Oly/Pinto contigs if they were annotated with SPID at e-value of at least 1e-5 and blast hits only if they matched withthe same e-value cut off. The y-axis is a list of contigs for the transcriptome being compared (Oly/Pinto) and then each dot on the graphrepresents a match between that original transcriptome and a gene in one of the other species.
203
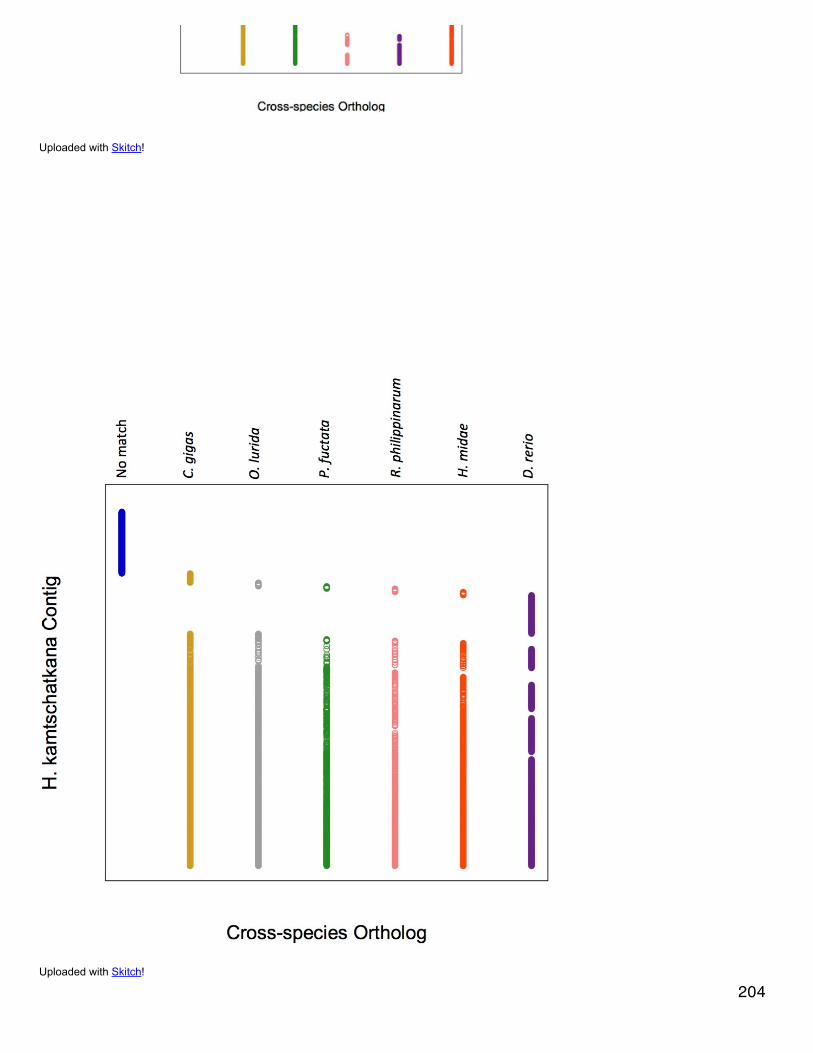
Uploaded with Skitch!
Uploaded with Skitch!
204

July 19, 2012Secondary stress: RNA-SeqCloningChose 8 samples at random to clone and Sanger sequence: 13, 16, 58, 61, 67, 271, 274, 280. Cloning was done using TOPO pCR2.1 kitfollowing manufacturer's protocol. To 2 µl of PCR product from each of those samples (PCR done 7/17/12) added 0.5 µl TOPO salt solutionand 0.5 µl TOPO vector. Incubated at 22°C for 10 minutes and put on ice. Thawed competent cells on ice (One Shot TOPO 10 cells). Added 2µl of PCR/salt/vector mix to the competent cells (swirling while adding) and incubated for 10 minutes on ice. Heat shocked for 30s in a water
bath at 42°C and put on ice for 2 minutes. Added 250 µl SOC (room temp) to each sample (under hood), rolling the tubes to coat sides.Incubated at 37°C, 200 rpm for 1 hour. Meanwhile, LB+Kan plates made yesterday were warmed for >30 minutes at 37°C, spread with 40 µl of40 mg/mL XGAL, and kept in incubator until ready for use (with lids slightly cracked to evaporate some moisture). Sam spread the plates afterthe samples were done incubating: for each sample a plate was spread with 50 µl or with 200 µl of competent cell solution. Plates werereturned to 37°C incubator.
Bioinformatics: Pinto Ab NGSRedid GO Slim pie charts for Pinto and Oly so that GO Slim terms are non-redundant with respect to contig.Started to work on graph depicting the contigs that match different species from blast searches. Only contains with an evalue of at least 1e-5were used. A horizontal bar graph was made with individual O. lurida contigs on the y-axis and number of cross-species orthologs (correctterm?) on the x-axis. The x-axis represents how many other species had contigs that matched the original O. lurida at the pre-determined e-value. The fewest contigs matched across all 5 species (C. gigs, P. fuctata, R. philippinarum, H. midae, D. rerio; n=574) and the most matchedwith just one other species (n=4,746) or 2 other species (n=4,700).
July 18, 2012Secondary stress: RNA-SeqIt was difficult to access the liquid that the gel slices were sitting in, so I spun them down on Millipore gel extraction columns (5,000xg for 10minutes). I started with a subset of 8 samples. Concentrations of the cDNA product post-gel extraction can be found in the spreadsheet . Did aPCR using 5 ng of template for each sample. Each reaction consisted of 1 µl 2.5 mM dNTPs, 1 µl 10X PCR buffer, 0.2 µl 10 µM ILL-Lib1-20oligo, 0.2 µl 10 µM ILL-Lib2 oligo, 1 µl Titanium taq, 6.6 µl template+H2O ( volume of template varied depending on concentration). Amplifiedon thermal cycler following: 95°C 5 minutes; 15 cycles of 95°C 40s, 63°C 1 minute, 72°C 1 minute. Ran 3 µl of product on 1% agarose gel withEtBr (made with 1x modified TAE) for 5 minutes with TAE level below top of gel and then for 30 additional minutes with buffer covering gel(using Hyperladder II).The smear is in the ~250-300 bp range (the tail above the smear is an artifact from dry loading the gel).
205
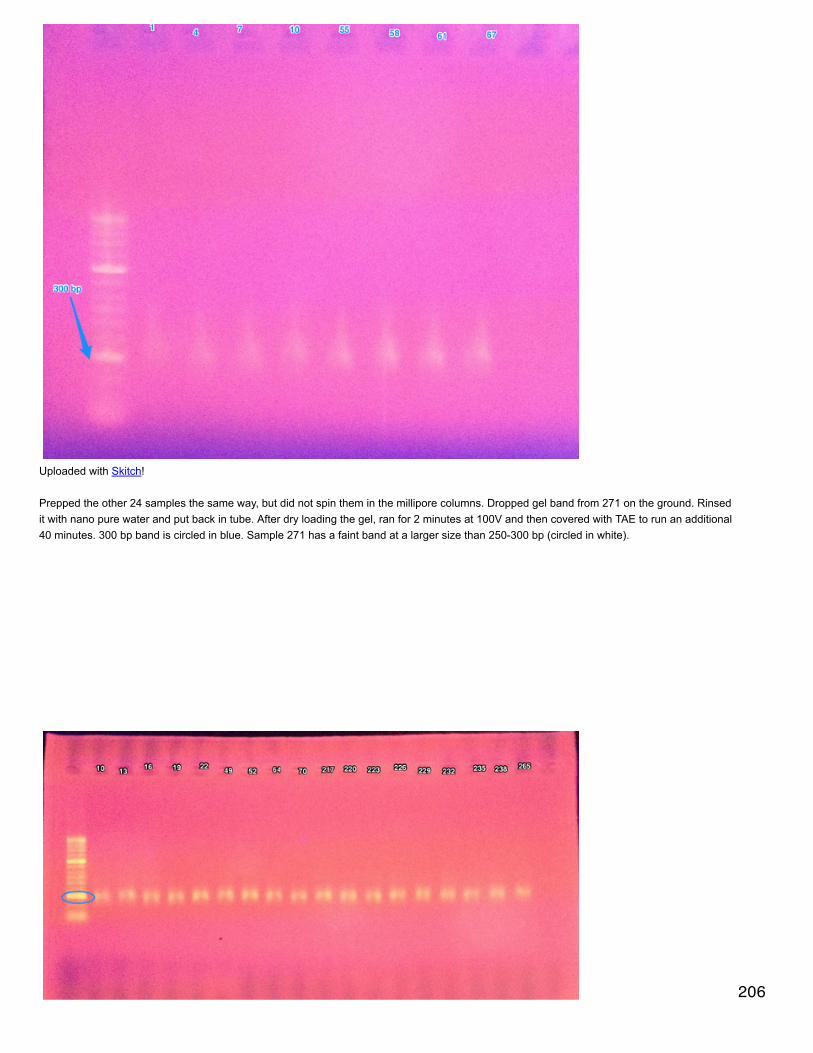
Uploaded with Skitch!
Prepped the other 24 samples the same way, but did not spin them in the millipore columns. Dropped gel band from 271 on the ground. Rinsedit with nano pure water and put back in tube. After dry loading the gel, ran for 2 minutes at 100V and then covered with TAE to run an additional40 minutes. 300 bp band is circled in blue. Sample 271 has a faint band at a larger size than 250-300 bp (circled in white).
206

Uploaded with Skitch!
CloningMade LB for plates. Mixed 100 mL of 5X LB lab stock with 400 mL nano pure water and 7.5 g Bacto agar. Swirled to mix, covered with foil, andput in autoclave at 121°C for 20 minutes (sterilization only). After flask cooled enough to touch, added 500 µl of 50 mg/µl kanamycin. Filledplates on a sterilized lab bench, let solidify, and then placed at 4°C.
July 17, 2012Secondary stress: RNA-SeqRe-did PCR from yesterday to test barcode PCR, but with a couple of changes. Only ran 8 samples per reaction (samples 1-22 for A, 49-70 forB, 217-238 for C, and 264-286 for D). Also only used 5 ng of cDNA per reaction by making a dilution to 2.5 ng/µl and using 2 µl as template.The product in D is definitely brighter than the product in C, but there's still too much showing up in C.
207

Uploaded with Skitch!
Re-did PCR with only 1.2 µl (3 ng) of template (added 0.8 µl of water to make up the difference in volume).
Uploaded with Skitch!
Did big PCR with 15 ng (6 µl of 2.5 ng/µl dilution of cDNA) of template, 31 µl H2O, 5 µl 2.5 mM dNTP, 5 µl 10X PCR buffer, 1 µl titanium taw.Added 1 µl of each 10 µM barcode to corresponding wells (see spreadsheet 7/16/12). Amplified using same profile as 7/16/12.Made 10X TBE: 108g Tris base, 55g boric acid, 40 mL 0.5 M EDTA (pH 8.0), and filled to 1 L with Nanopure water. Stirred for 30 minutes.Diluted to 1X with nano pure water and used to make and run gels.Made 2% agarose gels with 1XTBE and 10 µl SYBR Safe DNA staining dye (invitrogen). Loaded entirety of PCR product into wells (dryloading) and used 10 µL of low molecular weight ladder pBR322 DNA-Msp1 Digest. Before loading, mixed 10 µl ladder with 40 µl nano purewater and 10 µl 6X loading dye. Ran gels at 100 V for 5 minutes so that product could leave well and then covered gels with 1X TBE and ranfor an addition 65 minutes. Cut out bands between 250-300 bp and put bands for each individual in a labeled tube. Added 40 µl nano purewater and spun down at 10,000xg for 30 s. Stored at 4°C overnight. There were bands on the gel, but they were very light. The bands for 232-
208
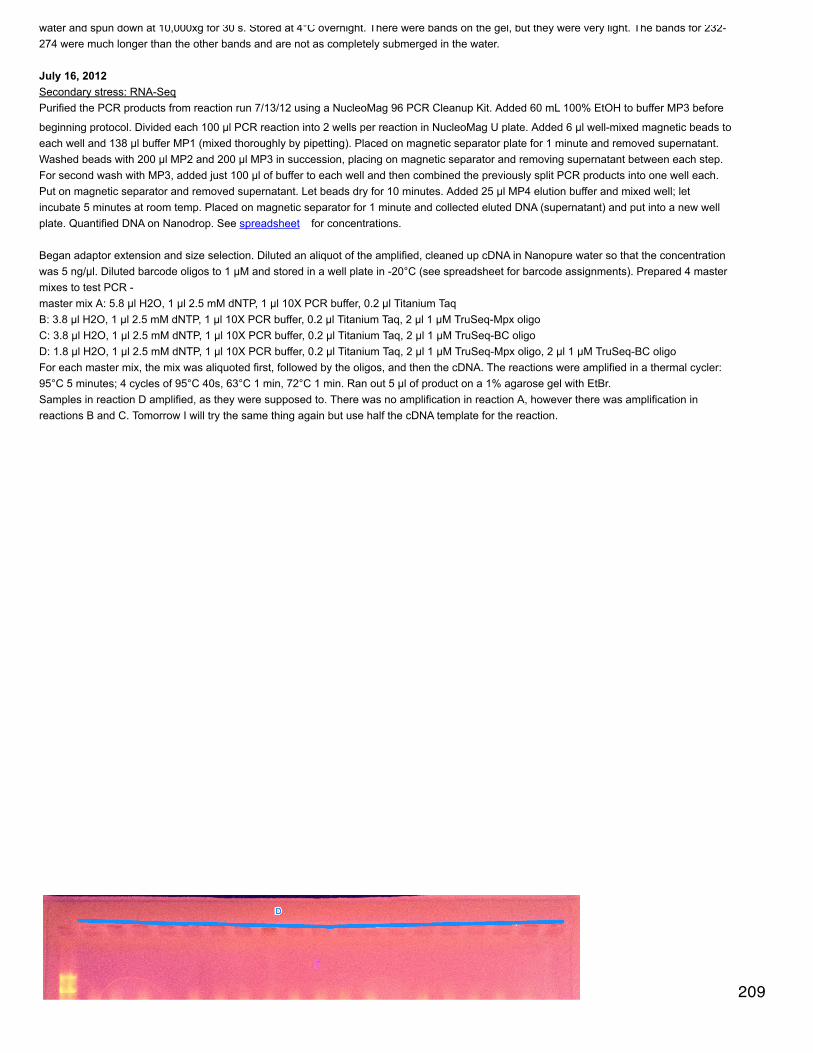
water and spun down at 10,000xg for 30 s. Stored at 4°C overnight. There were bands on the gel, but they were very light. The bands for 232-274 were much longer than the other bands and are not as completely submerged in the water.
July 16, 2012Secondary stress: RNA-SeqPurified the PCR products from reaction run 7/13/12 using a NucleoMag 96 PCR Cleanup Kit. Added 60 mL 100% EtOH to buffer MP3 before
beginning protocol. Divided each 100 µl PCR reaction into 2 wells per reaction in NucleoMag U plate. Added 6 µl well-mixed magnetic beads toeach well and 138 µl buffer MP1 (mixed thoroughly by pipetting). Placed on magnetic separator plate for 1 minute and removed supernatant.Washed beads with 200 µl MP2 and 200 µl MP3 in succession, placing on magnetic separator and removing supernatant between each step.For second wash with MP3, added just 100 µl of buffer to each well and then combined the previously split PCR products into one well each.Put on magnetic separator and removed supernatant. Let beads dry for 10 minutes. Added 25 µl MP4 elution buffer and mixed well; letincubate 5 minutes at room temp. Placed on magnetic separator for 1 minute and collected eluted DNA (supernatant) and put into a new wellplate. Quantified DNA on Nanodrop. See spreadsheet for concentrations.
Began adaptor extension and size selection. Diluted an aliquot of the amplified, cleaned up cDNA in Nanopure water so that the concentrationwas 5 ng/µl. Diluted barcode oligos to 1 µM and stored in a well plate in -20°C (see spreadsheet for barcode assignments). Prepared 4 mastermixes to test PCR -master mix A: 5.8 µl H2O, 1 µl 2.5 mM dNTP, 1 µl 10X PCR buffer, 0.2 µl Titanium TaqB: 3.8 µl H2O, 1 µl 2.5 mM dNTP, 1 µl 10X PCR buffer, 0.2 µl Titanium Taq, 2 µl 1 µM TruSeq-Mpx oligoC: 3.8 µl H2O, 1 µl 2.5 mM dNTP, 1 µl 10X PCR buffer, 0.2 µl Titanium Taq, 2 µl 1 µM TruSeq-BC oligoD: 1.8 µl H2O, 1 µl 2.5 mM dNTP, 1 µl 10X PCR buffer, 0.2 µl Titanium Taq, 2 µl 1 µM TruSeq-Mpx oligo, 2 µl 1 µM TruSeq-BC oligoFor each master mix, the mix was aliquoted first, followed by the oligos, and then the cDNA. The reactions were amplified in a thermal cycler:95°C 5 minutes; 4 cycles of 95°C 40s, 63°C 1 min, 72°C 1 min. Ran out 5 µl of product on a 1% agarose gel with EtBr.Samples in reaction D amplified, as they were supposed to. There was no amplification in reaction A, however there was amplification inreactions B and C. Tomorrow I will try the same thing again but use half the cDNA template for the reaction.
209

Uploaded with Skitch!
210
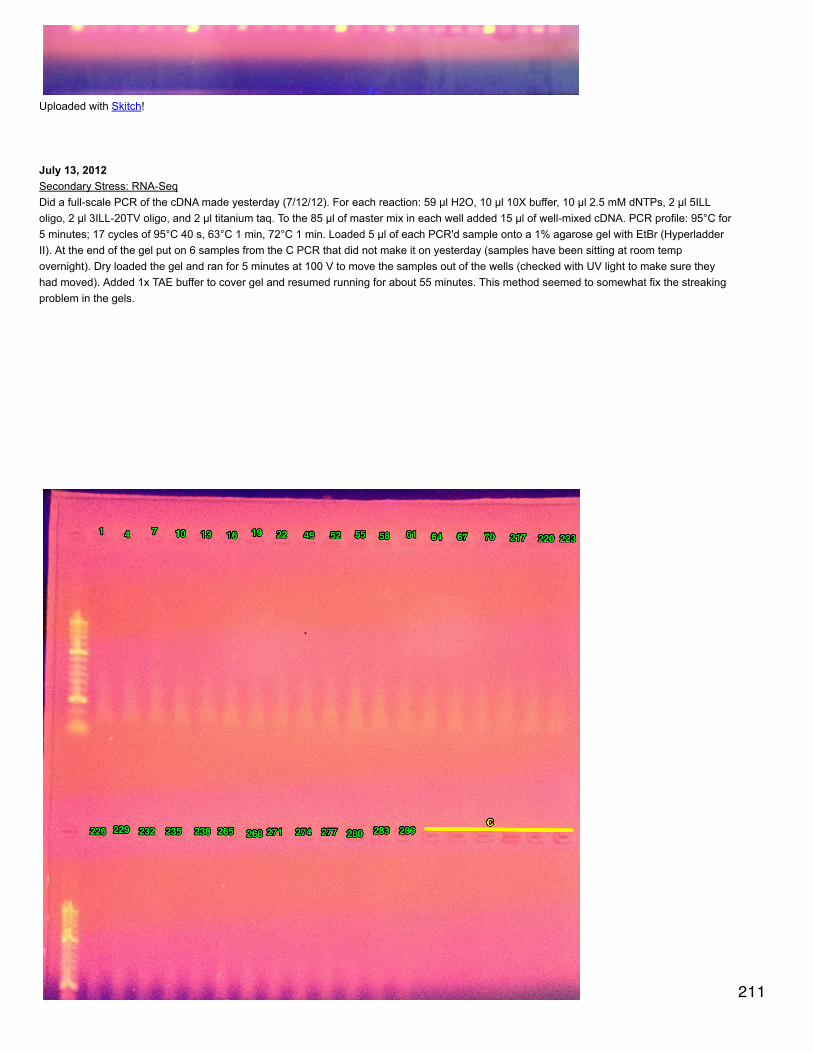
Uploaded with Skitch!
July 13, 2012Secondary Stress: RNA-SeqDid a full-scale PCR of the cDNA made yesterday (7/12/12). For each reaction: 59 µl H2O, 10 µl 10X buffer, 10 µl 2.5 mM dNTPs, 2 µl 5ILLoligo, 2 µl 3ILL-20TV oligo, and 2 µl titanium taq. To the 85 µl of master mix in each well added 15 µl of well-mixed cDNA. PCR profile: 95°C for5 minutes; 17 cycles of 95°C 40 s, 63°C 1 min, 72°C 1 min. Loaded 5 µl of each PCR'd sample onto a 1% agarose gel with EtBr (HyperladderII). At the end of the gel put on 6 samples from the C PCR that did not make it on yesterday (samples have been sitting at room tempovernight). Dry loaded the gel and ran for 5 minutes at 100 V to move the samples out of the wells (checked with UV light to make sure theyhad moved). Added 1x TAE buffer to cover gel and resumed running for about 55 minutes. This method seemed to somewhat fix the streakingproblem in the gels.
211
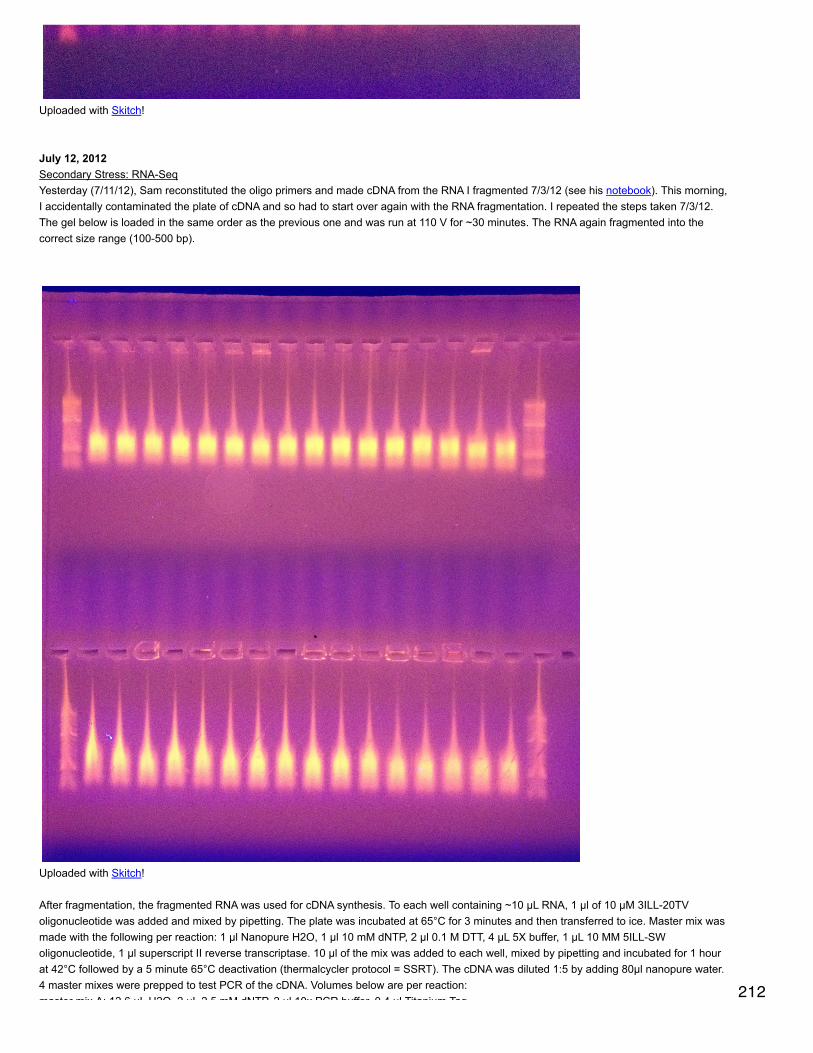
Uploaded with Skitch!
July 12, 2012Secondary Stress: RNA-SeqYesterday (7/11/12), Sam reconstituted the oligo primers and made cDNA from the RNA I fragmented 7/3/12 (see his notebook). This morning,I accidentally contaminated the plate of cDNA and so had to start over again with the RNA fragmentation. I repeated the steps taken 7/3/12.The gel below is loaded in the same order as the previous one and was run at 110 V for ~30 minutes. The RNA again fragmented into thecorrect size range (100-500 bp).
Uploaded with Skitch!
After fragmentation, the fragmented RNA was used for cDNA synthesis. To each well containing ~10 µL RNA, 1 µl of 10 µM 3ILL-20TVoligonucleotide was added and mixed by pipetting. The plate was incubated at 65°C for 3 minutes and then transferred to ice. Master mix wasmade with the following per reaction: 1 µl Nanopure H2O, 1 µl 10 mM dNTP, 2 µl 0.1 M DTT, 4 µL 5X buffer, 1 µL 10 MM 5ILL-SWoligonucleotide, 1 µl superscript II reverse transcriptase. 10 µl of the mix was added to each well, mixed by pipetting and incubated for 1 hourat 42°C followed by a 5 minute 65°C deactivation (thermalcycler protocol = SSRT). The cDNA was diluted 1:5 by adding 80µl nanopure water.4 master mixes were prepped to test PCR of the cDNA. Volumes below are per reaction:master mix A: 12.6 µL H2O, 2 µL 2.5 mM dNTP, 2 µl 10x PCR buffer, 0.4 µl Titanium Taq
212

master mix A: 12.6 µL H2O, 2 µL 2.5 mM dNTP, 2 µl 10x PCR buffer, 0.4 µl Titanium TaqB: 12.2 µL H2O, 2 µL 2.5 mM dNTP, 2 µl 10x PCR buffer, 0.4 µl 10 µM 5ILL oligo, 0.4 µl Titanium TaqC: 12.2 µL H2O, 2 µL 2.5 mM dNTP, 2 µl 10x PCR buffer, 0.4 µl 10 µM 3ILL-20TV oligo, 0.4 µl Titanium Taq
D: 11.8 µL H2O, 2 µL 2.5 mM dNTP, 2 µl 10x PCR buffer, 0.4 µl 10 µM 5ILL oligo, 0.4 µl 10 µM 3ILL-20TV oligo, 0.4 µl Titanium Taq
Each cDNA sample was amplified with each of these master mixes (18 µL master mix, 2 µL cDNA). A-C are on one plate in a thermalcyclerand D is on a separate plate in a different thermalcycler. Profile: 95°C 5 minutes; 17 cycles of 95°C 40s, 63°C 1 min, 72°C 1 min. After the 17cycles, loaded 5 µl of product on 1% agarose gels with EtBr (Hyperladder II). Did not have enough wells to load the last 10 samples frommaster mix C. Ran gels at 110 V for 40 minutes. Gels were loaded by column (see plate layout 7/3/12) and only the master mix signifier (A-D)is indicated on the gel photo. There was amplification in the ~100-500 bp range for master mix D only. none of the other master mixes showedamplification, although the first row on the second gel (mostly master mix A) ran too far. however, the samples in the other rows show noamplification.
Uploaded with Skitch!
213
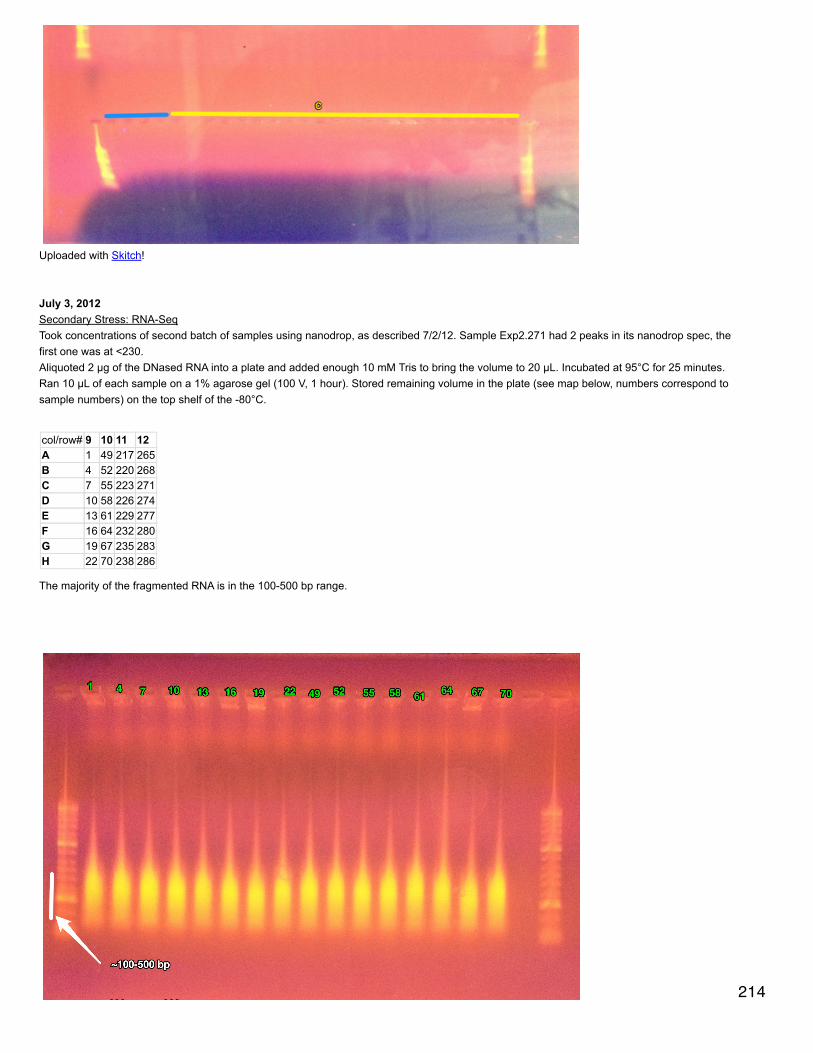
Uploaded with Skitch!
July 3, 2012Secondary Stress: RNA-SeqTook concentrations of second batch of samples using nanodrop, as described 7/2/12. Sample Exp2.271 had 2 peaks in its nanodrop spec, thefirst one was at <230.Aliquoted 2 µg of the DNased RNA into a plate and added enough 10 mM Tris to bring the volume to 20 µL. Incubated at 95°C for 25 minutes.Ran 10 µL of each sample on a 1% agarose gel (100 V, 1 hour). Stored remaining volume in the plate (see map below, numbers correspond tosample numbers) on the top shelf of the -80°C.
col/row# 9 10 11 12A 1 49 217 265B 4 52 220 268C 7 55 223 271D 10 58 226 274E 13 61 229 277F 16 64 232 280G 19 67 235 283H 22 70 238 286
The majority of the fragmented RNA is in the 100-500 bp range.
214
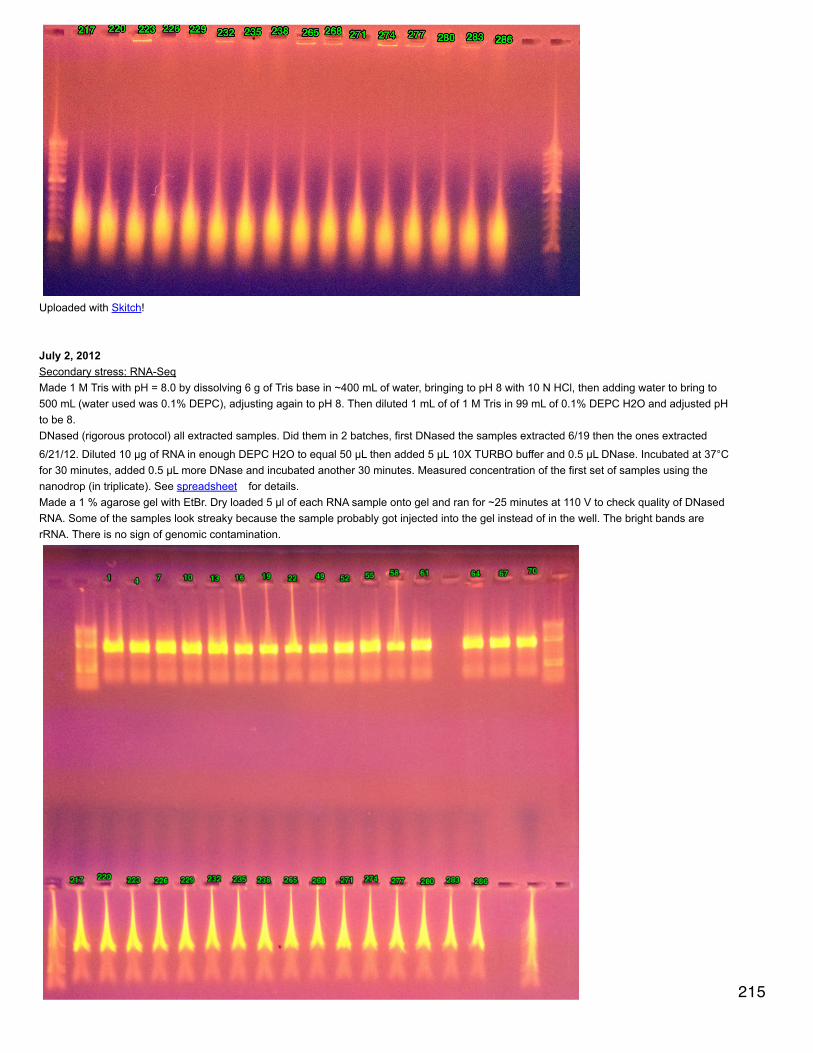
Uploaded with Skitch!
July 2, 2012Secondary stress: RNA-SeqMade 1 M Tris with pH = 8.0 by dissolving 6 g of Tris base in ~400 mL of water, bringing to pH 8 with 10 N HCl, then adding water to bring to500 mL (water used was 0.1% DEPC), adjusting again to pH 8. Then diluted 1 mL of of 1 M Tris in 99 mL of 0.1% DEPC H2O and adjusted pHto be 8.DNased (rigorous protocol) all extracted samples. Did them in 2 batches, first DNased the samples extracted 6/19 then the ones extracted
6/21/12. Diluted 10 µg of RNA in enough DEPC H2O to equal 50 µL then added 5 µL 10X TURBO buffer and 0.5 µL DNase. Incubated at 37°Cfor 30 minutes, added 0.5 µL more DNase and incubated another 30 minutes. Measured concentration of the first set of samples using thenanodrop (in triplicate). See spreadsheet for details.Made a 1 % agarose gel with EtBr. Dry loaded 5 µl of each RNA sample onto gel and ran for ~25 minutes at 110 V to check quality of DNasedRNA. Some of the samples look streaky because the sample probably got injected into the gel instead of in the well. The bright bands arerRNA. There is no sign of genomic contamination.
215
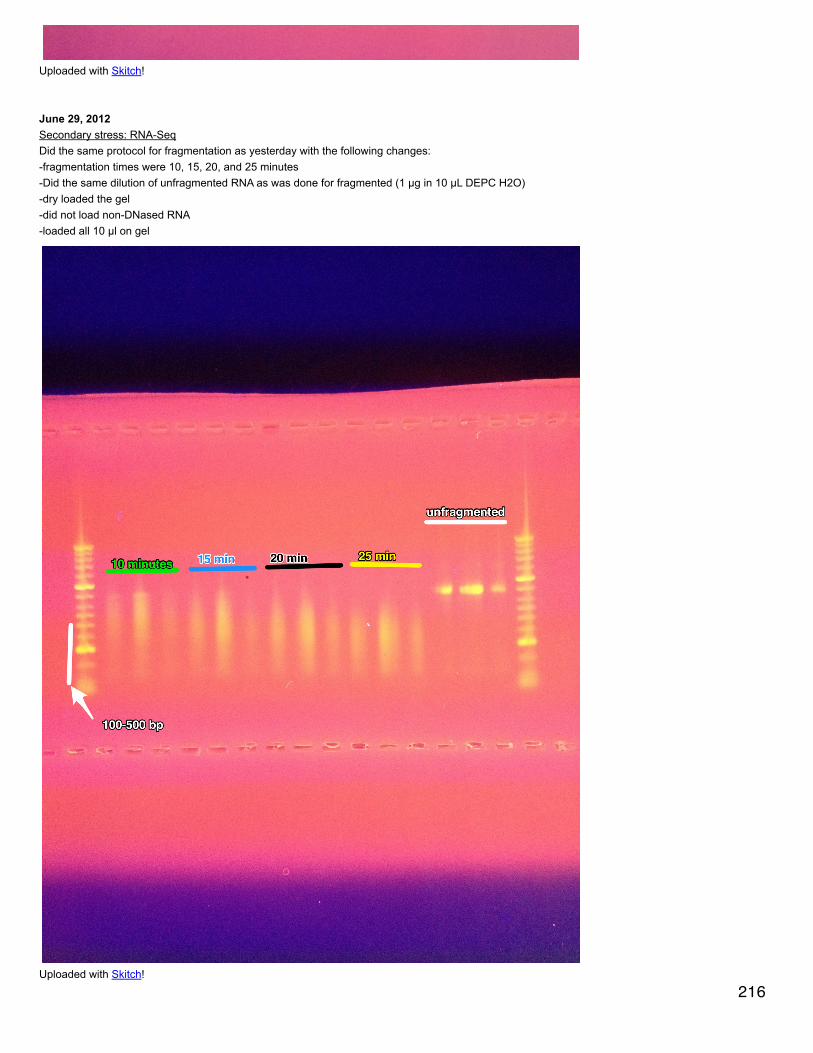
Uploaded with Skitch!
June 29, 2012Secondary stress: RNA-SeqDid the same protocol for fragmentation as yesterday with the following changes:-fragmentation times were 10, 15, 20, and 25 minutes-Did the same dilution of unfragmented RNA as was done for fragmented (1 µg in 10 µL DEPC H2O)-dry loaded the gel-did not load non-DNased RNA-loaded all 10 µl on gel
Uploaded with Skitch!
216

25 minutes seems to be the ideal fragmentation time since the majority of the RNA is between 100 and 500 bp.
Bioinformatics: Pinto Ab NGSThe previous file used for interspecies comparison of contigs with pinto abalone was redundant (multiple entries for each contig due to multipleGO annotations). Redid joining other species blastn files in Galaxy with pinto abalone annotated with just SPIDs (this file is non-redundant,Galaxy 151). Pinto abalone contigs that annotate with SPIDs with an evalue cut-off of 1e-5 = 1,351. D. rerio contigs that match at the e-valuecut-off to the contigs annotated with SPIDs at the cut-off are 625, 848 H. midae contigs, 797 C. gigas, 712 O. lurida, 557 P. fuctata, and 499 R.philippinarum. Redid Venn diagrams - numbers in black represent the contigs that uniquely match to that species' database, numbers in italicgray represent contigs that are represented by 2 or 3 databases. Also redid Venns for the Oly contigs so that numbers are now correct.OLY CONTIG MATCHES
Uploaded with Skitch!
PINTO CONTIG MATCHES
217
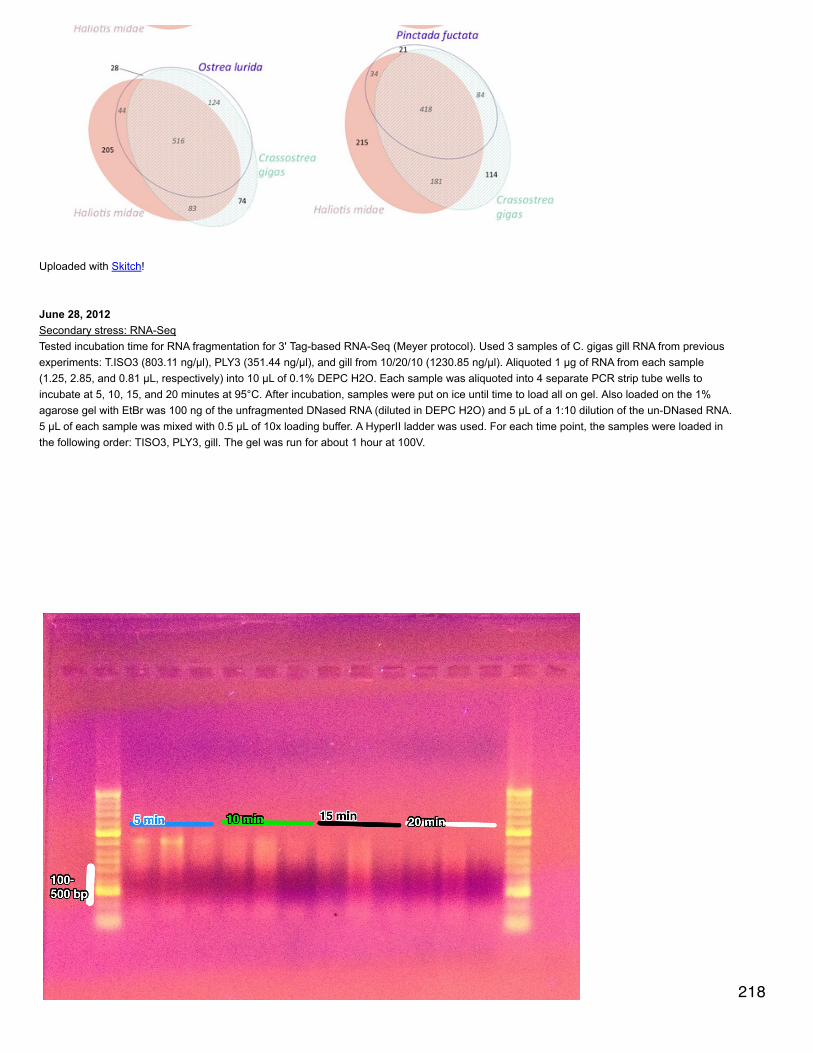
Uploaded with Skitch!
June 28, 2012Secondary stress: RNA-SeqTested incubation time for RNA fragmentation for 3' Tag-based RNA-Seq (Meyer protocol). Used 3 samples of C. gigas gill RNA from previousexperiments: T.ISO3 (803.11 ng/µl), PLY3 (351.44 ng/µl), and gill from 10/20/10 (1230.85 ng/µl). Aliquoted 1 µg of RNA from each sample(1.25, 2.85, and 0.81 µL, respectively) into 10 µL of 0.1% DEPC H2O. Each sample was aliquoted into 4 separate PCR strip tube wells toincubate at 5, 10, 15, and 20 minutes at 95°C. After incubation, samples were put on ice until time to load all on gel. Also loaded on the 1%agarose gel with EtBr was 100 ng of the unfragmented DNased RNA (diluted in DEPC H2O) and 5 µL of a 1:10 dilution of the un-DNased RNA.5 µL of each sample was mixed with 0.5 µL of 10x loading buffer. A HyperII ladder was used. For each time point, the samples were loaded inthe following order: TISO3, PLY3, gill. The gel was run for about 1 hour at 100V.
218
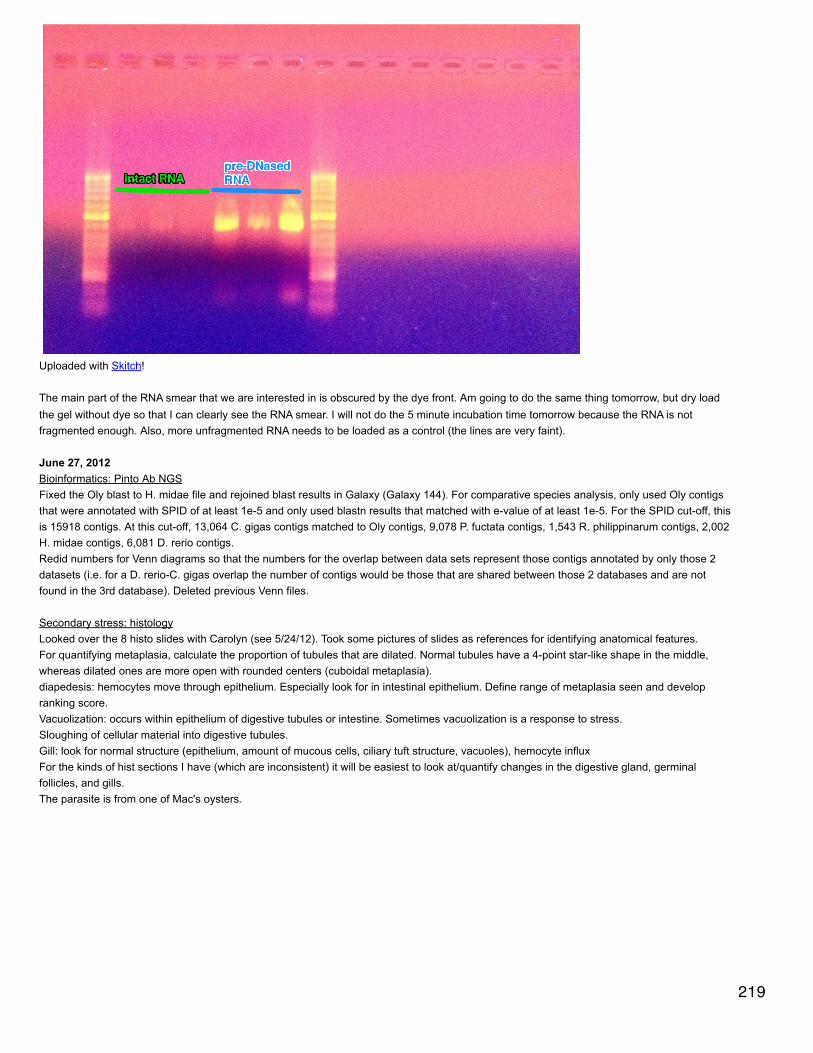
Uploaded with Skitch!
The main part of the RNA smear that we are interested in is obscured by the dye front. Am going to do the same thing tomorrow, but dry loadthe gel without dye so that I can clearly see the RNA smear. I will not do the 5 minute incubation time tomorrow because the RNA is notfragmented enough. Also, more unfragmented RNA needs to be loaded as a control (the lines are very faint).
June 27, 2012Bioinformatics: Pinto Ab NGSFixed the Oly blast to H. midae file and rejoined blast results in Galaxy (Galaxy 144). For comparative species analysis, only used Oly contigsthat were annotated with SPID of at least 1e-5 and only used blastn results that matched with e-value of at least 1e-5. For the SPID cut-off, thisis 15918 contigs. At this cut-off, 13,064 C. gigas contigs matched to Oly contigs, 9,078 P. fuctata contigs, 1,543 R. philippinarum contigs, 2,002H. midae contigs, 6,081 D. rerio contigs.Redid numbers for Venn diagrams so that the numbers for the overlap between data sets represent those contigs annotated by only those 2datasets (i.e. for a D. rerio-C. gigas overlap the number of contigs would be those that are shared between those 2 databases and are notfound in the 3rd database). Deleted previous Venn files.
Secondary stress: histologyLooked over the 8 histo slides with Carolyn (see 5/24/12). Took some pictures of slides as references for identifying anatomical features.For quantifying metaplasia, calculate the proportion of tubules that are dilated. Normal tubules have a 4-point star-like shape in the middle,whereas dilated ones are more open with rounded centers (cuboidal metaplasia).diapedesis: hemocytes move through epithelium. Especially look for in intestinal epithelium. Define range of metaplasia seen and developranking score.Vacuolization: occurs within epithelium of digestive tubules or intestine. Sometimes vacuolization is a response to stress.Sloughing of cellular material into digestive tubules.Gill: look for normal structure (epithelium, amount of mucous cells, ciliary tuft structure, vacuoles), hemocyte influxFor the kinds of hist sections I have (which are inconsistent) it will be easiest to look at/quantify changes in the digestive gland, germinalfollicles, and gills.The parasite is from one of Mac's oysters.
219

Uploaded with Skitch!
220

Uploaded with Skitch!
221

Uploaded with Skitch!
Uploaded with Skitch! 222
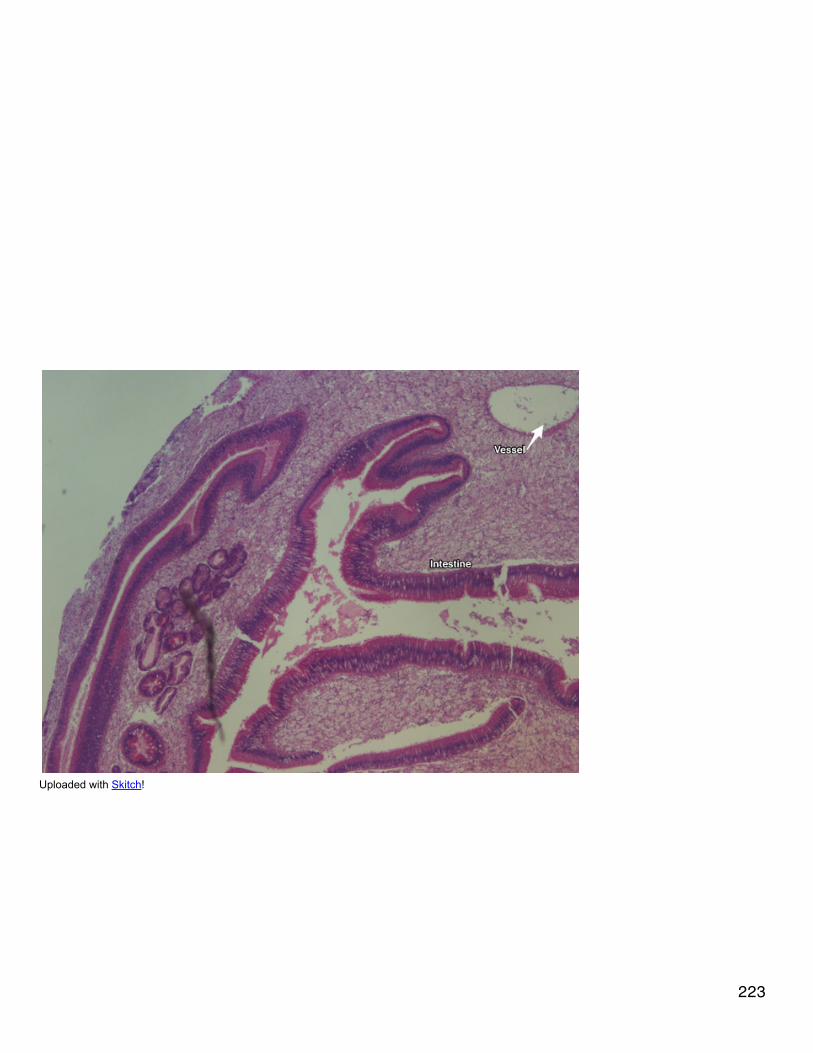
Uploaded with Skitch!
223

Uploaded with Skitch!
June 25, 2012Bioinformatics: Pinto Ab NGSMade alignments and phylogenetic trees using Geneious tree builder as described for 6/22/12. None of the sequences have been trimmed tothe exact same length for any of the trees. If a sequence was much shorter than the others in the alignment, it was excluded.v-type proton ATPasenot included: P. fuctata, H. kamtschatkanasequences reversed: R. philippinarum, H. midae
224

Uploaded with Skitch!
Transmembrane protein 85reversed sequences: D. rerio, O. lurida, H. midaeO. lurida may be closer to D. rerio in the tree because it is the only sequence that overlaps with Danio
225

Uploaded with Skitch!
Translation initiation factorreversed sequences: D. rerio, O. lurida, H. midaethe P. fuctata sequence is really too short to include, but the alignment did not work without it.
Uploaded with Skitch!
HSP90not included: R. philippinarum, P. fuctatareversed sequences: O. lurida
226

Uploaded with Skitch!
HSP83Alignment did not work
HSP82not included: H. kamtschatkana, P. fuctatareversed sequences: O. lurida
227
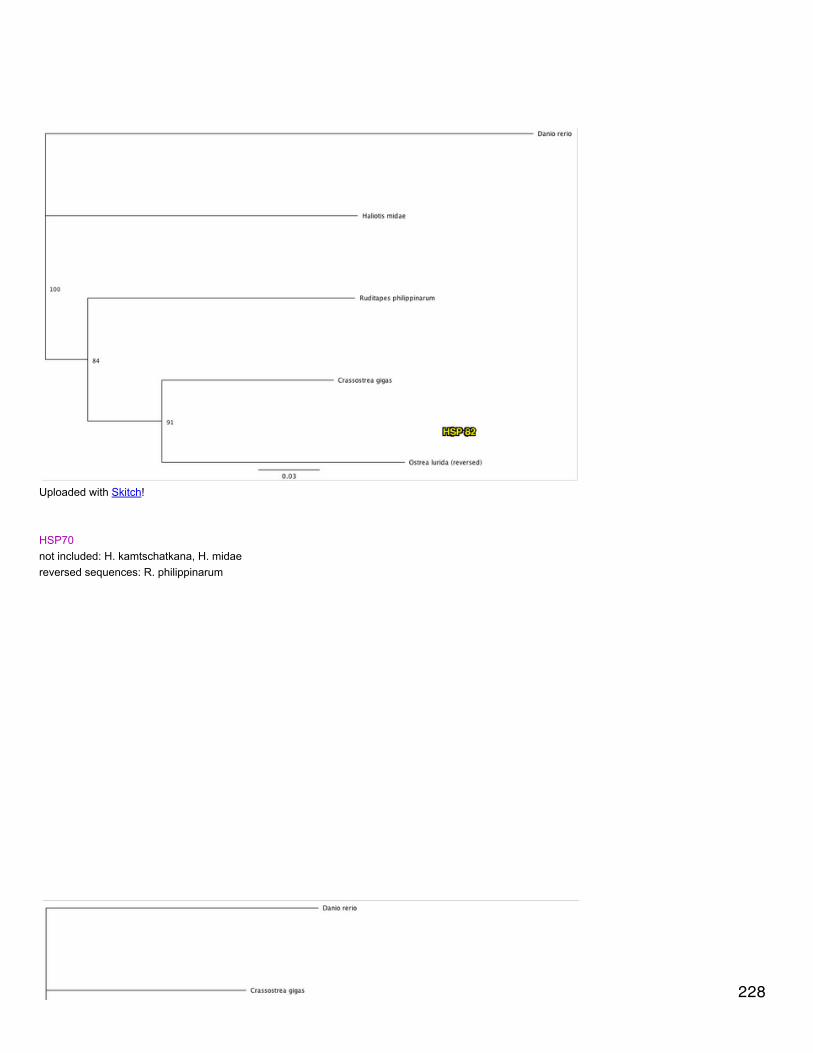
Uploaded with Skitch!
HSP70not included: H. kamtschatkana, H. midaereversed sequences: R. philippinarum
228

Uploaded with Skitch!
Cathepsin Lreversed sequences: H. kamtschatkana
229

Uploaded with Skitch!
GABA receptor associated proteinreversed sequences: H. midae
Uploaded with Skitch!
Redoing alignments and trees including all sequences, regardless of length, and then trimming alignments so that all sequences in tree are thesame length.
v-type proton ATPaseshortest sequence: H. kamtschatkana (221 nucleotides)
230
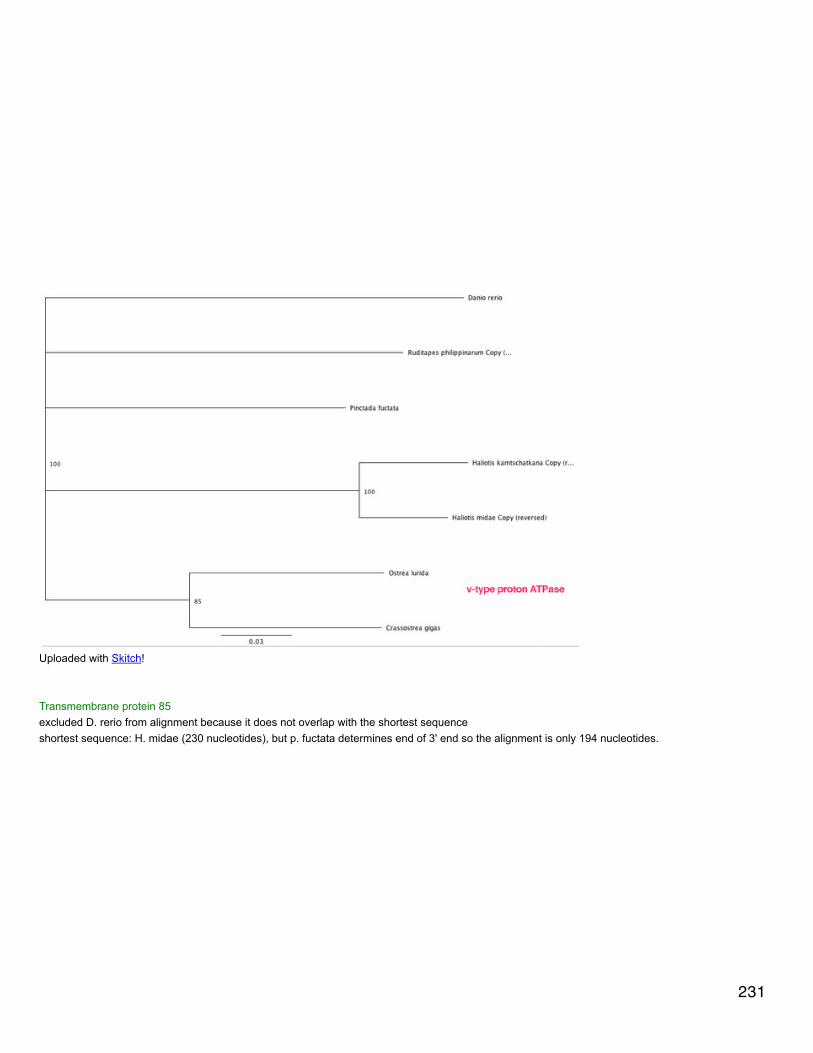
Uploaded with Skitch!
Transmembrane protein 85excluded D. rerio from alignment because it does not overlap with the shortest sequenceshortest sequence: H. midae (230 nucleotides), but p. fuctata determines end of 3' end so the alignment is only 194 nucleotides.
231
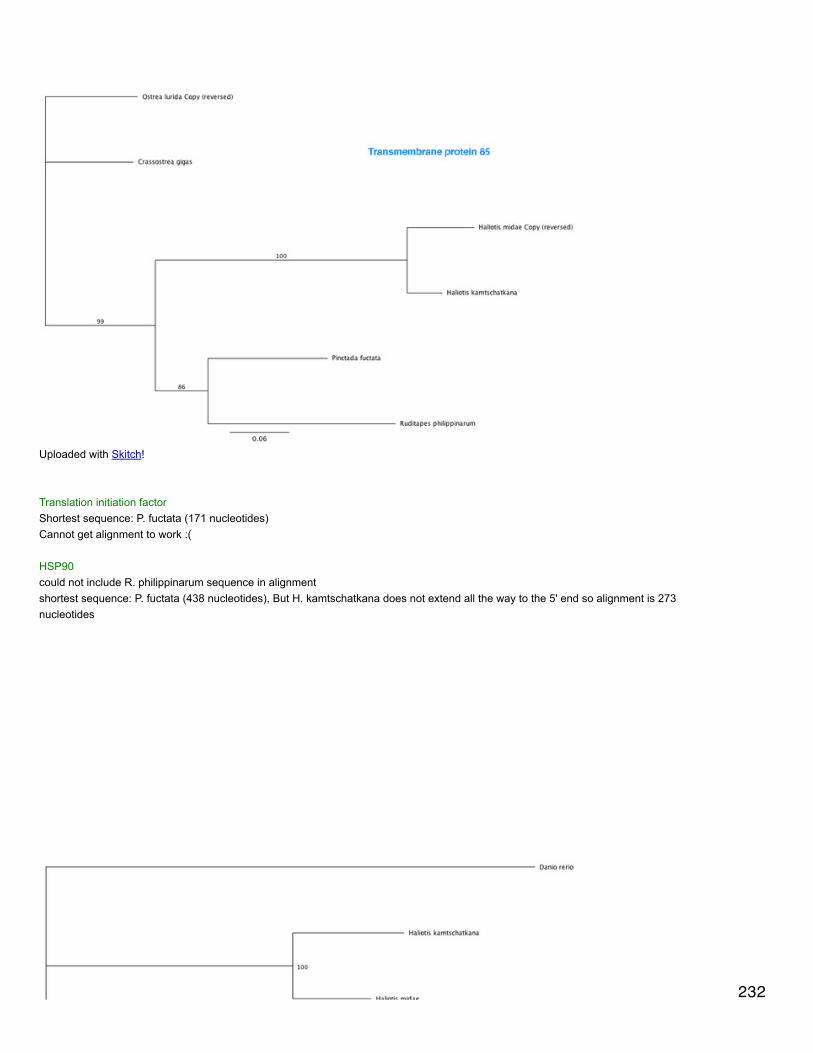
Uploaded with Skitch!
Translation initiation factorShortest sequence: P. fuctata (171 nucleotides)Cannot get alignment to work :(
HSP90could not include R. philippinarum sequence in alignmentshortest sequence: P. fuctata (438 nucleotides), But H. kamtschatkana does not extend all the way to the 5' end so alignment is 273nucleotides
232
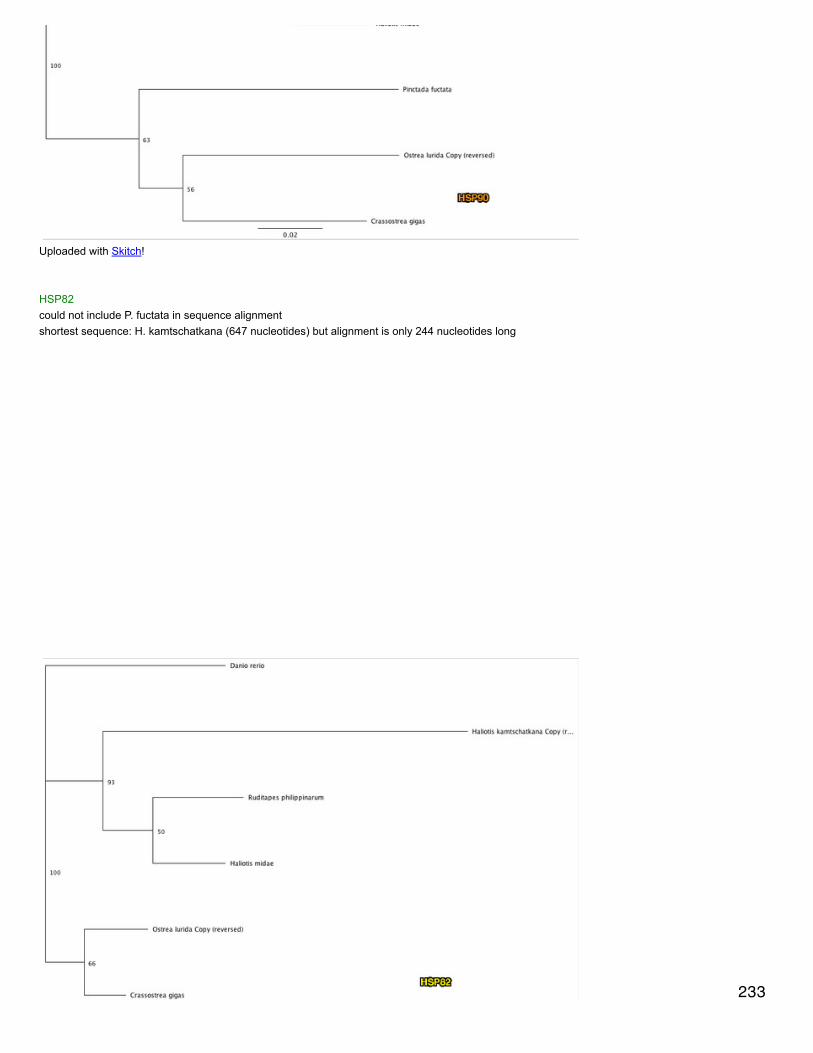
Uploaded with Skitch!
HSP82could not include P. fuctata in sequence alignmentshortest sequence: H. kamtschatkana (647 nucleotides) but alignment is only 244 nucleotides long
233
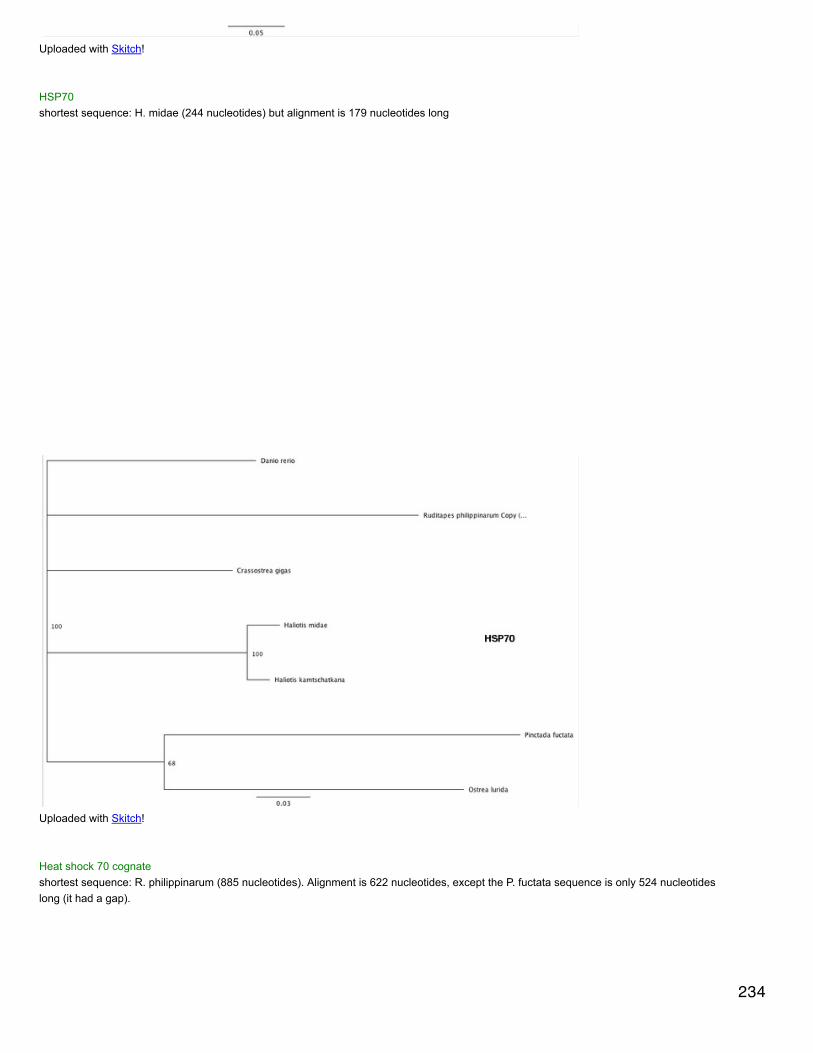
Uploaded with Skitch!
HSP70shortest sequence: H. midae (244 nucleotides) but alignment is 179 nucleotides long
Uploaded with Skitch!
Heat shock 70 cognate shortest sequence: R. philippinarum (885 nucleotides). Alignment is 622 nucleotides, except the P. fuctata sequence is only 524 nucleotideslong (it had a gap).
234

Uploaded with Skitch!
GABA receptor associated proteinshortest sequence: R. philippinarum (568 nucleotides), alignment is 512 nucleotides long.
235
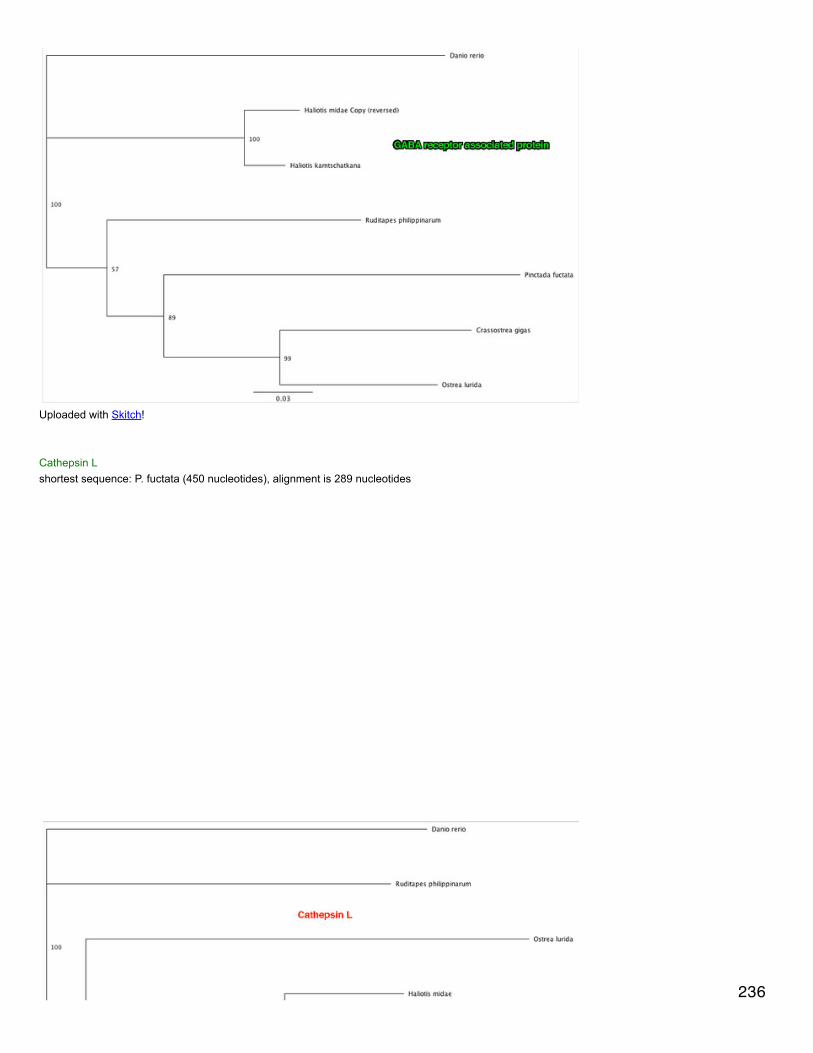
Uploaded with Skitch!
Cathepsin Lshortest sequence: P. fuctata (450 nucleotides), alignment is 289 nucleotides
236

Uploaded with Skitch!
June 22, 2012Bioinformatics: Pinto Ab NGSFor the genes of interest for phylogenetics (see 6/21/12) imported the sequences that matched the same pinto ab contig in blastn searches (infile Galaxy 141). The 7 sequences correspond to pinto ab, olympia oyster, c. gigas, pearl oyster, manila clam, H. midae, and D. rerio. In the firstalignment, the manila clam and O. lurida sequences did not align well, so I took the reverse complements of both and realigned for a betterresult. Alignments were made according to the following parameters: cost matrix 65% similarity (5.0/-4.0); gap open penalty 12; gap extensionpenalty 3; global alignment with free end gaps; automatically determine sequences' direction; 2 refinement iterations.
237
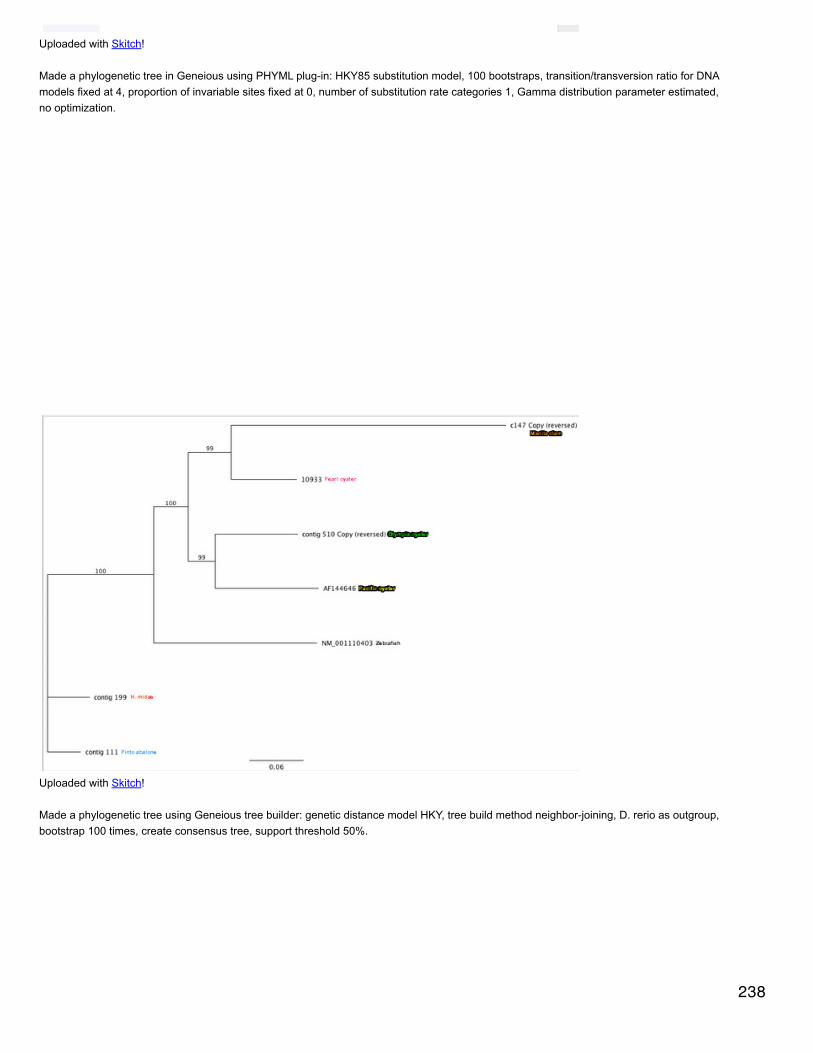
Uploaded with Skitch!
Made a phylogenetic tree in Geneious using PHYML plug-in: HKY85 substitution model, 100 bootstraps, transition/transversion ratio for DNAmodels fixed at 4, proportion of invariable sites fixed at 0, number of substitution rate categories 1, Gamma distribution parameter estimated,no optimization.
Uploaded with Skitch!
Made a phylogenetic tree using Geneious tree builder: genetic distance model HKY, tree build method neighbor-joining, D. rerio as outgroup,bootstrap 100 times, create consensus tree, support threshold 50%.
238

Uploaded with Skitch!
June 21, 2012Secondary stress: Exp2RNA extractions of 8 samples from experiment 2 - 103B (control) samples Exp2.265, 268, 271, 274, 277, 280, 283, 286. Followed sameprotocol as described 6/15/12. Sample Exp2.271 seems to be poor quality: the three 260/280 were 1.97, 1.99, and 1.96; the three 260/230were 1.78, 0.58, and 1.74.
Sample Tissue mass (g) Avg ng/µLExp2.265 0.09 841.1Exp2.268 0.10 790.8Exp2.271 0.06 639.8Exp2.274 0.08 637.1Exp2.277 0.04 364.2Exp2.280 0.09 744.4Exp2.283 0.06 564.2Exp2.286 0.05 405.2
Bioinformatics: Pinto Ab NGSNeed to choose genes to do phylogenetics. Created a list of contigs that are shared across all species data sets. Filtered according to e-value:only used contigs that were annotated by SPID at at least 1e-5 and that matched pinto abalone contigs with an e-value of at least 1e-5. Thisended up being 116 contigs once redundancies were removed due to multiple GO term matches. Those highlighted in green are from non-eukaryotes or plants and those in pink text are potentially interesting stress genes. 13 of the entries match to organisms that were probablycontaminating the RNA sample. Genes of interest for phylogenetics include: heat shock cognate 70, eukaryotic translation initiation factor, HSP90, HSP 82, HSP 83, HSP 70, v-type proton ATPase, transmembrane protein 85 (implicated in apoptosis).
June 19, 2012239
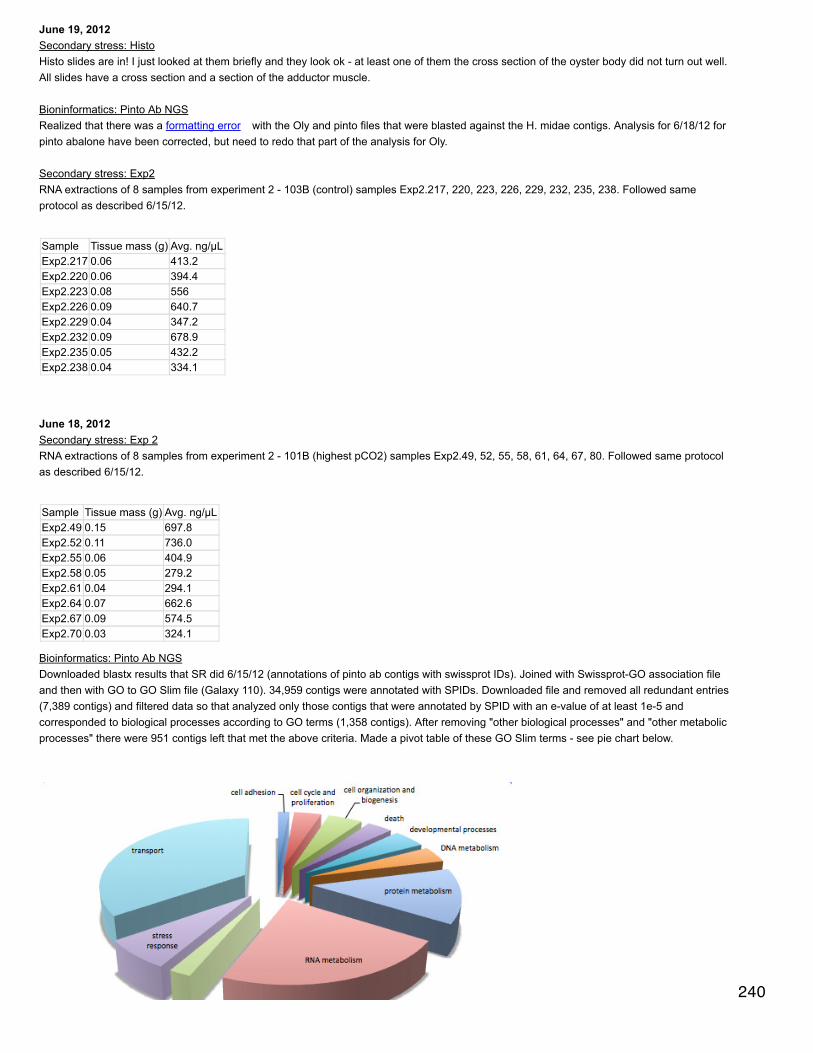
June 19, 2012Secondary stress: HistoHisto slides are in! I just looked at them briefly and they look ok - at least one of them the cross section of the oyster body did not turn out well.All slides have a cross section and a section of the adductor muscle.
Bioninformatics: Pinto Ab NGSRealized that there was a formatting error with the Oly and pinto files that were blasted against the H. midae contigs. Analysis for 6/18/12 forpinto abalone have been corrected, but need to redo that part of the analysis for Oly.
Secondary stress: Exp2RNA extractions of 8 samples from experiment 2 - 103B (control) samples Exp2.217, 220, 223, 226, 229, 232, 235, 238. Followed sameprotocol as described 6/15/12.
Sample Tissue mass (g) Avg. ng/µLExp2.217 0.06 413.2Exp2.220 0.06 394.4Exp2.223 0.08 556Exp2.226 0.09 640.7Exp2.229 0.04 347.2Exp2.232 0.09 678.9Exp2.235 0.05 432.2Exp2.238 0.04 334.1
June 18, 2012Secondary stress: Exp 2RNA extractions of 8 samples from experiment 2 - 101B (highest pCO2) samples Exp2.49, 52, 55, 58, 61, 64, 67, 80. Followed same protocolas described 6/15/12.
Sample Tissue mass (g) Avg. ng/µLExp2.49 0.15 697.8Exp2.52 0.11 736.0Exp2.55 0.06 404.9Exp2.58 0.05 279.2Exp2.61 0.04 294.1Exp2.64 0.07 662.6Exp2.67 0.09 574.5Exp2.70 0.03 324.1
Bioinformatics: Pinto Ab NGSDownloaded blastx results that SR did 6/15/12 (annotations of pinto ab contigs with swissprot IDs). Joined with Swissprot-GO association fileand then with GO to GO Slim file (Galaxy 110). 34,959 contigs were annotated with SPIDs. Downloaded file and removed all redundant entries(7,389 contigs) and filtered data so that analyzed only those contigs that were annotated by SPID with an e-value of at least 1e-5 andcorresponded to biological processes according to GO terms (1,358 contigs). After removing "other biological processes" and "other metabolicprocesses" there were 951 contigs left that met the above criteria. Made a pivot table of these GO Slim terms - see pie chart below.
240

Uploaded with Skitch!
Uploaded pinto contig file annotated with SPIDs and GO terms into Galaxy. Also uploaded blast results from blasting pinto contigs againstspecies specific databases C. gigas, H. midae, O. lurida, P. functata, Manila clam, and D. rerio. Joined the files in the order listed by matchingH. kam contig numbers. This final file is Galaxy 130. Deleted all entries with SPID annotation of pinto contig greater than 1e-5. 767 C. gigascontigs correspond to Pinto contigs with a blastn e-value of at least 1e-5, 945 H. midae contigs, 717 O. lurida contigs, 564 pearl oyster contigs,493 Manila clam contigs, and 614 Danio contigs.
June 15, 2012Secondary stress: Exp 2Did RNA extractions for 8 samples from experiment 2 (started 1/14/12 and sampled 2/11/12). Will begin sequencing effort with highest pCO2samples (101B), tubes numbered Exp2.1, 4, 7, 10, 13, 16, 19, 22, 49, 52, 55, 58, 61, 64, 67, 70 and control (103B), tubes numbered Exp2.217,220, 223, 226, 229, 232, 235, 238, 265, 268, 271, 274, 277, 280, 283, 286. All of these tubes are anterior gill samples. Today extracted RNAfrom Exp2, 1, 4, 7, 10, 13, 16, 19 and 22. Used Tri Reagent and followed manufacturer's protocol. Weighed the tissues before sampling. Onlyone (Exp2.13) was > 0.1 g, so I cut it in half and returned the remaining half to the -80C. All extractions had large pellets and to dissolve them Iadded 200 µl 0.1% DEPC H2O to the dried pellet and heated at 55°C for ~5 minutes. Pipetted multiple times to homogenize and measuredconcentration on the Nanodrop, 3 times for each sample (2 µL each time). Stored samples in gray plastic box in -80, labeled FHL OA:Secondary Stress Exp 2 RNA Box 1.
Sample Tissue mass (g) Avg. ng/µlExp2.1 0.09 721.1Exp2.4 0.08 576.6Exp2.7 0.12 822.5Exp2.10 0.11 772.2Exp2.13 0.20/2 857.7Exp2.16 0.08 602.4Exp2.19 0.03 240.5Exp2.22 0.09 654.3
Mukilteo water chemistry
Made new dye: 0.032 g m-cresol purple in 40 mL nanopure water. Added 5 µL 5N NaOH, which was a little too much (add 4 µL next time).Corrected with 1.5 µL HCl (conc. unknown) for A1/A2 of 1.71.Spec pH of 9 samples: source water from GHA, GHB, and Lab as well as 2 tanks from each. Did double dye addition for 3 samples tocontribute towards dye correction that will be done next week.
Bioinformatics: Pinto Ab NGSSR showed me how to do blastx on the cluster (he started one for pinto ab transcriptome). Once logged on to node 2, ncbi blast program is inthe main directory, so hit "ls" to get exact name. cd to ncbi blastx and then cd to bin (this brings you inside the directory). Run code as shown inSR's lab notebook for 6/15/12 .
June 14, 2012Bioinformatics: Pinto Ab NGSDownloaded SR's annotation of Oly contigs with swissprot ID and GO Slim terms (downloaded data set that has already been filtered toinclude e-values of at least 1e-5). This file includes 77,384 entries. Filtered so that it's just biological processes and then filtered so that onlyunique entries remained (19,191 entries). Made a pivot table of the remaining GO Slim terms. Removed "other metabolic processes" and"other biological processes" and 14,660 annotation remained. Made a pie chart.
241

Uploaded with Skitch!
Downloaded Oly SPID annotated file that has not been filtered for e-values less than 1e-5, edited so just contained contig name, SPID, and e-value and uploaded to Galaxy.Also uploaded Oly contigs blasted to species-specific databases: C. gigas, pearl oyster, Manila clam, Haliotis midae, and zebrafish.Joined datasets based on Oly contig number in the order listed above. Every new blast result dataset is joined with the original Oly dataset(always keep original entry even if it doesn't match). File for Oly joined to C. gigas is Galaxy 103, with added pearl oyster is Galaxy 104, withadded ruphi base is galaxy 105, with added H. midae is galaxy 106, and with added zebrafish is galaxy 107.Within excel, filtered out blast hits so that only those of at least 1e-5 remain. For Oly contigs matching SPIDs, this is 15,918 entries. For Olycontigs annotated by C. gigas contigs = 13,064 entries, annotated by pearl oyster = 9,078, Manila clam = 1, 543, H. midae = 1,976, and Danio= 6, 081.Made Venn diagrams of gigas vs. pearl vs. clam annotations of Oly contigs; of gigas vs. pearl vs. H. midae; and of gigas vs. pearl vs. Danio.For each diagram the order that the taxa are listed in correspond to a, b, and c (pink, green, blue). Below is the Venn for the gigas vs. pearl vs.Danio.
Uploaded with Skitch!
June 13, 2012Bioinformatics: Pinto Ab NGSSR did more blasts of pinto ab against the oly NGS data, zebrafish, rufibase, pearl oyster, C. gigas, and H. midae. See his notebook Pinto Ab- Blast 6/13/12.Oly assembly herePinto assembly hereOly swiss prot and GO annotations here 242
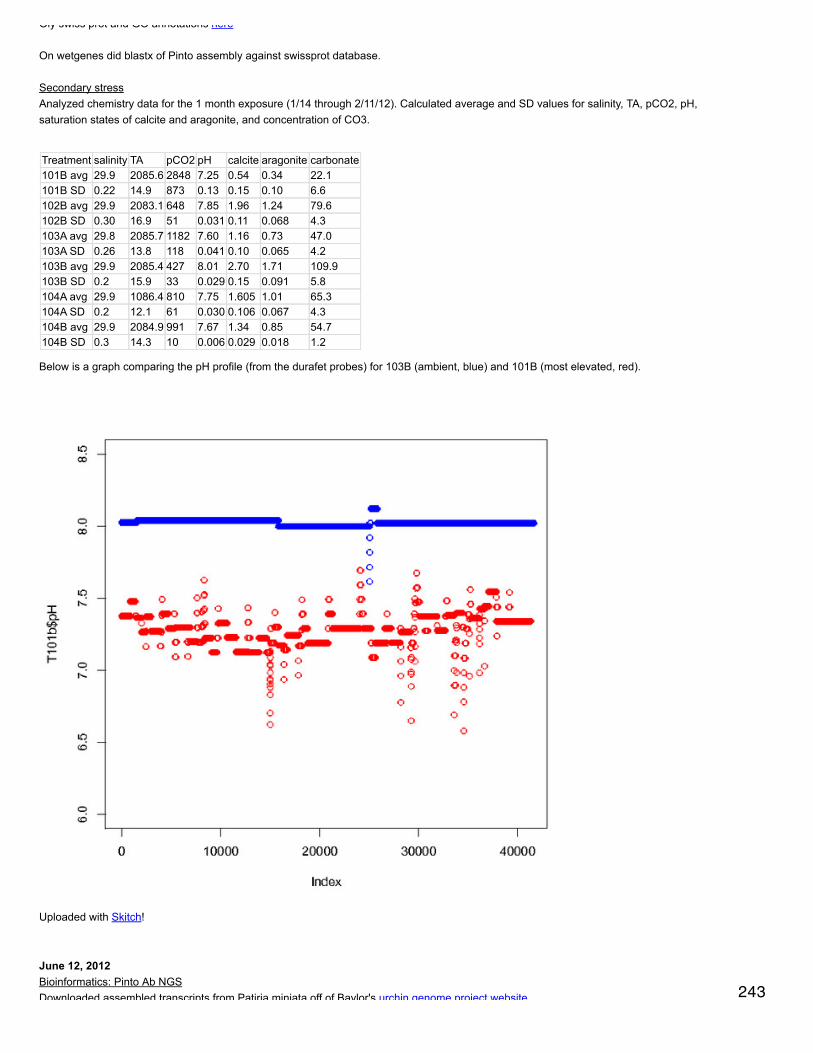
Oly swiss prot and GO annotations here
On wetgenes did blastx of Pinto assembly against swissprot database.
Secondary stressAnalyzed chemistry data for the 1 month exposure (1/14 through 2/11/12). Calculated average and SD values for salinity, TA, pCO2, pH,saturation states of calcite and aragonite, and concentration of CO3.
Treatment salinity TA pCO2 pH calcite aragonite carbonate101B avg 29.9 2085.6 2848 7.25 0.54 0.34 22.1101B SD 0.22 14.9 873 0.13 0.15 0.10 6.6102B avg 29.9 2083.1 648 7.85 1.96 1.24 79.6102B SD 0.30 16.9 51 0.031 0.11 0.068 4.3103A avg 29.8 2085.7 1182 7.60 1.16 0.73 47.0103A SD 0.26 13.8 118 0.041 0.10 0.065 4.2103B avg 29.9 2085.4 427 8.01 2.70 1.71 109.9103B SD 0.2 15.9 33 0.029 0.15 0.091 5.8104A avg 29.9 1086.4 810 7.75 1.605 1.01 65.3104A SD 0.2 12.1 61 0.030 0.106 0.067 4.3104B avg 29.9 2084.9 991 7.67 1.34 0.85 54.7104B SD 0.3 14.3 10 0.006 0.029 0.018 1.2
Below is a graph comparing the pH profile (from the durafet probes) for 103B (ambient, blue) and 101B (most elevated, red).
Uploaded with Skitch!
June 12, 2012Bioinformatics: Pinto Ab NGSDownloaded assembled transcripts from Patiria miniata off of Baylor's urchin genome project website . 243
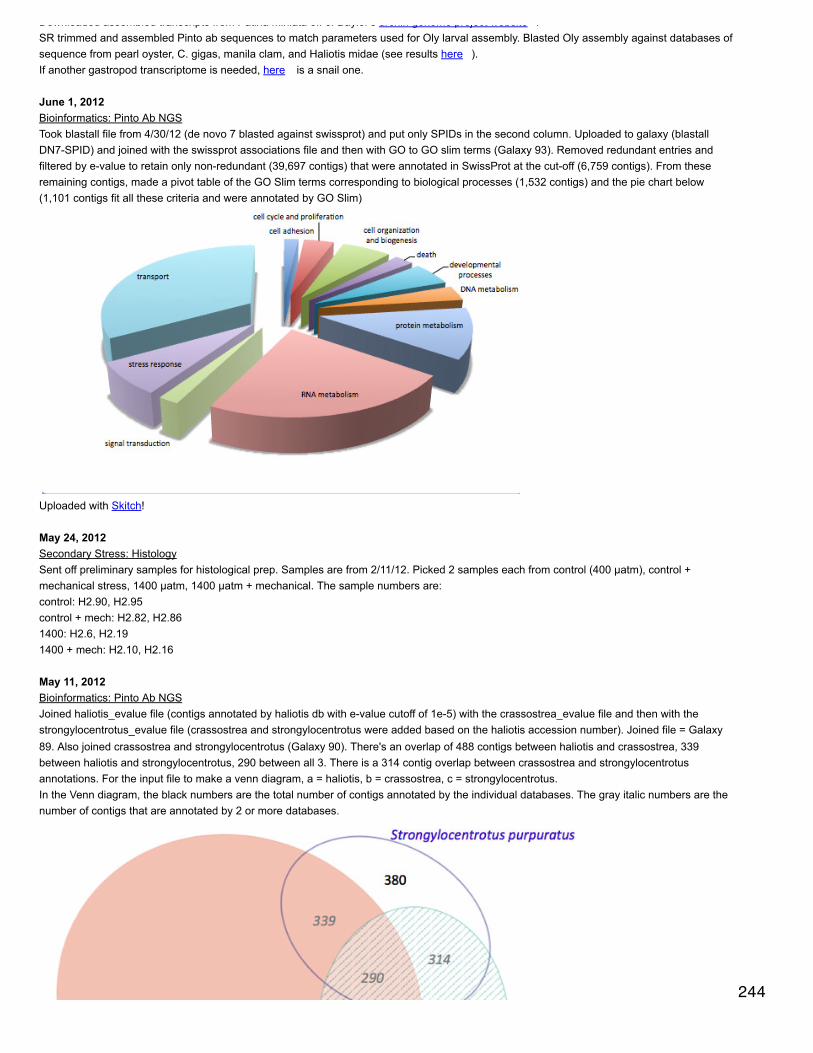
Downloaded assembled transcripts from Patiria miniata off of Baylor's urchin genome project website .SR trimmed and assembled Pinto ab sequences to match parameters used for Oly larval assembly. Blasted Oly assembly against databases ofsequence from pearl oyster, C. gigas, manila clam, and Haliotis midae (see results here ).If another gastropod transcriptome is needed, here is a snail one.
June 1, 2012Bioinformatics: Pinto Ab NGSTook blastall file from 4/30/12 (de novo 7 blasted against swissprot) and put only SPIDs in the second column. Uploaded to galaxy (blastallDN7-SPID) and joined with the swissprot associations file and then with GO to GO slim terms (Galaxy 93). Removed redundant entries andfiltered by e-value to retain only non-redundant (39,697 contigs) that were annotated in SwissProt at the cut-off (6,759 contigs). From theseremaining contigs, made a pivot table of the GO Slim terms corresponding to biological processes (1,532 contigs) and the pie chart below(1,101 contigs fit all these criteria and were annotated by GO Slim)
Uploaded with Skitch!
May 24, 2012Secondary Stress: HistologySent off preliminary samples for histological prep. Samples are from 2/11/12. Picked 2 samples each from control (400 µatm), control +mechanical stress, 1400 µatm, 1400 µatm + mechanical. The sample numbers are:control: H2.90, H2.95control + mech: H2.82, H2.861400: H2.6, H2.191400 + mech: H2.10, H2.16
May 11, 2012Bioinformatics: Pinto Ab NGSJoined haliotis_evalue file (contigs annotated by haliotis db with e-value cutoff of 1e-5) with the crassostrea_evalue file and then with thestrongylocentrotus_evalue file (crassostrea and strongylocentrotus were added based on the haliotis accession number). Joined file = Galaxy89. Also joined crassostrea and strongylocentrotus (Galaxy 90). There's an overlap of 488 contigs between haliotis and crassostrea, 339between haliotis and strongylocentrotus, 290 between all 3. There is a 314 contig overlap between crassostrea and strongylocentrotusannotations. For the input file to make a venn diagram, a = haliotis, b = crassostrea, c = strongylocentrotus.In the Venn diagram, the black numbers are the total number of contigs annotated by the individual databases. The gray italic numbers are thenumber of contigs that are annotated by 2 or more databases.
244
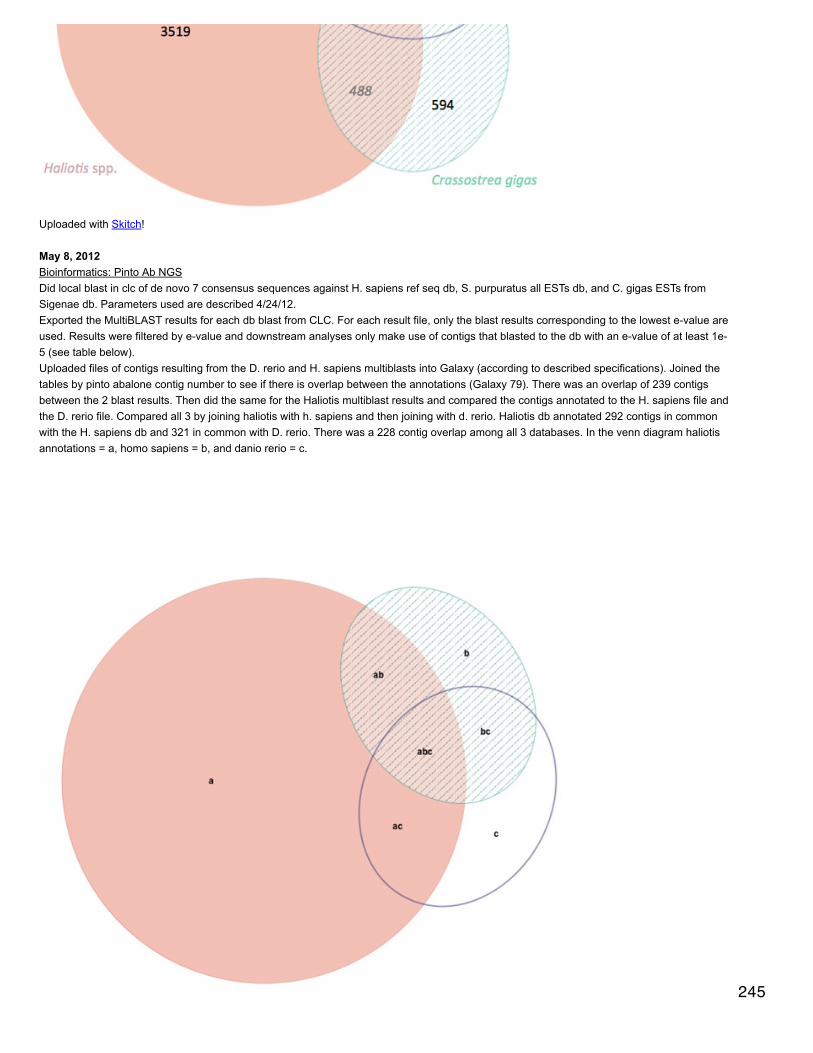
Uploaded with Skitch!
May 8, 2012Bioinformatics: Pinto Ab NGSDid local blast in clc of de novo 7 consensus sequences against H. sapiens ref seq db, S. purpuratus all ESTs db, and C. gigas ESTs fromSigenae db. Parameters used are described 4/24/12.Exported the MultiBLAST results for each db blast from CLC. For each result file, only the blast results corresponding to the lowest e-value areused. Results were filtered by e-value and downstream analyses only make use of contigs that blasted to the db with an e-value of at least 1e-5 (see table below).Uploaded files of contigs resulting from the D. rerio and H. sapiens multiblasts into Galaxy (according to described specifications). Joined thetables by pinto abalone contig number to see if there is overlap between the annotations (Galaxy 79). There was an overlap of 239 contigsbetween the 2 blast results. Then did the same for the Haliotis multiblast results and compared the contigs annotated to the H. sapiens file andthe D. rerio file. Compared all 3 by joining haliotis with h. sapiens and then joining with d. rerio. Haliotis db annotated 292 contigs in commonwith the H. sapiens db and 321 in common with D. rerio. There was a 228 contig overlap among all 3 databases. In the venn diagram haliotisannotations = a, homo sapiens = b, and danio rerio = c.
245

Uploaded with Skitch!
Database Totalannotations withevaluecutoffH. sapiens 7204 332D. rerio 8236 349S. purpuratus 7697 380C. gigas 8742 594Haliotis 8857 3519
May 7, 2012Mukilteo water chemistryDid spec pH for source water for lab and GHB. Sammi had made the dye 5/5/12. Will do dye correction tomorrow.
May 3, 2012
Ceramide: vibrio gene expressionRedid t-tests in R comparing expression in control and treatment. ACMase is still differentially expressed (p<0.05), but 3KDSR is alsodifferentially expressed. Using a boxcox plot to check for skewness, ACMase and CgT needed to be transformed (reciprocal transformationand squareroot, respectively). T-tests after data transformations resulted in the same relationship between control and exposed expression:significantly different for ACMase and not different for CgT.
Bioinformatics: Pinto Ab NGSI helped Miranda and Selina design primers for genes involved in the immune response and calcification in the pinto abalone. We found geneshomologous to ferritin, perlinhibin, proteasome subunit alpha, and sodium bicarbonate transporter in the NGS data and designed primers for allof them. I'm going to design EF1a primers for them. I downloaded Haliotis EF1a mRNA from NCBI: H. rufescencs (DQ087488), H. tuberculata(FN566842), H. diversicolor (EF553516), and H. diversicolor (AY953390). Imported sequenced to geneious and assembled (all 4 assembledtogether). Made a consensus sequence from the assembly. Imported consensus sequences from de novo 7 assembly into the "Haliotis" folder.The best hit was contig 7244, which covered the entire 1610 of the consensus sequence from the assembled multi-haliotis EF1a. The designedprimers overlap with the area of contig 7244 that aligns with the haliotis consensus EF1a.
May 2, 2012Bioinformatics: Pinto Ab NGSJoined MultiBLAST tables with SPIDS with GO and GO slim terms in Galaxy for de novo 7 and SR assemblies of pinto ab data. Exported thesetables and made pivot tables of the GOSlim terms for just biological processes (have not tried to remove redundancy or filter for e-value,except for the original MultiBLAST in clc with a cutoff of e=1e-5). The SR assembly had 4077 contigs annotated to GO Slim and 2913 onceother biological and metabolic processes were removed. 12 Go Slim categories are represented in the data.The de novo 7 assembly had 4366 contigs, 3152 without other biological and metabolic processes. 12 GO Slim categories are represented.The de novo 7 assembly had more contigs in all categories (compared to SR's assembly) except for cell-cell signaling and death (see tablebelow).
denovo7 SRcelladhesion 90 80cell cycle and proliferation 110 104cell organizationandbiogenesis 240 232cell-cell signaling 2 2death 45 52developmental processes 250 199DNA metabolism 144 126protein metabolism 254 246RNA metabolism 776 740signal transduction 299 215stress response 213 210transport 729 707
April 30, 2012Bioinformatics: Pinto Ab NGSDownloaded blastall results from wetgenes. Uploaded blastall files and MultiBLAST files (only e-value less than or equal to 1e-5 for the latter)
246

Downloaded blastall results from wetgenes. Uploaded blastall files and MultiBLAST files (only e-value less than or equal to 1e-5 for the latter)into Glalaxy. Joined blastall results with MultiBLAST results for de novo 7 and SR assembly, as described 4/16/12.For de novo 7: 8281 contigs from the assembly were annotated with SPIDs in blastall. 561 of the contigs from the significant MultiBLAST filedid not match to contigs annotated by SPIDs in blastall.For SR assembly: 7712 contigs from the assembly were annotated with SPIDs in blastall. 469 of the contigs from the significant MultiBLASTdid not match to contigs annotated by SPIDs in blastall.
April 27, 2012Bioinformatics: Pinto Ab NGSResults from blast of SR's assembly to Haliotis db (4/24/12): 8291 sequences matched to the db.To compare performance of the 2 assemblies (SR's and de novo 7), exported consensus sequences and uploaded into wetgenes to doblastalls (blastx) against swissprot. The results will be uploaded into Galaxy and joined with the contig names that correspond to a blast hit(against the Haliotis db) with an evalue of at least 1e-5. This will show the breadth of coverage achieved by both assemblies. Will also comparethe number of contigs returned by each one (total and corresponding to an evalue of at least 1e-5).
Total contigs = contigs assembled in de novo assemblyContigs @ 1e-5 = Contigs that matched to ESTs in Haliotis db with an e-value of at least 1e-5#Go Slim Categories = the number of unique categories that correspond to contigs with an e-value of at least 1e-5
Assembly TotalContigs Contigs@1e-5 #GoSlimCategoriesETS de novo 7 8857 3519 see 5/2SR 8291 3244 see 5/2
April 25, 2012Bioinformatics: Pinto Ab NGSThe blasts didn't work from yesterday, so redid them. Most contigs (n=9,294) matched to contigs in the Haliotis and D. rerio databases (n=8857 and 8236, respectively). Exported blast results.Blastn with same parameters described 4/24/12 of pinto ab consensus seqs from de novo 7 against databases of H. sapiens RefSeq and C.gigas Sigenae contigs and S. purpuratus contigs from NCBI. (these failed, will try again later)
Downloaded SR's assembly (see his notebook, Pinto Ab data analysis for file): Abalone_pinto_v5beta_8673.fa. This assembly assembled >75million reads to form 8673 contigs. did a local blast against the all Haliotis db. Blast parameters were the same as described 4/24/12.
April 24, 2012Bioinformatics: Pinto Ab NGSFor de novo assembly 7, ~17.5 million reads matched to make 9,294 contigs. This is one of the best results yet (except for de novo 3, but themin contig length was only 100 bases for that one).Downloaded SR's file of assembled all Haliotis ESTs from GenBank (file = Haliotis_comboNCBI_cdhit selection.fa) and uploaded as adatabase for local blast searches to clc.Extracted consensus sequences from de novo assembly 7. Did a blastn against the Haliotis database: low complexity, expect 1, word size 11,no. of processors 2, match 1, mismatch -3, gap cost open 5 and extension 2, create overview blast table. Did the same to start a blast searchagainst Danio rerio RefSeq database.
April 23, 2012Bioinformatics: Pinto Ab NGSFor de novo assembly 6, ~17 million reads were assembled to make 9,296 contigs.De novo assembly 7: mismatch cost = 1, limit = 7, no fast ungapped alignment, insertion cost = 3, deletion cost = 3, vote for conflict resolution,ignore non-specific matches, min contig length = 200, map reads back to contigs.
April 20, 2012Bioinformatics: Pinto Ab NGSMade local blast db on galaxy of all H. sapiens ESTs downloaded yesterday.Summary of results for de novo assemblies 3 and 4 (done 4/19/12):
Reads Matched Notmatched Contigsdenovo3 94,777,799 25,459,866 69,317,933 26,942denovo4 94,777,799 13,541,271 81,236,528 9,294
Started new de novo (de novo 5) with mismatch cost = 2, limit = 8, no fast ungapped alignment, insertion cost = 3, deletion cost = 3, vote forconflict resolution, ignore non-specific matches, min contig length = 200, map reads back to contigs. Only ~13 million reads assembled, but itlooks like the limit was set at 1, not 8. Started a new de novo (de novo 6) with the parameters that should have been used for de novo 5. 247

looks like the limit was set at 1, not 8. Started a new de novo (de novo 6) with the parameters that should have been used for de novo 5.
Downloaded Haliotis midae transcriptome (referenced here ) as well as transcriptomic data for larval snail (paper and data on NCBI).Possible D. rerio transcriptomic data found in this paper and here on NCBI. For information on assembled sea star transcriptome, seehere .Downloaded H. sapiens and D. rerio rna.fna files from the RefSeq server .Made local BLAST databases of the H. sapiens and D. rerio RefSeq data.SR downloaded all Haliotis ESTs and mRNA and is making a non-redundant db.
April 19, 2012Bioinformatics: Pinto Ab NGSPrevious download of H. sapiens did not work so reinitiated download of all H. sapiens ESTs from GenBank.New de novo assemblies of trimmed pinto reads since the de novo previously used assembled relatively few reads and we'd like to capturemore of the data. For de novo 3: mismatch cost=1, limit=6, fast ungapped alignment, conflict resolution by voting, ignore non-specific matches,min contig length = 100, map reads back to contigs and create a summary report. For de novo assembly 4, used all the same parameters as 3except mismatch cost = 1, limit = 1, and min contig length = 200.SR previously did an assembly of this data and got better results using the following parameters:
Uploaded with Skitch!
April 15, 2012Bioinformatics: Pinto Ab NGSUploaded best e-value contig numbers to Galaxy for annotations by C. gigas and S. purpuratus datasets. Joined files to find overlaps ofannotations. The light blue represents contigs annotated by C. gigas and dark green are those annotated by S. purpuratus (gray is overlap).
248
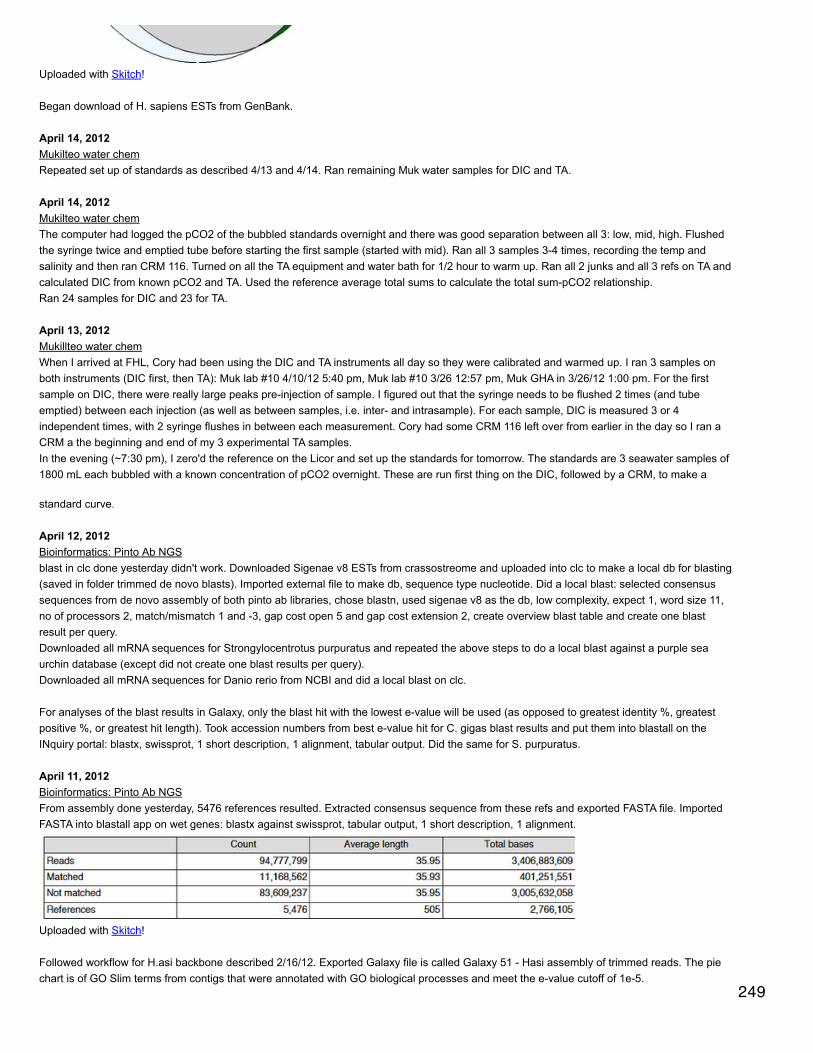
Uploaded with Skitch!
Began download of H. sapiens ESTs from GenBank.
April 14, 2012Mukilteo water chemRepeated set up of standards as described 4/13 and 4/14. Ran remaining Muk water samples for DIC and TA.
April 14, 2012Mukilteo water chemThe computer had logged the pCO2 of the bubbled standards overnight and there was good separation between all 3: low, mid, high. Flushedthe syringe twice and emptied tube before starting the first sample (started with mid). Ran all 3 samples 3-4 times, recording the temp andsalinity and then ran CRM 116. Turned on all the TA equipment and water bath for 1/2 hour to warm up. Ran all 2 junks and all 3 refs on TA andcalculated DIC from known pCO2 and TA. Used the reference average total sums to calculate the total sum-pCO2 relationship.Ran 24 samples for DIC and 23 for TA.
April 13, 2012Mukillteo water chemWhen I arrived at FHL, Cory had been using the DIC and TA instruments all day so they were calibrated and warmed up. I ran 3 samples onboth instruments (DIC first, then TA): Muk lab #10 4/10/12 5:40 pm, Muk lab #10 3/26 12:57 pm, Muk GHA in 3/26/12 1:00 pm. For the firstsample on DIC, there were really large peaks pre-injection of sample. I figured out that the syringe needs to be flushed 2 times (and tubeemptied) between each injection (as well as between samples, i.e. inter- and intrasample). For each sample, DIC is measured 3 or 4independent times, with 2 syringe flushes in between each measurement. Cory had some CRM 116 left over from earlier in the day so I ran aCRM a the beginning and end of my 3 experimental TA samples.In the evening (~7:30 pm), I zero'd the reference on the Licor and set up the standards for tomorrow. The standards are 3 seawater samples of1800 mL each bubbled with a known concentration of pCO2 overnight. These are run first thing on the DIC, followed by a CRM, to make a
standard curve.
April 12, 2012Bioinformatics: Pinto Ab NGSblast in clc done yesterday didn't work. Downloaded Sigenae v8 ESTs from crassostreome and uploaded into clc to make a local db for blasting(saved in folder trimmed de novo blasts). Imported external file to make db, sequence type nucleotide. Did a local blast: selected consensussequences from de novo assembly of both pinto ab libraries, chose blastn, used sigenae v8 as the db, low complexity, expect 1, word size 11,no of processors 2, match/mismatch 1 and -3, gap cost open 5 and gap cost extension 2, create overview blast table and create one blastresult per query.Downloaded all mRNA sequences for Strongylocentrotus purpuratus and repeated the above steps to do a local blast against a purple seaurchin database (except did not create one blast results per query).Downloaded all mRNA sequences for Danio rerio from NCBI and did a local blast on clc.
For analyses of the blast results in Galaxy, only the blast hit with the lowest e-value will be used (as opposed to greatest identity %, greatestpositive %, or greatest hit length). Took accession numbers from best e-value hit for C. gigas blast results and put them into blastall on theINquiry portal: blastx, swissprot, 1 short description, 1 alignment, tabular output. Did the same for S. purpuratus.
April 11, 2012Bioinformatics: Pinto Ab NGSFrom assembly done yesterday, 5476 references resulted. Extracted consensus sequence from these refs and exported FASTA file. ImportedFASTA into blastall app on wet genes: blastx against swissprot, tabular output, 1 short description, 1 alignment.
Uploaded with Skitch!
Followed workflow for H.asi backbone described 2/16/12. Exported Galaxy file is called Galaxy 51 - Hasi assembly of trimmed reads. The piechart is of GO Slim terms from contigs that were annotated with GO biological processes and meet the e-value cutoff of 1e-5.
249

edit
Uploaded with Skitch!
NCBI blast using clc of de novo assembly of trimmed pinto ab reads. Blastx against swissprot. Limit entrez query by Homo sapiens, lowcomplexity, expect 10, word size 3, BLOSUM62 matrix, gap cost existence: 11 extension: 1, create one blast result per query. Saved in folder"trimmed de novo blasts".
April 10, 2012Bioinformatics: Pinto Ab NGSBegan workflow of using trimmed reads (trimmed by SR, see 2/15/12) to assemble to reference H. asinina backbone. In clc, mapped trimmedreads from both libraries - air and high co2 - back to Hasi backbone (Hasi ESTs NCBI 013112). Mismatch cost = 2, limit = 8, fast ungappedalignment, add conflict annotations, vote resolution, random non-specific matches, create summary report and list of unmapped reads. Theassembled sequences will be in the folder, "trimmed reads mapped".
April 6, 2012Mukilteo water chemSammi made new dye this morning. I did spec pH of incoming water and 1 tank from lab, GHA and GHB. Also did dye correction for new dye.
March 21, 2012Secondary stressMet with Peter Westley (Quinn lab) to talk about using ImageJ to quantify shell corrosion on the inside of shells. He thinks I should use thepolygon function to measure the total shell pixel area and the area of the white spots. To take better pictures, he suggests using a regulardigital camera attached to a stand so that it is parallel to the bench top. Put the oyster shell on a white background (probably use only the flatvalve to minimize problems with glare), include a scale of some sort, and light with a couple of regular desk lamps. Try to take a picture with themaximum resolution - raw if possible, or tiff, try to make the pictures 4 MB.
250
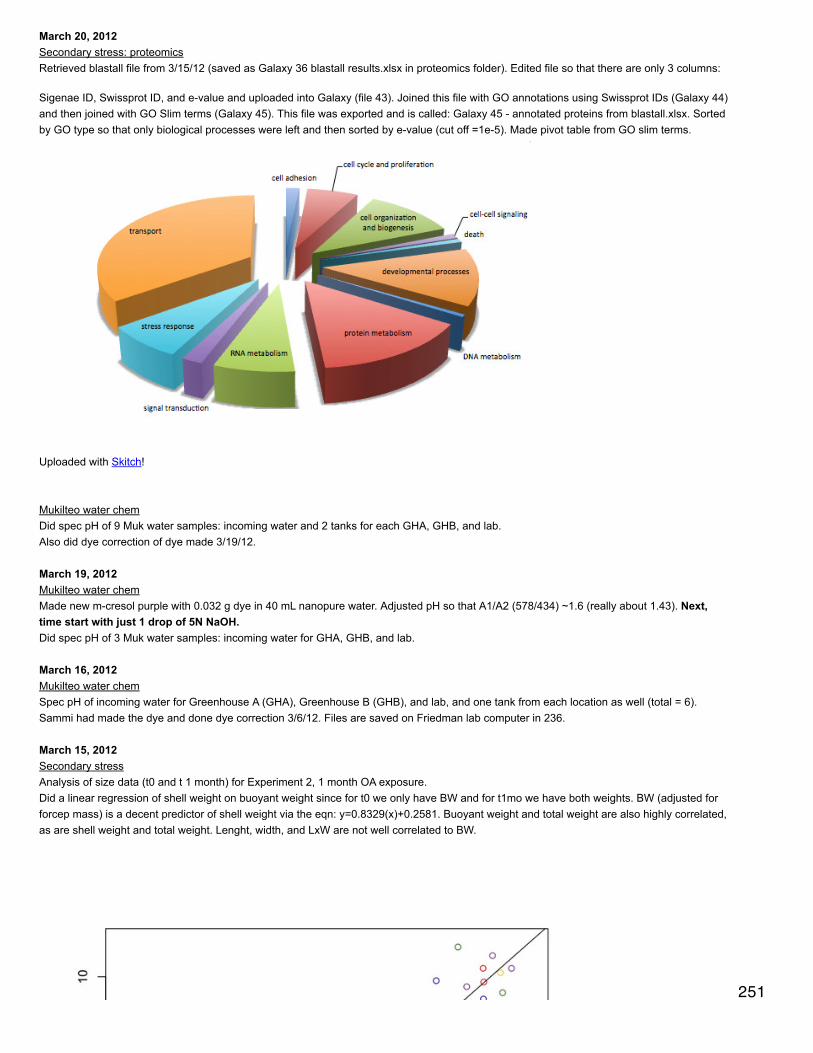
March 20, 2012Secondary stress: proteomicsRetrieved blastall file from 3/15/12 (saved as Galaxy 36 blastall results.xlsx in proteomics folder). Edited file so that there are only 3 columns:
Sigenae ID, Swissprot ID, and e-value and uploaded into Galaxy (file 43). Joined this file with GO annotations using Swissprot IDs (Galaxy 44)and then joined with GO Slim terms (Galaxy 45). This file was exported and is called: Galaxy 45 - annotated proteins from blastall.xlsx. Sortedby GO type so that only biological processes were left and then sorted by e-value (cut off =1e-5). Made pivot table from GO slim terms.
Uploaded with Skitch!
Mukilteo water chemDid spec pH of 9 Muk water samples: incoming water and 2 tanks for each GHA, GHB, and lab.Also did dye correction of dye made 3/19/12.
March 19, 2012Mukilteo water chemMade new m-cresol purple with 0.032 g dye in 40 mL nanopure water. Adjusted pH so that A1/A2 (578/434) ~1.6 (really about 1.43). Next,time start with just 1 drop of 5N NaOH.Did spec pH of 3 Muk water samples: incoming water for GHA, GHB, and lab.
March 16, 2012Mukilteo water chemSpec pH of incoming water for Greenhouse A (GHA), Greenhouse B (GHB), and lab, and one tank from each location as well (total = 6).Sammi had made the dye and done dye correction 3/6/12. Files are saved on Friedman lab computer in 236.
March 15, 2012Secondary stressAnalysis of size data (t0 and t 1 month) for Experiment 2, 1 month OA exposure.Did a linear regression of shell weight on buoyant weight since for t0 we only have BW and for t1mo we have both weights. BW (adjusted forforcep mass) is a decent predictor of shell weight via the eqn: y=0.8329(x)+0.2581. Buoyant weight and total weight are also highly correlated,as are shell weight and total weight. Lenght, width, and LxW are not well correlated to BW.
251
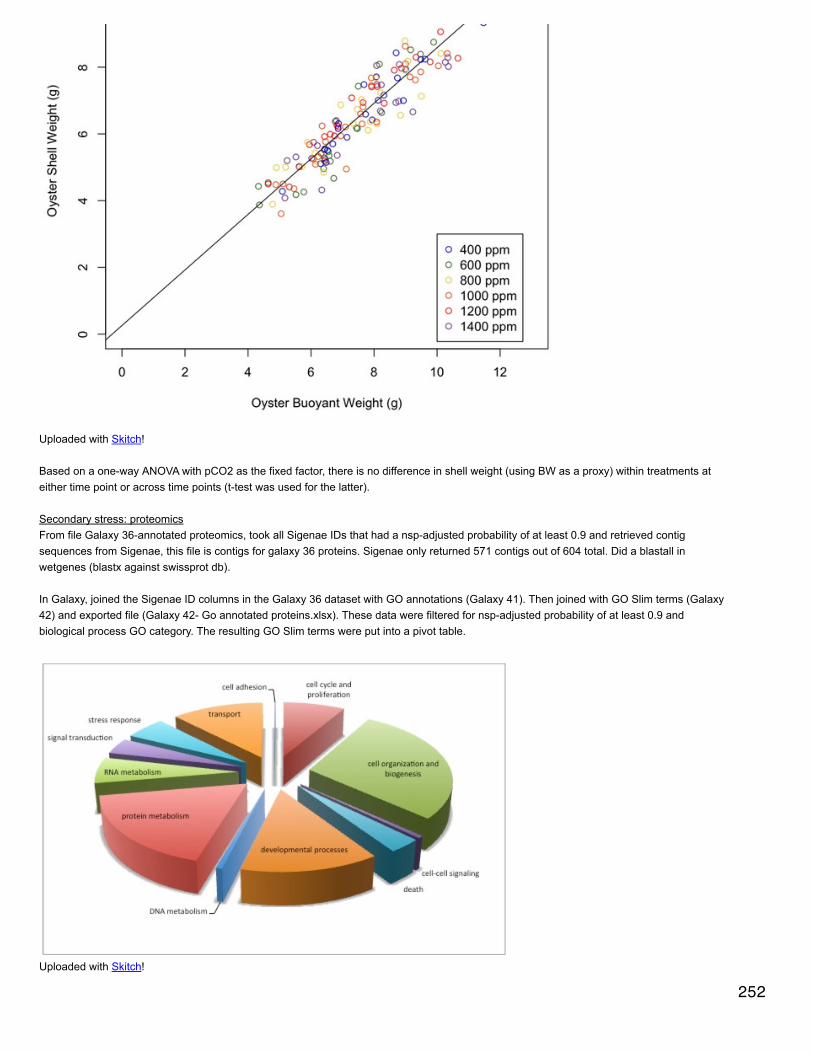
Uploaded with Skitch!
Based on a one-way ANOVA with pCO2 as the fixed factor, there is no difference in shell weight (using BW as a proxy) within treatments ateither time point or across time points (t-test was used for the latter).
Secondary stress: proteomicsFrom file Galaxy 36-annotated proteomics, took all Sigenae IDs that had a nsp-adjusted probability of at least 0.9 and retrieved contigsequences from Sigenae, this file is contigs for galaxy 36 proteins. Sigenae only returned 571 contigs out of 604 total. Did a blastall inwetgenes (blastx against swissprot db).
In Galaxy, joined the Sigenae ID columns in the Galaxy 36 dataset with GO annotations (Galaxy 41). Then joined with GO Slim terms (Galaxy42) and exported file (Galaxy 42- Go annotated proteins.xlsx). These data were filtered for nsp-adjusted probability of at least 0.9 andbiological process GO category. The resulting GO Slim terms were put into a pivot table.
Uploaded with Skitch!
252
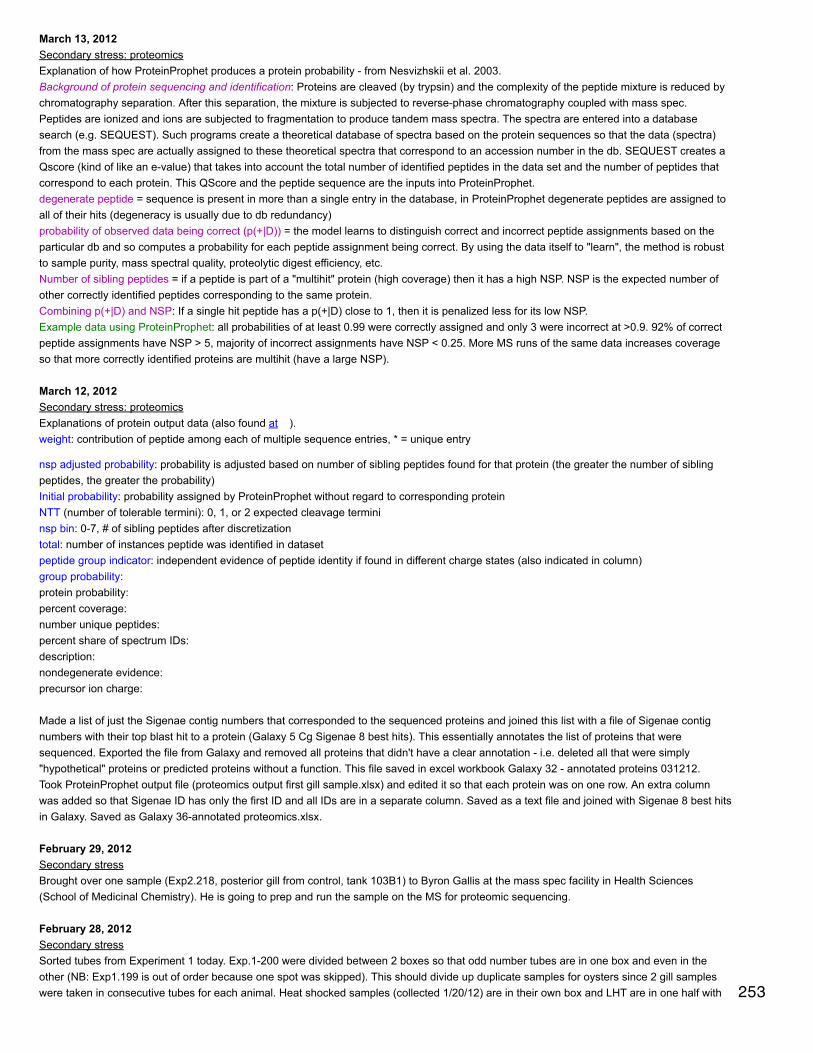
March 13, 2012Secondary stress: proteomicsExplanation of how ProteinProphet produces a protein probability - from Nesvizhskii et al. 2003.Background of protein sequencing and identification: Proteins are cleaved (by trypsin) and the complexity of the peptide mixture is reduced bychromatography separation. After this separation, the mixture is subjected to reverse-phase chromatography coupled with mass spec.Peptides are ionized and ions are subjected to fragmentation to produce tandem mass spectra. The spectra are entered into a databasesearch (e.g. SEQUEST). Such programs create a theoretical database of spectra based on the protein sequences so that the data (spectra)from the mass spec are actually assigned to these theoretical spectra that correspond to an accession number in the db. SEQUEST creates aQscore (kind of like an e-value) that takes into account the total number of identified peptides in the data set and the number of peptides thatcorrespond to each protein. This QScore and the peptide sequence are the inputs into ProteinProphet.degenerate peptide = sequence is present in more than a single entry in the database, in ProteinProphet degenerate peptides are assigned toall of their hits (degeneracy is usually due to db redundancy)probability of observed data being correct (p(+|D)) = the model learns to distinguish correct and incorrect peptide assignments based on theparticular db and so computes a probability for each peptide assignment being correct. By using the data itself to "learn", the method is robustto sample purity, mass spectral quality, proteolytic digest efficiency, etc.Number of sibling peptides = if a peptide is part of a "multihit" protein (high coverage) then it has a high NSP. NSP is the expected number ofother correctly identified peptides corresponding to the same protein.Combining p(+|D) and NSP: If a single hit peptide has a p(+|D) close to 1, then it is penalized less for its low NSP.Example data using ProteinProphet: all probabilities of at least 0.99 were correctly assigned and only 3 were incorrect at >0.9. 92% of correctpeptide assignments have NSP > 5, majority of incorrect assignments have NSP < 0.25. More MS runs of the same data increases coverageso that more correctly identified proteins are multihit (have a large NSP).
March 12, 2012Secondary stress: proteomicsExplanations of protein output data (also found at ).weight: contribution of peptide among each of multiple sequence entries, * = unique entry
nsp adjusted probability: probability is adjusted based on number of sibling peptides found for that protein (the greater the number of siblingpeptides, the greater the probability)Initial probability: probability assigned by ProteinProphet without regard to corresponding proteinNTT (number of tolerable termini): 0, 1, or 2 expected cleavage termininsp bin: 0-7, # of sibling peptides after discretizationtotal: number of instances peptide was identified in datasetpeptide group indicator: independent evidence of peptide identity if found in different charge states (also indicated in column)group probability:protein probability:percent coverage:number unique peptides:percent share of spectrum IDs:description:nondegenerate evidence:precursor ion charge:
Made a list of just the Sigenae contig numbers that corresponded to the sequenced proteins and joined this list with a file of Sigenae contignumbers with their top blast hit to a protein (Galaxy 5 Cg Sigenae 8 best hits). This essentially annotates the list of proteins that weresequenced. Exported the file from Galaxy and removed all proteins that didn't have a clear annotation - i.e. deleted all that were simply"hypothetical" proteins or predicted proteins without a function. This file saved in excel workbook Galaxy 32 - annotated proteins 031212.Took ProteinProphet output file (proteomics output first gill sample.xlsx) and edited it so that each protein was on one row. An extra columnwas added so that Sigenae ID has only the first ID and all IDs are in a separate column. Saved as a text file and joined with Sigenae 8 best hitsin Galaxy. Saved as Galaxy 36-annotated proteomics.xlsx.
February 29, 2012Secondary stressBrought over one sample (Exp2.218, posterior gill from control, tank 103B1) to Byron Gallis at the mass spec facility in Health Sciences(School of Medicinal Chemistry). He is going to prep and run the sample on the MS for proteomic sequencing.
February 28, 2012Secondary stressSorted tubes from Experiment 1 today. Exp.1-200 were divided between 2 boxes so that odd number tubes are in one box and even in theother (NB: Exp1.199 is out of order because one spot was skipped). This should divide up duplicate samples for oysters since 2 gill sampleswere taken in consecutive tubes for each animal. Heat shocked samples (collected 1/20/12) are in their own box and LHT are in one half with 253

SLT+LHT in the other half (except for 103B LHT2, which is in the overflow box). Exp1.201-249 are in a fourth box.I also organized all the samples from Experiment 2 (1 month exposure). Samples are divided between boxes by tissue type: anterior gill,posterior gill, and whole body. It appears that there never was a tube Exp2.387 so the sample sheet will be adjusted accordingly.
February 18, 2012Secondary stressLabeled tubes and made sample sheets for last day of experiment, 2/19/12, when Carolyn and Steven are going to sample the oysters.Took spec pH of source water for all treatments. Spec pH is corrected for temperature (13 or 20°C) using a TA of 2095 µmol/kg.
Tank Durafet_pH salinity spec_pH101A 8.04 29.6 8.032102A 7.64 29.6 7.593102B 8.02 29.6 8.014103B 8.01 29.6 8.035104A 8.05 29.7 8.013104B 7.70 29.7 7.684
HS mortality (checked by SR in the pm): 1 hot pink dead in 102B4 (l=49, w=40, shell weight = 6.59 g)
February 17, 2012Secondary stress and Multispecies OACounted morts of geoduck, small C. gigas, and large C. gigas.Took spec pH of all source water. Messed up the 101A sample so do not have pH data for it. Also somehow forgot to record the salinity andDurafet pH data, so salinity is estimated to be 29.7 ppt. Spec pH is corrected for temperature (either 13 or 20°C) using a TA of 2095 µmol/kg.
Tank spec_pH102A 7.612102B 8.045103A 8.012103B 8.057104A 8.030104B 7.683
February 16, 2012BioinformaticsThe focus of my analysis is now going to be completely on gene discovery. I am going to do a comparison of gene discovery using a de novoassembly vs. a backbone assembled from available H. asinina reads.De novo assembly of trimmed reads: reads assembled to create 9,301 reference sequences. Exported pdf of mapping summary report.Opened de novo and selected all contigs and chose "open consensus". Exported FASTA file of consensus sequences.
Uploaded with Skitch!
Reads mapped back to H. asi backbone: did the same as above - extracted consensus sequences from 1122 references and exported FASTAfile. (NB: these are still the untrimed reads)
Uploaded with Skitch!
For both files of consensus sequences, imported into the SAFS Inquiry portal to do a blastall. Blastall run with same parameters as Jan 9,2012: blastx against swissprot db, etc.
Workflow for results from H.asi backbone:254

Workflow for results from H.asi backbone:
opened blastall file in excel and separated columns by "|"; made sure there were no gaps in the data (saved as blastall Hasibackbone.txt)uploaded into galaxy and joined with the uniprot swissprot IDs file based on swissprot IDs (1st column in uniprot file, 5th in blastall file) =job 20; kept unmantching and incomplete linesjoined resulting table (column 5) with swissprot associations file (column 2) - couldn't keep unmatching and incomplete lines becausekept on getting an error = job 23joined resulting table (column 25) with GO to GO Slim file column 1, keeping unmatching and incomplete lines = job 24exported into excel and saved as Galaxy Hasi backbone.xlsxMade a tab with the data filtered for only biological processesfiltered the biological processes to those with evalues less than or equal to 1e-5 in a new tabUsed the GO Slim terms to make a pivot table and pie chart of the processes discovered (see below)exported unique swissprot IDs from the blastall file to DAVID as the background list and exported the filtered (biol process, e-value cut-off) unique list of IDs as the gene list. Used the functional annotation tool, selected Gene Ontology, and exported the GO_TERM_BPFAT file. (see below)Pasted GO terms with associated p-values into revigo.
Uploaded with Skitch!
255

Uploaded with Skitch!
Uploaded with Skitch!
Workflow results for de novo assembly (same as above but differences are noted):
blastall file - blastall de novo.txtjoin with uniprot/swissprot IDs= job26join with swissprot associations=job 27join with GO to GO slim file = job 28saved as Galaxy de novo.xlsx
Secondary stressCleaned tanks and counted mortalities.From 43°C HS (tank 102B) the following are dead: hot pink (102B3), yellow and dark pink (102B4), and red (102B5). From 44°C HS thefollowing are dead: hot pink and dark pink (103A1), hot pink (103A2), seafoam and turquoise (103A3), turquoise and yellow (103A5), dark pink(103A7). All oysters dead from yesterday and today were measured (length and width), shucked, and shell weight was taken.Durafet probes were calibrated for temperature. Spec pH was taken of all source water and is corrected for temperature (13°C) with a TA of2090 µmol/kg.
Tank Durafet_pH salinity spec_pH101A 8.01 29.6 8.043102A 7.68 29.7 7.654102B 8.02 29.6 8.035103A 8.03 29.7 8.034103B 8.04 29.7 8.080104A 8.05 29.9 8.037104B 7.69 29.8 7.689
Multispecies OAAll tanks were cleaned (I cleaned Oly tanks, Dave cleaned multispecies tanks). Geoduck morts were counted and photos put in dropbox: 3 in102A3 (1 crushed), 2 in 102A6, and 1 in 102A4. Small C. gigas morts were 1 each in 101A5 and 102A6. See above for spec pH (Oly pH iscorrected for temp of 20°C).
256

February 15, 2012BioinformaticsThe RNA-Seq says that it "ended abnormally" so I guess that means it didn't work. Mapping reads (both libraries) back to reference (H. asibackbone) to make sure that there are actually sequences in common between them.Started work flow for trimmed sequences (that SR had trimmed). Summary of SR trimming:
Name Numberofreads AVg.length Numb.reads.after.trim percentag.trimmed avg.length.after.trimhigh CO2 41,027,557 36.0 40,816,572 99.59% 35.9ambient 54,101,070 36.0 53,961,227 99.74% 36.0
Removal of low quality sequence limit = 0.05removal of ambiguous nucleotides: maximal 2 nucleotides allowedremoval of sequences on lenght: min length 25 nucleotidesDe novo assembly of 2 libraries of trimmed reads (all saved within "SR" directory under trimmed sequences): mismatch cost = 2, limit = 8, fastungapped alignment, vote conflict resolution, random non-specific matches, min contig length = 200, map reads back to contigs (createsummary report).
Secondary stressor and Multispecies OATook spec pH of all source water and containers 5 and 6 for every treatment. Took TA of all source water and of containers 5 and 6 for 104 Aand B (Olys) and 101A and 102A (Multispecies OA). Spec pH in the table is corrected for temperature (13°C for all except 20°C for 104A and104B) using the given TA.
Tank Durafet_pH salinity spec_pH TA101A 8.00 29.7 8.027 2093.01102A 7.66 29.7 7.604 2091.32102B 8.02 29.7 8.046 2091.92
103A 8.04 29.9 8.032 2090.77103B 8.03 29.9 8.067 2091.02104A 8.05 29.9 8.042 2092.84104B 7.69 30 7.69 2093.12
Geoduck mortality from HS 2/10/12: 101A1 (1), 101A5 (1), 101A6 (3), 101A7 (1, 100% mortality), 102A4 (1), 102A6 (1, crushed), 102A7 (1),102A8 (3, 100% mortality). Took pictures and put in Friedman lab dropbox.Small C. gigas mortality: 101A5 (1), 101A6 (1).Secondary stress C. gigas mortality for 44°C:
Tank 101B(hot_pink) 102B(turquoise) 103A(yellow) 103B(dark_pink) 104A(sea_foam) 104B(red)103A1 x x x x103A2 x x x x103A3 x x x x103A4 x x x x x x103A5 x x x x103A6 x x x x x x103A7 x x x x x103A8 x x x x x
Secondary stress C. gigas mortality for 43°C: red in 102B4 and dark pink in 102B5.Saved all the morts in the freezer to get measurements and shell weights tomorrow.
February 14, 2012BioinformaticsRNA-Seq from 2/7/12 seems to have not worked so repeated steps to do RNA-seq for both libraries agains the H.asi backbone.
Secondary stressorThe electricity was turned off this afternoon for about 15 minutes around 1:30 pm. When it came back on all the controllers were in manualmode and so the pH went up for all the treatments to 8.1-8.2. They were set back to auto around 3:30 pm.All tanks were cleaned. There were no mortalities although many of the oysters from the 44°C HS were slow to close their valves uponemersion (lethargic).Took spec pH of all source water. Spec pH is corrected for temperature (13°C except for 104 A and B which are at 20°C) using a TA of 2095µmol/kg.
Tank Durafet_pH salinity spec_pH101A 7.99 29.7 7.990102A 7.63 29.9 7.551102B 8.01 29.8 8.034103A 8.00 29.7 7.999
257
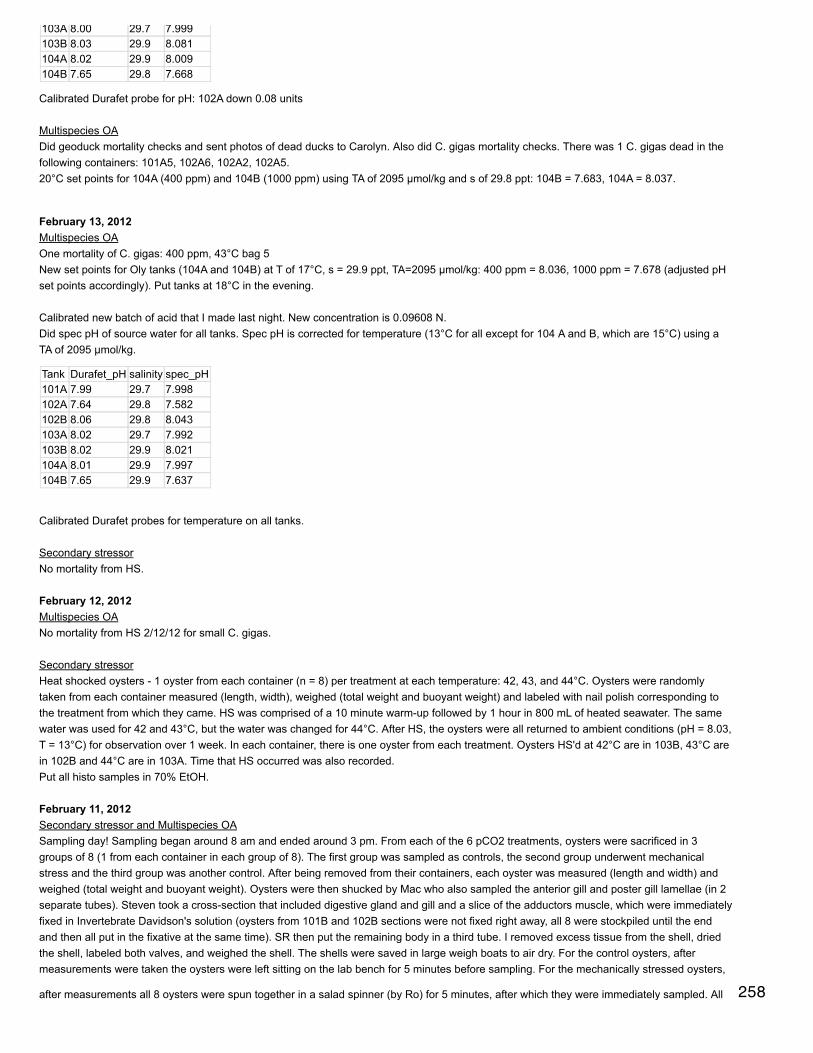
103A 8.00 29.7 7.999103B 8.03 29.9 8.081104A 8.02 29.9 8.009104B 7.65 29.8 7.668
Calibrated Durafet probe for pH: 102A down 0.08 units
Multispecies OADid geoduck mortality checks and sent photos of dead ducks to Carolyn. Also did C. gigas mortality checks. There was 1 C. gigas dead in thefollowing containers: 101A5, 102A6, 102A2, 102A5.20°C set points for 104A (400 ppm) and 104B (1000 ppm) using TA of 2095 µmol/kg and s of 29.8 ppt: 104B = 7.683, 104A = 8.037.
February 13, 2012Multispecies OAOne mortality of C. gigas: 400 ppm, 43°C bag 5New set points for Oly tanks (104A and 104B) at T of 17°C, s = 29.9 ppt, TA=2095 µmol/kg: 400 ppm = 8.036, 1000 ppm = 7.678 (adjusted pHset points accordingly). Put tanks at 18°C in the evening.
Calibrated new batch of acid that I made last night. New concentration is 0.09608 N.Did spec pH of source water for all tanks. Spec pH is corrected for temperature (13°C for all except for 104 A and B, which are 15°C) using aTA of 2095 µmol/kg.
Tank Durafet_pH salinity spec_pH101A 7.99 29.7 7.998102A 7.64 29.8 7.582102B 8.06 29.8 8.043103A 8.02 29.7 7.992103B 8.02 29.9 8.021104A 8.01 29.9 7.997104B 7.65 29.9 7.637
Calibrated Durafet probes for temperature on all tanks.
Secondary stressorNo mortality from HS.
February 12, 2012Multispecies OANo mortality from HS 2/12/12 for small C. gigas.
Secondary stressorHeat shocked oysters - 1 oyster from each container (n = 8) per treatment at each temperature: 42, 43, and 44°C. Oysters were randomlytaken from each container measured (length, width), weighed (total weight and buoyant weight) and labeled with nail polish corresponding tothe treatment from which they came. HS was comprised of a 10 minute warm-up followed by 1 hour in 800 mL of heated seawater. The samewater was used for 42 and 43°C, but the water was changed for 44°C. After HS, the oysters were all returned to ambient conditions (pH = 8.03,T = 13°C) for observation over 1 week. In each container, there is one oyster from each treatment. Oysters HS'd at 42°C are in 103B, 43°C arein 102B and 44°C are in 103A. Time that HS occurred was also recorded.Put all histo samples in 70% EtOH.
February 11, 2012Secondary stressor and Multispecies OASampling day! Sampling began around 8 am and ended around 3 pm. From each of the 6 pCO2 treatments, oysters were sacrificed in 3groups of 8 (1 from each container in each group of 8). The first group was sampled as controls, the second group underwent mechanicalstress and the third group was another control. After being removed from their containers, each oyster was measured (length and width) andweighed (total weight and buoyant weight). Oysters were then shucked by Mac who also sampled the anterior gill and poster gill lamellae (in 2separate tubes). Steven took a cross-section that included digestive gland and gill and a slice of the adductors muscle, which were immediatelyfixed in Invertebrate Davidson's solution (oysters from 101B and 102B sections were not fixed right away, all 8 were stockpiled until the endand then all put in the fixative at the same time). SR then put the remaining body in a third tube. I removed excess tissue from the shell, driedthe shell, labeled both valves, and weighed the shell. The shells were saved in large weigh boats to air dry. For the control oysters, aftermeasurements were taken the oysters were left sitting on the lab bench for 5 minutes before sampling. For the mechanically stressed oysters,
after measurements all 8 oysters were spun together in a salad spinner (by Ro) for 5 minutes, after which they were immediately sampled. All 258
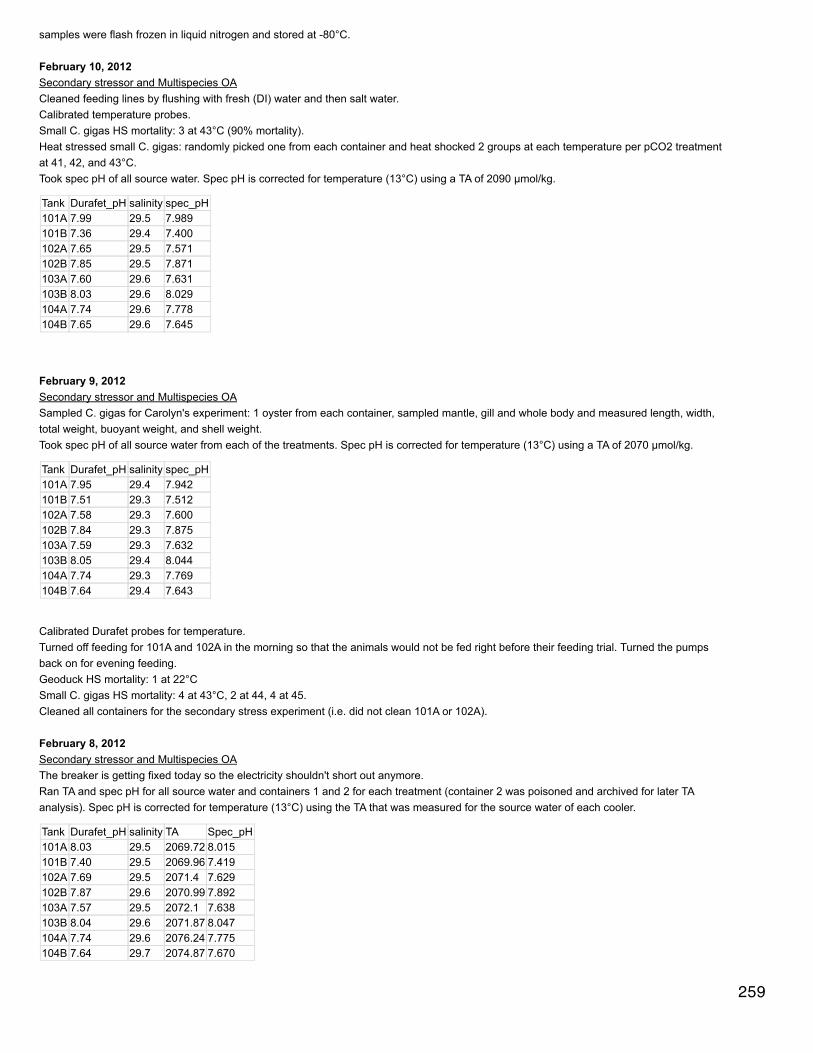
after measurements all 8 oysters were spun together in a salad spinner (by Ro) for 5 minutes, after which they were immediately sampled. Allsamples were flash frozen in liquid nitrogen and stored at -80°C.
February 10, 2012Secondary stressor and Multispecies OACleaned feeding lines by flushing with fresh (DI) water and then salt water.Calibrated temperature probes.Small C. gigas HS mortality: 3 at 43°C (90% mortality).Heat stressed small C. gigas: randomly picked one from each container and heat shocked 2 groups at each temperature per pCO2 treatmentat 41, 42, and 43°C.Took spec pH of all source water. Spec pH is corrected for temperature (13°C) using a TA of 2090 µmol/kg.
Tank Durafet_pH salinity spec_pH101A 7.99 29.5 7.989101B 7.36 29.4 7.400102A 7.65 29.5 7.571102B 7.85 29.5 7.871103A 7.60 29.6 7.631103B 8.03 29.6 8.029104A 7.74 29.6 7.778104B 7.65 29.6 7.645
February 9, 2012Secondary stressor and Multispecies OASampled C. gigas for Carolyn's experiment: 1 oyster from each container, sampled mantle, gill and whole body and measured length, width,total weight, buoyant weight, and shell weight.Took spec pH of all source water from each of the treatments. Spec pH is corrected for temperature (13°C) using a TA of 2070 µmol/kg.
Tank Durafet_pH salinity spec_pH101A 7.95 29.4 7.942101B 7.51 29.3 7.512102A 7.58 29.3 7.600102B 7.84 29.3 7.875103A 7.59 29.3 7.632103B 8.05 29.4 8.044104A 7.74 29.3 7.769104B 7.64 29.4 7.643
Calibrated Durafet probes for temperature.Turned off feeding for 101A and 102A in the morning so that the animals would not be fed right before their feeding trial. Turned the pumpsback on for evening feeding.Geoduck HS mortality: 1 at 22°CSmall C. gigas HS mortality: 4 at 43°C, 2 at 44, 4 at 45.Cleaned all containers for the secondary stress experiment (i.e. did not clean 101A or 102A).
February 8, 2012Secondary stressor and Multispecies OAThe breaker is getting fixed today so the electricity shouldn't short out anymore.Ran TA and spec pH for all source water and containers 1 and 2 for each treatment (container 2 was poisoned and archived for later TAanalysis). Spec pH is corrected for temperature (13°C) using the TA that was measured for the source water of each cooler.
Tank Durafet_pH salinity TA Spec_pH101A 8.03 29.5 2069.72 8.015101B 7.40 29.5 2069.96 7.419102A 7.69 29.5 2071.4 7.629102B 7.87 29.6 2070.99 7.892103A 7.57 29.5 2072.1 7.638103B 8.04 29.6 2071.87 8.047104A 7.74 29.6 2076.24 7.775104B 7.64 29.7 2074.87 7.670
259
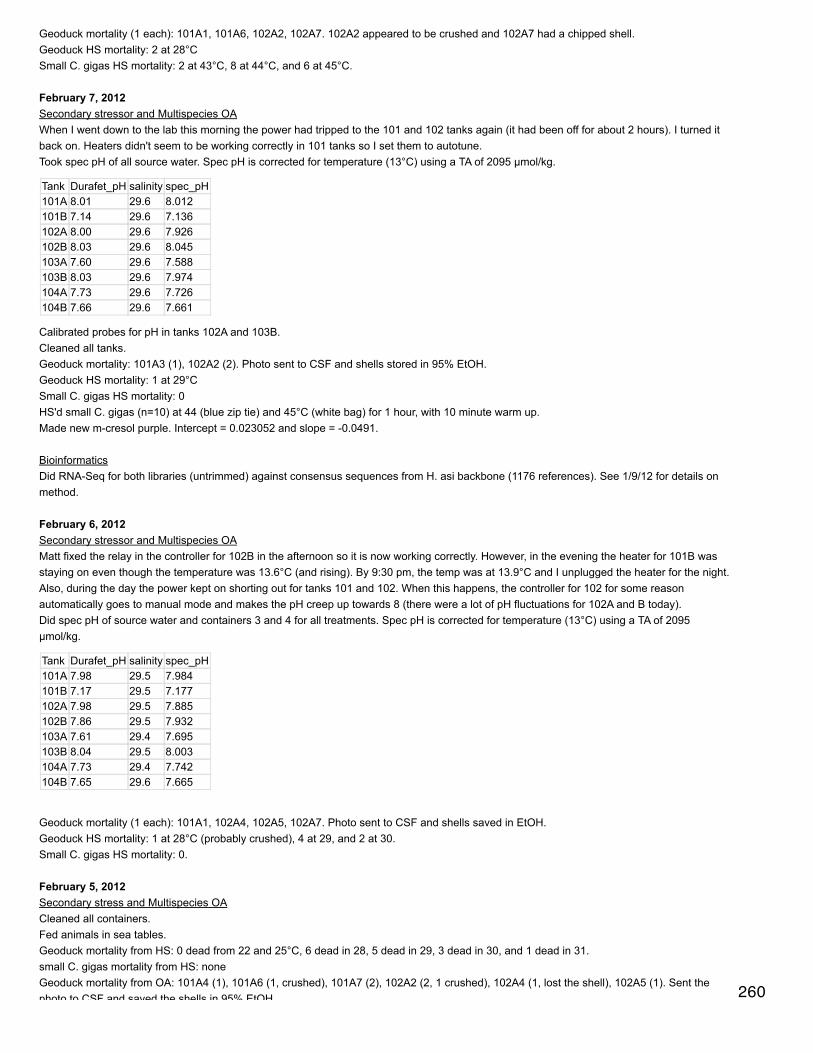
Geoduck mortality (1 each): 101A1, 101A6, 102A2, 102A7. 102A2 appeared to be crushed and 102A7 had a chipped shell.Geoduck HS mortality: 2 at 28°CSmall C. gigas HS mortality: 2 at 43°C, 8 at 44°C, and 6 at 45°C.
February 7, 2012Secondary stressor and Multispecies OAWhen I went down to the lab this morning the power had tripped to the 101 and 102 tanks again (it had been off for about 2 hours). I turned itback on. Heaters didn't seem to be working correctly in 101 tanks so I set them to autotune.Took spec pH of all source water. Spec pH is corrected for temperature (13°C) using a TA of 2095 µmol/kg.
Tank Durafet_pH salinity spec_pH101A 8.01 29.6 8.012101B 7.14 29.6 7.136102A 8.00 29.6 7.926102B 8.03 29.6 8.045103A 7.60 29.6 7.588103B 8.03 29.6 7.974104A 7.73 29.6 7.726104B 7.66 29.6 7.661
Calibrated probes for pH in tanks 102A and 103B.Cleaned all tanks.Geoduck mortality: 101A3 (1), 102A2 (2). Photo sent to CSF and shells stored in 95% EtOH.Geoduck HS mortality: 1 at 29°CSmall C. gigas HS mortality: 0HS'd small C. gigas (n=10) at 44 (blue zip tie) and 45°C (white bag) for 1 hour, with 10 minute warm up.Made new m-cresol purple. Intercept = 0.023052 and slope = -0.0491.
BioinformaticsDid RNA-Seq for both libraries (untrimmed) against consensus sequences from H. asi backbone (1176 references). See 1/9/12 for details onmethod.
February 6, 2012Secondary stressor and Multispecies OAMatt fixed the relay in the controller for 102B in the afternoon so it is now working correctly. However, in the evening the heater for 101B wasstaying on even though the temperature was 13.6°C (and rising). By 9:30 pm, the temp was at 13.9°C and I unplugged the heater for the night.Also, during the day the power kept on shorting out for tanks 101 and 102. When this happens, the controller for 102 for some reasonautomatically goes to manual mode and makes the pH creep up towards 8 (there were a lot of pH fluctuations for 102A and B today).Did spec pH of source water and containers 3 and 4 for all treatments. Spec pH is corrected for temperature (13°C) using a TA of 2095µmol/kg.
Tank Durafet_pH salinity spec_pH101A 7.98 29.5 7.984101B 7.17 29.5 7.177102A 7.98 29.5 7.885102B 7.86 29.5 7.932103A 7.61 29.4 7.695103B 8.04 29.5 8.003104A 7.73 29.4 7.742104B 7.65 29.6 7.665
Geoduck mortality (1 each): 101A1, 102A4, 102A5, 102A7. Photo sent to CSF and shells saved in EtOH.Geoduck HS mortality: 1 at 28°C (probably crushed), 4 at 29, and 2 at 30.Small C. gigas HS mortality: 0.
February 5, 2012Secondary stress and Multispecies OACleaned all containers.Fed animals in sea tables.Geoduck mortality from HS: 0 dead from 22 and 25°C, 6 dead in 28, 5 dead in 29, 3 dead in 30, and 1 dead in 31.small C. gigas mortality from HS: noneGeoduck mortality from OA: 101A4 (1), 101A6 (1, crushed), 101A7 (2), 102A2 (2, 1 crushed), 102A4 (1, lost the shell), 102A5 (1). Sent thephoto to CSF and saved the shells in 95% EtOH. 260
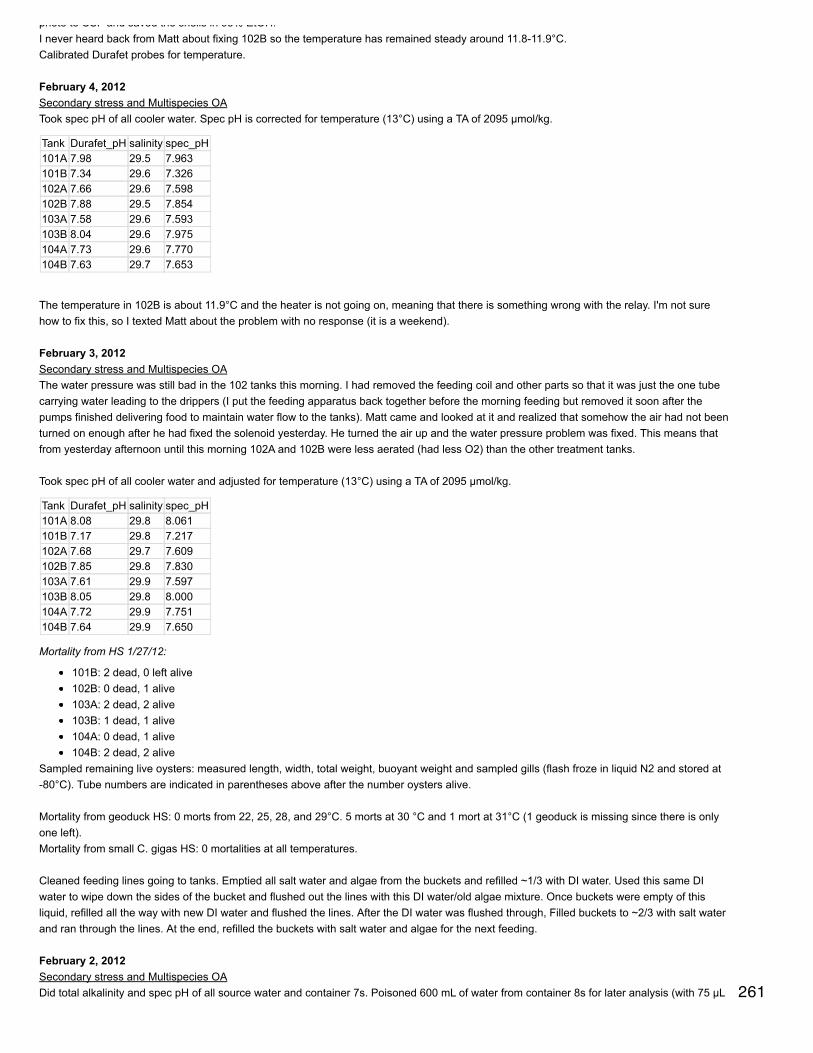
photo to CSF and saved the shells in 95% EtOH.I never heard back from Matt about fixing 102B so the temperature has remained steady around 11.8-11.9°C.Calibrated Durafet probes for temperature.
February 4, 2012Secondary stress and Multispecies OATook spec pH of all cooler water. Spec pH is corrected for temperature (13°C) using a TA of 2095 µmol/kg.
Tank Durafet_pH salinity spec_pH101A 7.98 29.5 7.963101B 7.34 29.6 7.326102A 7.66 29.6 7.598102B 7.88 29.5 7.854103A 7.58 29.6 7.593103B 8.04 29.6 7.975104A 7.73 29.6 7.770104B 7.63 29.7 7.653
The temperature in 102B is about 11.9°C and the heater is not going on, meaning that there is something wrong with the relay. I'm not surehow to fix this, so I texted Matt about the problem with no response (it is a weekend).
February 3, 2012Secondary stress and Multispecies OAThe water pressure was still bad in the 102 tanks this morning. I had removed the feeding coil and other parts so that it was just the one tubecarrying water leading to the drippers (I put the feeding apparatus back together before the morning feeding but removed it soon after thepumps finished delivering food to maintain water flow to the tanks). Matt came and looked at it and realized that somehow the air had not beenturned on enough after he had fixed the solenoid yesterday. He turned the air up and the water pressure problem was fixed. This means thatfrom yesterday afternoon until this morning 102A and 102B were less aerated (had less O2) than the other treatment tanks.
Took spec pH of all cooler water and adjusted for temperature (13°C) using a TA of 2095 µmol/kg.
Tank Durafet_pH salinity spec_pH101A 8.08 29.8 8.061101B 7.17 29.8 7.217102A 7.68 29.7 7.609102B 7.85 29.8 7.830103A 7.61 29.9 7.597103B 8.05 29.8 8.000104A 7.72 29.9 7.751104B 7.64 29.9 7.650
Mortality from HS 1/27/12:
101B: 2 dead, 0 left alive102B: 0 dead, 1 alive103A: 2 dead, 2 alive103B: 1 dead, 1 alive104A: 0 dead, 1 alive104B: 2 dead, 2 alive
Sampled remaining live oysters: measured length, width, total weight, buoyant weight and sampled gills (flash froze in liquid N2 and stored at-80°C). Tube numbers are indicated in parentheses above after the number oysters alive.
Mortality from geoduck HS: 0 morts from 22, 25, 28, and 29°C. 5 morts at 30 °C and 1 mort at 31°C (1 geoduck is missing since there is onlyone left).Mortality from small C. gigas HS: 0 mortalities at all temperatures.
Cleaned feeding lines going to tanks. Emptied all salt water and algae from the buckets and refilled ~1/3 with DI water. Used this same DIwater to wipe down the sides of the bucket and flushed out the lines with this DI water/old algae mixture. Once buckets were empty of thisliquid, refilled all the way with new DI water and flushed the lines. After the DI water was flushed through, Filled buckets to ~2/3 with salt waterand ran through the lines. At the end, refilled the buckets with salt water and algae for the next feeding.
February 2, 2012Secondary stress and Multispecies OADid total alkalinity and spec pH of all source water and container 7s. Poisoned 600 mL of water from container 8s for later analysis (with 75 µL 261

HgCl2). Spec pH is corrected for temperature (13°C) using the given TA. The containers in 102A are a higher pH than the source water, whichis unusual. I think this is because there was a lot of pH fluctuation in 102A today (see below) and there's a lag in what the containersexperience relative to the source water during pH variation.
TANK salinity Durafet_pH spec_pH TA101A 29.9 8.07 8.041 2093.75101B 30 7.18 7.196 2095.42102A 30 7.48 7.401 2094.81102B 30.1 7.83 7.823 2095.16103A 29.9 7.61 7.633 2094.84103B 30 8.03 8.004 2094.14104A 30 7.73 7.776 2094.52104B 30.2 7.60 7.669 2095.96
The solenoid in tank 102 had to be replaced because it was not working properly (CO2 was not being dispensed appropriately to meet andmaintain the set point pH). After it was replaced, I re-calibrated the probes using spec pH and ran accutune.The am feeding seemed to have clogged some of the tubing in 102A. I replaced the part that was clogged and it is working fine now.All the animals in the sea tables were fed.Mortality from HS 1/27/12: 1 in 103A and 1 in 102B.Geoduck mortality: 1 in 101A7 and 1 in 102A7.Heat shocked geoduck at 29 and 30°C for 1 hour each. Mortality from yesterday's 'duck HS: 7 dead from 31°C and 1 dead from 28°C, althoughit looks to have died from being crushed. The three "live" geoduck from the 31 HS may not really be alive, but it was hard to tell if they weretruly dead or just extremely lethargic from the stress.Heat shocked 10 small Pacific oysters each at 40, 41, 42, and 43°C (10 minute warm up followed by 1 hour HS). Zip tie colors correspond tothe following temperatures: pink = 40, purple = 41, yellow = 42, red = 43.Calibrated Durafet probes for temperature.
February 1, 2012Secondary stress and Multispecies OATook spec pH of source water for all coolers. Spec pH is corrected for temperature (13°C) at a TA of 2099 µmol/kg.
Tank Durafet_pH salinity spec_pH101A 8.07 29.9 8.056101B 7.22 29.9 7.273102A 7.79 30 7.759102B 8.20 30 8.174103A 7.61 29.9 7.645103B 7.99 30 7.958104A 7.74 29.9 7.767104B 7.77 30 7.767
Calibrated temperature in all coolers.Had to manually adjust CO2 flow in 102A and B and 104B this morning because they were not reaching the correct set points. The pH hadsettled by the afternoon so I ran accutune in 102A and B (don't think it is needed in 104B).Cleaned all containers. Fed animals in sea tables.Mortality from HS 1/27/12: 1 in 104B, 3 in 103A, 1 in 102B, 1 in 104A, 1 in 101B, 1 in 103B.
Today I helped to sample the oysters in Carolyn's experiment - took samples of mantle, gill, and the rest of the body for 1 C. gigas from each ofher containers in 101A and 102A.We are trying to find the lethal temperature for the geoduck seed. We are doing HS starting at 21°C at every 3 degrees. Today, HS was done at21, 25, 28, and 31°C. The geoduck were not looking good after the 31°C - gaping, lethargic, siphons unresponsive to stimulation.
January 31, 2012Secondary stress and Multispecies OACalibrated the new batch of acid from 1/30/12 with CRM 113. Ran samples that were taken previously and poisoned on 1/18 and 1/24/12.Moose and Matt fixed an air flow problem to the system, but it made all the controllers go crazy. They ran accutune so everything should bebetter by this evening.Mortality from HS 1/27/12: 1 each in 101B and 104A
Made new m-cresol purple.Fed animals in sea table.Geoduck mortalities (1 each): 101A1, 101A8, 102A8. Photo sent to CSF and shells preserved.102B is having trouble getting up to its set point pH (7.87). I turned the CO2 flow down so there is less CO2 entering the Venturi.
262
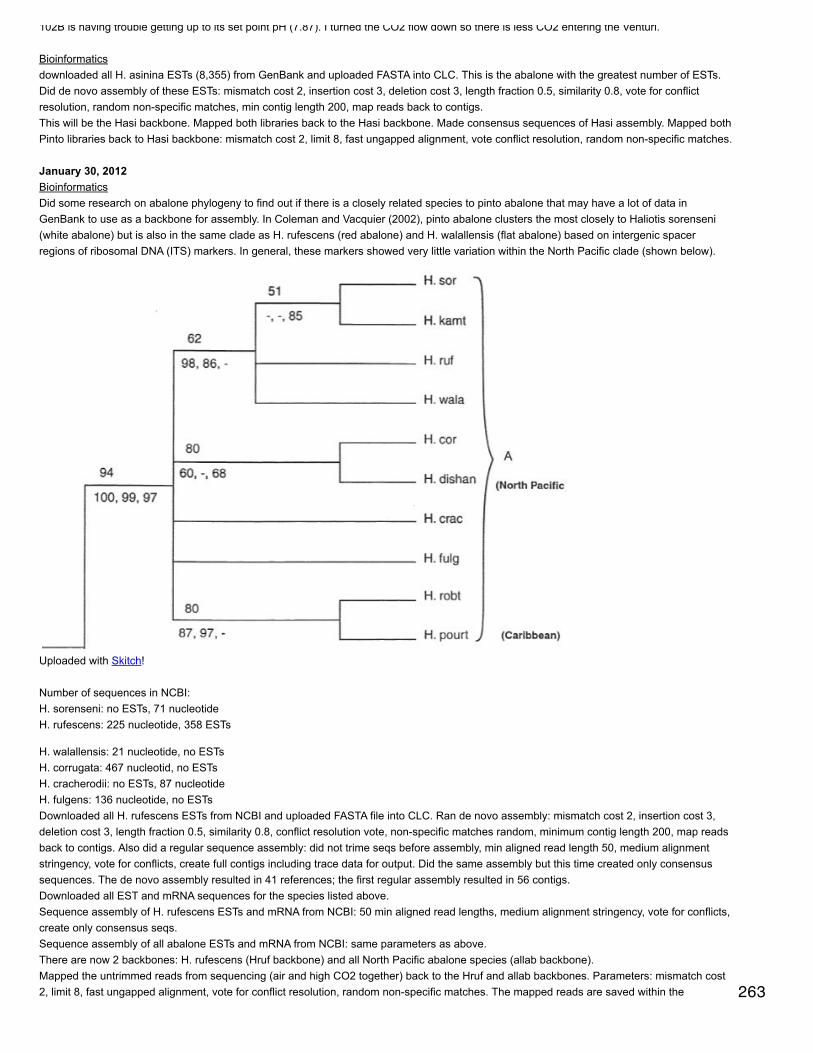
102B is having trouble getting up to its set point pH (7.87). I turned the CO2 flow down so there is less CO2 entering the Venturi.
Bioinformaticsdownloaded all H. asinina ESTs (8,355) from GenBank and uploaded FASTA into CLC. This is the abalone with the greatest number of ESTs.Did de novo assembly of these ESTs: mismatch cost 2, insertion cost 3, deletion cost 3, length fraction 0.5, similarity 0.8, vote for conflictresolution, random non-specific matches, min contig length 200, map reads back to contigs.This will be the Hasi backbone. Mapped both libraries back to the Hasi backbone. Made consensus sequences of Hasi assembly. Mapped bothPinto libraries back to Hasi backbone: mismatch cost 2, limit 8, fast ungapped alignment, vote conflict resolution, random non-specific matches.
January 30, 2012BioinformaticsDid some research on abalone phylogeny to find out if there is a closely related species to pinto abalone that may have a lot of data inGenBank to use as a backbone for assembly. In Coleman and Vacquier (2002), pinto abalone clusters the most closely to Haliotis sorenseni(white abalone) but is also in the same clade as H. rufescens (red abalone) and H. walallensis (flat abalone) based on intergenic spacerregions of ribosomal DNA (ITS) markers. In general, these markers showed very little variation within the North Pacific clade (shown below).
Uploaded with Skitch!
Number of sequences in NCBI:H. sorenseni: no ESTs, 71 nucleotideH. rufescens: 225 nucleotide, 358 ESTs
H. walallensis: 21 nucleotide, no ESTsH. corrugata: 467 nucleotid, no ESTsH. cracherodii: no ESTs, 87 nucleotideH. fulgens: 136 nucleotide, no ESTsDownloaded all H. rufescens ESTs from NCBI and uploaded FASTA file into CLC. Ran de novo assembly: mismatch cost 2, insertion cost 3,deletion cost 3, length fraction 0.5, similarity 0.8, conflict resolution vote, non-specific matches random, minimum contig length 200, map readsback to contigs. Also did a regular sequence assembly: did not trime seqs before assembly, min aligned read length 50, medium alignmentstringency, vote for conflicts, create full contigs including trace data for output. Did the same assembly but this time created only consensussequences. The de novo assembly resulted in 41 references; the first regular assembly resulted in 56 contigs.Downloaded all EST and mRNA sequences for the species listed above.Sequence assembly of H. rufescens ESTs and mRNA from NCBI: 50 min aligned read lengths, medium alignment stringency, vote for conflicts,create only consensus seqs.Sequence assembly of all abalone ESTs and mRNA from NCBI: same parameters as above.There are now 2 backbones: H. rufescens (Hruf backbone) and all North Pacific abalone species (allab backbone).Mapped the untrimmed reads from sequencing (air and high CO2 together) back to the Hruf and allab backbones. Parameters: mismatch cost2, limit 8, fast ungapped alignment, vote for conflict resolution, random non-specific matches. The mapped reads are saved within the 263
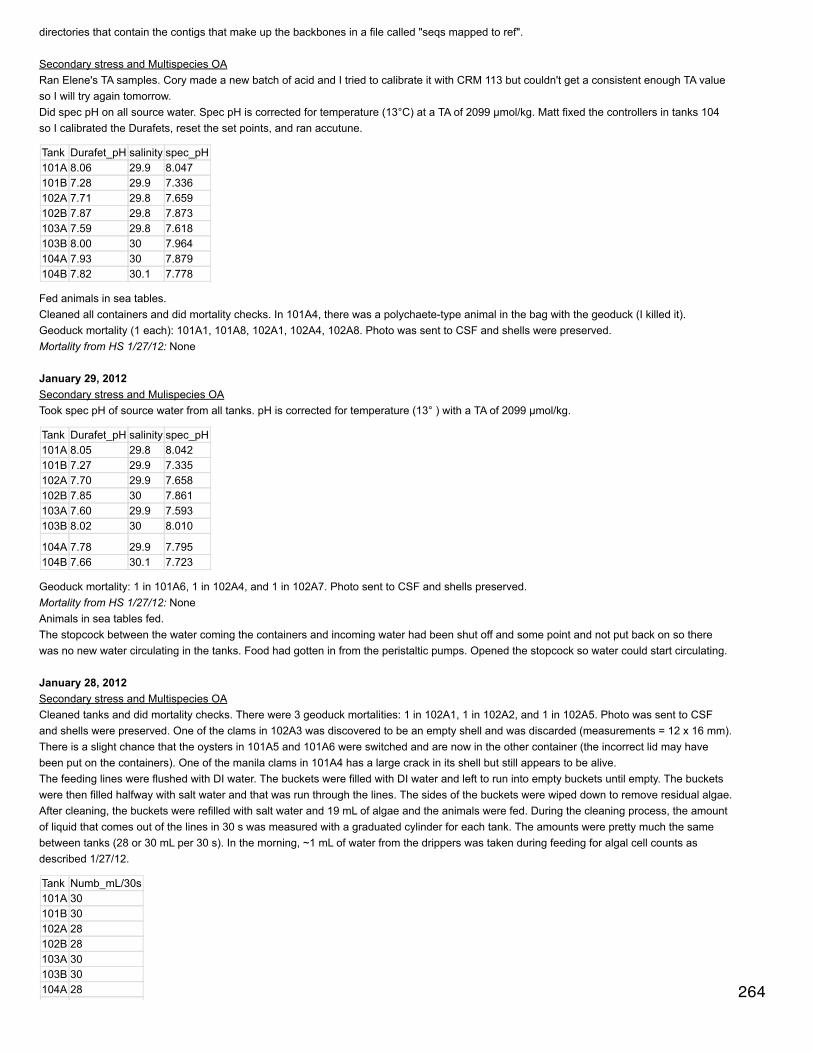
directories that contain the contigs that make up the backbones in a file called "seqs mapped to ref".
Secondary stress and Multispecies OARan Elene's TA samples. Cory made a new batch of acid and I tried to calibrate it with CRM 113 but couldn't get a consistent enough TA valueso I will try again tomorrow.Did spec pH on all source water. Spec pH is corrected for temperature (13°C) at a TA of 2099 µmol/kg. Matt fixed the controllers in tanks 104so I calibrated the Durafets, reset the set points, and ran accutune.
Tank Durafet_pH salinity spec_pH101A 8.06 29.9 8.047101B 7.28 29.9 7.336102A 7.71 29.8 7.659102B 7.87 29.8 7.873103A 7.59 29.8 7.618103B 8.00 30 7.964104A 7.93 30 7.879104B 7.82 30.1 7.778
Fed animals in sea tables.Cleaned all containers and did mortality checks. In 101A4, there was a polychaete-type animal in the bag with the geoduck (I killed it).Geoduck mortality (1 each): 101A1, 101A8, 102A1, 102A4, 102A8. Photo was sent to CSF and shells were preserved.Mortality from HS 1/27/12: None
January 29, 2012Secondary stress and Mulispecies OATook spec pH of source water from all tanks. pH is corrected for temperature (13° ) with a TA of 2099 µmol/kg.
Tank Durafet_pH salinity spec_pH101A 8.05 29.8 8.042101B 7.27 29.9 7.335102A 7.70 29.9 7.658102B 7.85 30 7.861103A 7.60 29.9 7.593103B 8.02 30 8.010
104A 7.78 29.9 7.795104B 7.66 30.1 7.723
Geoduck mortality: 1 in 101A6, 1 in 102A4, and 1 in 102A7. Photo sent to CSF and shells preserved.Mortality from HS 1/27/12: NoneAnimals in sea tables fed.The stopcock between the water coming the containers and incoming water had been shut off and some point and not put back on so therewas no new water circulating in the tanks. Food had gotten in from the peristaltic pumps. Opened the stopcock so water could start circulating.
January 28, 2012Secondary stress and Multispecies OACleaned tanks and did mortality checks. There were 3 geoduck mortalities: 1 in 102A1, 1 in 102A2, and 1 in 102A5. Photo was sent to CSFand shells were preserved. One of the clams in 102A3 was discovered to be an empty shell and was discarded (measurements = 12 x 16 mm).There is a slight chance that the oysters in 101A5 and 101A6 were switched and are now in the other container (the incorrect lid may havebeen put on the containers). One of the manila clams in 101A4 has a large crack in its shell but still appears to be alive.The feeding lines were flushed with DI water. The buckets were filled with DI water and left to run into empty buckets until empty. The bucketswere then filled halfway with salt water and that was run through the lines. The sides of the buckets were wiped down to remove residual algae.After cleaning, the buckets were refilled with salt water and 19 mL of algae and the animals were fed. During the cleaning process, the amountof liquid that comes out of the lines in 30 s was measured with a graduated cylinder for each tank. The amounts were pretty much the samebetween tanks (28 or 30 mL per 30 s). In the morning, ~1 mL of water from the drippers was taken during feeding for algal cell counts asdescribed 1/27/12.
Tank Numb_mL/30s101A 30101B 30102A 28102B 28103A 30103B 30104A 28104B 30
264

104B 30
Spec pH was done of all source water. pH is corrected for temperature (13°C) with a TA of 2099 µmol/kg.
Tank salinity Durafet_pH spec_pH101A 30 8.02 8.007101B 30 7.20 7.235102A 30.1 7.63 7.602102B 30.1 7.87 7.861103A 30.1 7.62 7.584103B 30.2 8.01 7.961104A 30.1 7.76 7.757104B 30.1 7.70 7.676
Mortalities from HS 1/27/12: 1 in 104B, 1 in 103B, and 2 in 104A.Animals in sea tables fed.
January 27, 2012Secondary stress and Multispecies OAAlgae counts: During the morning feeding, around 9:50 am, collected ~1 mL of water + algae directly from the drippers from each container #1.
Counted the algae cells in a hemocytometer. I will repeat this for another container this evening or tomorrow morning. Also counted the cellsfrom 1 mL of water taken directly from a feeding bucket. Samples were shaken before being loaded onto the hemocytometer. All counts are forthe entire center square of the hemocytometer (i.e. 1 square millimeter). The counts were done in duplicate for each sample.
Tank Algae_count1 Algae_count2101A 3 4101B 4 7102A 2 3102B 5 4103A 15 7103B 5 5104A 1 4104B 3 8
Counts for the bucket were 30 and 23.
Took spec pH of the source water from all treatments and from containers 7 and 8. Spec pH is corrected for temperature (13°C) and calculatedusing a TA of 2099 µmol/kg.
Tank Durafet_pH salinity spec_pH101A 8.02 29.9 7.977101B 7.18 30 7.218102A 7.62 30.1 7.612102B 7.87 30 7.854103A 7.60 30.1 7.608103B 8.02 30.1 7.982104A 7.76 30 7.746104B 7.68 30.1 7.661
104B keeps on dipping down to a low pH (about 7.5) and then righting itself. In general, it fluctuates but stays within an acceptable range. Ranaccutune to try to get it under better control.Sea table animals fed.
Heat shock: Did LHT HS of oysters that were HS'd at SLT on 1/13/12. Oysters were warmed at 44°C for 10 minutes before HS at 44°C for 1hour (monitored constantly by the Fluke temperature probe). Checked mortality at 6 pm (about 6 hours post-HS): 3 dead in 104A, 2 dead in104B, 4 dead in 101B, 5 dead in 102B, and 4 dead in 103B.
2 geoduck mortalities: 1 in 101A7 and 1 in 102A7. Photo sent to CSF and shells preserved in 95% EtOH.
January 26, 2012Secondary stressMortality from HS 1/19/12: 1 was dead from the 44°C treatment (100 % mortality). This is the new LHT.Had to reset the relay in 104A.Calibrated temperature for the Durafet probes. 265
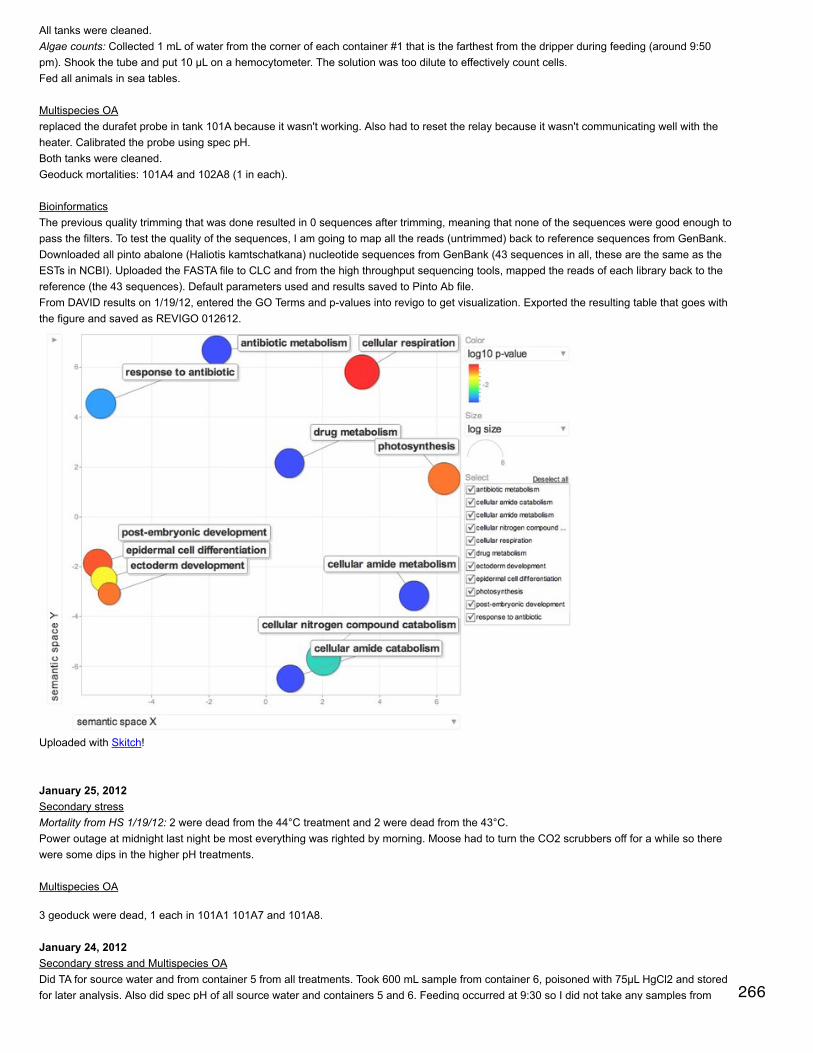
All tanks were cleaned.Algae counts: Collected 1 mL of water from the corner of each container #1 that is the farthest from the dripper during feeding (around 9:50pm). Shook the tube and put 10 µL on a hemocytometer. The solution was too dilute to effectively count cells.Fed all animals in sea tables.
Multispecies OAreplaced the durafet probe in tank 101A because it wasn't working. Also had to reset the relay because it wasn't communicating well with theheater. Calibrated the probe using spec pH.Both tanks were cleaned.Geoduck mortalities: 101A4 and 102A8 (1 in each).
BioinformaticsThe previous quality trimming that was done resulted in 0 sequences after trimming, meaning that none of the sequences were good enough topass the filters. To test the quality of the sequences, I am going to map all the reads (untrimmed) back to reference sequences from GenBank.Downloaded all pinto abalone (Haliotis kamtschatkana) nucleotide sequences from GenBank (43 sequences in all, these are the same as theESTs in NCBI). Uploaded the FASTA file to CLC and from the high throughput sequencing tools, mapped the reads of each library back to thereference (the 43 sequences). Default parameters used and results saved to Pinto Ab file.From DAVID results on 1/19/12, entered the GO Terms and p-values into revigo to get visualization. Exported the resulting table that goes withthe figure and saved as REVIGO 012612.
Uploaded with Skitch!
January 25, 2012Secondary stressMortality from HS 1/19/12: 2 were dead from the 44°C treatment and 2 were dead from the 43°C.Power outage at midnight last night be most everything was righted by morning. Moose had to turn the CO2 scrubbers off for a while so therewere some dips in the higher pH treatments.
Multispecies OA
3 geoduck were dead, 1 each in 101A1 101A7 and 101A8.
January 24, 2012Secondary stress and Multispecies OADid TA for source water and from container 5 from all treatments. Took 600 mL sample from container 6, poisoned with 75µL HgCl2 and storedfor later analysis. Also did spec pH of all source water and containers 5 and 6. Feeding occurred at 9:30 so I did not take any samples from 266
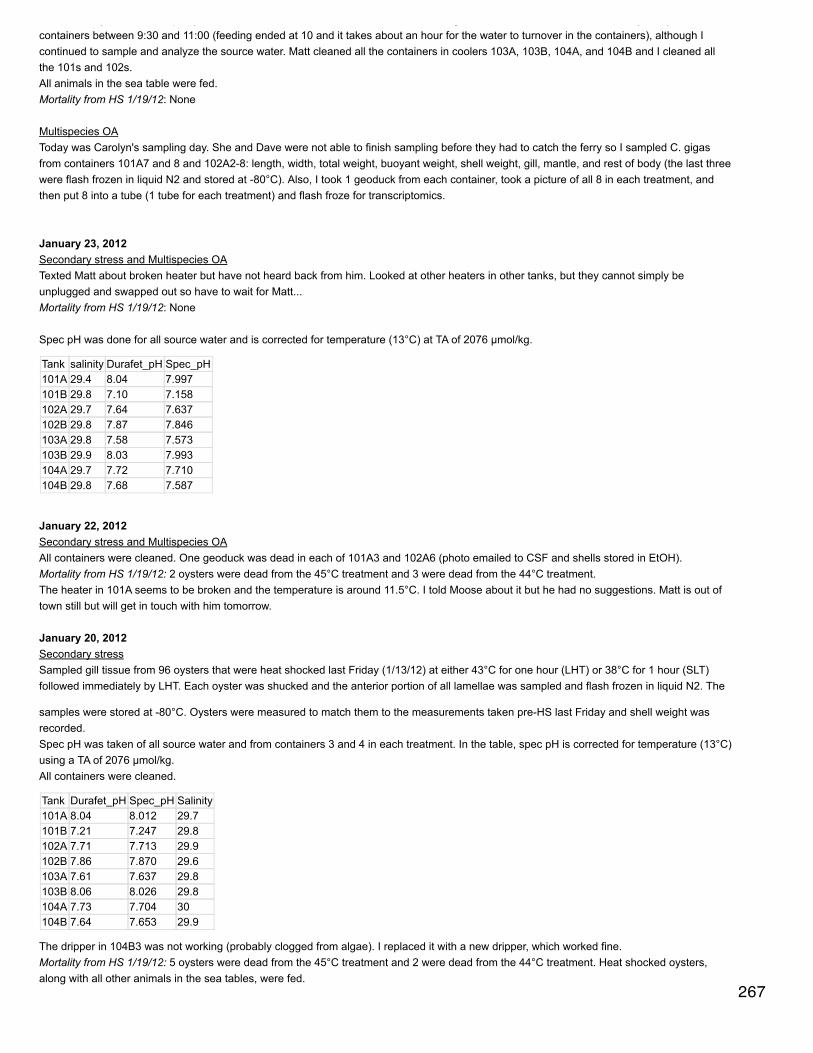
for later analysis. Also did spec pH of all source water and containers 5 and 6. Feeding occurred at 9:30 so I did not take any samples fromcontainers between 9:30 and 11:00 (feeding ended at 10 and it takes about an hour for the water to turnover in the containers), although Icontinued to sample and analyze the source water. Matt cleaned all the containers in coolers 103A, 103B, 104A, and 104B and I cleaned allthe 101s and 102s.All animals in the sea table were fed.Mortality from HS 1/19/12: None
Multispecies OAToday was Carolyn's sampling day. She and Dave were not able to finish sampling before they had to catch the ferry so I sampled C. gigasfrom containers 101A7 and 8 and 102A2-8: length, width, total weight, buoyant weight, shell weight, gill, mantle, and rest of body (the last threewere flash frozen in liquid N2 and stored at -80°C). Also, I took 1 geoduck from each container, took a picture of all 8 in each treatment, andthen put 8 into a tube (1 tube for each treatment) and flash froze for transcriptomics.
January 23, 2012Secondary stress and Multispecies OATexted Matt about broken heater but have not heard back from him. Looked at other heaters in other tanks, but they cannot simply beunplugged and swapped out so have to wait for Matt...Mortality from HS 1/19/12: None
Spec pH was done for all source water and is corrected for temperature (13°C) at TA of 2076 µmol/kg.
Tank salinity Durafet_pH Spec_pH101A 29.4 8.04 7.997101B 29.8 7.10 7.158102A 29.7 7.64 7.637102B 29.8 7.87 7.846103A 29.8 7.58 7.573103B 29.9 8.03 7.993104A 29.7 7.72 7.710104B 29.8 7.68 7.587
January 22, 2012Secondary stress and Multispecies OAAll containers were cleaned. One geoduck was dead in each of 101A3 and 102A6 (photo emailed to CSF and shells stored in EtOH).Mortality from HS 1/19/12: 2 oysters were dead from the 45°C treatment and 3 were dead from the 44°C treatment.The heater in 101A seems to be broken and the temperature is around 11.5°C. I told Moose about it but he had no suggestions. Matt is out oftown still but will get in touch with him tomorrow.
January 20, 2012Secondary stressSampled gill tissue from 96 oysters that were heat shocked last Friday (1/13/12) at either 43°C for one hour (LHT) or 38°C for 1 hour (SLT)followed immediately by LHT. Each oyster was shucked and the anterior portion of all lamellae was sampled and flash frozen in liquid N2. The
samples were stored at -80°C. Oysters were measured to match them to the measurements taken pre-HS last Friday and shell weight wasrecorded.Spec pH was taken of all source water and from containers 3 and 4 in each treatment. In the table, spec pH is corrected for temperature (13°C)using a TA of 2076 µmol/kg.All containers were cleaned.
Tank Durafet_pH Spec_pH Salinity101A 8.04 8.012 29.7101B 7.21 7.247 29.8102A 7.71 7.713 29.9102B 7.86 7.870 29.6103A 7.61 7.637 29.8103B 8.06 8.026 29.8104A 7.73 7.704 30104B 7.64 7.653 29.9
The dripper in 104B3 was not working (probably clogged from algae). I replaced it with a new dripper, which worked fine.Mortality from HS 1/19/12: 5 oysters were dead from the 45°C treatment and 2 were dead from the 44°C treatment. Heat shocked oysters,along with all other animals in the sea tables, were fed.
267
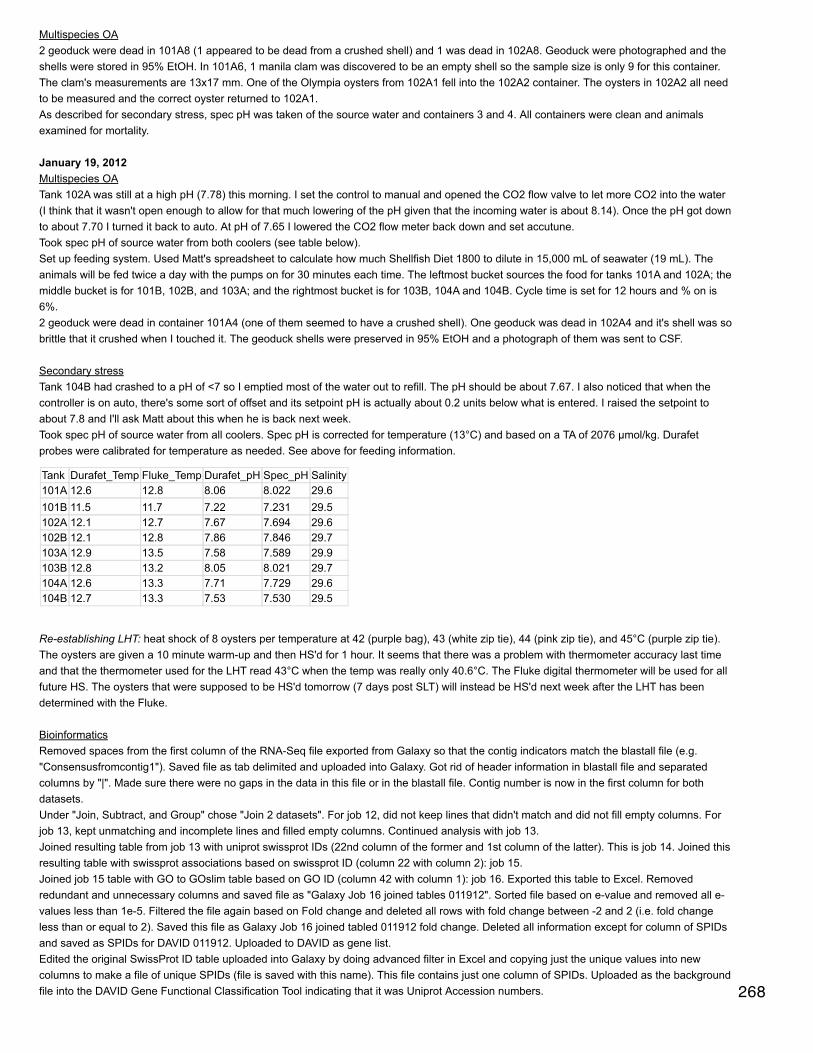
Multispecies OA2 geoduck were dead in 101A8 (1 appeared to be dead from a crushed shell) and 1 was dead in 102A8. Geoduck were photographed and theshells were stored in 95% EtOH. In 101A6, 1 manila clam was discovered to be an empty shell so the sample size is only 9 for this container.The clam's measurements are 13x17 mm. One of the Olympia oysters from 102A1 fell into the 102A2 container. The oysters in 102A2 all needto be measured and the correct oyster returned to 102A1.As described for secondary stress, spec pH was taken of the source water and containers 3 and 4. All containers were clean and animalsexamined for mortality.
January 19, 2012Multispecies OATank 102A was still at a high pH (7.78) this morning. I set the control to manual and opened the CO2 flow valve to let more CO2 into the water(I think that it wasn't open enough to allow for that much lowering of the pH given that the incoming water is about 8.14). Once the pH got downto about 7.70 I turned it back to auto. At pH of 7.65 I lowered the CO2 flow meter back down and set accutune.Took spec pH of source water from both coolers (see table below).Set up feeding system. Used Matt's spreadsheet to calculate how much Shellfish Diet 1800 to dilute in 15,000 mL of seawater (19 mL). Theanimals will be fed twice a day with the pumps on for 30 minutes each time. The leftmost bucket sources the food for tanks 101A and 102A; themiddle bucket is for 101B, 102B, and 103A; and the rightmost bucket is for 103B, 104A and 104B. Cycle time is set for 12 hours and % on is6%.2 geoduck were dead in container 101A4 (one of them seemed to have a crushed shell). One geoduck was dead in 102A4 and it's shell was sobrittle that it crushed when I touched it. The geoduck shells were preserved in 95% EtOH and a photograph of them was sent to CSF.
Secondary stressTank 104B had crashed to a pH of <7 so I emptied most of the water out to refill. The pH should be about 7.67. I also noticed that when thecontroller is on auto, there's some sort of offset and its setpoint pH is actually about 0.2 units below what is entered. I raised the setpoint toabout 7.8 and I'll ask Matt about this when he is back next week.Took spec pH of source water from all coolers. Spec pH is corrected for temperature (13°C) and based on a TA of 2076 µmol/kg. Durafetprobes were calibrated for temperature as needed. See above for feeding information.
Tank Durafet_Temp Fluke_Temp Durafet_pH Spec_pH Salinity101A 12.6 12.8 8.06 8.022 29.6101B 11.5 11.7 7.22 7.231 29.5102A 12.1 12.7 7.67 7.694 29.6102B 12.1 12.8 7.86 7.846 29.7103A 12.9 13.5 7.58 7.589 29.9103B 12.8 13.2 8.05 8.021 29.7104A 12.6 13.3 7.71 7.729 29.6104B 12.7 13.3 7.53 7.530 29.5
Re-establishing LHT: heat shock of 8 oysters per temperature at 42 (purple bag), 43 (white zip tie), 44 (pink zip tie), and 45°C (purple zip tie).The oysters are given a 10 minute warm-up and then HS'd for 1 hour. It seems that there was a problem with thermometer accuracy last timeand that the thermometer used for the LHT read 43°C when the temp was really only 40.6°C. The Fluke digital thermometer will be used for allfuture HS. The oysters that were supposed to be HS'd tomorrow (7 days post SLT) will instead be HS'd next week after the LHT has beendetermined with the Fluke.
BioinformaticsRemoved spaces from the first column of the RNA-Seq file exported from Galaxy so that the contig indicators match the blastall file (e.g."Consensusfromcontig1"). Saved file as tab delimited and uploaded into Galaxy. Got rid of header information in blastall file and separatedcolumns by "|". Made sure there were no gaps in the data in this file or in the blastall file. Contig number is now in the first column for bothdatasets.Under "Join, Subtract, and Group" chose "Join 2 datasets". For job 12, did not keep lines that didn't match and did not fill empty columns. Forjob 13, kept unmatching and incomplete lines and filled empty columns. Continued analysis with job 13.Joined resulting table from job 13 with uniprot swissprot IDs (22nd column of the former and 1st column of the latter). This is job 14. Joined thisresulting table with swissprot associations based on swissprot ID (column 22 with column 2): job 15.Joined job 15 table with GO to GOslim table based on GO ID (column 42 with column 1): job 16. Exported this table to Excel. Removedredundant and unnecessary columns and saved file as "Galaxy Job 16 joined tables 011912". Sorted file based on e-value and removed all e-values less than 1e-5. Filtered the file again based on Fold change and deleted all rows with fold change between -2 and 2 (i.e. fold changeless than or equal to 2). Saved this file as Galaxy Job 16 joined tabled 011912 fold change. Deleted all information except for column of SPIDsand saved as SPIDs for DAVID 011912. Uploaded to DAVID as gene list.Edited the original SwissProt ID table uploaded into Galaxy by doing advanced filter in Excel and copying just the unique values into newcolumns to make a file of unique SPIDs (file is saved with this name). This file contains just one column of SPIDs. Uploaded as the backgroundfile into the DAVID Gene Functional Classification Tool indicating that it was Uniprot Accession numbers. 268
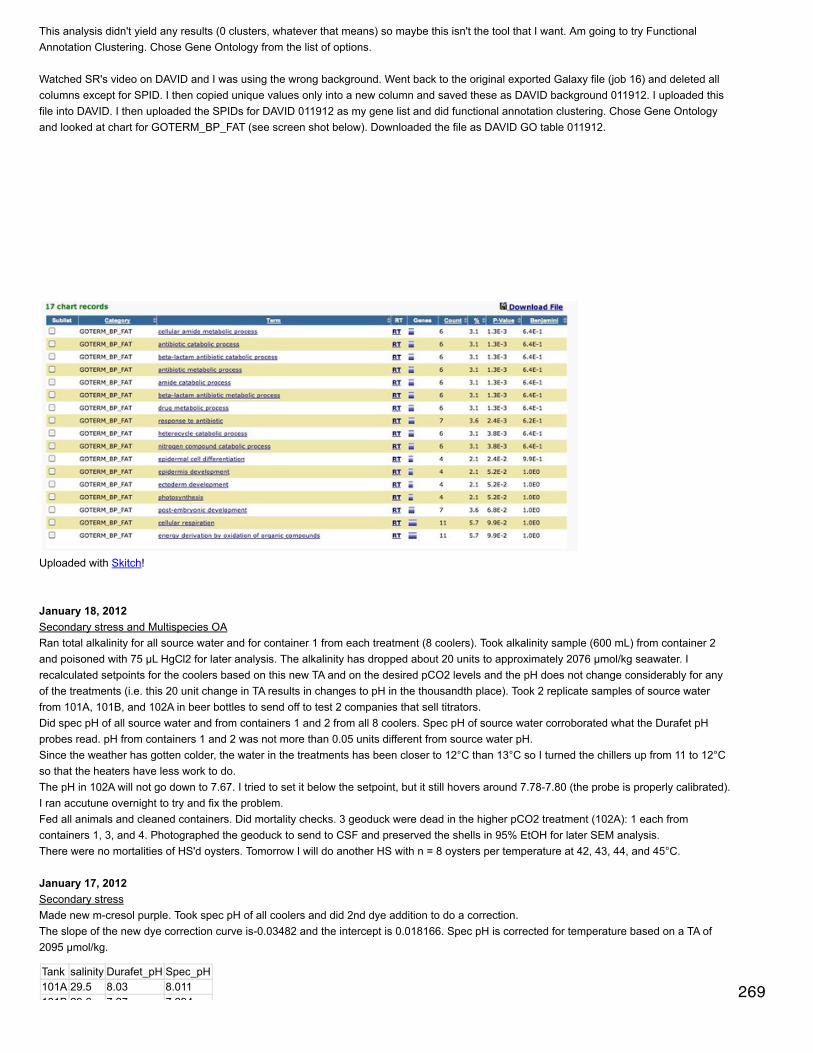
This analysis didn't yield any results (0 clusters, whatever that means) so maybe this isn't the tool that I want. Am going to try FunctionalAnnotation Clustering. Chose Gene Ontology from the list of options.
Watched SR's video on DAVID and I was using the wrong background. Went back to the original exported Galaxy file (job 16) and deleted allcolumns except for SPID. I then copied unique values only into a new column and saved these as DAVID background 011912. I uploaded thisfile into DAVID. I then uploaded the SPIDs for DAVID 011912 as my gene list and did functional annotation clustering. Chose Gene Ontologyand looked at chart for GOTERM_BP_FAT (see screen shot below). Downloaded the file as DAVID GO table 011912.
Uploaded with Skitch!
January 18, 2012Secondary stress and Multispecies OARan total alkalinity for all source water and for container 1 from each treatment (8 coolers). Took alkalinity sample (600 mL) from container 2and poisoned with 75 µL HgCl2 for later analysis. The alkalinity has dropped about 20 units to approximately 2076 µmol/kg seawater. Irecalculated setpoints for the coolers based on this new TA and on the desired pCO2 levels and the pH does not change considerably for anyof the treatments (i.e. this 20 unit change in TA results in changes to pH in the thousandth place). Took 2 replicate samples of source waterfrom 101A, 101B, and 102A in beer bottles to send off to test 2 companies that sell titrators.Did spec pH of all source water and from containers 1 and 2 from all 8 coolers. Spec pH of source water corroborated what the Durafet pHprobes read. pH from containers 1 and 2 was not more than 0.05 units different from source water pH.Since the weather has gotten colder, the water in the treatments has been closer to 12°C than 13°C so I turned the chillers up from 11 to 12°Cso that the heaters have less work to do.The pH in 102A will not go down to 7.67. I tried to set it below the setpoint, but it still hovers around 7.78-7.80 (the probe is properly calibrated).I ran accutune overnight to try and fix the problem.Fed all animals and cleaned containers. Did mortality checks. 3 geoduck were dead in the higher pCO2 treatment (102A): 1 each fromcontainers 1, 3, and 4. Photographed the geoduck to send to CSF and preserved the shells in 95% EtOH for later SEM analysis.There were no mortalities of HS'd oysters. Tomorrow I will do another HS with n = 8 oysters per temperature at 42, 43, 44, and 45°C.
January 17, 2012Secondary stressMade new m-cresol purple. Took spec pH of all coolers and did 2nd dye addition to do a correction.The slope of the new dye correction curve is-0.03482 and the intercept is 0.018166. Spec pH is corrected for temperature based on a TA of2095 µmol/kg.
Tank salinity Durafet_pH Spec_pH101A 29.5 8.03 8.011101B 29.6 7.27 7.294
269

101B 29.6 7.27 7.294102A 29.8 7.69 7.789102B 29.6 7.86 7.859103A 29.6 7.57 7.586103B 29.8 8.02 8.002104A 29.5 7.74 7.714104B 29.4 7.66 7.673
The probe for 102A was calibrated since the actual pH was 0.1 unit higher than the perceived pH.
Animals were fed. No mortalities from HS.
Matt showed me the set up for the automated feeding and I think I will work on that Thursday. The algae delivered to the containers ends upbeing at 5% concentration of the algae in the source buckets. The buckets are marked with a fill line at 20,000 mL for calculating how muchalgae to add to a bucket of seawater.
Multispecies OATook spec pH of both coolers (see above table).Animals were fed.
January 16, 2012Secondary stressRan total alkalinity samples that were taken on 1/7/12 and 1/10/12. Also ran 3 of the Mukilteo samples that Carolyn brought up. Did spec pH onthe source water for all 8 coolers. NB: salinity was not taken at the exact time of spec pH, but was taken about 1 hour later. Spec pH has beencorrected for temperature based on a TA of 2095 µmol/kg.
Tanks salinity spec_pH103A 29.4 7.638103B 29.5 8.014104A 29.5 7.731104B 29.6 7.664101A 28.9 8.037101B 29.1 7.401102A 29.4 7.780102B 29.4 7.853
Fed oysters and cleaned containers after feeding.There was no mortality in the HS'd oysters.Cleaned spec pH cuvettes overnight.
Multispecies OAThroughout the day adjusted the pH in cooler 102A to about 7.67 (pCO2 of 1000 ppm).Fed bivalves and cleaned containers. Checked all animals for mortality. 4 geoduck were dead, 1 in each of containers 101A1, 101A3, 102A3,and 102A6. Photographed the dead animals with a scale for size.NB: When cleaning these containers make sure that none of the geoduck have fallen out of their bag to the bottom of the container.
January 15, 2012Secondary stressThere is no mortality from HS.Oysters were fed 120,000 cells per mL (water circulation turned off for 1 hour).
Multispecies OAAnimals were fed 120,000 cells per mL.
January 14, 2012Secondary stressFixed samples were moved from Davidson's fixative into jars of 70% EtOH.There was no mortality from HS.The oysters for the 1 month OA exposure were measured, weighed individually for buoyant weight, and weighed for total mass of all theanimals in a container together. 6 oysters were put in each container at pCO2 of 400, 600, 800, 1000, 1200, or 1400.
Multispecies OAAnimals were measured before being put into one of 8 containers in each of 2 coolers. The coolers are both currently set at a pH of >8.0
270
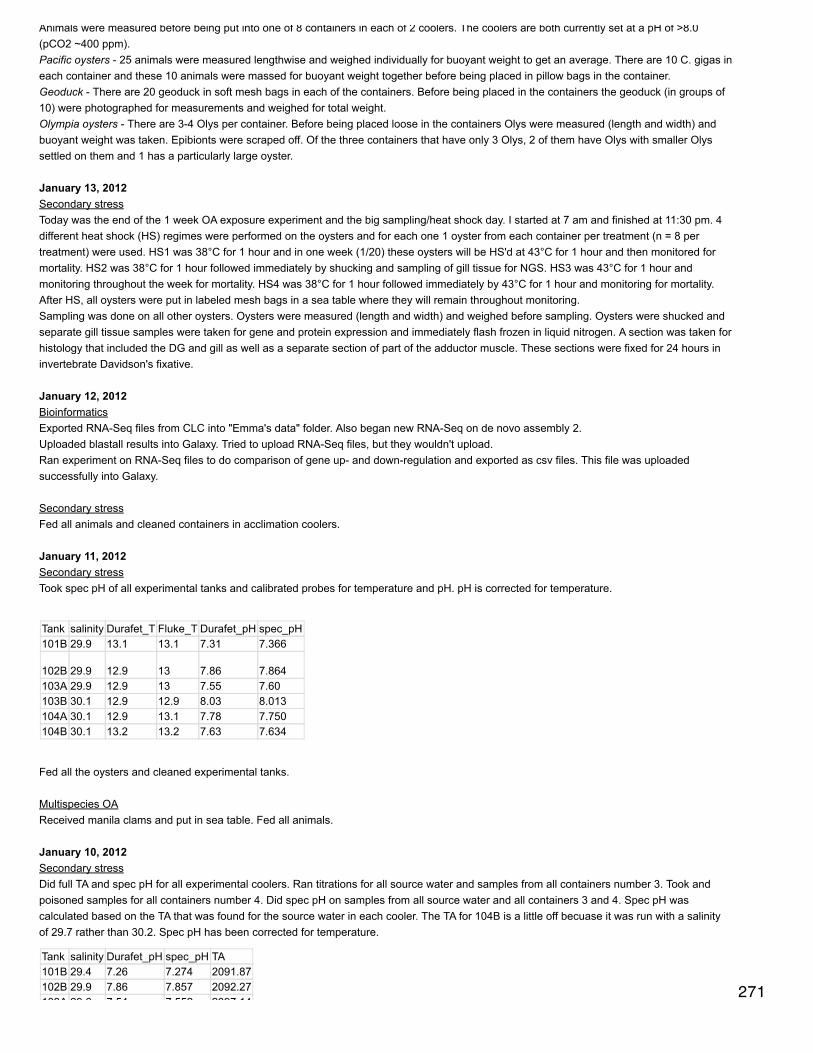
Animals were measured before being put into one of 8 containers in each of 2 coolers. The coolers are both currently set at a pH of >8.0(pCO2 ~400 ppm).Pacific oysters - 25 animals were measured lengthwise and weighed individually for buoyant weight to get an average. There are 10 C. gigas ineach container and these 10 animals were massed for buoyant weight together before being placed in pillow bags in the container.Geoduck - There are 20 geoduck in soft mesh bags in each of the containers. Before being placed in the containers the geoduck (in groups of10) were photographed for measurements and weighed for total weight.Olympia oysters - There are 3-4 Olys per container. Before being placed loose in the containers Olys were measured (length and width) andbuoyant weight was taken. Epibionts were scraped off. Of the three containers that have only 3 Olys, 2 of them have Olys with smaller Olyssettled on them and 1 has a particularly large oyster.
January 13, 2012Secondary stressToday was the end of the 1 week OA exposure experiment and the big sampling/heat shock day. I started at 7 am and finished at 11:30 pm. 4different heat shock (HS) regimes were performed on the oysters and for each one 1 oyster from each container per treatment (n = 8 pertreatment) were used. HS1 was 38°C for 1 hour and in one week (1/20) these oysters will be HS'd at 43°C for 1 hour and then monitored formortality. HS2 was 38°C for 1 hour followed immediately by shucking and sampling of gill tissue for NGS. HS3 was 43°C for 1 hour andmonitoring throughout the week for mortality. HS4 was 38°C for 1 hour followed immediately by 43°C for 1 hour and monitoring for mortality.After HS, all oysters were put in labeled mesh bags in a sea table where they will remain throughout monitoring.Sampling was done on all other oysters. Oysters were measured (length and width) and weighed before sampling. Oysters were shucked andseparate gill tissue samples were taken for gene and protein expression and immediately flash frozen in liquid nitrogen. A section was taken forhistology that included the DG and gill as well as a separate section of part of the adductor muscle. These sections were fixed for 24 hours ininvertebrate Davidson's fixative.
January 12, 2012BioinformaticsExported RNA-Seq files from CLC into "Emma's data" folder. Also began new RNA-Seq on de novo assembly 2.Uploaded blastall results into Galaxy. Tried to upload RNA-Seq files, but they wouldn't upload.Ran experiment on RNA-Seq files to do comparison of gene up- and down-regulation and exported as csv files. This file was uploadedsuccessfully into Galaxy.
Secondary stressFed all animals and cleaned containers in acclimation coolers.
January 11, 2012Secondary stressTook spec pH of all experimental tanks and calibrated probes for temperature and pH. pH is corrected for temperature.
Tank salinity Durafet_T Fluke_T Durafet_pH spec_pH101B 29.9 13.1 13.1 7.31 7.366
102B 29.9 12.9 13 7.86 7.864103A 29.9 12.9 13 7.55 7.60103B 30.1 12.9 12.9 8.03 8.013104A 30.1 12.9 13.1 7.78 7.750104B 30.1 13.2 13.2 7.63 7.634
Fed all the oysters and cleaned experimental tanks.
Multispecies OAReceived manila clams and put in sea table. Fed all animals.
January 10, 2012Secondary stressDid full TA and spec pH for all experimental coolers. Ran titrations for all source water and samples from all containers number 3. Took andpoisoned samples for all containers number 4. Did spec pH on samples from all source water and all containers 3 and 4. Spec pH wascalculated based on the TA that was found for the source water in each cooler. The TA for 104B is a little off becuase it was run with a salinityof 29.7 rather than 30.2. Spec pH has been corrected for temperature.
Tank salinity Durafet_pH spec_pH TA101B 29.4 7.26 7.274 2091.87102B 29.9 7.86 7.857 2092.27103A 29.6 7.54 7.552 2097.14
271

103A 29.6 7.54 7.552 2097.14103B 29.7 8.03 7.968 2093.44104A 29.7 7.76 7.664 2094.94104B 30.2 7.68 7.596 2092.69
Did spec pH on source water for acclimation coolers. Calibrated the Durafet probes for temperature. Spec pH has been corrected fortemperature based on a TA of 2095 µmol/kg.
Tank salinity Durafet_T Fluke_T Durafet_pH spec_pH105A 29.5 12.9 12.8 7.96 7.913105B 29.7 13.6 13.5 7.97 7.958106A 29.9 12.9 12.8 7.94 7.926106B 30 13.1 13 7.92 7.841102A 30 12.7 12.5 7.94 7.917101A 30 12.9 12.8 7.97 8.092
All oysters were fed and acclimation tanks were cleaned. Oysters were redistributed randomly between the acclimation tanks at the end ofcleaning.
Multispecies OACarolyn brought up mussels, geoduck, olympia oysters, and pacific oysters for a multispecies OA experiment. The Pacifics are small, about thesize of a thumbnail. The Olys are larger, about 1 inch long. The mussels look like they are just post-larval and the geoduck are also small seed,but larger than the mussels. Manila clams are arriving tomorrow. All animals were put in sea tables. All animals were fed shellfish diet 1800.
January 9, 2012Secondary stressMade new m-cresol purple (see 1/2/12). Took spec pH from all experimental coolers and used them to do the dye correction. The intercept forthe dye correction is 0.013592 and the slope is -0.03138. Calculated the temperature-corrected pH from spec pH at 25°C with an assumed TA
of 2095 µmol/kg.
Tank salinity Durafet_pH spec_pH101B 29.7 7.29 7.265102B 29.8 7.86 7.867103A 29.9 7.49 7.428103B 29.8 7.93 7.894104A 29.9 7.70 7.729204B 30 7.62 7.650
Changed set points on a couple of the coolers that are consistently below their set points.
Fed all the oysters and cleaned the containers for the experimental oysters.
BioinformaticsStarted a new de novo assembly (Emma de novo 2) on pinto ab OA data. The parameters for the new de novo are all default, except themismatch costs were changed to 3 and the min contig length was decreased to 150.
Began RNA-Seq analysis to find differentially expressed genes between data sets. The consensus sequences from the de novo assemblywere used as a reference backbone (8911 sequences). The analysis was done on a reference without annotations and with default assemblysettings, except the unmapped sequences box was unchecked. RNA-Seq was done for both data sets.Detailed instructions:
Open file of consensus sequences in CLC so you can view it and select all sequences by clicking on the first one, scrollingn down, holdshift and click on last oneClick "open consensus" at the bottom of the windowResave the file into a folder in your CLC directory - this file will be your reference for RNA-SeqRight click on your raw data file and select toolbox -> CLCserver -> RNAseq analysisUse default options on the RNA-Seq with the following changes: 1) reference without annotations, 2) uncheck unmapped sequencesRepeat RNA-seq with your second sequence fileTo do a comparison of your RNA-seq for your datasets, go to high throughput sequencing in your toolbox and select "Run anexperiment". Keep your default settings
Quality trimmed raw data, discarding lengths below 20 and saving the trimmed sequences in the trimmed sequence folder. 272
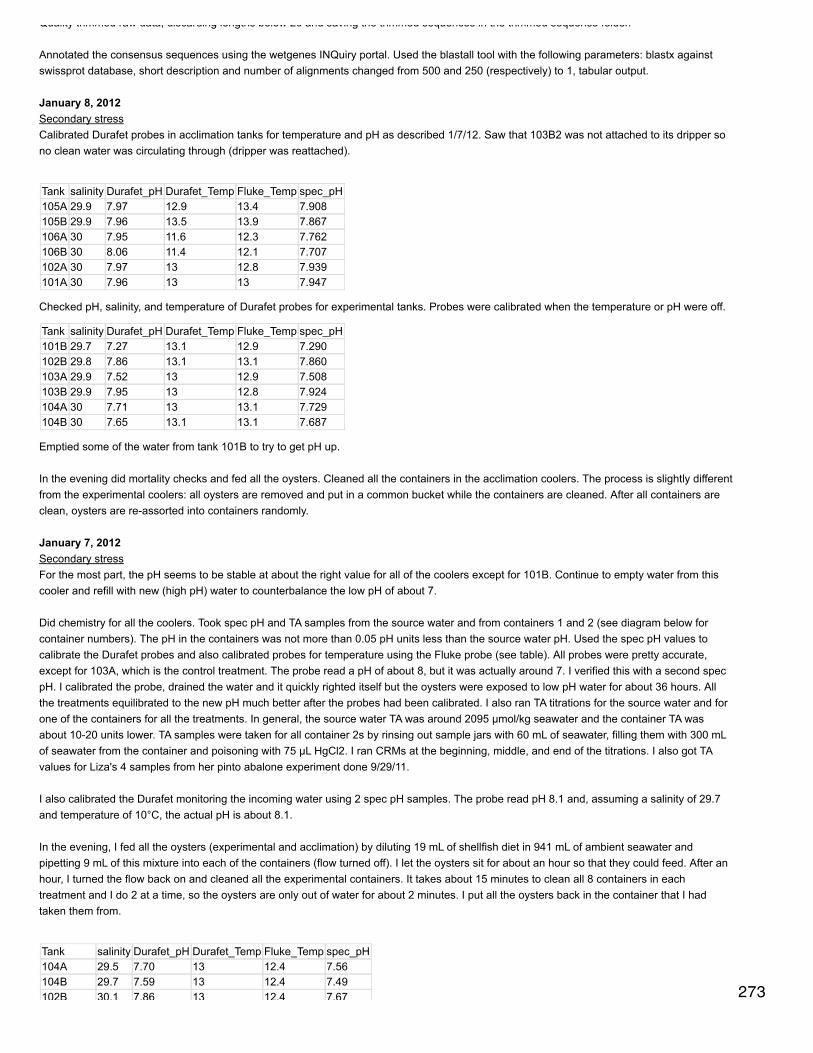
Quality trimmed raw data, discarding lengths below 20 and saving the trimmed sequences in the trimmed sequence folder.
Annotated the consensus sequences using the wetgenes INQuiry portal. Used the blastall tool with the following parameters: blastx againstswissprot database, short description and number of alignments changed from 500 and 250 (respectively) to 1, tabular output.
January 8, 2012Secondary stressCalibrated Durafet probes in acclimation tanks for temperature and pH as described 1/7/12. Saw that 103B2 was not attached to its dripper sono clean water was circulating through (dripper was reattached).
Tank salinity Durafet_pH Durafet_Temp Fluke_Temp spec_pH105A 29.9 7.97 12.9 13.4 7.908105B 29.9 7.96 13.5 13.9 7.867106A 30 7.95 11.6 12.3 7.762106B 30 8.06 11.4 12.1 7.707102A 30 7.97 13 12.8 7.939101A 30 7.96 13 13 7.947
Checked pH, salinity, and temperature of Durafet probes for experimental tanks. Probes were calibrated when the temperature or pH were off.
Tank salinity Durafet_pH Durafet_Temp Fluke_Temp spec_pH101B 29.7 7.27 13.1 12.9 7.290102B 29.8 7.86 13.1 13.1 7.860103A 29.9 7.52 13 12.9 7.508103B 29.9 7.95 13 12.8 7.924104A 30 7.71 13 13.1 7.729104B 30 7.65 13.1 13.1 7.687
Emptied some of the water from tank 101B to try to get pH up.
In the evening did mortality checks and fed all the oysters. Cleaned all the containers in the acclimation coolers. The process is slightly differentfrom the experimental coolers: all oysters are removed and put in a common bucket while the containers are cleaned. After all containers areclean, oysters are re-assorted into containers randomly.
January 7, 2012Secondary stressFor the most part, the pH seems to be stable at about the right value for all of the coolers except for 101B. Continue to empty water from thiscooler and refill with new (high pH) water to counterbalance the low pH of about 7.
Did chemistry for all the coolers. Took spec pH and TA samples from the source water and from containers 1 and 2 (see diagram below forcontainer numbers). The pH in the containers was not more than 0.05 pH units less than the source water pH. Used the spec pH values tocalibrate the Durafet probes and also calibrated probes for temperature using the Fluke probe (see table). All probes were pretty accurate,except for 103A, which is the control treatment. The probe read a pH of about 8, but it was actually around 7. I verified this with a second specpH. I calibrated the probe, drained the water and it quickly righted itself but the oysters were exposed to low pH water for about 36 hours. Allthe treatments equilibrated to the new pH much better after the probes had been calibrated. I also ran TA titrations for the source water and forone of the containers for all the treatments. In general, the source water TA was around 2095 µmol/kg seawater and the container TA wasabout 10-20 units lower. TA samples were taken for all container 2s by rinsing out sample jars with 60 mL of seawater, filling them with 300 mLof seawater from the container and poisoning with 75 µL HgCl2. I ran CRMs at the beginning, middle, and end of the titrations. I also got TAvalues for Liza's 4 samples from her pinto abalone experiment done 9/29/11.
I also calibrated the Durafet monitoring the incoming water using 2 spec pH samples. The probe read pH 8.1 and, assuming a salinity of 29.7and temperature of 10°C, the actual pH is about 8.1.
In the evening, I fed all the oysters (experimental and acclimation) by diluting 19 mL of shellfish diet in 941 mL of ambient seawater andpipetting 9 mL of this mixture into each of the containers (flow turned off). I let the oysters sit for about an hour so that they could feed. After anhour, I turned the flow back on and cleaned all the experimental containers. It takes about 15 minutes to clean all 8 containers in eachtreatment and I do 2 at a time, so the oysters are only out of water for about 2 minutes. I put all the oysters back in the container that I hadtaken them from.
Tank salinity Durafet_pH Durafet_Temp Fluke_Temp spec_pH104A 29.5 7.70 13 12.4 7.56104B 29.7 7.59 13 12.4 7.49102B 30.1 7.86 13 12.4 7.67 273
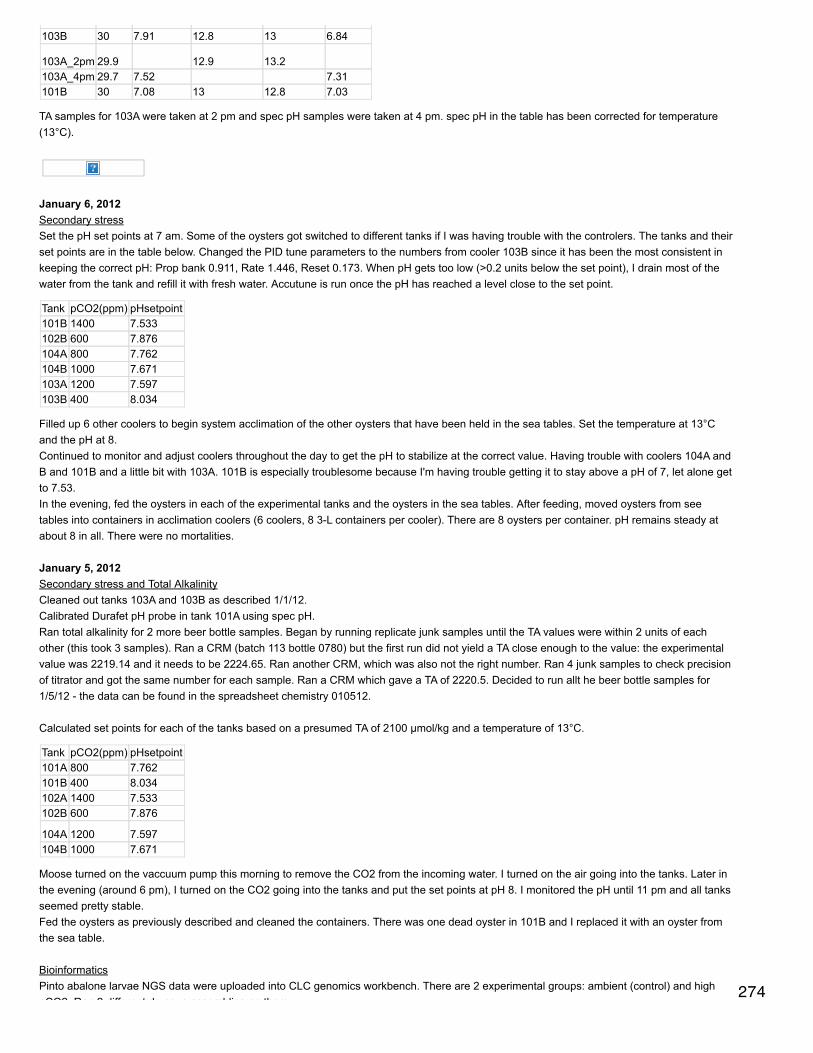
102B 30.1 7.86 13 12.4 7.67103B 30 7.91 12.8 13 6.84
103A_2pm 29.9 12.9 13.2103A_4pm 29.7 7.52 7.31101B 30 7.08 13 12.8 7.03
TA samples for 103A were taken at 2 pm and spec pH samples were taken at 4 pm. spec pH in the table has been corrected for temperature(13°C).
January 6, 2012Secondary stressSet the pH set points at 7 am. Some of the oysters got switched to different tanks if I was having trouble with the controlers. The tanks and theirset points are in the table below. Changed the PID tune parameters to the numbers from cooler 103B since it has been the most consistent inkeeping the correct pH: Prop bank 0.911, Rate 1.446, Reset 0.173. When pH gets too low (>0.2 units below the set point), I drain most of thewater from the tank and refill it with fresh water. Accutune is run once the pH has reached a level close to the set point.
Tank pCO2(ppm) pHsetpoint101B 1400 7.533102B 600 7.876104A 800 7.762104B 1000 7.671103A 1200 7.597103B 400 8.034
Filled up 6 other coolers to begin system acclimation of the other oysters that have been held in the sea tables. Set the temperature at 13°Cand the pH at 8.Continued to monitor and adjust coolers throughout the day to get the pH to stabilize at the correct value. Having trouble with coolers 104A andB and 101B and a little bit with 103A. 101B is especially troublesome because I'm having trouble getting it to stay above a pH of 7, let alone getto 7.53.In the evening, fed the oysters in each of the experimental tanks and the oysters in the sea tables. After feeding, moved oysters from seetables into containers in acclimation coolers (6 coolers, 8 3-L containers per cooler). There are 8 oysters per container. pH remains steady atabout 8 in all. There were no mortalities.
January 5, 2012Secondary stress and Total AlkalinityCleaned out tanks 103A and 103B as described 1/1/12.Calibrated Durafet pH probe in tank 101A using spec pH.Ran total alkalinity for 2 more beer bottle samples. Began by running replicate junk samples until the TA values were within 2 units of eachother (this took 3 samples). Ran a CRM (batch 113 bottle 0780) but the first run did not yield a TA close enough to the value: the experimentalvalue was 2219.14 and it needs to be 2224.65. Ran another CRM, which was also not the right number. Ran 4 junk samples to check precisionof titrator and got the same number for each sample. Ran a CRM which gave a TA of 2220.5. Decided to run allt he beer bottle samples for1/5/12 - the data can be found in the spreadsheet chemistry 010512.
Calculated set points for each of the tanks based on a presumed TA of 2100 µmol/kg and a temperature of 13°C.
Tank pCO2(ppm) pHsetpoint101A 800 7.762101B 400 8.034102A 1400 7.533102B 600 7.876
104A 1200 7.597104B 1000 7.671
Moose turned on the vaccuum pump this morning to remove the CO2 from the incoming water. I turned on the air going into the tanks. Later inthe evening (around 6 pm), I turned on the CO2 going into the tanks and put the set points at pH 8. I monitored the pH until 11 pm and all tanksseemed pretty stable.Fed the oysters as previously described and cleaned the containers. There was one dead oyster in 101B and I replaced it with an oyster fromthe sea table.
BioinformaticsPinto abalone larvae NGS data were uploaded into CLC genomics workbench. There are 2 experimental groups: ambient (control) and highpCO2. Ran 2 different de novo assemblies on them.
274
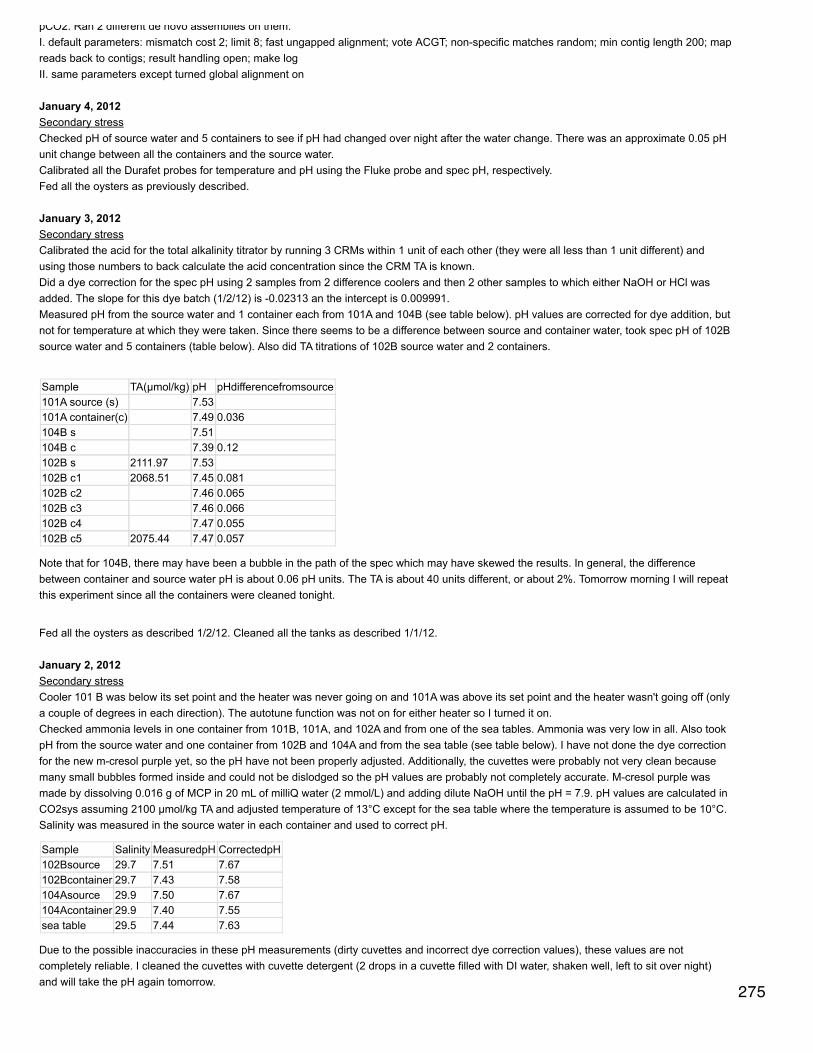
pCO2. Ran 2 different de novo assemblies on them.I. default parameters: mismatch cost 2; limit 8; fast ungapped alignment; vote ACGT; non-specific matches random; min contig length 200; mapreads back to contigs; result handling open; make logII. same parameters except turned global alignment on
January 4, 2012Secondary stressChecked pH of source water and 5 containers to see if pH had changed over night after the water change. There was an approximate 0.05 pHunit change between all the containers and the source water.Calibrated all the Durafet probes for temperature and pH using the Fluke probe and spec pH, respectively.Fed all the oysters as previously described.
January 3, 2012Secondary stressCalibrated the acid for the total alkalinity titrator by running 3 CRMs within 1 unit of each other (they were all less than 1 unit different) andusing those numbers to back calculate the acid concentration since the CRM TA is known.Did a dye correction for the spec pH using 2 samples from 2 difference coolers and then 2 other samples to which either NaOH or HCl wasadded. The slope for this dye batch (1/2/12) is -0.02313 an the intercept is 0.009991.Measured pH from the source water and 1 container each from 101A and 104B (see table below). pH values are corrected for dye addition, butnot for temperature at which they were taken. Since there seems to be a difference between source and container water, took spec pH of 102Bsource water and 5 containers (table below). Also did TA titrations of 102B source water and 2 containers.
Sample TA(µmol/kg) pH pHdifferencefromsource101A source (s) 7.53101A container(c) 7.49 0.036104B s 7.51104B c 7.39 0.12102B s 2111.97 7.53102B c1 2068.51 7.45 0.081102B c2 7.46 0.065102B c3 7.46 0.066102B c4 7.47 0.055102B c5 2075.44 7.47 0.057
Note that for 104B, there may have been a bubble in the path of the spec which may have skewed the results. In general, the differencebetween container and source water pH is about 0.06 pH units. The TA is about 40 units different, or about 2%. Tomorrow morning I will repeatthis experiment since all the containers were cleaned tonight.
Fed all the oysters as described 1/2/12. Cleaned all the tanks as described 1/1/12.
January 2, 2012Secondary stressCooler 101 B was below its set point and the heater was never going on and 101A was above its set point and the heater wasn't going off (onlya couple of degrees in each direction). The autotune function was not on for either heater so I turned it on.Checked ammonia levels in one container from 101B, 101A, and 102A and from one of the sea tables. Ammonia was very low in all. Also tookpH from the source water and one container from 102B and 104A and from the sea table (see table below). I have not done the dye correctionfor the new m-cresol purple yet, so the pH have not been properly adjusted. Additionally, the cuvettes were probably not very clean becausemany small bubbles formed inside and could not be dislodged so the pH values are probably not completely accurate. M-cresol purple wasmade by dissolving 0.016 g of MCP in 20 mL of milliQ water (2 mmol/L) and adding dilute NaOH until the pH = 7.9. pH values are calculated inCO2sys assuming 2100 µmol/kg TA and adjusted temperature of 13°C except for the sea table where the temperature is assumed to be 10°C.Salinity was measured in the source water in each container and used to correct pH.
Sample Salinity MeasuredpH CorrectedpH102Bsource 29.7 7.51 7.67102Bcontainer 29.7 7.43 7.58104Asource 29.9 7.50 7.67104Acontainer 29.9 7.40 7.55sea table 29.5 7.44 7.63
Due to the possible inaccuracies in these pH measurements (dirty cuvettes and incorrect dye correction values), these values are notcompletely reliable. I cleaned the cuvettes with cuvette detergent (2 drops in a cuvette filled with DI water, shaken well, left to sit over night)and will take the pH again tomorrow.
275
edit
Fed the oysters in the containers and sea tables by turning off flow and giving them ~120,000 cells per mL of shellfish diet. Put 19 mL ofshellfish diet in 941 mL of seawater and gave 9 mL to the container oysters and 255 mL to the sea table oysters (estimated sea tabledimensions used to calculate volume: 3' x 2' x 0.5').
January 1, 2012Secondary stressOysters were fed as described 12/31/11 except they were fed ~120,000 cells per mLEmptied all coolers and cleaned out by removing debris, wiping down with Vortex, rinsing and wiping down with freshwater and then salt water.Coolers were then refilled with salt water. Only 6 oysters were replaced in each of the containers (which had been cleaned by rinsing with freshand then salt water) and only 6 coolers were used (8 reps of 6 per cooler). These will be the oysters used in the 1 week OA exposure. Theremaining oysters were divided between 2 sea tables.
December 31, 2011Secondary stressFed oysters in their containers about 60,000 cells of algae (Shellfish Diet 1800) per mL by diluting the SD in seawater and turning on flow incontainers for ~30 minutes. Checked ammonia levels of a few containers and all were low.
December 30, 2011Secondary stressBrought oysters up to Friday Harbor. Changed filters with Michelle (put in new bag filters and clean 0.2 µm filters). Turned on water to coolersand let run through to rinse out lines for > 1 hour. Put ~110 oysters in each of 6 coolers and set temperature to 13°C. Moose later told me thathaving them in the coolers would contaminate the water for the remainder of the experiment, so put oysters in microcosm containers (3.5 L). 10oysters were placed in each containers and 8 containers were put in each of 8 coolers. Green drippers (57.5 mL/ min) were used for flow ofwater into containers.
December 29, 2011Secondary Stress2 am: collected ~650 oysters (same group as used for most recent heat stress experiment) in Oyster Bay at low tide. Put oysters in mesh bagsin a cooler, covered with towels and put a few ice packs on top of the towels. The oysters remained in the cooler (ice packs were replacedwhen thawed) until the afternoon of 12/30.
Emma's Lab Notebook Autumn 2011December 28, 2011Secondary stress: heat shock wrap-upSam and Lisa attended to the heat shocked oysters while I was gone this past week.Dec 21: none deadDec 22: all dead in light blue (43°C heat shock), 1 dead in purple (42°C)Dec 23: none deadDec 24: 2 dead in purple, high ammonia and low pH so Lisa did a 50% water changeDec 25: none dead, high ammonia 50% water changeDec 26: none deadDec 27: end experiment
100% mortality from 43°C heat shock by 72 hours post-shock. 30% mortality from 42°C heat shock by 96 hours post-shock.
December 20, 2011Secondary stressChecked the oysters around 11 am and 1 was dead in the 43°C heat shocked group (light blue zip tie). Decreased water level and fed oysters2 mL of shellfish diet diluted in 300 mL of seawater. After 1 hour, the water was not clear (oysters were not eating much).
December 19, 2011Secondary stressBegan heat shock of oysters to find LHT at 12:15 pm. 10 oysters were used for each temperature. Beakers were filled to 800 mL with seawaterand placed in the water bath and allowed to equilibrate to temperature. Prior to 1 hour long heat shock, oysters were preheated for 10 minutesin a separate beaker. The preheating is done to make sure that the internal temperature of the oysters actually reaches the temperature of thewater and to avoid the initial decrease in T that occurs when the oysters are put in the beakers.
Time HeatShockTemp Color12:15 38°C green13:47 39 darkblue
276

13:47 39 darkblue15: 36 40 red17:45 41 brown19:15 42 purple20:40 43 lightblue
Some of the oysters from the 41°C heat shock were gaping after 1 hour, but none were dead.Checked the ammonia of the tank around 4 pm. Was at about 0.25 ppm. Added more denitrifying bacteria and did partial water change.
OA FHL 2011qPCR same as EF1a of FHL OA samples on 12/15/11 but using v-type H+ transporter primers with an annealing T of 60°C.
Results: All cDNA samples amplified but had double melt peak. There was no amplification in gDNA or NTCs. There was no difference innormalized expression among treatments.
December 18, 2011Secondary stressFed the oysters at 3:30 pm by diluting 2 mL of shellfish diet in about 300 mL of seawater, reducing the water level in the tank, and letting theoysters feed for 1 hour.The ammonia was between 0.25-0.5 ppm so did a partial water change.
December 17, 2011Secondary stressFed the oysters around 9 am but only put 2 mL of shellfish diet in the water. They cleared all algae after about 1 hour. Temperature was about13.6°C and ammonia was 0.5 ppm. Did a complete water change including rinsing out sediment/pseudofeces at the bottom of the tank. Addedmore denitrifying bacteria after the water change.
OA FHL 2011qPCR using v-type H+ transporter primers, exact same PCR as yesterday except used 60°C annealing T.
Results: gDNA did not amplify (neither did NTCs) and cDNA did. However, there is still a double melt peak for the cDNA.
Uploaded with Skitch!
277
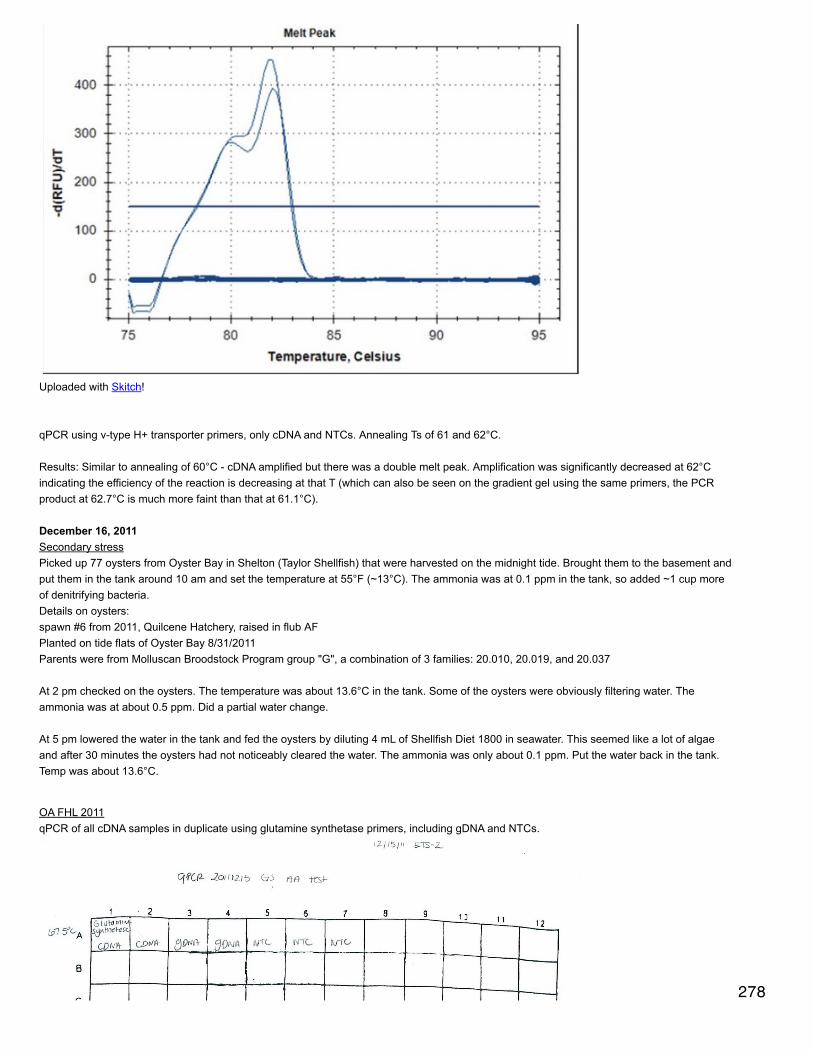
Uploaded with Skitch!
qPCR using v-type H+ transporter primers, only cDNA and NTCs. Annealing Ts of 61 and 62°C.
Results: Similar to annealing of 60°C - cDNA amplified but there was a double melt peak. Amplification was significantly decreased at 62°Cindicating the efficiency of the reaction is decreasing at that T (which can also be seen on the gradient gel using the same primers, the PCRproduct at 62.7°C is much more faint than that at 61.1°C).
December 16, 2011Secondary stressPicked up 77 oysters from Oyster Bay in Shelton (Taylor Shellfish) that were harvested on the midnight tide. Brought them to the basement andput them in the tank around 10 am and set the temperature at 55°F (~13°C). The ammonia was at 0.1 ppm in the tank, so added ~1 cup moreof denitrifying bacteria.Details on oysters:spawn #6 from 2011, Quilcene Hatchery, raised in flub AFPlanted on tide flats of Oyster Bay 8/31/2011Parents were from Molluscan Broodstock Program group "G", a combination of 3 families: 20.010, 20.019, and 20.037
At 2 pm checked on the oysters. The temperature was about 13.6°C in the tank. Some of the oysters were obviously filtering water. Theammonia was at about 0.5 ppm. Did a partial water change.
At 5 pm lowered the water in the tank and fed the oysters by diluting 4 mL of Shellfish Diet 1800 in seawater. This seemed like a lot of algaeand after 30 minutes the oysters had not noticeably cleared the water. The ammonia was only about 0.1 ppm. Put the water back in the tank.Temp was about 13.6°C.
OA FHL 2011qPCR of all cDNA samples in duplicate using glutamine synthetase primers, including gDNA and NTCs.
278

Uploaded with Skitch!
Results: All samples amplified except for 105A2 and 103B3. There was no amplification in the gDNA controls or NTCs. ANOVA of thenormalized gene expression shows no significant difference between treatments.
279

Uploaded with Skitch!
Uploaded with Skitch!
qPCR of all cDNA samples in duplicate using aspartate aminotransferase primers, including gDNA and NTCs. The plate had the exact samelayout at the glutamine synthetase. Annealing T for aspartate aminotransferase was 63.5°C.
Results: cDNA amplified except for 1 of the replicates each for both 105A2 and 103B3. The replicates that did amplify for those samples cameup at >39 Cq. Analysis based on PCR miner, which did not detect amplification in either of those samples, finds no difference betweentreatments.
280
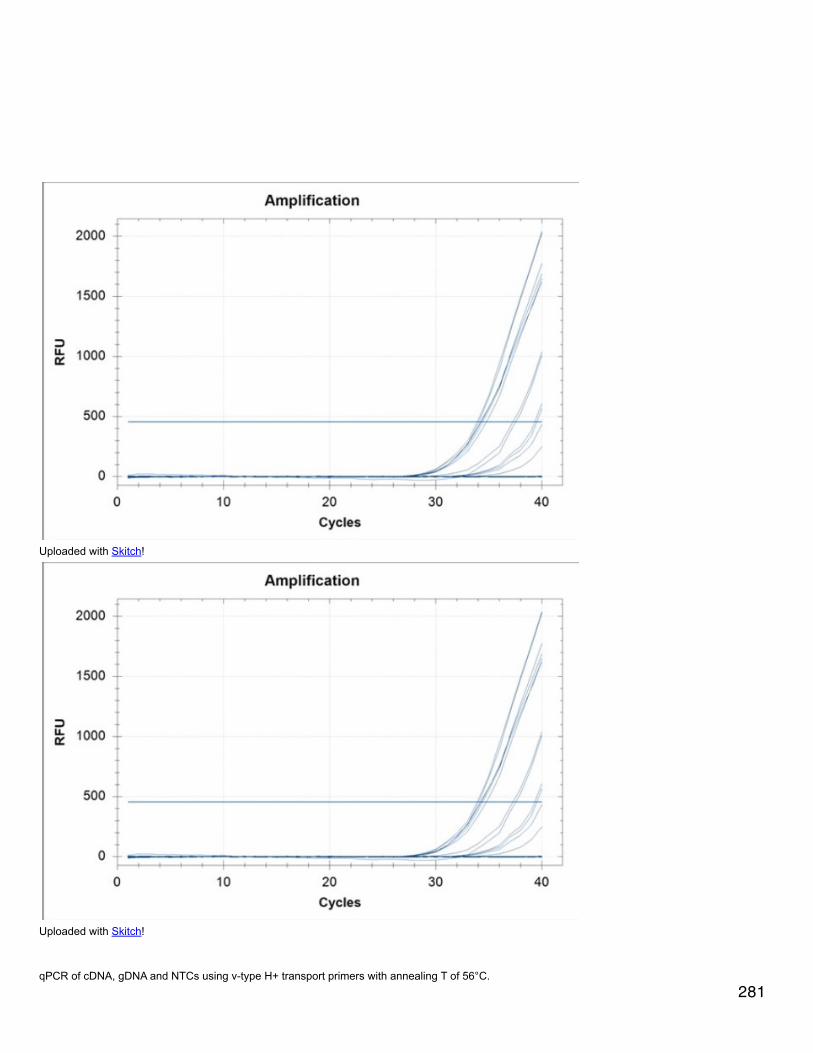
Uploaded with Skitch!
Uploaded with Skitch!
qPCR of cDNA, gDNA and NTCs using v-type H+ transport primers with annealing T of 56°C.281
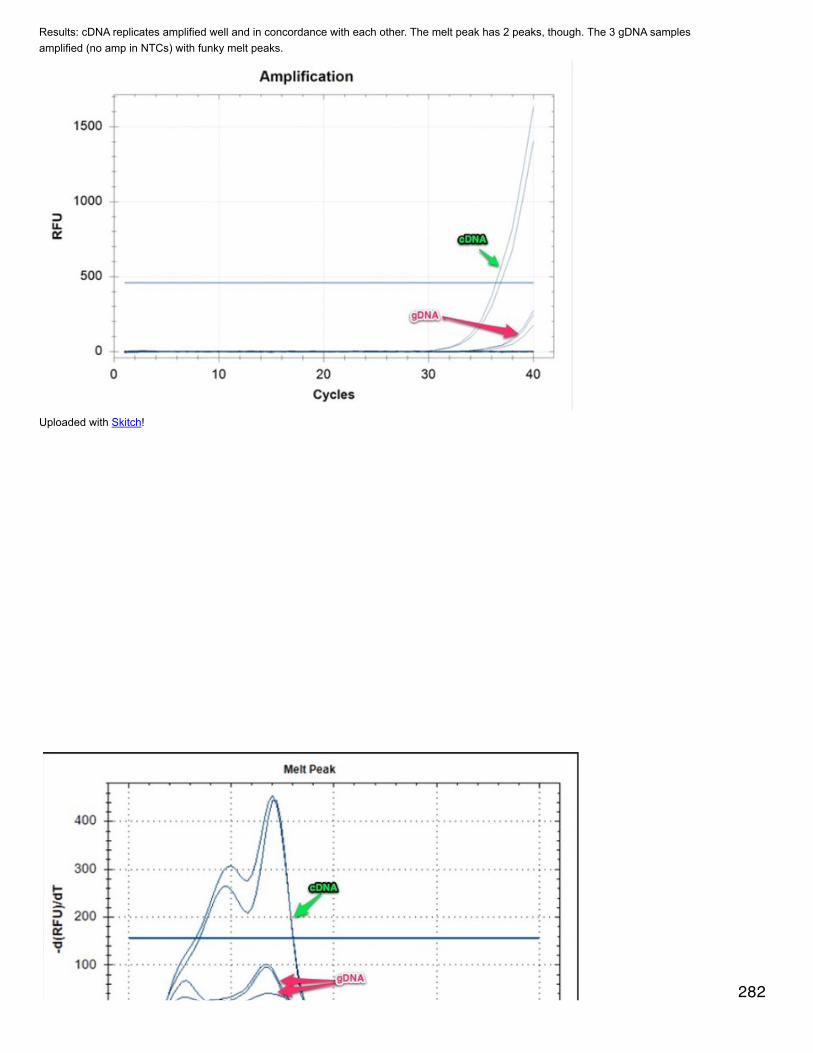
Results: cDNA replicates amplified well and in concordance with each other. The melt peak has 2 peaks, though. The 3 gDNA samplesamplified (no amp in NTCs) with funky melt peaks.
Uploaded with Skitch!
282

Uploaded with Skitch!
December 15, 2011OA FHL 2011: primersGradient PCR using new primers: v-type H+ transporter. Master mix is made of 12.5ul Apex, 10.5 ul water, 0.5 ul of each 10 uM primer, and 1ul template (cDNA or gDNA). cDNA is in the first row of the plate (with a NTC in well 2) and gDNA is in the second row. The PCR protocol is95C for 10 min, 40 cycles of 95C 15s, annealing T 15s, and 72C 30s, followed by 95C 10s and 72C 10 min. The annealing T range from 50-65C: 50, 50.4, 51.3, 52.5, 54.2, 56.4, 59, 61.1, 62.7, 63.8, 64.7, 65.
Uploaded with Skitch!
Results: cDNA amplified well through annealing T of 59°C. gDNA shows non-specific binding through an annealing T of 54°C (with primerdimer still apparent at 56°C). qPCR at annealing T greater than or equal to 55°C should work well for cDNA-specific binding.
OA FHL 2011qPCR using EF1a primers of FHL OA samples in duplicate , 3 ul of template per reaction. 2 gDNA controls and 3 NTCs on the plate.
283

Uploaded with Skitch!
Uploaded with Skitch!
284

Uploaded with Skitch!
Results: All cDNA samples amplified and replicates came up at the same Cq. All amplified products had the same melt peak. There was noamplification in any of the NTCs nor in the gDNA controls.
qPCR using glutamine synthetase and aspartate aminotransferase primers at previously determined annealing Ts of 67.5 and 63.5C,respectively. Included gDNA and NTCs on the plate.
285

Uploaded with Skitch!
Results: The dropbox on the computer malfunctioned and I am not able to export the data or report, but both primer pairs amplified a singleproduct with replicates in good agreement for cDNA. There was no amplification in gDNA or NTCs.
Secondary StressSammi helped me set up a large tank with filters and water chiller for the oysters. We set the temperature at 59°F. Added ~2 cups denitrifyingbacteria (Proline).
December 12, 2011OA FHL 2011: primersSR aligned mRNA for v-type H+ transporters (see 12.9.11) with genomic sequence from BGI for C. gigas to determine intron/exon boundaries.See his lab notebook for details. I designed primers to span the intron/exon boundaries at base pairs 1419 (1410-1429) and 1592 (1585-1604). The reverse primer was designed off of the reverse complement of the sequence. The primers are both 45% GC with Tm of 49.73°C.The SRIDs are 1436 and 1437.
OA FHL 2011: reverse transcriptionReverse transcribed remaining RNA from July 29, 2011 C. gigas larvae. Since we're not sure what the true concentration of RNA (vs. gDNA) inthe samples is, it seemed the safest to reverse transcribe all of it to get as much cDNA as possible. For each volume of RNA, scaled up theamount of MMLV reagents used based on a total volume of 17.75 µL RNA for 1 reaction. The master mix in the table refers to 5x MMLV RTbuffer (5µL per reaction), 10 µM dNTPs (1.25 µL), and 0.5 µL reverse transcriptase.
Sample VolumeRNA VolOligodT VolMasterMix 286
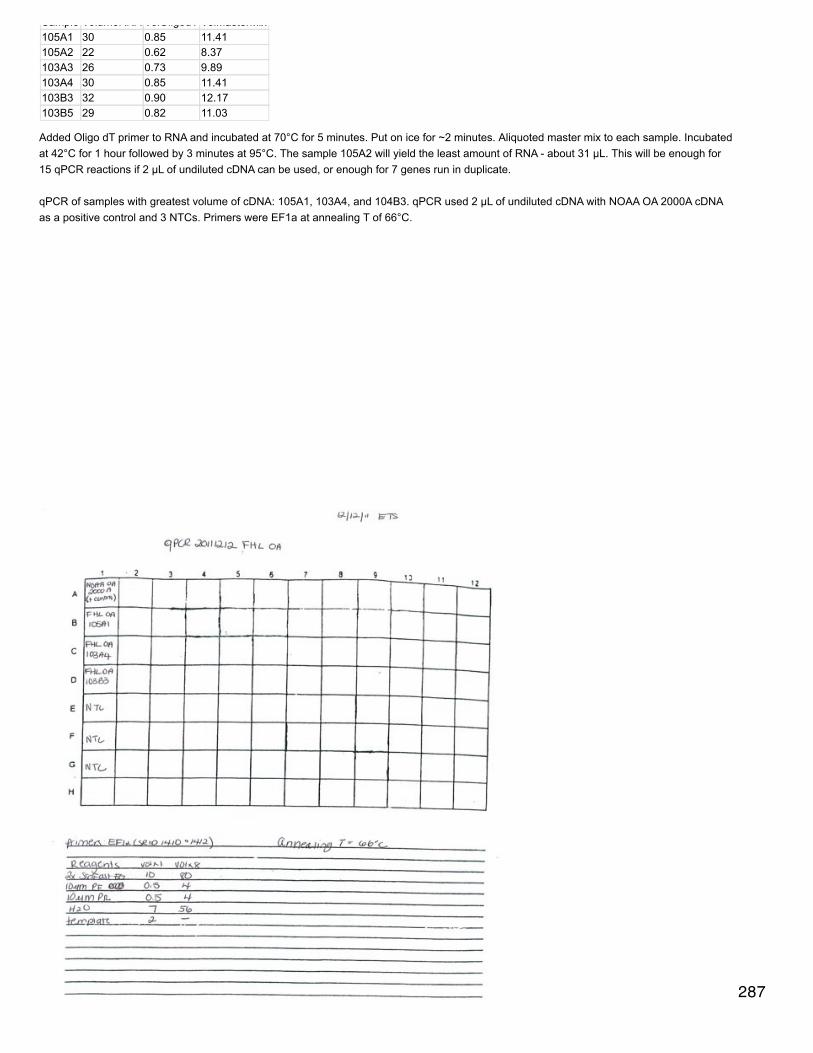
Sample VolumeRNA VolOligodT VolMasterMix105A1 30 0.85 11.41105A2 22 0.62 8.37103A3 26 0.73 9.89103A4 30 0.85 11.41103B3 32 0.90 12.17103B5 29 0.82 11.03
Added Oligo dT primer to RNA and incubated at 70°C for 5 minutes. Put on ice for ~2 minutes. Aliquoted master mix to each sample. Incubatedat 42°C for 1 hour followed by 3 minutes at 95°C. The sample 105A2 will yield the least amount of RNA - about 31 µL. This will be enough for15 qPCR reactions if 2 µL of undiluted cDNA can be used, or enough for 7 genes run in duplicate.
qPCR of samples with greatest volume of cDNA: 105A1, 103A4, and 104B3. qPCR used 2 µL of undiluted cDNA with NOAA OA 2000A cDNAas a positive control and 3 NTCs. Primers were EF1a at annealing T of 66°C.
287
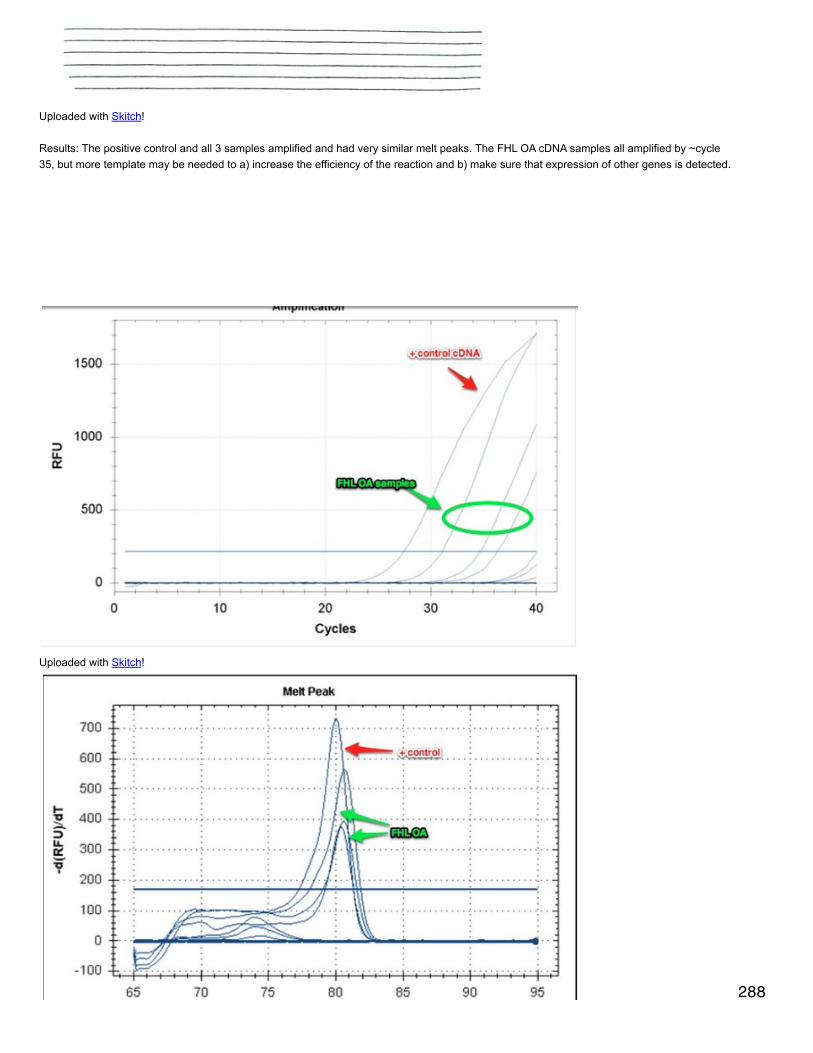
Uploaded with Skitch!
Results: The positive control and all 3 samples amplified and had very similar melt peaks. The FHL OA cDNA samples all amplified by ~cycle35, but more template may be needed to a) increase the efficiency of the reaction and b) make sure that expression of other genes is detected.
Uploaded with Skitch!
288
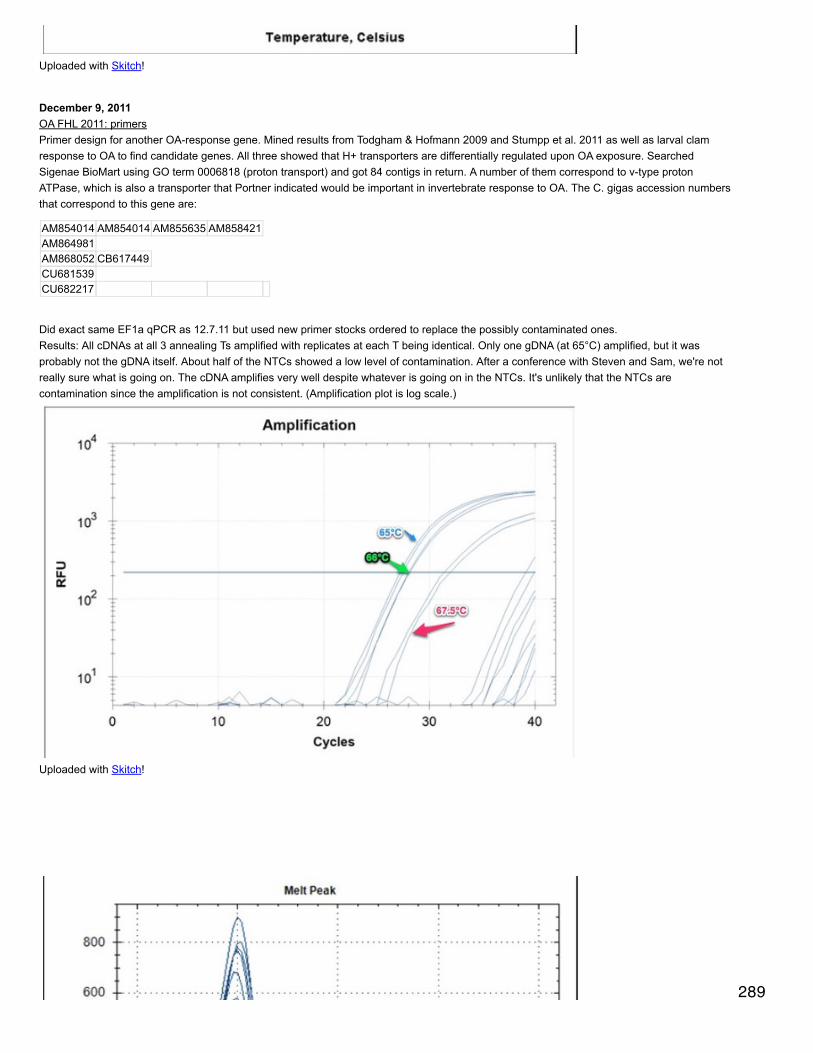
Uploaded with Skitch!
December 9, 2011OA FHL 2011: primersPrimer design for another OA-response gene. Mined results from Todgham & Hofmann 2009 and Stumpp et al. 2011 as well as larval clamresponse to OA to find candidate genes. All three showed that H+ transporters are differentially regulated upon OA exposure. SearchedSigenae BioMart using GO term 0006818 (proton transport) and got 84 contigs in return. A number of them correspond to v-type protonATPase, which is also a transporter that Portner indicated would be important in invertebrate response to OA. The C. gigas accession numbersthat correspond to this gene are:
AM854014 AM854014 AM855635 AM858421AM864981AM868052 CB617449CU681539CU682217
Did exact same EF1a qPCR as 12.7.11 but used new primer stocks ordered to replace the possibly contaminated ones.Results: All cDNAs at all 3 annealing Ts amplified with replicates at each T being identical. Only one gDNA (at 65°C) amplified, but it wasprobably not the gDNA itself. About half of the NTCs showed a low level of contamination. After a conference with Steven and Sam, we're notreally sure what is going on. The cDNA amplifies very well despite whatever is going on in the NTCs. It's unlikely that the NTCs arecontamination since the amplification is not consistent. (Amplification plot is log scale.)
Uploaded with Skitch!
289

Uploaded with Skitch!
qPCR using EF1a primers and just NTCs (x3).Results: A small amount of amplification occurred in each NTC.
290
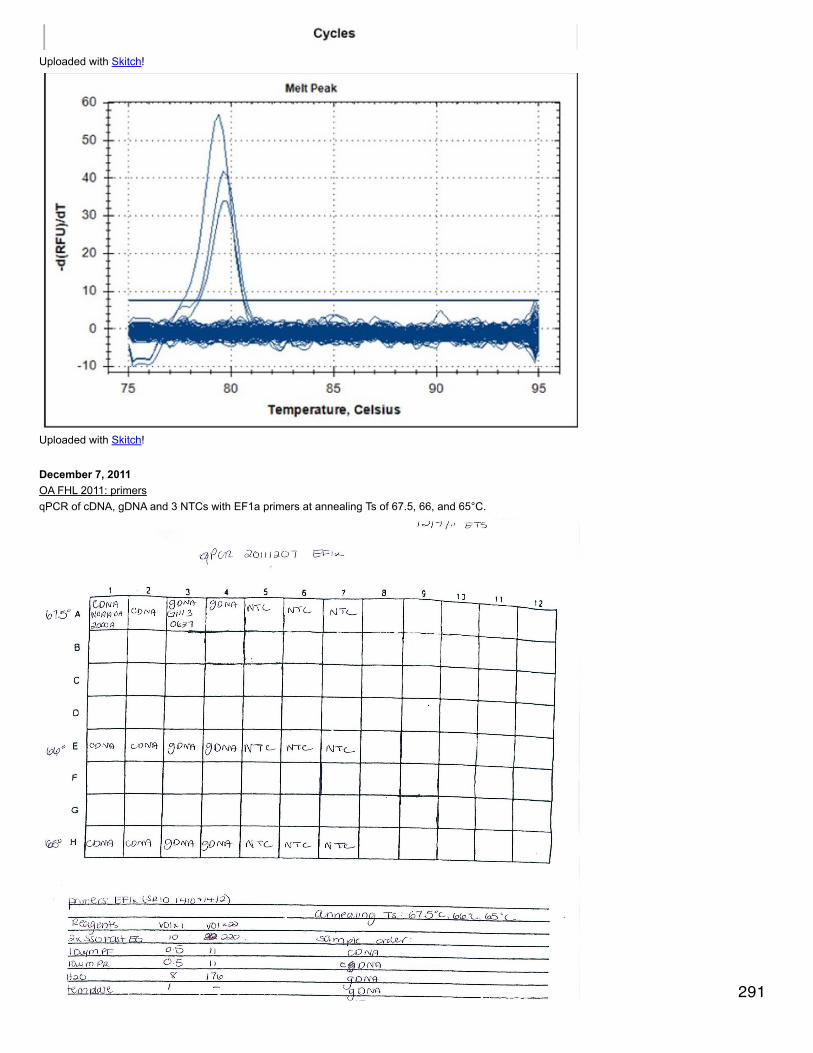
Uploaded with Skitch!
Uploaded with Skitch!
December 7, 2011OA FHL 2011: primersqPCR of cDNA, gDNA and 3 NTCs with EF1a primers at annealing Ts of 67.5, 66, and 65°C.
291
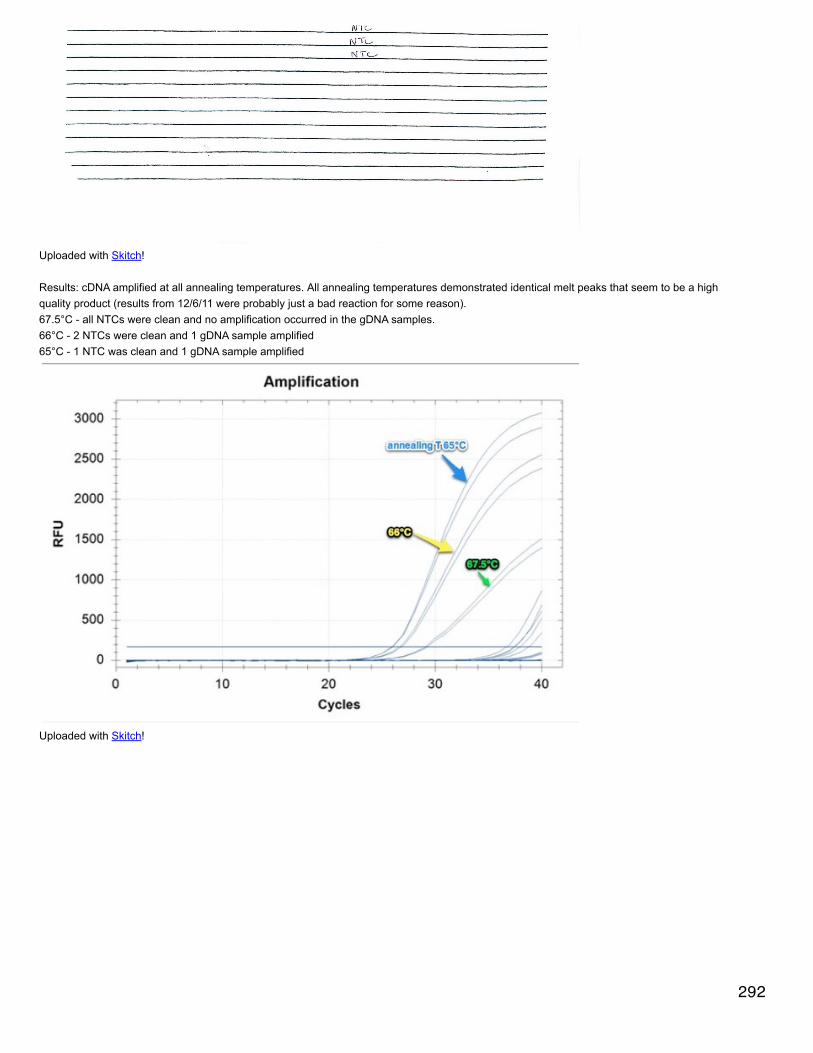
Uploaded with Skitch!
Results: cDNA amplified at all annealing temperatures. All annealing temperatures demonstrated identical melt peaks that seem to be a highquality product (results from 12/6/11 were probably just a bad reaction for some reason).67.5°C - all NTCs were clean and no amplification occurred in the gDNA samples.66°C - 2 NTCs were clean and 1 gDNA sample amplified65°C - 1 NTC was clean and 1 gDNA sample amplified
Uploaded with Skitch!
292

Uploaded with Skitch!
The unlabeled amplification curves and melt peaks correspond to the gDNA and NTC samples that amplified.
qPCR of cDNA, gDNA (x3) and 3 NTCs with aspartate aminotransferase primers (AY660003) with annealing T of 63.5°C.
293

Uploaded with Skitch!
Results: Only the cDNA amplified - there was no amplification at all in the gDNA or NTCs. The product showed a single melt peak.
294

Uploaded with Skitch!
Uploaded with Skitch!
December 6, 2011OA FHL 2011: primersGradient PCR with same conditions as 11/18 except used just 1 µL of template. After PCR, products were run on 1.5% agarose gel + EtBr withHyperladder II (Bioline).
Uploaded with Skitch!
Results: Annealing temperatures are in blue at the top of the wells. The primers amplified a product of about 100 bp in the cDNA andamplification was strong through annealing temperature of 67.7°C. There was a lot of non-specific binding in the gDNA, but the amplificationgot considerably weaker after 57.5°C and was almost non-existent by 66.1°C. Next step will be to do a qPCR testing cDNA and gDNA at anannealing temperature of 67.5°C.
qPCR of cDNA, 3 gDNA replicates and 3 NTCs using EF1a primers with an annealing T of 67.5°C.
295

Uploaded with Skitch!
296

Uploaded with Skitch!
Uploaded with Skitch!
Results: the cDNA amplified, but the melt peak was weird. There was no amplification in the gDNA or NTCs. Will try qPCR again at the sameannealing T as well as annealings of 66 and 65°C.
December 5, 2011OA FHL 2011: primersqPCR to check validity of using EF1a primers in selectively amplifying cDNA. One sample of cDNA as positive control and 3 samples each ofgDNA and NTC.Thermalcylcer protocol is 2stempamp+melt EvaGreen (55°C annealing T).
297
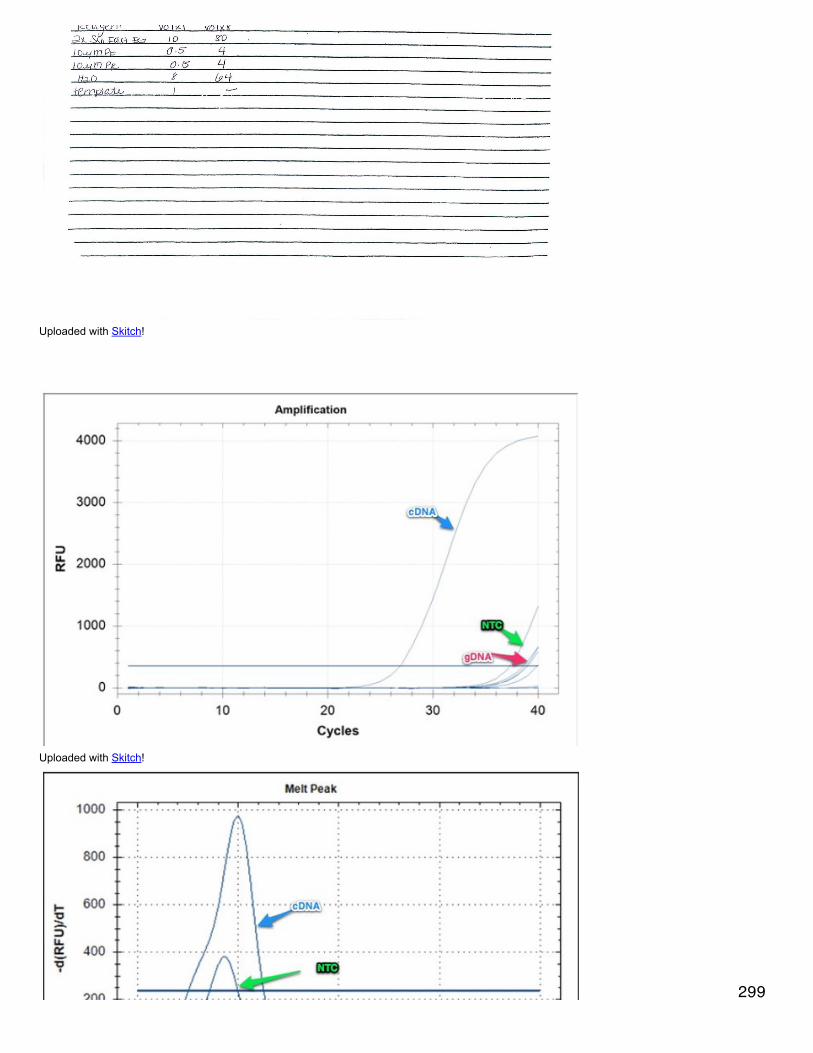
Uploaded with Skitch!
Uploaded with Skitch!
299
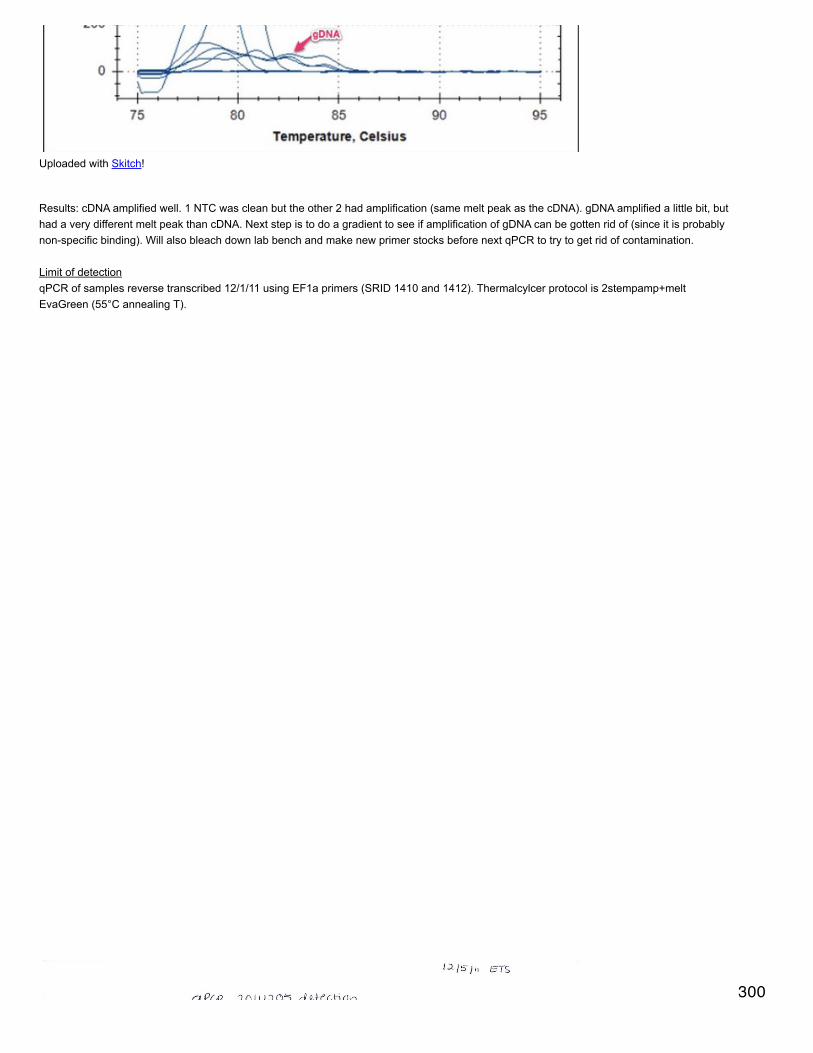
Uploaded with Skitch!
Results: cDNA amplified well. 1 NTC was clean but the other 2 had amplification (same melt peak as the cDNA). gDNA amplified a little bit, buthad a very different melt peak than cDNA. Next step is to do a gradient to see if amplification of gDNA can be gotten rid of (since it is probablynon-specific binding). Will also bleach down lab bench and make new primer stocks before next qPCR to try to get rid of contamination.
Limit of detectionqPCR of samples reverse transcribed 12/1/11 using EF1a primers (SRID 1410 and 1412). Thermalcylcer protocol is 2stempamp+meltEvaGreen (55°C annealing T).
300

Uploaded with Skitch!
Results: One NTC had some contamination, but it amplified much later than the samples. All samples amplified between Cqs of 26-34.
301

Uploaded with Skitch!
December 1, 2011OA FHL 2011Ran gradient PCR using new aspartate aminotransferase primers (SRID 1422 and 1423). The Gradient ran from 50-65°C using the Opticon.Mastermix was made of 12.5 µL Apex, 9.5 µL water, and 0.5 µL each of 10 µM primers with 2 µL cDNA (Gill C9) or gDNA (Gill 0627) template.Thermocycler profile was 95°C 10 min; 40 cycles of 95° 15s, annealing T 15s, 72° 30s; 95° 10s 72° 10 min.
Uploaded with Skitch!
Results: It looks like 63.8°C may be a good annealing temperature to selectively amplify the cDNA and not the gDNA amplicon.
qPCR using AY660003 primers of gDNA (Gill 0627) and 2 larval cDNA (NOAA OA Sept 2010 380A and 2000A). Annealing temperature of 302

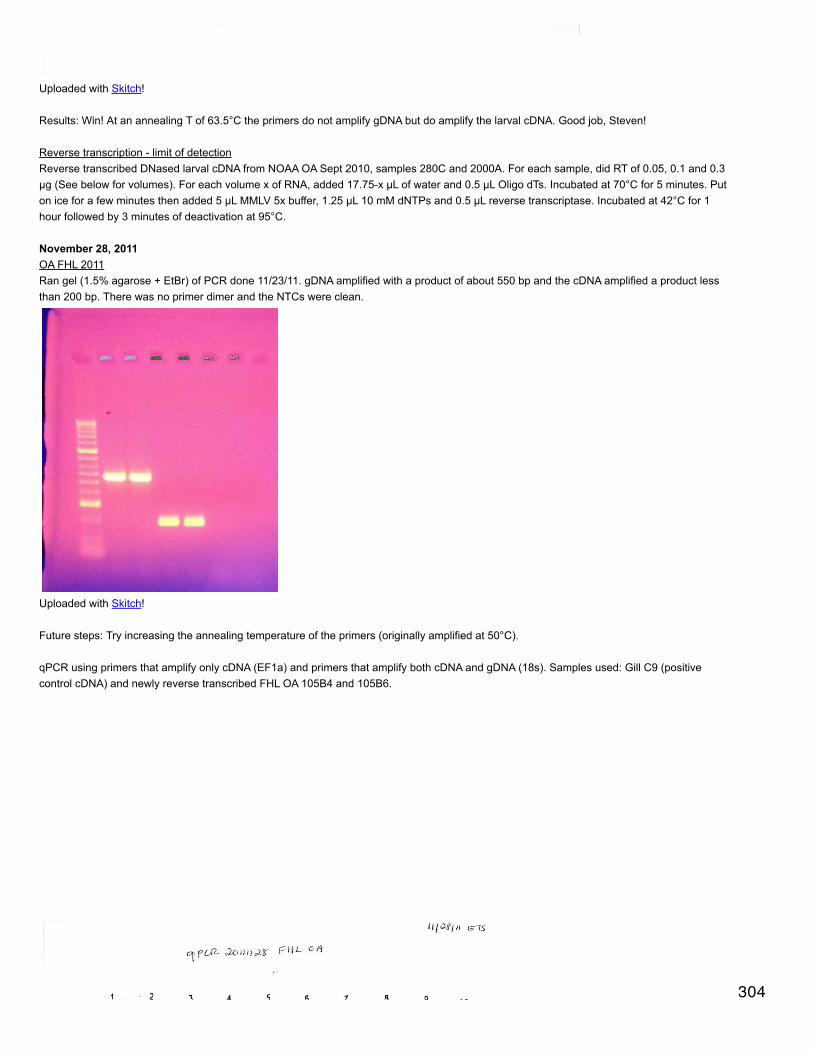
Uploaded with Skitch!
Results: Win! At an annealing T of 63.5°C the primers do not amplify gDNA but do amplify the larval cDNA. Good job, Steven!
Reverse transcription - limit of detectionReverse transcribed DNased larval cDNA from NOAA OA Sept 2010, samples 280C and 2000A. For each sample, did RT of 0.05, 0.1 and 0.3µg (See below for volumes). For each volume x of RNA, added 17.75-x µL of water and 0.5 µL Oligo dTs. Incubated at 70°C for 5 minutes. Puton ice for a few minutes then added 5 µL MMLV 5x buffer, 1.25 µL 10 mM dNTPs and 0.5 µL reverse transcriptase. Incubated at 42°C for 1hour followed by 3 minutes of deactivation at 95°C.
November 28, 2011OA FHL 2011Ran gel (1.5% agarose + EtBr) of PCR done 11/23/11. gDNA amplified with a product of about 550 bp and the cDNA amplified a product lessthan 200 bp. There was no primer dimer and the NTCs were clean.
Uploaded with Skitch!
Future steps: Try increasing the annealing temperature of the primers (originally amplified at 50°C).
qPCR using primers that amplify only cDNA (EF1a) and primers that amplify both cDNA and gDNA (18s). Samples used: Gill C9 (positivecontrol cDNA) and newly reverse transcribed FHL OA 105B4 and 105B6.
304

Uploaded with Skitch!
305

Uploaded with Skitch!
Results: Both primer pairs amplified C9, the positive control. 105B6 amplified a small amount for EF1a (pink) and 18s (blue), although therewas some contamination in the 18s NTC. 105B4 appears to have not amplified at all.
November 23, 2011OA FHL 2011Reverse transcribed Dnased RNA samples 105B4 and 105B6. The cDNA from these samples will be used as test runs for the new primers. To17.75 µL of RNA, added 0.5 µL Oligo dTs and incubated at 70°C for 5 minutes. Put samples on ice for about 3 minutes then added to each 5µL of MMLV 5x buffer, 1.25 µL of 10 mM dNTPs, and 0.5 µL of reverse transcriptase. Incubated at 42°C for 1 hour followed by a 95°Cinactivation for 3 minutes.
qPCR of new cDNA with EF1a primers and glutamine synthetase primers. Also included Gill C9 as a positive control and 2 NTCs. GS wasamplified at 67.7°C annealing T and EF1a at 55.
306

Uploaded with Skitch!
Results: NTCs were clean and C9 amplified for both primer sets. None of the larval cDNA amplified.
qPCR of NOAA OA 2000 ppm cDNA and Gill C9 with EF1a primers to make sure the primers work with larval cDNA (this cDNA has beensuccessfully amplified with multiple primers in the past).
307
Uploaded with Skitch!
Results: The EF1a primers successfully amplified both adult and larval cDNA. The NTCs were clean.
Received the primers that SR designed for aspartate aminotransferase (Cg_AY660003_F SRID 1422 and R SRID 1423). Did regular PCRusing Apex (12.5µL), water (8.5 µL) and 10 µM primers (0.5 µL each) with an annealing temperature of 50°C. Layout of samples in strip tubefor PCR is Gill 0627 gDNA (A), gDNA (B), Gill C9 cDNA (C), cDNA (D), NTC (E and F).
November 21, 2011OA FHL 2011qPCR with glutamine synthetase (annealing T of 67.7°C) and Tld (66.1°C) using gDNA and cDNA.
308
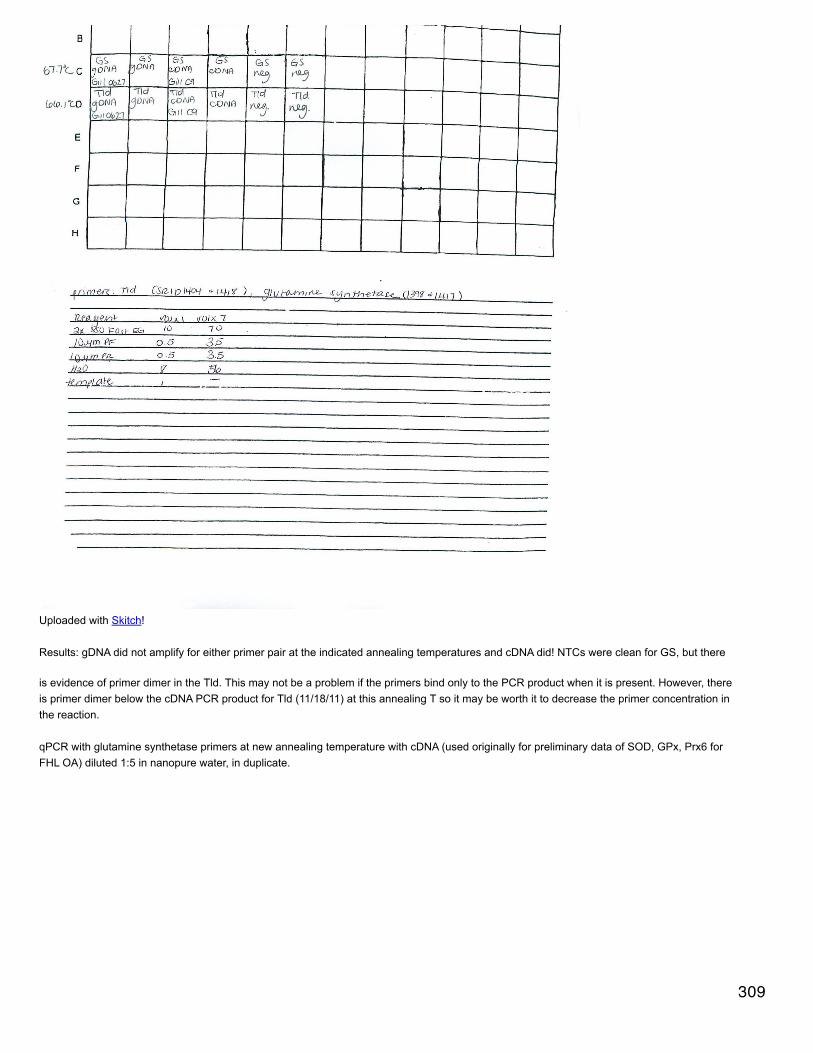
Uploaded with Skitch!
Results: gDNA did not amplify for either primer pair at the indicated annealing temperatures and cDNA did! NTCs were clean for GS, but there
is evidence of primer dimer in the Tld. This may not be a problem if the primers bind only to the PCR product when it is present. However, thereis primer dimer below the cDNA PCR product for Tld (11/18/11) at this annealing T so it may be worth it to decrease the primer concentration inthe reaction.
qPCR with glutamine synthetase primers at new annealing temperature with cDNA (used originally for preliminary data of SOD, GPx, Prx6 forFHL OA) diluted 1:5 in nanopure water, in duplicate.
309

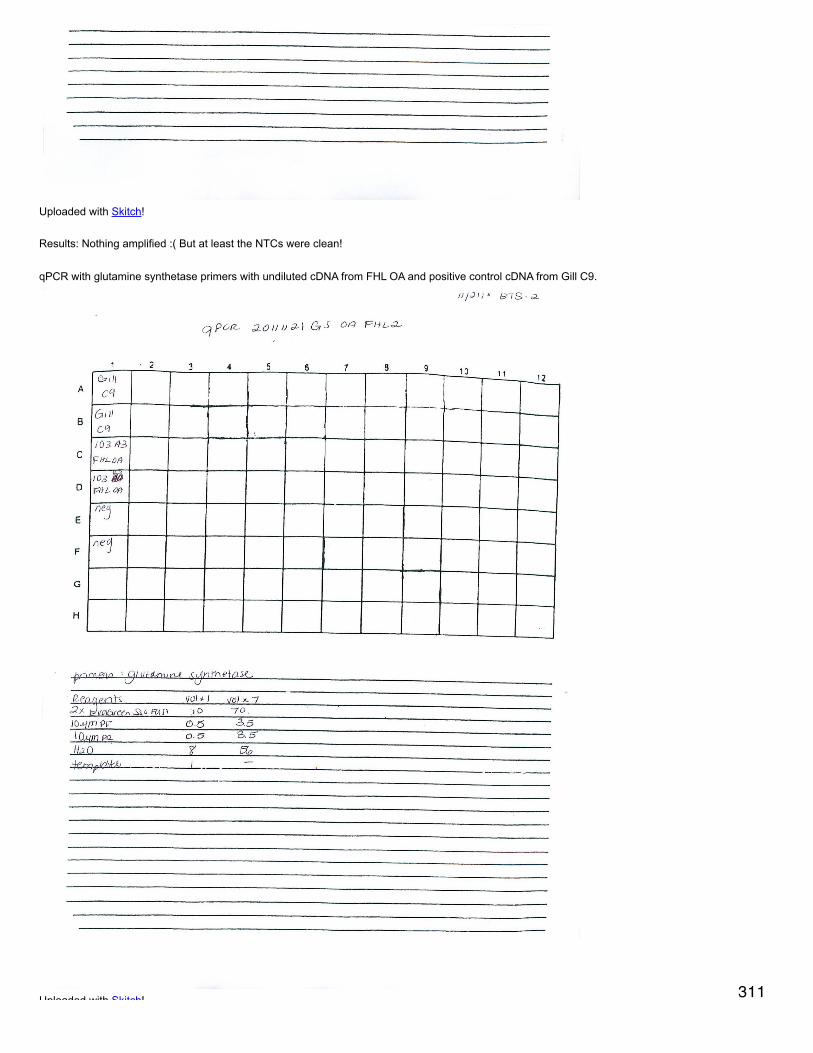
Uploaded with Skitch!
Results: Nothing amplified :( But at least the NTCs were clean!
qPCR with glutamine synthetase primers with undiluted cDNA from FHL OA and positive control cDNA from Gill C9.
Uploaded with Skitch! 311
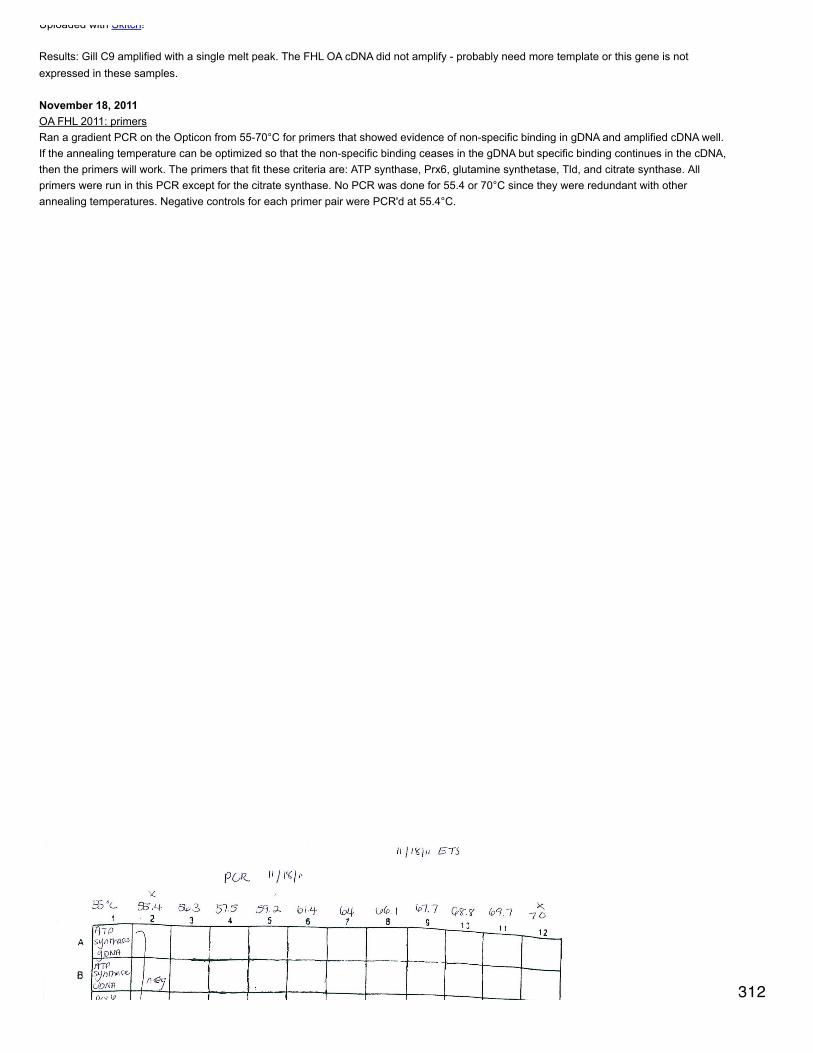
Uploaded with Skitch!
Results: Gill C9 amplified with a single melt peak. The FHL OA cDNA did not amplify - probably need more template or this gene is notexpressed in these samples.
November 18, 2011OA FHL 2011: primersRan a gradient PCR on the Opticon from 55-70°C for primers that showed evidence of non-specific binding in gDNA and amplified cDNA well.If the annealing temperature can be optimized so that the non-specific binding ceases in the gDNA but specific binding continues in the cDNA,then the primers will work. The primers that fit these criteria are: ATP synthase, Prx6, glutamine synthetase, Tld, and citrate synthase. Allprimers were run in this PCR except for the citrate synthase. No PCR was done for 55.4 or 70°C since they were redundant with otherannealing temperatures. Negative controls for each primer pair were PCR'd at 55.4°C.
312

Uploaded with Skitch!
Uploaded with Skitch!
Uploaded with Skitch!313
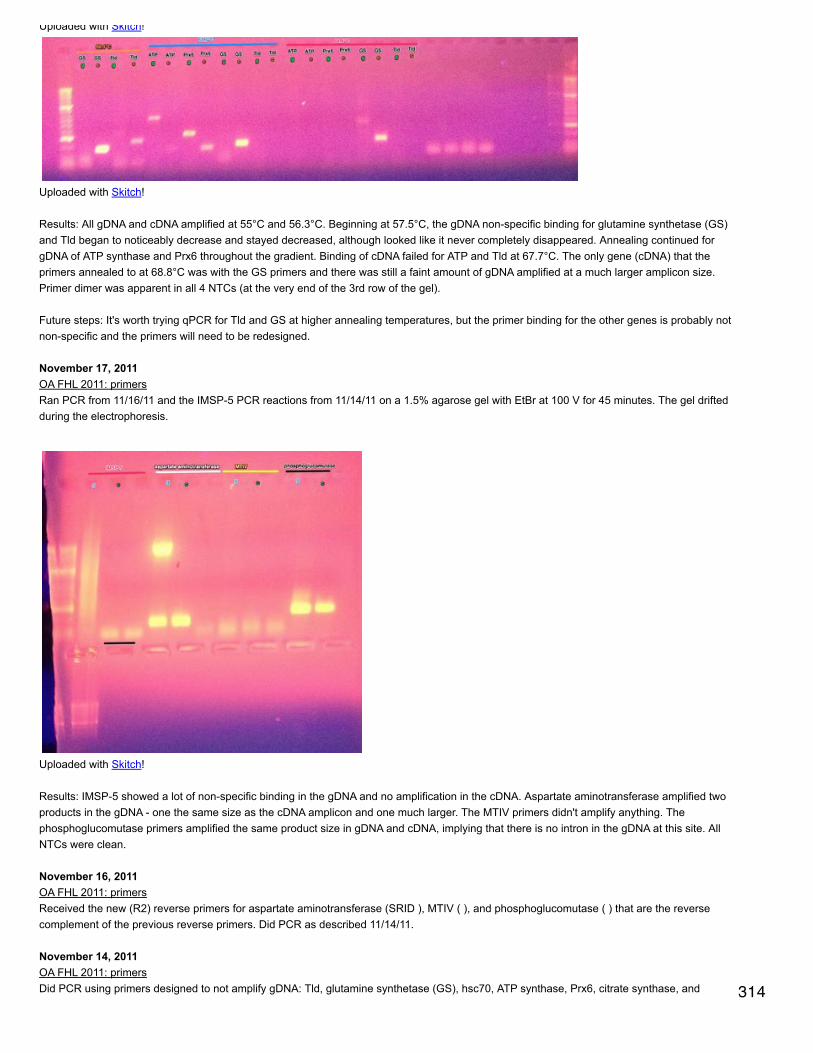
Uploaded with Skitch!
Uploaded with Skitch!
Results: All gDNA and cDNA amplified at 55°C and 56.3°C. Beginning at 57.5°C, the gDNA non-specific binding for glutamine synthetase (GS)and Tld began to noticeably decrease and stayed decreased, although looked like it never completely disappeared. Annealing continued forgDNA of ATP synthase and Prx6 throughout the gradient. Binding of cDNA failed for ATP and Tld at 67.7°C. The only gene (cDNA) that theprimers annealed to at 68.8°C was with the GS primers and there was still a faint amount of gDNA amplified at a much larger amplicon size.Primer dimer was apparent in all 4 NTCs (at the very end of the 3rd row of the gel).
Future steps: It's worth trying qPCR for Tld and GS at higher annealing temperatures, but the primer binding for the other genes is probably notnon-specific and the primers will need to be redesigned.
November 17, 2011OA FHL 2011: primersRan PCR from 11/16/11 and the IMSP-5 PCR reactions from 11/14/11 on a 1.5% agarose gel with EtBr at 100 V for 45 minutes. The gel driftedduring the electrophoresis.
Uploaded with Skitch!
Results: IMSP-5 showed a lot of non-specific binding in the gDNA and no amplification in the cDNA. Aspartate aminotransferase amplified twoproducts in the gDNA - one the same size as the cDNA amplicon and one much larger. The MTIV primers didn't amplify anything. Thephosphoglucomutase primers amplified the same product size in gDNA and cDNA, implying that there is no intron in the gDNA at this site. AllNTCs were clean.
November 16, 2011OA FHL 2011: primersReceived the new (R2) reverse primers for aspartate aminotransferase (SRID ), MTIV ( ), and phosphoglucomutase ( ) that are the reversecomplement of the previous reverse primers. Did PCR as described 11/14/11.
November 14, 2011OA FHL 2011: primersDid PCR using primers designed to not amplify gDNA: Tld, glutamine synthetase (GS), hsc70, ATP synthase, Prx6, citrate synthase, andIMSP-5. Each PCR reaction had 12.5 µL Apex master mix, 8.5 µL water, 0.5 µL of each primer, and 3 µL of template (either gDNA Gill 0627,
314

IMSP-5. Each PCR reaction had 12.5 µL Apex master mix, 8.5 µL water, 0.5 µL of each primer, and 3 µL of template (either gDNA Gill 0627,cDNA gill C9, or water for controls). For Tld, GS, and hsc70, the new reverse primers were used. The PCR was run using the QPCRthermalcycler profile in the EMMA directory. 10 µL of the PCR products were run on a 1.5% agarose gel with EtBr alongside 5 µL of Hyperlineladder II. There was not enough room on the gel for the IMSP-5 reactions.
Uploaded with Skitch!
gDNA is marked with a green "g", cDNA with a blue "c" and the negative control lanes are not marked at all.Results: All negative controls were clean. Tld has a lot of primer dimer. Tld, GS, hsc70, and citrate synthase all show multiple bands (products)amplified in the gDNA. All primers amplified gDNA products that are larger than expected for the cDNA amplicon, suggesting that these geneshave introns. hsc70 is the only primer pair that amplified a gDNA product of the same size as the expected cDNA product. All cDNA ampliconsare the expected size and only show a single product.
November 11, 2011Histology practiceAt 10:30 am (24 hours after putting the samples in Davidson's) I put the two tissue samples in 70% EtOH.
OA FHL 2011: primersqPCR using new reverse primers for Tld, glutamine synthetase, and hsc70. All of them amplified both gDNA and cDNA :( Melt peaks weredifferent between gDNA and cDNA for all primer sets.
November 10, 2011Secondary Stress trialTook samples from all jars for TA and spec pH at 8 am, then did a complete water change of all jars and took 1 sample from the new water forTA and spec pH. Salinity of the water in the jars was 29.5 and in the new water was 29.2 ppt. pH had dropped in all oyster jars. TA didn't dropmuch in the jars with 4 oysters in them, but did drop in the jars with 8 oysters.
Amy did 2 titrations and spec pH at noon. She did not record the mass of the water sample, so I cannot calculate TA from the titrations.
Histology practiceCarolyn showed me how to fix samples for histological analysis. We carefully shucked 2 oysters ("Emma 1" and "Emma 2") and slid the wholebody onto a kim wipe inside a weigh boat. We cut 3 sections for Emma 1 (gill + heart + kidney; gill + DG; adductor) and 2 for Emma 2 (gill +DG; adductor). The sections need to be cut cleanly (1 cut) and thick enough so that they hold their shape. The side that you are interested inlooking at should be put face-down in the small plastic box. The sections were put in Invertebrate Davidson's solution and will be left there for24 hours.
November 9, 2011Secondary Stress trialThis 2-day trial is designed to determine if smaller oysters alter the chemistry in 4 L jars as much as the previous batch. 4 4-L jars will be filledwith water and 2 will have 4 oysters, the other 2 will have 8. At 3 time points throughout today and tomorrow, pH and TA will be measured ineach jar. pH is measured using spec pH and TA is measured by doing a manual titration with 0.1 N HCl. For the titration, ~120 g of seawater is
315
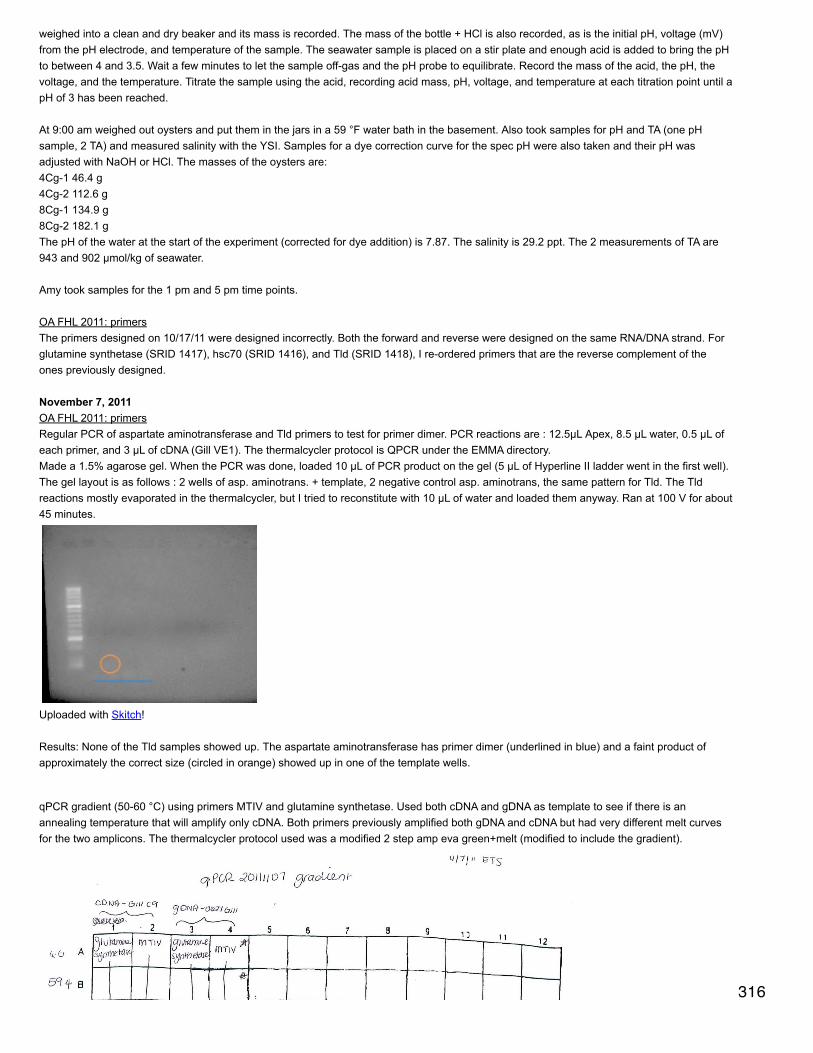
weighed into a clean and dry beaker and its mass is recorded. The mass of the bottle + HCl is also recorded, as is the initial pH, voltage (mV)from the pH electrode, and temperature of the sample. The seawater sample is placed on a stir plate and enough acid is added to bring the pHto between 4 and 3.5. Wait a few minutes to let the sample off-gas and the pH probe to equilibrate. Record the mass of the acid, the pH, thevoltage, and the temperature. Titrate the sample using the acid, recording acid mass, pH, voltage, and temperature at each titration point until apH of 3 has been reached.
At 9:00 am weighed out oysters and put them in the jars in a 59 °F water bath in the basement. Also took samples for pH and TA (one pHsample, 2 TA) and measured salinity with the YSI. Samples for a dye correction curve for the spec pH were also taken and their pH wasadjusted with NaOH or HCl. The masses of the oysters are:4Cg-1 46.4 g4Cg-2 112.6 g8Cg-1 134.9 g8Cg-2 182.1 gThe pH of the water at the start of the experiment (corrected for dye addition) is 7.87. The salinity is 29.2 ppt. The 2 measurements of TA are943 and 902 µmol/kg of seawater.
Amy took samples for the 1 pm and 5 pm time points.
OA FHL 2011: primersThe primers designed on 10/17/11 were designed incorrectly. Both the forward and reverse were designed on the same RNA/DNA strand. Forglutamine synthetase (SRID 1417), hsc70 (SRID 1416), and Tld (SRID 1418), I re-ordered primers that are the reverse complement of theones previously designed.
November 7, 2011OA FHL 2011: primersRegular PCR of aspartate aminotransferase and Tld primers to test for primer dimer. PCR reactions are : 12.5µL Apex, 8.5 µL water, 0.5 µL ofeach primer, and 3 µL of cDNA (Gill VE1). The thermalcycler protocol is QPCR under the EMMA directory.Made a 1.5% agarose gel. When the PCR was done, loaded 10 µL of PCR product on the gel (5 µL of Hyperline II ladder went in the first well).The gel layout is as follows : 2 wells of asp. aminotrans. + template, 2 negative control asp. aminotrans, the same pattern for Tld. The Tldreactions mostly evaporated in the thermalcycler, but I tried to reconstitute with 10 µL of water and loaded them anyway. Ran at 100 V for about45 minutes.
Uploaded with Skitch!
Results: None of the Tld samples showed up. The aspartate aminotransferase has primer dimer (underlined in blue) and a faint product ofapproximately the correct size (circled in orange) showed up in one of the template wells.
qPCR gradient (50-60 °C) using primers MTIV and glutamine synthetase. Used both cDNA and gDNA as template to see if there is anannealing temperature that will amplify only cDNA. Both primers previously amplified both gDNA and cDNA but had very different melt curvesfor the two amplicons. The thermalcycler protocol used was a modified 2 step amp eva green+melt (modified to include the gradient).
316
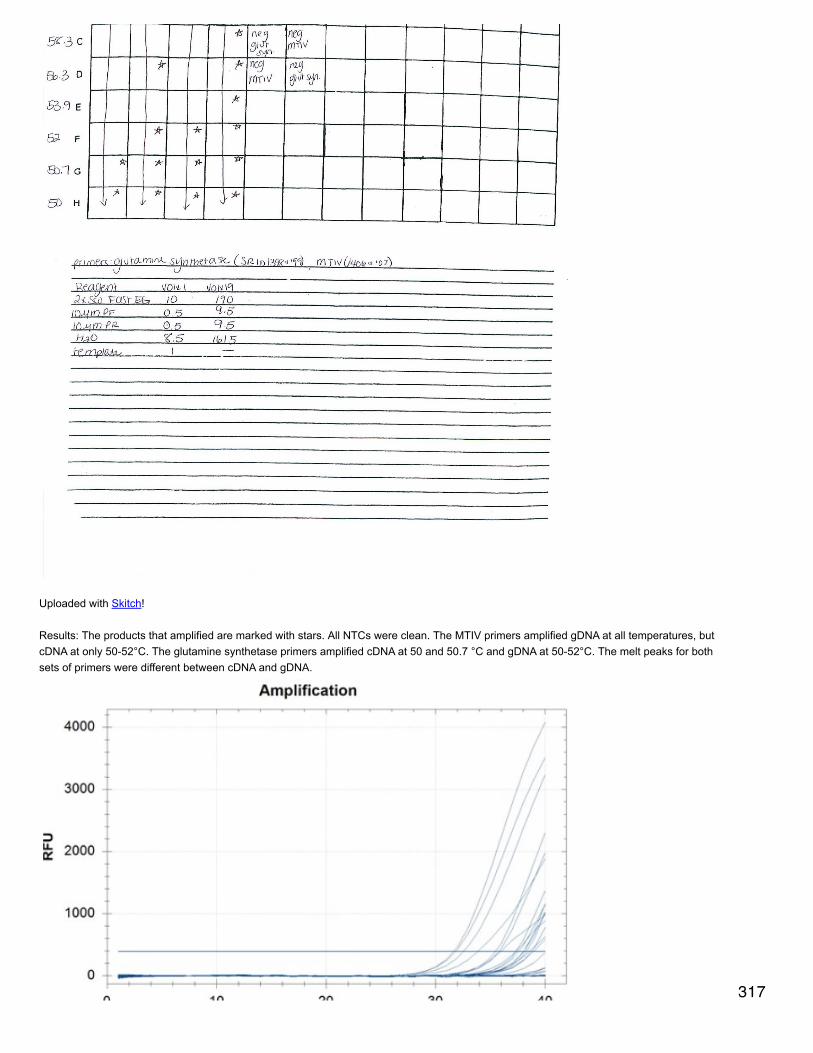
Uploaded with Skitch!
Results: The products that amplified are marked with stars. All NTCs were clean. The MTIV primers amplified gDNA at all temperatures, butcDNA at only 50-52°C. The glutamine synthetase primers amplified cDNA at 50 and 50.7 °C and gDNA at 50-52°C. The melt peaks for bothsets of primers were different between cDNA and gDNA.
317

Uploaded with Skitch!
Uploaded with Skitch!
NB: I found my box of cDNA sitting on the bench next to the fridge. Not sure how it got there or how long it has been sitting there...
November 4, 2011Secondary Stress TrialAmmonia levels were low, but still did a water change for oysters.
November 2, 2011OA FHL 2011: primersqPCR of new EF1a primers with the re-ordered reverse primer.
318

Uploaded with Skitch!
October 31, 2011Secondary Stress TrialWater change for oysters.
October 28, 2011OA FHL 2011: primersThe reverse primer for the EF1a qPCR done on 10/27/11 was the reverse complement of what it should have been. Re-ordered the primer inthe correct orientation (Cg_EF1a_R2, SRID 1412). Also designed a forward primer for EF1a so that we can empirically determine if there is anintron where we think there is one (Cg_EF1a_F2, SRID 1413).
October 27, 2011OA FHL 2011: primersTested new EF1a primers and further testing of Tld and citrate synthase, which previously seemed to not amplify gDNA.
319
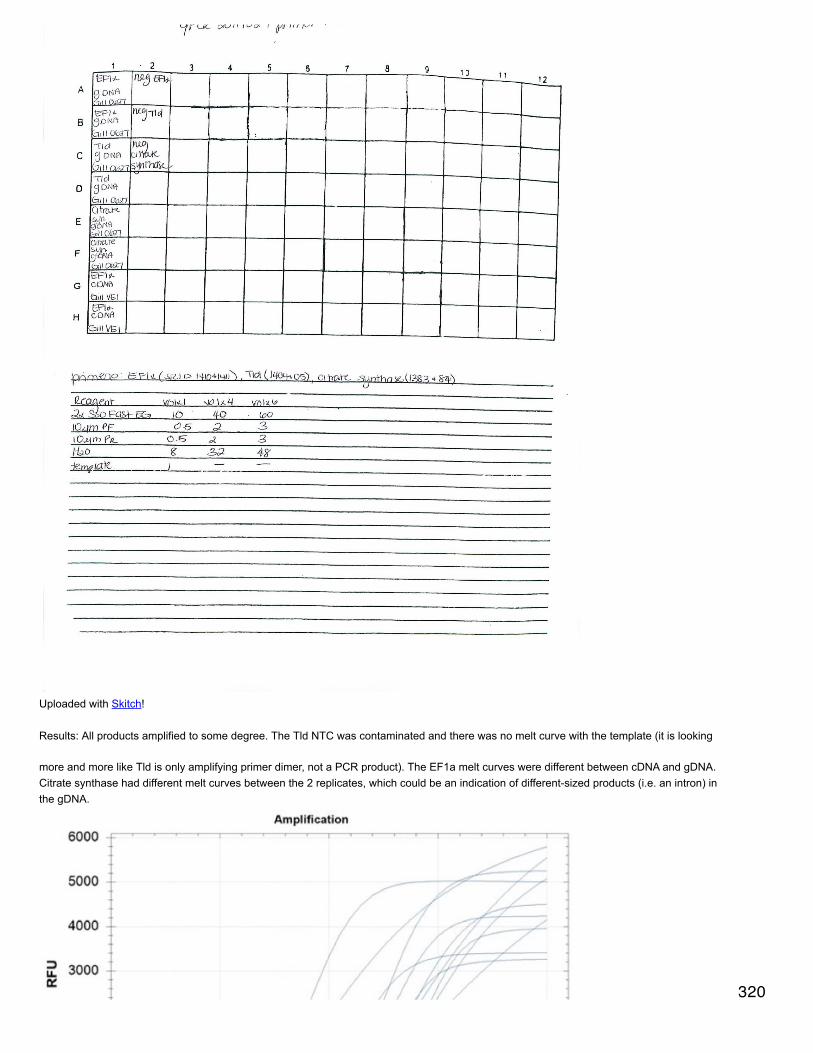
Uploaded with Skitch!
Results: All products amplified to some degree. The Tld NTC was contaminated and there was no melt curve with the template (it is looking
more and more like Tld is only amplifying primer dimer, not a PCR product). The EF1a melt curves were different between cDNA and gDNA.Citrate synthase had different melt curves between the 2 replicates, which could be an indication of different-sized products (i.e. an intron) inthe gDNA.
320

Uploaded with Skitch!
Uploaded with Skitch!
Secondary Stress TrialBrent picked up new oysters from Joth for a second go at controlling pH in static containers. The oysters are in a 50 gallon tank in the 321
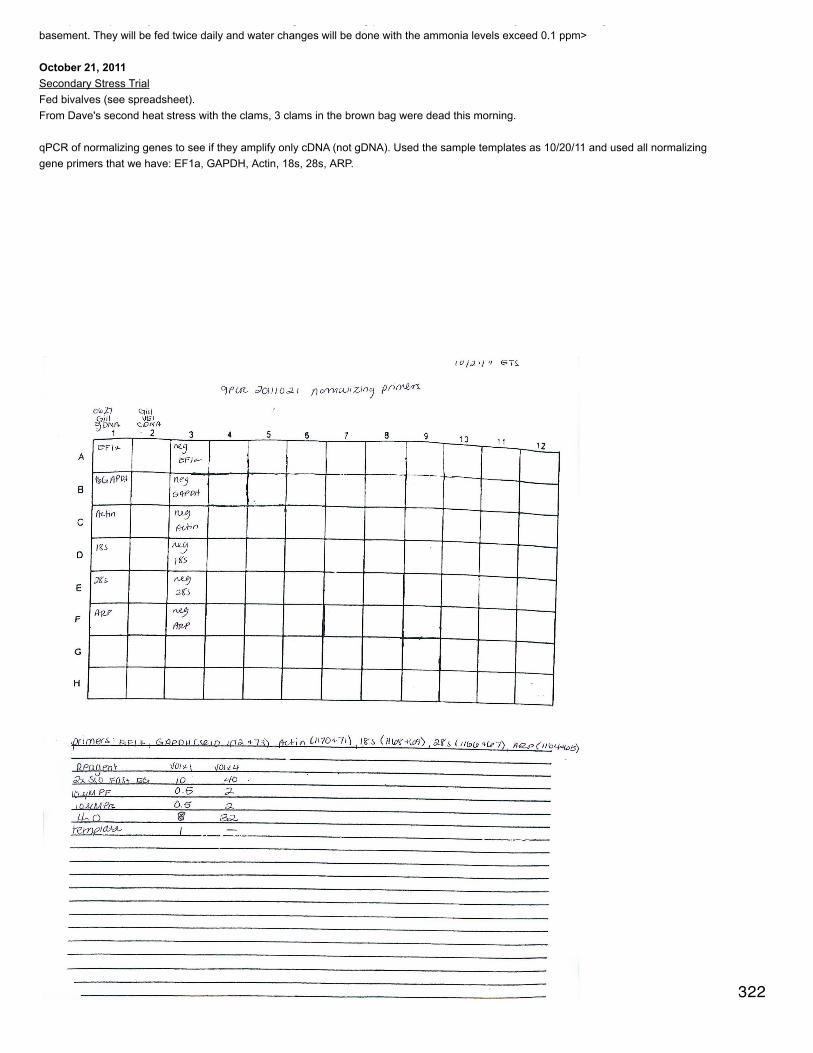
Brent picked up new oysters from Joth for a second go at controlling pH in static containers. The oysters are in a 50 gallon tank in thebasement. They will be fed twice daily and water changes will be done with the ammonia levels exceed 0.1 ppm>
October 21, 2011Secondary Stress TrialFed bivalves (see spreadsheet).From Dave's second heat stress with the clams, 3 clams in the brown bag were dead this morning.
qPCR of normalizing genes to see if they amplify only cDNA (not gDNA). Used the sample templates as 10/20/11 and used all normalizinggene primers that we have: EF1a, GAPDH, Actin, 18s, 28s, ARP.
322
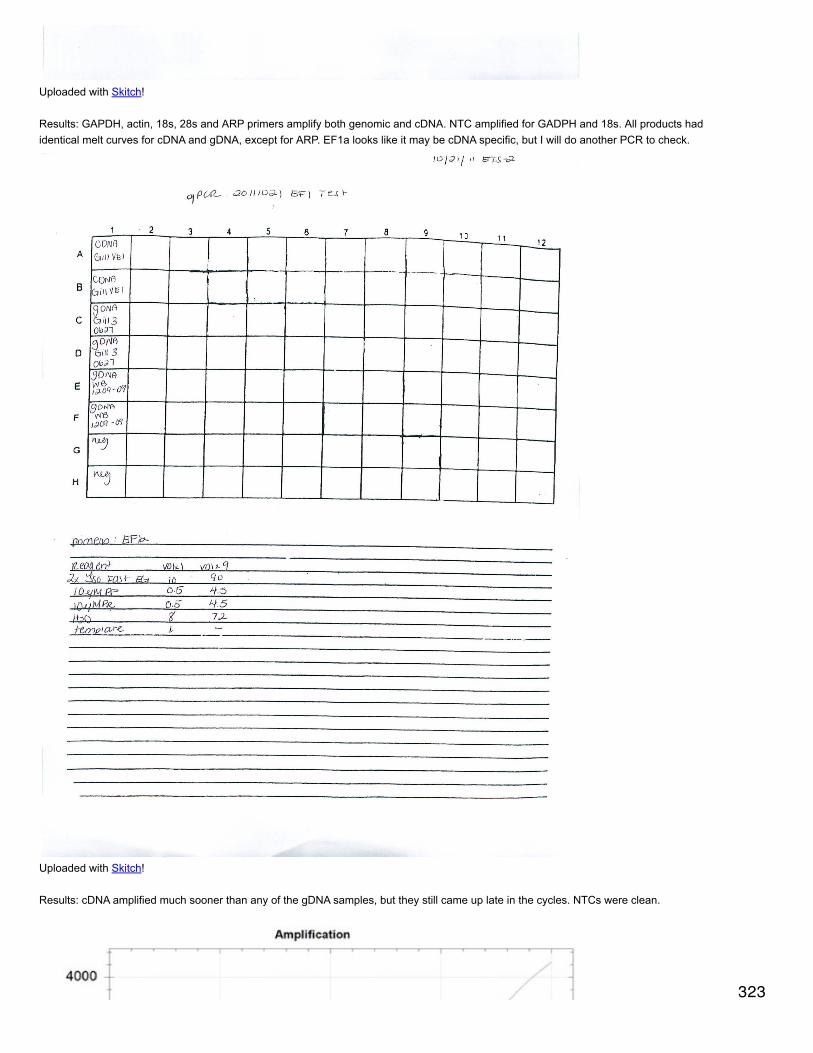
Uploaded with Skitch!
Results: GAPDH, actin, 18s, 28s and ARP primers amplify both genomic and cDNA. NTC amplified for GADPH and 18s. All products hadidentical melt curves for cDNA and gDNA, except for ARP. EF1a looks like it may be cDNA specific, but I will do another PCR to check.
Uploaded with Skitch!
Results: cDNA amplified much sooner than any of the gDNA samples, but they still came up late in the cycles. NTCs were clean.
323
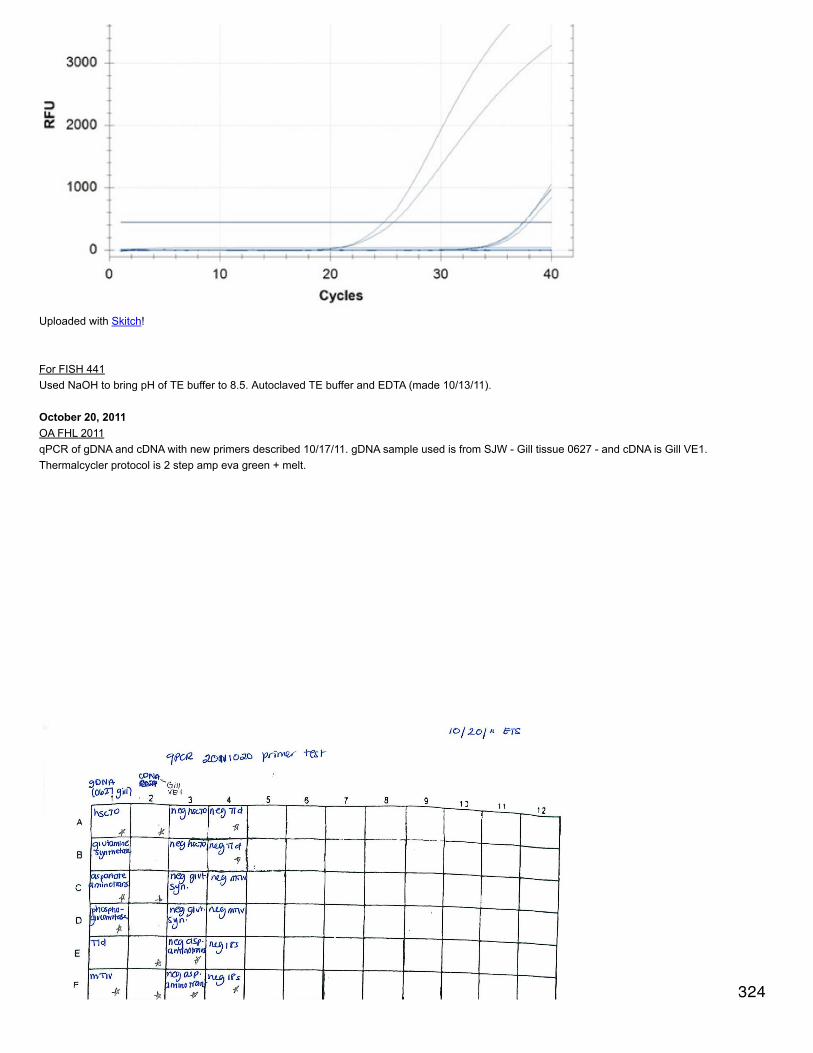
Uploaded with Skitch!
For FISH 441Used NaOH to bring pH of TE buffer to 8.5. Autoclaved TE buffer and EDTA (made 10/13/11).
October 20, 2011OA FHL 2011qPCR of gDNA and cDNA with new primers described 10/17/11. gDNA sample used is from SJW - Gill tissue 0627 - and cDNA is Gill VE1.Thermalcycler protocol is 2 step amp eva green + melt.
324

Uploaded with Skitch!
Results: Products that amplified are indicated with a "*". cDNA for aspartate aminotransferase, Tld, MTIV, and 18s showed very littleamplification. Melt curves between gDNA and cDNA were different for hsc70, aspartate aminotransferase, phosphocomutase, MTIV, and 18s.There were not melt curves for glutamine synthase, Tld, and cDNA for aspartate aminotransferase, phosphoglucomutase, and 18s. There wasNTC amplification for aspartate aminotransferase, Tld, and 18s.Next steps: Check possible primer dimer in aspartate aminotransferase, Tld, and 18s. Tld and glutamine synthetase may work (i.e. may notamplify gDNA), but glut synth. does not amplify anything at this annealing temperature and Tld shows evidence of some contamination.Aspartate aminotransferase probably has primer dimer. All other primers amplify genomic DNA.
Uploaded with Skitch!
325

For FISH 441Made 2x SDS reducing buffer (10 mL).
2 mL 20% (w/v) SDS2 mL glycerol40 µL 2.5% Bromophenol blue2.5 mL 0.5M Tric HCl, pH 6.82 mL 2B-mercaptoethanol1.46 mL Nanopure water
October 18-19, 2011Secondary Stress TrialFed bivalves (see spreadsheet).
Rehydrated primers in TE buffer pH 8.5 to 100 µM (primers were designed 10/17/11). Let sit at room temp overnight.
October 17, 2011Secondary Stress Trial
Fed bivalves (see spreadsheet).
OA FHL 2011Designed more primers to span the intron boundary to avoid amplifying gDNA. Genes were picked from a list of genes that have genomicsequence and, for the most part, for which intron/exon boundaries are known. Genes were also picked based on functionality: energymetabolism, immune, and housekeeping. Two genes were picked that did not yield usable boundaries for primer design: ATB0 (AccessionNumber AB185609, an amino acid transporter) and a metallothionein gene promoter (AJ249659). The following are the genes for which Idesigned primers:
hsc70, heat shock cognate 70 (AJ305315): gDNA sequence was aligned with RNA sequence (HS119891) that was retrieved in a megablastagainst ESTs, narrowing the search to Crassostrea. The alignment was done in Spidey to find the intron/exon boundaries. The primers weredesigned on the RNA sequence and meant to span the boundary that occurs at the RNA bp 571/572. The SRIDs for these primers are 1396and 1397.
glutamine synthetase(AJ564739): This gene is used in metabolism of nitrogen. The intron/exon boundaries are known and the primers weredesigned off of the gDNA sequence. The forward primer spans the intron from bp 751-876 and the reverse spans the intron from bp 1024-1299.The SRID for these primers are 1398 and 1399.
aspartate aminotransferase (AY660003): This gene is used in amino acid metabolism and changes expression during environmental stress.The primers were designed off of the RNA sequence after alignment with gDNA in Spidey. The intron/exon boundary occurs at RNA bp 138/139and the forward primer overlaps it. The forward primer goes from bp 128-147 and the reverse from 249-268. The SRID for these primers are1400 and 1401.
phosphoglucomutase (AJ512213): This gene is involved in metabolism. The primers were designed on the genomic DNA sequence, for whichthe intron/exon boundaries are known. The forward primer spans the intron from bp 699-1540 and the reverse is within the exon at bp 1730-1749. The SRID for these primers are 1402 and 1403.
Tolloid-like protein, Tld (AJ543452): Involved in the immune response. The primers were designed on the genomic DNA sequence. The forwardprimer spans the intron from bp 1424-2335 and the reverse occurs within an exon at bp 3457-3755. The SRID for these primers are 1404 and1405.
MTIV, metallothionein IV (AM265551): The primers were designed on genomic DNA. The forward primer spans an intron from bp 54-156 andthe reverse is within an exon at bp 708-817. The SRID for these primers are 1406 and 1407.
18s (EF035120): Housekeeping gene. The primers were designed on genomic DNA, however the boundaries were found using Spidey. Theforward spans an intron from 656-670 and the reverse spans a couple of introns from 813-824. The SRID for these primers are 1408 and 1409.
October 14-16, 2011Secondary Stress TrialFed bivalves (see spreadsheet).Got new algae on 10/16. Put some of it in f/2 in a flask. 326
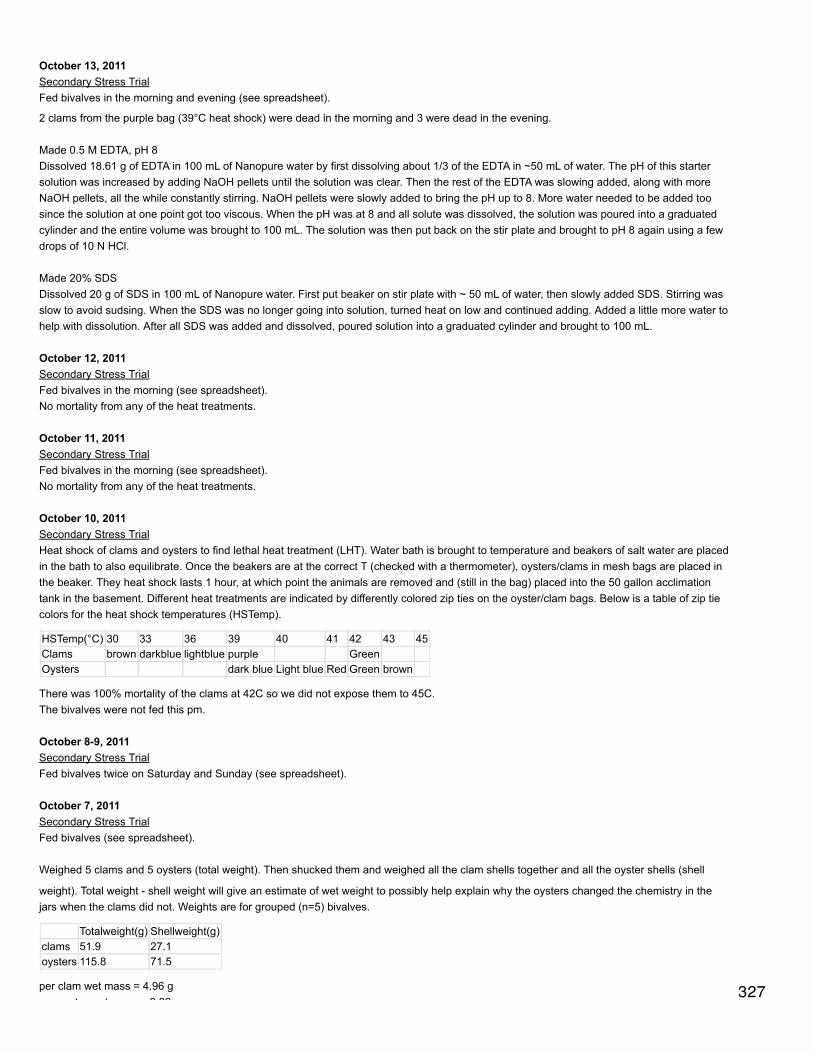
October 13, 2011Secondary Stress TrialFed bivalves in the morning and evening (see spreadsheet).
2 clams from the purple bag (39°C heat shock) were dead in the morning and 3 were dead in the evening.
Made 0.5 M EDTA, pH 8Dissolved 18.61 g of EDTA in 100 mL of Nanopure water by first dissolving about 1/3 of the EDTA in ~50 mL of water. The pH of this startersolution was increased by adding NaOH pellets until the solution was clear. Then the rest of the EDTA was slowing added, along with moreNaOH pellets, all the while constantly stirring. NaOH pellets were slowly added to bring the pH up to 8. More water needed to be added toosince the solution at one point got too viscous. When the pH was at 8 and all solute was dissolved, the solution was poured into a graduatedcylinder and the entire volume was brought to 100 mL. The solution was then put back on the stir plate and brought to pH 8 again using a fewdrops of 10 N HCl.
Made 20% SDSDissolved 20 g of SDS in 100 mL of Nanopure water. First put beaker on stir plate with ~ 50 mL of water, then slowly added SDS. Stirring wasslow to avoid sudsing. When the SDS was no longer going into solution, turned heat on low and continued adding. Added a little more water tohelp with dissolution. After all SDS was added and dissolved, poured solution into a graduated cylinder and brought to 100 mL.
October 12, 2011Secondary Stress TrialFed bivalves in the morning (see spreadsheet).No mortality from any of the heat treatments.
October 11, 2011Secondary Stress TrialFed bivalves in the morning (see spreadsheet).No mortality from any of the heat treatments.
October 10, 2011Secondary Stress TrialHeat shock of clams and oysters to find lethal heat treatment (LHT). Water bath is brought to temperature and beakers of salt water are placedin the bath to also equilibrate. Once the beakers are at the correct T (checked with a thermometer), oysters/clams in mesh bags are placed inthe beaker. They heat shock lasts 1 hour, at which point the animals are removed and (still in the bag) placed into the 50 gallon acclimationtank in the basement. Different heat treatments are indicated by differently colored zip ties on the oyster/clam bags. Below is a table of zip tiecolors for the heat shock temperatures (HSTemp).
HSTemp(°C) 30 33 36 39 40 41 42 43 45Clams brown darkblue lightblue purple GreenOysters dark blue Light blue Red Green brown
There was 100% mortality of the clams at 42C so we did not expose them to 45C.The bivalves were not fed this pm.
October 8-9, 2011Secondary Stress TrialFed bivalves twice on Saturday and Sunday (see spreadsheet).
October 7, 2011Secondary Stress TrialFed bivalves (see spreadsheet).
Weighed 5 clams and 5 oysters (total weight). Then shucked them and weighed all the clam shells together and all the oyster shells (shell
weight). Total weight - shell weight will give an estimate of wet weight to possibly help explain why the oysters changed the chemistry in thejars when the clams did not. Weights are for grouped (n=5) bivalves.
Totalweight(g) Shellweight(g)clams 51.9 27.1oysters 115.8 71.5
per clam wet mass = 4.96 gper oyster wet mass = 8.86 g
327

edit
per oyster wet mass = 8.86 g
Comparison of Dongsen's titrations with ours
sample DXCaCO3mg/L DXµmol/kg ETSDMµmol/kglow CO2 control1092811 198 1922 2050low CO2 start exp 092711 203 1970 2045low CO2 Cg 4-2 092811 191 1854 1769high CO2 Cg 8-2 092811 196 1902 1884high CO2 clam 5-2 092811 208 2019 2094high CO2 start exp 092711 205 1990 2050CRM 113 205 1990 2224
October 3-6, 2011Secondary Stress TrialFed bivalves (see spreadsheet).
September 30, 2011Secondary Stress TrialBrought all of our total alkalinity samples up to Friday Harbor to analyze them on the titrator in Moose's lab. Verified accuracy of titrator byrunning the Dickson standard 3 times - in the beginning, middle, and end of running all of our samples. Oysters caused significant decreases intotal alkalinity, regardless of density and feeding status. Clams did not significantly change the alkalinity in their jars. At the end of theexperiment, the oysters and clams were put in mesh bags and placed back into the large, round tank with the other oysters and clams. Thehigh CO2 exposed bivalves have zip ties on their bags.We also dropped 6 samples and 1 CRM off with Dongsen Xue in Forestry to run on his titrator. The samples were : High CO2 Cg 8-2 092811;Low CO2 Cg 4-2 092811; Low CO2 092711 from the start of the experiment; Low CO2 control 1 092811; High CO2 clam 5-2 092811; HighCO2 092711 from the start of the experiment. Dongsen reports Total CaCO3 concentrations instead of total alkalinity.
September 29, 2011Secondary Stress TrialBivalves in large tank were fed at 8:15 am (see spreadsheet).The feeding jars for the pH trial were fed at 9:15, 20 mL into each jar.
September 28, 2011Secondary Stress TrialBivalves in large tank were fed at 9:15 am (see spreadsheet).In the morning, all jars were sampled for spec pH, salinity, temperature, and ammonia (for jars containing animals and 1 control). In general, pHdropped to about 6.9 in all the oyster jars regardless of starting pH, stayed consistent in the non-animal controls, stayed consistent in the clamjars with 5 clams, and dropped a little (~0.2 units) in the clam jars with 10 clams. After sampling for pH, all animals were fed 40 mL of algae.
In the afternoon, 1 jar from each replicate was sampled for spec pH and total alkalinity. Duplicate alkalinity samples were taken for time seriesof beer bottles and for verification of the Forestry spec method. All samples were poisoned with ~70 µL HgCl2. After sampling, water waschanged in all the jars. The ambient water was at pH 8 so we added 0.4% of high CO2 water to 4.75 L of ambient to get the low pH treatment.Dave will feed all the animals in the evening. Only 1 jar from each replicate will be fed for the next 24 hours to see if feeding causes changes inpH (jars 1 are the fed jars).The new treatment water is pH 8.03 for low CO2 and 7.77 for high CO2.For detailed pH, see water chemistry spreadsheet .
September 27, 2011Secondary Stress TrialBivalves were fed at 8:20 am (see spreadsheet).Took 2 cuvettes full of water from each trash can (low and high CO2) and added 70 µL of 0.1 N NaOH or HCl to low and high, respectively. Thelow CO2 Mukilteo water is 7.7 and the high is not calculable because it is so high.Mixed 50/50, 25/75, and 10/90 high/low CO2 water and took pH. The 10/90 mixture was at pH of ~4.Turned off pure CO2 bubbling into high CO2 trash can. Made mixes of 10, 20, and 50 mL of high CO2 water in ~2L of low CO2 water. Fromthese pHs, we made a regression of pH on % volume high CO2 water. To get a low pH 0.2 units below the control, we need to add 0.18%volume high CO2 water, or about 8.8 mL to 5L.We have 2 pH treatments: high CO2 and low CO2 (pH of about 7.7 and 7.9). In each pH, there are 2 densities of oysters (4 or 8) or clams (5 or10) per jar, in duplicate. There are also 2 control jars per pH without any animals. We took duplicate spec pH measurements of both treatmentsand 5 total alkalinity samples - 2 in PMEL bottles and 3 in beer bottles. The animals were put in their treatment jars around 13:30. 328

Wet masses were taken of groups of bivalves as they were put into their jars. The jar labels are type of animal (Cg or clam) followed by # in jar-replicate.
Low CO2:Cg 4-1 80gCg 4-2 109.7 gCg 8-1 156.2 gCg 8-2 156.5 gclam 5-1 56.3 gclam 5-2 42.8 gclam 10-1 90.8 gclam 10-2 90.1 g
High CO2:Cg 4-1 84.5 gCg 4-2 63.4 gCg 8-1 148 gCg 8-2 149.1 gclam 5-1 38.1 gclam 5-2 45.6 gclam 10-1 88.7 gclam 10-2 90.6 g
Dave fed all animals, 20 mL algae per jar (~60,000 cells/mL) in the evening.
OA FHL 2011qPCR of gDNA from 9/26/11 qPCR (DH 12) and new gDNA (0627 gill tissue) using 18s, ATP synthase, citrate synthase, and new Prx6 primers.DH12 did not amplify at 18s, indicating that the results from yesterday were spurious. the new gDNA amplified at 18s, ATP synthase, and Prx6,
but not at citrate synthase.
329

Uploaded with Skitch!
September 26, 2011Secondary Stress TrialBivalves were fed at 9:30 am (see spreadsheet).Switched from aquarium water to Mukilteo water to try to remedy low pH. Bubbled one trash can with pure CO2 and the other with CO2-freeair.
OA FHL 2011Reconstituted primers designed Sept 14, 2011 in TE buffer (pH 8.5). SR IDs are as follows: IMSP5 = 1387, 1388; ATP synthase = 1386, 1385;citrate synthase = 1384, 1383; Prx6 = 1382, 1381.Did qPCR using all primers on gDNA (DH 12 from Sam's -20C gDNA Box 1) and cDNA (C. gigas gill vibrio exposed). All primers amplifiedcDNA, only IMSP5 amplified gDNA, but is probably primer dimer because it also amplified in the negative control where no other primer pairdid. Also did a gradient between 50 and 57°C and all primers amplify well at 55°C. Need to make sure that gDNA was actually amplifiable bychecking with 18s primers.
330

Uploaded with Skitch!
September 25, 2011Secondary Stress TrialDave had started bubbling 2000 ppm CO2 and CO2-free air into trash cans on Saturday. Took 2 cuvettes full of water from each trash can andadded 10 µL of 0.1 N NaOH to one low CO2 cuvette and 10 µL 0.1 N HCl to the other. The low CO2 water was about pH 7.87 and the highCO2 only at 7.81.
September 23, 2011Secondary Stress TrialBivalves were fed at 10:20 am (see spreadsheet). 331

Bivalves were fed at 10:20 am (see spreadsheet).Counted clams and oysters: 205 oysters, 211 clams.Water ammonia was at 0.25 ppm. Flushed out all excrement and did 50% water change.
September 18, 2011Secondary Stress TrialBivalves were fed at 10:50 am and 6:30 pm (see spreadsheet). During morning feeding, ammonia was at 0.5 ppm. Did 100% water changeand rinsed out feces/pseudofeces.
September 17, 2011Secondary Stress TrialBivalves were fed at 9:45 am and 6:15 pm (see spreadsheet). One oyster was found dead at the morning feeding. During evening feedingammonia was at 0.5 ppm. Did 80% water change.
September 16, 2011Secondary Stress TrialBivalves were fed at 9:45 am (see spreadsheet).Made F/2 media with 1 L of sterile seawater and 132 µL each of Procul A and B.
September 15 , 2011Secondary Stress TrialBivalves were fed at 9:30 am (see spreadsheet). One oyster was dead.
September 14, 2011Secondary Stress TrialBivalves were fed at 9:15 am (see spreadsheet).
OA FHL 2011Two samples - both from treatment 105B (1500 µatm) taken on 8/1/11 - were extracted for demonstration purposes and discarded.
Primer design for qPCR - primers must span introns.Since I have not been able to get rid of all gDNA in the RNA samples, I'm going to design primers that will amplify only cDNA. I have foundgDNA sequence in C. gigas or a related species for Prx6 (C. gigas sequence AM265552), ATP synthase (C. gigas sequence EE677774),citrate synthase (EE677716), and IMSP-5 (a protein from the oyster shell,HS208448). I was not able to find sequence for SOD. Davesupposedly has primers that might amplify only cDNA for Hsp70, but they have not yet been tested with gDNA.To find gDNA to align with the RNA off of which the primers were originally designed for these genes, I first did a megablast of the RNAsequence against Crassostrea sequences only. If that yielded gDNA, then I used that gene sequence and aligned it with the RNA in Spidey(indicating it was C. elegans, which probably has the most similar splice sites). If the original blast did not yield any results, then I blastedagainst S. purpuratus only, searching for somewhat similar sequences. If that still did not work, then I opened up the blast parameters to all
organisms in genbank, searching for somewhat similar sequences. The following are the species for which I found gDNA corresponding to theRNA that I was blasting:Prx6 - primers were originally designed off of a DNA sequence with 6 exons (C. gigas,AM265552); exons occur on DNA 38-123, 918-1074,2091-2234, 2952-3025, 3190-3262, 3352-3483ATP synthase - S. purpuratus (NM_214578); exons occur on mRNA sequence 262-437 and 577-623citrate synthase - Aspergillus niger (HQ407432); exons occur on mRNA sequence 96-157 and 638-708IMSP-5 - Lotus japonicus (AP004959); exons occur on mRNA sequence 466-563 and 611-662
Prx6 SRID: 1381, 1382ATP synthase SRID: 1385, 1386citrate synthase SRID: 1383, 1384IMSP-5 SRID: 1387, 1388
September 13,2011Secondary Stress TrialBivalves were fed around 8 am (see spreadsheet).
OA FHL 2011Did spec (Nanodrop) of Dnased RNA samples (n=6). The concentrations and estimated remaining volumes of the samples are below.
332

Uploaded with Skitch!
September 12, 2011Secondary Stress TrialBivalves were fed around 10 am and details were entered in the spreadsheet.
OA FHL 2011Re-DNased samples that were DNased on August 22, 2011 (except for 105B/1500 ppm samples). Followed regular DNase protocol. DilutedDNAsed RNA 1:20 in nanopure water. Did qPCR using 18s primers using 1 and 2 µL of diluted RNA as template. The thermalcycler protocol is2step amp+melt for EvaGreen.
September 10, 2011Secondary Stress TrialAt 9:30 am, the oysters and clams were fed as described 9/9/11. The volume of algae was about 300 mL. The information was entered in thebivalve feeding spreadsheet .Bivalves were fed again around 6 pm. Ammonia levels were checked in the water and were at 1 ppm (threshold = 0.1 ppm). Did a full waterchange.
September 9, 2011Secondary Stress Trial
We got ~200 pacific oysters and 200 manila clams from Joth's farm. We put the oysters and clams in a large fiberglass tank with watercirculating through a chiller to keep it at 16°C and through biofilters.At 4pm we reduced the water in the tank to 40.5 L and fed the bivalves 60,000 cells of algae mix (from Taylor) per mL, about 575 mL. Afterabout 1/2 hour, when the water had been cleared of algal cells, we then put the same water back in the tank.Plans for the trial and links to data on feeding the bivalves can be found here .
September 2, 2011Notes from Richard Strathmann on larval rearingTo make a water bath, use aquarium heater and circulating pump with a stopcock to regulate flow.Do water changes with a sieve and bowl.At 22°C with feeding, water changes need to be every day in a static system.If there is flow, need to monitor amount - does the outlet have material stuck in it?Scottie Henderson (dissertation in FHL library) used pulse food supply.IV bag could drip food in. Could shine a light on the bag to keep culture photosynthesizing. Could also slow siphon using valve and smallstopcock.If pulse feeding, can do ad libitum, ~ >100,000 cells of isochrysis per mL (based on M. edulis), bigger cells would be less. This amount doesnot scale with larval age.Possible mix for larvae: Isochrysis galbana + Pavlova lutherii or nanochoropsis or chitopserois.Organic content is about equal to cell volume, but much larger cells have bigger vacuoles.When collecting hatched larvae , make sure they are not malformed.Spawning: take straight from lagoon and spawn immediately or feed and keep at a higher temperature. Can wedge open the shell and injectserotonin into the adductor (or anywhere) - may yield better eggs.could adjust larval density for a constant biomassCiliates should wash out in a continuous flow.When strip spawn, rinse tissue well with filtered seawater.quality of food is important with sterilized seawater.Settlement: Would be cleaner with tiles, but shell may stimulate them better. Try adding K+ or cesium ions, check concentration to getmaximum effect (Yool et al. 1986 Biol Bull). Yool's results: Greater synchrony, downstream of normal sensory input, normal metabolism andgood survival.What do the lab lights do to larvae? old paper published with c. virginica.
August 25, 2011OA FHL 2011Nanodrop concentrations of 105A and 105B cDNA. The concentrations are very similar to 103A3 so there should be enough cDNA for a qPCRsince that sample amplified well.Redid qPCR of the 105 samples with the same primers. Also did qPCR of all samples using Hsp70 primers (SR ID 971 and 972). Protocol is
333

Redid qPCR of the 105 samples with the same primers. Also did qPCR of all samples using Hsp70 primers (SR ID 971 and 972). Protocol is2Step Amp+Melt Eva Green.
August 23, 2011OA FHL 2011Nanodropped all DNased RNA samples 3 times. Concentrations were higher (~8-16 ng/µL), but this may be because the background blank ofpure water is no longer a true blank after DNAsing.Went ahead and reverse transcribed all samples. Since concentrations are so low, reverse transcribed the maximum volume (still less than 1µg) of 17.75 µL. Added 0.5 µL Oligo dT primers to sample and incubated at 70C for 5 minutes, followed by a few minutes on ice. Then added 5µL MMLV 5x buffer, 1.25 µL 10 DNTPs, and 0.5 µL of reverse transcriptase to each sample - mixed and incubated 42C for 1 hour + 3 minutesdeactivation at 95C.
Did qPCR of cDNA using 1 µL template a full concentration (equal volume pooled cDNA from all samples), diluted 2x, 4x, and 10x for a dilution
test. Primers used were superoxide dismutase (SR ID 600 and 601) and EF1a. qPCR protocol used was 2Step Amp+Melt Eva Green(annealing = 55C).
Uploaded with Skitch! 334
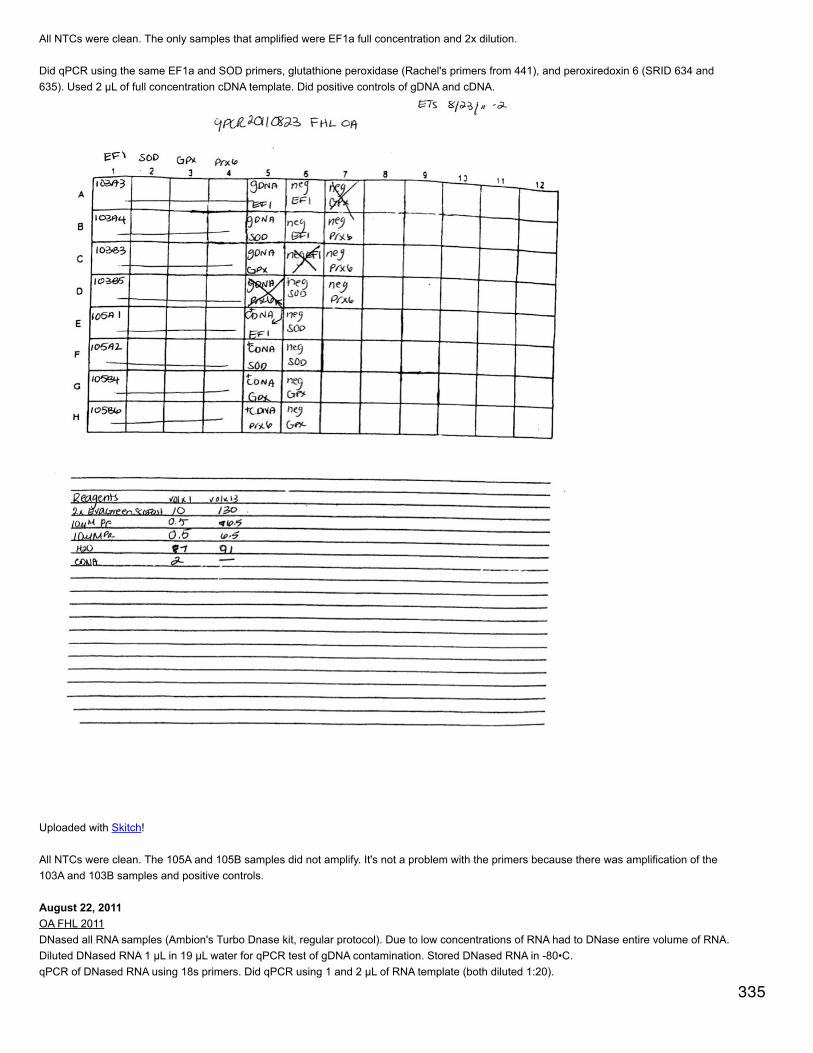
All NTCs were clean. The only samples that amplified were EF1a full concentration and 2x dilution.
Did qPCR using the same EF1a and SOD primers, glutathione peroxidase (Rachel's primers from 441), and peroxiredoxin 6 (SRID 634 and635). Used 2 µL of full concentration cDNA template. Did positive controls of gDNA and cDNA.
Uploaded with Skitch!
All NTCs were clean. The 105A and 105B samples did not amplify. It's not a problem with the primers because there was amplification of the103A and 103B samples and positive controls.
August 22, 2011OA FHL 2011DNased all RNA samples (Ambion's Turbo Dnase kit, regular protocol). Due to low concentrations of RNA had to DNase entire volume of RNA.Diluted DNased RNA 1 µL in 19 µL water for qPCR test of gDNA contamination. Stored DNased RNA in -80•C.qPCR of DNased RNA using 18s primers. Did qPCR using 1 and 2 µL of RNA template (both diluted 1:20).
335

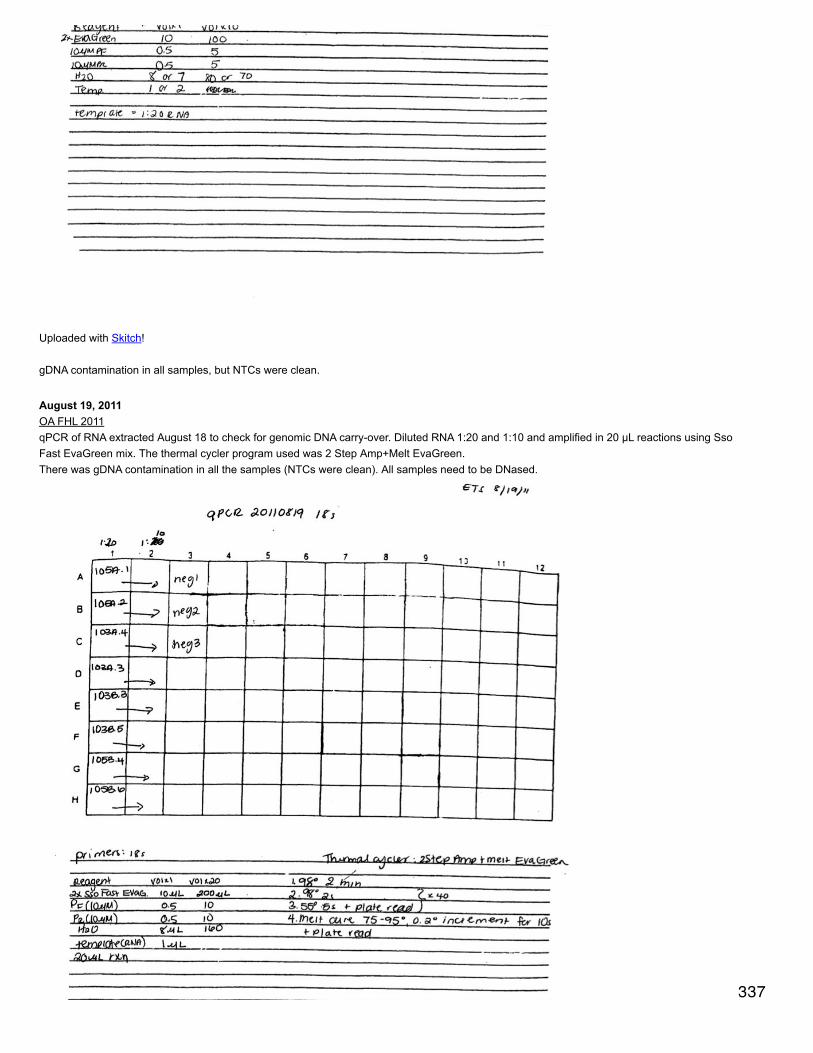
Uploaded with Skitch!
gDNA contamination in all samples, but NTCs were clean.
August 19, 2011OA FHL 2011qPCR of RNA extracted August 18 to check for genomic DNA carry-over. Diluted RNA 1:20 and 1:10 and amplified in 20 µL reactions using SsoFast EvaGreen mix. The thermal cycler program used was 2 Step Amp+Melt EvaGreen.There was gDNA contamination in all the samples (NTCs were clean). All samples need to be DNased.
337
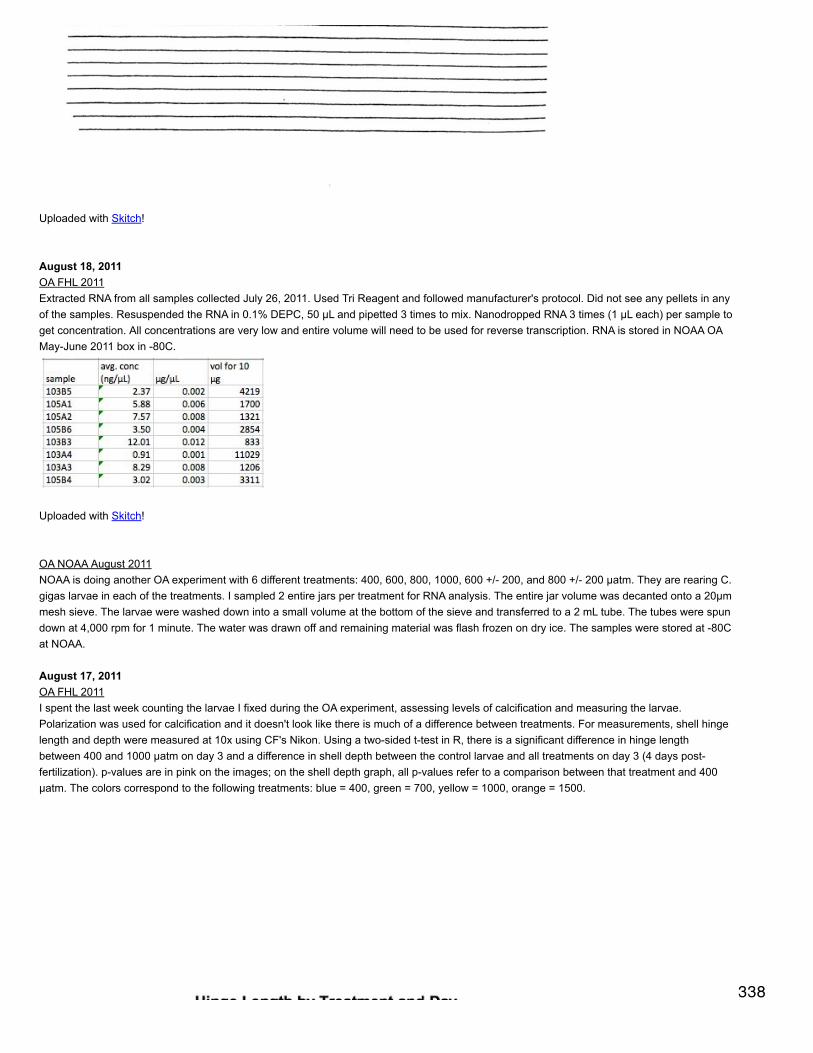
Uploaded with Skitch!
August 18, 2011OA FHL 2011Extracted RNA from all samples collected July 26, 2011. Used Tri Reagent and followed manufacturer's protocol. Did not see any pellets in anyof the samples. Resuspended the RNA in 0.1% DEPC, 50 µL and pipetted 3 times to mix. Nanodropped RNA 3 times (1 µL each) per sample toget concentration. All concentrations are very low and entire volume will need to be used for reverse transcription. RNA is stored in NOAA OAMay-June 2011 box in -80C.
Uploaded with Skitch!
OA NOAA August 2011NOAA is doing another OA experiment with 6 different treatments: 400, 600, 800, 1000, 600 +/- 200, and 800 +/- 200 µatm. They are rearing C.gigas larvae in each of the treatments. I sampled 2 entire jars per treatment for RNA analysis. The entire jar volume was decanted onto a 20µmmesh sieve. The larvae were washed down into a small volume at the bottom of the sieve and transferred to a 2 mL tube. The tubes were spundown at 4,000 rpm for 1 minute. The water was drawn off and remaining material was flash frozen on dry ice. The samples were stored at -80Cat NOAA.
August 17, 2011OA FHL 2011I spent the last week counting the larvae I fixed during the OA experiment, assessing levels of calcification and measuring the larvae.Polarization was used for calcification and it doesn't look like there is much of a difference between treatments. For measurements, shell hingelength and depth were measured at 10x using CF's Nikon. Using a two-sided t-test in R, there is a significant difference in hinge lengthbetween 400 and 1000 µatm on day 3 and a difference in shell depth between the control larvae and all treatments on day 3 (4 days post-fertilization). p-values are in pink on the images; on the shell depth graph, all p-values refer to a comparison between that treatment and 400µatm. The colors correspond to the following treatments: blue = 400, green = 700, yellow = 1000, orange = 1500.
338
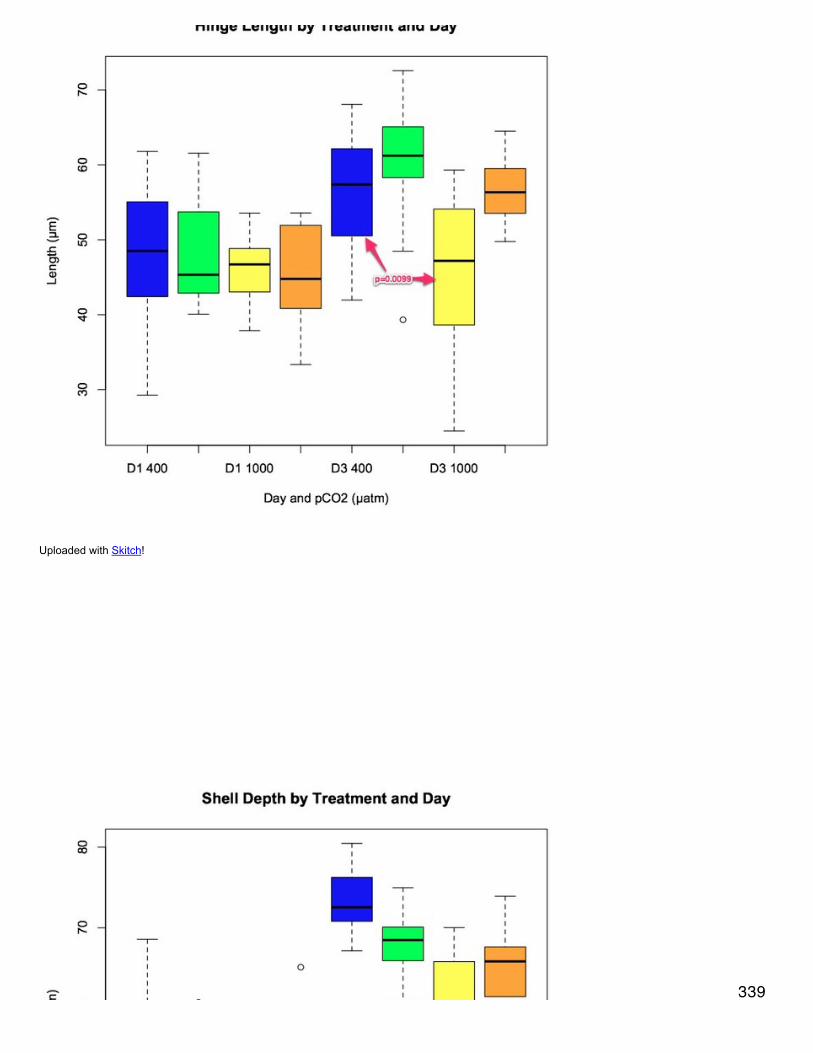
Uploaded with Skitch!
339
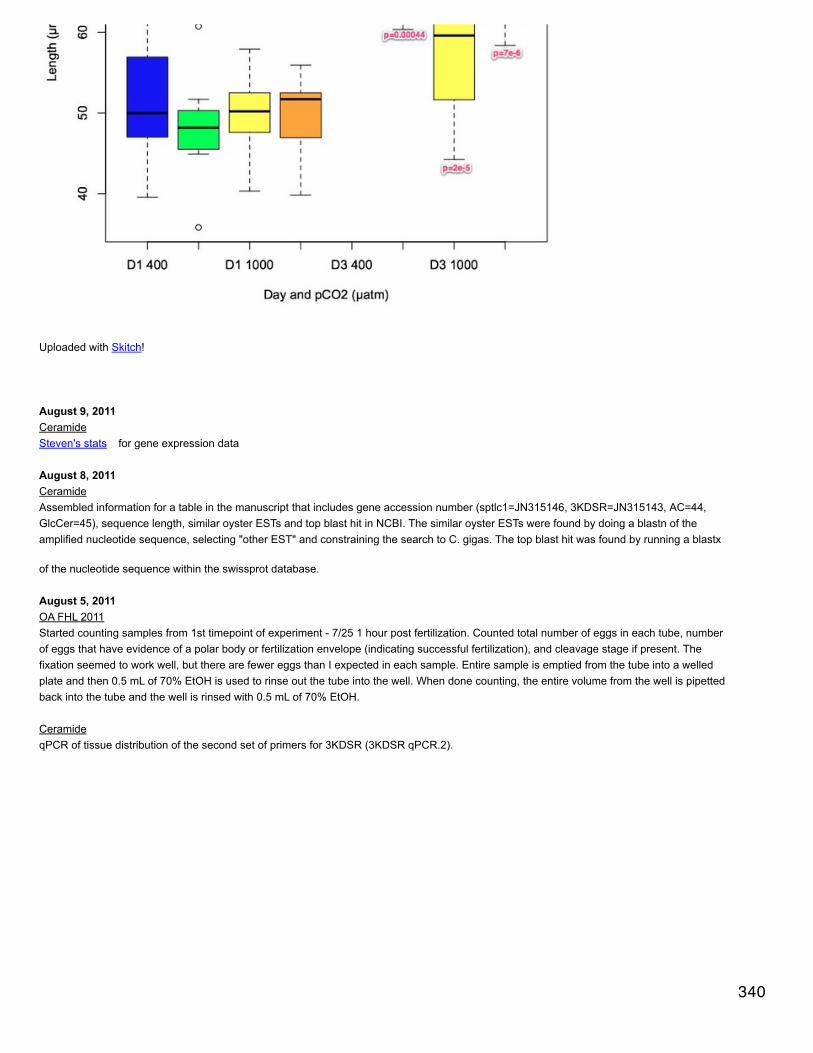
Uploaded with Skitch!
August 9, 2011CeramideSteven's stats for gene expression data
August 8, 2011CeramideAssembled information for a table in the manuscript that includes gene accession number (sptlc1=JN315146, 3KDSR=JN315143, AC=44,GlcCer=45), sequence length, similar oyster ESTs and top blast hit in NCBI. The similar oyster ESTs were found by doing a blastn of theamplified nucleotide sequence, selecting "other EST" and constraining the search to C. gigas. The top blast hit was found by running a blastx
of the nucleotide sequence within the swissprot database.
August 5, 2011OA FHL 2011Started counting samples from 1st timepoint of experiment - 7/25 1 hour post fertilization. Counted total number of eggs in each tube, numberof eggs that have evidence of a polar body or fertilization envelope (indicating successful fertilization), and cleavage stage if present. Thefixation seemed to work well, but there are fewer eggs than I expected in each sample. Entire sample is emptied from the tube into a welledplate and then 0.5 mL of 70% EtOH is used to rinse out the tube into the well. When done counting, the entire volume from the well is pipettedback into the tube and the well is rinsed with 0.5 mL of 70% EtOH.
CeramideqPCR of tissue distribution of the second set of primers for 3KDSR (3KDSR qPCR.2).
340

Uploaded with Skitch!
August 4, 2011OA FHL 2011Finished fixation of samples from 8/3.
August 3, 2011OA FHL 2011End of experimentDid TA and spec pH on cooler water and 2 containers in 105B (because flow is still a problem in these containers).From each remaining container, took 2 separate aliquots of 2x 1000 µL each for live/dead counts. Filtered out remaining larvae and fixed inPFA (fixation finished 8/4).
August 2, 2011OA FHL 2011Ran all remaining total alkalinity samples and DIC. Took and ran spec pH and TA for all 4 coolers.Fed larvae by putting in 30 mL of hatchery algae mix and turning off water for 2 hours.
August 1, 2011OA FHL 2011Sampled 2 containers for RNA and counting from each treatment: 103A-5, 103A-6, 103B-1, 103B-2, 105A-4, 105A-5, 105B-2, 105B-3.Containers were chosen because they had the highest densities based on last week's counts for the 4 remaining larval containers in eachtreatment. Larvae were spun down in 2 mL of water and flash frozen in liquid N2. For counting, 4 aliquots of 500 µL were taken per containerand for fixation, 2 aliquots of 500 µL was taken.Counts were done for live/dead and totals. Photos were taken for SEM: 9 photos for 103B, 10 for 103A, 5 for 105B, and 1 for 105A (there wasonly one larva counted in all the subsamples taken for the 105A treatment).Samples were taken from the cooler water for DIC, TA and spec pH. For each container sampled for RNA, water chemistry was done (pH andTA).Some samples from previous days were run for TA and DIC.The larvae were fed ~60,000 cells per mL of the hatchery algae mix by turning off the water flow for 2 hours.
July 31, 2011OA FHL 2011Laura Newcomb fed the larvae with 50 mL of each Iso. and Dunaliella, leaving water shut off to system for 2 hours.
July 29, 2011OA FHL 2011Finished total counts of larvae sampled 7/28. Also took SEM of the same larvae: 7 larvae photographed from treatment 103A, 10 from 103B, 5from 105A, and 4 from 105B.
Took salinity and temperature from all outside cooler water and took spec pH of same water.
Sampled containers for RNA (emptied all larvae onto mesh, poured into 2 mL vial, spun down for 1 min at 2,500 rpm and flash frozen): 103A-3,103A-4, 103B-3, 103B-5, 105A-1, 105A-2, 105B-4, 105B-6.
Finished fixation of larvae from 7/26 and 7/28.
Fed larvae as described 7/27.
July 28, 2011OA FHL 2011Crisis at 6 am - cooler 106B pH was down to 6.5. Switched containers over to 105B, which had been pre-equilibrated at 7.52 startingyesterday. Took a spec sample to see how low pH had gotten within the container (sample was of 106B-3). The containers will staypermanently in 105B. Without temperature correction, the pH in 106B-3 was about 6.8. 342
permanently in 105B. Without temperature correction, the pH in 106B-3 was about 6.8.
Sampled all containers for counting (3x 500 µL aliquots). Live/dead counts were done today, but total counts will be done tomorrow morning (aswell as SEM!). Sampled containers 1, 3 and 4 for fixation with PFA (2x 500 µL aliquots).Took pH and TA samples from containers 3 and 4.Took pH, TA and DIC samples from outer cooler water.
Used what I thought was a 50 µm mesh sieve for the first container (103B-1), but I think it was actually much larger because no larvae wereretained. Switched back tot he 35 µm for the remainder and larvae were present in every well.
Ran total alkalinity for cooler water samples collected 7/25 and 7/27 (8 samples).
Made new 4% PFA in seawater.
July 27, 2011OA FHL 2011Made new 50 µm mesh for outflows on 105A and 106B (see 7/26). Took samples for DIC, TA and pH and ran DIC from 7/25 and 7/27. Fedlarvae.
Continued fixation of larvae from yesterday. Only did 2 PBS washes, leaving larvae in second wash at 4C.
Around 11 am we ran out of CO2 and all the pHs went to ~8 in all the treatments. Moose and I installed another cylinder, and the systems re-adjusted, but in most cases the pH was overshot and went too low before it re-equilibrated. All seem OK now.
At 11:30 am took samples from outer cooler water for DIC and TA and measured, salinity, temperature, and took spec pH.
Counted algal cells for larval feeding. Counted 3 squares in hemacytometer, 25 of which equal one square millimeter. For Dunaliella, therewere ~366 cells per square mm and for Isochrysis ~ 216 (diluted 1:1 and 2:1, algae : EtOH, respectively). This scales up to 1.8 million cells permL for Dunaliella and 1.3 million for Isochrysis. To feed the larvae approximated 45 million cells oof each (30,000 cells per mL in a 3 Lcontainer), they need 24 mL of Dunaliella and 34 mL of Iso. At 4 pm, turned off water flow and fed larvae. Turned water flow back on at 6 pm.Tubing has not arrived yet, so had to feed larvae by adding food and turning off water flow for 2 hours.
At 6 pm, took spec samples from outer cooler water and salinity and temperature.
Ran DIC for all samples collected 7/25 and 7/27 standardizing against CRM 111.
July 26, 2011OA FHL 2011Finished fixing samples from 7/25. Cleaned and replaced water in all tanks, started on flow-through. Took samples for counting live/dead andfixing for scope work later. Took chemistry samples (TA and pH) of all outer cooler water and inside 2 containers for each treatment.
Details:Finished the fixation process from 7/25. Removed the PFA and washed 2x with 1x PBS, letting stand 15 minutes in between each wash. Thenwashed in increasing concentrations of EtOH: 30, 50, and 70%, again letting stand 15 minutes between each. Left larvae in the 70% EtOH and
stored at 4C.Around 8:30 in the morning, took samples for spec pH from the outer cooler water of all treatments and from the following larval containers:106B-2, 105A-2, 105A-3, 103B-1, 103A-2, 103A-4, 103B-3, 106B-3. Also took samples in Pyrex bottles (poisoned) for total alkalinity.In turn, emptied each larval container onto a 35 µm mesh sieve and then rinsed the larvae from the sieve into a 50 mL Flacon tube. Filled thetube to 50 mL with the appropriate pCO2 SW. Inverting 3x between each aliquot, aliquoted 450 µL (3x 150 µL)of larvae in seawater into agridded welled plate. Aliquoted the same amount into a 2 mL microcentrifuge tube and added 7.5% MgCl2 for 15 minutes. Then followed samesteps as 7/25 for PFA. For the larvae in the welled plate, counted live vs. dead on an inverted scope (went to 32x to verify mortalities) and totalcounts.Later in the afternoon, noticed that some of the containers in tanks 105 and 106 were overflowing. The problem seemed to be caused by notenough outflow from the containers. Tried to fix the problem for most of the evening and replaced most of the containers with new ones thathad good flow around 1 am. By 2 am, all containers seemed to be holding a good volume and not overflowing. At 6:45 am on 7/27 came backand a couple containers looked like they were overflowing again. Replaced all the outflow mesh with 50 µm and the problem seems to be fixed.
July 25, 2011OA FHL 2011Took spec pH of the cooler water and of the water in one larval container for each treatment (6 am). Recalibrated the Durafet probes based onthe spec pH for the cooler water. Turned off flow through on larval containers.At 7:30 am, collected 31 adult C. gigas from Argyle Creek. Strip spawned 10 females and 4 males, separating sperm and eggs.
343
At 7:30 am, collected 31 adult C. gigas from Argyle Creek. Strip spawned 10 females and 4 males, separating sperm and eggs.Fertilization (in the correct pCO2 water) began around 10:30 am. About 90,000 eggs were fertilized with about 1200 sperm.The fertilized eggs were incubated for 10-15 minutes to allow fertilization to occur and were then rinsed into the static larval containers (staticfor 24h).Fertilization of the falcon tubes used to monitor development and take samples for fixation within the first 24 hours begain at 11:25 am andproceeded as follows for each of the treatment coolers (2replicates fertilized per cooler):106B - 11:25 am105A - 11:40 am103A - 11:55 am103B - 12:10 pmThe fertilized eggs were left to incubate for 10 minutes and then put into 40 mL of seawater at the correct pCO2. The tubes were placed in thecoolers that contain the larval containers. At one hour post fertilization (hpf), the Falcon tubes were gently inverted 3x and 500 uL werealiquoted into a microcentrifuge tube (this was repeated for a total of 1 mL). The fertilized eggs were allowed to settle to the bottom of the tubefor 5 minutes, then the seawater was drawn off and 1 mL of 4% paraformaldehyde (PFA) was added. The tubes were left to sit overnight.Starting at 5:25 pm (6 hpf) when there was evidence of the larvae hatching into the trocophore stage, the same steps were repeated except thelarvae were all strained onto a 35 µm mesh screen and rinsed using 1 mL of SW into a tube. 1 mL of 7.5% MgCl2 was added to relax thelarvae and they were left to sit for 15 minutes. The SW + MgCl2 was then removed and replaced with 1 mL of 4% PFA, left to sit overnight.
At 2:30 pm, samples were taken in 500 mL Pyrex bottles for carbonate chemistry from each cooler. Samples were also taken for spec andtemperature and salinity were measured with probes.
July 24, 2011OA FHL 2011Reset settings on tanks for new treatments. All are at 21C and the pCO2 are at 400, 700, 1000, and 1500 µatm.
July 23, 2011OA FHL 2011Tank 103 is adjusted to the correct pH levels as is tank 106B. Tanks 105 and 106A are not appropriately equilibrating. Tank 106A was notflowing through and so was not allowing turnover of water - replumbed it and seems to be getting a little better. Turned off the CO2 to tanks 105so that the pH could come up. Moose also fixed a problem with the vacuum compressor, which may help as well.
Temperature is not getting high enough on any of the tanks (does not go above 22 C). On tanks 103, put a heater in the cooler that containsthe cooling coil (set at 24C) to try and warm the incoming water. Each cooler containing the experimental replicates has 1 500W heater, it maybe that they each need 2.
July 22, 2011OA FHL 2011Made new m-cresol purple: dissolved 0.016 g of m-cresol purple (MW = 404.4 g/mol) in 20 mL of milliQ water to make 2mmol/L solution.Brought to pH ~7.9 using 0.1N HCl. Did a dye addition correction using 4 samples of seawater, 2 with added HCl for a pH range (10 µl and 20µl).The slope (b) = -1.415The intercept (a) = 0.996
Durafet pH probe calibration: Each tank has a Durafet probe attached to the pump that measures the pH of the water in the tank. These needto be calibrated with the spectrophotometric pH. Turned off the water flow into the coolers around 9 am and let the water circulate through thepumps for ~1/2 hour. Took one cuvette of water from each tank to measure pH using m-cresol purple (MCP). Calibrated temperature for eachprobe using the Fluke thermometer. Tanks 103 A and B were at 10C, 105 A and B were 10.4C, and 106 A and B were 10.2 and 10.3 C,respectively. pH measured at 25C was adjusted for dye addition (see above) and adjusted for temperature using CO2calc and assuming thattotal alkalinity = 2060 µmol/kg. Probes were calibrated to the correct pH as follows:
TANK MEASURED pH ADJUSTED pH103A 7.76 7.98103B 7.76 7.98105A 7.78 7.99105B 7.79 8106A 7.77 7.99106B 7.76 7.98
After calibration, tanks were set to the appropriate treatments outlined July 18, 2011.
July 21, 2011OA FHL 2011
344
OA FHL 2011Turned on water in coolers and set flow through larval containers around 11:30 am.
July 20, 2011OA FHL 2011Washed all larval containers and lids using vortex and fresh water. Made 35 and 50 µm large screens and 35 µm small screens.
Made 7.5% MgCl2 in MilliQ water (0.7877 mol/L). Dissolved 7.49 g of MgCl2 (MW = 95.2115 g/mol) in 100 mL of water.
Made 1x PBS from 10x PBS (from Jaquan) by mixing 10 mL of 10x in 90 mL of DI water. Brought the pH down to 7.4 with 1N HCl. The 1N HClwas made from 10N HCl - 20 mL of 10 N HCl in 180 mL of DI water.
Made 4% paraformaldehyde in filtered seawater. Each ampoule of 16% PFA is 10 mL - mixed with 30 mL of FSW.
July 19, 2011OA FHL 2011Cleaned out all 6 coolers to be used for the experiment. Emptied all water in the coolers and wiped down with vortex. Let sit with the vortex for>5 minutes. Wiped down twice with fresh water.
"Larvae-proofed" the 36 larval chambers for the experiment. All chambers have an outflow of ~1/2" diameter near the top of the container. I hotglued mesh of 35µm on the outflow so that larvae would not be able to escape.
Working on a detailed experimental protocol and materials list for the experiment. It can be found here
July 18, 2011OA FHL 2011: Choosing pH for OA experimentsThe coolers representing different treatments need to be set at specific pH that represent the correct µatm treatments for CO2 in seawater.These values depend on total alkalinity (TA), salinity, and temperature. Students in the OA class have measured the TA and salinity of theincoming water into the tanks. TA = 2060 µmol/kg, salinity = 30.1 ppt. All measurements are taken at 25C. For each temperature treatment, theadjusted conditions are set to the correct T (24 or 28C). Constants used in CO2calc are Lueker et al. 2000 for CO2 constants, Dickson 1990bfor KHSO4, Total pH scale, Wanninkhof 1992 for air-sea flux (Dickson, pers. comm.) pH at which the Honeywell controllers will be set are:24C, 400 µatm: 8.0424C, 700 µatm: 7.8424C, 1000 µatm: 7.6928C, 400 µatm: 7.9828C, 700 µatm: 7.7828C, 1000 µatm: 7.64
June 17, 2011How to measure total alkalinity
Find a clean, dry 200 mL beakerRinse beaker 3 times with a small amount of water from your sample (dispose of rinse water properly)Fill beaker with sample to ~130 mLZero balance and weigh beaker with water and zero again. Remove beaker from balance, pour the sample into the insulatedbeaker on the stir plate and place empty beaker on the balance. The sample weight is the absolute value of the number on thebalance display. Record the sample weight.Stir contents of insulated beaker with a magnetic stir bar. Place TA and temperature electrodes in the sample. The sample shouldwarm to 25 +/- 0.1 degree C.Click “initialize instrument” in Controls tab.When temperature is attained, enter the salinity and weight of the sample into the Controls tab in LabView. Click “begin titration”An initial pulse of HCl will be added, then none for 2-5 minutes, then small pulses. The TA measured by the two differentelectrodes should be within 4 units of each other.When TA measurement is done, rinse probes over sample with DI water and pat gently with kimwipes. Do NOT touch theelectrodes on the bottom of the probes.Use the peristaltic pump to suck out the water from the beaker into the SW + HCl waste. Rinse the insulated beaker with DI watera few times and turn off pump when done.Without touching the inside of the insulated beaker, remove the stir bar with a kimwipe. Wipe out 3 times with kimwipes to dry
Making m-cresol purpleM-cresol purple needs to be kept at 4C once the powder is dissolved because the dye degrades in water over time. The concentration of thedye for a 10 mL cuvette should be 2 mmol/L, or 0.04044 g in 50 mL of nanopure/milliQ water. The dye needs to be brought to 7.9 +/- 0.1 pH, or
345
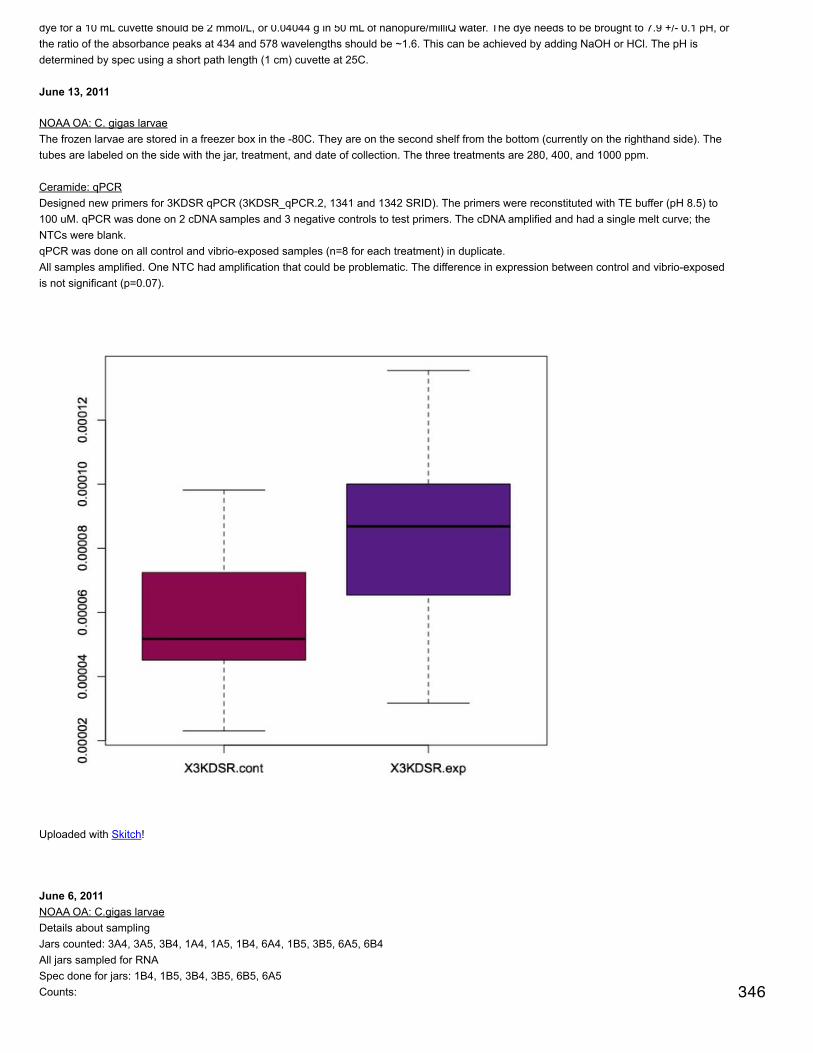
dye for a 10 mL cuvette should be 2 mmol/L, or 0.04044 g in 50 mL of nanopure/milliQ water. The dye needs to be brought to 7.9 +/- 0.1 pH, orthe ratio of the absorbance peaks at 434 and 578 wavelengths should be ~1.6. This can be achieved by adding NaOH or HCl. The pH isdetermined by spec using a short path length (1 cm) cuvette at 25C.
June 13, 2011
NOAA OA: C. gigas larvaeThe frozen larvae are stored in a freezer box in the -80C. They are on the second shelf from the bottom (currently on the righthand side). Thetubes are labeled on the side with the jar, treatment, and date of collection. The three treatments are 280, 400, and 1000 ppm.
Ceramide: qPCRDesigned new primers for 3KDSR qPCR (3KDSR_qPCR.2, 1341 and 1342 SRID). The primers were reconstituted with TE buffer (pH 8.5) to100 uM. qPCR was done on 2 cDNA samples and 3 negative controls to test primers. The cDNA amplified and had a single melt curve; theNTCs were blank.qPCR was done on all control and vibrio-exposed samples (n=8 for each treatment) in duplicate.All samples amplified. One NTC had amplification that could be problematic. The difference in expression between control and vibrio-exposedis not significant (p=0.07).
Uploaded with Skitch!
June 6, 2011NOAA OA: C.gigas larvaeDetails about samplingJars counted: 3A4, 3A5, 3B4, 1A4, 1A5, 1B4, 6A4, 1B5, 3B5, 6A5, 6B4All jars sampled for RNASpec done for jars: 1B4, 1B5, 3B4, 3B5, 6B5, 6A5Counts: 346

counts were done for live/dead, calcification, and size. Aliquots used for counting were 6x1000 uL divided between 2 wells. Calculations weredone as described May 19. Calcification data were taken on June 7. As for June 1, there were barely any larvae left in the 1000 ppm treatmentand densities were low in all jars.For the samples taken for RNA for 1A5 and 1B5 there were many shell bits that were too hard to remove without compromising the sample.3A4 was the only jar that was first filtered with 180 um mesh to get rid of rotifers (it didn't seem to help much since the rotifers were still there,they were probably able to squeeze through the mesh).The algae used to feed the larvae had crashed but was still being delivered into the larval chambers.Copepods had proliferated in some of the jars and I saw many copepod eggs and some copepodites.The wells corresponding to 6B4 were completely covered by rotifers. When EtOH was added to these wells, the rotifers created a solid mat onthe bottom.
June 1, 2011NOAA OA: C.gigas larvaeDetails about samplingJars counted: 1A4, 1A5, 1B4, 1B5, 3A4, 3A5, 3B4, 3B5, 6A4, 6A5, 6B5No jars sampled for RNASpec done for jars: 1A4, 1A5, 3A4, 3A5, 6A4, 6A5Counts: counts were done for live/dead, calcification, and size. Aliquots used for counting were 3x 1000 uL. Calculations were done asdescribed May 19. Sarah took size pictures for plate 2, wells A2, B2 and C2 on June 2. Trends included: a number of the jars at 1000 ppm hadno larvae at all; there was no obvious trend in number of larvae swimming per treatment or in calcification or mortality. Since the anomalousresults at previous time points for the 1000 ppm treatments drive the trends, it seems that the lack of data for this time point results in noobvious trends. The absence of larvae could be due to a mass mortality event between May 27 and June 1.
Rotifers were in all jars counted and were very dense in some. This distracted from counting. The rotifers also "kick" the larvae, which seems tocause the larvae to close their valves and cease swimming. In 6B4, there was so much algae and rotifer bodies that it was difficult to see thelarvae.
May 27, 2011NOAA OA: C.gigas larvaeDetails about samplingJars counted: 1B3, 3B3, 6B3, 1B6, 3B6, 6B6, 1A4, 3A4, 6A4, 1A5, 3A5, 6A5, 1B4, 3B4, 6B4, 1B5, 3B5Jars sampled for RNA: 1B3, 3B3, 6B3, 1B6, 3B6, 6B6**There are two tubes for 6B6 because there was so much algae in the sample that the volume couldn't be reduced enough on the sieve to fit inone tube.Spec done for jars: 1B3, 3B3, 6B3, 1B6, 3B4, 6B6Counts: counts were done for live/dead, calcification, and size. Aliquots used for counting were 3x450 uL. Calculations were done as describedMay 19. Calcification for plate 4 was done on May 28 (in the morning around 7:30 am). Trends included: slightly greater number of larvaeswimming in the 1000 ppm; fewer completely calcified larvae at 1000 ppm and greater partially calcified and uncalcified; overall least amount oftotal mortality at 1000 ppm but the single jar with the greatest total mortality was also at 1000 ppm; inconsistent instant mortality.Rotifers were observed in almost all the jars. There was a lot of algae in the jars from treatment 6, box B. Jar 6A5 was dropped and ~1/3 of thecontents spilled. The jar was refilled with water and replaced in its box. Around 9 pm, ~60 g of adult C. gigas shell fragment were placed in all
the remaining jars. In one box for each treatment, two jars were put in the system with only water and 2 jars with water and 60 g of shellfragment to monitor changes in total alkalinity.
May 23, 2011NOAA OA: C.gigas larvaeDetails about samplingJars counted: 3A3, 3B3, 3A6, 3B5, 3B6, 3A6, 3A5, 6A3, 6A6, 6B3, 6A5, 1A6, 1A3, 1A5, 1B5, 1B3, 1B6Jars sampled for RNA: 3A3, 3A6, 1A3, 1A6, 6A3, 6A6Spec done for jars: 1A3, 3B3, 6A3, 1A6, 3A6, 6A6Counts: counts were done for live/dead, calcification, and size. Aliquots used for counting were 3x333 uL (1 mL). Calculations were done asdescribed May 19. Trends observed included: greater number of larvae swimming in the 1000 ppm; lower % calcified larvae at 1000 ppm;higher % partially and uncalcified larvae at 1000 ppm, lowest uncalcified at 280 ppm; greater total and instant mortalities at 1000 ppm. Rotifershad somehow gotten into the jars in treatment 6 (400 ppm). Ciliates were observed in some jars.
May 19, 2011NOAA OA: C.gigas larvaeDetails about samplingJars counted: 3B1, 3B2, 3B3, 3B4, 3A3, 3A4, 6B1, 6B2, 6B3, 6B4, 6A3, 6A4, 1B1, 1B2, 1B3, 1A3, 1A4, 1B4.Jars sampled for RNA: 3B1, 3B2, 6B1, 6B2, 1B1, 1B2Spec done for jars: 1B1, 3B1, 6B1, 1B2, 3B2, 6B2 347

Spec done for jars: 1B1, 3B1, 6B1, 1B2, 3B2, 6B2Counts: counts were done for live/dead and calcification. Photos were taken for size for plate 6. Sarah took photos for the other plates the nextday (5/20). Aliquots used for counting were 7x100 uL (700 uL). Calculations and graphs were made to observe trends for % swimming larvae,% calcified, % partially calcified, % uncalcified, total mortality, and instant mortality. Since the number of empty shells were recorded, it ispossible to separate out the larvae that have died recently (instant mortality) from those that have died over the course of the experiment buthave just been counted (total mortality). % swimming is based on the total larvae, including the empty shells. All the calculations for % calcified,etc. are based on total larvae excluding the empty shells. Observed general trends include: more larvae are swimming at 1000 ppm; morelarvae are totally calcified at 400 ppm > 280 ppm > 1000 ppm; more larvae are partially calcified and uncalcified at 1000 ppm; total and instantmortalities arehighest at 400 ppm and lowest at 1000 ppm. Ciliates were present in some jars.
May 18, 2011Ceramide sequencingAnalysis/incorporation of new sequences3KDSR to include stop codon: Assembled all previously sequenced reverse sequences. Based on alignment with the new reverse sequence(R2), deleted all Ns and the first 6 bp (GCCCTT) from the consensus (1626). Assembled with R2 and made consensus (1627). Assembled allpreviously sequenced forward sequences and made consensus (1628). Made reverse complement of the contig 1627 and assembled with theforward contig (1628) to make consensus full sequence 1630. Trimmed at bp 111 to start with ATG. Based on majority rule, base pairs werechanged in the contig 1630 to have certainty in protein translation: bp 904 = G, bp 936 = G, bp 964 = C. Translated and trimmed amino acidsequence to include first stop codon at aa 329.Sptlc1 missing middle 26 bp: Sequenced purified gel band of Sptlc1 PCR (F and R) and resequenced plasmid prep from before (F and R) for 4new sequences. Assembled all previous and new F and R sequences - F contig is 1631, R is 1632. They did not align. Aligned them with theoriginal Sptlc1 EST and there are still 10 bp missing in the middle of the sequence.
NOAA OA: C.gigas larvaeShallin and Mike showed me how to take samples for PMEL to test total alkalinity (TA) and dissolved inorganic carbon (DIC). The jars (500 mL)are from PMEL and are made to be nonporous. 1. label the jars with a paint marker: "NWFSC/UW dd/mm/yy Tank #"2. Grease the stopper and smooth out the grease by moving the stopper in the neck of the jar3. Make sure the equilibrator pump is on and attach tubing to outlet from equilibrator.
4. Let water flow out the tube for at least 1 minute.5. Rinse bottle well, upside down so water flows out.6. Fill bottle completely with water from tank and let overflow for at least 5 seconds (about equal to half the volume of the bottle).7. Pinch off tube tightly and quickly remove from jar. It is important to have adequate headspace so that the water does not overflow after thepoison is added. Turn off water flow.8. Poison jar with mercuric chloride (Shallin does this) and put in stopper.
May 16, 2011NOAA OA: C. gigas larvaeThe NOAA side of the experiment ended on Sunday (May 15) and our experiment now has access to 1 more box (=6 more jars) per treatment.The sampling schedule has been updated and is in the google doc of the sampling data.When I came in Monday morning, there was no water flowing to the jars in treatment 3 (280 ppm). Paul says that they had trouble with thattank on Sunday and that it probably stopped working Sunday night. After doing the pH spec, I verified that the pH in the jars had not beenadversely affected by the static water. The jars were all moved to tank 4, which had been previously equilibrated to 280 ppm. The jars are stilllabeled as treatment 3 jars (i.e. 3A1 as opposed to 4A1) but will remain attached to tank 4 for the remainder of the experiment.Sampling for May 16:Total jars sampled for RNA - 1A1, 1A2, 3A1, 3A2, 6A1, 6A2Jars counted (5 aliquots of 100 uL from the Falcon tube) - 1A1, 1A2, 3A1, 3A2, 6A1, 6A2, 1A3, 1B3, 6A3, 6B3, 1B1, 1B2, 3B1, 3B2, 6B1, 6B2
Details about samplingRNA: All larvae were removed from jars using a 20 um mesh sieve. Larvae were transferred from the sieve into a 2 mL tube with 1-2 mL ofseawater. The tube was spun down at 5,000 rpm for 1 min and the seawater was removed. The larvae were then flash frozen in liquid N2 andlater transferred to the -80C freezer.Counting: Counts were done for live/dead, calcification, and size. In some of the wells (both wells for 1A1 and one well for 1A2) too much EtOHwas added and it was difficult to find the partially/uncalcified larvae, so their representation may be missing from the final counts. For thesewells, shells were fully calcified if they had they full D-hinge shape and were partially calcified if the shell was very small/was not the correctshape. No uncalcified larvae were found in these wells (which is unrealistic since it is the 1000 ppm treatment). All other wells were easy toscore. For size, photos were taken of ~10 larvae per well on the dissecting scope (5x) of larvae that were positioned in the well so that a clear"D" shape was visible when looking down at them. Photos were taken 5.17.11. Measurements have not yet been taken.
Other notesAll larvae were D-hinge or close to (kidney bean shaped) if calcification was apparent. Partially calcified larvae ranged from small dots ofcalcified material on the larval body to a full shell that did not show a well formed cross under the polarized light.
348
calcified material on the larval body to a full shell that did not show a well formed cross under the polarized light.Empty shells were included in counts of mortality, but not calcification.There were ciliates in some wells/jars (see data sheet).There seemed to be more algae in the jars from treatment 1 (1000 ppm) - maybe because the higher pCO2 is causing the algae to grow in thejars?
May 13, 2011NOAA OA: C. gigas larvaeSampled 2 jars from each treatment and took data on microscope.Began cleaning and sampling jars around 8:30 am. Cleaning was accomplished as described for May 10, 2011. Aliquots for counting were 3x60 uL (180 uL). Calcification amount was also determined on the inverted microscope using double polarization. A few pictures were taken asexamples of different levels of calcification: full, partial, uncalcified. Data can be found in link from May 10. Eggs were not included in totalcounts. A couple of ciliates were seen in one well from jar 3B2. Jar 6B5 was sampled in its entirety for RNA due to low densities of larvae inmost of the jars from shelf 6. In general, densities are much lower than expected and the sampling schedule will have to be adjustedaccordingly.Samples were taken for gene expression analysis from 6 jars: 1B1, 3B1, 1B2, 3B3, 6B2, 6B5. After preliminary density counts for each jar, the
correct volume for the desired number of larvae (10,000 or 5,000) was taken from the 50 mL Falcon tube. This volume was filtered through a20 um sieve and then pipetted into a 2 mL screw cap tube. The larvae were left to sit for ~1 min, tapped a few times on the counter toencourage larvae to go to the bottom, and then most of the seawater was pipetted off before the larvae were flash frozen in liquid nitrogen. Thesamples were later transferred to a -80C freezer, but it appears that the dewar had run out of liquid N2 and the samples may not have goodquality RNA.
Larval feeding began Thursday at ~4 pm, except for box 3B which was started Friday morning (and given a surplus of food at that time).
May 10, 2011NOAA OA: C. gigas larvaeBegan cleaning and sampling jars around 8:30 am. Each jar was completely emptied into a 20 um mesh sieve and then rinsed out with theappropriate treatment water. A new, clean jar/larval chamber was filled with new water from the appropriate treatment and if that jar was notscheduled to be sampled, all larvae were rinsed into the new jar. If the jar was scheduled to be sampled (jars 5 and 6 for May 10), then a cleanjar was prepped while larvae were washed into a 50 mL Falcon tube, which was then filled to 45 mL. The tube was gently mixed ~5x, 3 aliquotsof a fixed volume were taken and put into a welled plate (1 well) and then these two steps were repeated so that for each jar sampled therewere 2 wells of a fixed volume to count. For shelf 1, the volume taken was 45 uL x3, for shelves 3 and 6 the volume was 25 uL x3 (135 uLyielded too many larvae). After the aliquots were taken from the Falcon tube, it was poured into the new, clean jar and replaced in theappropriate box. At the end of sampling all the jars, they were plugged into the system so that the water would flow through.Counting of larvae began ~10 am. First, live/dead were determined on the inverted microscope at 40x. Then the larvae were dropped with100% EtOH and total counts were taken per well on the inverted scope at 4x. Count data are hereShallin did pH spec on the system and jars for demography.Jars were plugged into the system (flow-through) ~4 pm.
Treatment 1 = 1000 ppmTreatment 3 = 280 ppmTreatment 6 = 400 ppm
May 9, 2011NOAA OA: C. gigas larvaeCarolyn and Brent went to Taylor and fertilized eggs for the experiment. 21 females and 20 males were used in the fertilization. 80,000 eggswere aliquoted to each jar for transport (each jar would then be emptied into the larger larval chambers at NWFSC) and the eggs were fertilizedin the jars with pooled sperm. We began putting the fertilized eggs into the chambers containing treatment water around 5 pm (treatmentpCO2= 280 ppm, 400 ppm 1000 ppm). The system is being kept at 14C. Fertilized eggs in the larval chambers were left static overnight so thatthe larvae could hatch.2 jars (~80,000) fertilized eggs were strained on 20 um mesh and stored at -20C for pop gen.
May 3, 2011C. gigas larvae: OA & Vtextracted 2 samples for RNA: 1 control and 1 10^6 Vt. First spun down briefly at 5,000 xg and removed seawater supernatant. Then extractedwith TRI reagent according to manufacturer's protocol. Resuspended in 50 uL 0.1% DEPC H2O and mixed by pipetting. Checked RNAconcentrations on Nanodrop, doing each sample in triplicate. Average concentrations are reported below.control: 27.03 ng/uL10^6 Vt: 30.68 ng/uL
S. glomerata: OA 349
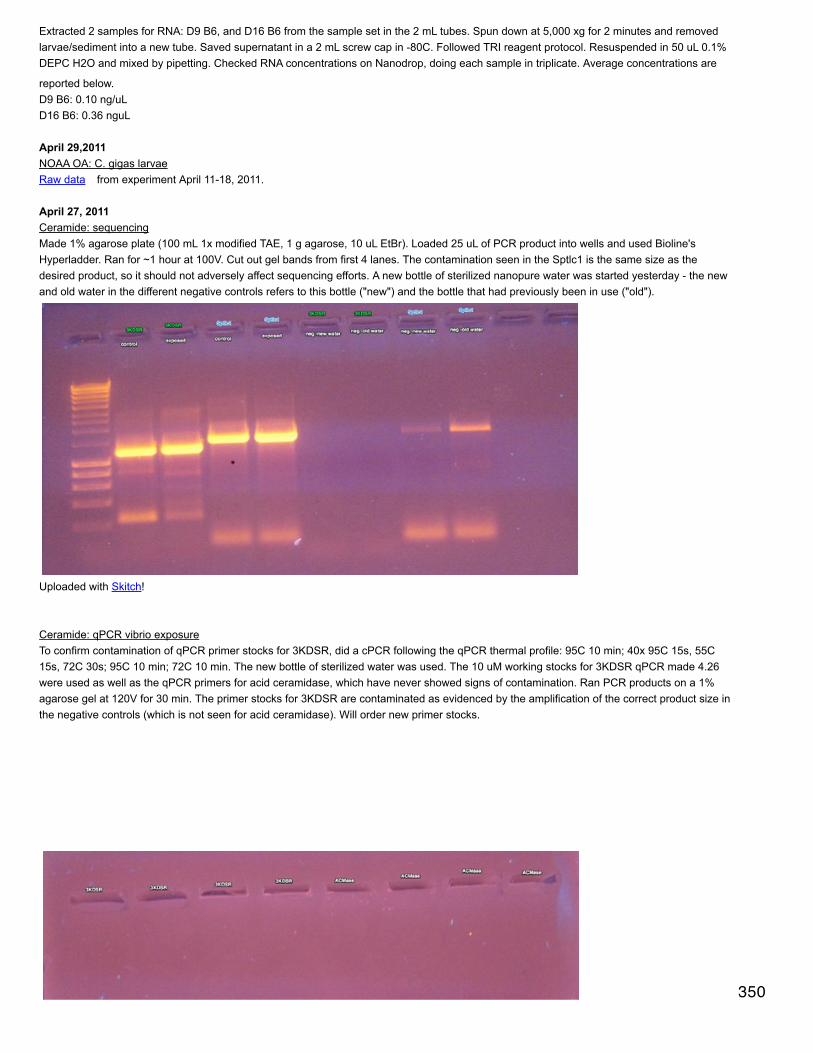
Extracted 2 samples for RNA: D9 B6, and D16 B6 from the sample set in the 2 mL tubes. Spun down at 5,000 xg for 2 minutes and removedlarvae/sediment into a new tube. Saved supernatant in a 2 mL screw cap in -80C. Followed TRI reagent protocol. Resuspended in 50 uL 0.1%DEPC H2O and mixed by pipetting. Checked RNA concentrations on Nanodrop, doing each sample in triplicate. Average concentrations are
reported below.D9 B6: 0.10 ng/uLD16 B6: 0.36 nguL
April 29,2011NOAA OA: C. gigas larvaeRaw data from experiment April 11-18, 2011.
April 27, 2011Ceramide: sequencingMade 1% agarose plate (100 mL 1x modified TAE, 1 g agarose, 10 uL EtBr). Loaded 25 uL of PCR product into wells and used Bioline'sHyperladder. Ran for ~1 hour at 100V. Cut out gel bands from first 4 lanes. The contamination seen in the Sptlc1 is the same size as thedesired product, so it should not adversely affect sequencing efforts. A new bottle of sterilized nanopure water was started yesterday - the newand old water in the different negative controls refers to this bottle ("new") and the bottle that had previously been in use ("old").
Uploaded with Skitch!
Ceramide: qPCR vibrio exposureTo confirm contamination of qPCR primer stocks for 3KDSR, did a cPCR following the qPCR thermal profile: 95C 10 min; 40x 95C 15s, 55C15s, 72C 30s; 95C 10 min; 72C 10 min. The new bottle of sterilized water was used. The 10 uM working stocks for 3KDSR qPCR made 4.26were used as well as the qPCR primers for acid ceramidase, which have never showed signs of contamination. Ran PCR products on a 1%agarose gel at 120V for 30 min. The primer stocks for 3KDSR are contaminated as evidenced by the amplification of the correct product size inthe negative controls (which is not seen for acid ceramidase). Will order new primer stocks.
350
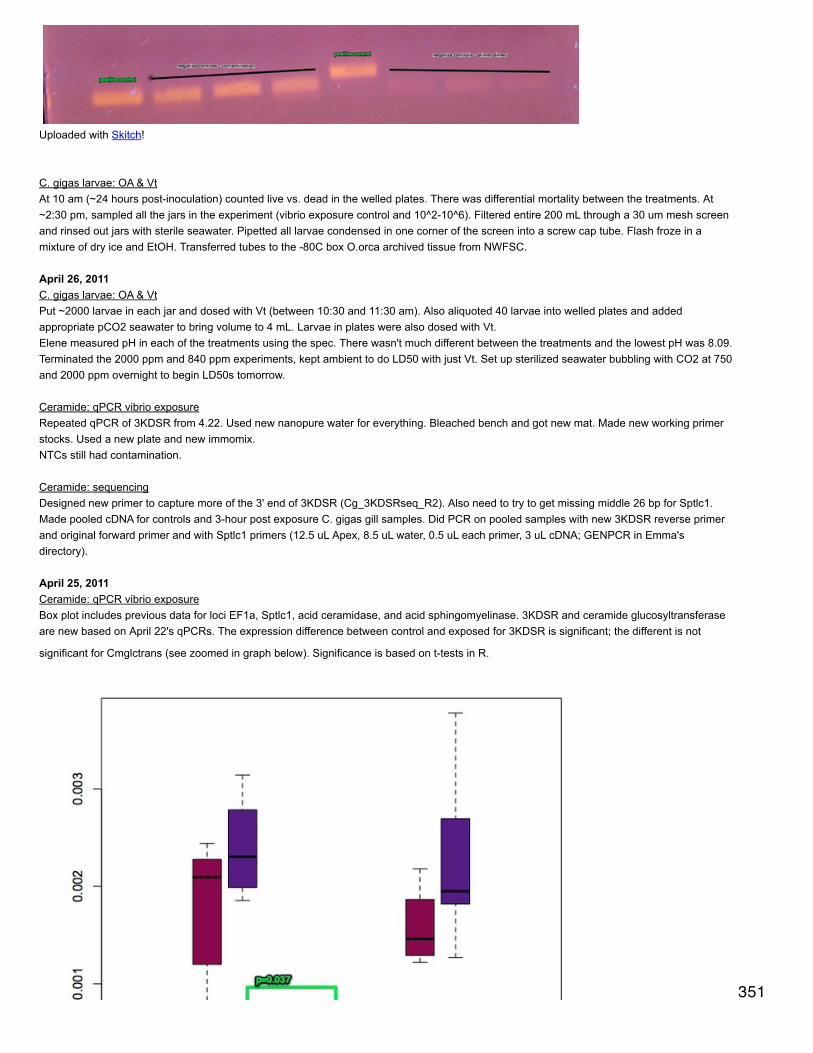
Uploaded with Skitch!
C. gigas larvae: OA & VtAt 10 am (~24 hours post-inoculation) counted live vs. dead in the welled plates. There was differential mortality between the treatments. At~2:30 pm, sampled all the jars in the experiment (vibrio exposure control and 10^2-10^6). Filtered entire 200 mL through a 30 um mesh screenand rinsed out jars with sterile seawater. Pipetted all larvae condensed in one corner of the screen into a screw cap tube. Flash froze in amixture of dry ice and EtOH. Transferred tubes to the -80C box O.orca archived tissue from NWFSC.
April 26, 2011C. gigas larvae: OA & VtPut ~2000 larvae in each jar and dosed with Vt (between 10:30 and 11:30 am). Also aliquoted 40 larvae into welled plates and addedappropriate pCO2 seawater to bring volume to 4 mL. Larvae in plates were also dosed with Vt.Elene measured pH in each of the treatments using the spec. There wasn't much different between the treatments and the lowest pH was 8.09.Terminated the 2000 ppm and 840 ppm experiments, kept ambient to do LD50 with just Vt. Set up sterilized seawater bubbling with CO2 at 750and 2000 ppm overnight to begin LD50s tomorrow.
Ceramide: qPCR vibrio exposureRepeated qPCR of 3KDSR from 4.22. Used new nanopure water for everything. Bleached bench and got new mat. Made new working primerstocks. Used a new plate and new immomix.NTCs still had contamination.
Ceramide: sequencingDesigned new primer to capture more of the 3' end of 3KDSR (Cg_3KDSRseq_R2). Also need to try to get missing middle 26 bp for Sptlc1.Made pooled cDNA for controls and 3-hour post exposure C. gigas gill samples. Did PCR on pooled samples with new 3KDSR reverse primerand original forward primer and with Sptlc1 primers (12.5 uL Apex, 8.5 uL water, 0.5 uL each primer, 3 uL cDNA; GENPCR in Emma'sdirectory).
April 25, 2011Ceramide: qPCR vibrio exposureBox plot includes previous data for loci EF1a, Sptlc1, acid ceramidase, and acid sphingomyelinase. 3KDSR and ceramide glucosyltransferaseare new based on April 22's qPCRs. The expression difference between control and exposed for 3KDSR is significant; the different is not
significant for Cmglctrans (see zoomed in graph below). Significance is based on t-tests in R.
351

Uploaded with Skitch!
Uploaded with Skitch!
C. gigas larvae: OA & Vt 352

C. gigas larvae: OA & VtSet up system in basement to do a LD50 with 3 levels of CO2 (ambient, 840 ppm, and 2000 ppm) and 6 concentrations of V. tubiashii (control,10^2 CFU through 10^6 CFU). There are 2 replicate jars for each Vt concentration within each pCO2 for a total of 12 jars in each pCO2. Eachjar holds 200 mL of sterilized filtered seawater. The jars were placed in airtight boxes with an inlet for the correct pCO2 and an outlet attachedto tubing with the other end in water so that atmospheric air does not enter the box (see pictures below). At ~3:30 pm the boxes were sealedand the air was turned on so that the water in each jar will equilibrate to the correct pCO2. Also ~200 mL of water in a beaker was placed ineach box that will serve as water in the plates to be used for counting.
Uploaded with Skitch!
Uploaded with Skitch!
353
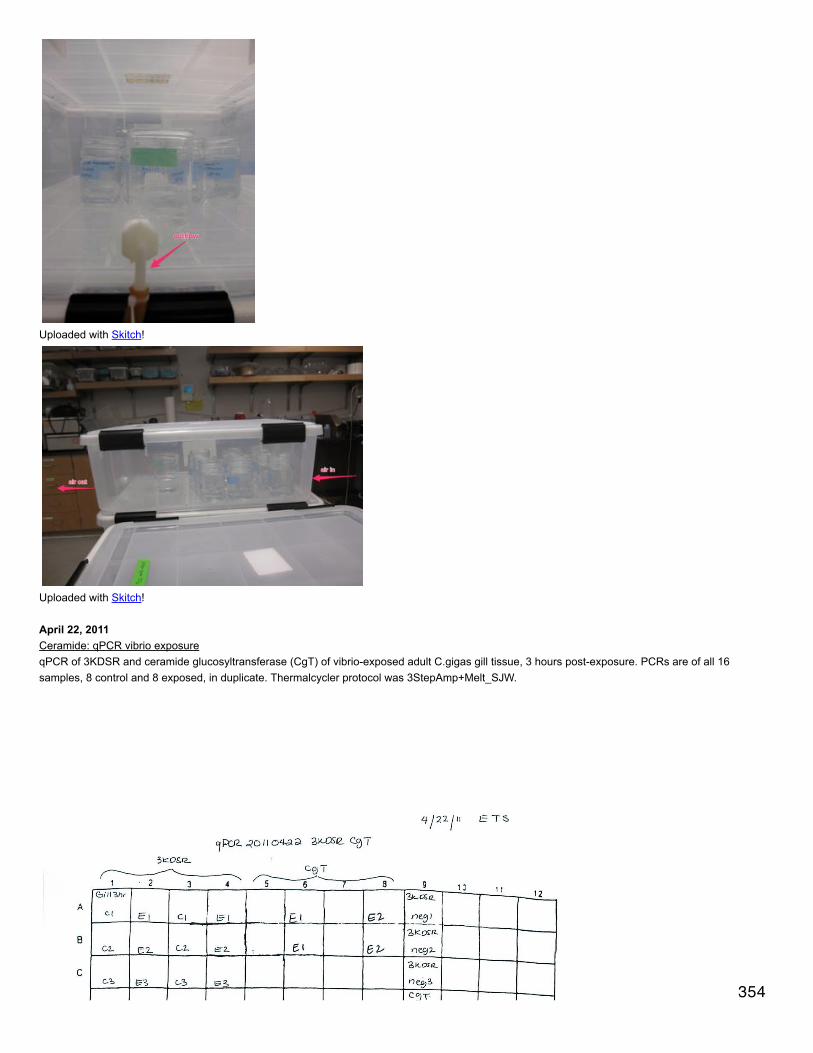
Uploaded with Skitch!
Uploaded with Skitch!
April 22, 2011Ceramide: qPCR vibrio exposureqPCR of 3KDSR and ceramide glucosyltransferase (CgT) of vibrio-exposed adult C.gigas gill tissue, 3 hours post-exposure. PCRs are of all 16samples, 8 control and 8 exposed, in duplicate. Thermalcycler protocol was 3StepAmp+Melt_SJW.
354

Uploaded with Skitch!
Results: 3KDSR was contaminated (high amplification of NTCs), CgT was not. Both primer pairs amplified only one product (one melt curve).
Made new working stocks of 3KDSR (10 uM) and did a qPCR of all samples in duplicate.
355
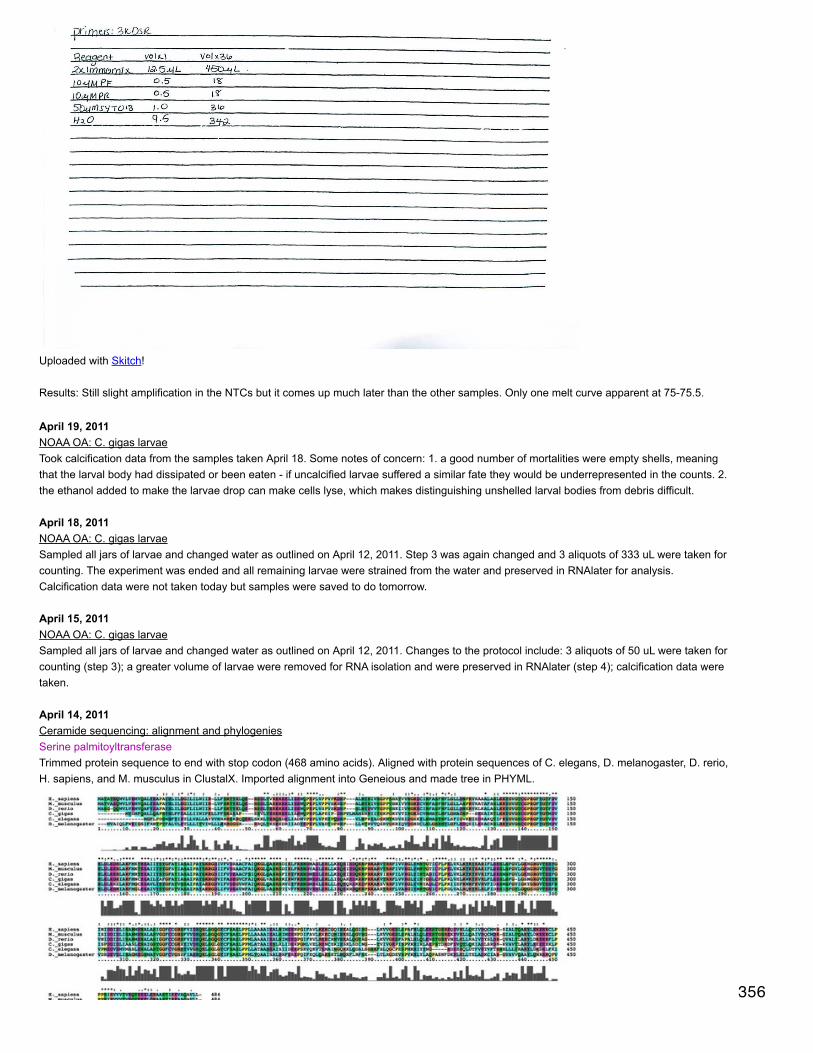
Uploaded with Skitch!
Results: Still slight amplification in the NTCs but it comes up much later than the other samples. Only one melt curve apparent at 75-75.5.
April 19, 2011NOAA OA: C. gigas larvaeTook calcification data from the samples taken April 18. Some notes of concern: 1. a good number of mortalities were empty shells, meaningthat the larval body had dissipated or been eaten - if uncalcified larvae suffered a similar fate they would be underrepresented in the counts. 2.the ethanol added to make the larvae drop can make cells lyse, which makes distinguishing unshelled larval bodies from debris difficult.
April 18, 2011NOAA OA: C. gigas larvaeSampled all jars of larvae and changed water as outlined on April 12, 2011. Step 3 was again changed and 3 aliquots of 333 uL were taken forcounting. The experiment was ended and all remaining larvae were strained from the water and preserved in RNAlater for analysis.Calcification data were not taken today but samples were saved to do tomorrow.
April 15, 2011NOAA OA: C. gigas larvaeSampled all jars of larvae and changed water as outlined on April 12, 2011. Changes to the protocol include: 3 aliquots of 50 uL were taken forcounting (step 3); a greater volume of larvae were removed for RNA isolation and were preserved in RNAlater (step 4); calcification data weretaken.
April 14, 2011Ceramide sequencing: alignment and phylogeniesSerine palmitoyltransferaseTrimmed protein sequence to end with stop codon (468 amino acids). Aligned with protein sequences of C. elegans, D. melanogaster, D. rerio,H. sapiens, and M. musculus in ClustalX. Imported alignment into Geneious and made tree in PHYML.
356
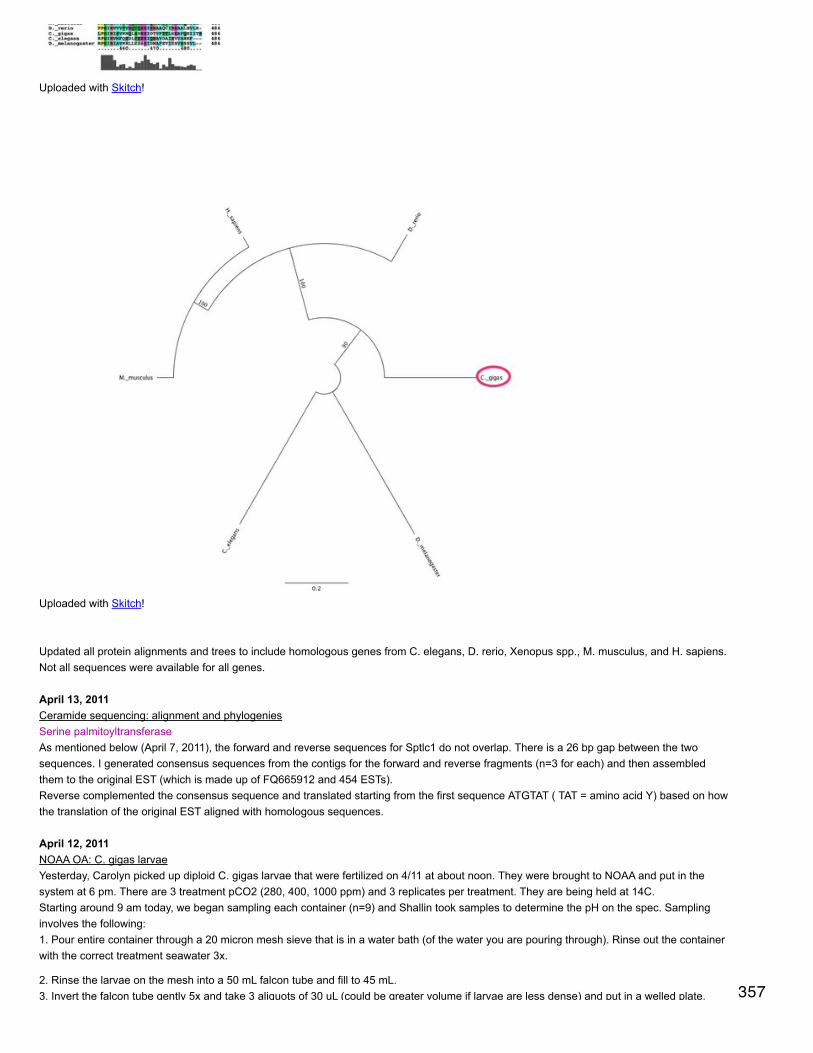
Uploaded with Skitch!
Uploaded with Skitch!
Updated all protein alignments and trees to include homologous genes from C. elegans, D. rerio, Xenopus spp., M. musculus, and H. sapiens.Not all sequences were available for all genes.
April 13, 2011Ceramide sequencing: alignment and phylogeniesSerine palmitoyltransferaseAs mentioned below (April 7, 2011), the forward and reverse sequences for Sptlc1 do not overlap. There is a 26 bp gap between the twosequences. I generated consensus sequences from the contigs for the forward and reverse fragments (n=3 for each) and then assembledthem to the original EST (which is made up of FQ665912 and 454 ESTs).Reverse complemented the consensus sequence and translated starting from the first sequence ATGTAT ( TAT = amino acid Y) based on howthe translation of the original EST aligned with homologous sequences.
April 12, 2011NOAA OA: C. gigas larvaeYesterday, Carolyn picked up diploid C. gigas larvae that were fertilized on 4/11 at about noon. They were brought to NOAA and put in thesystem at 6 pm. There are 3 treatment pCO2 (280, 400, 1000 ppm) and 3 replicates per treatment. They are being held at 14C.Starting around 9 am today, we began sampling each container (n=9) and Shallin took samples to determine the pH on the spec. Samplinginvolves the following:1. Pour entire container through a 20 micron mesh sieve that is in a water bath (of the water you are pouring through). Rinse out the containerwith the correct treatment seawater 3x.
2. Rinse the larvae on the mesh into a 50 mL falcon tube and fill to 45 mL.3. Invert the falcon tube gently 5x and take 3 aliquots of 30 uL (could be greater volume if larvae are less dense) and put in a welled plate. 357

3. Invert the falcon tube gently 5x and take 3 aliquots of 30 uL (could be greater volume if larvae are less dense) and put in a welled plate.Which containers go in which wells is randomized.5. Take 750 uL of water + larvae from the falcon tube and strain through mesh (should be >500 larvae). Remove larvae from mesh with apipette and put in 2 mL screw cap vial and flash freeze.4. Blind counts are done for number larvae dead, number alive but on bottom of well, total larvae (and then by subtraction, the numberswimming), and calcification level (uncalcified, partially, or fully). Total larvae and calcification data are taken after the larvae have beendropped by EtOH. Calcification is determined using a polarized lens on the inverted scope. Mortality is verified at 40x.
No calcification data were taken today because the larvae were still too young to be calcified. The larvae are so small that there are probablynot enough frozen for qPCR.Tomorrow, feeding will begin for all the larvae.
April 8, 2011Ceramide sequencing: alignment and phylogeniesAcid ceramidaseGenerated consensus sequence from alignment in Geneious. Most of the beginning and end of the sequence are Ns, the start codon (ATG) isat bp 89 and the stop codon (TAA) ends at bp 1258. Translated consensus nucleotide sequence into a protein sequence and exported FASTAsof C. gigas protein with protein sequences from GenBank for C. elegans, D. rerio, H. sapiens, and R. norvegicus. Aligned all sequences inClustal and imported the protein alignment back into Geneious. Using the PHYML plug-in, generated a phylogenetic tree using the JTTalgorithm, 100 bootstraps, 0 invariable sites, and 1 substitution rate category.
Uploaded with Skitch!
358

Uploaded with Skitch!
Ceramide glucosyltransferaseSame as for ACMase. The reverse complement of the sequence was used to generate the protein sequence. On the reverse complement, theATG was 38bp after then Ns. The alignment was performed with sequences of CgT for H. sapiens, X. tropicalis, and C. elegans.
Uploaded with Skitch!
Uploaded with Skitch!
359
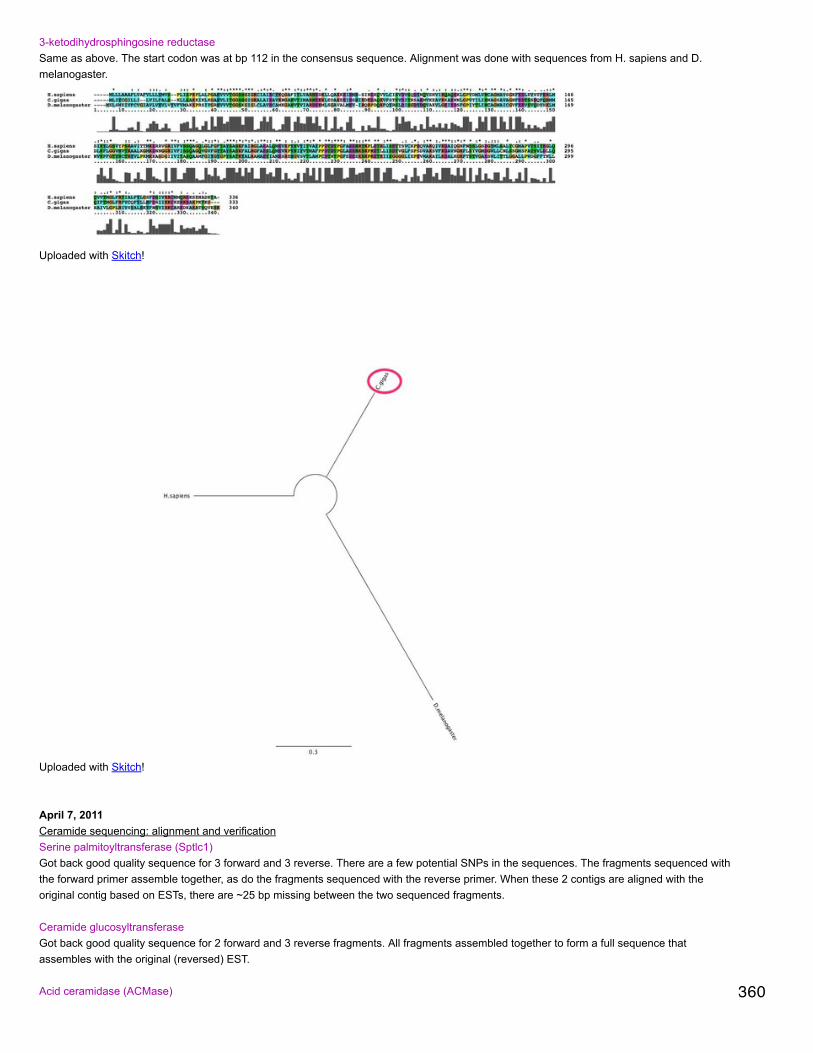
3-ketodihydrosphingosine reductaseSame as above. The start codon was at bp 112 in the consensus sequence. Alignment was done with sequences from H. sapiens and D.melanogaster.
Uploaded with Skitch!
Uploaded with Skitch!
April 7, 2011Ceramide sequencing: alignment and verificationSerine palmitoyltransferase (Sptlc1)Got back good quality sequence for 3 forward and 3 reverse. There are a few potential SNPs in the sequences. The fragments sequenced withthe forward primer assemble together, as do the fragments sequenced with the reverse primer. When these 2 contigs are aligned with theoriginal contig based on ESTs, there are ~25 bp missing between the two sequenced fragments.
Ceramide glucosyltransferaseGot back good quality sequence for 2 forward and 3 reverse fragments. All fragments assembled together to form a full sequence thatassembles with the original (reversed) EST.
Acid ceramidase (ACMase) 360

edit
Got back good quality sequence for 4 forward and 4 reverse fragments. All fragments assembled together and aligned with the original ESTused to design the primers.
3-ketodihydrosphingosine reductase (3KDSR)Got back good quality sequence for 8 forward and 7 reverse fragments. All fragments assembled together and aligned with the original contigused to design the primers.
March 31, 2011
C.gigas Larvae Vibrio exposureAlmost all larvae were dead in all treatments (including control), probably due to ciliates which had proliferated overnight.
March 30, 2011C.gigas Larvae Vibrio exposureCounted larvae to determine mortality. Only counted larvae on the bottom of the well. On the last day of the experiment we will count totallarvae in each well by dropping them with EtOH and then retroactively determine the number of swimming larvae for previous days. Dead vs.live larvae were determined at 40x magnification.
March 29, 2011C. gigas Larvae Vibrio exposureElene got 2 week-old larvae from the hatchery yesterday. This morning, we aliquoted ~40 larvae into wells of tissue culture plates and madesure the volumes in each well were at 4 mL. Different plates were inoculated with 10^3, 10^4, 10^5, 10^6, 10^7, or no V. tubiashii (control) thatElene had grown over the weekend. Plates were left on the benchtop to incubate over night.
March 24, 2011Ceramide sequencing: cloningSR cloned 4 PCR products for acid ceramidase and 4 for ceramide glucosyltransferase. I did the plasma minipreps today following the sameprotocol outlined March 8, 2011 except the spinning for 13,000xg was actually done at 13,000 rpm. The DNA and primer plates for sequencingwere updated with the new plasmids and primers.
March 18, 2011Ceramide sequencing: cloningPooled equal volumes of control oyster gill tissue at the 3 hour time point for the PCR. Each PCR reaction had 12.5 uL Apex, 8.5 uL water, 0.5uL each primer, and 3 uL cDNA. Primers used were ceramide glucosyltransferase and acid ceramidase (also NTCs). Ran on programGENPCR (Emma directory).Made 1.2% agarose gel (50 uL 1xTAE, 0.6 g agar, 5 uL EtBr). Loaded 5 uL of Bioline's Hyperladder and 10 uL PCR product and ran 100 V for~30 min.Observed band sizes corresponded to expected sizes: 1080 bp for ceramide glucosyltransferase and 1165 bp for acid ceramidase. Cut outbands and stored at -20 C in cDNA III box.
361

Uploaded with Skitch!
March 9, 2011Ceramide sequencing: cloningChecked the colonies from the re-cloning started on 3.7.2011 and there were not many so let them grow until today. Still very few colonies.Only one dark blue colony grew on the plates streaked with the Bioline cells. Only dark blue colonies on the TOPO cell plates. Fail :(
Ceramide: tissue distributionBelow are the graphs of the tissue distribution of gene expression for the genes identified in the ceramide pathway. qPCRs were done on3.8.11 (ASMase), 12.14.10 (Sptlc1), and 3.1.11 (3KDSR, CMglctrans, ACMase). All data were analyzed in PCR miner and are averages acrossduplicate Cts. Expression values are normalized to EF1a (qPCR 11.30.10).
362

Uploaded with Skitch!
Uploaded with Skitch!
Uploaded with Skitch!
363
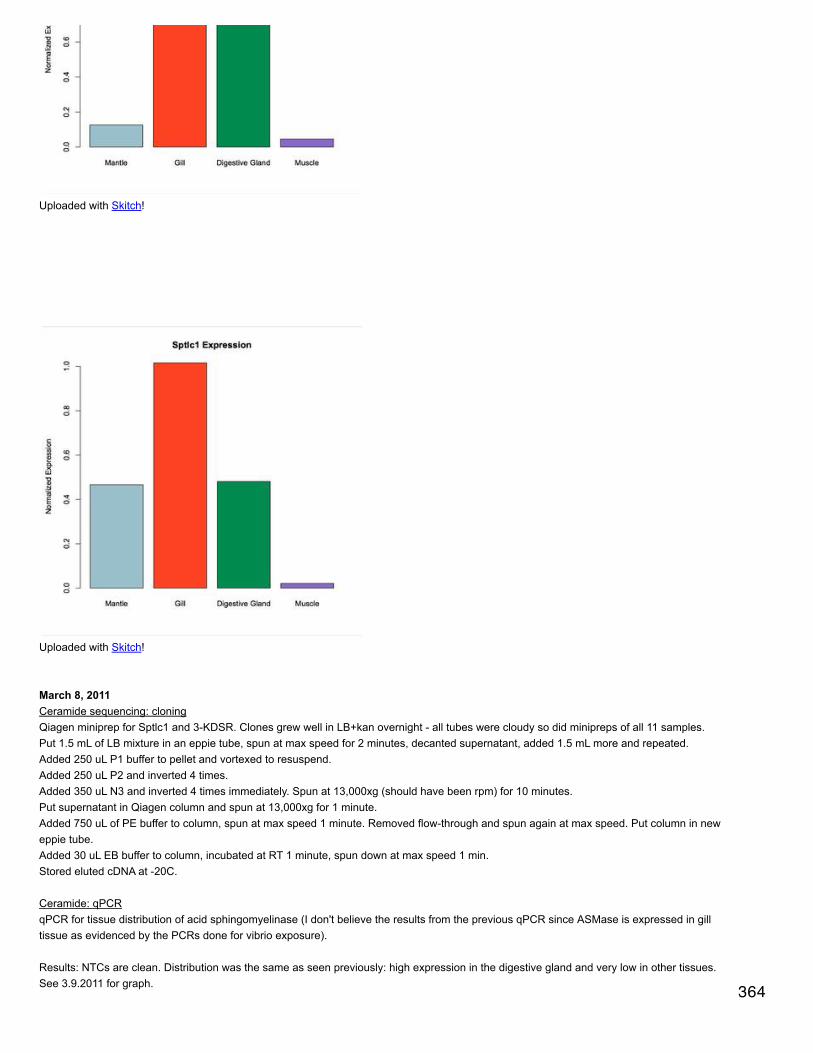
Uploaded with Skitch!
Uploaded with Skitch!
March 8, 2011Ceramide sequencing: cloningQiagen miniprep for Sptlc1 and 3-KDSR. Clones grew well in LB+kan overnight - all tubes were cloudy so did minipreps of all 11 samples.Put 1.5 mL of LB mixture in an eppie tube, spun at max speed for 2 minutes, decanted supernatant, added 1.5 mL more and repeated.Added 250 uL P1 buffer to pellet and vortexed to resuspend.Added 250 uL P2 and inverted 4 times.Added 350 uL N3 and inverted 4 times immediately. Spun at 13,000xg (should have been rpm) for 10 minutes.Put supernatant in Qiagen column and spun at 13,000xg for 1 minute.Added 750 uL of PE buffer to column, spun at max speed 1 minute. Removed flow-through and spun again at max speed. Put column in neweppie tube.Added 30 uL EB buffer to column, incubated at RT 1 minute, spun down at max speed 1 min.Stored eluted cDNA at -20C.
Ceramide: qPCRqPCR for tissue distribution of acid sphingomyelinase (I don't believe the results from the previous qPCR since ASMase is expressed in gilltissue as evidenced by the PCRs done for vibrio exposure).
Results: NTCs are clean. Distribution was the same as seen previously: high expression in the digestive gland and very low in other tissues.See 3.9.2011 for graph. 364
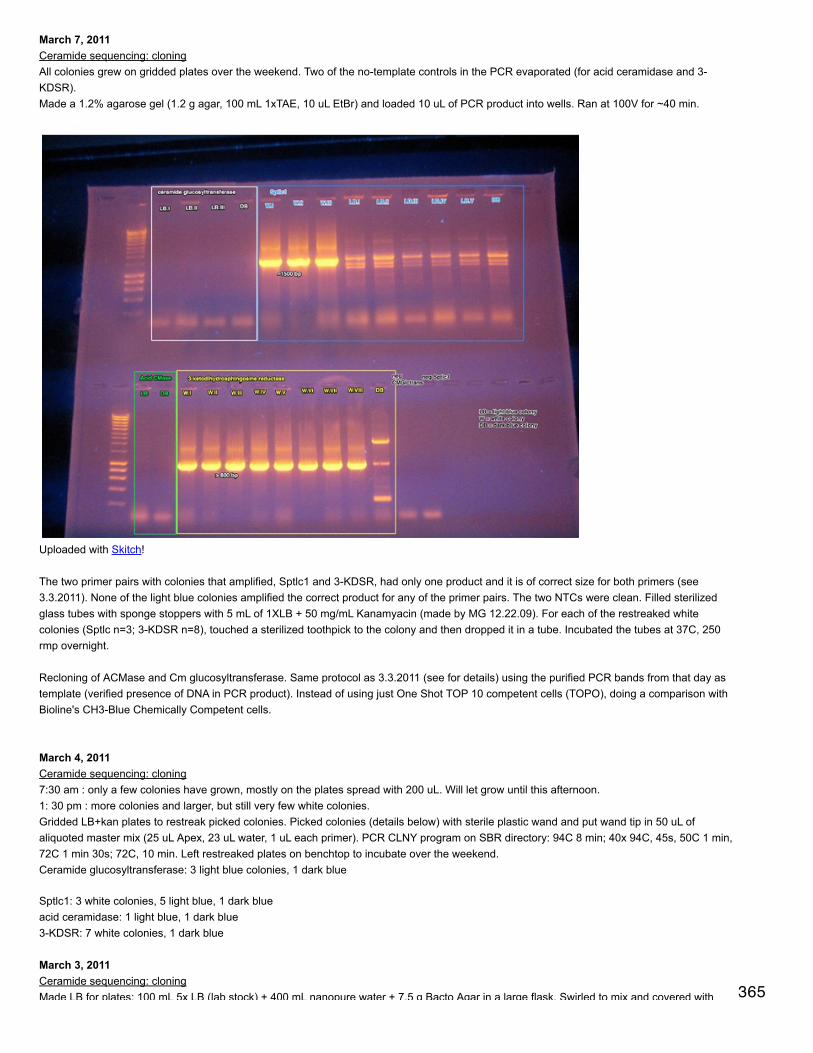
March 7, 2011Ceramide sequencing: cloningAll colonies grew on gridded plates over the weekend. Two of the no-template controls in the PCR evaporated (for acid ceramidase and 3-KDSR). Made a 1.2% agarose gel (1.2 g agar, 100 mL 1xTAE, 10 uL EtBr) and loaded 10 uL of PCR product into wells. Ran at 100V for ~40 min.
Uploaded with Skitch!
The two primer pairs with colonies that amplified, Sptlc1 and 3-KDSR, had only one product and it is of correct size for both primers (see3.3.2011). None of the light blue colonies amplified the correct product for any of the primer pairs. The two NTCs were clean. Filled sterilizedglass tubes with sponge stoppers with 5 mL of 1XLB + 50 mg/mL Kanamyacin (made by MG 12.22.09). For each of the restreaked whitecolonies (Sptlc n=3; 3-KDSR n=8), touched a sterilized toothpick to the colony and then dropped it in a tube. Incubated the tubes at 37C, 250rmp overnight.
Recloning of ACMase and Cm glucosyltransferase. Same protocol as 3.3.2011 (see for details) using the purified PCR bands from that day astemplate (verified presence of DNA in PCR product). Instead of using just One Shot TOP 10 competent cells (TOPO), doing a comparison withBioline's CH3-Blue Chemically Competent cells.
March 4, 2011Ceramide sequencing: cloning7:30 am : only a few colonies have grown, mostly on the plates spread with 200 uL. Will let grow until this afternoon.1: 30 pm : more colonies and larger, but still very few white colonies. Gridded LB+kan plates to restreak picked colonies. Picked colonies (details below) with sterile plastic wand and put wand tip in 50 uL ofaliquoted master mix (25 uL Apex, 23 uL water, 1 uL each primer). PCR CLNY program on SBR directory: 94C 8 min; 40x 94C, 45s, 50C 1 min,72C 1 min 30s; 72C, 10 min. Left restreaked plates on benchtop to incubate over the weekend.Ceramide glucosyltransferase: 3 light blue colonies, 1 dark blue
Sptlc1: 3 white colonies, 5 light blue, 1 dark blueacid ceramidase: 1 light blue, 1 dark blue3-KDSR: 7 white colonies, 1 dark blue
March 3, 2011Ceramide sequencing: cloningMade LB for plates: 100 mL 5x LB (lab stock) + 400 mL nanopure water + 7.5 g Bacto Agar in a large flask. Swirled to mix and covered with 365
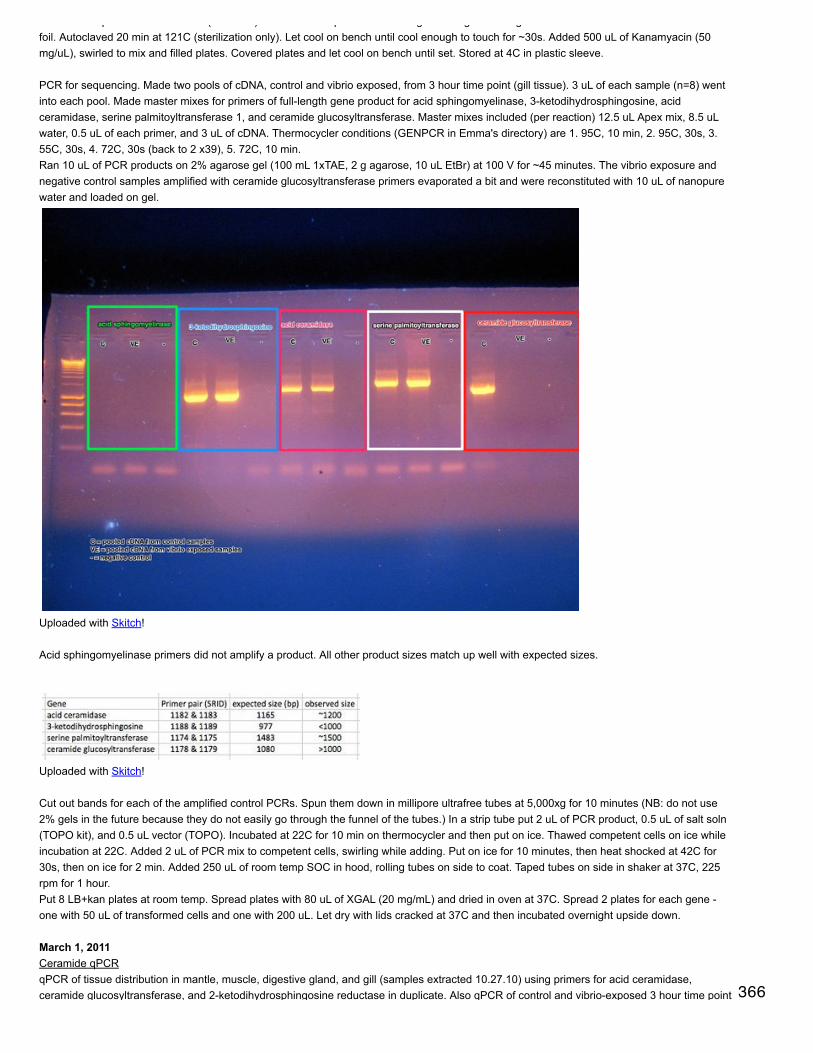
Made LB for plates: 100 mL 5x LB (lab stock) + 400 mL nanopure water + 7.5 g Bacto Agar in a large flask. Swirled to mix and covered withfoil. Autoclaved 20 min at 121C (sterilization only). Let cool on bench until cool enough to touch for ~30s. Added 500 uL of Kanamyacin (50mg/uL), swirled to mix and filled plates. Covered plates and let cool on bench until set. Stored at 4C in plastic sleeve.
PCR for sequencing. Made two pools of cDNA, control and vibrio exposed, from 3 hour time point (gill tissue). 3 uL of each sample (n=8) wentinto each pool. Made master mixes for primers of full-length gene product for acid sphingomyelinase, 3-ketodihydrosphingosine, acidceramidase, serine palmitoyltransferase 1, and ceramide glucosyltransferase. Master mixes included (per reaction) 12.5 uL Apex mix, 8.5 uLwater, 0.5 uL of each primer, and 3 uL of cDNA. Thermocycler conditions (GENPCR in Emma's directory) are 1. 95C, 10 min, 2. 95C, 30s, 3.55C, 30s, 4. 72C, 30s (back to 2 x39), 5. 72C, 10 min.Ran 10 uL of PCR products on 2% agarose gel (100 mL 1xTAE, 2 g agarose, 10 uL EtBr) at 100 V for ~45 minutes. The vibrio exposure andnegative control samples amplified with ceramide glucosyltransferase primers evaporated a bit and were reconstituted with 10 uL of nanopurewater and loaded on gel.
Uploaded with Skitch!
Acid sphingomyelinase primers did not amplify a product. All other product sizes match up well with expected sizes.
Uploaded with Skitch!
Cut out bands for each of the amplified control PCRs. Spun them down in millipore ultrafree tubes at 5,000xg for 10 minutes (NB: do not use2% gels in the future because they do not easily go through the funnel of the tubes.) In a strip tube put 2 uL of PCR product, 0.5 uL of salt soln(TOPO kit), and 0.5 uL vector (TOPO). Incubated at 22C for 10 min on thermocycler and then put on ice. Thawed competent cells on ice whileincubation at 22C. Added 2 uL of PCR mix to competent cells, swirling while adding. Put on ice for 10 minutes, then heat shocked at 42C for30s, then on ice for 2 min. Added 250 uL of room temp SOC in hood, rolling tubes on side to coat. Taped tubes on side in shaker at 37C, 225rpm for 1 hour.Put 8 LB+kan plates at room temp. Spread plates with 80 uL of XGAL (20 mg/mL) and dried in oven at 37C. Spread 2 plates for each gene -one with 50 uL of transformed cells and one with 200 uL. Let dry with lids cracked at 37C and then incubated overnight upside down.
March 1, 2011Ceramide qPCRqPCR of tissue distribution in mantle, muscle, digestive gland, and gill (samples extracted 10.27.10) using primers for acid ceramidase,ceramide glucosyltransferase, and 2-ketodihydrosphingosine reductase in duplicate. Also qPCR of control and vibrio-exposed 3 hour time point 366
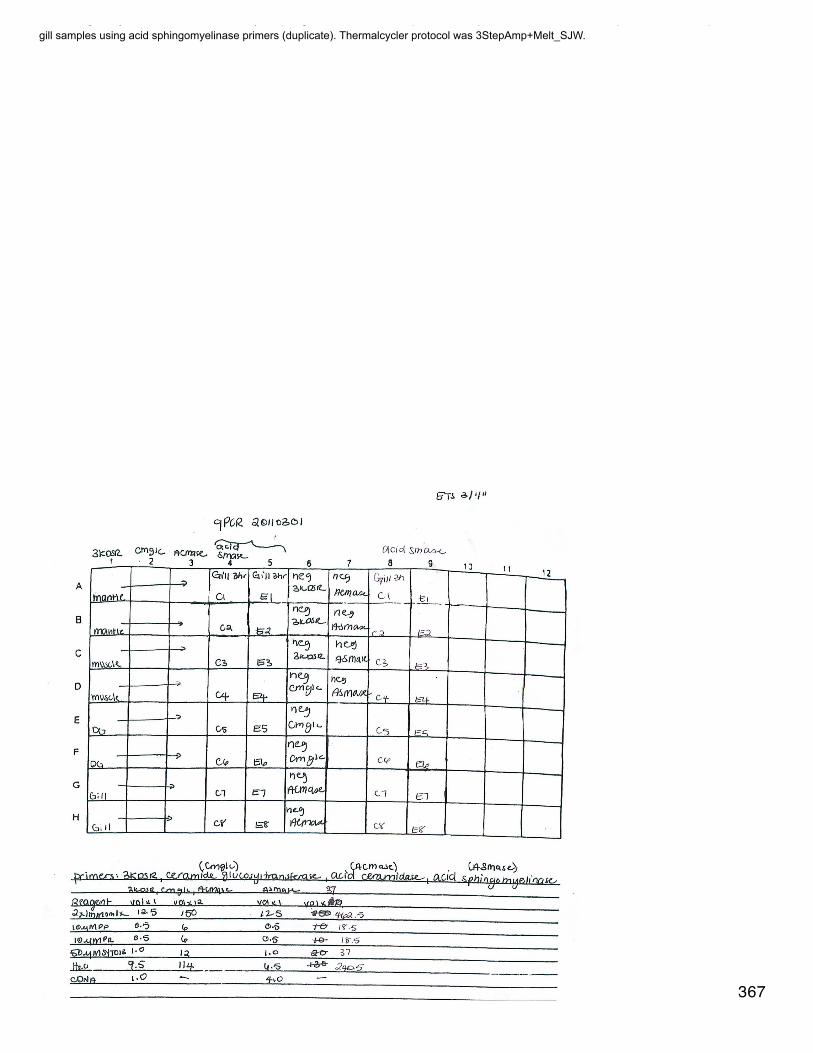
ceramide glucosyltransferase, and 2-ketodihydrosphingosine reductase in duplicate. Also qPCR of control and vibrio-exposed 3 hour time pointgill samples using acid sphingomyelinase primers (duplicate). Thermalcycler protocol was 3StepAmp+Melt_SJW.
367
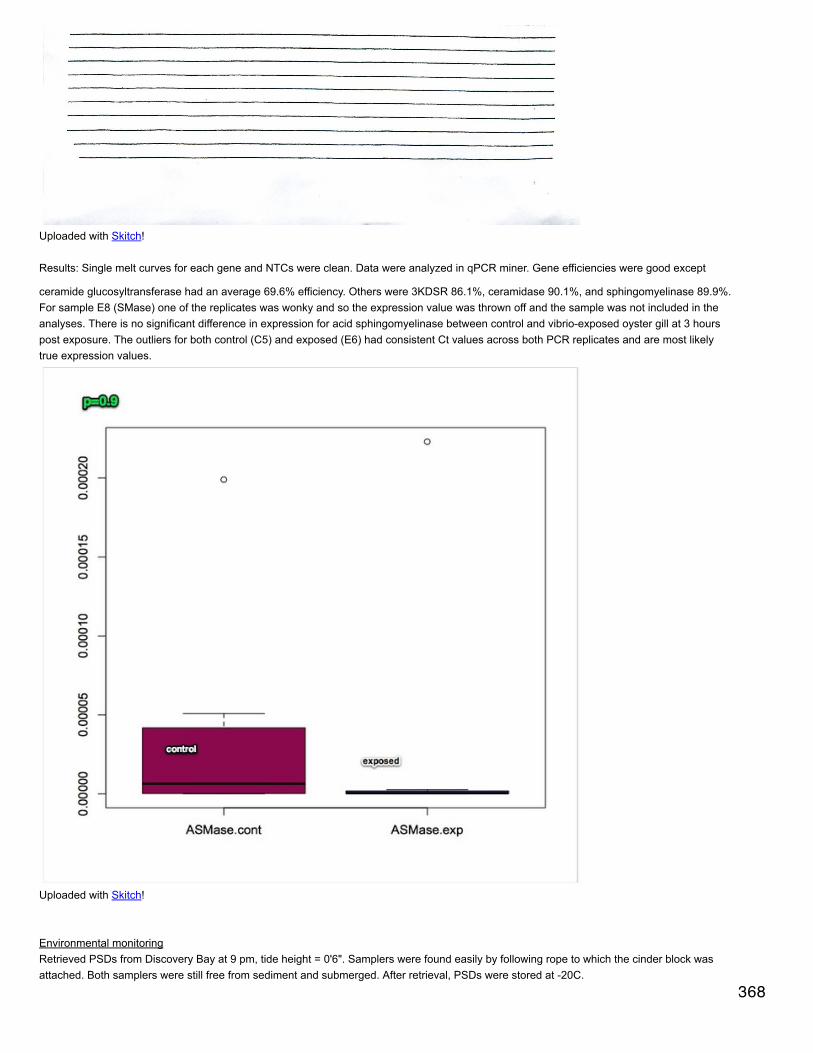
Uploaded with Skitch!
Results: Single melt curves for each gene and NTCs were clean. Data were analyzed in qPCR miner. Gene efficiencies were good except
ceramide glucosyltransferase had an average 69.6% efficiency. Others were 3KDSR 86.1%, ceramidase 90.1%, and sphingomyelinase 89.9%.For sample E8 (SMase) one of the replicates was wonky and so the expression value was thrown off and the sample was not included in theanalyses. There is no significant difference in expression for acid sphingomyelinase between control and vibrio-exposed oyster gill at 3 hourspost exposure. The outliers for both control (C5) and exposed (E6) had consistent Ct values across both PCR replicates and are most likelytrue expression values.
Uploaded with Skitch!
Environmental monitoringRetrieved PSDs from Discovery Bay at 9 pm, tide height = 0'6". Samplers were found easily by following rope to which the cinder block wasattached. Both samplers were still free from sediment and submerged. After retrieval, PSDs were stored at -20C.
368
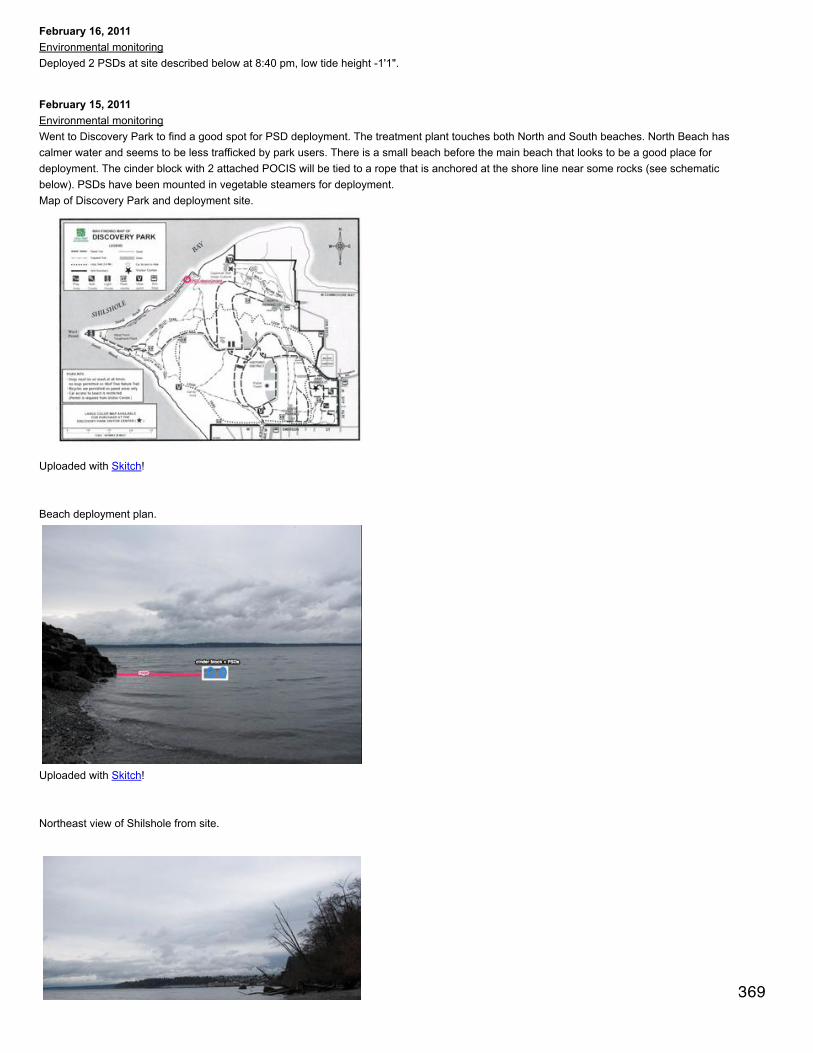
February 16, 2011Environmental monitoringDeployed 2 PSDs at site described below at 8:40 pm, low tide height -1'1".
February 15, 2011Environmental monitoringWent to Discovery Park to find a good spot for PSD deployment. The treatment plant touches both North and South beaches. North Beach hascalmer water and seems to be less trafficked by park users. There is a small beach before the main beach that looks to be a good place fordeployment. The cinder block with 2 attached POCIS will be tied to a rope that is anchored at the shore line near some rocks (see schematicbelow). PSDs have been mounted in vegetable steamers for deployment.Map of Discovery Park and deployment site.
Uploaded with Skitch!
Beach deployment plan.
Uploaded with Skitch!
Northeast view of Shilshole from site.
369
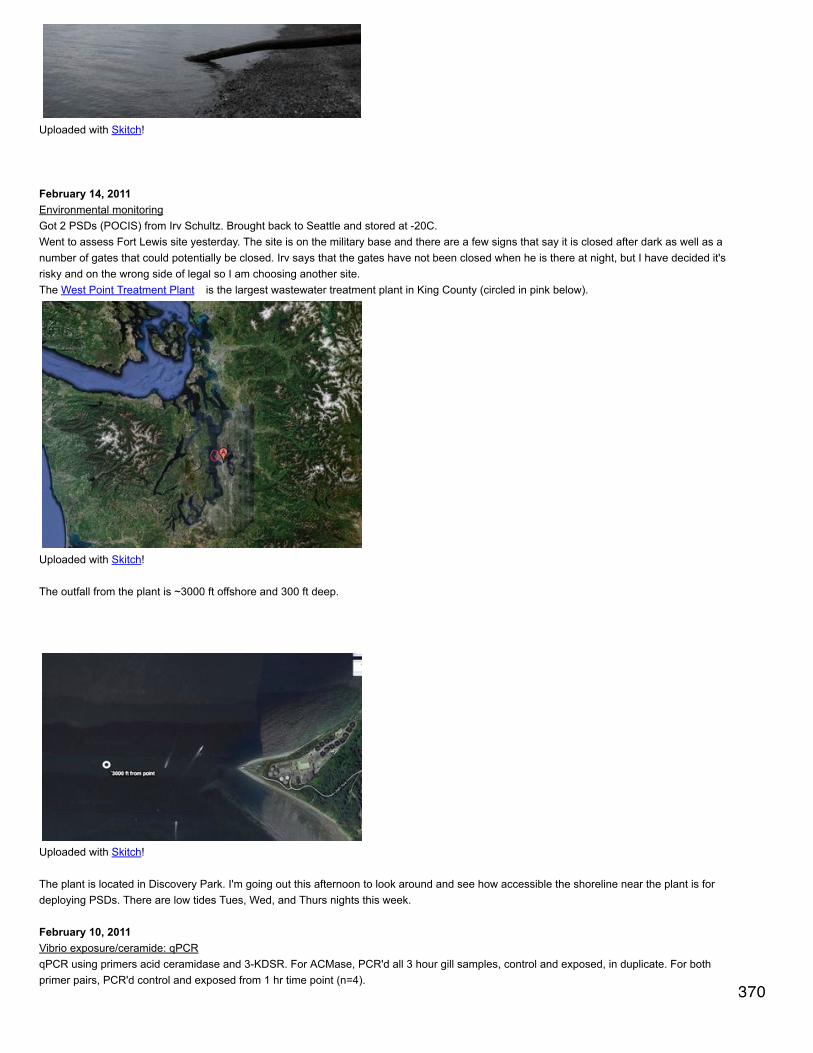
Uploaded with Skitch!
February 14, 2011Environmental monitoringGot 2 PSDs (POCIS) from Irv Schultz. Brought back to Seattle and stored at -20C.Went to assess Fort Lewis site yesterday. The site is on the military base and there are a few signs that say it is closed after dark as well as anumber of gates that could potentially be closed. Irv says that the gates have not been closed when he is there at night, but I have decided it'srisky and on the wrong side of legal so I am choosing another site.The West Point Treatment Plant is the largest wastewater treatment plant in King County (circled in pink below).
Uploaded with Skitch!
The outfall from the plant is ~3000 ft offshore and 300 ft deep.
Uploaded with Skitch!
The plant is located in Discovery Park. I'm going out this afternoon to look around and see how accessible the shoreline near the plant is fordeploying PSDs. There are low tides Tues, Wed, and Thurs nights this week.
February 10, 2011Vibrio exposure/ceramide: qPCRqPCR using primers acid ceramidase and 3-KDSR. For ACMase, PCR'd all 3 hour gill samples, control and exposed, in duplicate. For bothprimer pairs, PCR'd control and exposed from 1 hr time point (n=4).
370
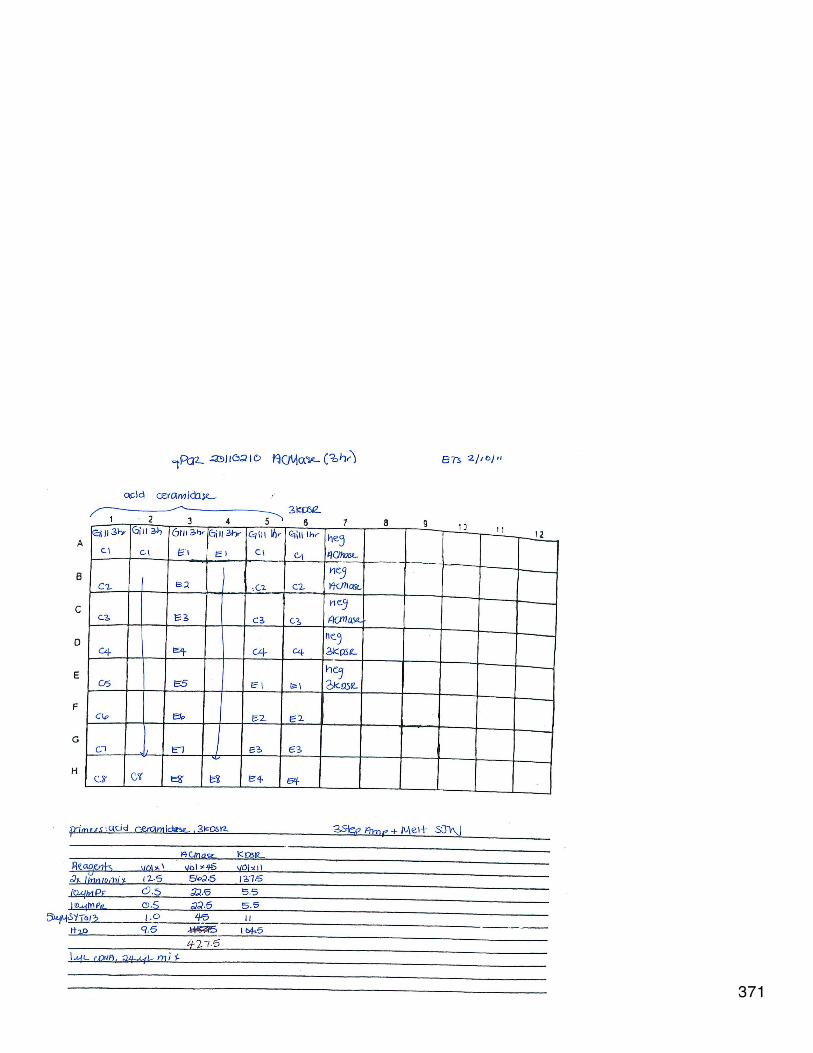

Uploaded with Skitch!
Results:Acid ceramidase, all samples - significantly different expression between control and exposed (p=0.045)
Uploaded with Skitch!
Acid ceramidase and 3-ketodihydrosphingosine reductase, 1 hour timepoint n=4 for exposed and control - no significant differences inexpression at this time point.
372

Uploaded with Skitch!
February 8, 2011Vibrio exposure/ceramide: qPCRqPCR using new primers, 3-ketodihydrosphingosine reductase, ceramide glucosyltransferase, and acid ceramidase on gill tissues from vibrioexposed and control oysters (n=4 for each treatment with each primer pair). 1 uL of cDNA and 24 uL of master mix were used for eachreaction.
373

Uploaded with Skitch!
Results: All primers amplified product and had one melt curve. All NTCs were clean. A number of the samples for ceramide glucosyltransferasecame up very late and as a result 1 control and 2 exposed were set to 0 expression level for the analysis. The other Cts were >42 and may notbe trustworthy, although they were analyzed in Miner. If these primers are to be continued they need to be optimized. None of the differences between treatments were significant (n=4 for control and vibrio exposed) although there is a trend for upregulation ofthese genes in vibrio exposure, except for ceramide glucosyltransferase.
374
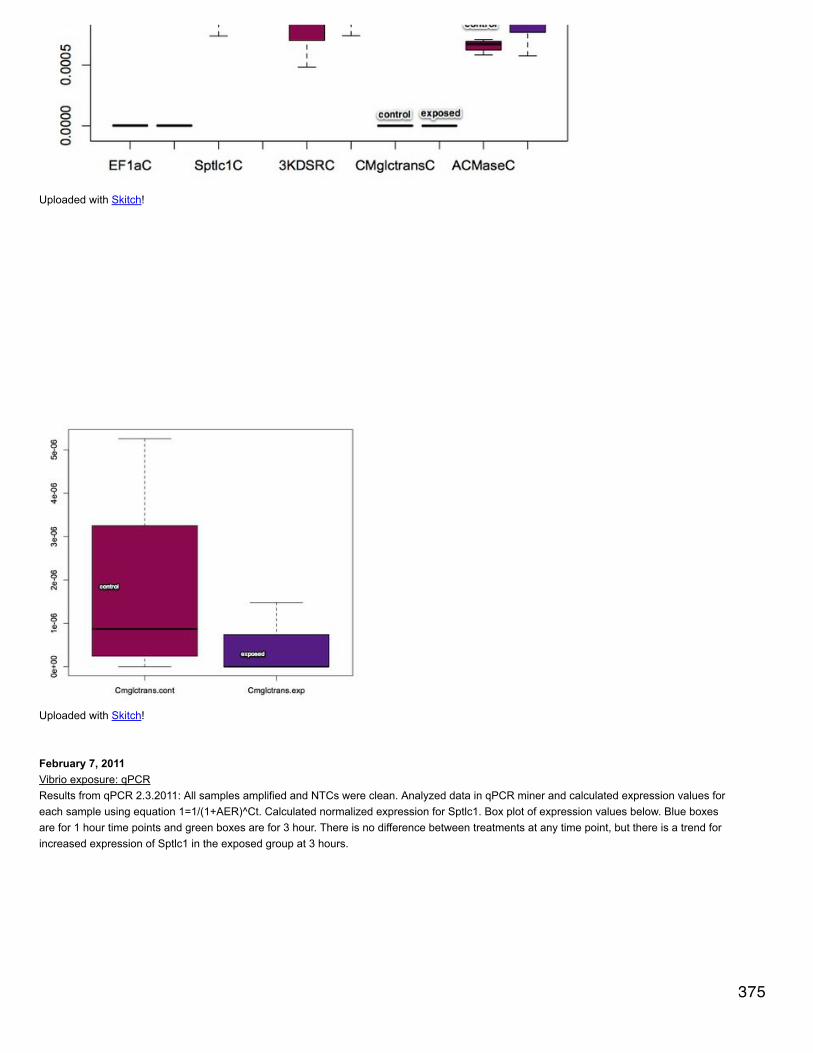
Uploaded with Skitch!
Uploaded with Skitch!
February 7, 2011Vibrio exposure: qPCRResults from qPCR 2.3.2011: All samples amplified and NTCs were clean. Analyzed data in qPCR miner and calculated expression values foreach sample using equation 1=1/(1+AER)^Ct. Calculated normalized expression for Sptlc1. Box plot of expression values below. Blue boxesare for 1 hour time points and green boxes are for 3 hour. There is no difference between treatments at any time point, but there is a trend forincreased expression of Sptlc1 in the exposed group at 3 hours.
375
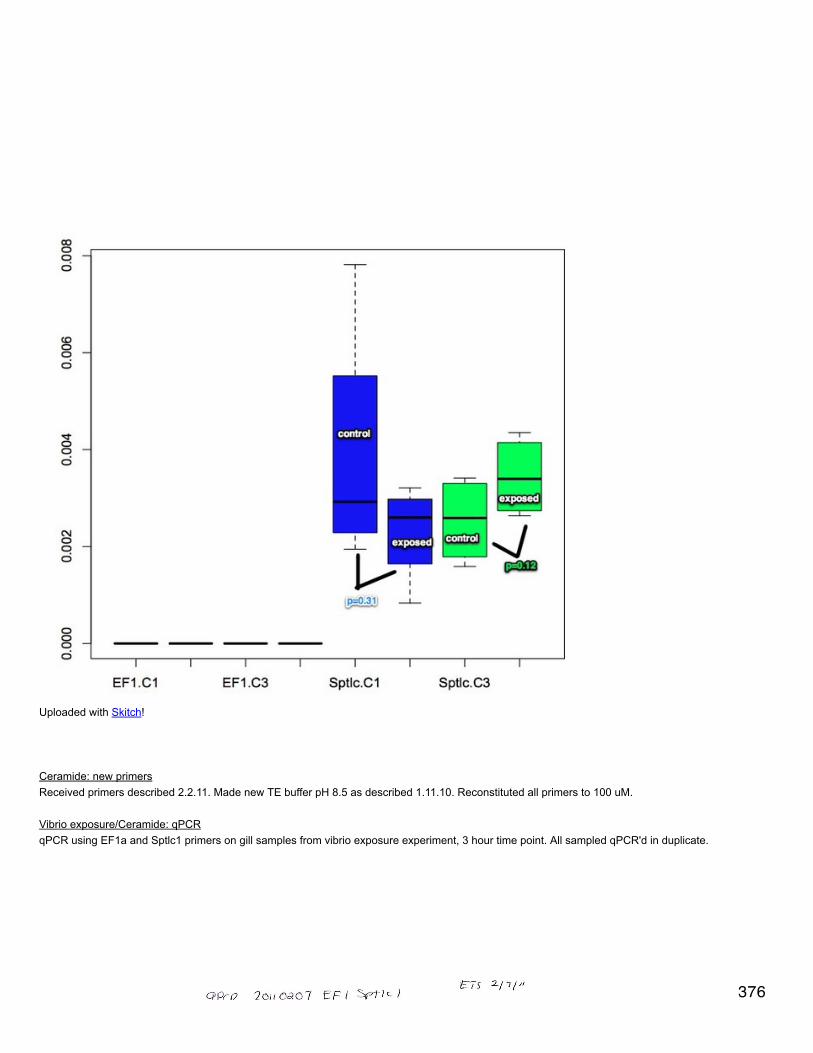
Uploaded with Skitch!
Ceramide: new primersReceived primers described 2.2.11. Made new TE buffer pH 8.5 as described 1.11.10. Reconstituted all primers to 100 uM.
Vibrio exposure/Ceramide: qPCRqPCR using EF1a and Sptlc1 primers on gill samples from vibrio exposure experiment, 3 hour time point. All sampled qPCR'd in duplicate.
376

Uploaded with Skitch!
Results: calculated expression values as described above. Normalized expression of Sptlc1 is barely insignificant for increased expression in
vibrio exposed versus control.
377

Uploaded with Skitch!
February 3, 2011Vibrio exposure: qPCRDiluted all cDNA 4x (72 uL water + 24 uL cDNA). Using EF1a (SR ID 309) and Sptlc1 primers for samples C1-4 1 hour, E1-4 1 hour, C1-4 3hours, and E1-4 3 hours.
378

Uploaded with Skitch!
February 2, 2011
Vibrio exposure: reverse transcriptionqPCR from 1.31.2011 showed possible (although very little) gDNA contamination in samples: Gill C2 1 hour, gill E2 1h, gill E2 3h, muscle C2,mantle C1.Reverse transcribed all gill samples, control and exposed, from 1 and 3 hr time points (n=32). To 14 uL of DNased RNA (~1 ug) added 0.5 uLoligo dT primers and 3.75 uL of water. Incubated at 70C for 5 minutes. Put rxn on ice for a few minutes then added to each well: 5 uL MMLV RTbuffer, 1.25 uL dNTPs, 0.5 uL MMLV reverse transcriptase. Incubated at 42C for 1 hour, heat deactivation 95C for 3 minutes. Stored cDNA inEmma's cDNA Box III.
Vibrio exposure: qPCRMade pooled samples of control and exposed gill cDNA (across 1 and 3 hour time points, n=16 in each pool). 1 uL from each sample was putin each pool. qPCR was done using EF1 and Sptlc1 primers on the pooled cDNA at full concentration and diluted 2x, 4x, and 10x from controland exposed samples for each primer pair.
379

Uploaded with Skitch!
Results: All dilution factors amplified for both genes, although EF1a had much lower Ct than Sptlc1 (see table below). A 4x dilution will probablywork well for these samples and the genes we are testing. PCR miner successfully analyzed all the data.
380
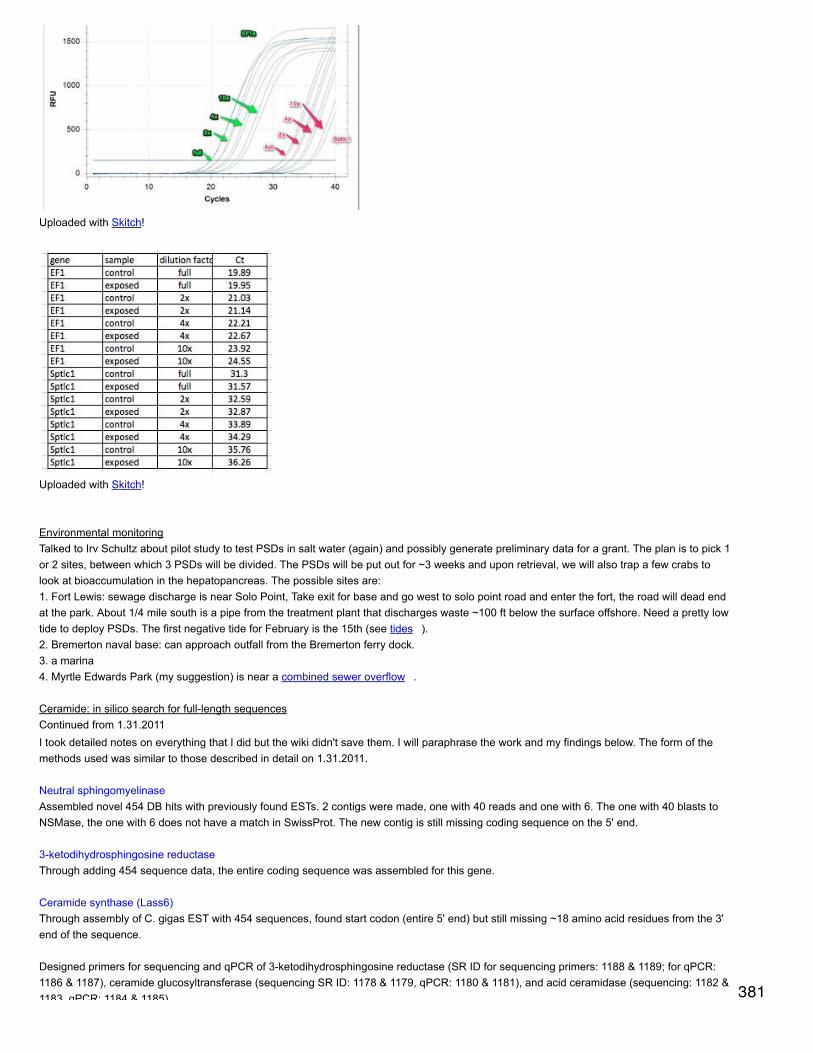
Uploaded with Skitch!
Uploaded with Skitch!
Environmental monitoringTalked to Irv Schultz about pilot study to test PSDs in salt water (again) and possibly generate preliminary data for a grant. The plan is to pick 1or 2 sites, between which 3 PSDs will be divided. The PSDs will be put out for ~3 weeks and upon retrieval, we will also trap a few crabs tolook at bioaccumulation in the hepatopancreas. The possible sites are:1. Fort Lewis: sewage discharge is near Solo Point, Take exit for base and go west to solo point road and enter the fort, the road will dead endat the park. About 1/4 mile south is a pipe from the treatment plant that discharges waste ~100 ft below the surface offshore. Need a pretty lowtide to deploy PSDs. The first negative tide for February is the 15th (see tides ).2. Bremerton naval base: can approach outfall from the Bremerton ferry dock.3. a marina4. Myrtle Edwards Park (my suggestion) is near a combined sewer overflow .
Ceramide: in silico search for full-length sequencesContinued from 1.31.2011I took detailed notes on everything that I did but the wiki didn't save them. I will paraphrase the work and my findings below. The form of themethods used was similar to those described in detail on 1.31.2011.
Neutral sphingomyelinaseAssembled novel 454 DB hits with previously found ESTs. 2 contigs were made, one with 40 reads and one with 6. The one with 40 blasts toNSMase, the one with 6 does not have a match in SwissProt. The new contig is still missing coding sequence on the 5' end.
3-ketodihydrosphingosine reductaseThrough adding 454 sequence data, the entire coding sequence was assembled for this gene.
Ceramide synthase (Lass6)Through assembly of C. gigas EST with 454 sequences, found start codon (entire 5' end) but still missing ~18 amino acid residues from the 3'end of the sequence.
Designed primers for sequencing and qPCR of 3-ketodihydrosphingosine reductase (SR ID for sequencing primers: 1188 & 1189; for qPCR:1186 & 1187), ceramide glucosyltransferase (sequencing SR ID: 1178 & 1179, qPCR: 1180 & 1181), and acid ceramidase (sequencing: 1182 &1183, qPCR: 1184 & 1185). 381

1183, qPCR: 1184 & 1185).
January 31, 2011Vibrio exposureqPCR with 18s primers of DNAsed RNA from SJW for adult C. gigas 1 and 3 hr post-vibrio exposure.
382

Uploaded with Skitch!
Ceramide: in silico search for full-length sequencesCeramide glucosyltransferaseCreated a custom database in geneious with the 6-day-old larval transcriptome data from 454 sequencing (now called "454 DB"). Didmegablast of longest EST from ceramide glucosyltransferase (the other ESTs lay within the long one). Got 6 454 ESTs that matched to original,assembled all and extracted consensus sequence. blastx of consensus EST against swissprot database Xenopus tropicalis ceramideglucosyltransferase (Q5BL38.1), e = 2e-53 and protein coding starts before bp 98 on C. gigas EST query. Through protein alignment, foundstart codon at bp 35 of contig, so translated from bp 35 to get final protein coding sequence for C. gigas. blastp returns top hit of ceramideglucosyltransferase (gene structure ).
Acid ceramidaseblasted (megablast) EST AM856720.1 against 454 DB and returned a lot of ESTs. The first 5 top returns did not add significantly to the originalESTs found 1.29.2011. Did megablast of contig of original 4 ESTs found on GenBank against 454 DB but the top 5 hits did not extend thesequence at all.blastx of original contig (contig 1597 in geneious) on NCBI. Top hit was rat acid ceramidase (Q6P7S1.1) and protein coding in the alignmentbegan at bp 69. Extending to start codon at bp 15 looks like it encompasses the entire protein sequence.
Neutral sphingomyelinase454DB megablast of HS230283.1 returned a lot of hits. Assembly with the top 5 extends the sequence a little in the 3' direction. Assembly withthe top 10 extends the original sequence in both directions. Extract the consensus and blastx - top hit is C. elegans neutral sphingomyelinase(O45870.2, e=5e-59) with protein coding in the alignment starting at bp 10. there is no start codon at or before 10 bp and alignment of theamino acid sequences shows that there may be ~80 aa residues (>200 bp) missing from the C. gigas sequence on the 5' end.Assembled all the megablast return (n=22 + original EST) and generated consensus sequence. Did megablast of consensus
January 29, 2011Ceramide: in silico search for full-length sequencesContinuation of work from 1/28/2011 to find available full-length cDNA for the constituents of the ceramide pathway.Ceramide glucosyltransferase/glucosylceramide synthase: makes glucosylceramide from ceramideHomologene number 37763. H. sapiens and C. elegans (cgt-1) align with 48% identity - pretty good.blastn of C. elegans mRNA (NM_074570.3) against C. gigas nucleotides and ESTs yielded no results.tblastn of C. elegans protein ( NP_506971.2) against C. gigas ESTs returned top hit HS163638.1 (mixed adult tissues). E value was 5e-50 andEST covers only part of protein sequence. Protein coding in alignment begins at bp 47 of C. gigas EST, so translated the sequence and didpblast. top hit is xenopus ceramide glucosyltransferase (Q5BL38.1), e=3e-58, with very good coverage.
383

Uploaded with Skitch!
blastn of C. gigas EST HS163638.1 against other C. gigas ESTs to see if mRNA can be extended at all. Returned 2 more ESTs - FP003616.1and FP009071.1. Neither EST adds any length to the original.
Ceramide kinase: makes ceramide 1-P from ceramideHomologene 11247Aligned protein sequences: C. elegans shows poor identity (27%) with H. sapiens; D. melanogaster has better identity (32%) and D. rerio andH. sapiens share 46% identity. blastn of D. rerio mRNA (NM_001105586.1) against C. gigas nucleotides and ESTs yields no results.tblastn of D. rerio protein (NP_001099056.1) against C. gigas ESTs brings back HS203383.1 (e=4e-15) but coverage is poor. tblastn with D.melanogaster protein sequence similarly returns FQ661838.1 (e=3e-24), but coverage is poor. These 2 ESTs do not form a contig.
Glucosylceramidase(/cerebrosidase?)homologene 10859Alignment of C. elegans and H. sapiens proteins shows ~37% identity between the two. D. melanogaster and H. sapiens share 43% identity.blastn of D. melanogaster mRNA (NM_176041.1) against C. gigas nucleotide and ESTs returns no results.tblastn of D. melanogaster protein (NP_788055.2) against C. gigas ESTs returns CU996255.1, but it only covers the last 200 bp of the proteinsequence (e=7e-69). not going to pursue this one further
Acid ceramidase: makes ceramide from sphingosinehomologene 10504H. sapiens and C. elegans protein sequences share 38% identity. H. sapiens and D. rerio share 59%.blastn of C. elegans mRNA (NM_060772.7) against C. gigas nucleotide and ESTs returns no results.
tblastn of C. elegans protein (NP_493173.1) against C. gigas ESTs returns top hit AM854720.1 (e=2e-72) with excellent coverage of theprotein sequence.
384
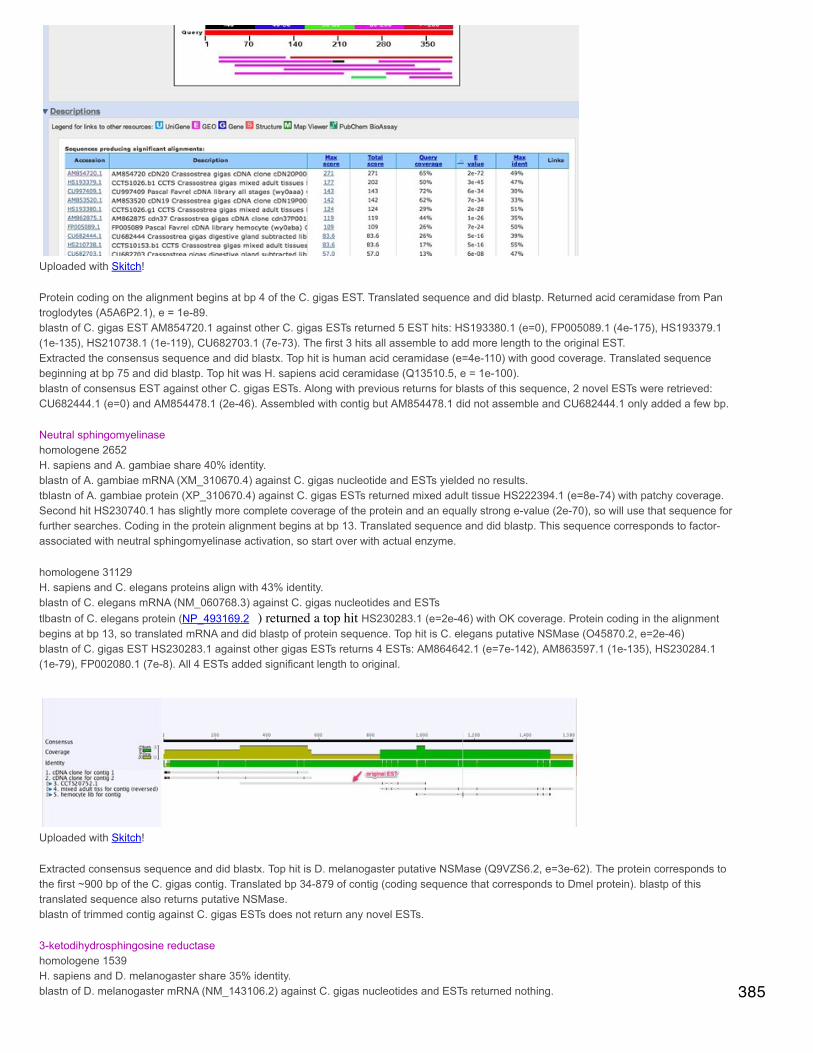
Uploaded with Skitch!
Protein coding on the alignment begins at bp 4 of the C. gigas EST. Translated sequence and did blastp. Returned acid ceramidase from Pantroglodytes (A5A6P2.1), e = 1e-89.blastn of C. gigas EST AM854720.1 against other C. gigas ESTs returned 5 EST hits: HS193380.1 (e=0), FP005089.1 (4e-175), HS193379.1(1e-135), HS210738.1 (1e-119), CU682703.1 (7e-73). The first 3 hits all assemble to add more length to the original EST. Extracted the consensus sequence and did blastx. Top hit is human acid ceramidase (e=4e-110) with good coverage. Translated sequencebeginning at bp 75 and did blastp. Top hit was H. sapiens acid ceramidase (Q13510.5, e = 1e-100).blastn of consensus EST against other C. gigas ESTs. Along with previous returns for blasts of this sequence, 2 novel ESTs were retrieved:CU682444.1 (e=0) and AM854478.1 (2e-46). Assembled with contig but AM854478.1 did not assemble and CU682444.1 only added a few bp.
Neutral sphingomyelinasehomologene 2652H. sapiens and A. gambiae share 40% identity.blastn of A. gambiae mRNA (XM_310670.4) against C. gigas nucleotide and ESTs yielded no results.tblastn of A. gambiae protein (XP_310670.4) against C. gigas ESTs returned mixed adult tissue HS222394.1 (e=8e-74) with patchy coverage.Second hit HS230740.1 has slightly more complete coverage of the protein and an equally strong e-value (2e-70), so will use that sequence forfurther searches. Coding in the protein alignment begins at bp 13. Translated sequence and did blastp. This sequence corresponds to factor-associated with neutral sphingomyelinase activation, so start over with actual enzyme.
homologene 31129H. sapiens and C. elegans proteins align with 43% identity.blastn of C. elegans mRNA (NM_060768.3) against C. gigas nucleotides and ESTstlbastn of C. elegans protein (NP_493169.2 ) returned a top hit HS230283.1 (e=2e-46) with OK coverage. Protein coding in the alignmentbegins at bp 13, so translated mRNA and did blastp of protein sequence. Top hit is C. elegans putative NSMase (O45870.2, e=2e-46)blastn of C. gigas EST HS230283.1 against other gigas ESTs returns 4 ESTs: AM864642.1 (e=7e-142), AM863597.1 (1e-135), HS230284.1(1e-79), FP002080.1 (7e-8). All 4 ESTs added significant length to original.
Uploaded with Skitch!
Extracted consensus sequence and did blastx. Top hit is D. melanogaster putative NSMase (Q9VZS6.2, e=3e-62). The protein corresponds tothe first ~900 bp of the C. gigas contig. Translated bp 34-879 of contig (coding sequence that corresponds to Dmel protein). blastp of thistranslated sequence also returns putative NSMase.blastn of trimmed contig against C. gigas ESTs does not return any novel ESTs.
3-ketodihydrosphingosine reductasehomologene 1539H. sapiens and D. melanogaster share 35% identity.blastn of D. melanogaster mRNA (NM_143106.2) against C. gigas nucleotides and ESTs returned nothing. 385
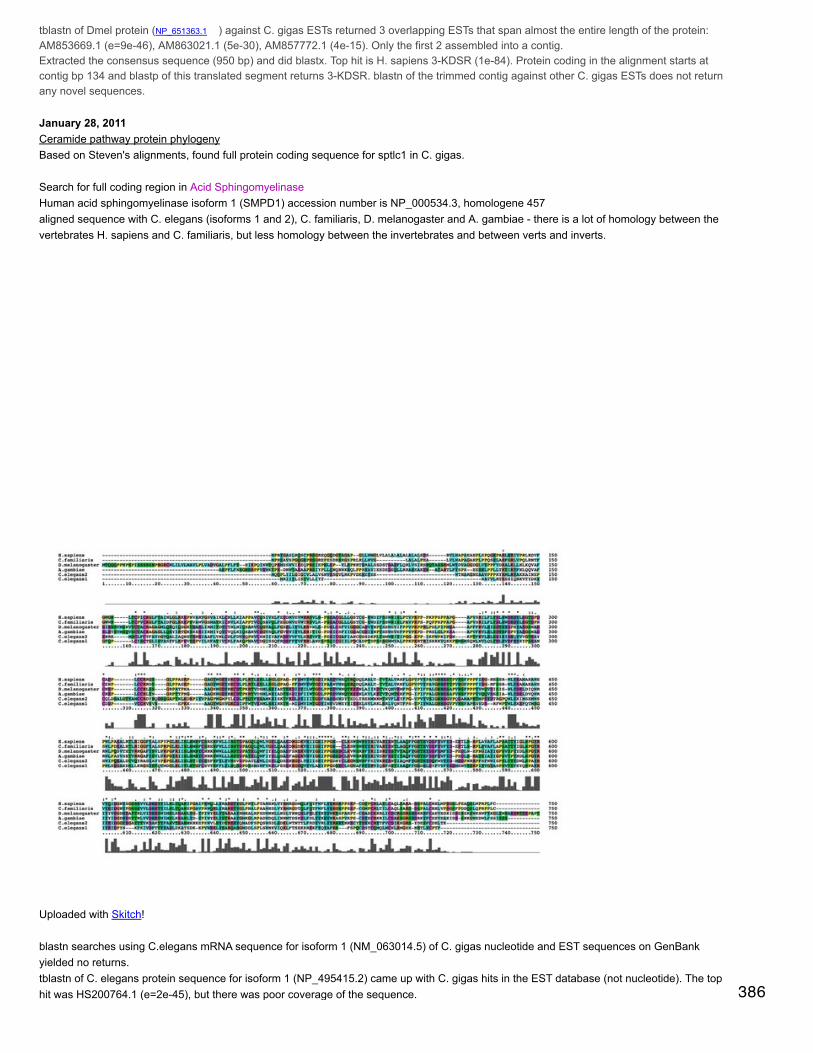
tblastn of Dmel protein (NP_651363.1 ) against C. gigas ESTs returned 3 overlapping ESTs that span almost the entire length of the protein:AM853669.1 (e=9e-46), AM863021.1 (5e-30), AM857772.1 (4e-15). Only the first 2 assembled into a contig.Extracted the consensus sequence (950 bp) and did blastx. Top hit is H. sapiens 3-KDSR (1e-84). Protein coding in the alignment starts atcontig bp 134 and blastp of this translated segment returns 3-KDSR. blastn of the trimmed contig against other C. gigas ESTs does not returnany novel sequences.
January 28, 2011Ceramide pathway protein phylogenyBased on Steven's alignments, found full protein coding sequence for sptlc1 in C. gigas.
Search for full coding region in Acid SphingomyelinaseHuman acid sphingomyelinase isoform 1 (SMPD1) accession number is NP_000534.3, homologene 457aligned sequence with C. elegans (isoforms 1 and 2), C. familiaris, D. melanogaster and A. gambiae - there is a lot of homology between thevertebrates H. sapiens and C. familiaris, but less homology between the invertebrates and between verts and inverts.
Uploaded with Skitch!
blastn searches using C.elegans mRNA sequence for isoform 1 (NM_063014.5) of C. gigas nucleotide and EST sequences on GenBankyielded no returns.tblastn of C. elegans protein sequence for isoform 1 (NP_495415.2) came up with C. gigas hits in the EST database (not nucleotide). The tophit was HS200764.1 (e=2e-45), but there was poor coverage of the sequence. 386

hit was HS200764.1 (e=2e-45), but there was poor coverage of the sequence.
Uploaded with Skitch!
tblastx returned the same sequence as tblastn (e=9-50) but also with poor sequence coverage.tblastn using H. sapiens protein sequence of the C. gigas ESTs also returned HS200764.1 (e=9e-72) with slightly better coverage, but still notcomplete.
387
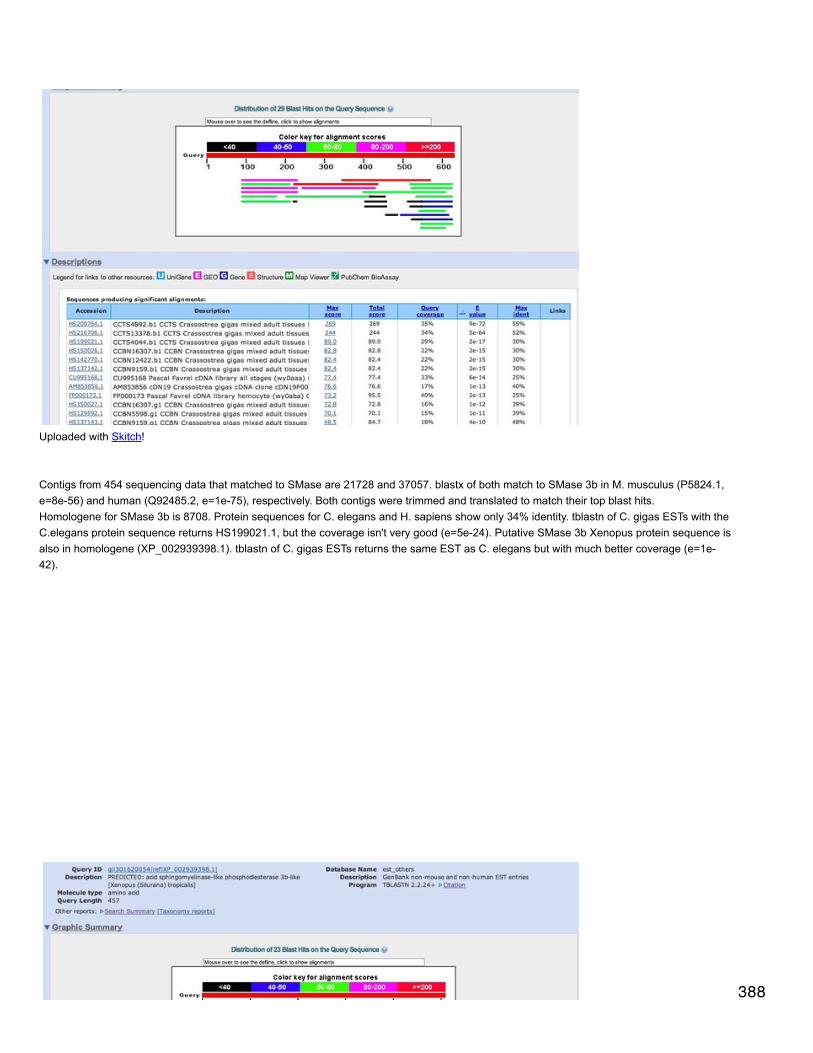
Uploaded with Skitch!
Contigs from 454 sequencing data that matched to SMase are 21728 and 37057. blastx of both match to SMase 3b in M. musculus (P5824.1,e=8e-56) and human (Q92485.2, e=1e-75), respectively. Both contigs were trimmed and translated to match their top blast hits.Homologene for SMase 3b is 8708. Protein sequences for C. elegans and H. sapiens show only 34% identity. tblastn of C. gigas ESTs with theC.elegans protein sequence returns HS199021.1, but the coverage isn't very good (e=5e-24). Putative SMase 3b Xenopus protein sequence isalso in homologene (XP_002939398.1). tblastn of C. gigas ESTs returns the same EST as C. elegans but with much better coverage (e=1e-42).
388

Uploaded with Skitch!
megablast of HS199021.1 returns no other C. gigas EST hits.
Find a better gene....Ceramide synthase 6 (Lass6) is highly conserved across taxa. Homologene #72228. H. sapiens and D. rerio sequences share 89% identity;Hsap, Drer and P. marinus (lamprey) share 65% homology. (P. marinus sequence is translated from an embryo EST starting at bp 6, accessionnumber EG337115.1). blastn of D. rerio mRNA (XM_688191.3) against C. gigas nucleotides and ESTs yields no results. tblastn of D. rerioprotein against C. gigas ESTs returns a number of hits, the top one being HS185280.1 (e=3e-55). According to the alignment, the codingregions overlap at C. gigas bp 58. pblast of this translated sequence returns as a top hit Lass6 (Q8C172.1, e=2e-65). blastn of the C.gigas ESTreturns 15 other C. gigas ESTs, but they all overlap completely and are of the same origin - mixed adult tissue libraries.
January 27, 2011Ceramide pathway protein phylogenytranslated sptlc1 sequence to a stop codon in Geneious. This ends up being the translation of the reverse compliment of bp 1036-1821. the toppblast hit is serine plamitoyltransferase (1e-84).
January 25, 2011Ceramide pathway protein phylogenyBoth the SMase and Sptlc1 protein sequences are missing some important amino acid residues that would be necessary for making acomplete comparison with homologous proteins. SR found 5 C. gigas SMase sequences that align with the original EST. I did the alignment inGeneious and did a tblastx of the consensus sequence. The 3rd hit was D. rerio acid SMase 3b-like (e=6e-75). The alignment of our C. gigassequence with the D. rerio started at bp 398, so I trimmed the consensus sequence and translated it in Geneious. I then did a pblast with theSwissProt db of this protein sequence, which returned protein information for acid SMase, the top hits being human, mouse, bovine, amoeba,and C. elegans acid SMase 3b-like. For information on protein structure see here . I redid the protein alignment in Clustal (with the same
protein sequences previously used) and remade a phylogenetic tree in Geneious.
A pblast of the translated protein of Sptlc1 described 1.19.2011 also returned protein information in NCBI, found here .
January 21, 2011Ceramide qPCR: SMaseqPCR of adult C.gigas tissues, vibrio exposed adult gill, and OA larvae.
389
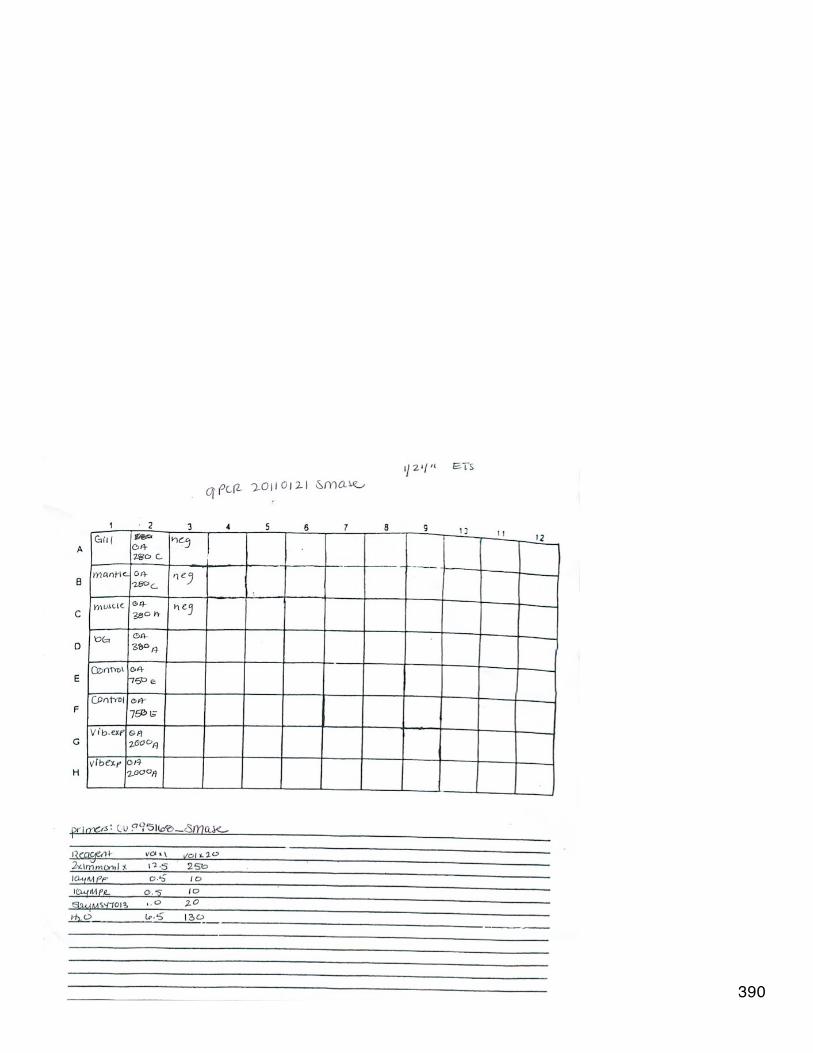

Uploaded with Skitch!
Results: All amplified well and NTCs were clean.
January 20, 2011Ceramide pathway protein phylogenyRedid Sptlc1 tree with mRNA sequence translated in Geneious (same method as for SMase). Used all same protein sequences as previouslydescribed.
Ceramide qPCR: SMaseReceived new SMase primers and reconstituted to 100 uM with TE buffer. qPCR using new SMase primers (CU995168_SMase) of adult C.gigas gill, mantle, muscle, and digestive gland.
391

Uploaded with Skitch!
Results: Amplified only in DG (amp plot beginning to come up very late for other tissues). No contamination in NTCs.
January 19, 2011Ceramide pathway protein phylogeny (Sptlc1 and acid sphingomyelinase)Sptlc1EST sequence used to design primers overlaps completely with 454 contig 4852, which blasts with high confidence (e-value<10^-30) to Sptlc1homologs. tlbastx of entire contig shows that the protein coding sequence begins ~bp 1000 (which still includes overlap with original Sptlc1EST), so trimmed contig and new contig is comprised of bp1000-1879. Did tblastx of trimmed contig. Top hit was with Sptlc1 of Pong abelii(orangutan). Took translated protein sequence from this alignment (i.e. the one used by blast) and used it in alignment (this ends up being thereverse compliment of bp 1045-1821 translated). Other sequences taken from blast results are human (BAF84235.1), mouse (BAE36210.1),frog (NP_001084963.1), zebrafish (P_001018307.1), sea urchin (XP_793539), drosophila (NP_725256.1), C. elegans (NP_001021979.1), seaanemone (XP_001628145.1), and hydra (XP_002161793.1). Sequences were all aligned in ClustalX and alignment was imported intoGeneious. Using the PhyML plug-in James-Taylor-Thornton model and 100 bootstraps, a maximum likelihood phylogenetic tree was made forthe sequences.
392

the sequences.
Uploaded with Skitch!
Spingomyelinase (SMase)C. gigas SMase EST (on which primers were designed) was blasted in tblastx. Protein alignments began at bp 218. The EST was translated inGeneious starting at bp 218 and this protein sequence was entered into protein blast to find homologs. Sequences taken from blast results foralignment are human (EAX07722.1), mouse (NP_598649.1), frog (XP_002939398.1), zebrafish (XP_692822.2), sea urchin (XP_786766.1),drosophila (XP_0013161994.2), C. elegans (NP_505620.3), and a hemichordate (XP_002737983.1). Sequences were aligned and tree wasmade as described for Sptlc1. (SMase2 is the C.gigas sequence)
393

Uploaded with Skitch!
January 12, 2011SMase primer designEST named "sphingomyelinase" in geneious BLASTs to other sphingomyelinases with e-values around e-40. C. gigas EST accession isCU995168. ORFs extend from ~25 to 743 bp on the reference and primers are designed to fall within thisrange (total sequence length is 780 bp). Forward sequence: TGGAGCATCGCTTACACAGC; Reverse sequence:ATCACACGGCATCACTTCGG. Product size is 159 bp starting at bp 467 and going to bp 625. See primer databasefor more details.
January 11, 2011qPCR to test SMase primersDid qPCR of 3 blank samples (water only) to find source of contamination seen in previous SMast NTCs on 12.10.2010. volumes of reagentsper reaction were: 12.5 uL 2xImmomix, 10.5 uL water, 0.5 uL of each primer, 1.0 uL 50 uM SYTO13. Used qPCR protocol3stepamp+melt_58annealing_ETS (45 cycles, 58C annealing).Results: blank samples showed some amplification, but much less than what was seen in NTCs previously.
Made new 10 uM stocks of SMase primers. qPCR comparing old and new 10 uM primer stocks of NTCs (x3), NTCs without primer (x4), andcDNA template (x2). Used qPCR protocol 3stepamp+melt_58annealing_ETS.
394

edit
Uploaded with Skitch!
Results: product amplification for old and new stock dilutions looked exactly like the NTCs with primers (NTCs without primers did not amplifyat all). It appears that the primers do not work well and are probably amplifying primer dimer more than anything else. Need to redesign
primers.
December 30, 2010
New notebook!
December 16, 2010CeramideWorked on analysis/manuscript/presentation.
Updated lab notebook with links to qPCR data.
Ceramide sequencesSuccessful sequences: Fas, Insulin receptor, Lass5, LeptinTrimmed sequences in Geneious to get rid of poor quality data. enter trimmed sequences into blastx, searching swissprot doing (1) a searchwith no a priori taxonomy and (2) a search qualifying crassostrea.
December 15, 2010Ceramide & vibrio exposure: qPCR resultsLink to resultsSignificant differences in expression between control and vibrio-exposed for both PE2 (p=0.00184) and Sptlc1 (p=0.009616).
Uploaded with Skitch!
395

Uploaded with Skitch!
Also significant differences in expression of Sptlc1 between adult C. gigas tissues: gill-dig.gland: p=0.0032muscle-dig.gland: p=0.0284mantle-gill: p=0.0061muscle-gill: p=0.00013muscle-mantle: p=0.007
396
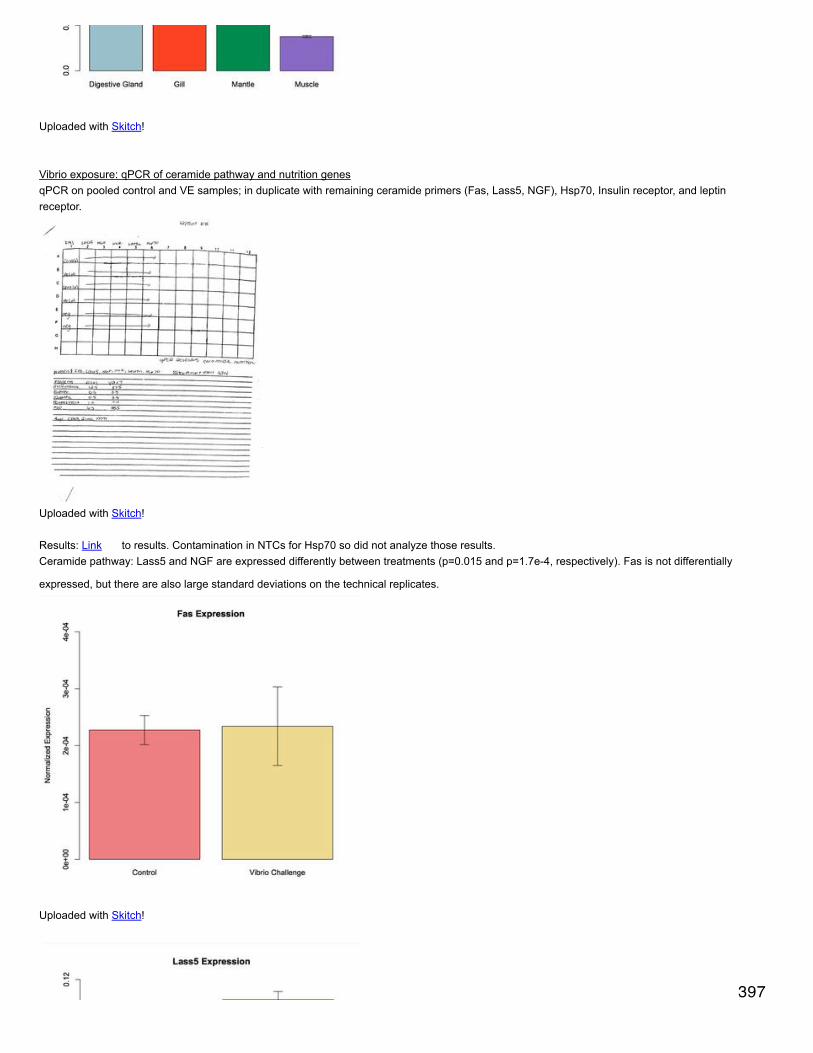
Uploaded with Skitch!
Vibrio exposure: qPCR of ceramide pathway and nutrition genesqPCR on pooled control and VE samples; in duplicate with remaining ceramide primers (Fas, Lass5, NGF), Hsp70, Insulin receptor, and leptinreceptor.
Uploaded with Skitch!
Results: Link to results. Contamination in NTCs for Hsp70 so did not analyze those results.Ceramide pathway: Lass5 and NGF are expressed differently between treatments (p=0.015 and p=1.7e-4, respectively). Fas is not differentially
expressed, but there are also large standard deviations on the technical replicates.
Uploaded with Skitch!
397

Uploaded with Skitch!
Uploaded with Skitch!
Nutrition: Both insulin and leptin receptors are expressed at higher levels in the vibrio-exposed oysters (p=0.04 and p=7.4e-4).
398

Uploaded with Skitch!
Uploaded with Skitch!
December 14, 2010Ceramide: qPCRTissue distribution of Sptlc1 (qPCR previously failed for this gene). Also for pooled control and vibrio exposed adult gill tissues (see below).
Vibrio exposure: qPCRPooled control (n=10) and vibrio exposed (n=10) samples reverse transcribed Dec 8, 2010 that had previously been PCR'd separately. 10 uL ofeach sample into each pool. qPCR done for EF1a, prostaglandin receptor (PE2), and Sptlc1.
Uploaded with Skitch!
December 13, 2010 399

December 13, 2010Ceramide: Follow-up to gene verification (see Dec 6, 2010)Gene: Lass5 (LAG1 homolog ceramide synthase)SR returned glucose-regulated protein (Q16956). Alignment with C. gigas sequence for Lass5 (sequence used for primer design) had a lot ofgaps - i.e. not a great alignment. Also a lot of gaps when aligned with original P. anubis sequence. Need to see what amplified product lookslike before deciding to keep or discard.
Gene: MHCSR returned myosin heavy chain...oops! wrong MHC? discard this one.
Gene: IL1BSR returned serine/threonin-protein phosphatase 2A (PP2A). Probably not IL1B, but is involved in apoptosis, so will keep for now.
Gene: Sptlc1verified as serine palmitoyltransferase 1. Enzyme that catalyzes one of the first steps in ceramide synthesis.
Gene: Sphingomyelinase (SMase)Verified as acid sphingomyelinase-like phosphodiesterase 3b.
Gene: nerve growth factor BSR returned cation transport regulator-like protein, or Chac1. Chac1 is a pro-apoptotic component of the unfolded protein response pathwayand may mediate some pro-apoptotic effects.
Gene: Fas death receptorSR returned TNF receptor superfamily, which plays similar role and is related to Fas receptors in ceramide-mediated apoptosis pathway.
December 10, 2010
NOAA OA: qPCRandVibrio exposure: qPCRqPCR of NOAA OA samples at Spltc1, Lass5, NGF, and Hsp70 (in duplicate). Sptlc1 for Vibrio exposure (duplicate). Used3StepAmp+Melt_SJW protocol.
400

Uploaded with Skitch!
NOAA OA: qPCR ResultsLink to resultsp-values are pairwise comparisons with 380 ppm treatment. ANOVA was non-significant.
Uploaded with Skitch!
Uploaded with Skitch!
401

Uploaded with Skitch!
Vibrio exposure: results
Uploaded with Skitch!
Notes for next time: If doing qPCR on samples of juveniles or adults that have RNA/cDNA for individuals, try to pool treatments and do qPCRon the pooled cDNA to decrease variability and pull out underlying trends/differences between treatments. Will also save reagents.
NOAA OA: qPCR (SMase)with optimized protocol: 45 cycles, 58C annealing T
402

Uploaded with Skitch!
Results (Link ): All samples amplified before cut-off of 45 cycles and had the same melt peak, but all NTCs had strong amplification of product
so results are not useful.
Ceramide: SequencingPrepared DNA and primer plates for sequencing on Monday. Melissa Baird is filling the rest of the plate and will bring it down to the sequencingcenter.
Uploaded with Skitch!
December 9, 2010NOAA OA: qPCRandVibrio exposure: qPCRAll 4 NOAA OA samples and n=5 controls and VE for vibrio (C1-5 and VE 1-5). Used EF1a and FAS; all in duplicate.
Uploaded with Skitch!
Results (Link ): All negatives were clean and samples amplified.NOAA OA larvae FAS expression by treatment. There is 0 expression at 2000 ppm. Differences in expression are not statistically significant in
an ANOVA comparing expression in treatment. 2 pairwise differences are significant: 380 vs. 2000 ppm (p=0.0113) and 750 vs 2000 ppm(p=0.00145).
403
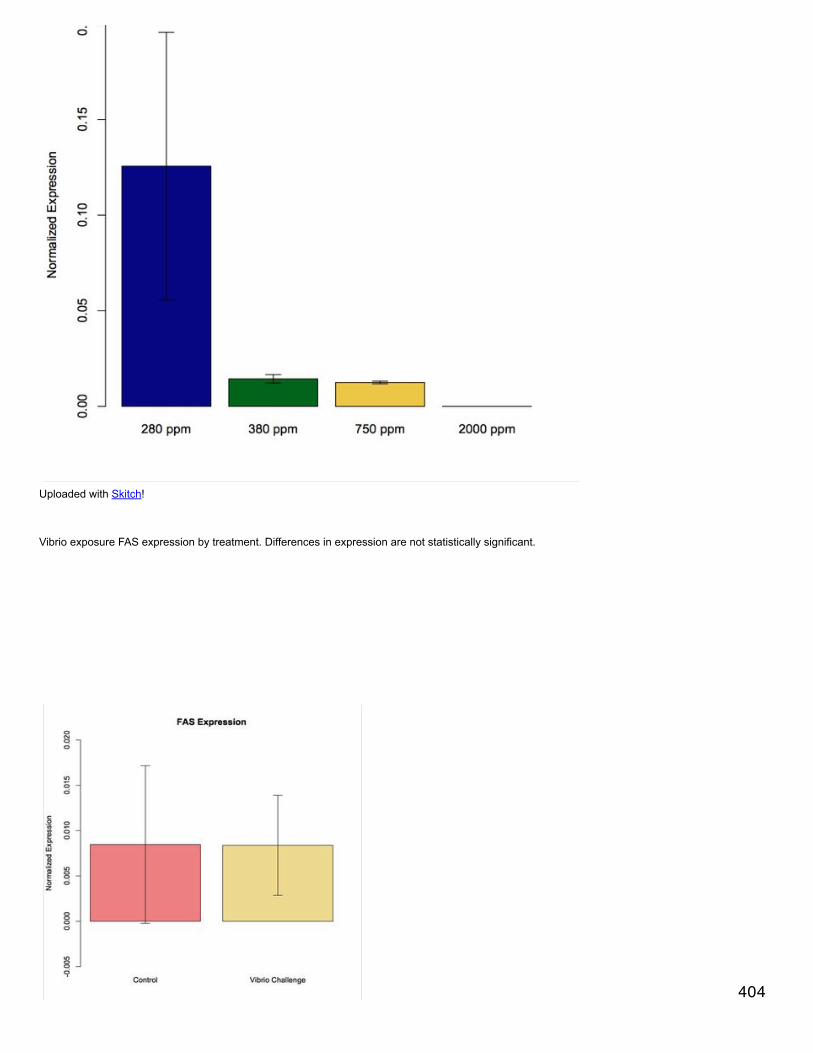
Uploaded with Skitch!
Vibrio exposure FAS expression by treatment. Differences in expression are not statistically significant.
404
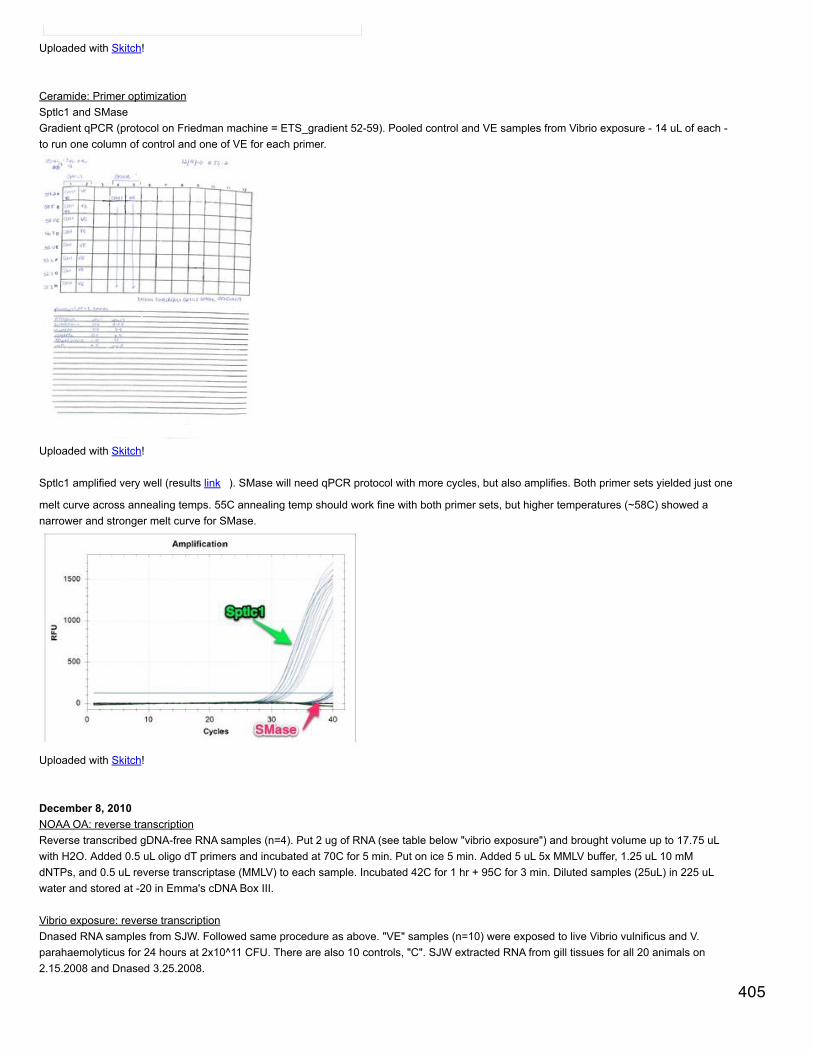
Uploaded with Skitch!
Ceramide: Primer optimizationSptlc1 and SMaseGradient qPCR (protocol on Friedman machine = ETS_gradient 52-59). Pooled control and VE samples from Vibrio exposure - 14 uL of each -to run one column of control and one of VE for each primer.
Uploaded with Skitch!
Sptlc1 amplified very well (results link ). SMase will need qPCR protocol with more cycles, but also amplifies. Both primer sets yielded just one
melt curve across annealing temps. 55C annealing temp should work fine with both primer sets, but higher temperatures (~58C) showed anarrower and stronger melt curve for SMase.
Uploaded with Skitch!
December 8, 2010NOAA OA: reverse transcriptionReverse transcribed gDNA-free RNA samples (n=4). Put 2 ug of RNA (see table below "vibrio exposure") and brought volume up to 17.75 uLwith H2O. Added 0.5 uL oligo dT primers and incubated at 70C for 5 min. Put on ice 5 min. Added 5 uL 5x MMLV buffer, 1.25 uL 10 mMdNTPs, and 0.5 uL reverse transcriptase (MMLV) to each sample. Incubated 42C for 1 hr + 95C for 3 min. Diluted samples (25uL) in 225 uLwater and stored at -20 in Emma's cDNA Box III.
Vibrio exposure: reverse transcriptionDnased RNA samples from SJW. Followed same procedure as above. "VE" samples (n=10) were exposed to live Vibrio vulnificus and V.parahaemolyticus for 24 hours at 2x10^11 CFU. There are also 10 controls, "C". SJW extracted RNA from gill tissues for all 20 animals on2.15.2008 and Dnased 3.25.2008.
405
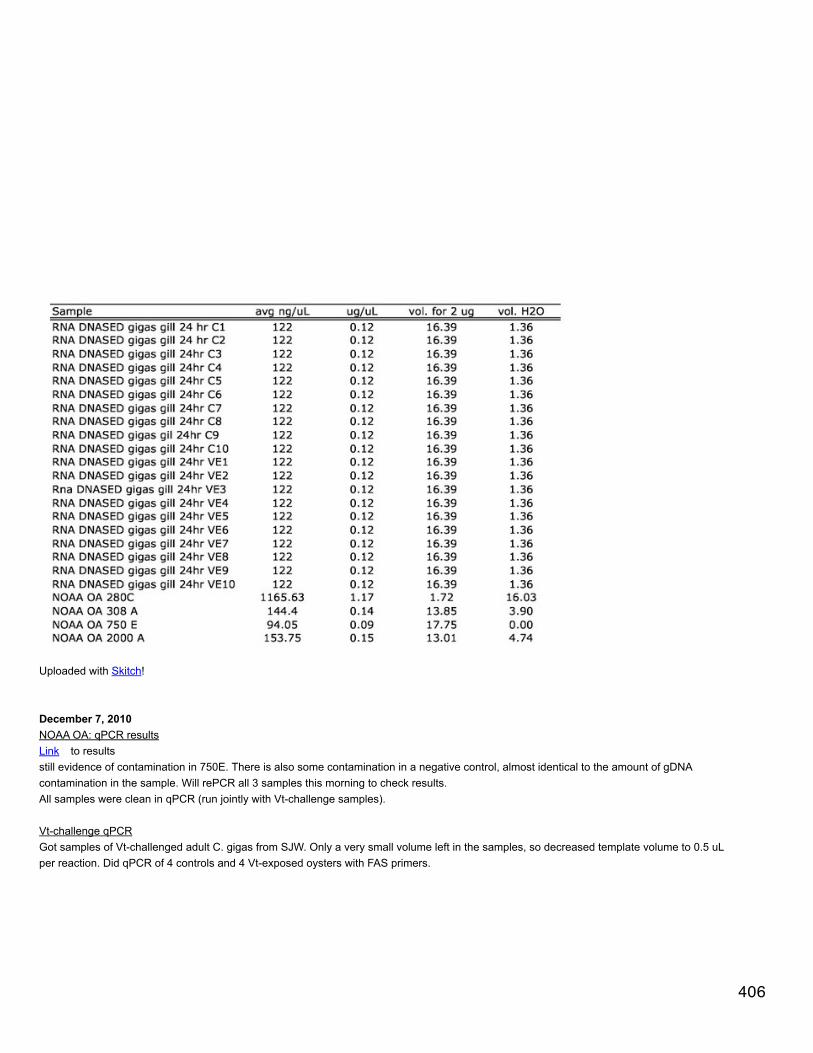
Uploaded with Skitch!
December 7, 2010NOAA OA: qPCR resultsLink to resultsstill evidence of contamination in 750E. There is also some contamination in a negative control, almost identical to the amount of gDNAcontamination in the sample. Will rePCR all 3 samples this morning to check results.All samples were clean in qPCR (run jointly with Vt-challenge samples).
Vt-challenge qPCRGot samples of Vt-challenged adult C. gigas from SJW. Only a very small volume left in the samples, so decreased template volume to 0.5 uLper reaction. Did qPCR of 4 controls and 4 Vt-exposed oysters with FAS primers.
406

Uploaded with Skitch!
qPCR results didn't look very good and Ct values were very variable (probably due to pipetting variability of 0.5 uL of template). But primersworked on samples. There is more RNA of these samples and I will reverse transcribe it tomorrow.
Ceramide: sequencingRan 1.5% agarose gel of sampled PCR'd 12.6.10 (loaded each well with full 25uL volume of PCR product). Used 5 uL of Bioline's HyperladderI. Cut out bands marked with a green "*" for sequencing. (For Sptlc1, just cut out top band)
407
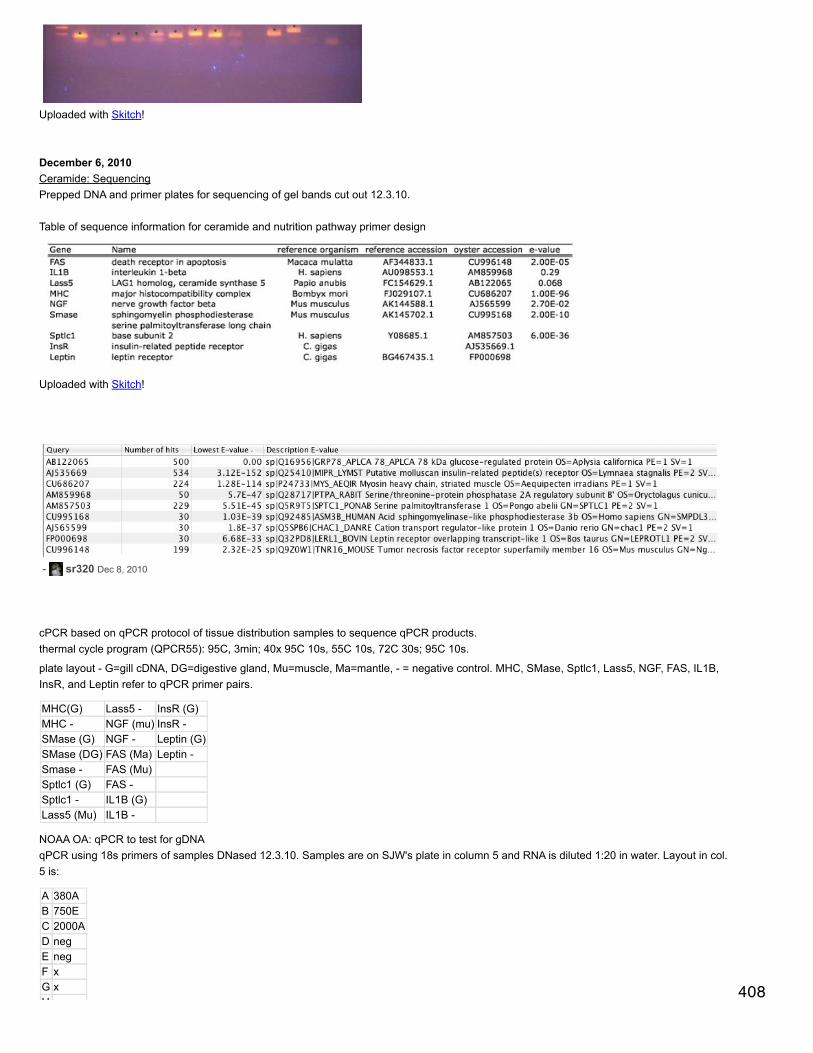
Uploaded with Skitch!
December 6, 2010Ceramide: SequencingPrepped DNA and primer plates for sequencing of gel bands cut out 12.3.10.
Table of sequence information for ceramide and nutrition pathway primer design
Uploaded with Skitch!
- sr320 Dec 8, 2010
cPCR based on qPCR protocol of tissue distribution samples to sequence qPCR products.thermal cycle program (QPCR55): 95C, 3min; 40x 95C 10s, 55C 10s, 72C 30s; 95C 10s.
plate layout - G=gill cDNA, DG=digestive gland, Mu=muscle, Ma=mantle, - = negative control. MHC, SMase, Sptlc1, Lass5, NGF, FAS, IL1B,InsR, and Leptin refer to qPCR primer pairs.
MHC(G) Lass5 - InsR (G)MHC - NGF (mu) InsR -SMase (G) NGF - Leptin (G)SMase (DG) FAS (Ma) Leptin -Smase - FAS (Mu)Sptlc1 (G) FAS -Sptlc1 - IL1B (G)Lass5 (Mu) IL1B -
NOAA OA: qPCR to test for gDNAqPCR using 18s primers of samples DNased 12.3.10. Samples are on SJW's plate in column 5 and RNA is diluted 1:20 in water. Layout in col.5 is:
A 380AB 750EC 2000AD negE negF xG xH x
408

H x
December 3, 2010NOAA OA, Cg Vt, & ceramide: qPCROA - qPCR with 18s to test for gDNA contamination in RNA (see 12.2.10)Vt - juvenile gill tissue from Vt challenge 3.16.10. Test 4 control & 4 challenged with Hsp70 and Lass5 (and EF1a to normalize). Not done induplicate.tissue distribution - test in duplicate of FAS, MHC_q, and Sptlc1. May have contaminated 2nd replicate of FAS gill with DG.
Uploaded with Skitch!
Results (Link ): gDNA contamination in OA samples 380A, 750E, and 2000A. Will need to DNase. Hsp70 and Lass5 amplified well in the Vt-challenged juvenile gill tissue. FAS and MHC also amplified well, but Sptlc1 did not amplify. All melt curves look good except for 2nd replicateof FAS DG (well 8C), which will be excluded from all analyses.
Uploaded with Skitch!
all pairwise comparisons between mantle and other tissues expression levels are significant (p=8.46e-4)
Uploaded with Skitch!
all pairwise comparisons of expression levels in the tissues are significant.
409
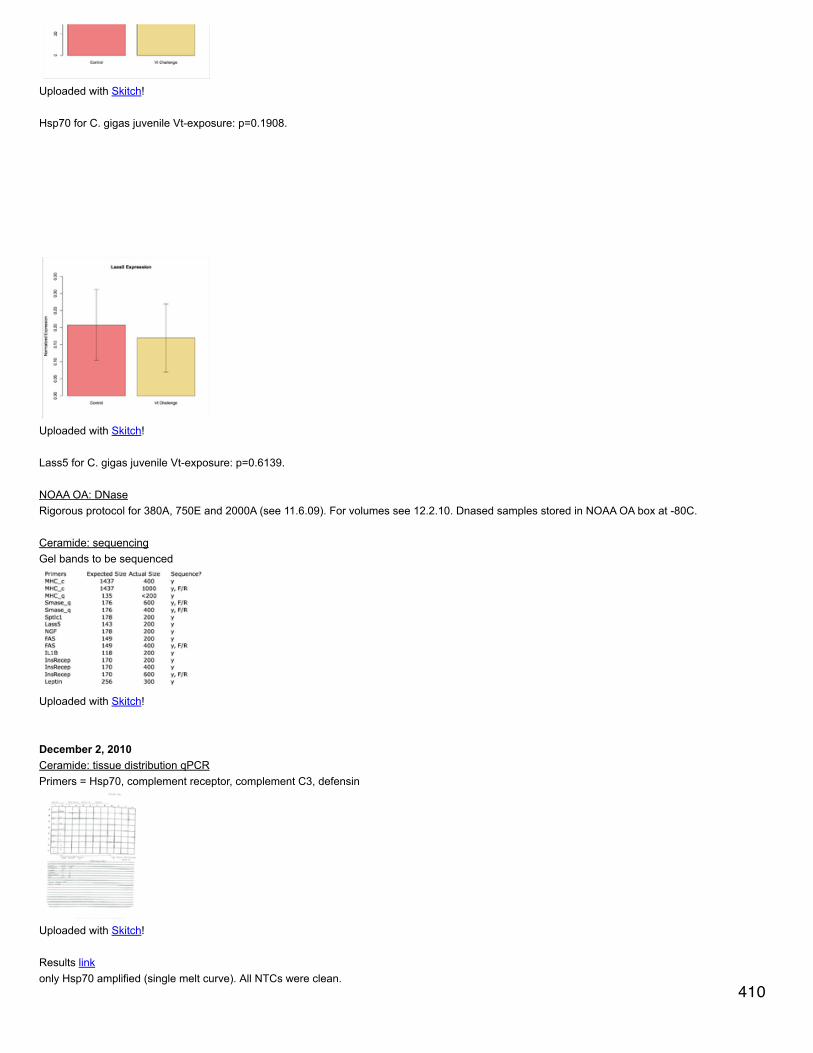
Uploaded with Skitch!
Hsp70 for C. gigas juvenile Vt-exposure: p=0.1908.
Uploaded with Skitch!
Lass5 for C. gigas juvenile Vt-exposure: p=0.6139.
NOAA OA: DNaseRigorous protocol for 380A, 750E and 2000A (see 11.6.09). For volumes see 12.2.10. Dnased samples stored in NOAA OA box at -80C.
Ceramide: sequencingGel bands to be sequenced
Uploaded with Skitch!
December 2, 2010Ceramide: tissue distribution qPCRPrimers = Hsp70, complement receptor, complement C3, defensin
Uploaded with Skitch!
Results linkonly Hsp70 amplified (single melt curve). All NTCs were clean.
410
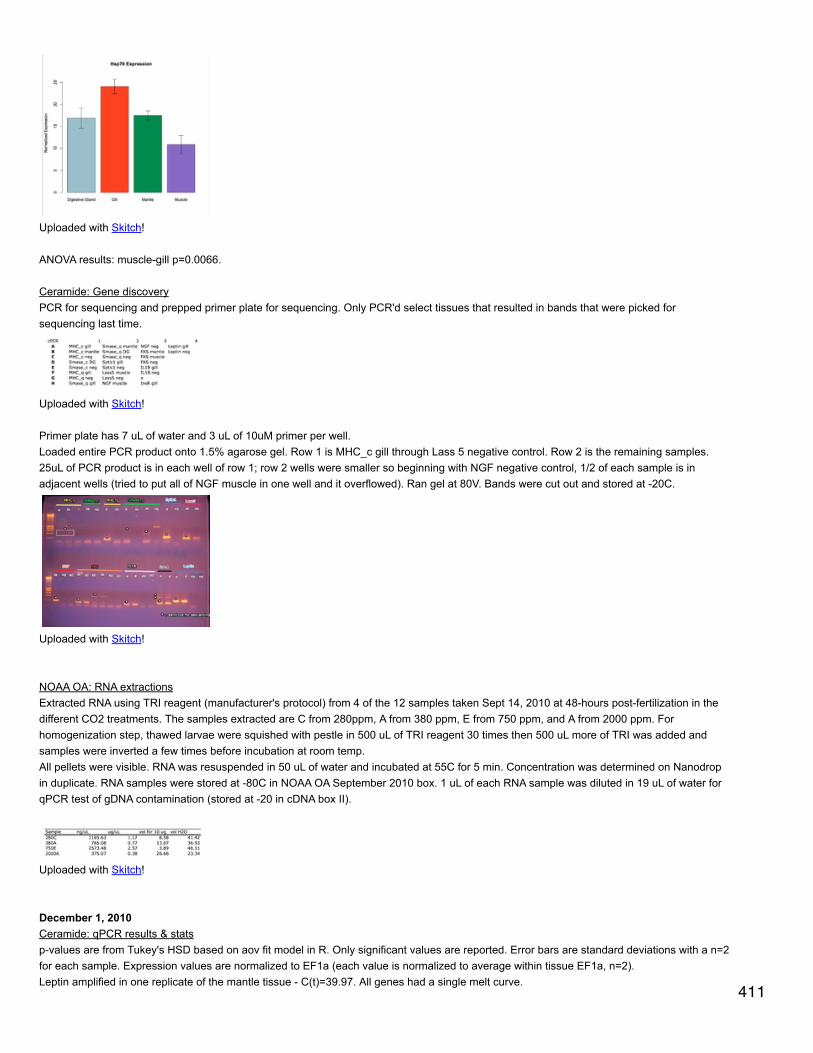
Uploaded with Skitch!
ANOVA results: muscle-gill p=0.0066.
Ceramide: Gene discoveryPCR for sequencing and prepped primer plate for sequencing. Only PCR'd select tissues that resulted in bands that were picked forsequencing last time.
Uploaded with Skitch!
Primer plate has 7 uL of water and 3 uL of 10uM primer per well.Loaded entire PCR product onto 1.5% agarose gel. Row 1 is MHC_c gill through Lass 5 negative control. Row 2 is the remaining samples.25uL of PCR product is in each well of row 1; row 2 wells were smaller so beginning with NGF negative control, 1/2 of each sample is inadjacent wells (tried to put all of NGF muscle in one well and it overflowed). Ran gel at 80V. Bands were cut out and stored at -20C.
Uploaded with Skitch!
NOAA OA: RNA extractionsExtracted RNA using TRI reagent (manufacturer's protocol) from 4 of the 12 samples taken Sept 14, 2010 at 48-hours post-fertilization in thedifferent CO2 treatments. The samples extracted are C from 280ppm, A from 380 ppm, E from 750 ppm, and A from 2000 ppm. Forhomogenization step, thawed larvae were squished with pestle in 500 uL of TRI reagent 30 times then 500 uL more of TRI was added andsamples were inverted a few times before incubation at room temp.All pellets were visible. RNA was resuspended in 50 uL of water and incubated at 55C for 5 min. Concentration was determined on Nanodropin duplicate. RNA samples were stored at -80C in NOAA OA September 2010 box. 1 uL of each RNA sample was diluted in 19 uL of water forqPCR test of gDNA contamination (stored at -20 in cDNA box II).
Uploaded with Skitch!
December 1, 2010Ceramide: qPCR results & statsp-values are from Tukey's HSD based on aov fit model in R. Only significant values are reported. Error bars are standard deviations with a n=2for each sample. Expression values are normalized to EF1a (each value is normalized to average within tissue EF1a, n=2).Leptin amplified in one replicate of the mantle tissue - C(t)=39.97. All genes had a single melt curve.
411
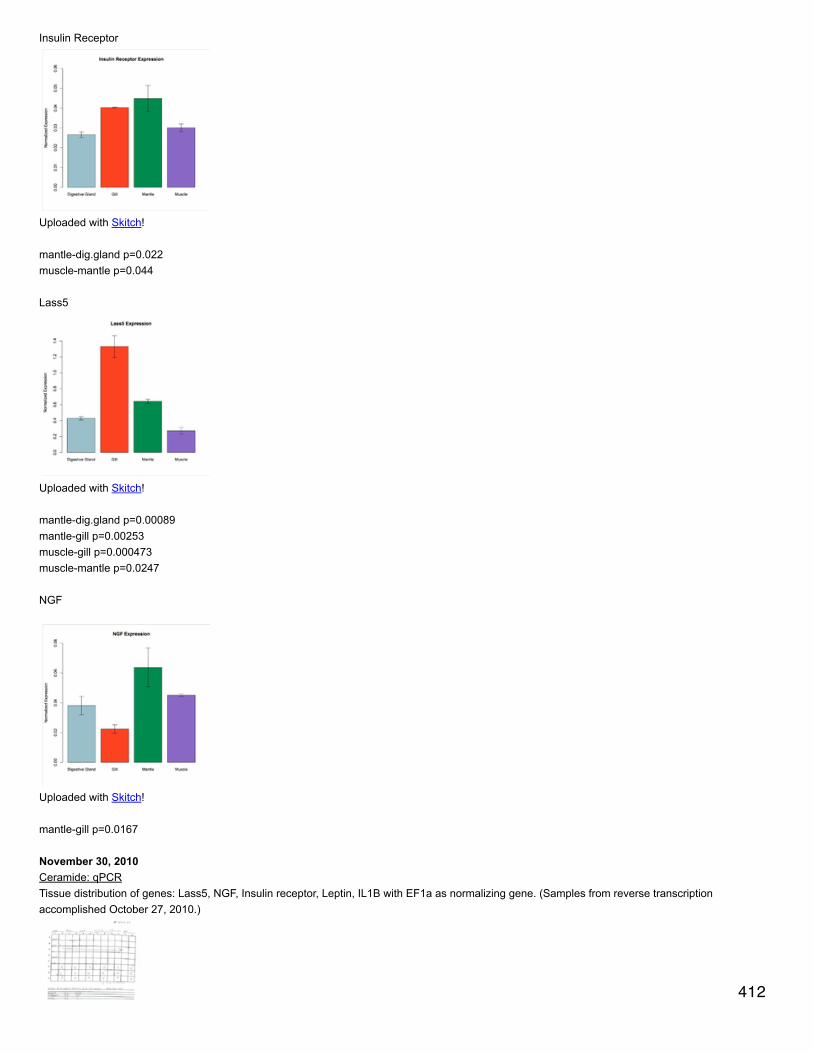
Insulin Receptor
Uploaded with Skitch!
mantle-dig.gland p=0.022muscle-mantle p=0.044
Lass5
Uploaded with Skitch!
mantle-dig.gland p=0.00089mantle-gill p=0.00253muscle-gill p=0.000473muscle-mantle p=0.0247
NGF
Uploaded with Skitch!
mantle-gill p=0.0167
November 30, 2010Ceramide: qPCRTissue distribution of genes: Lass5, NGF, Insulin receptor, Leptin, IL1B with EF1a as normalizing gene. (Samples from reverse transcriptionaccomplished October 27, 2010.)
412

Uploaded with Skitch!
All NTCs were clean and amplification was successful. Results link
Uploaded with Skitch!
November 29, 2010T/Vt: qPCRqPCR of samples A, B, D, E, F, G, H, & I for all 4 days (7.13-7.16). See below for details. PCR done on Friedman Lab machine using 3-stepamp+melt. File: T-Vt EF1a 11.29.10. qPCR done in duplicate for all samples with 4 NTCs.Results linkVery little amplification of samples (only ~8 total, a couple per day). Redid qPCR (not in duplicate) but used 8 uL of cDNA template anddecreased amount of water per reaction accordingly to 2.5 uL.
Amplification plot for 8 uL qPCR with EF1a primers
Uploaded with Skitch!
C(t) values for samples that successfully amplified in 8 uL template qPCR
Uploaded with Skitch!
The samples in wells F are from chamber G, not E.
November 22, 2010T/Vt: DNasingDiluted samples for DNasing as described 11.19.10. Did TURBO's regular DNase protocol: 5 uL buffer + 1 uL enzyme in each sample andincubate at 37C for 30 min. Add 5 uL inactivation buffer and vortex 3x during 2 min incubation. Spin down at 10,000 xg for 1.5 min, transfersupernatant to new tube and store at -80C (in Sarah & Emma's OA/Vt box).qPCR of DNased samples to test for gDNA contamination. Diluted 1 uL of DNased RNA in 19 uL of water to use as template. Each reactionhad 12.5 uL Immomix, 0.5 uL of each primer, 1 uL of 50 uM SYTO13, 6.5 uL water, and 4 uL of template. Loaded samples in following order:
7.14A7.14D7.14F7.14H7.15E7.15G 413
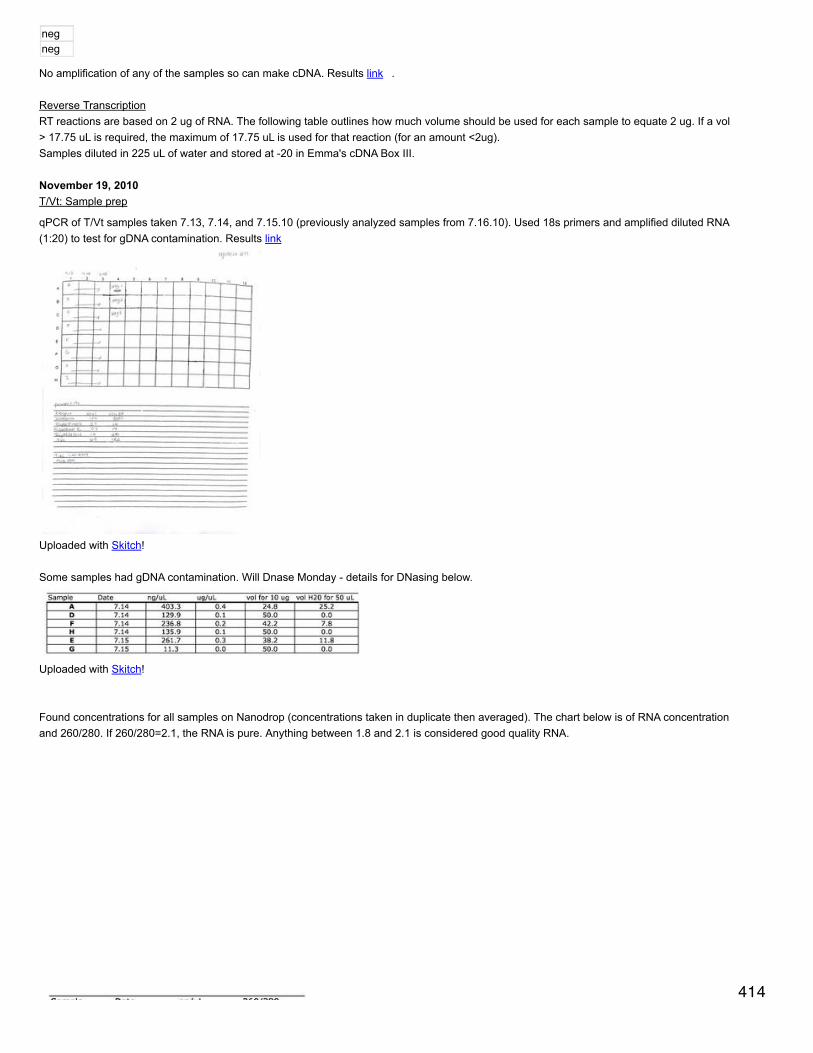
7.15Gnegneg
No amplification of any of the samples so can make cDNA. Results link .
Reverse TranscriptionRT reactions are based on 2 ug of RNA. The following table outlines how much volume should be used for each sample to equate 2 ug. If a vol> 17.75 uL is required, the maximum of 17.75 uL is used for that reaction (for an amount <2ug).Samples diluted in 225 uL of water and stored at -20 in Emma's cDNA Box III.
November 19, 2010T/Vt: Sample prep
qPCR of T/Vt samples taken 7.13, 7.14, and 7.15.10 (previously analyzed samples from 7.16.10). Used 18s primers and amplified diluted RNA(1:20) to test for gDNA contamination. Results link
Uploaded with Skitch!
Some samples had gDNA contamination. Will Dnase Monday - details for DNasing below.
Uploaded with Skitch!
Found concentrations for all samples on Nanodrop (concentrations taken in duplicate then averaged). The chart below is of RNA concentrationand 260/280. If 260/280=2.1, the RNA is pure. Anything between 1.8 and 2.1 is considered good quality RNA.
414
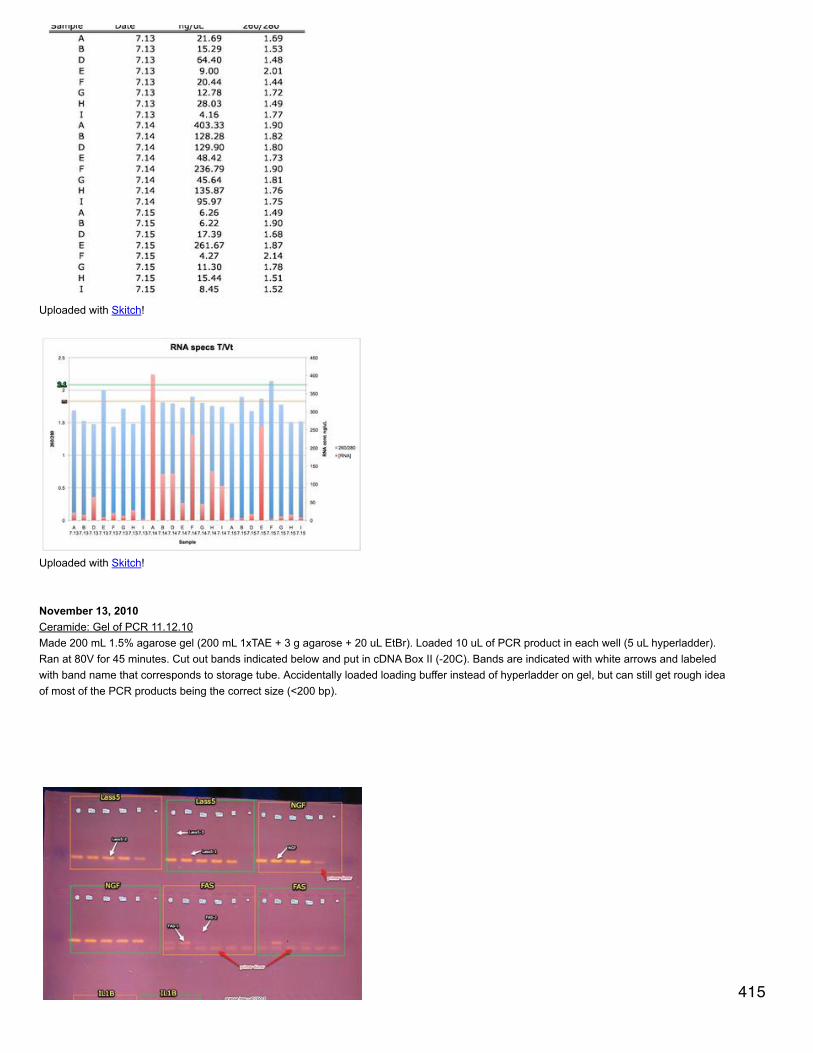
Uploaded with Skitch!
Uploaded with Skitch!
November 13, 2010Ceramide: Gel of PCR 11.12.10Made 200 mL 1.5% agarose gel (200 mL 1xTAE + 3 g agarose + 20 uL EtBr). Loaded 10 uL of PCR product in each well (5 uL hyperladder).Ran at 80V for 45 minutes. Cut out bands indicated below and put in cDNA Box II (-20C). Bands are indicated with white arrows and labeledwith band name that corresponds to storage tube. Accidentally loaded loading buffer instead of hyperladder on gel, but can still get rough ideaof most of the PCR products being the correct size (<200 bp).
415

Uploaded with Skitch!
November 12, 2010CeramideReceived primers for ceramide pathway. Eluted to 100 uM with TE buffer (pH 8.5).
Primer SRIDFAS F 1019FAS R 1020NGF F 1021NGF R 1022IL1B F 1023IL1B R 1024Lass5 F 1025Lass5 R 1026
PCR of cDNA (11.11.2010) with new primers. Diluted cDNA in 225uL water; It looked like T.ISO 3 hemolymph sample had evaporated a little.Each reaction has 12.5 uL Apex master mix, 8.5 uL water, and 0.5 uL of each primer (10 uM). 22 uL of master mix and 3 uL of cDNA templatein each well. PCR55 program on thermocycler (generic, 55C annealing). Plate layout below.
Uploaded with Skitch!
November 11, 2010Ceramide/Nutrition: DnasingDiluted samples according to volumes for 50 uL (11/8/10). Dnased all samples according to Ambion's TURBO protocol. For both TISO3 andPLY3, followed rigorous protocol for mantle, gill & muscle and followed regular protocol for visceral mass & hemolymph. Regular: added 5 uLbuffer + 1 uL Dnase and incubated 30 min at 37C. For rigorous: added 5 uL buffer + 0.5 uL Dnase, incubated 37C for 30 min then added 0.5 uLDnase and incubated again. At end of incubations added 5 uL inactivation buffer and vortexed 3x over 2 min. Centrifuged at 10000xg for 1.5minutes and put supernatant in new tube (stored at -80).
qPCR with 18s primers of Dnased RNA to test for gDNA contamination.
416
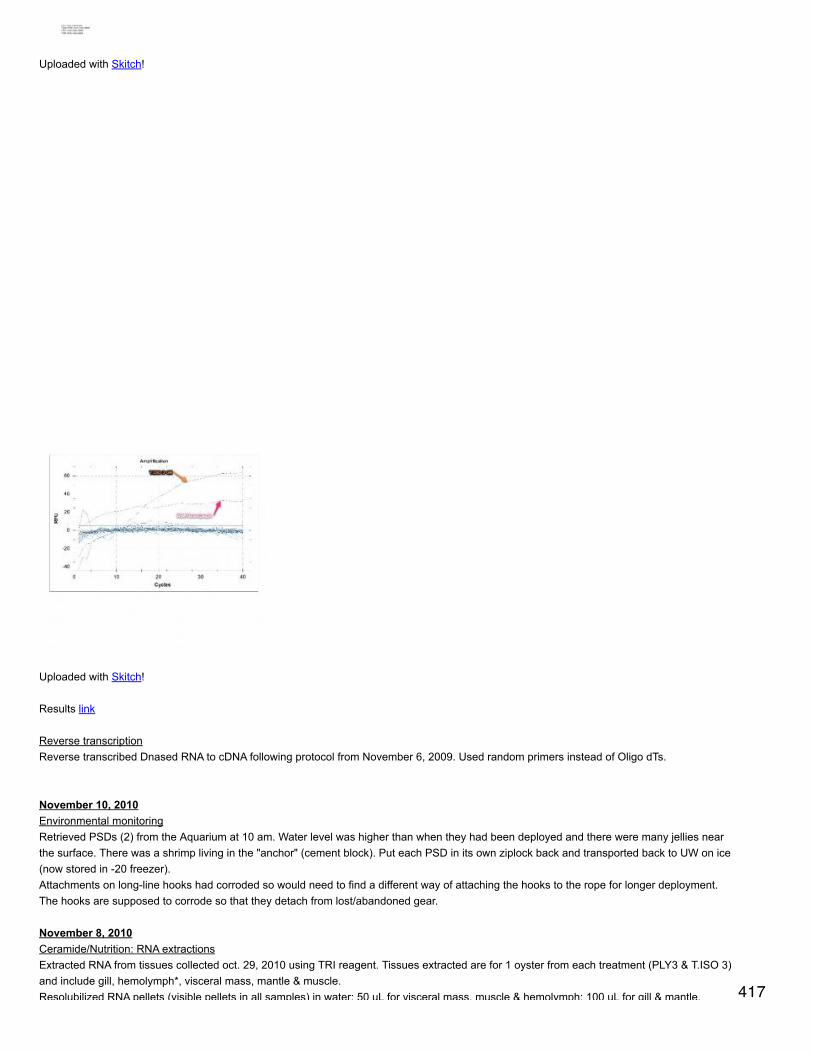
Uploaded with Skitch!
Uploaded with Skitch!
Results link
Reverse transcriptionReverse transcribed Dnased RNA to cDNA following protocol from November 6, 2009. Used random primers instead of Oligo dTs.
November 10, 2010Environmental monitoringRetrieved PSDs (2) from the Aquarium at 10 am. Water level was higher than when they had been deployed and there were many jellies nearthe surface. There was a shrimp living in the "anchor" (cement block). Put each PSD in its own ziplock back and transported back to UW on ice(now stored in -20 freezer).Attachments on long-line hooks had corroded so would need to find a different way of attaching the hooks to the rope for longer deployment.The hooks are supposed to corrode so that they detach from lost/abandoned gear.
November 8, 2010Ceramide/Nutrition: RNA extractionsExtracted RNA from tissues collected oct. 29, 2010 using TRI reagent. Tissues extracted are for 1 oyster from each treatment (PLY3 & T.ISO 3)and include gill, hemolymph*, visceral mass, mantle & muscle.Resolubilized RNA pellets (visible pellets in all samples) in water: 50 uL for visceral mass, muscle & hemolymph; 100 uL for gill & mantle. 417
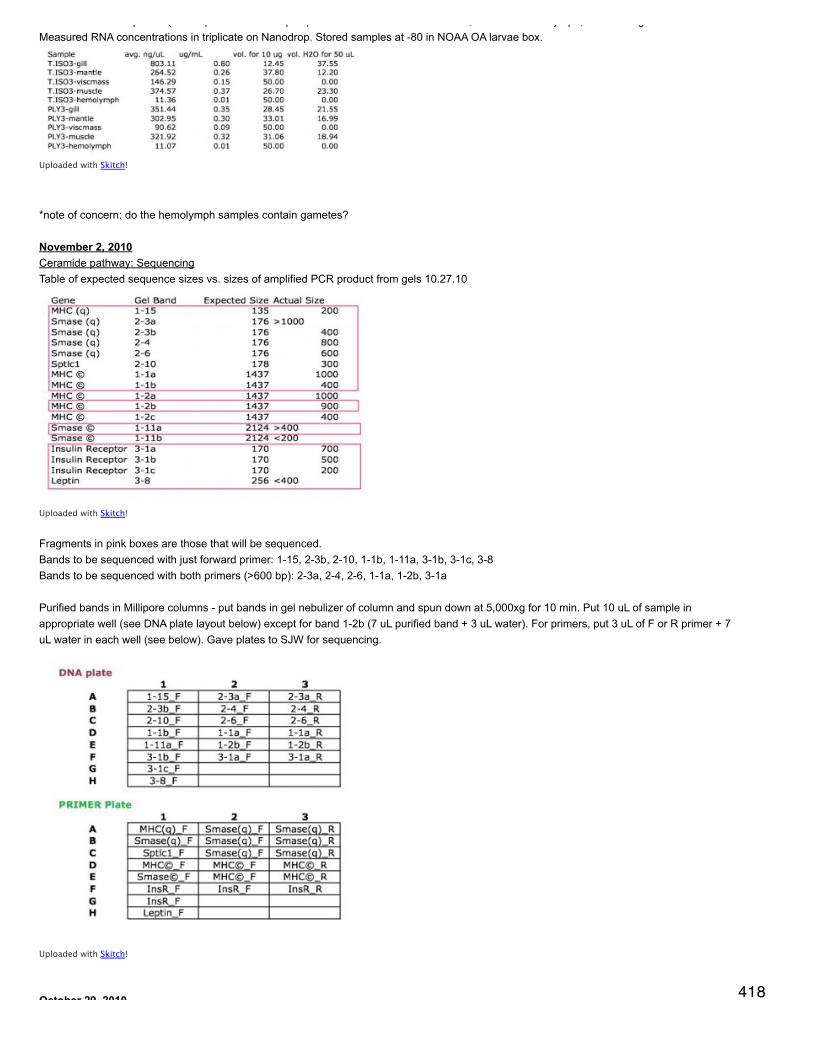
Resolubilized RNA pellets (visible pellets in all samples) in water: 50 uL for visceral mass, muscle & hemolymph; 100 uL for gill & mantle.Measured RNA concentrations in triplicate on Nanodrop. Stored samples at -80 in NOAA OA larvae box.
Uploaded with Skitch!
*note of concern: do the hemolymph samples contain gametes?
November 2, 2010Ceramide pathway: SequencingTable of expected sequence sizes vs. sizes of amplified PCR product from gels 10.27.10
Uploaded with Skitch!
Fragments in pink boxes are those that will be sequenced.Bands to be sequenced with just forward primer: 1-15, 2-3b, 2-10, 1-1b, 1-11a, 3-1b, 3-1c, 3-8Bands to be sequenced with both primers (>600 bp): 2-3a, 2-4, 2-6, 1-1a, 1-2b, 3-1a
Purified bands in Millipore columns - put bands in gel nebulizer of column and spun down at 5,000xg for 10 min. Put 10 uL of sample inappropriate well (see DNA plate layout below) except for band 1-2b (7 uL purified band + 3 uL water). For primers, put 3 uL of F or R primer + 7uL water in each well (see below). Gave plates to SJW for sequencing.
Uploaded with Skitch!
October 29, 2010 418

October 29, 2010NutritionTerminated algae nutrition experiment. Sampled 3 oysters from each treatment (T.iso and Ply). Took 5 different tissue samples for the 6oysters: gill, hemolymph, mantle, muscle, digestive gland/visceral mass/gonad. Most of the oysters had developed gonad, which was difficult todistinguish from the visceral mass/DG. Tissues were stored in 1 mL RNAlater at 4C except for hemolymph which was stored in 0.5 mL TRIreagent at 4C. Shucker was cleaned between oysters and dissecting tools were cleaned between tissues in bleach & EtOH.
October 27, 2010Ceramide pathwayReverse transcription of DNased RNA samples. Put 16.75 uL water, 1 uL RNA, and 1 uL Oligo dT primers (oops, should have been 0.5 uL) intowells of a plate. Heated at 70C for 5 minutes and put on ice for ~3 minutes. Added 5 uL MMLV buffer, 1.25 uL 10 mM dNTPs and 0.5 uLreverse transcriptase. Heated at 42C 1 hours, 95C 3 min.
Diluted cDNA in 225 uL water. Stored at -20 in cDNA box II.
Primer test with cPCR: test of all new primers (qPCR: leptin, insulin receptor, SMase, Sptlc1, MHC; cPCR: SMase, MHC). For each primer pair,amplified cDNA from gill, mantle, muscle, dig. gland, and hemolymph + 1 negative control. Used Apex master mix: 12.5 uL Apex, 8.5 uL water,0.5 uL each primer. Thermal profile: 95C 10 min; 95C 30s, 55C 30s, 72C 30s (repeat 40x); 72C 10 min.
Uploaded with Skitch!
Made 1.5% agarose gel (100 mL 1xTAE, 1.5 g agarose, 10 uL EtBr). Loaded gel with hyperladder I (Bioline, see below) in the beginning of bothrows (5 uL). Row 1 has samples MHC (c) gill through MHC (q) muscle. Row 2 has samples MHC (q) DG through Sptlc1 negative control.Ladder
419
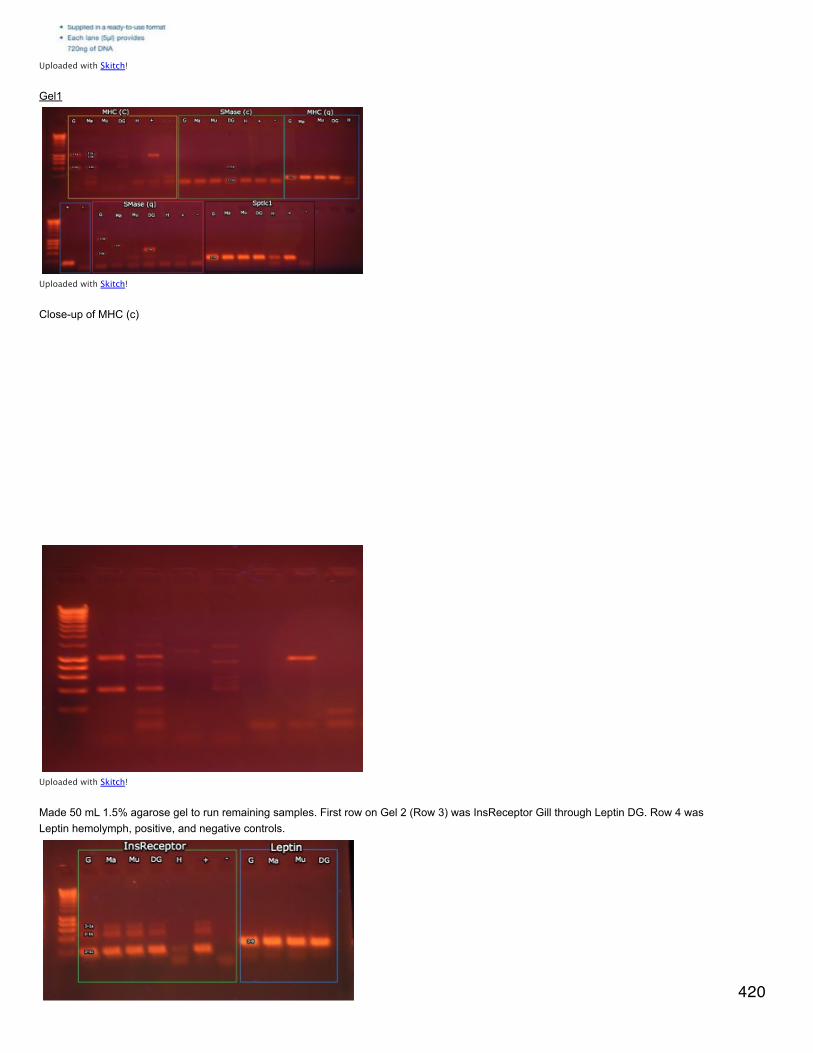
Uploaded with Skitch!
Gel1
Uploaded with Skitch!
Close-up of MHC (c)
Uploaded with Skitch!
Made 50 mL 1.5% agarose gel to run remaining samples. First row on Gel 2 (Row 3) was InsReceptor Gill through Leptin DG. Row 4 wasLeptin hemolymph, positive, and negative controls.
420
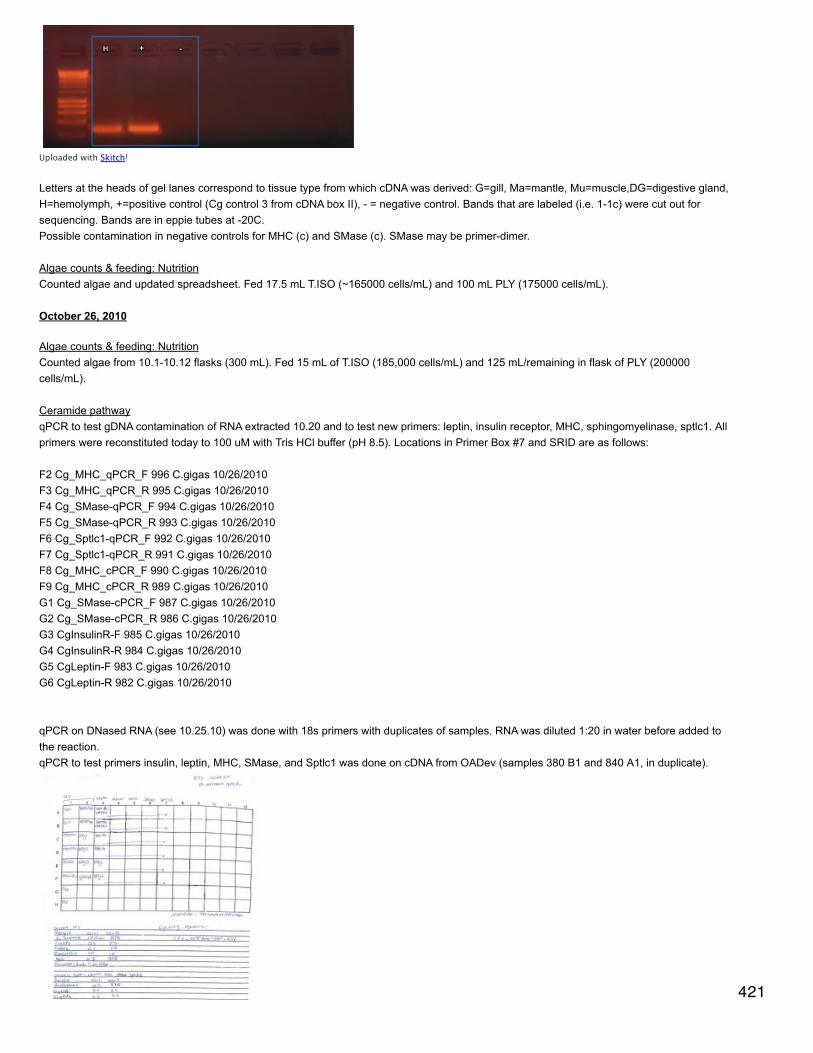
Uploaded with Skitch!
Letters at the heads of gel lanes correspond to tissue type from which cDNA was derived: G=gill, Ma=mantle, Mu=muscle,DG=digestive gland,H=hemolymph, +=positive control (Cg control 3 from cDNA box II), - = negative control. Bands that are labeled (i.e. 1-1c) were cut out forsequencing. Bands are in eppie tubes at -20C.Possible contamination in negative controls for MHC (c) and SMase (c). SMase may be primer-dimer.
Algae counts & feeding: NutritionCounted algae and updated spreadsheet. Fed 17.5 mL T.ISO (~165000 cells/mL) and 100 mL PLY (175000 cells/mL).
October 26, 2010
Algae counts & feeding: NutritionCounted algae from 10.1-10.12 flasks (300 mL). Fed 15 mL of T.ISO (185,000 cells/mL) and 125 mL/remaining in flask of PLY (200000cells/mL).
Ceramide pathwayqPCR to test gDNA contamination of RNA extracted 10.20 and to test new primers: leptin, insulin receptor, MHC, sphingomyelinase, sptlc1. Allprimers were reconstituted today to 100 uM with Tris HCl buffer (pH 8.5). Locations in Primer Box #7 and SRID are as follows:
F2 Cg_MHC_qPCR_F 996 C.gigas 10/26/2010F3 Cg_MHC_qPCR_R 995 C.gigas 10/26/2010F4 Cg_SMase-qPCR_F 994 C.gigas 10/26/2010F5 Cg_SMase-qPCR_R 993 C.gigas 10/26/2010F6 Cg_Sptlc1-qPCR_F 992 C.gigas 10/26/2010F7 Cg_Sptlc1-qPCR_R 991 C.gigas 10/26/2010F8 Cg_MHC_cPCR_F 990 C.gigas 10/26/2010F9 Cg_MHC_cPCR_R 989 C.gigas 10/26/2010G1 Cg_SMase-cPCR_F 987 C.gigas 10/26/2010G2 Cg_SMase-cPCR_R 986 C.gigas 10/26/2010G3 CgInsulinR-F 985 C.gigas 10/26/2010G4 CgInsulinR-R 984 C.gigas 10/26/2010G5 CgLeptin-F 983 C.gigas 10/26/2010G6 CgLeptin-R 982 C.gigas 10/26/2010
qPCR on DNased RNA (see 10.25.10) was done with 18s primers with duplicates of samples. RNA was diluted 1:20 in water before added tothe reaction.qPCR to test primers insulin, leptin, MHC, SMase, and Sptlc1 was done on cDNA from OADev (samples 380 B1 and 840 A1, in duplicate).
421
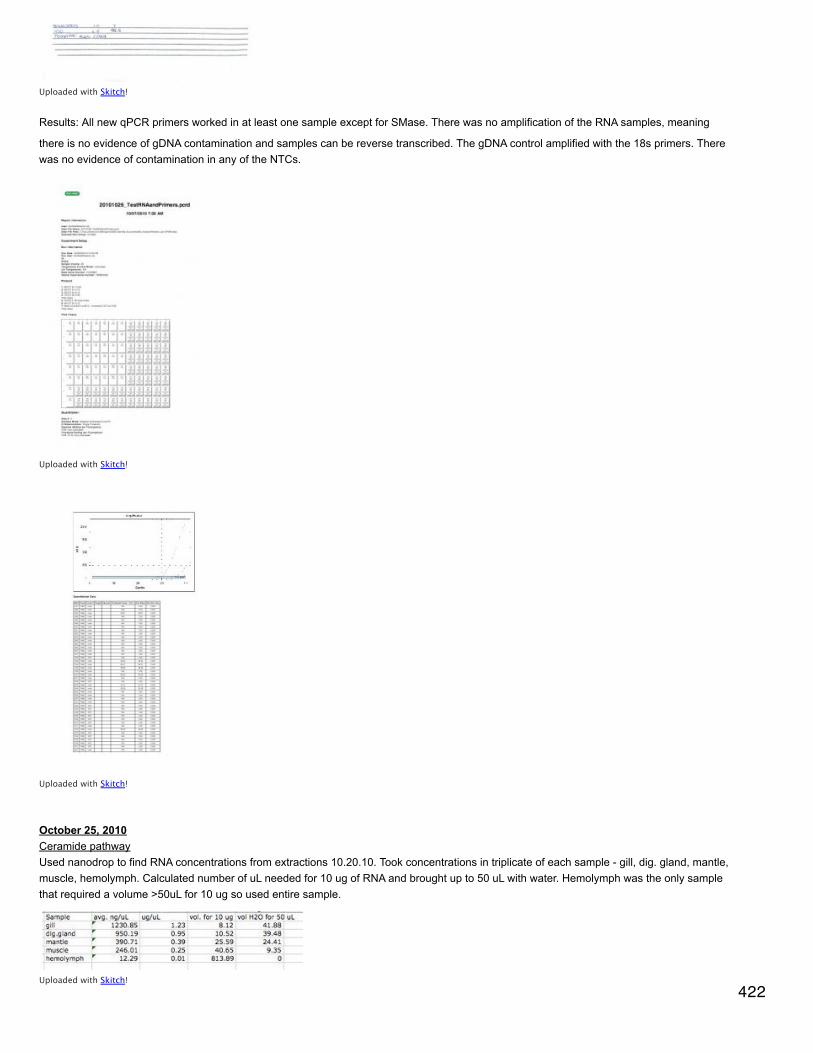
Uploaded with Skitch!
Results: All new qPCR primers worked in at least one sample except for SMase. There was no amplification of the RNA samples, meaning
there is no evidence of gDNA contamination and samples can be reverse transcribed. The gDNA control amplified with the 18s primers. Therewas no evidence of contamination in any of the NTCs.
Uploaded with Skitch!
Uploaded with Skitch!
October 25, 2010Ceramide pathwayUsed nanodrop to find RNA concentrations from extractions 10.20.10. Took concentrations in triplicate of each sample - gill, dig. gland, mantle,muscle, hemolymph. Calculated number of uL needed for 10 ug of RNA and brought up to 50 uL with water. Hemolymph was the only samplethat required a volume >50uL for 10 ug so used entire sample.
Uploaded with Skitch!
422

DNased RNA samples, did rigorous protocol for all except did regular for hemolymph since RNA concentration was so low. See March 18,2010 for details on rigorous protocol. For rigorous added 0.5 uL DNase + 5 uL 10x buffer to samples and incubated at 37C for 30 min; addedadditional 0.5 uL DNase and incubated another 30 minutes. Regular protocol: added 1 uL DNase + 5 uL buffer and incubated at 37 C for 30min.After incubations, added 5 uL inactivation buffer and vortexed 3 x over 2 minutes. Spun at 10,000xg for 1.5 min and put supernatant in newtube. Stored at -80.
Algae counts & feeding: NutritionKarissa counted algae from 10.19 flasks (300 mL). Fed 30 mL of T.ISO (210000 cells/mL) and 90 mL of PLY (171000 cells/mL).Made 2L new media from water Zac autoclaved last week. Seeded new flasks of PLY and T.ISO.
October 24, 2010Algae counts & feeding: NutritionCounted algae from feeder flask for T.ISO and from 300 mL 10.19 for PLY. Significant numbers of dead algae cells (most were still alive) inT.ISO so after feeding discarded remaining algae. Fed ~360,000 cells /mL of T.ISO and 340,000 cells/mL of PLY (T.ISO probably anoverestimate given number of dead algal cells in culture).
October 22, 2010Algae counts & feeding: NutritionCounted algae - did not add any EtOH. Updated counts are in spreadsheet. Fed oysters ~11 mL of T.ISO (170000 cells/mL) and the rest of thePLY (~40 mL, 196000 cells/mL).Before feeding changed water in tanks.
October 21, 2010Algae counts & feeding: NutritionCounted algae. Added 50 uL of 75% EtOH to 1 mL of algae from feeding flasks. Still not enough EtOH to completely stop swimming, but algaewere slower. Oysters were fed 15 mL T.ISO and 77 mL PLY.
October 20, 2010Ceramide pathwayExtracted RNA from tissues collected yesterday using TRI reagent. All pellets were resuspended in 100 uL water, except hemolymph wasresuspended in 50 uL. Resuspension was aided by incubation at 50C for ~5 minutes, samples were then lightly vortexed and stored at -80 inNOAA Sept 2010 box.
Algae counts & feeding: NutritionCounted algae from 300 mL flasks 10/1-10/12 because did not see other flasks which had been taken out of the hood. Added 10 uL 75% EtOHto 1 mL of algae to slow algae movement. Took 2 aliquots from the 1 mL and counted 6 squares on hemacytometer. This did not have much ofan effect on the algae. Oysters were fed 20 mL T.ISO and 155 mL PLY, ~170000 cells/mL each.Fed the trash can oysters 10 mL SD1800.
Biomonitoring
Deployed 2 PSDs at the Aquarium (POCIS). PSDs were attached to a rope using long-line clips. The rope was weighted with a large cinderblock (PSDs were ~5-6' above the block). The block & PSDs were lowered into the water until the block touched bottom and then the top of therope was tied off to secure vertical suspension of the PSDs in the water column. PSDs will be deployed for 3 weeks.
October 19,2010Algae counts & feeding: NutritionCounted algae (see 10.13) and updated spread sheet. Fed oysters 14 mL T.ISO and 47 mL PLY (~170000 cells/mL each).White/grayish debris in bottom of tanks is probably feces - looked under 'scope and they were dense and solid.Also under scope found larvae from the tanks - surprise barnacle larvae!!
Cleaned out tanks by emptying water, rinsing twice with dechlorinated water and refilling with new seawater until oysters covered. Fed oystersafter cleaned tanks.
Ceramide pathwayDissected oyster from yesterday. Tissues for RNA extraction (gill, mantle, muscle, digestive gland, and hemolymph) were put in 0.5 mLRNAlater at 4C; duplicates of all tissues except hemolymph were frozen immediately at -80C. The frozen tissues are in the C. gigas LarvaeNOAA OA September 2010 box.
October 18, 2010423

October 18, 2010Algae counts & feeding: NutritionCounted algae (see 10.13) and updated spread sheet. Fed oysters 20 mL TISO and 142 mL PLY (2x normal feeding because missed feedingthis weekend, ~340,000 cells/mL). Oysters were all sightly agape. Weird white stuff on bottom of PLY treatment tank - will investigate tomorrow.Will also change water in both tanks tomorrow.
Environmental monitoringPicked up 2 PSDs from Irv Shultz (PNNL). Irv has membranes mounted inside steamers (cooking appliance) and held closed with zip ties. Thiswould save $355 per site ($1065 total).
Ceramide signaling pathwayPicked up an oyster from Taylor shellfish to dissect for various tissues and test ceramide pathway primers. Put oyster in tank with saltwater.
October 15, 2010Algae counts & feeding: NutritionCounted algae as outlined 10.13.10 and updated spread sheet. Fed oysters 15 mL T.ISO and 95 mL PLY (~1.7*10^5 cells/mL). Oysters in bothtreatments were slightly agape.Fed trashcan oysters 10 mL SD1800.Oysters will not be fed 10.16.10.
October 14, 2010Algae counts & feeding: NutritionCounted algae as outlined 10.13.10 and updated spread sheet. There was more cells/uL of T.ISO today but not of PLY. Fed the oysters 25 mLof T.ISO (1.66x10^5 cells/mL) and 115 mL of PLY (same # cells/mL).Oysters in T.ISO treatment are mostly closed and barnacles are inactive. This is in stark contrast to the oysters in the PLY treatment where allbarnacles are active and all oysters are slightly agape.Fed trashcan oysters 10 mL SD1800.Received leptin pathway primers (2 pairs) but did not elute.
October 13, 2010Algae counts & set-up: NutritionSwirled algae flasks so well-mixed. Took aliquots from both algaes, Isochrysis (T. ISO) and tetraselmis (PLY). Counted 2 ~15 uL aliquots fromeach algae type on hemacytometer. Counts were for number of algae cells in 6 different squares as defined by the pink square (below). T.ISOcells were much smaller than PLY cells. Ongoing algae counts can be found in spreadsheet here .
Uploaded with Skitch!
Put oysters (collected at Big Beef Creek) in 2 separate rectangular experimental tanks (n=4 for T.ISO and n=5 for PLY). Each tank has a smallpump to create water flow. Fed the PLY treatment 100 mL of algae and the T.ISO treatment got 25 mL of algae. Oysters in trash can were fed10 mL of shellfish diet 1800.
October 11, 2010Primer design: Ceramide Signalling PathwayDesigned primers for sequencing and qPCR for genes in the ceramide pathway. Known vertebrate sequences for the genes and their C. gigas
424
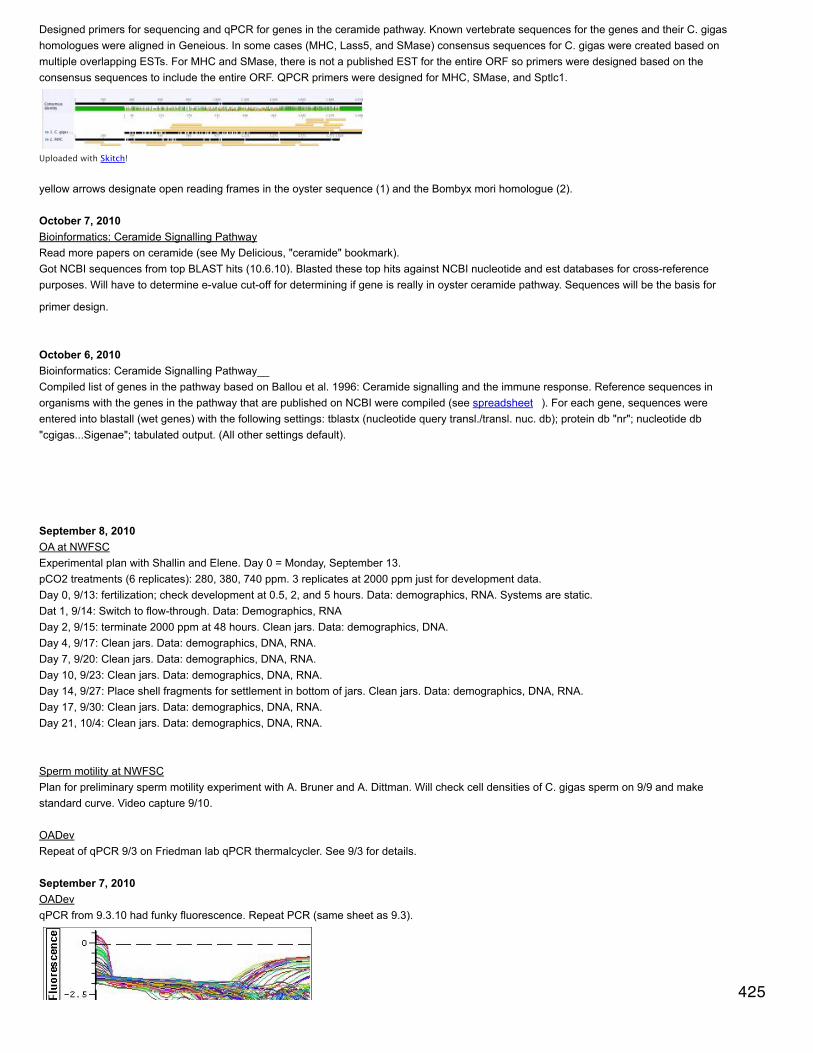
Designed primers for sequencing and qPCR for genes in the ceramide pathway. Known vertebrate sequences for the genes and their C. gigashomologues were aligned in Geneious. In some cases (MHC, Lass5, and SMase) consensus sequences for C. gigas were created based onmultiple overlapping ESTs. For MHC and SMase, there is not a published EST for the entire ORF so primers were designed based on theconsensus sequences to include the entire ORF. QPCR primers were designed for MHC, SMase, and Sptlc1.
Uploaded with Skitch!
yellow arrows designate open reading frames in the oyster sequence (1) and the Bombyx mori homologue (2).
October 7, 2010Bioinformatics: Ceramide Signalling PathwayRead more papers on ceramide (see My Delicious, "ceramide" bookmark).Got NCBI sequences from top BLAST hits (10.6.10). Blasted these top hits against NCBI nucleotide and est databases for cross-referencepurposes. Will have to determine e-value cut-off for determining if gene is really in oyster ceramide pathway. Sequences will be the basis for
primer design.
October 6, 2010Bioinformatics: Ceramide Signalling Pathway__Compiled list of genes in the pathway based on Ballou et al. 1996: Ceramide signalling and the immune response. Reference sequences inorganisms with the genes in the pathway that are published on NCBI were compiled (see spreadsheet ). For each gene, sequences wereentered into blastall (wet genes) with the following settings: tblastx (nucleotide query transl./transl. nuc. db); protein db "nr"; nucleotide db"cgigas...Sigenae"; tabulated output. (All other settings default).
September 8, 2010OA at NWFSCExperimental plan with Shallin and Elene. Day 0 = Monday, September 13.pCO2 treatments (6 replicates): 280, 380, 740 ppm. 3 replicates at 2000 ppm just for development data. Day 0, 9/13: fertilization; check development at 0.5, 2, and 5 hours. Data: demographics, RNA. Systems are static.Dat 1, 9/14: Switch to flow-through. Data: Demographics, RNADay 2, 9/15: terminate 2000 ppm at 48 hours. Clean jars. Data: demographics, DNA.Day 4, 9/17: Clean jars. Data: demographics, DNA, RNA.Day 7, 9/20: Clean jars. Data: demographics, DNA, RNA.Day 10, 9/23: Clean jars. Data: demographics, DNA, RNA.Day 14, 9/27: Place shell fragments for settlement in bottom of jars. Clean jars. Data: demographics, DNA, RNA.Day 17, 9/30: Clean jars. Data: demographics, DNA, RNA.Day 21, 10/4: Clean jars. Data: demographics, DNA, RNA.
Sperm motility at NWFSCPlan for preliminary sperm motility experiment with A. Bruner and A. Dittman. Will check cell densities of C. gigas sperm on 9/9 and makestandard curve. Video capture 9/10.
OADevRepeat of qPCR 9/3 on Friedman lab qPCR thermalcycler. See 9/3 for details.
September 7, 2010OADevqPCR from 9.3.10 had funky fluorescence. Repeat PCR (same sheet as 9.3).
425

Uploaded with plasq's Skitch!
Still weird fluorescence.qPCR to check SYTO 13 (50 uM) made 8.31.10. Made new SYTO stock - 1 uL 5mM SYTO 13 in 99 uL DMSO. qPCR in replicate with mastermixes made from 2 different SYTO dilutions.
Uploaded with plasq's Skitch!
fluorescence is a problem with the qPCR machine.
OA at NWFSC1 pm: dropped off oysters collected at Big Beef Creek on 9.6. Oysters are at ~20C in flowing water.
September 6, 2010Prep for spawningCollected ~23 adult C. gigas from Big Beef Creek. Tide was high (~1:30 pm). Opened a few oysters to check ripeness before collecting.Oysters on river side of bridge above tide were barely ripe. More ripeness in subtidal oysters under bridge and along the beach in the bay.Oysters were collected from these 2 locations and transported back to UW on ice. Once back at SAFS, put oysters in seawater tank with airand a pump to create water flow.
September 3, 2010OADevExported qPCR data from 9/1 and 9/2 with manual threshold of 0.011. Too much variation to tell if differences are significant or not. Samplesthat need to be rerun (due to low efficiency or failed amplification):EF1: 840 C2CytP450: 380A2, 380 A1, 840 C1
qPCR of rerun samples and all samples for duplicate. Also included Hsp70 (CM primers).
426

Uploaded with plasq's Skitch!
T/VtSamples inoculated with Vt at 25C: A,G,D,HSamples inoculated with Vt at 12C: J,K,C,LControls (unclear which are at which T): B,E,F,I,M,N,O,P - but we think the 25C controls are F,E,B,I and 12C controls are O,M,N,P.Exported qPCR data from 9/1 & 9/2 with manual threshold of 0.019. Samples that need to be rerun are:EF1: A,D,H,Pcjunk: A,D,P,F,G,INfkB: all
September 2, 2010OADevqPCR of 380 A1, A2, B1 and 840 A1, B1, C1, C2 (cDNA). Genes = BPI, CytP450, Prx6, and Hsp70.
Uploaded with plasq's Skitch!
Results: BPI did not amplify - need to check paper for published annealing temp, etc.; CytP450 & Prx6 were fine; Hsp70 had a terrible melt 427
curve. SW says that the primer set is bad in general and gave me newly designed primers (from Christina Miller).T/VtReverse transcription (see 11/6/09) of 7.16 J & K.qPCR of T/Vt 7.16 cDNA with c-jun kinase and NfKB (also EF1a for J & K). Tested new Hsps70 primers (from CM) with some unknown cDNA.
Uploaded with plasq's Skitch!
September 1, 2010
OADev & T/VtDNase (standard protocol) of 380 C1 and 7.16 J & K.Reverse transcription (MMLV see 11/6/09) of clean DNased samples from 8/30 and 8/31 (n=21). Samples in welled plated in following order:
7.16 L 840 C1 7.16 G7.16 B 7.16 N 840 B17.16 F 840 C2 7.16 C7.16 P 840 A1 380 B17.16 H 7.16 M 7.16 I7.16 A 380 A17.16 E 7.16 O7.16 D 380 A2
Diluted all cDNA in 225 uL water. Transferred to 1.5 mL tubes & stored at -20.
qPCR of cDNA (gene = EF1a) and of DNased RNA (diluted 1:20) 380C1 and 7.16 J & K (gene = 18s).
428

Uploaded with plasq's Skitch!
Still contamination in 380C1, but J & K are clean.
Made sample database of all RNA, cDNA and samples.
August 31, 2010OADev & T/VtqPCR results from 8.30: Some samples were clean and some had gDNA contamination. Clean samples: 380 A1, 380 A2, 840 C2, 7.16 A, D,H, O and P. All negatives were clean and gDNA controls amplified more than most of the RNA samples. Chose samples with the highest gDNAlevels, diluted them 1:20 in nanopure water and did qPCR with 18s primers. Samples picked for re-amp. were: 380 C1, 7.16 B, F, I, and N.
Uploaded with plasq's Skitch!
Still evidence of contamination in all samples tested at 1:20 dilution. Re-DNase (standard protocol, 1 uL DNase, 5 uL buffer, incubate 37C for30 min) all samples that showed evidence of gDNA contamination in qPCR from 8.30.qPCR of re-DNased samples with 18s primers.
Uploaded with plasq's Skitch!
All samples clean except for 380 C1. Will re-DNase 380C1 and 7.16 J &K, which were missed yesterday.
August 30, 2010429

August 30, 2010OADev & T/Vt
Extracted RNA from OADev samples using Tri Reagent. Extracted 4 from each CO2 treatment. For 380 ppm: A1, B1, C1, A2. For 840 ppm:A1, B1, C1, C2. 380 ppm C1 spilled ~1/2 volume during vortexing after chloroform addition.
Found RNA concentrations using Nanodrop for extracted OAdev sample & 16 RNA samples (extracted at FHL) from T/Vt trial 7.16. Didconcentrations of 3 aliquots of 1.5 uL from each sample.
Uploaded with plasq's Skitch!
3 concentrations were averaged unless one was anomalous, then is was discarded from calculations. From averaged concentration,determined how many uL would be needed for 10 ug. If >50 uL, then used entire sample for DNasing (all RNA samples are 50 uL); if <50 uL,then made up difference with DEPC-treated H2O.Dnased samples using Ambion's rigorous protocol (details March 18, 2010).
qPCR of all RNA samples with 18s primers to test for gDNA contamination (4 negative controls, 2 positive controls of C. gigas DNA).
430

Uploaded with plasq's Skitch!
August 27-30, 2010LD50: C. gigas larvae + V. tubiashiiCounted larvae in the am to determine live vs dead. Same protocol as 8.26. Did 4x on 8.26-28, switched to 10x on 8.29 & 8.30. Data here.In a number of the samples, fewer larvae were swimming as of 8.27 (see data for details). Ciliates first observed on 8.30 in chambers C, N, andB. Larvae were not counted in K & D on 8.30 because they had all been dead since 8.27.
August 26, 2010LD50: C. gigas larvae + V. tubiashiiGot ~1x10^6 Cg larvae from Taylor yesterday (8/25). larvae were spawned on Monday (8/23). Divided larvae equally between 10 treatmentchambers (1.5 L). Chambers were filled with seawater and aerated.10 am today inoculated 8 treatment chambers with Vt. Inoculation at 4 concentrations in duplicate: 10^6, 10^5, 10^4, and 10^3 CFU/mL. 2chambers left as controls. Before inoculation, homogenized larvae in water column with "plunger" and sampled 10 mL. Took 3 aliquots fromthose 10 mL and put in 3 wells of a depression slide. Counted larvae in 3 fields of view at 4x. Determined live vs. dead (xls "LD 50 mortalitydata"). Larvae appeared healthy and most were swimming actively. They had bivalved shells and velums.
July 27, 2010IMPORTANT NOTEUntil this week Lillian was not cleaning water collection jars used to sample microbe. communities outside the hatchery.
July 13, 2010Cg Larvae - Vt & T trial 28 amSet one tote to 12C and the other to 25 C using chiller & heater, respectively. Later in the day Elene inoculated 4 chambers in each tote.9 pmFed larvae. Divided ~ 125 mL T.iso/Plya between 16 chambers.
July 12, 2010Cg Larvae - Vt & T trial 2New larvae from Taylor. 9-day old, ~ 2 million. Divided between 16 larval chambers in 2 separate totes.
July 9, 2010Cg Larvae - Vt trial 18:25 amneutral red staining of larvae from each chamber50 Vt colonies at 10^-34 pmended experiment. Sampled all remaining larvae from remaining chambers.T=20Csalinity = 31 pptpH <8
July 8, 2010Cg Larvae - Vt trial 17: 40 amstarted 6 hour Vt incubation. Inoculated new media ( 25 mL of 0.25% tryptone and seawater) with 100 uL of 24 hour Vt culture from 7/7. Placedculture on rocker in incubator (26C).Counted colonies from yesterday's Vt used for inoculating larvae. Counted colonies on both 10^-3 concentration plates - n=109 & 74.According to equation CFU/mL = # colonies * 1/0.1 * dilution this 183 * 10^6 CFU/mL. 431

8:10 amStarted neutral red incubation of 50 mL larvae + 50 uL 1% neutral red.
11 amEmptied, rinsed and replaced banjo filters in all chambers. Sampled larvae. There were very few larvae left in H so sampled all and now onlyhave 7 chambers for remaining part of trial.T: 23Csalinity: 30 pptpH: ~8
1:40 pmboiled 4 mL of Vt for 1 hour to heat kill. Made 5 serial dilutions: 1 mL Vt in 9 mL sterile water. Spread 2 plates each for last 3 dilutions - 10^-3,-4, and -5. Put in 25C incubator overnight.2:10 pmNeutral red microscopy: photographed and measured larvae from all 8 chambers.4 pmInoculated treatment chambers (A, B, D & E) and put algae (T. iso + Plya, 50 mL between 7 containers) in all chambers.
July 7, 2010Cg Larvae - Vt trial 1Temp: 21Csalinity: 31 pptpH: ~8
Repeated steps from 7/6 - neutral red, sampling, feeding, inoculating. Ciliates observed in larvae from E.
July 6, 2010Cg Larvae - Vt trial 110:45 amGot larvae from Taylor shellfish 7/5/10. Larvae were spawned 6/30.salinity 31 ppt, T 20C, pH <8. Water flow is on for one hour every other hour.11:20 amPut 50 mL of SW + larvae from each chamber into small glass vial and added 50 uL neutral red. Swirled gently and let sit 6 hours.4:00 pmEmptied and cleaned all larval chambers. Refilled with fresh SW. Sampled larvae for RNA (1 per chamber). Replaced all non-stopper chamberswith stoppered ones and replaced all banjo filters with clean ones. Fed larvae mix of T.iso and Plya (50 mL divided between 8 chambers).5-5:30 pmInoculated treatment chambers (A,B,D & E) with 100 uL heat-killed Vt (prepped by ED).Measured and assessed mortality of neutral red-dyed larvae from this am. Took 40 uL aliquots from each dyed sample and measured all larvaepositioned well for measuring. If n<10 in the 40 uL aliquot, did a 2nd or 3rd aliquot. Noticed ciliate in chambers B & D.
July 2, 2010Cg LarvaeEmptied and cleaned all larvae chambers. Sampled for RNA and microscopy as described below. Today was end of trial so cleaned out allchambers. Sizes recorded in spreadsheet. Live swimming larvae visible in all chambers except F.
June 30, 2010Cg Larvae
Emptied and cleaned all larvae chambers. Replaced the banjo filters with new, clean 70 micron filters. Took one sample from each chamber toput in RNAlater and then a few larvae for microscopy. Stored the RNA samples in 500 uL RNAlater. Refilled all chambers with fresh seawater.
Microscopy: Looked at all larvae under dissecting scope to assess if there were any still alive. All chambers except D & I had live larvaeswimming around. Put 50 uL from each sample on depression slide and photographed under compound scope + camera to measure withSPOT. Measured larvae from all chambers except D & F because there were no larve in the aliquot. The only larvae measured were ones witha dorsal or ventral view that were providing a view of a circle (posterior or anterior views did not provide clear measurements). Measurementswere taken along the longitudinal and latitudinal axes of the dorsal/ventral side of the larva.
June 28, 2010 432

Cg Larvaemade 1 L f/2 media for algae culture. See recipe 5/28.
Emptied and cleaned all larvae chambers. Sampled RNA larvae for gene expression (in 500 uL RNAlater) and microscopy. For microscopy, justtook samples from chambers A & F. Measured subset of these using microscope. Summary statistics (data are in spreadsheet CO2 Cg larvaesizes start 062310), measurements are in microns and letters indicate larval chamber:
mean A 100.4615385 91.23076923max A 107 101min A 87 78sd A 4.875369808 7.037445632n A 13mean F 101.25 96.75max F 112 109min F 84 83sd F 8.091802811 7.967262562n F 12
Under dissecting scope, larvae were observed swimming, although fewer were obviously active.
pH in treatment tank ~6, in control <8.
There appeared to be very few larvae left in chamber D but all chambers still had larvae.
Fed larvae Ply 429, 50 mL split between 8 chambers.
June 26, 2010Cg LarvaeDrained and rinsed larvae from all chambers. Took samples for gene expression analysis and stored in 500 uL RNAlater. Looked at larvae fromD & E under dissection microscope. Larvae are still alive and swimming vigorously. Chamber E seems to have many more larvae than theother chambers although good concentrations of larvae apparent in all chambers.Returned larvae to respective chambers and fed all chambers a mix of T.iso and Ply429 (50 mL between 8 chambers).
June 25, 2010Cg Larvae12:30 pmpH in treatment tank <7, pH in control ~8 (measured with litmus paper)Changed pump cycle to 1 hour on/one hour off.
2:00 pmPut mixture of T.iso & Ply 429 in all chambers (dived 50 mL between 8 chambers).
June 24, 2010Cg larvaeGot new larvae last night (6/23) from Taylor Shellfish. 5 day-old c. gigas. Put in chambers with new water around 5 pm with water flow and airbubbling. No co2 treatment.
Got new seawater from the aquarium today.
pH and pH probe: the pH probe is not properly calibrated to low pHs (it seems to be broken/missing a piece). It accurately measures the pH 7standard, but not the 4. It is indicating that the seawater is at pH<7. After testing with litmus paper, it seems that the SW is probably at a pH ofabout 7. Turned down the pH probe so that it was about 0.2 units below what it thinks the seawater is so that CO2 would bubble into thetreatment tank. There are now treatment and control chambers (same as before).
air: turned off air delivery to all chambers because the air flow was too strong.
water: put pumps on a timer so that they are on for one hour and off for 2. this is to make sure that the larval chambers do not overflow.
larvae sampling: filtered each larvae chamber on 64 micron mesh and rinsed in 2 buckets of water. Took sample for RNA analysis (0.5 mL
RNAlater) and subsampled from 4 chambers for microscopy. Replaced larvae in chambers after rinsing and sampling with new water. Rinsed 433
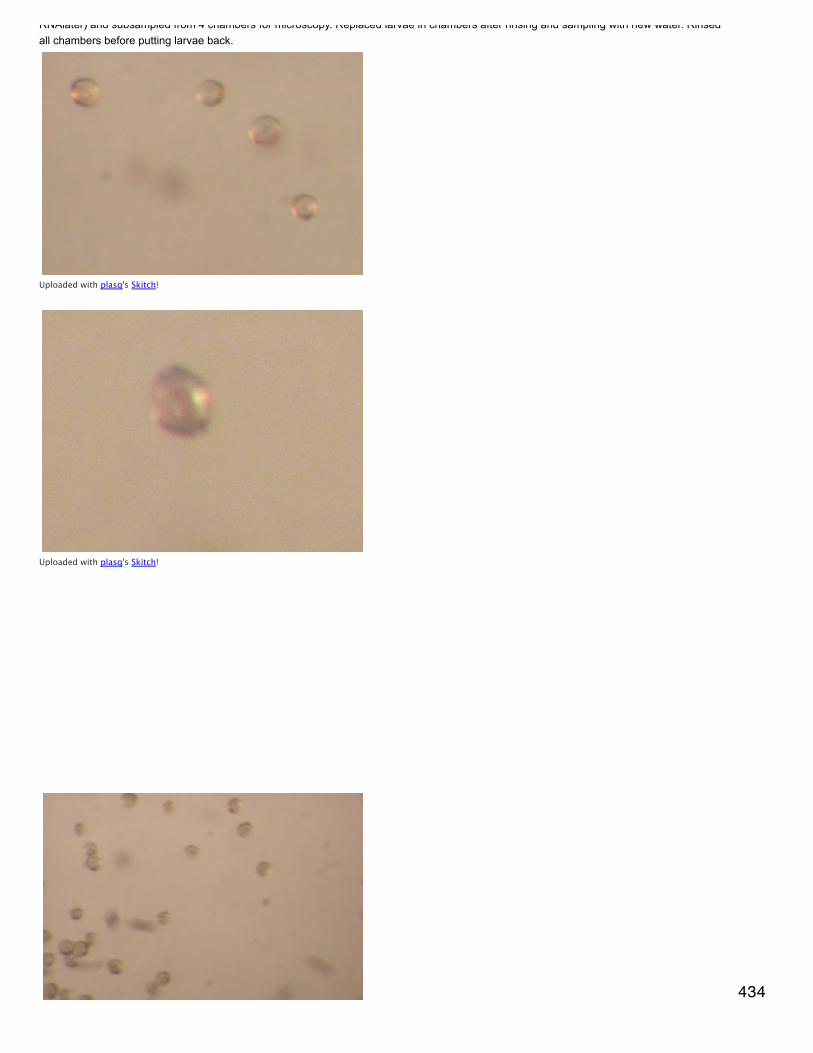
RNAlater) and subsampled from 4 chambers for microscopy. Replaced larvae in chambers after rinsing and sampling with new water. Rinsedall chambers before putting larvae back.
Uploaded with plasq's Skitch!
Uploaded with plasq's Skitch!
434

Uploaded with plasq's Skitch!
June 19, 2010Cg LarvaeEmptied and cleaned all larvae chambers. Took 1 sample from each chamber and stored in 0.5 mL RNAlater at 4C. pH for treatment was at7.5. Also took a few larvae to observe in microscopy (from screen). There seemed to be fewer larvae in each chamber.Microscopy: a number of larvae were still alive and swimming vigorously. Under the dissecting scope, I did not see any evidence of ciliates.Larvae were put back in proper containers. We are low on seawater so I switched the system to recirculation, meaning that there are no longertreatment and control groups.
Uploaded with plasq's Skitch!
June 18, 2010Cg Larvae6:20 pm, pH in treatment water 7.5. Treatment chambers are A, B, E, G. Controls are H, D, F, I.
Sampled 2 mL of water from each chamber. No larvae were apparent in any of the aliquots. Will filter out all chambers tomorrow andthoroughly assess state of larvae.
June 17, 2010Cg Larvae12:00 pm: lowered pH for water going to treatment chambers by about 0.4 pH units (to about 7.5).Made 900 mL F/2 media: 900 mL sterile seawater (from 5/28) 118.8 uL each Procul A & B (new bottles).Split algae cultures into new media: F/2 for T-iso and Ply429, F/2 + silicates for TW.
Cleaned all larvae in 2 washes seawater. While larvae on filter, removed >1000 and put in RNAlater for extraction. Took 2 samples from eachchamber, stored at 4C. Before larvae put back in chambers, rinsed thoroughly with dechlorinated water and refilled with fresh seawater. Putsome Ply429 in each of the chambers.At 8:00 pm the pH in the treatment water was down to about 7.3.In a number of the chambers with rubber stoppers (vs. resin) there were larvae stuck between the stopper and the side of the neck of thebottle.
June 16, 2010Cg Larvaeabout 8:30 pm. New larvae from Taylor (9 day-olds). ~89 larvae per mL in 1000 mL. Put 137.5 mL of larvae in each of 8 chambers - about12,237 in 1.5 L. Chambers were filled with fresh seawater and attached to water and air supplies.
June 11, 2010Larval Chamber set-upFiltered out and washed all larvae. Put aside in 1 L beaker with seawater.Looked for ciliates in samples of water from tote and from water barrel, but found none.Dismantled and washed all parts of larval chamber set-up. 435
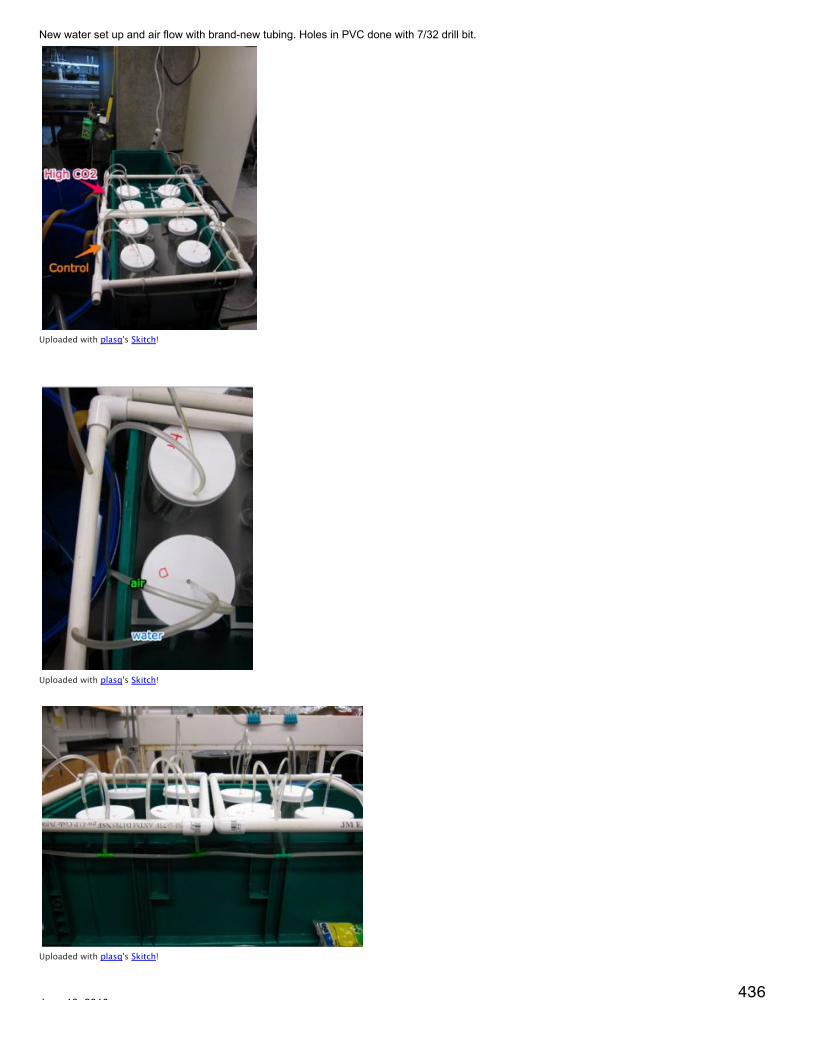
Dismantled and washed all parts of larval chamber set-up.New water set up and air flow with brand-new tubing. Holes in PVC done with 7/32 drill bit.
Uploaded with plasq's Skitch!
Uploaded with plasq's Skitch!
Uploaded with plasq's Skitch!
June 10, 2010436

June 10, 2010Cg LarvaeCounts per mL (based on 3 mL)A: 1B: 16H: 4F: 1E: 0I: 1G: 6When present, most larvae were alive and many were swimming (veligers). Almost all larvae in chamber G were dead and there was onelarger shell (2x size of others).
Uploaded with plasq's Skitch!
RNA ExtractionExtracted RNA from larvae collected 6.9.10. Spun down tubes of larvae + RNAlater (5000xg for 5 minutes) and used pipette to remove larvaefrom bottom of tube. Extracted with TRI following manufacturer's protocol. Resuspended pellets in 50 uL water. All samples except F hadvisible pellets of RNA. Analyzed concentrations of RNA on Nanodrop. Stored samples at -80. (Letters indicate which larval chamber samplewas taken from.)
Uploaded with plasq's Skitch!
Where did all the larvae go?Emptied chamber A onto a 48 micron screen to capture all larvae in water column. Placed in bath of seawater, removed stopper and rinsedlarvae stuck to stopper into petri dish. Rinsed & refilled A, replacing larvae on screen. Looked at stopper larvae under microscope and noticedthat there were a number of ciliates in with the larvae (some larvae were still alive, but the ciliates were viciously attacking them). Looked atsome of the algae from the hatchery under the scope but did not see ciliates.
437

Uploaded with plasq's Skitch!
Emptied all other chambers, one at a time, onto a screen. Rinsed them twice in seawater on the screen. Emptied chamber completely, rinsedwell, and refilled with fresh water. Replaced the water in the rest of the system as well. This process will need to be repeated daily to ensureexpulsion of all ciliates.
June 9, 2010Cg LarvaeCounted larvae in all chambers. Took 3 mL from each water column and counted # larvae per mL. Larvae were mostly alive and active exceptin chambers H & F where a large number were dead. Counts are in counts per mL, followed by average for the 3 mL and then estimated # perchamber.A: 21, 34, 52; avg. 35.7; total 53,500B: 41, 15, 63; avg. 39.7; total 59,500H: 10, 3, 12; avg. 8.3; total 12,500F: 23, 25, 22; avg. 23.3; total 35,000E: 0,0,1; avg. 0.3; total 450I: 1, 4 (only 1 alive), 0; avg. 1.7; total 2,500G: 22, 7, 25; avg. 18; total 27,000
Uploaded with plasq's Skitch!438
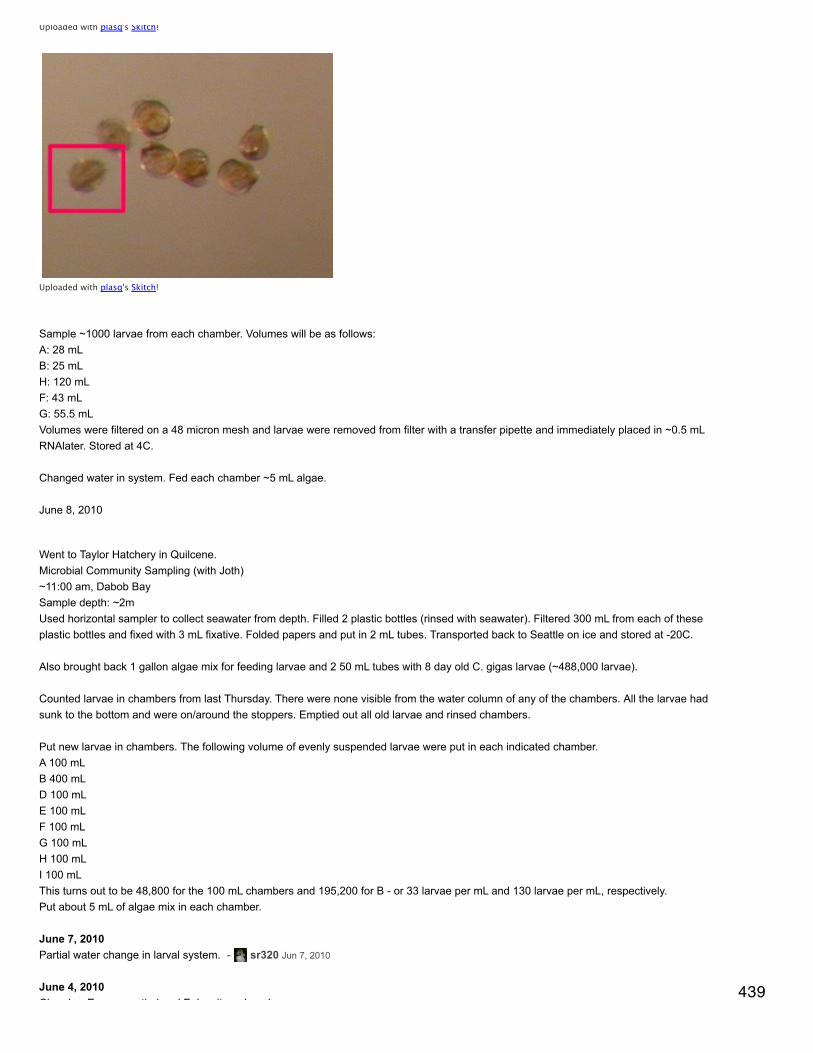
Uploaded with plasq's Skitch!
Uploaded with plasq's Skitch!
Sample ~1000 larvae from each chamber. Volumes will be as follows:A: 28 mLB: 25 mLH: 120 mLF: 43 mLG: 55.5 mLVolumes were filtered on a 48 micron mesh and larvae were removed from filter with a transfer pipette and immediately placed in ~0.5 mLRNAlater. Stored at 4C.
Changed water in system. Fed each chamber ~5 mL algae.
June 8, 2010
Went to Taylor Hatchery in Quilcene.Microbial Community Sampling (with Joth)~11:00 am, Dabob BaySample depth: ~2mUsed horizontal sampler to collect seawater from depth. Filled 2 plastic bottles (rinsed with seawater). Filtered 300 mL from each of theseplastic bottles and fixed with 3 mL fixative. Folded papers and put in 2 mL tubes. Transported back to Seattle on ice and stored at -20C.
Also brought back 1 gallon algae mix for feeding larvae and 2 50 mL tubes with 8 day old C. gigas larvae (~488,000 larvae).
Counted larvae in chambers from last Thursday. There were none visible from the water column of any of the chambers. All the larvae hadsunk to the bottom and were on/around the stoppers. Emptied out all old larvae and rinsed chambers.
Put new larvae in chambers. The following volume of evenly suspended larvae were put in each indicated chamber.A 100 mLB 400 mLD 100 mLE 100 mLF 100 mLG 100 mLH 100 mLI 100 mLThis turns out to be 48,800 for the 100 mL chambers and 195,200 for B - or 33 larvae per mL and 130 larvae per mL, respectively.Put about 5 mL of algae mix in each chamber.
June 7, 2010Partial water change in larval system. - sr320 Jun 7, 2010
June 4, 2010Chamber E was emptied and F density reduced.
439

Chamber E was emptied and F density reduced.Chambers A & B received 3 ml T-iso each (1 week old)Chambers C& H received 10 ml T-iso each (1 week old)Aquarium water postponed till next week.No feeding during weekend given supply. Will feed on Monday.Next week will also gear up for CO2 trials. Need to speak to Elene on how to preserve samples for pH measurements.- sr320 Jun 4, 2010
June 3, 2010Cg LarvaeNotes on FeedingPonis et al. 2003:in 2 L beakers (1.8 L seawater)D-hinge larvae at 5/mLfeed 3x per week (when change sw) with 10^5 algae cells/mL
Ponis et al. 2006in 2 L beakers 5 D-hinge larvae/mLfed every other day, 50 cells/uL first week then 100 cells/uL
Quantifying Algal cellsTook 20 uL from each algae culture flask. Looked at cells under scope - they were moving too rapidly to count accurately. Added ~45 uLLugol's Iodine to each 20 uL aliquot (will multiply counts by 2.25 to make up for the dilution). Average number of cells per uL from each flask,with x2.25 correction, are as follows (counted on a hemacytometer):A1. Ply 429 5/28 w/foil top: 2.25A2. Ply 429 6/1: 2.25A3. Ply 429 5/28 w/ cotton: 3B1. TW 5/28 w/ foil: 6.25B2. TW 5/28 w/ cotton: 2.25C1. T-iso 5/28 w/ foil: 218C2. T-iso 5/28 w/ cotton: 422C3. T-iso 6/1: 15
Aim to feed larvae 100 cells per uL of volume at which they are held. If feed equal amounts of each algae, will feed 33 cells/uL of eachcomponent. With 1.5 L (or 1.5 x 10^6 uL) in each chamber, need to feed ~4.95 x 10^7 cells of each algal component.Based on the cell counts above, the volumes from each of the flask to feed 4.95E7 cells would be:A1. 22 LA2. 22 LA3. 16.5 LB1. 7.9 LB2. 22 LC1. 227 mLC2. 117 mLC3. 3.3 L
Brent brought back new C. gigas larvae from Taylor Shellfish in Quilcene. They are indicated at being 10 days old and when observed undermicroscope appear to be early veliger stage. Poured larvae into 1 L beaker of seawater. Plunged to evenly suspend larvae and sampled 10mL. Counted 1 quadrant (1/4) of larvae in each mL (counts are estimates, not exact). The 10 1/4 counts are: 150, 60, 120, 50, 500, 50, 30, 45.This averages out to be about 380,400 larvae total or about 380 larvae per mL.There are 10 larvae per mL in chambers A & B.50 larvae per mL in chambers C & H.The remaining larvae (approximately 527 mL worth, or 100,197 larvae) were evenly distributed between chambers E & F. This works out to beabout 67 larvae per mL.All chambers are outfitted with air stones and new water delivered via drippers at 2 L/hour.
June 2, 2010Cg LarvaeReplaced pump in larval chamber set-up. Measured pump rate (without drippers) at 420 mL/minute.Turned all drippers in chambers the other way and they are no longer having clogging problems. Looks like they were upside down before.
May 29, 2010 440
Fed Mac's oysters (top & bottom tanks) ~9am.Changed water in larval tank. Counted 5 mL larvae from chambers A, B and C. There were no larvae until the last mL (corresponding to watertaken from the bottom of the chamber) for any of the samples. In A there were 32 larvae, 4 were alive and 2 were 2x the size of the others(dead). In B there were 8 larvae, 2 alive. In 7 there were 17 larvae, 1 alive.
Extracted RNA from larvae samples collected 5.25.10 with TRI reagent following manufacturer's protcol. Homogenized larvae (even when noneapparently visible) with pestle in TRI reagent.
May 27, 2010Algal starter culturesSterilized 2 L of seawater in glass bottles (just sterilization cycle in autoclave).Sterilized varied flasks & graduated cylinders for growing algae on full sterilization through exhaust cycle.
To make 1 L of pro-culture for algal starter cultures:Procul A & B = Kent Marine Pro-cultures A and B10 mL Procul A + 10 mL Procul B for 20 gallons of water1 L = 0.264 gallons0.264 gallons * (10 mL/20 gallons) = .132 mL = 132 uL of Procul A & B for 1 L seawater
Adding silicates:1 gallon Procul A + 1 gallon Procul B makes 7,680 gallons culture waterAdd silicates at 20 g per 1,000 gallons of culture water0.132 mL of Procul A + Procul B makes 38.425 gallons of culture waterNeed to add 0.7685 g of silicates
Sterilized all equipment needed to make culture media in germicidal hood for 15 minutes. Made 1 L of regular culture media (Procul A & B) and1 L of regular media + silicates. Media are made in sterile bottles, labeled, and at 4C (behind my bench).
May 26, 2010Cg LarvaeChanged water in system.Larvae counts for remaining chambers. Took 5 mL aliquots from each chamber, 1 mL in each well of 12-well plate. Counts are followed byobservationsA: 1 (dead), 3 (1 dead), 0, 38, 51For the wells containing n=38 and n=51 only a few larvae were swimming in each well. In the n=38 well, 2 larvae were twice the size as theothers (these 2 were alive, but not swimming so couldn't determine stage). All swimming larvae were veligers.
B: 1, 0, 0, 1 (swimming), 2 (1 swimming)veligers
C: 0, 0, 0, 0, 7At least one larva was alive. None were swimming.
May 25, 2010Cg LarvaeLarvae counts for chambers - took 2 aliquots of 1 mL each and counted larvae under dissecting scope.A: n=2 & 4B: n= 1 & 1C: n=1 & 0E: 0Z: 0All larvae were swimming actively (veliger).Noticed that there were what looked like larvae floating on the surface of the water and on the bottom of the holding tank. Took 1 mL aliquots ofsurface and bottom water. There were no larvae in the top sample but >50 from the bottom.Determined that larvae were escaping from Z & E. Filtered out all the water in these chambers through a 60 micron mesh and transferred to
RNAlater. Took chambers into lab for repairs.
May 24, 2010Cg Larvae: RNA & DNA ExtractionRNA extraction : Following manufacturer's protocol for TRI Reagent.DNA extraction: manufacturer's protocol (details below)
441
DNA extraction: manufacturer's protocol (details below)1. Upon separation of sample into aqueous (RNA), inter-, and phenol phases, remove aqueous phase for RNA extraction.2. Add 0.3 mL 100% EtOH to interphase + phenol phase and mix by inversion3. store at RT 2-3 minutes4. centrifuge 2000xg, 5 min, 4C5. remove supernatant6. wash DNA pellet 2 times. Each time wash with 1 mL 0.1 M trisodium citrate in 10% EtOH and store at RT for 30 minutes, periodically mixing.Centrifuge at 2000 xg for 5 min, 4-25C.7. Suspend in 1.5-2 mL 75% EtOH.8.store 10-20 min RT, mix9. centrifuge 2000 xg 5 minutes, 4-25 C10. remove EtOH and dry at RT11. dissolve pellet in 0.3-0.6 mL 8mM NaOH12. spin 12,000 xg 10 min13. Remove the supernatant = DNA
Reagents needed: 100% EtOH, 75% EtOH, 0.1 M trisodium citrate in 10% EtOH, 8 mM NaOHTo make 0.1 M trisodium citrate in 10% EtOH:2.941 g sodium citrate90 mL H2O10 mL 100% EtOH
The samples from 5.21.10 were the only ones with RNA and DNA pellets.
Uploaded with plasq's Skitch!
May 23, 2010Cg LarvaeChanged water in system.Sampled the following volumes (in mL) from the specified larval chambers -A & B: 5, 10, 20C & E: 1, 2, 4
Z: 0.5, 1, 2The volumes correspond to approximately n=50, 100, & 200 larvae, respectively.
Observations and counts of 1 mL of larvae from each of the larval chambers -A: n=9; actively swimming, veligersB: 0C: n=4; actively swimming, veligersE: 0Z: n=1; actively swimming, veligers
Spun down all samples at 1200 rpm for 5 min (20 C). Removed supernatant and stored at -80C.
May 22, 2010Cg LarvaeChanged water in system.
May 21, 2010Cg Larvae 442
Changed water in system. Joth brought in new larvae. Suspended in 1 L seawater, stirred well and aliquoted 1 mL 3 times into plate forcounting larvae. Drew quadrants on the bottom of the wells. Counted larvae in 2 quadrants for each of the three aliquots.Per quadrant counts:I: 40, 52, 66II: 70, 45, 90Per well counts (quadrant * 4):I: 160, 208, 284II: 280, 180, 360average number of larvae per mL = 245Total larvae = 245,000
Counts from chamber C (sampled 10 mL larvae + water): 180 larvae, 18 larvae/mL
For new larvae, want 2 chambers with 10 larvae/mL and 2 with 50 larvae/mL. 10 larvae per mL would = 15,000 larvae in the chamber (~1.5 L),which is 16.3 mL of the 245,000 larvae in 1 L. 50 larvae per mL would be 75,000 larvae per chamber, which is 81.5 mL of the 1 L. Afteraliquoting the larvae to their respective chambers, there is 804.4 mL of larvae + seawater left in the 1 L beaker. (Between each aliquot, plungedstrainer up & down in beaker to suspend larvae homogeneously.) This 804.4 mL is about 197,000 larvae, or about 131 larvae per mL. Larvalchambers with concentrations below:Chambers A & B: 10 larvae/mLChambers C & E: 50 larvae/mLChamber D: Elene's larvae (was chamber C)Foil-covered chamber (=chamber Z): 131 larvae/mLFrom chamber Z took 20 mL and 40 mL of larvae (this is about 26,000 and 52,000 larvae respectively). Spun down at 12000 rpm for 5 minutes(20C). Some larvae still in suspension after spinning down, but still removed most of seawater and froze remaining larvae at -80C.
May 19, 2010Cg LarvaeChanged water in system. Last night Elene put many new larvae in chamber C. Counts today yielded about 55 live larvae in 10 mL for chamberC and almost not larvae in chambers B & D. New larvae arriving tomorrow as well.Empty out chambers B & D. Prepare chambers A, B, & D for larvae tomorrow.
Sampling protocol for determining # of larvae needed to do usable RNA extraction.Every other day, sample 50, 100, and 200 larvae (10, 20, and 40 mL) from each chamber. Filter and preserve in RNAlater for RNA & DNAextraction.
May 18, 2010Cg LarvaeChanged water in system. Sampled 10mL from B and 9 mL from D.B 1/4D 1/4
May 18, 2010Cg LarvaeChanged water in system. Realized that pump for drip into chambers was not plugged in and so was not providing fresh water to chambers -plugged in pump. Sampled 10 mL from chambers B & D.B 7/26D 24/57
May 17, 2010Cg LarvaeChanged water in system. Sampled 10 mL from chambers B & D.B 5/20D 6/8
May 16, 2010Cg LarvaeChanged water in system. Sampled 10 mL from chambers B & D.B 9/18D 0
May 15, 2010 443
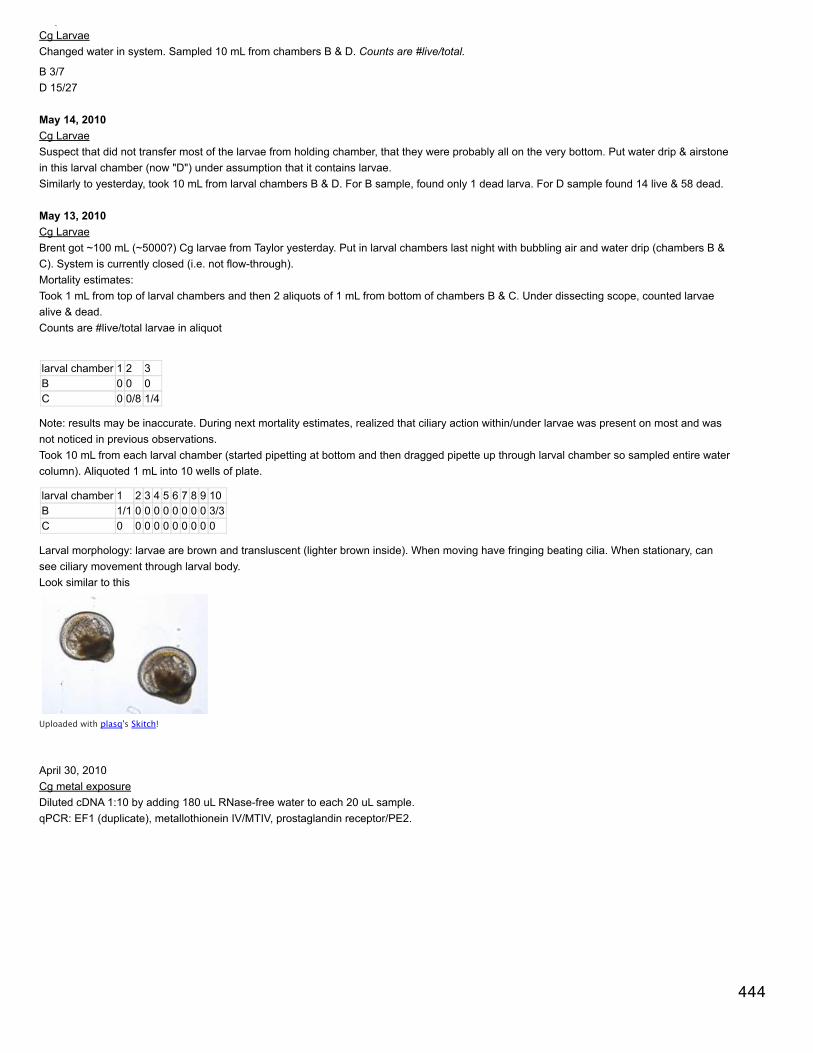
May 15, 2010Cg LarvaeChanged water in system. Sampled 10 mL from chambers B & D. Counts are #live/total.
B 3/7D 15/27
May 14, 2010Cg LarvaeSuspect that did not transfer most of the larvae from holding chamber, that they were probably all on the very bottom. Put water drip & airstonein this larval chamber (now "D") under assumption that it contains larvae.Similarly to yesterday, took 10 mL from larval chambers B & D. For B sample, found only 1 dead larva. For D sample found 14 live & 58 dead.
May 13, 2010Cg LarvaeBrent got ~100 mL (~5000?) Cg larvae from Taylor yesterday. Put in larval chambers last night with bubbling air and water drip (chambers B &C). System is currently closed (i.e. not flow-through).Mortality estimates:Took 1 mL from top of larval chambers and then 2 aliquots of 1 mL from bottom of chambers B & C. Under dissecting scope, counted larvaealive & dead.Counts are #live/total larvae in aliquot
larval chamber 1 2 3B 0 0 0C 0 0/8 1/4
Note: results may be inaccurate. During next mortality estimates, realized that ciliary action within/under larvae was present on most and wasnot noticed in previous observations.Took 10 mL from each larval chamber (started pipetting at bottom and then dragged pipette up through larval chamber so sampled entire watercolumn). Aliquoted 1 mL into 10 wells of plate.
larval chamber 1 2 3 4 5 6 7 8 9 10B 1/1 0 0 0 0 0 0 0 0 3/3C 0 0 0 0 0 0 0 0 0 0
Larval morphology: larvae are brown and transluscent (lighter brown inside). When moving have fringing beating cilia. When stationary, cansee ciliary movement through larval body.Look similar to this
Uploaded with plasq's Skitch!
April 30, 2010Cg metal exposureDiluted cDNA 1:10 by adding 180 uL RNase-free water to each 20 uL sample.qPCR: EF1 (duplicate), metallothionein IV/MTIV, prostaglandin receptor/PE2.
444

Uploaded with plasq's Skitch!
April 28, 2010Cg metal exposureDNase RNADefinite gDNA contamination in all RNA samples. DNase samples using Ambion's TURBO DNA-free rigorous protocol (see 3.18.10).
Uploaded with plasq's Skitch!
qPCR of DNased RNA with 18s primersExact same PCR as 4.27.10. See sheet below for plate layout & mix recipe.Carry-over (or is it some contamination?) very much reduced. Data not meant for publication, so not going to worry about it.RNA -> cDNAReverse transcription of DNased RNA following protocol 11.6.09.
April 27, 2010Cg metal exposureRNA ExtractionExtracted RNA from gill tissues from both trials. Tissue IDs for 4.21.10 end date are: Cu1, Cu2, Cu3, C1, C2, C3. Tissue IDs for 4.26.10 enddate are: Cu2.1, C2.1, C2.2, C2.3. RNA Extractions with Tri Reagent according to manufacturer's protocol. Resuspended in 50 uL RNAse-freeH2O, heated for 5 min at 55C to dissolve. Concentrations of RNA measured on Nanodrop for each of the samples.
Uploaded with plasq's Skitch!
RNA -> cDNA445

RNA -> cDNAMade cDNA from all RNA samples following protocol 11.6.09. Stored remaining RNA at -80 in C. gigas 2010 Box 1.plate layout:
1 2A Cu1 C2.2B Cu2 C2.3C Cu3D Cu2.1E C1F C2G C3H C2.1
Cu = copper trialC = control_2.# = 2nd trial
Uploaded with plasq's Skitch!
Well that was silly, I forgot to check for gDNA carry-over. Maybe I did a perfect extraction and I have clean RNA.qPCR of RNA with 18s primers
Uploaded with plasq's Skitch!
446
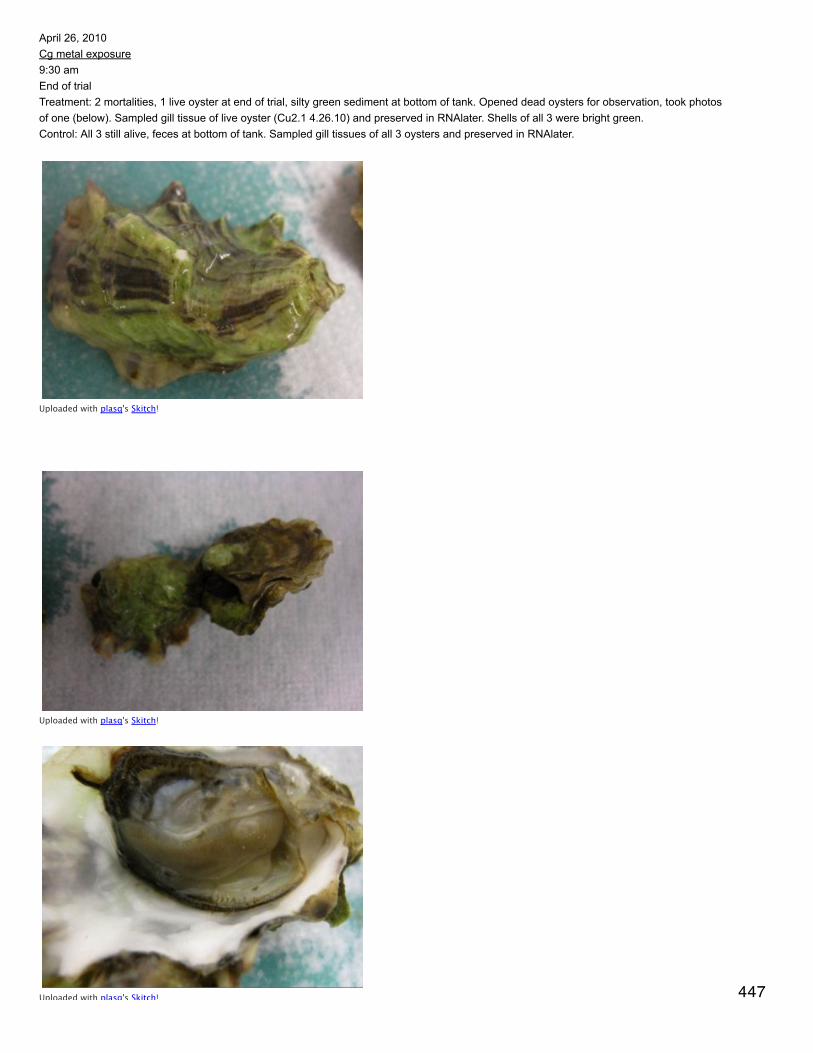
April 26, 2010Cg metal exposure9:30 amEnd of trialTreatment: 2 mortalities, 1 live oyster at end of trial, silty green sediment at bottom of tank. Opened dead oysters for observation, took photosof one (below). Sampled gill tissue of live oyster (Cu2.1 4.26.10) and preserved in RNAlater. Shells of all 3 were bright green.Control: All 3 still alive, feces at bottom of tank. Sampled gill tissues of all 3 oysters and preserved in RNAlater.
Uploaded with plasq's Skitch!
Uploaded with plasq's Skitch!
Uploaded with plasq's Skitch! 447

Uploaded with plasq's Skitch!
April 24, 2010Cg metal exposure11:30 amChanged water in both tanksTreatment: murky green sediment at bottom of tank (silty). 1 mortality (stored at -20). To new tank water, added 5 mL of 0.4 g CuN2O6dissolved in 20 mL sterile seawater. Also added 5 mL Shellfish Diet 1800.Control: Feces at bottom of tank. To new tank added 5 mL sterile seawater and shellfish diet. No mortalities.
April 23, 2010Cg metal exposure10:00 amTreatment: oysters still alive.
April 22, 2010Cg metal exposure10:40 amused juvenile Cg controls from previous experiment (n=7).Gave both treatment (n=4) and control (n=3) groups new seawater (1.5 L) and 5 mL Shellfish Diet 1800. Both tanks are aerated with air stones.Treatment: To tank added 5 mL of 0.4 g CuN2O6 dissolved in 20 mL sterile seawater.Control: Added 5 mL sterile seawater.
April 21, 2010Cg metal exposure3:00 pm: end of treatment.Treatment: Removed oysters from treatment tank. 3 more mortalities (n=3 for sampling). Stored morts at -20. Opened 3 others that appearedto be alive and sampled gill tissue (stored in ~1.5 mL RNAlater, 4C).Control: Removed 3 oysters from control tank. Renewed water (no food) for remaining 7 (live!) oysters. Sampled controls as above withpictures of dissection. Saved sacrificed oysters for further analysis and comparison with morts from treatment at -20.
Uploaded with plasq's Skitch!
448
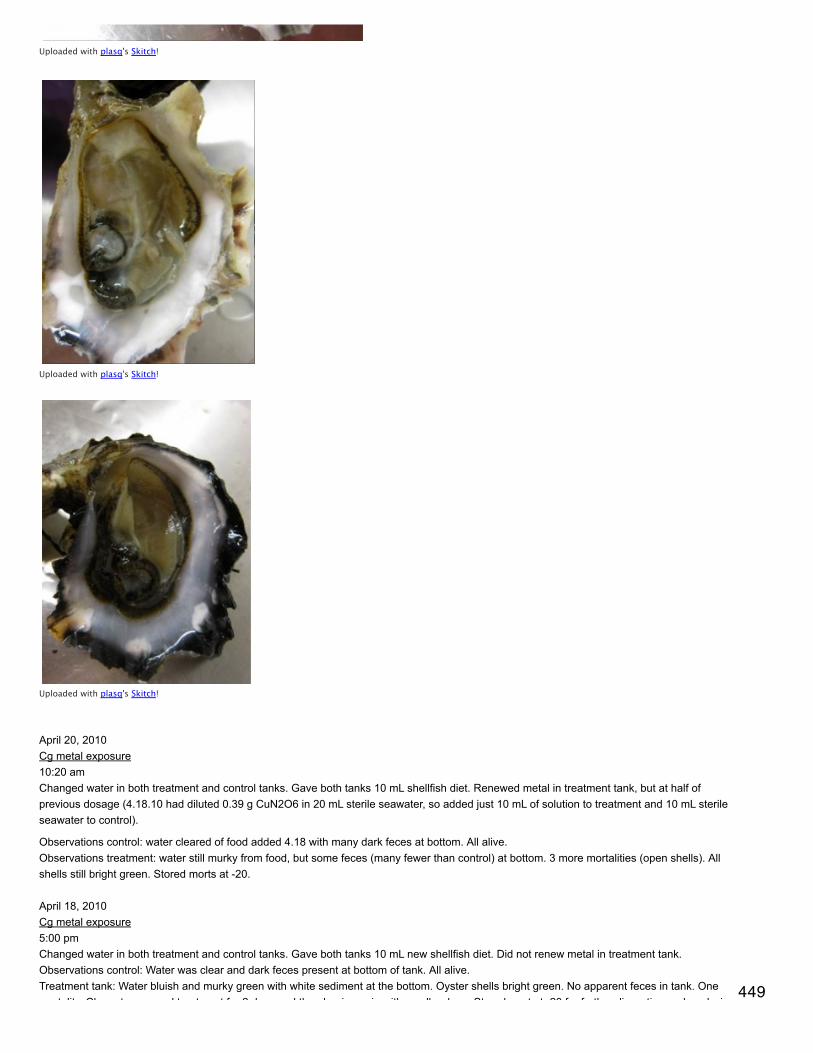
Uploaded with plasq's Skitch!
Uploaded with plasq's Skitch!
Uploaded with plasq's Skitch!
April 20, 2010Cg metal exposure10:20 amChanged water in both treatment and control tanks. Gave both tanks 10 mL shellfish diet. Renewed metal in treatment tank, but at half ofprevious dosage (4.18.10 had diluted 0.39 g CuN2O6 in 20 mL sterile seawater, so added just 10 mL of solution to treatment and 10 mL sterileseawater to control).
Observations control: water cleared of food added 4.18 with many dark feces at bottom. All alive.Observations treatment: water still murky from food, but some feces (many fewer than control) at bottom. 3 more mortalities (open shells). Allshells still bright green. Stored morts at -20.
April 18, 2010Cg metal exposure5:00 pmChanged water in both treatment and control tanks. Gave both tanks 10 mL new shellfish diet. Did not renew metal in treatment tank.Observations control: Water was clear and dark feces present at bottom of tank. All alive.Treatment tank: Water bluish and murky green with white sediment at the bottom. Oyster shells bright green. No apparent feces in tank. Onemortality. Chose to suspend treatment for 2 days and then begin again with smaller dose. Stored mort at -20 for further dissection and analysis.
449
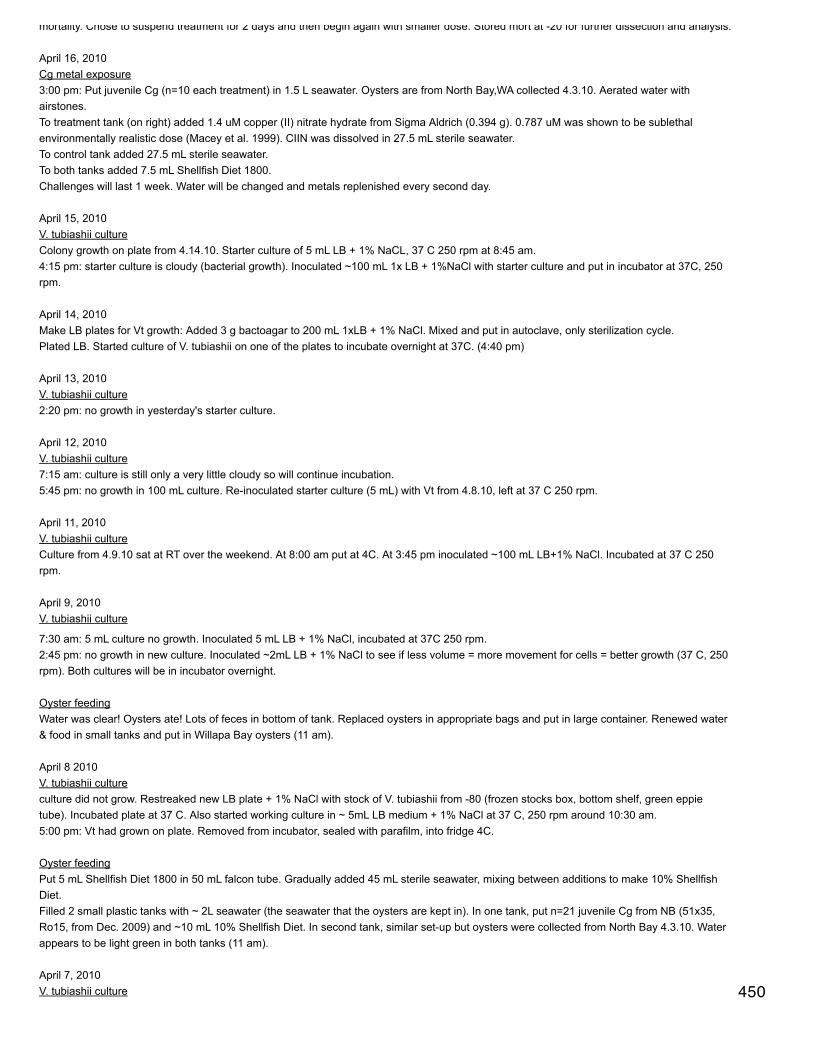
mortality. Chose to suspend treatment for 2 days and then begin again with smaller dose. Stored mort at -20 for further dissection and analysis.
April 16, 2010Cg metal exposure3:00 pm: Put juvenile Cg (n=10 each treatment) in 1.5 L seawater. Oysters are from North Bay,WA collected 4.3.10. Aerated water withairstones.To treatment tank (on right) added 1.4 uM copper (II) nitrate hydrate from Sigma Aldrich (0.394 g). 0.787 uM was shown to be sublethalenvironmentally realistic dose (Macey et al. 1999). CIIN was dissolved in 27.5 mL sterile seawater.To control tank added 27.5 mL sterile seawater.To both tanks added 7.5 mL Shellfish Diet 1800.Challenges will last 1 week. Water will be changed and metals replenished every second day.
April 15, 2010V. tubiashii cultureColony growth on plate from 4.14.10. Starter culture of 5 mL LB + 1% NaCL, 37 C 250 rpm at 8:45 am.4:15 pm: starter culture is cloudy (bacterial growth). Inoculated ~100 mL 1x LB + 1%NaCl with starter culture and put in incubator at 37C, 250rpm.
April 14, 2010Make LB plates for Vt growth: Added 3 g bactoagar to 200 mL 1xLB + 1% NaCl. Mixed and put in autoclave, only sterilization cycle.Plated LB. Started culture of V. tubiashii on one of the plates to incubate overnight at 37C. (4:40 pm)
April 13, 2010V. tubiashii culture2:20 pm: no growth in yesterday's starter culture.
April 12, 2010V. tubiashii culture7:15 am: culture is still only a very little cloudy so will continue incubation.5:45 pm: no growth in 100 mL culture. Re-inoculated starter culture (5 mL) with Vt from 4.8.10, left at 37 C 250 rpm.
April 11, 2010V. tubiashii cultureCulture from 4.9.10 sat at RT over the weekend. At 8:00 am put at 4C. At 3:45 pm inoculated ~100 mL LB+1% NaCl. Incubated at 37 C 250rpm.
April 9, 2010V. tubiashii culture
7:30 am: 5 mL culture no growth. Inoculated 5 mL LB + 1% NaCl, incubated at 37C 250 rpm.2:45 pm: no growth in new culture. Inoculated ~2mL LB + 1% NaCl to see if less volume = more movement for cells = better growth (37 C, 250rpm). Both cultures will be in incubator overnight.
Oyster feedingWater was clear! Oysters ate! Lots of feces in bottom of tank. Replaced oysters in appropriate bags and put in large container. Renewed water& food in small tanks and put in Willapa Bay oysters (11 am).
April 8 2010V. tubiashii cultureculture did not grow. Restreaked new LB plate + 1% NaCl with stock of V. tubiashii from -80 (frozen stocks box, bottom shelf, green eppietube). Incubated plate at 37 C. Also started working culture in ~ 5mL LB medium + 1% NaCl at 37 C, 250 rpm around 10:30 am.5:00 pm: Vt had grown on plate. Removed from incubator, sealed with parafilm, into fridge 4C.
Oyster feedingPut 5 mL Shellfish Diet 1800 in 50 mL falcon tube. Gradually added 45 mL sterile seawater, mixing between additions to make 10% ShellfishDiet.Filled 2 small plastic tanks with ~ 2L seawater (the seawater that the oysters are kept in). In one tank, put n=21 juvenile Cg from NB (51x35,Ro15, from Dec. 2009) and ~10 mL 10% Shellfish Diet. In second tank, similar set-up but oysters were collected from North Bay 4.3.10. Waterappears to be light green in both tanks (11 am).
April 7, 2010V. tubiashii culture 450

Made 200 mL 1x LB + 1% NaCl: 40 mL 5x LB lab stock, 160 mL nanopure H2O, 2 g NaCl. Autoclaved without exhaust/dry cycle.Swiped Vt from plate grown 3.12.10 with sterile wand and swirled in ~100 mL LB + NaCL in flask. Put in incubator, 37C, 250 rpm overnight.
April 6, 2010FISH 310Ran 10 uL PCR products from 4.5.10 on 1.5% agarose gel + 10 uL EtBr.
April 5, 2010Vt-exposed juvenile CgDetermined concentration of samples on Nanodrop.
Uploaded with plasq's Skitch!
Normalized cDNA concentrations to 68.6 ng/uL.qPCR of normalized cDNA for EF1.
451
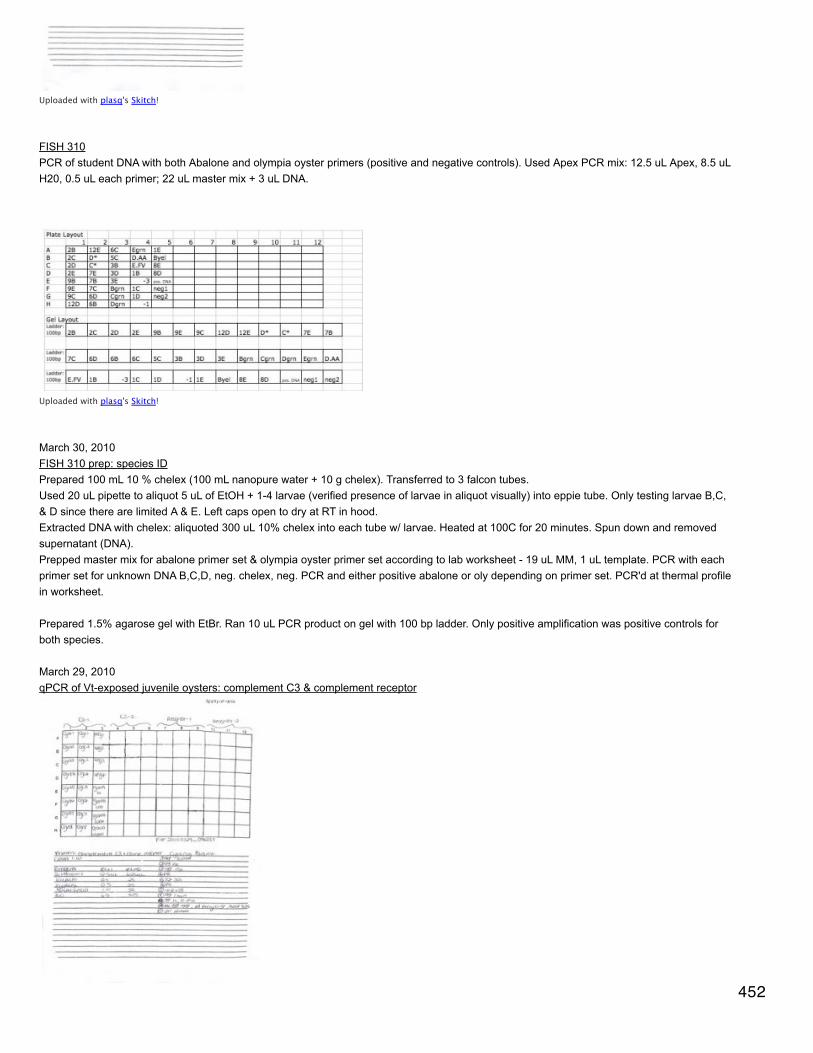
Uploaded with plasq's Skitch!
FISH 310PCR of student DNA with both Abalone and olympia oyster primers (positive and negative controls). Used Apex PCR mix: 12.5 uL Apex, 8.5 uLH20, 0.5 uL each primer; 22 uL master mix + 3 uL DNA.
Uploaded with plasq's Skitch!
March 30, 2010FISH 310 prep: species IDPrepared 100 mL 10 % chelex (100 mL nanopure water + 10 g chelex). Transferred to 3 falcon tubes.Used 20 uL pipette to aliquot 5 uL of EtOH + 1-4 larvae (verified presence of larvae in aliquot visually) into eppie tube. Only testing larvae B,C,& D since there are limited A & E. Left caps open to dry at RT in hood.Extracted DNA with chelex: aliquoted 300 uL 10% chelex into each tube w/ larvae. Heated at 100C for 20 minutes. Spun down and removedsupernatant (DNA).Prepped master mix for abalone primer set & olympia oyster primer set according to lab worksheet - 19 uL MM, 1 uL template. PCR with eachprimer set for unknown DNA B,C,D, neg. chelex, neg. PCR and either positive abalone or oly depending on primer set. PCR'd at thermal profilein worksheet.
Prepared 1.5% agarose gel with EtBr. Ran 10 uL PCR product on gel with 100 bp ladder. Only positive amplification was positive controls forboth species.
March 29, 2010qPCR of Vt-exposed juvenile oysters: complement C3 & complement receptor
Uploaded with plasq's Skitch!452
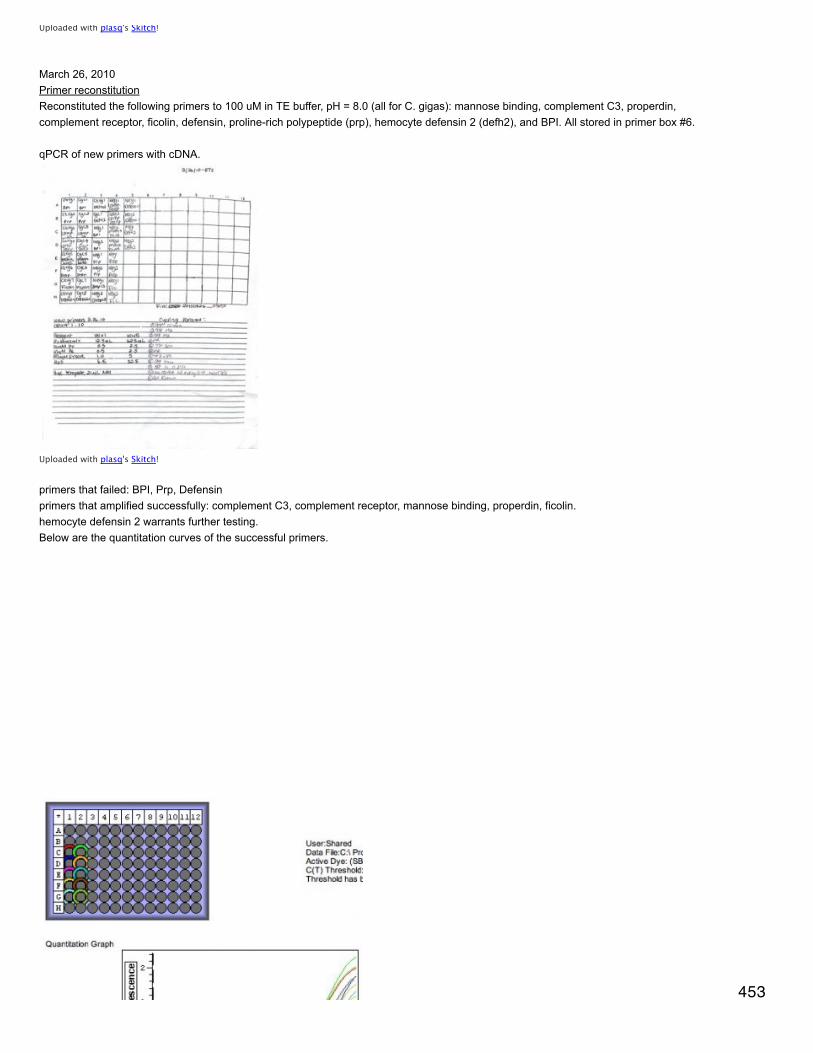
Uploaded with plasq's Skitch!
March 26, 2010Primer reconstitutionReconstituted the following primers to 100 uM in TE buffer, pH = 8.0 (all for C. gigas): mannose binding, complement C3, properdin,complement receptor, ficolin, defensin, proline-rich polypeptide (prp), hemocyte defensin 2 (defh2), and BPI. All stored in primer box #6.
qPCR of new primers with cDNA.
Uploaded with plasq's Skitch!
primers that failed: BPI, Prp, Defensinprimers that amplified successfully: complement C3, complement receptor, mannose binding, properdin, ficolin.hemocyte defensin 2 warrants further testing.Below are the quantitation curves of the successful primers.
453

Uploaded with plasq's Skitch!
March 25, 2010qPCR of Vt-exposed juvenile Cg: EF1 & prostaglandin receptor (PE2)
Uploaded with plasq's Skitch!
March 23, 2010qPCR of Vt-exposed juvenile Cg: IkB & IL-17
Uploaded with plasq's Skitch!
454

Uploaded with plasq's Skitch!
Note of caution: These are non-normalized expression values. Normalization to come...
March 22, 2010RNA -> cDNAFollowed reverse transcription protocol on 11.6.09.
qPCR of cDNA with Hsp70, IkB, and IL-17. Negative and positive (gDNA) controls.
Uploaded with plasq's Skitch!
Uploaded with plasq's Skitch!
455
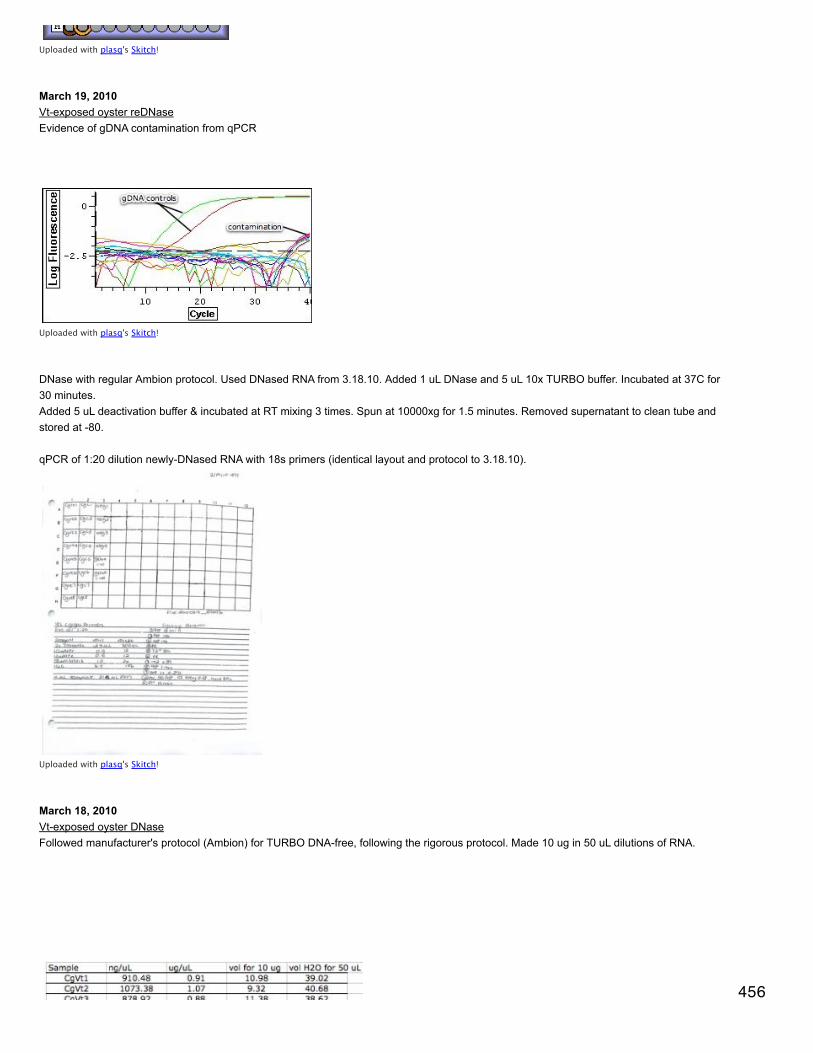
Uploaded with plasq's Skitch!
March 19, 2010Vt-exposed oyster reDNaseEvidence of gDNA contamination from qPCR
Uploaded with plasq's Skitch!
DNase with regular Ambion protocol. Used DNased RNA from 3.18.10. Added 1 uL DNase and 5 uL 10x TURBO buffer. Incubated at 37C for30 minutes.Added 5 uL deactivation buffer & incubated at RT mixing 3 times. Spun at 10000xg for 1.5 minutes. Removed supernatant to clean tube andstored at -80.
qPCR of 1:20 dilution newly-DNased RNA with 18s primers (identical layout and protocol to 3.18.10).
Uploaded with plasq's Skitch!
March 18, 2010Vt-exposed oyster DNaseFollowed manufacturer's protocol (Ambion) for TURBO DNA-free, following the rigorous protocol. Made 10 ug in 50 uL dilutions of RNA.
456
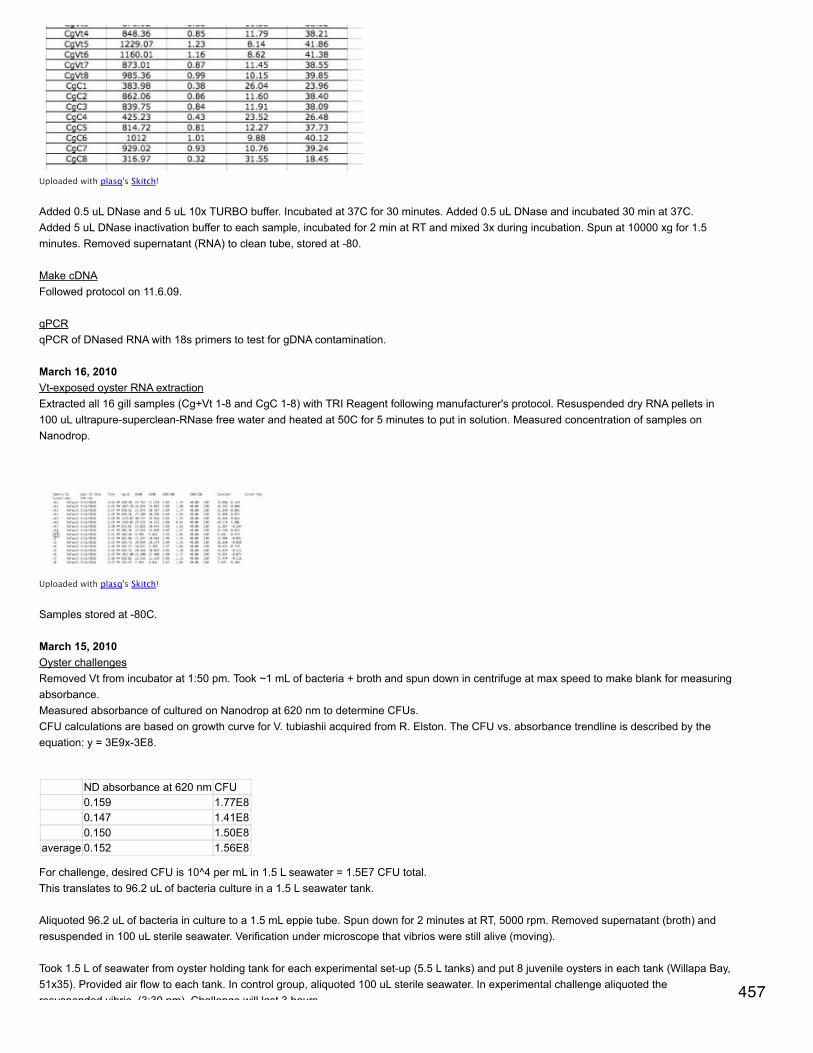
Uploaded with plasq's Skitch!
Added 0.5 uL DNase and 5 uL 10x TURBO buffer. Incubated at 37C for 30 minutes. Added 0.5 uL DNase and incubated 30 min at 37C.Added 5 uL DNase inactivation buffer to each sample, incubated for 2 min at RT and mixed 3x during incubation. Spun at 10000 xg for 1.5minutes. Removed supernatant (RNA) to clean tube, stored at -80.
Make cDNAFollowed protocol on 11.6.09.
qPCRqPCR of DNased RNA with 18s primers to test for gDNA contamination.
March 16, 2010Vt-exposed oyster RNA extractionExtracted all 16 gill samples (Cg+Vt 1-8 and CgC 1-8) with TRI Reagent following manufacturer's protocol. Resuspended dry RNA pellets in100 uL ultrapure-superclean-RNase free water and heated at 50C for 5 minutes to put in solution. Measured concentration of samples onNanodrop.
Uploaded with plasq's Skitch!
Samples stored at -80C.
March 15, 2010Oyster challengesRemoved Vt from incubator at 1:50 pm. Took ~1 mL of bacteria + broth and spun down in centrifuge at max speed to make blank for measuringabsorbance.Measured absorbance of cultured on Nanodrop at 620 nm to determine CFUs.CFU calculations are based on growth curve for V. tubiashii acquired from R. Elston. The CFU vs. absorbance trendline is described by theequation: y = 3E9x-3E8.
ND absorbance at 620 nm CFU0.159 1.77E80.147 1.41E80.150 1.50E8
average 0.152 1.56E8
For challenge, desired CFU is 10^4 per mL in 1.5 L seawater = 1.5E7 CFU total.This translates to 96.2 uL of bacteria culture in a 1.5 L seawater tank.
Aliquoted 96.2 uL of bacteria in culture to a 1.5 mL eppie tube. Spun down for 2 minutes at RT, 5000 rpm. Removed supernatant (broth) andresuspended in 100 uL sterile seawater. Verification under microscope that vibrios were still alive (moving).
Took 1.5 L of seawater from oyster holding tank for each experimental set-up (5.5 L tanks) and put 8 juvenile oysters in each tank (Willapa Bay,51x35). Provided air flow to each tank. In control group, aliquoted 100 uL sterile seawater. In experimental challenge aliquoted theresuspended vibrio. (3:30 pm). Challenge will last 3 hours. 457

resuspended vibrio. (3:30 pm). Challenge will last 3 hours.
6:30 pm. Brought experimental tanks of oysters into lab. Sampled gill tissue of all 16 oysters and put in labeled tubes of RNAlater. Sampled Vt-exposed oysters first. Between each oyster, all tools were sterilized first in 10% bleach and then in 95% EtOH + autoclaved sand. Oysters wereshucked with a shucker and gill tissue was removed with forceps and scissors. Sample tubes were topped off with RNAlater (each tubecontains 1+ mL RNAlater). Oyster shells seemed brittle and most oysters were pretty easy to open. After all samples were taken, tubes wereput at 4C overnight. Stored at -80C.
March 14, 2010V. tubiashii cultureIn hood, swiped bacteria from plate with sterile scraper and swirled in ~55 mL LB broth + 1% NaCl in Erlenmeyer flask. Covered with foil andput in incubator at 250 rpm, 37C at 10:45 am.
March 12, 2010V. tubiashii platingPre-made LB plate with 1% NaCl - incubate at RT for 15 minutes.Turn on UV light and blower in hood for 15 minutes.Vt stock from -80C freezer, kept on ice. Using sterile spreader, dipped spreader tip in frozen Vt and spread on plate. Incubate plate upsidedown at 37C until end of day (visible bacteria growth) and SW transferred to 4C.
February 16, 2010PCR of O. orca cDNACox2 did not amplify in the qPCR, but hsp6 amplified in all samples (same product size and only one product peak).Regular PCR of 3 samples (...) to verify amplicon size (primers were designed for hsp6 that amplifies at 523 bp in T. truncatus and at 350 bp ingray whale).template: 3 uL cDNA (1:10)
Reagent volx1 volx52xapex buffer 12.5 uL 62.5 uLH2O 8.5 42.5Pf 0.5 2.5Pr 0.5 2.5
February 15, 2010O. orca Reverse Transcription & qPCRFollowed RT protocol from 11.6.09, but used 10 uL of RNA and 6.75 uL of H2O with 0.5 uL oligo dTs. After final incubation, diluted entire cDNA1:10 in 225 uL of H2O (stored in eppie tubes at -20C).
for qPCR, used Cetacea consensus primers for cox2 and hsp6 (primer box #4, F8 & F9, G1 & G2). Made dilutions to 10 uM and preppedmaster mix.
February 10, 2010O. orca RNA: Bioanalyzer 2100Based on concentrations from nanodrop 2.9.10, made 10 uL dilutions of all RNA samples to 5 ng/uL in DEPC water.
Uploaded with plasq's Skitch!
Ran Pico chip on Agilent Bioanalyzer with herring RNA (sample 1) as control. In order, samples 2 through 11, ran RNA from L87, K13, L60,L57, L82, Luna, J19, L53, K27, L2. 458
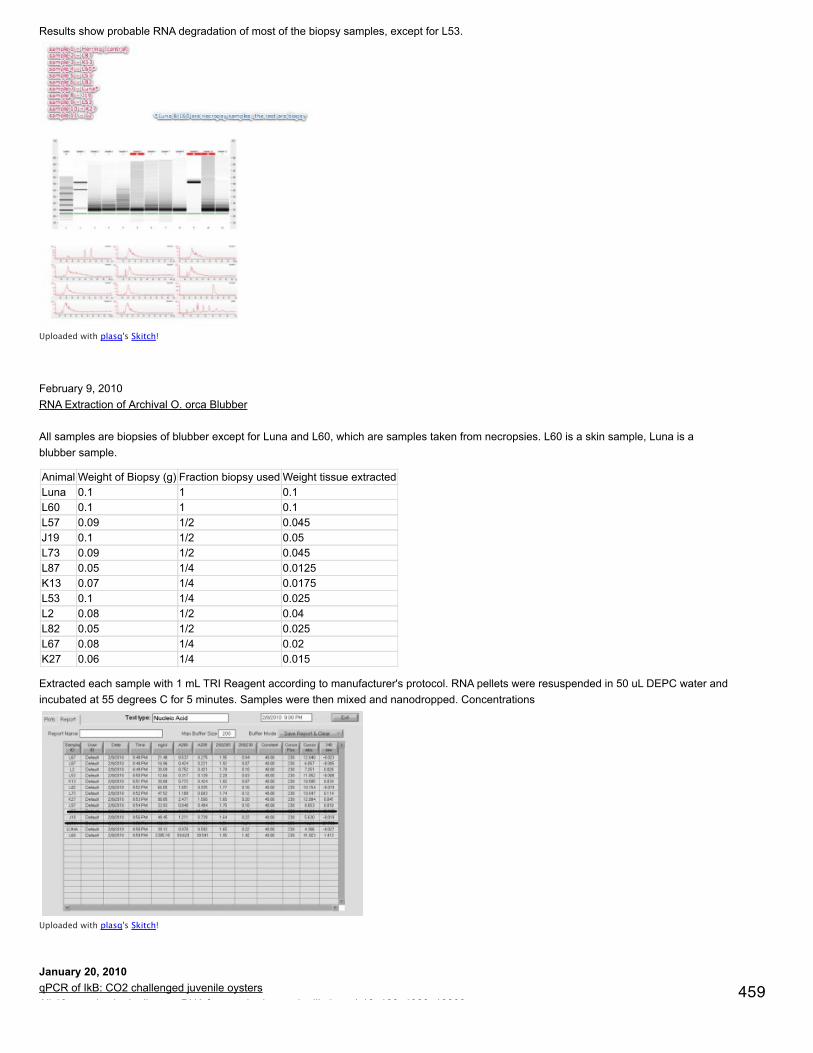
Results show probable RNA degradation of most of the biopsy samples, except for L53.
Uploaded with plasq's Skitch!
February 9, 2010RNA Extraction of Archival O. orca Blubber
All samples are biopsies of blubber except for Luna and L60, which are samples taken from necropsies. L60 is a skin sample, Luna is ablubber sample.
Animal Weight of Biopsy (g) Fraction biopsy used Weight tissue extractedLuna 0.1 1 0.1L60 0.1 1 0.1L57 0.09 1/2 0.045J19 0.1 1/2 0.05L73 0.09 1/2 0.045L87 0.05 1/4 0.0125K13 0.07 1/4 0.0175L53 0.1 1/4 0.025L2 0.08 1/2 0.04L82 0.05 1/2 0.025L67 0.08 1/4 0.02K27 0.06 1/4 0.015
Extracted each sample with 1 mL TRI Reagent according to manufacturer's protocol. RNA pellets were resuspended in 50 uL DEPC water andincubated at 55 degrees C for 5 minutes. Samples were then mixed and nanodropped. Concentrations
Uploaded with plasq's Skitch!
January 20, 2010qPCR of IkB: CO2 challenged juvenile oystersAll 16 samples in duplicate. gDNA for standard curve in dilutions 1:10, 100, 1000, 10000.
459

All 16 samples in duplicate. gDNA for standard curve in dilutions 1:10, 100, 1000, 10000.
Uploaded with plasq's Skitch!
January 19, 2010Primer test qPCRqPCR of new primer dilutions for matrilin, beta tubulin, and chaperonin. Included EF1 and Prx6 as controls. 2 samples with template and 4negative controls. Still evidence of contamination in the new primer dilutions and in EF1 (not Prx6). Discarded working stocks of EF1, matrilin,beta tub., and chaperonin.
Uploaded with plasq's Skitch!
Test qPCR of IkB (with Prx6 as positive control).
460
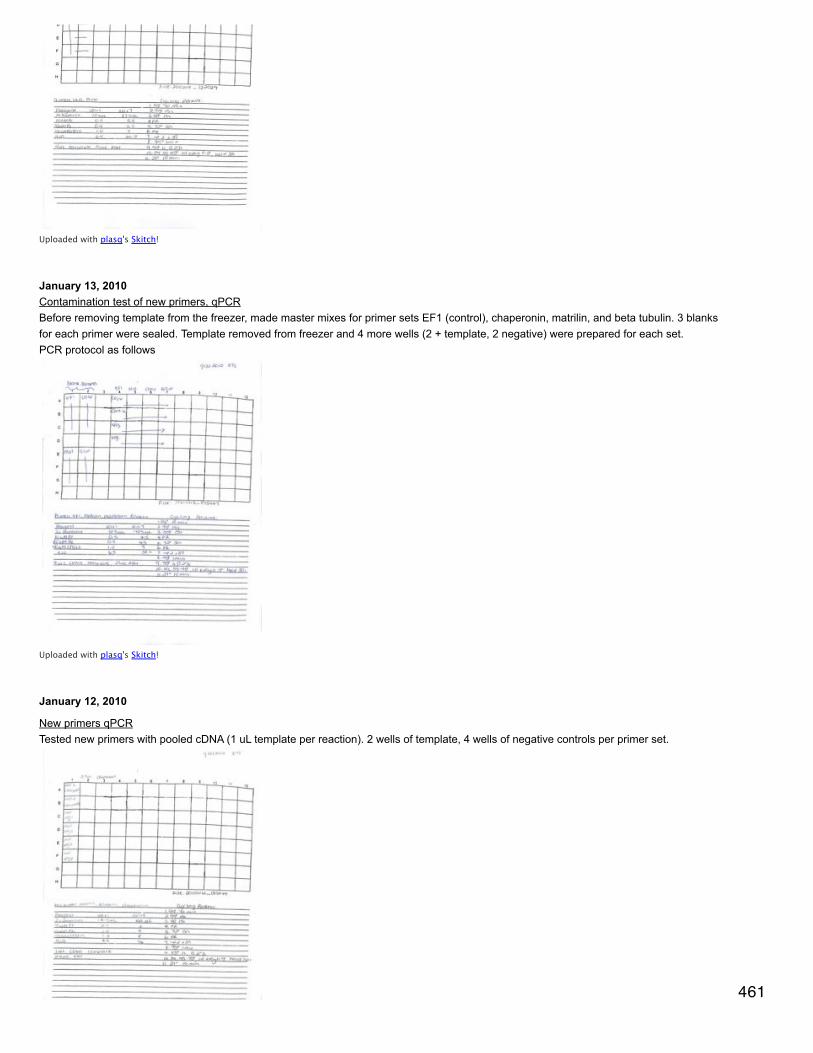
Uploaded with plasq's Skitch!
January 13, 2010Contamination test of new primers, qPCRBefore removing template from the freezer, made master mixes for primer sets EF1 (control), chaperonin, matrilin, and beta tubulin. 3 blanksfor each primer were sealed. Template removed from freezer and 4 more wells (2 + template, 2 negative) were prepared for each set.PCR protocol as follows
Uploaded with plasq's Skitch!
January 12, 2010
New primers qPCRTested new primers with pooled cDNA (1 uL template per reaction). 2 wells of template, 4 wells of negative controls per primer set.
461

Uploaded with plasq's Skitch!
Still evidence of contamination. Did another qPCR, new template and included Hsp70. Also included 2 wells in each primer column with just 25uL of water.
Uploaded with plasq's Skitch!
January 11, 2010New primersOrdered new primers for Cg, Beta tubulin, matrilin, and chaperonin.
Made pH 8.5 TE Buffer:1 mL Tris HCl 0.5M, pH = 6.80.1 mL 0.5 M EDTA48.9 mL nanopure H2OBrought pH up to 8.5 with 1N NaOH.
Reconstituted dried primers to 100 uM using volumes based on 10Xnm.
January 4, 2010Contamination checkStill evidence of contamination in PCR from 1.1.10. Ran PCR products on 1.5% agarose gel. Clear evidence of contamination for both primersets on gel as well.Did qPCR of blanks withe primers Hsp70, Prx6, chaperonin, and matrilin.
462

Uploaded with plasq's Skitch!
January 1, 2010qPCR optimization of matrilin and chaperonin primerstemperature gradient of 54-66 degrees C. Used leftover pooled cDNA from differential display as template. Protocol outlined here
Uploaded with plasq's Skitch!
.
December 31, 2009Contamination checkRegular PCR, no template. Primers: beta tubulin, matrilin, chaperonin, Hsp70, and Prx6. Each reaction is 25 uL.
Reagent volx1 volx52xApexBuffer 12.5 uL 62.5H2O 11.5 57.5Pf 0.5 2.5Pr 0.5 2.5
Ran PCR program CLNY under SBR menu on thermocycler. Plate layout below.
PCR with same primers, but added genomic DNA template (dilutions 1:100 and 1:1000). Used same master mix recipe, but 2 uL template perreaction and 9.5 uL water. Plate layout
Uploaded with plasq's Skitch!
Ran PCR products on 1.5% agarose gel + EtBr at 100 V for ~45 minutes.463
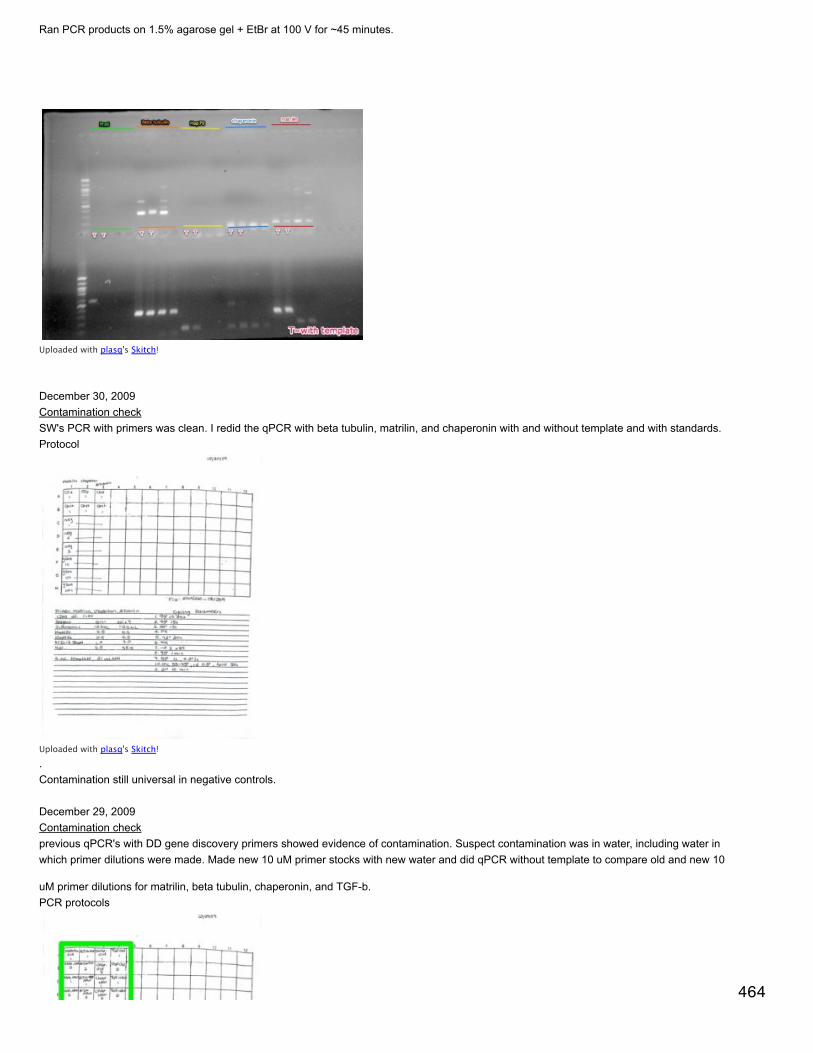
Ran PCR products on 1.5% agarose gel + EtBr at 100 V for ~45 minutes.
Uploaded with plasq's Skitch!
December 30, 2009Contamination checkSW's PCR with primers was clean. I redid the qPCR with beta tubulin, matrilin, and chaperonin with and without template and with standards.Protocol
Uploaded with plasq's Skitch!
.Contamination still universal in negative controls.
December 29, 2009Contamination checkprevious qPCR's with DD gene discovery primers showed evidence of contamination. Suspect contamination was in water, including water inwhich primer dilutions were made. Made new 10 uM primer stocks with new water and did qPCR without template to compare old and new 10
uM primer dilutions for matrilin, beta tubulin, chaperonin, and TGF-b.PCR protocols
464

Uploaded with plasq's Skitch!
Still evidence of contamination in the PCR. SW ran primers chaperonin, B tubulin, and matrilin with his master mix.
December 17, 2009qPCR with Gene Discovery Primers: CO2 challenged juvenile oystersDesigned primers based on DD products (sequenced clones). From BLAST, 4 putative genes were identified: Beta tubulin, TGF-b, matrilin, andchaperonin.qPCR of B-tub. and matrilin as outlined
Uploaded with plasq's Skitch!
.Used standard curve of gDNA (0.445 ng/uL) at dilutions 1:10, 1:100, 1:1000, and 1:10000. In ng: 0.178-0.000178.qPCR of chaperonin and TGF-b as outlined
465
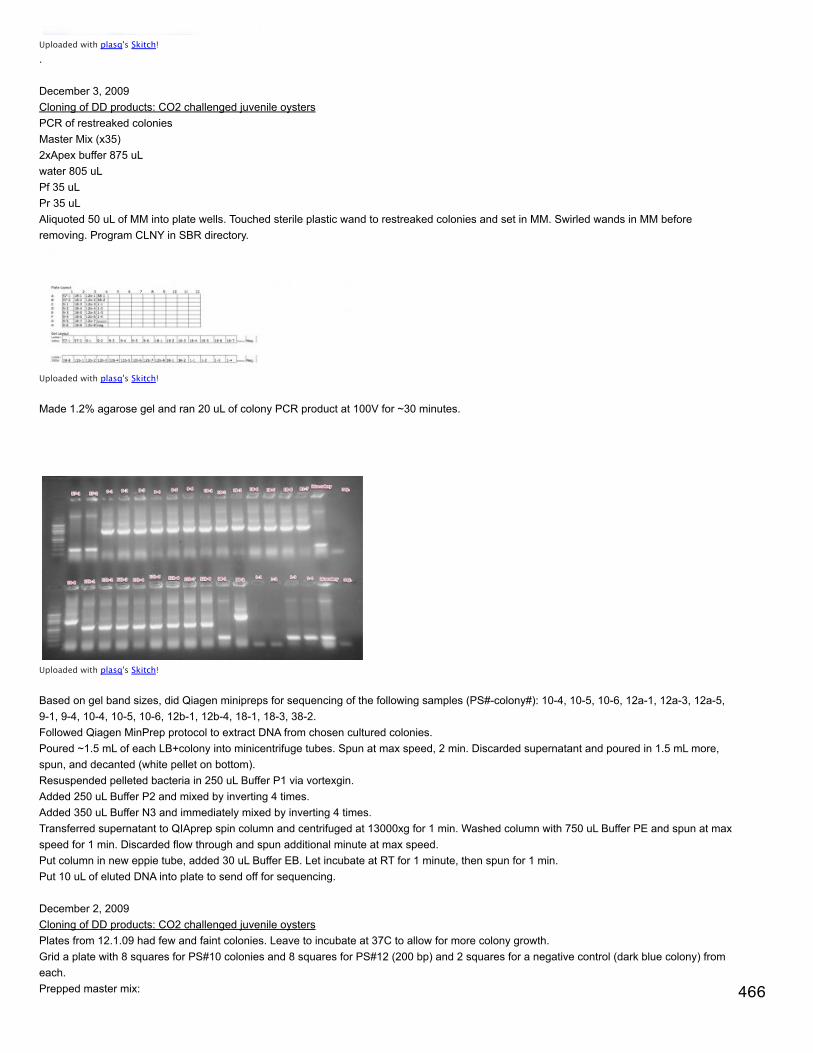
Uploaded with plasq's Skitch!
.
December 3, 2009Cloning of DD products: CO2 challenged juvenile oystersPCR of restreaked coloniesMaster Mix (x35)2xApex buffer 875 uLwater 805 uLPf 35 uLPr 35 uLAliquoted 50 uL of MM into plate wells. Touched sterile plastic wand to restreaked colonies and set in MM. Swirled wands in MM beforeremoving. Program CLNY in SBR directory.
Uploaded with plasq's Skitch!
Made 1.2% agarose gel and ran 20 uL of colony PCR product at 100V for ~30 minutes.
Uploaded with plasq's Skitch!
Based on gel band sizes, did Qiagen minipreps for sequencing of the following samples (PS#-colony#): 10-4, 10-5, 10-6, 12a-1, 12a-3, 12a-5,9-1, 9-4, 10-4, 10-5, 10-6, 12b-1, 12b-4, 18-1, 18-3, 38-2.Followed Qiagen MinPrep protocol to extract DNA from chosen cultured colonies.Poured ~1.5 mL of each LB+colony into minicentrifuge tubes. Spun at max speed, 2 min. Discarded supernatant and poured in 1.5 mL more,spun, and decanted (white pellet on bottom).Resuspended pelleted bacteria in 250 uL Buffer P1 via vortexgin.Added 250 uL Buffer P2 and mixed by inverting 4 times.Added 350 uL Buffer N3 and immediately mixed by inverting 4 times.Transferred supernatant to QIAprep spin column and centrifuged at 13000xg for 1 min. Washed column with 750 uL Buffer PE and spun at maxspeed for 1 min. Discarded flow through and spun additional minute at max speed.Put column in new eppie tube, added 30 uL Buffer EB. Let incubate at RT for 1 minute, then spun for 1 min.Put 10 uL of eluted DNA into plate to send off for sequencing.
December 2, 2009Cloning of DD products: CO2 challenged juvenile oystersPlates from 12.1.09 had few and faint colonies. Leave to incubate at 37C to allow for more colony growth.Grid a plate with 8 squares for PS#10 colonies and 8 squares for PS#12 (200 bp) and 2 squares for a negative control (dark blue colony) fromeach.Prepped master mix: 466
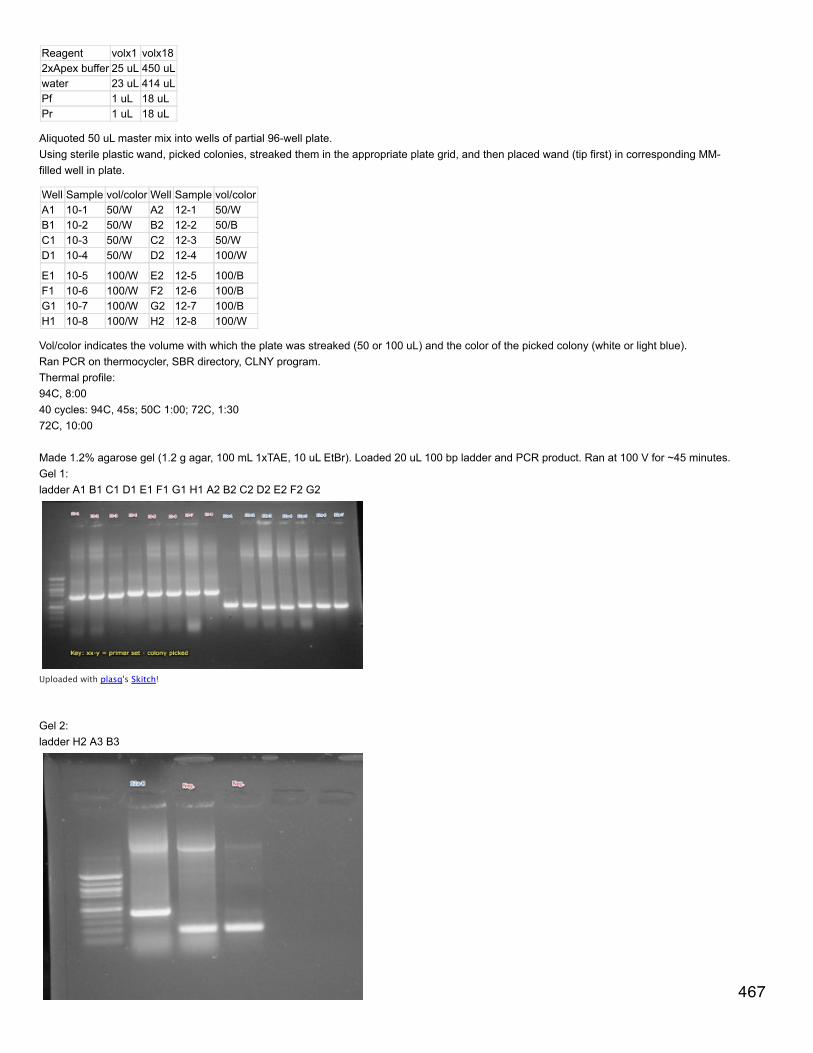
Reagent volx1 volx182xApex buffer 25 uL 450 uLwater 23 uL 414 uLPf 1 uL 18 uLPr 1 uL 18 uL
Aliquoted 50 uL master mix into wells of partial 96-well plate.Using sterile plastic wand, picked colonies, streaked them in the appropriate plate grid, and then placed wand (tip first) in corresponding MM-filled well in plate.
Well Sample vol/color Well Sample vol/colorA1 10-1 50/W A2 12-1 50/WB1 10-2 50/W B2 12-2 50/BC1 10-3 50/W C2 12-3 50/WD1 10-4 50/W D2 12-4 100/W
E1 10-5 100/W E2 12-5 100/BF1 10-6 100/W F2 12-6 100/BG1 10-7 100/W G2 12-7 100/BH1 10-8 100/W H2 12-8 100/W
Vol/color indicates the volume with which the plate was streaked (50 or 100 uL) and the color of the picked colony (white or light blue).Ran PCR on thermocycler, SBR directory, CLNY program.Thermal profile:94C, 8:0040 cycles: 94C, 45s; 50C 1:00; 72C, 1:3072C, 10:00
Made 1.2% agarose gel (1.2 g agar, 100 mL 1xTAE, 10 uL EtBr). Loaded 20 uL 100 bp ladder and PCR product. Ran at 100 V for ~45 minutes.Gel 1:ladder A1 B1 C1 D1 E1 F1 G1 H1 A2 B2 C2 D2 E2 F2 G2
Uploaded with plasq's Skitch!
Gel 2:ladder H2 A3 B3
467
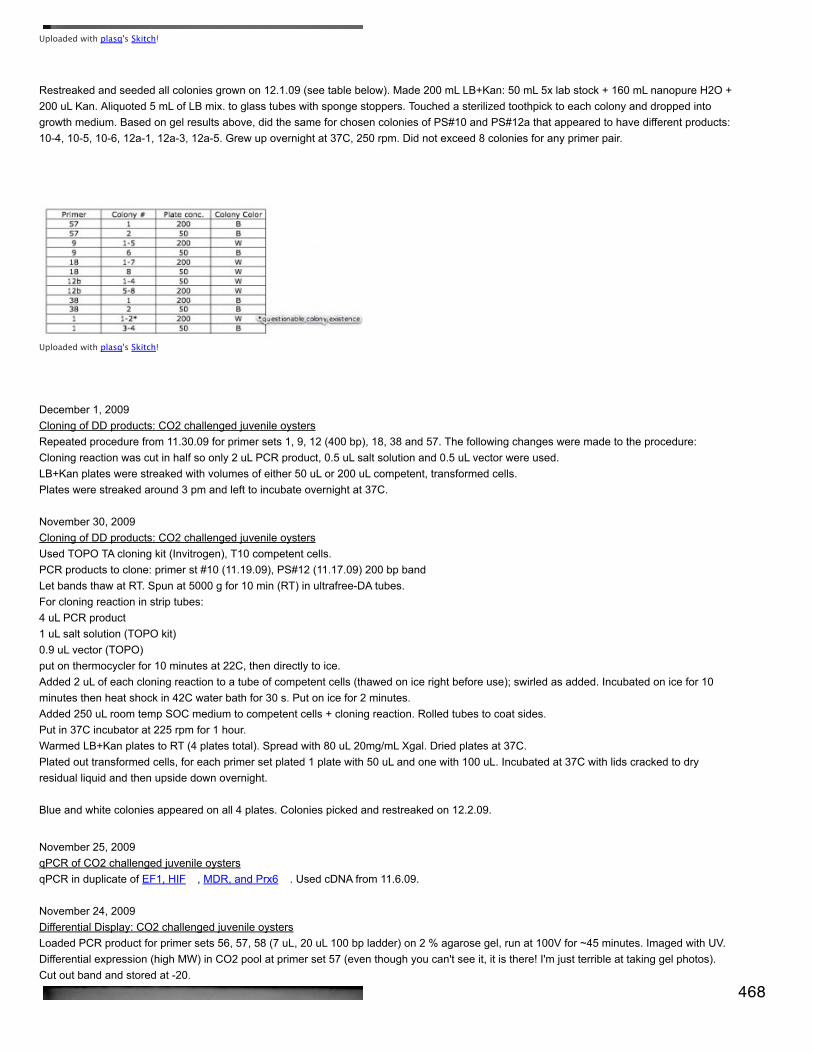
Uploaded with plasq's Skitch!
Restreaked and seeded all colonies grown on 12.1.09 (see table below). Made 200 mL LB+Kan: 50 mL 5x lab stock + 160 mL nanopure H2O +200 uL Kan. Aliquoted 5 mL of LB mix. to glass tubes with sponge stoppers. Touched a sterilized toothpick to each colony and dropped intogrowth medium. Based on gel results above, did the same for chosen colonies of PS#10 and PS#12a that appeared to have different products:10-4, 10-5, 10-6, 12a-1, 12a-3, 12a-5. Grew up overnight at 37C, 250 rpm. Did not exceed 8 colonies for any primer pair.
Uploaded with plasq's Skitch!
December 1, 2009Cloning of DD products: CO2 challenged juvenile oystersRepeated procedure from 11.30.09 for primer sets 1, 9, 12 (400 bp), 18, 38 and 57. The following changes were made to the procedure:Cloning reaction was cut in half so only 2 uL PCR product, 0.5 uL salt solution and 0.5 uL vector were used.LB+Kan plates were streaked with volumes of either 50 uL or 200 uL competent, transformed cells.Plates were streaked around 3 pm and left to incubate overnight at 37C.
November 30, 2009Cloning of DD products: CO2 challenged juvenile oystersUsed TOPO TA cloning kit (Invitrogen), T10 competent cells.PCR products to clone: primer st #10 (11.19.09), PS#12 (11.17.09) 200 bp bandLet bands thaw at RT. Spun at 5000 g for 10 min (RT) in ultrafree-DA tubes.For cloning reaction in strip tubes:4 uL PCR product1 uL salt solution (TOPO kit)0.9 uL vector (TOPO)put on thermocycler for 10 minutes at 22C, then directly to ice.Added 2 uL of each cloning reaction to a tube of competent cells (thawed on ice right before use); swirled as added. Incubated on ice for 10minutes then heat shock in 42C water bath for 30 s. Put on ice for 2 minutes.Added 250 uL room temp SOC medium to competent cells + cloning reaction. Rolled tubes to coat sides.Put in 37C incubator at 225 rpm for 1 hour.Warmed LB+Kan plates to RT (4 plates total). Spread with 80 uL 20mg/mL Xgal. Dried plates at 37C.Plated out transformed cells, for each primer set plated 1 plate with 50 uL and one with 100 uL. Incubated at 37C with lids cracked to dryresidual liquid and then upside down overnight.
Blue and white colonies appeared on all 4 plates. Colonies picked and restreaked on 12.2.09.
November 25, 2009qPCR of CO2 challenged juvenile oystersqPCR in duplicate of EF1, HIF , MDR, and Prx6 . Used cDNA from 11.6.09.
November 24, 2009Differential Display: CO2 challenged juvenile oystersLoaded PCR product for primer sets 56, 57, 58 (7 uL, 20 uL 100 bp ladder) on 2 % agarose gel, run at 100V for ~45 minutes. Imaged with UV.Differential expression (high MW) in CO2 pool at primer set 57 (even though you can't see it, it is there! I'm just terrible at taking gel photos).Cut out band and stored at -20.
468

Uploaded with plasq's Skitch!
Cloning of DD productsDiluted 100 mL 5xLB (lab stock) with 400 mL nanopure water in large flask. Added 7.5 g Bacto Agar. Put in autoclave (121C, 20 minutes).After autoclaving, let LB cool until flask is comfortable to touch for at least 30s. Added 500 uL Kanamycin (50 ug/mL). Swirled flask untilhomogenized. Poured LB+kan into sterile plates with lids until LB covered bottom. Let sit ~30 minutes til set. Stored in fridge.
November 23, 2009Differential Display: CO2 challenged juvenile oysters
Uploaded with plasq's Skitch!
Gene fishing (SeeGene) PCR with 3 new primer sets: 56, 57, 58. There are no new primer sets left so will have to use Sigma kit if to continuegene discovery.
November 20, 2009Differential Display: CO2 challenged juvenile oystersNew Gene fishing PCR with 7 new primers (same protocol as previously): 1, 16, 34, 35, 37, 39, 40.Plate layout:
A p1CO2 p1contB p16CO2 p16contC p34CO2 p34contD p35CO2 p35contE p37CO2 p37contF p39CO2 p39contG p40CO2 p40contH
- sr320 Nov 22, 2009 please start embedding images as this is the only way we can backup notebooks- thanks
2% gel with 100 mL 1xTAE, 2 g agar, 10 uL EtBr.Loaded 7 uL of each sample in order of primer pairs (1-40), control loaded first and CO2 loaded second.Differential display of high MW band in primer set #1 control (gene is downregulated in CO2 group). Cut out band and stored in 1.5 mL eppieat -20C.
469
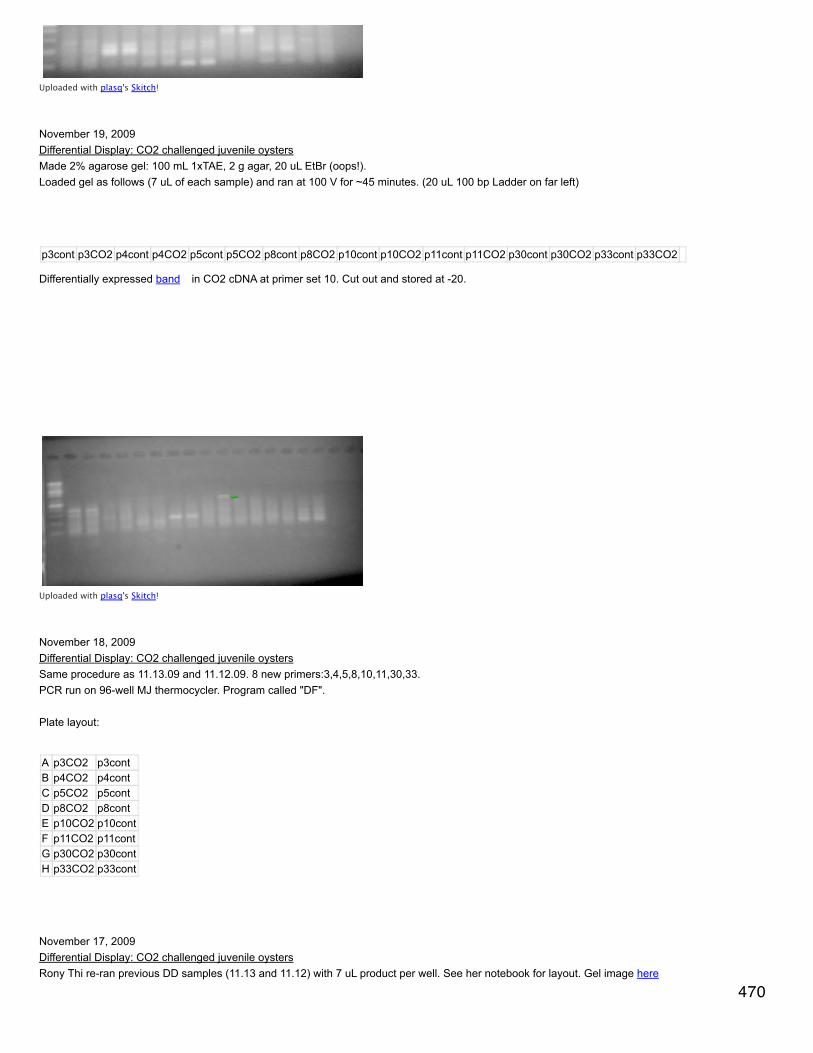
Uploaded with plasq's Skitch!
November 19, 2009Differential Display: CO2 challenged juvenile oystersMade 2% agarose gel: 100 mL 1xTAE, 2 g agar, 20 uL EtBr (oops!).Loaded gel as follows (7 uL of each sample) and ran at 100 V for ~45 minutes. (20 uL 100 bp Ladder on far left)
p3cont p3CO2 p4cont p4CO2 p5cont p5CO2 p8cont p8CO2 p10cont p10CO2 p11cont p11CO2 p30cont p30CO2 p33cont p33CO2
Differentially expressed band in CO2 cDNA at primer set 10. Cut out and stored at -20.
Uploaded with plasq's Skitch!
November 18, 2009Differential Display: CO2 challenged juvenile oystersSame procedure as 11.13.09 and 11.12.09. 8 new primers:3,4,5,8,10,11,30,33.PCR run on 96-well MJ thermocycler. Program called "DF".
Plate layout:
A p3CO2 p3contB p4CO2 p4contC p5CO2 p5contD p8CO2 p8contE p10CO2 p10contF p11CO2 p11contG p30CO2 p30contH p33CO2 p33cont
November 17, 2009Differential Display: CO2 challenged juvenile oystersRony Thi re-ran previous DD samples (11.13 and 11.12) with 7 uL product per well. See her notebook for layout. Gel image here
470
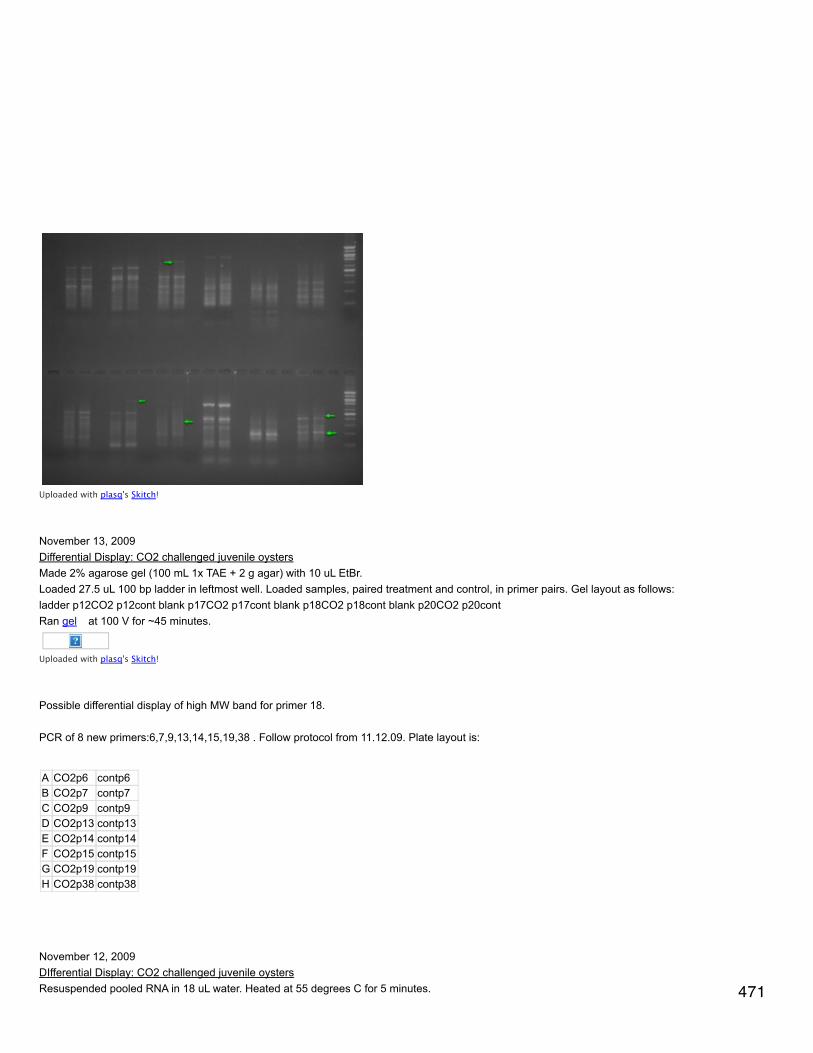
Uploaded with plasq's Skitch!
November 13, 2009Differential Display: CO2 challenged juvenile oystersMade 2% agarose gel (100 mL 1x TAE + 2 g agar) with 10 uL EtBr.Loaded 27.5 uL 100 bp ladder in leftmost well. Loaded samples, paired treatment and control, in primer pairs. Gel layout as follows:ladder p12CO2 p12cont blank p17CO2 p17cont blank p18CO2 p18cont blank p20CO2 p20contRan gel at 100 V for ~45 minutes.
Uploaded with plasq's Skitch!
Possible differential display of high MW band for primer 18.
PCR of 8 new primers:6,7,9,13,14,15,19,38 . Follow protocol from 11.12.09. Plate layout is:
A CO2p6 contp6B CO2p7 contp7C CO2p9 contp9D CO2p13 contp13E CO2p14 contp14F CO2p15 contp15G CO2p19 contp19H CO2p38 contp38
November 12, 2009DIfferential Display: CO2 challenged juvenile oystersResuspended pooled RNA in 18 uL water. Heated at 55 degrees C for 5 minutes. 471

'Speced pooled RNA on Nanodrop. Pool 1 was measured at 169.0, 170,3 and 172.3 ng/uL for an average of 170.53 ng/uL (3.08 ug) and Pool 2was 26 ng/uL.Repeat pooling and RNA precipitation for Pool 2. Resuspend in 9.5 uL DEPC H2O. Concentration on Nanodrop measured at 737.9 ng/uL and745.4 ng/uL (average of 741.65 ng/uL, or .74165 ug/uL).Following manufacturer's protocol for SeeGene GeneFishing, need up to 3 ug pooled RNA per reaction, no more than 7.5 uL. 7.5 uL of Pool 1is 1.3 ug. 1.3 ug of Pool 2 is 1.75 uL.RT reaction for Pool1:7.5 uL RNA + 2 uL 10 uM dT-ACP1.RT reaction for Pool2: 1.75 uL RNA + 2 uL 10 uM dT-ACP1 + 5.75 uL waterIncubated tubes at 80 degrees for 3 minutes then to ice for 2 minutes. Added to each tube: 4 uL RT 5x MMLV buffer, 4 uL 2.5 mM dNTPs, 1.5uL water, 1 uL reverse transcriptase. Incubated on thermocycler 42 degrees for 90 minutes then 94 degrees for 2 minutes. Chilled for 2 minuteson ice and added 80 uL water to each tube. Vortexed to mix.
For PCR, added reagents to wells of plate (8 wells) according to following:3 uL cDNA2 uL 5mM arbitrary primer1 uL 10 uM dT-ACP24 uL distilled water10 uL SeeAmp 2x master mixPlate layout as follows:
A p12-CO2B p17-CO2C p18-CO2D p20-CO2E p12-contF p17-contG p18-contH p20-cont
Placed on preheated (94C) thermocycler and started program: 94C 5 min; 50C 3 min; 72C 1 min; 40 cycles 94C 40s, 65C 40s, 72C 40s; 72C 5min.
Stored finished PCR at -20 (and leftover cDNA).
November 11, 2009Differential Display: CO2 challenged juvenile oystersThe following protocol basically follows Sigma's Differential Display manufacturer's protocol.I. Nanodrop RNA samples (these samples are the 2x DNased)Spec (2 sheets ) each sample (of 16) 3 times, average concentration for final concentration. Base subsequent calculations on this finalconcentration.Pooling samples: Amount of RNA per pooled sample cannot exceed 8 ug or 18 uL. To determine amount of each sample that will go in to pool,set up equation in Excel so that as sample with smallest concentration's volume was increased, all other sample volumes wouldcommensurately increase as well. Since total volumes ended up being larger than 18 uL, need to precipitate RNA and resuspend inappropriate volume.Pool 1 (CO2 challenged)Pool 2 (controls)
RNA Precipitation:To each pool of RNA, add 0.1 volume 5 M ammonium acetate (9.36 for Pool 1 and 7.63 for Pool 2). Added 2 volumes 100% EtOH (205.9 uLand 167.88 uL, respectively) to each pooled RNA. Mixed well and incubated at -80 for 30 minutes.Spin tube max speed (16,000xg) at 4 C for 30 minutes.Discard supernatant and quick spin tubes to remove residual EtOH.Add 1 mL 70% EtOH; flick to get pellet off bottom of tube.Spin at max speed, 4C for 10 minutes. Discard supernatant.Remove residual EtOH. Stored at -80.
November 9, 2009RT qPCR of CO2 challenged oyster cDNA 472

RT qPCR of CO2 challenged oyster cDNARepeated qPCR of previously amplified HIF and MDR, in duplicate, to ensure consistency of results. Master mix and cycling parameters forPCR detailed here .
November 6, 2009Reverse Transcription of CO2 challenged oyster RNA (take 2)Adapted protocol for MMLV Reverse Transcription. Reactions are 25 uL, approximately 1 ug total RNA per reaction.Added 1 uL from each sample, CO2 challenged (n=8) and control (n=8), to well in partial PCR plate. To each sample, added 16.75 uL ultra-clean water and 0.5 uL Oligo dT primers. Heated samples at 70 degrees C for 5 minutes (main directory on thermocycler, 75FOR5).Transferred samples immediately to ice for <10 minutes.Prepared master mix (for 17 reactions):
Reagentvolx1 volx175x MMLV Buffer 5 uL 85 uL10 mM dNTPs 1.25 uL 21.25 uLM-MLV RT 0.5 uL 8.5 uL
Mixed well and added 6.75 uL to each RNA sample. Mixed, spun down and incubated at 42 degrees for 1 hour followed by 3 minutesdeactivation at 95 degrees C (REVTINC).
RT-qPCRDiluted cDNA 1:10 by putting entire cDNA reaction sample in 225 uL of pure H2O (eppie tubes, stored at -20). Prepared master mix and didqPCR at EF1 and Prx6 in duplicate according to here .
November 3, 2009RT-qPCR on Vibrio & CO2 challenged oyster cDNAPCR on genes MTIV, hsp70, Prx6, and HIF1a.
November 2, 2009RT-qPCR on Vibrio & CO2 challenged oyster cDNASame as 10/29/2009 but with new primers MDR, SOD, and AURKA. No positive control. See here for layout, etc.
October 29, 2009RT-qPCR on Vibrio & CO2 challenged oyster cDNA
Did RT-qPCR on all 16 gigas samples for genes elongation factor 1, Interleukin 17 Isoform D, and Cytochrome P450.Working stock primers were all prepared fresh: 90 uL H2O + 10 uL 100 uM stock to make 10 uM solution. Positive control C. gigas cDNA wasprovided by SW. Experimental cDNA samples were brought up to 80 uL (1:4 dilution) with 60 uL H2O. Master mix and PCR performedaccording to here .
October 28, 2009Vibrio & CO2 challenged oysters: test for contaminationgDNA contamination apparent in all samples and blank controls. Made new 10 uM stock 18s gigas primers and got new aliquot of PCR water.Ran PCR of blanks and positive controls to ensure no contamination according (here ) .Results: blanks were clean, gDNA controls amplified as expected.
qPCR of 2xDNased 1:20 dilutions from 10/27/09 as seen here .
gDNA contamination gone from samples (proper amplification of positive controls, empty negative controls). Performed reverse transcription onRNA samples (undiluted 2xDNased).Transferred 5 uL of each sample into strip tube. Incubated at 75 degrees C for 5 minutes. Transferred to ice for 5+ minutes.Prepared master mix (x18):72 uL 5x AMV RT buffer144 uL 10 mM dNTP mix18 uL AMV RTranscriptase18 uL Oligo dT Primer18 uL RNase free waterAliquot 15 uL of master mix into each sample well. Incubated for 10 minutes at RT. Incubated at 37 degrees for 1 hour then at 95 degrees for 3minutes. Store at -20.
October 27, 2009473
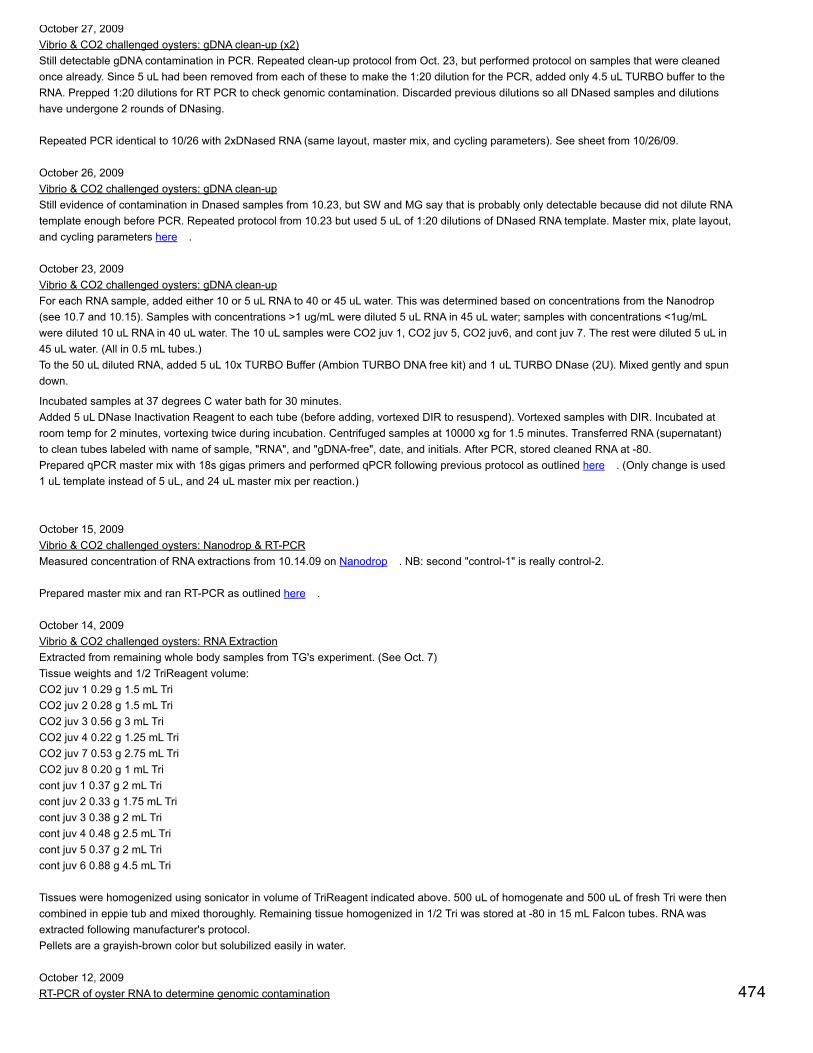
October 27, 2009Vibrio & CO2 challenged oysters: gDNA clean-up (x2)Still detectable gDNA contamination in PCR. Repeated clean-up protocol from Oct. 23, but performed protocol on samples that were cleanedonce already. Since 5 uL had been removed from each of these to make the 1:20 dilution for the PCR, added only 4.5 uL TURBO buffer to theRNA. Prepped 1:20 dilutions for RT PCR to check genomic contamination. Discarded previous dilutions so all DNased samples and dilutionshave undergone 2 rounds of DNasing.
Repeated PCR identical to 10/26 with 2xDNased RNA (same layout, master mix, and cycling parameters). See sheet from 10/26/09.
October 26, 2009Vibrio & CO2 challenged oysters: gDNA clean-upStill evidence of contamination in Dnased samples from 10.23, but SW and MG say that is probably only detectable because did not dilute RNAtemplate enough before PCR. Repeated protocol from 10.23 but used 5 uL of 1:20 dilutions of DNased RNA template. Master mix, plate layout,and cycling parameters here .
October 23, 2009Vibrio & CO2 challenged oysters: gDNA clean-upFor each RNA sample, added either 10 or 5 uL RNA to 40 or 45 uL water. This was determined based on concentrations from the Nanodrop(see 10.7 and 10.15). Samples with concentrations >1 ug/mL were diluted 5 uL RNA in 45 uL water; samples with concentrations <1ug/mLwere diluted 10 uL RNA in 40 uL water. The 10 uL samples were CO2 juv 1, CO2 juv 5, CO2 juv6, and cont juv 7. The rest were diluted 5 uL in45 uL water. (All in 0.5 mL tubes.)To the 50 uL diluted RNA, added 5 uL 10x TURBO Buffer (Ambion TURBO DNA free kit) and 1 uL TURBO DNase (2U). Mixed gently and spundown.
Incubated samples at 37 degrees C water bath for 30 minutes.Added 5 uL DNase Inactivation Reagent to each tube (before adding, vortexed DIR to resuspend). Vortexed samples with DIR. Incubated atroom temp for 2 minutes, vortexing twice during incubation. Centrifuged samples at 10000 xg for 1.5 minutes. Transferred RNA (supernatant)to clean tubes labeled with name of sample, "RNA", and "gDNA-free", date, and initials. After PCR, stored cleaned RNA at -80.Prepared qPCR master mix with 18s gigas primers and performed qPCR following previous protocol as outlined here . (Only change is used1 uL template instead of 5 uL, and 24 uL master mix per reaction.)
October 15, 2009Vibrio & CO2 challenged oysters: Nanodrop & RT-PCRMeasured concentration of RNA extractions from 10.14.09 on Nanodrop . NB: second "control-1" is really control-2.
Prepared master mix and ran RT-PCR as outlined here .
October 14, 2009Vibrio & CO2 challenged oysters: RNA ExtractionExtracted from remaining whole body samples from TG's experiment. (See Oct. 7)Tissue weights and 1/2 TriReagent volume:CO2 juv 1 0.29 g 1.5 mL TriCO2 juv 2 0.28 g 1.5 mL TriCO2 juv 3 0.56 g 3 mL TriCO2 juv 4 0.22 g 1.25 mL TriCO2 juv 7 0.53 g 2.75 mL TriCO2 juv 8 0.20 g 1 mL Tricont juv 1 0.37 g 2 mL Tricont juv 2 0.33 g 1.75 mL Tricont juv 3 0.38 g 2 mL Tricont juv 4 0.48 g 2.5 mL Tricont juv 5 0.37 g 2 mL Tricont juv 6 0.88 g 4.5 mL Tri
Tissues were homogenized using sonicator in volume of TriReagent indicated above. 500 uL of homogenate and 500 uL of fresh Tri were thencombined in eppie tub and mixed thoroughly. Remaining tissue homogenized in 1/2 Tri was stored at -80 in 15 mL Falcon tubes. RNA wasextracted following manufacturer's protocol.Pellets are a grayish-brown color but solubilized easily in water.
October 12, 2009RT-PCR of oyster RNA to determine genomic contamination 474
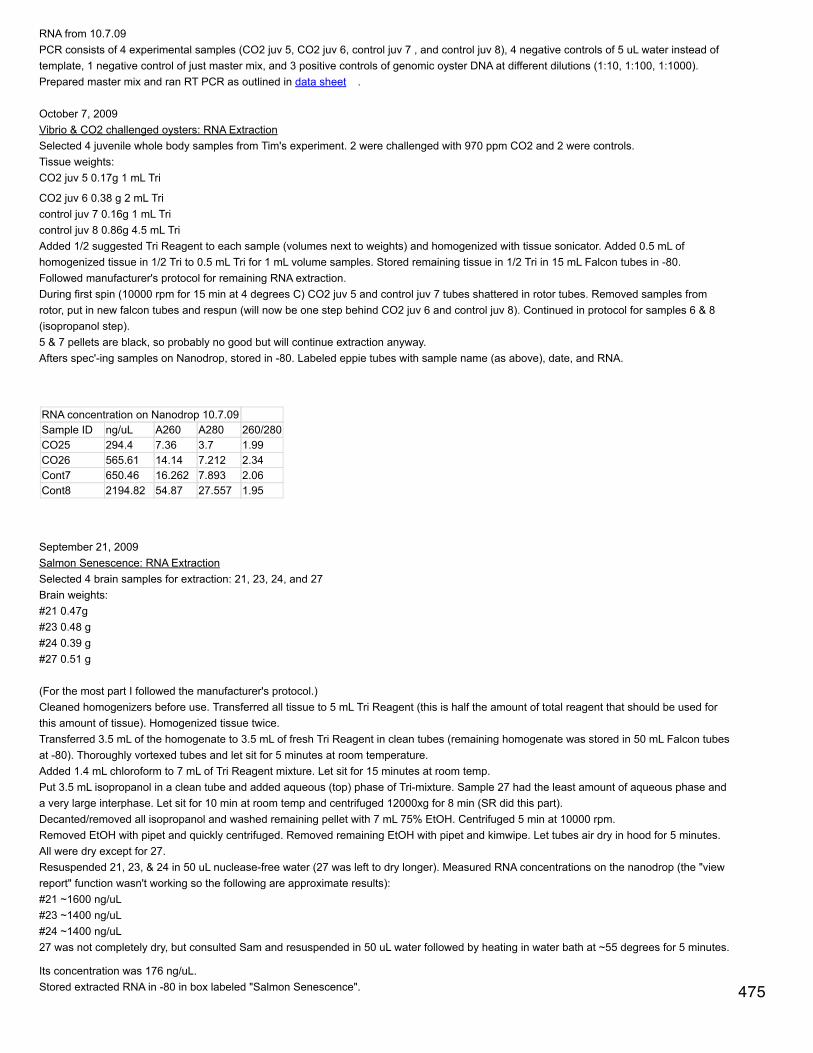
RNA from 10.7.09PCR consists of 4 experimental samples (CO2 juv 5, CO2 juv 6, control juv 7 , and control juv 8), 4 negative controls of 5 uL water instead oftemplate, 1 negative control of just master mix, and 3 positive controls of genomic oyster DNA at different dilutions (1:10, 1:100, 1:1000).Prepared master mix and ran RT PCR as outlined in data sheet .
October 7, 2009Vibrio & CO2 challenged oysters: RNA ExtractionSelected 4 juvenile whole body samples from Tim's experiment. 2 were challenged with 970 ppm CO2 and 2 were controls.Tissue weights:CO2 juv 5 0.17g 1 mL Tri
CO2 juv 6 0.38 g 2 mL Tricontrol juv 7 0.16g 1 mL Tricontrol juv 8 0.86g 4.5 mL TriAdded 1/2 suggested Tri Reagent to each sample (volumes next to weights) and homogenized with tissue sonicator. Added 0.5 mL ofhomogenized tissue in 1/2 Tri to 0.5 mL Tri for 1 mL volume samples. Stored remaining tissue in 1/2 Tri in 15 mL Falcon tubes in -80.Followed manufacturer's protocol for remaining RNA extraction.During first spin (10000 rpm for 15 min at 4 degrees C) CO2 juv 5 and control juv 7 tubes shattered in rotor tubes. Removed samples fromrotor, put in new falcon tubes and respun (will now be one step behind CO2 juv 6 and control juv 8). Continued in protocol for samples 6 & 8(isopropanol step).5 & 7 pellets are black, so probably no good but will continue extraction anyway.Afters spec'-ing samples on Nanodrop, stored in -80. Labeled eppie tubes with sample name (as above), date, and RNA.
RNA concentration on Nanodrop 10.7.09Sample ID ng/uL A260 A280 260/280CO25 294.4 7.36 3.7 1.99CO26 565.61 14.14 7.212 2.34Cont7 650.46 16.262 7.893 2.06Cont8 2194.82 54.87 27.557 1.95
September 21, 2009Salmon Senescence: RNA ExtractionSelected 4 brain samples for extraction: 21, 23, 24, and 27Brain weights:#21 0.47g#23 0.48 g#24 0.39 g#27 0.51 g
(For the most part I followed the manufacturer's protocol.)Cleaned homogenizers before use. Transferred all tissue to 5 mL Tri Reagent (this is half the amount of total reagent that should be used forthis amount of tissue). Homogenized tissue twice.Transferred 3.5 mL of the homogenate to 3.5 mL of fresh Tri Reagent in clean tubes (remaining homogenate was stored in 50 mL Falcon tubesat -80). Thoroughly vortexed tubes and let sit for 5 minutes at room temperature.Added 1.4 mL chloroform to 7 mL of Tri Reagent mixture. Let sit for 15 minutes at room temp.Put 3.5 mL isopropanol in a clean tube and added aqueous (top) phase of Tri-mixture. Sample 27 had the least amount of aqueous phase anda very large interphase. Let sit for 10 min at room temp and centrifuged 12000xg for 8 min (SR did this part).Decanted/removed all isopropanol and washed remaining pellet with 7 mL 75% EtOH. Centrifuged 5 min at 10000 rpm.Removed EtOH with pipet and quickly centrifuged. Removed remaining EtOH with pipet and kimwipe. Let tubes air dry in hood for 5 minutes.All were dry except for 27.Resuspended 21, 23, & 24 in 50 uL nuclease-free water (27 was left to dry longer). Measured RNA concentrations on the nanodrop (the "viewreport" function wasn't working so the following are approximate results):#21 ~1600 ng/uL#23 ~1400 ng/uL#24 ~1400 ng/uL27 was not completely dry, but consulted Sam and resuspended in 50 uL water followed by heating in water bath at ~55 degrees for 5 minutes.
Its concentration was 176 ng/uL.Stored extracted RNA in -80 in box labeled "Salmon Senescence". 475

476
Appendix
477
Even better news!
Dishwashed keyboards work- as long as you dry them in an oven for a week!
Add a comment...
Steven RobertsShared privately - May 24, 2012
3
how does a keyboard end up in a dishwasher?
Emma Timmins-SchiffmanMay 24, 2012
Open the door and place on rack- unless someone did not remove theredishes- then those would have to be removed first to make room.
Steven Roberts May 24, 2012 +232
Yep, Steven's spot on with this one.Sam White May 24, 2012
I'm the oldest sibling. Are you an only child?Sam White May 24, 2012
Are you both younger brothers?
Emma Timmins-SchiffmanMay 24, 2012
I'm the eldest sibling.Sam White May 24, 2012
Oh, and my siblings find me to be HILARIOUS! ;^)Sam White May 24, 2012 +1
21
funny. i'll rephrase my question: why would you put a keyboard in thedishwasher?
Emma Timmins-SchiffmanMay 24, 2012
To wash it.Sam White May 24, 2012 +1
21
C'mon. You had to see that one coming...Sam White May 24, 2012
But, that, seriously, is the reason.Sam White May 24, 2012
This is my favorite G+ post everDoug Immerman May 25, 2012 +1
21
s12 comments
478

479
Related Documents