Emittance Measurement Simulations in the ATF Extraction Line Anthony Scarfe The Cockcroft Institute

Emittance Measurement Simulations in the ATF Extraction Line Anthony Scarfe The Cockcroft Institute.
Dec 18, 2015
Welcome message from author
This document is posted to help you gain knowledge. Please leave a comment to let me know what you think about it! Share it to your friends and learn new things together.
Transcript

Emittance Measurement Simulations in the ATF
Extraction Line
Anthony ScarfeThe Cockcroft Institute

The Introduction
The ATF accelerator in KEK is currently a damping ring with an extraction line connected to it.
The extraction line starts with a extraction kicker and continues through 2 shared quadrupoles before reaching the first extraction septum.
Emittance growth has been measured in the extraction line.
To investigate the cause of the emittance growth an international team is going to KEK to measure the emittance in the extraction line when off-sets within the last shared quadrupole are generated.
The emittance is indirectly measured using the 5 wire-scanner stations within the extraction line.
The simulations discussed in this presentation are designed to mimic the emittance measurement technique used in the ATF extraction line.
The output of this research will be a Mathematica-based code that will assist in the understanding of the emittances measured during the experimentations performed at ATF.
The Set-up
There are 5 wire-scanners:
MW0X
MW1X
MW2X
MW3X
MW4X
3 wire-scanners are needed to reconstruct the emittance at a pre-selected place.
MW0X was chosen as the position for the emittance reconstruction.
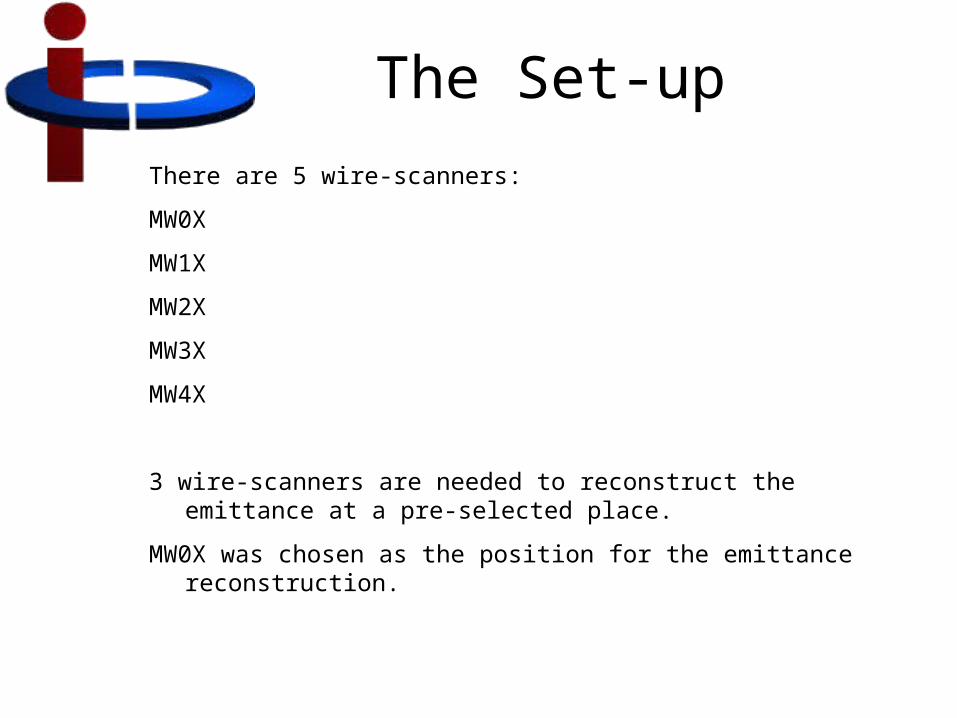
Emittance measurement5 positions for wire scanners
Diagnostic section (x=y =)
Each position is equipped with 3 wire scanners oriented at 0, 90 and 80° for x,y and 80° beam-size measurement.
Wire thickness = 10 m & 50 m
90° 80
°
0°

The Measurements
The wire-scanners are used to measure the transverse distribution of the beam.
Each wire-scanner position has 3 wires:
Horizontal
Vertical
Skew
The wire is positioned at one of the extremes of the beam, where it records the current flowing through the wire, this is directly related to the number of particles impacting the wire.
The wire scans the full range of the beam by repositioning between each bunch.

The Calculations
The parameters recorded by the wire-scanner are the x and y positions of the particles in the beam.
The emittance is defined as:
εx=√<x2><x’2>-<x.x’>2 equation 1
x is known from the wire-scanner, x’ is not known.
This is why multiple wire-scanners are needed.

The Reconstruction

The Simulation
To simulate the wire-scanner measurements the x and y particle positions generated from MAD at each wire-scanner were split into ‘bins’ the same thickness as the wires:
50 microns in x and 10 microns in y.
Each particle in each ‘bin’ was given the x and y positions corresponding to the middle of each ‘bin’.
The cumulative R-matrices between each wire-scanner and MW0X were generated from the MAD optics file.
The Mathematica function PsudoInverse was used to invert the R-matrix terms.

The Errors-Phase 1
3 sources of errors were investigated:
R-matrix errors (optics errors)
Initial Twiss errors (upstream optics errors)
Initial emittance errors (upstream emittance growth)
Each type of error was modelled as a seeded Gaussian error spread.
The R-matrix terms were given 1%, 5%, 10% and 20% error spread and each error was performed over 1,000 seeds
The initial Twiss and emittance errors were given 10% error spread and were performed over 20 seeds.
For each seed the complete set of R-matrix errors were simulated again.

The Results
The emittances were calculated using the first 3, 4 and 5 wire-scanners.
The results are presented in units of the theoretical emittance calculated at MW0X by MAD using equation 1.
The percentage of complex emittances calculated from each set of results are also presented.
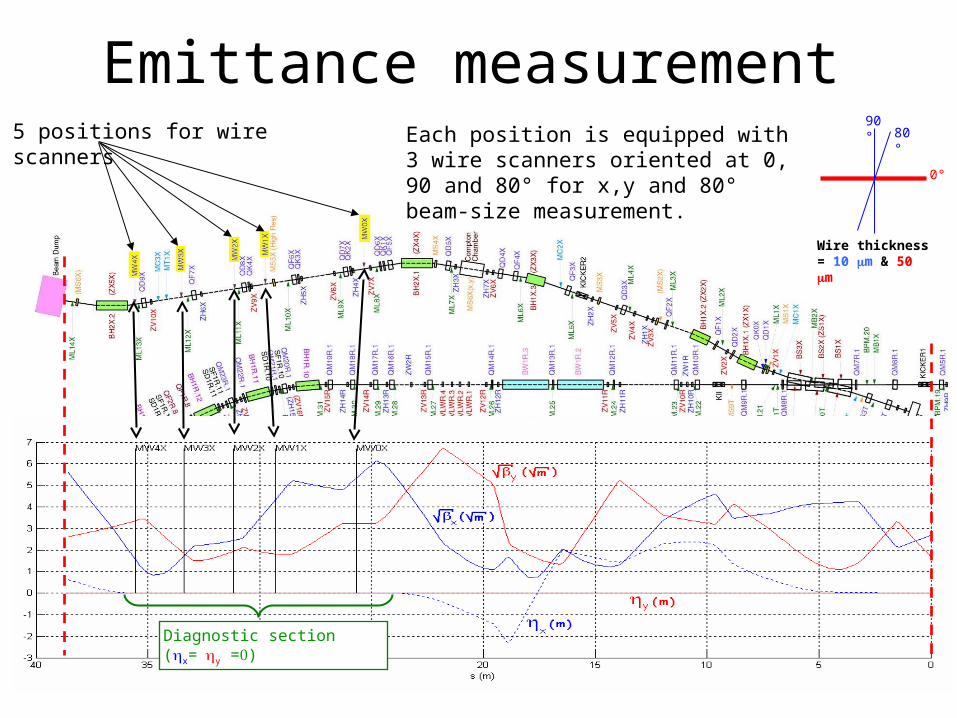
-0.0006 -0.0004 -0.0002 0.0002 0.0004 0.0006meters
500
1000
1500
2000
2500
3000
3500
number of particles
Simulated Wire-Scanner Signal, Horizontal
MW0XMW1XMW2XMW3XMW4X

-0.00006 -0.00004 -0.00002 0.00002 0.00004 0.00006meters
1000
2000
3000
4000
number of particles
Simulated Wire-Scanner Signal, Vertical
MW0XMW1XMW2XMW3XMW4X

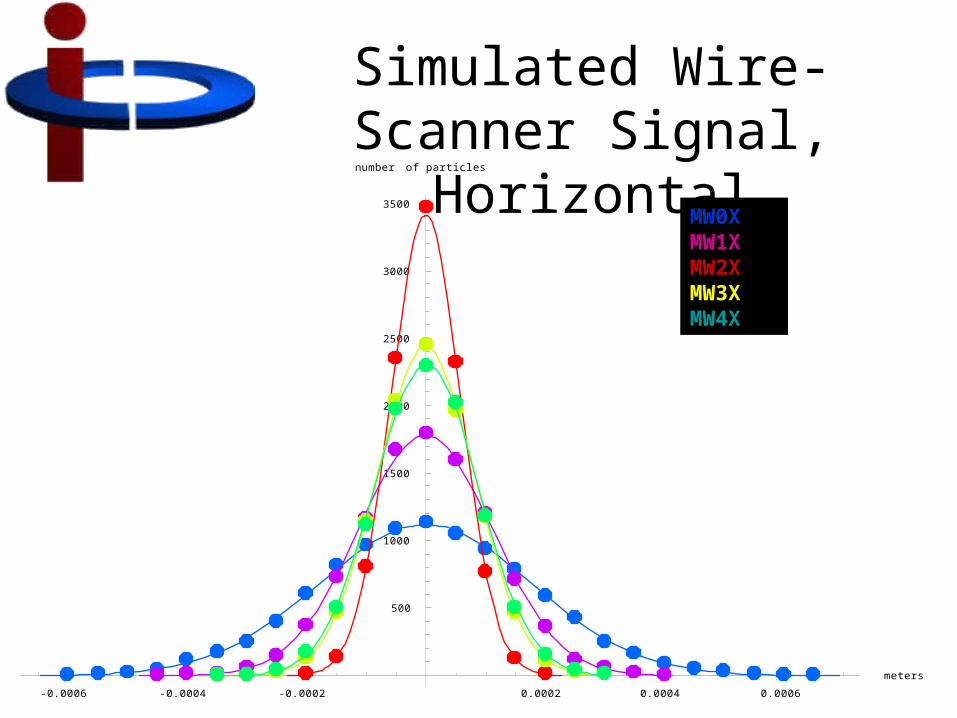
No Initial ErrorsWire-measured Emittance with R-matrix Errors
0.6
0.7
0.8
0.9
1
1.1
1.2
0 1 5 10 20
R-matrix error (%)
wir
e-m
easu
red
em
itta
nce
(th
eore
tica
l em
itta
nce
at
MW
0X)
X, 5 wire-scanners
Y, 5 wire-scanners
X, 4 wire-scanners
Y, 4 wire-scanners
X, 3 wire-scanners
Y, 3 wire-scanners

Initial Twiss ErrorsWire-measured Emittance with R-matrix and Initial Twiss Errors
0.85
0.9
0.95
1
1.05
1.1
1.15
1.2
1.25
0 1 5 10 20
R-matrix error (%)
wir
e-m
easu
red
em
itta
nce
(th
eore
tica
l em
itta
nce
at
MW
0X)
X, 5 wire-scanners
Y, 5 wire-scanners
X, 4 wire-scanners
Y, 4 wire-scanners
X, 3 wire-scanners
Y, 3 wire-scanners

Initial Emittance ErrorsWire-measured Emittance with R-matrix and Initial Emittance Errors
0.85
0.9
0.95
1
1.05
1.1
1.15
1.2
1.25
0 1 5 10 20
R-matrix error (%)
wir
e-m
easu
red
em
itta
nce
(th
eore
tica
l em
itta
nce
at
MW
0X)
X, 5 wire-scanners
Y, 5 wire-scanners
X, 4 wire-scanners
Y, 4 wire-scanners
X, 3 wire-scanners
Y, 3 wire-scanners

No Initial ErrorsRejection Factor for Emittance Measurements with R-matrix Errors
0
10
20
30
40
50
60
0 1 5 10 20
R-matrix error (%)
Rej
ecti
on
Fac
tor
(%) X, 5 wire-scanners
Y, 5 wire-scanners
X, 4 wire-scanners
Y, 4 wire-scanners
X, 3 wire-scanners
Y, 3 wire-scanners

Initial Twiss ErrorsRejection Factor for Emittance Measurements with R-matrix and Initial Twiss Errors
0
10
20
30
40
50
60
0 1 5 10 20
R-matrix error (%)
Rej
ecti
on
Fac
tor
(%) X, 5 wire-scanners
Y, 5 wire-scanners
X, 4 wire-scanners
Y, 4 wire-scanners
X, 3 wire-scanners
Y, 3 wire-scanners

Initial Emittance ErrorsRejection Factor for Emittance Measurements with R-matrix and Initial Emittance Errors
0
10
20
30
40
50
60
0 1 5 10 20
R-matrix error (%)
Rej
ecti
on
Fac
tor
(%) X, 5 wire-scanners
Y, 5 wire-scanners
X, 4 wire-scanners
Y, 4 wire-scanners
X, 3 wire-scanners
Y, 3 wire-scanners

Phase 1 Conclusions
It was decided that no significant differences were found between the initial emittance errors and initial twiss errors results
The initial emittance errors will be dropped from further study.
It was also decided that the R-matrix term errors are not very good for ‘real world’ comparisons, hence quadrupole strength errors will be used in future studies (phase 2).
It was also decided that the wire-scanner was too simplistic and that future studies should include any gaps between wire-scan positions present in real life as well as re-generating the beam between wire-scans (phases 3 & 4).

The Errors-Phase 2
Quadrupole Strength errors were investigated with no other errors.
The errors were modelled as seeded Gaussian error spreads.
The integrated quadrupole strengths of all the quadrupole magnets were given 1%, 2% and 5% error spread and each error was performed over 100 seeds.
Each seed required a tracking and data-manipulation run, this dramatically increased the computing time for each seed.
Due to the increase in computing time associated with the quadrupole errors the number of seeds was reduced.
It was also decided that further errors would be saved until the ‘real world’ nature of the simulations could be optimised.

No Initial ErrorsWire-measured Emittance with Quad Strength Errors
0
2
4
6
8
10
12
0 1 2 5
Quad Strength error (%)
wir
e-m
easu
red
em
itta
nce
(th
eore
tica
l em
itta
nce
at
MW
0X)
X, 5 wire-scanners
Y, 5 wire-scanners
X, 4 wire-scanners
Y, 4 wire-scanners
X, 3 wire-scanners
Y, 3 wire-scanners

No Initial ErrorsRejection Factor for Emittance Measurements with Quad Strength Errors
0
1
2
3
4
5
6
7
8
9
0 1 2 5
Quad Strength error (%)
Rej
ecti
on
Fac
tor
(%) X, 5 wire-scanners
Y, 5 wire-scanners
X, 4 wire-scanners
Y, 4 wire-scanners
X, 3 wire-scanners
Y, 3 wire-scanners
Phase 2 Conclusions
The rejection factors are far too low.
Realistic quadrupole strength errors may lead to more realistic rejection factors (phase 2a).
Realistic wire-scanner measurement simulations may also lead to more realistic rejection factors (phase 3).
Realistic initial beam errors may also lead to more realistic rejection factors (phase 4).
Simulation set-up may be lowering the rejection factors.
Phase 3
To simulate the wire-scanner measurements the x and y particle positions generated from MAD at each wire-scanner will be split into ‘bins’ the same thickness as the wires.
Some ‘bins’ will be removed to simulate the gap between wire-scans
Each particle in each ‘bin’ was given the x and y positions corresponding to the middle of each ‘bin’.
Quadrupole Strength errors will be investigated with no other errors.
The errors will be modelled as seeded Gaussian error spreads.
The integrated quadrupole strengths of all the quadrupole magnets will be given 1%, 2% and 5% error spreads and each error will be performed over a number of seeds.
Phase 4
To simulate the ‘real world’ wire-scanner measurement the x and y particle positions generated from MAD at one wire-scanner will be split up to fill one ‘bin’ per simulation.
Some ‘bins’ will be removed to simulate the gap between wire-scans
This process will be repeated for each wire-scanner.
The quadrupole errors used in phase 3 will be used again.
Each beam generated will have Gaussian error spreads applied to the initial Twiss parameters, the initial emittances and to the initial beam-centroid position.
The amount of error applied to each parameter will be chosen at a later date.
What we Need to Know
To successfully complete phase 4 we need to know:
• The range of the realistic quadrupole strength errors.
• The spacing between the wire-scans in each ATF wire-scanner.
• Does each wire-scan and each wire-scanner need a separate bunch or do they use the same bunch.
• The range of realistic beam errors at the entrance to the extraction kicker.
• The format of the wire-scanner results file generated by the ATF computers.
• How the instantaneously accurate MAD input files generated by the ATF computers compare to the MAD input file used for these simulations.
Related Documents