Paradigm Transportation Solutions Limited May 2015 Emery Investments Neighbourhood Commercial Site Traffic Impact Study

Welcome message from author
This document is posted to help you gain knowledge. Please leave a comment to let me know what you think about it! Share it to your friends and learn new things together.
Transcript

Paradigm Transportation Solutions Limited
May 2015
Emery Investments Neighbourhood Commercial
Site Traffic Impact Study

Project Summary
Paradigm Transportation Solutions Limited
Emery Investments Neighbourhood Commerial Site Traffic Impact Study List of Revisions
Version Date Author Description
1 May 2015 S. Elkins For submission
Signature Engineer’s Seal
Disclaimer
This document has been prepared for the titled project or named part thereof and should not be relied upon or used for any other project without an independent check being carried out as to its suitability and prior written authorization of Paradigm Transportation Solutions Limited being obtained. Paradigm Transportation Solutions Limited accepts no responsibility or liability for the consequence of this document being used for a purpose other than the purposes for which it was commissioned. Any person using or relying on the document for such other purpose agrees, and will by such use or reliance be taken to confirm their agreement to indemnify Paradigm Transportation Solutions Limited for all loss or damage resulting there from. Paradigm Transportation Solutions Limited accepts no responsibility or liability for this document to any party other than the person by whom it was commissioned.
To the extent that this report is based on information supplied by other parties, Paradigm Transportation Solutions Limited accepts no liability for any loss or damage suffered by the client, whether through contract or tort, stemming from any conclusions based on data supplied by parties other than Paradigm Transportation Solutions Limited and used by Paradigm Transportation Solutions Limited in preparing this report.
Project Number 141070 May 2015 Client Emery Investments Inc. 620 Wilson Avenue, Suite 350 Toronto ON M3J 1Z3
Client Contact Robert Cumming
Consultant Project Team Stewart Elkins, BES, MITE Scott Catton, CET, MITE
Paradigm Transportation Solutions Limited 22 King Street South Suite 300 Waterloo ON N2J 1N8 p: 519.896.3163 www.ptsl.com


Emery Investment’s Retail Site | Traffic Impact Study | 141070 | May 2015
Paradigm Transportation Solutions Limited | Page i
Executive Summary
Content
Emery Investments Incorporated is proposing an Official Plan Amendment (OPA) for 4880 Valera Road in the City of Burlington, Region of Halton to allow for high density residential land uses based on the high density residential designation in the Official Plan.
The purpose of this study is to determine the impacts of the development traffic on the surrounding road network and identify any improvements necessary to accommodate this traffic.
Development Concept
The subject site encompasses an area of approximately 2.26 hectares of land with frontage along Thomas Alton Boulevard, Valera Road, and Appleby Line. The development is assumed to consist of 407 condominium apartment units based on the maximum allowable density under the high density designation under the Official Plan. The subject site’s parking demand is anticipated to be accommodated on site through use of an integrated parking structure. No site plan has been developed that illustrates the site’s layout.
Conclusions
Development Generated Traffic: The development of the subject site is estimated to generate approximately 147 total vehicle trips during the AM peak hour and approximately 153 total vehicle trips during the PM peak hour. A ten percent reduction in trip generation has been applied to account for transit oriented trips to/from the development. As a result the site’s net generation is estimated to be 132 AM peak hour trips and 137 PM peak hour trips.
Existing Traffic Conditions: The Appleby Line intersection with Thomas Alton Boulevard, and the Valera Road intersections with Thomas Alton Boulevard and Verdi Street generally define the study area. From a capacity perspective, these intersections are currently operating with satisfactory levels of service with minimal delay and congestion during the AM and PM peak hours.
Forecast Background Traffic: The forecast background traffic volumes in the vicinity of the subject site have been assessed for a six-year horizon following the anticipated build-out of the subject site, Year 2021. The forecast traffic volumes are estimated to consist of a generalized growth rate of 2 percent per annum in addition to traffic related to the build-out of the surrounding lands.
Background Traffic Conditions: The study area intersections are anticipated to continue to operate with satisfactory levels of service

Emery Investment’s Retail Site | Traffic Impact Study | 141070 | May 2015
Paradigm Transportation Solutions Limited | Page ii
with minimal delay and congestion during the AM and PM peak hours. Queuing issues at the Appleby Line intersection with Thomas Alton Boulevard are anticipated to occur.
Total Traffic Conditions: The study area intersections are anticipated to continue to operate with satisfactory levels of service during the AM and PM peak hours. Queuing issues at the Appleby Line intersection with Thomas Alton Boulevard are anticipated to continue to occur. Additionally, several movements are estimated to have volume to capacity ratios greater than 0.85. These movements are not considered overly critical as the area is generally anticipated to be fully built-out at Year 2021.
Roadway Improvements: To accommodate the forecast traffic volumes, the eastbound right-turn along with the southbound left-turn and right-turn movements at the Appleby Line intersection with Thomas Alton Boulevard require additional storage.
Westbound left-turn lanes with 25 metres storage are warranted at the Thomas Alton Boulevard intersections with Valera Road and Driveway “A”.
Emery Investment’s Retail Site | Traffic Impact Study | 141070 | May 2015
Paradigm Transportation Solutions Limited | Page iii
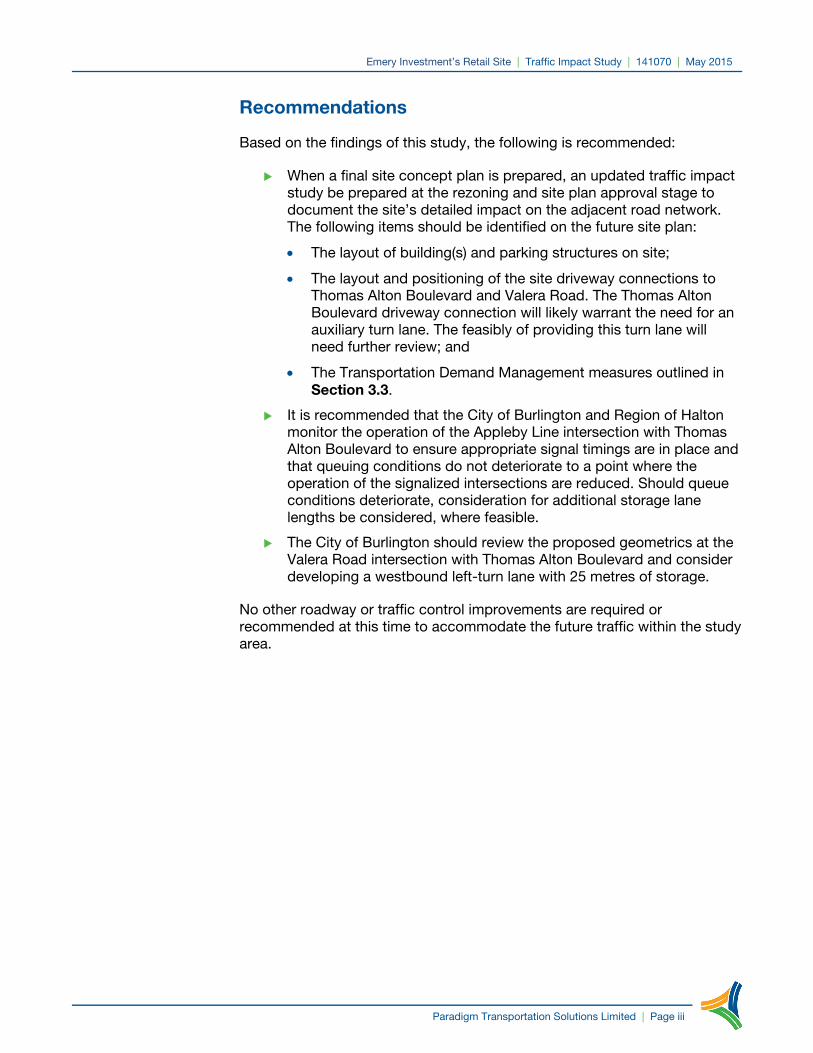
Recommendations
Based on the findings of this study, the following is recommended:
When a final site concept plan is prepared, an updated traffic impact study be prepared at the rezoning and site plan approval stage to document the site’s detailed impact on the adjacent road network. The following items should be identified on the future site plan:
The layout of building(s) and parking structures on site;
The layout and positioning of the site driveway connections to Thomas Alton Boulevard and Valera Road. The Thomas Alton Boulevard driveway connection will likely warrant the need for an auxiliary turn lane. The feasibly of providing this turn lane will need further review; and
The Transportation Demand Management measures outlined in Section 3.3.
It is recommended that the City of Burlington and Region of Halton monitor the operation of the Appleby Line intersection with Thomas Alton Boulevard to ensure appropriate signal timings are in place and that queuing conditions do not deteriorate to a point where the operation of the signalized intersections are reduced. Should queue conditions deteriorate, consideration for additional storage lane lengths be considered, where feasible.
The City of Burlington should review the proposed geometrics at the Valera Road intersection with Thomas Alton Boulevard and consider developing a westbound left-turn lane with 25 metres of storage.
No other roadway or traffic control improvements are required or recommended at this time to accommodate the future traffic within the study area.


Emery Investment’s Retail Site | Traffic Impact Study | 141070 | May 2015
Paradigm Transportation Solutions Limited | Page i
Contents
1 Introduction ............................................................... 1
1.1 Overview ............................................................................................. 1 1.2 Study Area .......................................................................................... 1
2 Existing Conditions ................................................... 3
2.1 Existing Roadways ............................................................................ 3 2.2 Existing Transit Service ..................................................................... 5 2.3 Existing Traffic Volumes ................................................................... 5 2.4 Existing Traffic Operations ............................................................... 9
3 Development Concept ............................................ 11 3.1 Site Description ................................................................................ 11 3.2 Site Traffic Estimates ...................................................................... 11 3.3 Transportation Demand Management ........................................... 15
4 Future Traffic Conditions ....................................... 17
4.1 Background Traffic Forecast .......................................................... 17 4.2 Background Traffic Operations ...................................................... 23 4.3 Future Total Traffic .......................................................................... 25 4.4 Future Total Traffic Operations ...................................................... 28
5 Assessment of Improvements ............................... 30
5.1 Auxiliary Turn Lane Storage Requirements................................... 30 5.2 Site Access Provisions .................................................................... 30
6 Conclusions & Recommendations ........................ 32
6.1 Conclusions ...................................................................................... 32 6.2 Recommendations ........................................................................... 33
Emery Investment’s Retail Site | Traffic Impact Study | 141070 | May 2015
Paradigm Transportation Solutions Limited | Page ii
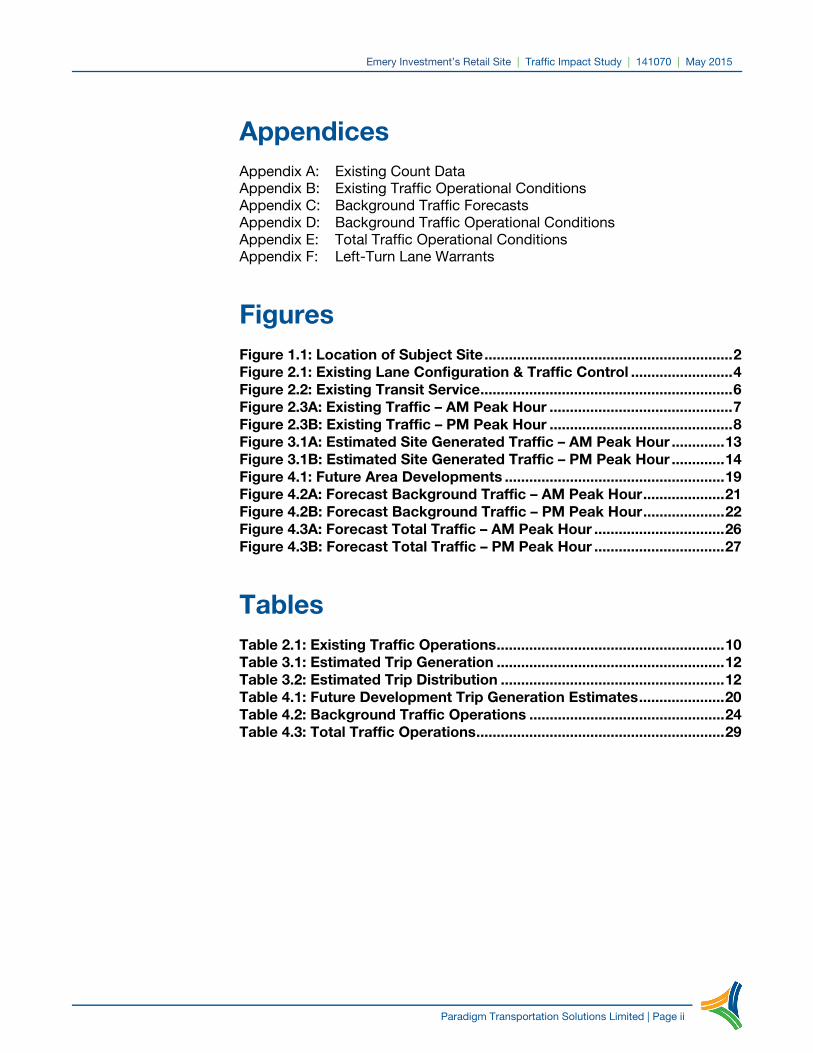
Appendices Appendix A: Existing Count Data Appendix B: Existing Traffic Operational Conditions Appendix C: Background Traffic Forecasts Appendix D: Background Traffic Operational Conditions Appendix E: Total Traffic Operational Conditions Appendix F: Left-Turn Lane Warrants
Figures Figure 1.1: Location of Subject Site ............................................................. 2 Figure 2.1: Existing Lane Configuration & Traffic Control ......................... 4 Figure 2.2: Existing Transit Service .............................................................. 6 Figure 2.3A: Existing Traffic – AM Peak Hour ............................................. 7 Figure 2.3B: Existing Traffic – PM Peak Hour ............................................. 8 Figure 3.1A: Estimated Site Generated Traffic – AM Peak Hour ............. 13 Figure 3.1B: Estimated Site Generated Traffic – PM Peak Hour ............. 14 Figure 4.1: Future Area Developments ...................................................... 19 Figure 4.2A: Forecast Background Traffic – AM Peak Hour .................... 21 Figure 4.2B: Forecast Background Traffic – PM Peak Hour .................... 22 Figure 4.3A: Forecast Total Traffic – AM Peak Hour ................................ 26 Figure 4.3B: Forecast Total Traffic – PM Peak Hour ................................ 27
Tables Table 2.1: Existing Traffic Operations ........................................................ 10 Table 3.1: Estimated Trip Generation ........................................................ 12 Table 3.2: Estimated Trip Distribution ....................................................... 12 Table 4.1: Future Development Trip Generation Estimates ..................... 20 Table 4.2: Background Traffic Operations ................................................ 24 Table 4.3: Total Traffic Operations ............................................................. 29
Emery Investment’s Retail Site | Traffic Impact Study | 141070 | May 2015
Paradigm Transportation Solutions Limited | Page 1
1 Introduction
1.1 Overview
Paradigm Transportation Solutions Limited was retained by Emery Investments Incorporated to undertake a traffic impact study for the proposed Official Plan Amendment (OPA) for 4880 Valera Road in the City of Burlington, Region of Halton to permit high density residential land uses based on the high density residential designation in the Official Plan. The purpose of this study is to determine the impact of the development traffic on the surrounding road network and identify any improvements necessary to accommodate this traffic. The scope of the study includes determination of:
1. The current traffic and site conditions in the vicinity of the development,
2. Estimates of background traffic growth in the area,
3. Estimates of the additional traffic that will be generated by the development,
4. The impact of the traffic at build-out of the lands, and
5. Recommendations on the remedial measures necessary to accommodate the future traffic in a satisfactory manner.
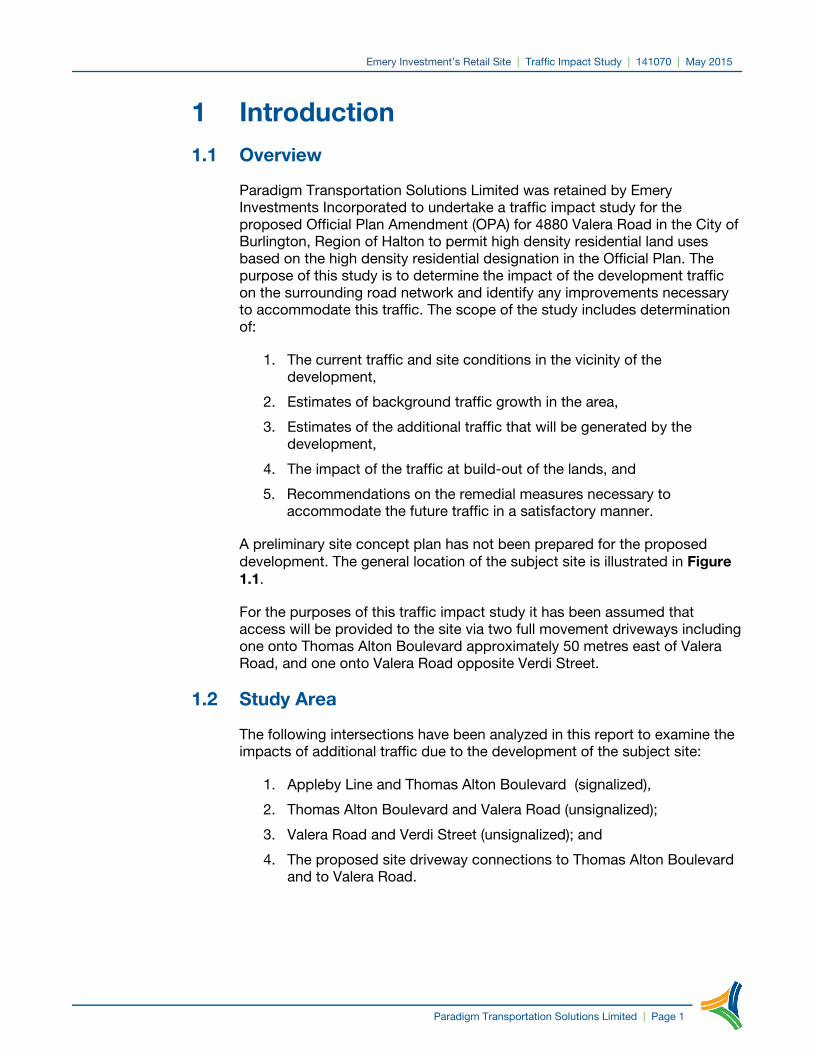
A preliminary site concept plan has not been prepared for the proposed development. The general location of the subject site is illustrated in Figure 1.1.
For the purposes of this traffic impact study it has been assumed that access will be provided to the site via two full movement driveways including one onto Thomas Alton Boulevard approximately 50 metres east of Valera Road, and one onto Valera Road opposite Verdi Street.
1.2 Study Area
The following intersections have been analyzed in this report to examine the impacts of additional traffic due to the development of the subject site:
1. Appleby Line and Thomas Alton Boulevard (signalized),
2. Thomas Alton Boulevard and Valera Road (unsignalized);
3. Valera Road and Verdi Street (unsignalized); and
4. The proposed site driveway connections to Thomas Alton Boulevard and to Valera Road.

Emery Investment’s Retail Site | Traffic Impact Study | 141070 | May 2015
Paradigm Transportation Solutions Limited | Page 2
Figure 1.1: Location of Subject Site
Emery Investment’s Retail Site | Traffic Impact Study | 141070 | May 2015
Paradigm Transportation Solutions Limited | Page 3
2 Existing Conditions This section of the report provides an overview of the existing conditions on the roadways in the study area. The roadways of interest include Appleby Line, Thomas Alton Boulevard, Valera Road, and Verdi Street.
2.1 Existing Roadways
The main roadways in the vicinity of the subject site that have been considered in assessing the traffic impacts of the development include Appleby Line, Thomas Alton Boulevard, Valera Road and Verdi Street. The characteristics of these roadways are as follows:
Appleby Line (Regional Road 20) is a major north-south regional arterial roadway with a six lane urban cross section and a posted speed limit of 60 kilometres per hour. The posted speed limit is increased to 70 kilometres per hour north of Palladium Way. The Appleby Line intersections with Thomas Alton Boulevard operates with traffic control signals. Pedestrian facilities are present on both sides of this roadway south of Palladium Way. North of Palladium Way, sidewalks are provided on the west side only. On-street bicycle lanes are present in both directions along this roadway. From Highway 407 to the Queen Elizabeth Way, this roadway is identified as a future rapid transit corridor.
Thomas Alton Boulevard is an east-west major collector road with a basic two-lane urban cross-section with a posted speed limit of 50 kilometres per hour. On-street bicycle lanes are present in both directions along this roadway. Pedestrian facilities are present on both sides of this roadway. The Lowe’s home improvement and appliance store driveway forms the west leg of the Thomas Alton Boulevard and Appleby Line intersection.
Valera Road and Verdi Street are local roadways with basic two-lane urban cross-sections and an assumed speed limit of 50 kilometres per hour. Pedestrian facilities are present on both sides of this roadway.
The existing intersections that could potentially be impacted by the development of the subject site include the following:
1. Appleby Line and Thomas Alton Boulevard (signalized),
2. Thomas Alton Boulevard and Valera Road (unsignalized);
3. Valera Road and Verdi Street (unsignalized); and
4. The proposed site driveway connections to Thomas Alton Boulevard and to Valera Road.
Figure 2.1 illustrates the existing lane configurations and traffic control at the study area intersections.

Emery Investment’s Retail Site | Traffic Impact Study | 141070 | May 2015
Paradigm Transportation Solutions Limited | Page 4
Figure 2.1: Existing Lane Configuration & Traffic Control
Emery Investment’s Retail Site | Traffic Impact Study | 141070 | May 2015
Paradigm Transportation Solutions Limited | Page 5
2.2 Existing Transit Service
Burlington Transit operates Route 11 (Sutton-Alton), Route 15A/15B (Appleby-Walkers) and Route 51 (Burlington Northeast) on the roadways immediately surrounding the subject site. Figure 2.2 illustrates the layout of the Burlington Transit routes and the general schedule. The transit routes provide opportunities for users to transfer to/from interregional GO transit service and other intercity routes at various locations.
2.3 Existing Traffic Volumes
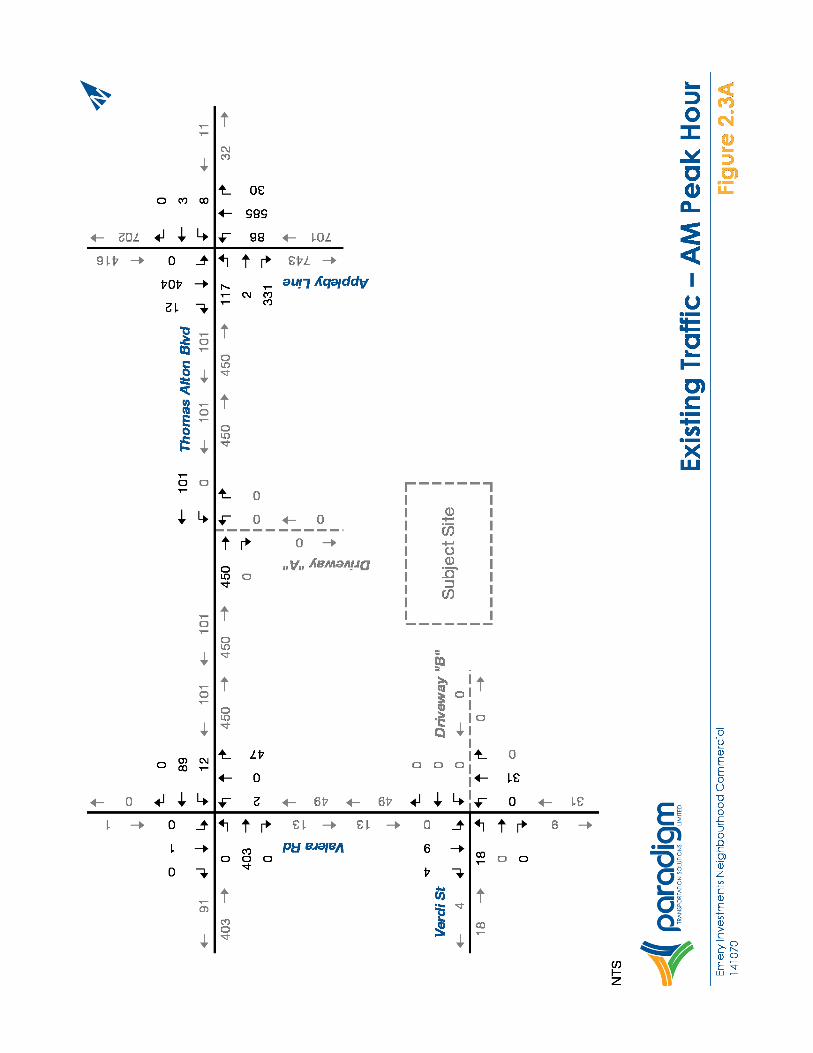
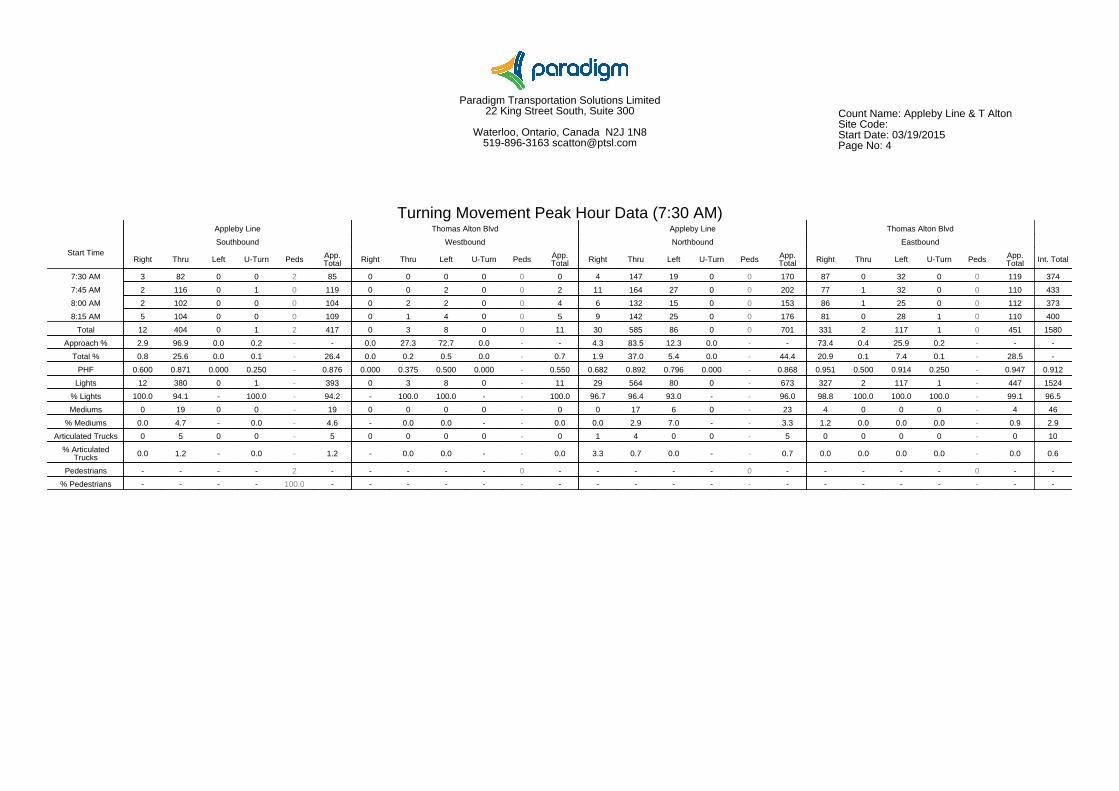
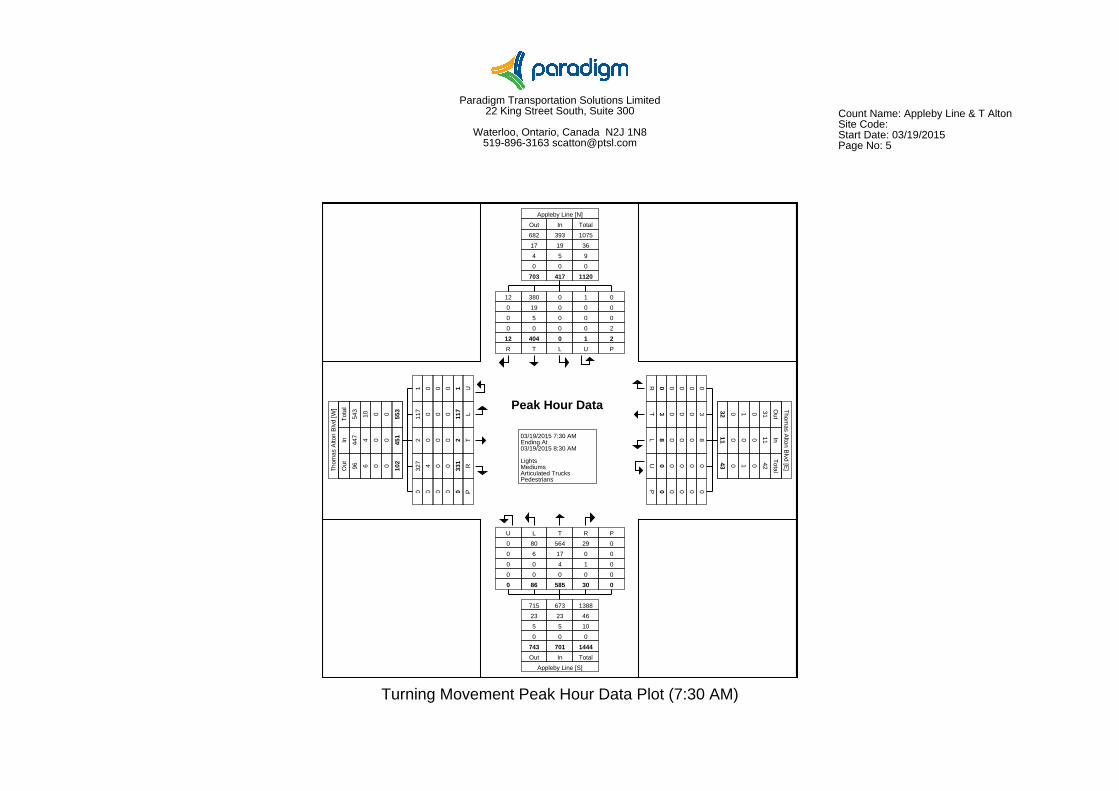
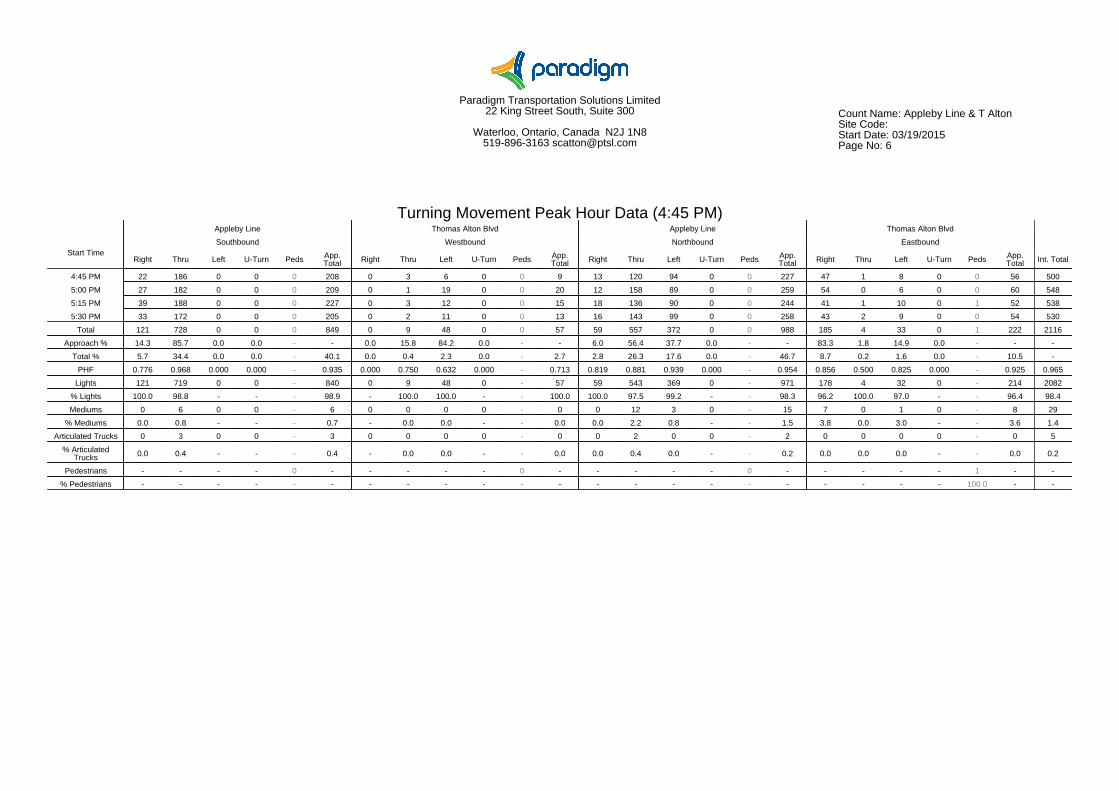
The traffic volumes used to establish the existing traffic conditions have been derived from turning movement counts conducted by Paradigm (March 2015 and July 2014). The existing turning movement count data is considered to be up-to-date and can be found attached in Appendix A. The existing traffic volumes are shown in Figure 2.3A and Figure 2.3B. The observed peak hour traffic volumes between the study area intersections have been balanced to ensure a reasonable flow is maintained.

Emery Investment’s Retail Site | Traffic Impact Study | 141070 | May 2015
Paradigm Transportation Solutions Limited | Page 6
Figure 2.2: Existing Transit Service
Emery Investment’s Retail Site | Traffic Impact Study | 141070 | May 2015
Paradigm Transportation Solutions Limited | Page 7
Figure 2.3A: Existing Traffic – AM Peak Hour

Emery Investment’s Retail Site | Traffic Impact Study | 141070 | May 2015
Paradigm Transportation Solutions Limited | Page 8
Figure 2.3B: Existing Traffic – PM Peak Hour
Emery Investment’s Retail Site | Traffic Impact Study | 141070 | May 2015
Paradigm Transportation Solutions Limited | Page 9
2.4 Existing Traffic Operations
Intersection level of service (LOS) is a recognized method of quantifying the efficiency of traffic flow at intersections. It is based on the delay experienced by individual vehicles executing the various movements. The delay is related to the number of vehicles desiring to make a particular movement, compared to the estimated capacity for that movement. The capacity is based on a number of criteria related to the opposing traffic flows. The highest possible rating is LOS A, under which the average total delay is equal or less than 10.0 seconds per vehicle. When the average delay exceeds 80 seconds at signalized intersections, the movement is classified as LOS F and remedial measures are usually implemented, if they are feasible.
The operation of the intersections in the study area were evaluated using the existing lane geometry and traffic control along with the existing peak hour traffic. The findings are summarized in Table 2.1. The intersection analysis considered three separate measures of performance:
The level of service (LOS) for each turning movement,
The volume to capacity (v/c) ratio for each turning movement, and
The 95th percentile queue lengths estimated using five 60-minute simulations of SimTraffic.
The level of service conditions on the existing road network have been assessed using Synchro 9.0 with HCM 2000 procedures. Movements are considered critical under the following conditions:
Volume to capacity ratios for through movements or shared through/turning movements are greater than or equal to 0.85,
Volume to capacity ratios for exclusive turning movements are greater than or equal to 0.95, and
Queue lengths for individual movements that are projected to exceed the available turning lane storage.
Based on the above criteria and the entries in Table 2.1, the following is noted:
The study area intersections are operation with acceptable levels of service with minimal delay and congestions during both the AM and PM peak hours. No movements are considered to be critical.
Detailed Synchro 9.0 output is provided in Appendix B.

Emery Investment’s Retail Site | Traffic Impact Study | 141070 | May 2015
Paradigm Transportation Solutions Limited | Page 10
TABLE 2.1: EXISTING TRAFFIC OPERATIONS
Left
Thro
ugh
Rig
ht
Ap
pro
ach
Left
Thro
ugh
Rig
ht
Ap
pro
ach
Left
Thro
ugh
Rig
ht
Ap
pro
ach
Left
Thro
ugh
Rig
ht
Ap
pro
ach
LOS < C C C C C > C A A > A A A A A BDelay < 29.4 27.1 27.7 25.7 25.5 > 25.7 4.7 4.3 > 4.3 0.0 4.1 3.7 4.0 11.1V/C < 0.47 0.23 0.04 0.01 > 0.16 0.18 > 0.00 0.12 0.01 0.2495th < 34 25 9 5 > 25 36 > 0 30 5
Ex. < - 35 - - > 135 - > 50 - 50
Avail < - 10 - - > 110 - > 50 - 45
LOS < A > A < A > A < B > B < B > BDelay < 0.0 > 0.0 < 1.1 > 1.1 < 11.6 > 11.6 < 13.5 > 13.5V/C < 0.00 > < 0.01 > < 0.09 > < 0.00 >
95th < 0 > < 8 > < 14 > < 2 >
LOS A > A < A A A > ADelay 8.8 > 8.8 < 0.0 0.0 0.0 > 0.0V/C 0.02 > < 0.00 0.01 >
95th 11 > < 0 0 >
LOS < D D D D D > D A A > A A B A B BDelay < 40.2 39.2 39.4 38.3 38.2 > 38.3 8.5 2.6 > 4.6 8.8 10.8 9.4 10.6 10.6V/C < 0.26 0.13 0.01 0.00 > 0.70 0.18 > 0.00 0.30 0.09 0.6495th < 19 21 3 3 > 93 29 > 1 70 22
Ex. < - 35 - - > 135 - > 50 - 50
Avail < - 14 - - > 42 - > 49 - 28
LOS < A > A < A > A < B > B < B > BDelay < 0.0 > 0.0 < 1.4 > 1.4 < 10.7 > 10.7 < 14.1 > 14.1V/C < 0.00 > < 0.05 > < 0.04 > < 0.02 >
95th < 0 > < 17 > < 12 > < 8 >
LOS A > A < A A A > ADelay 9.0 > 9.0 < 0.0 0.0 0.0 > 0.0V/C 0.01 > < 0.00 0.05 >
95th 9 > < 0 0 >MOE - Measure of Effectiveness LOS - Level of Service > - Shared Right-Turn Lane Ex. - Existing Storage (m)TCS - Traffic Control Signal V/C - Volume to Capacity Ratio Q - Queue Length Avail. - Available Storage (m)TWSC - Two-Way Stop Control < - Shared Left-Turn Lane 95th - 95th Percentile Queue Length (m)
SouthboundNorthboundWestboundEastbound
MOE
Direction / Movement / Approach
Ove
rall
3 - Verdi Street &Valera Road TW
SC
Ana
lysi
s P
erio
d
IntersectionControl
Type
2 - Thomas Alton Boulevard &Valera Road TW
SC
TCS
AM
Pea
k H
our
2 - Thomas Alton Boulevard &Valera Road TW
SC
3 - Verdi Street &Valera Road TW
SC
1 - Appleby Line &Thomas Alton Boulevard
TCS
PM
Pea
k H
our
1 - Appleby Line &Thomas Alton Boulevard
Emery Investment’s Retail Site | Traffic Impact Study | 141070 | May 2015
Paradigm Transportation Solutions Limited | Page 11
3 Development Concept
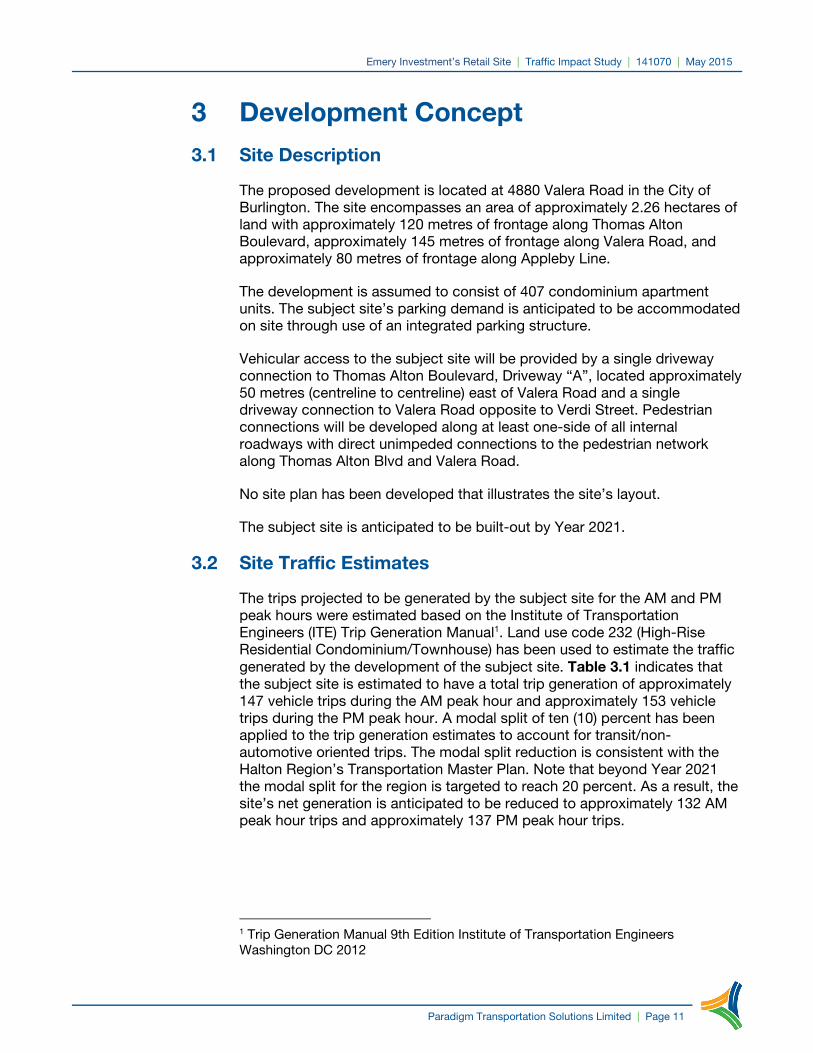
3.1 Site Description
The proposed development is located at 4880 Valera Road in the City of Burlington. The site encompasses an area of approximately 2.26 hectares of land with approximately 120 metres of frontage along Thomas Alton Boulevard, approximately 145 metres of frontage along Valera Road, and approximately 80 metres of frontage along Appleby Line.
The development is assumed to consist of 407 condominium apartment units. The subject site’s parking demand is anticipated to be accommodated on site through use of an integrated parking structure.
Vehicular access to the subject site will be provided by a single driveway connection to Thomas Alton Boulevard, Driveway “A”, located approximately 50 metres (centreline to centreline) east of Valera Road and a single driveway connection to Valera Road opposite to Verdi Street. Pedestrian connections will be developed along at least one-side of all internal roadways with direct unimpeded connections to the pedestrian network along Thomas Alton Blvd and Valera Road.
No site plan has been developed that illustrates the site’s layout.
The subject site is anticipated to be built-out by Year 2021.
3.2 Site Traffic Estimates
The trips projected to be generated by the subject site for the AM and PM peak hours were estimated based on the Institute of Transportation Engineers (ITE) Trip Generation Manual1. Land use code 232 (High-Rise Residential Condominium/Townhouse) has been used to estimate the traffic generated by the development of the subject site. Table 3.1 indicates that the subject site is estimated to have a total trip generation of approximately 147 vehicle trips during the AM peak hour and approximately 153 vehicle trips during the PM peak hour. A modal split of ten (10) percent has been applied to the trip generation estimates to account for transit/non-automotive oriented trips. The modal split reduction is consistent with the Halton Region’s Transportation Master Plan. Note that beyond Year 2021 the modal split for the region is targeted to reach 20 percent. As a result, the site’s net generation is anticipated to be reduced to approximately 132 AM peak hour trips and approximately 137 PM peak hour trips.
1 Trip Generation Manual 9th Edition Institute of Transportation Engineers Washington DC 2012
Emery Investment’s Retail Site | Traffic Impact Study | 141070 | May 2015
Paradigm Transportation Solutions Limited | Page 12
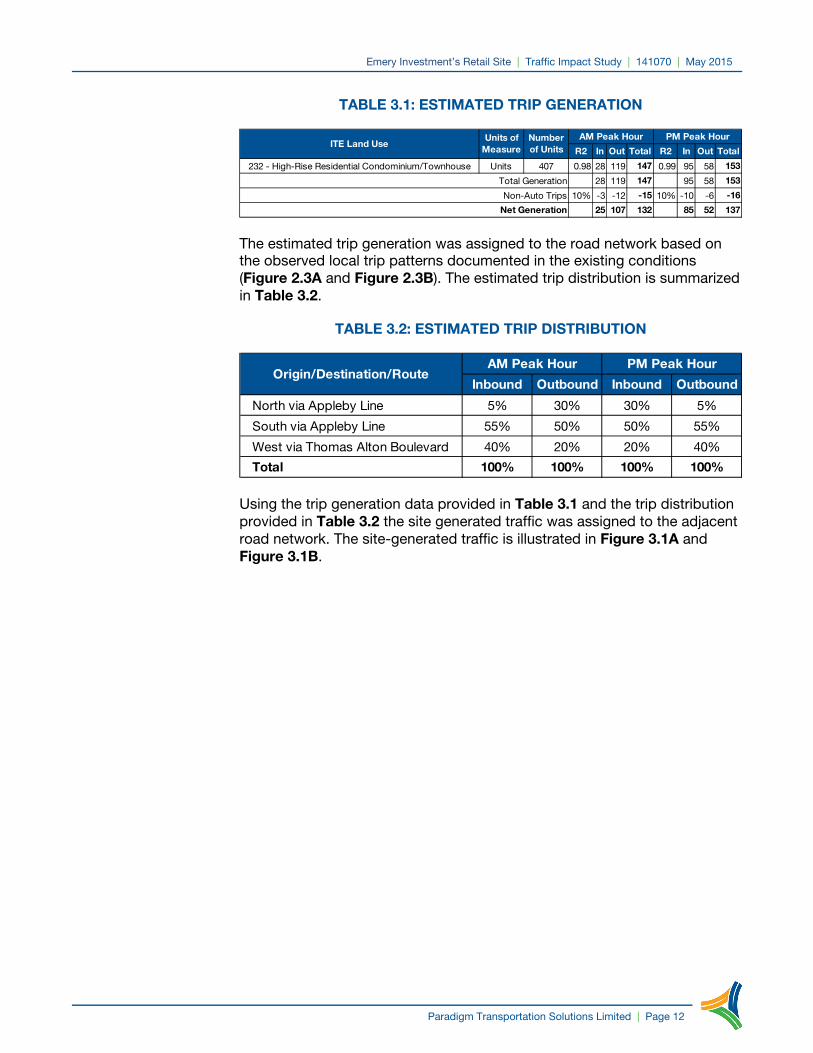
TABLE 3.1: ESTIMATED TRIP GENERATION
The estimated trip generation was assigned to the road network based on the observed local trip patterns documented in the existing conditions (Figure 2.3A and Figure 2.3B). The estimated trip distribution is summarized in Table 3.2.
TABLE 3.2: ESTIMATED TRIP DISTRIBUTION
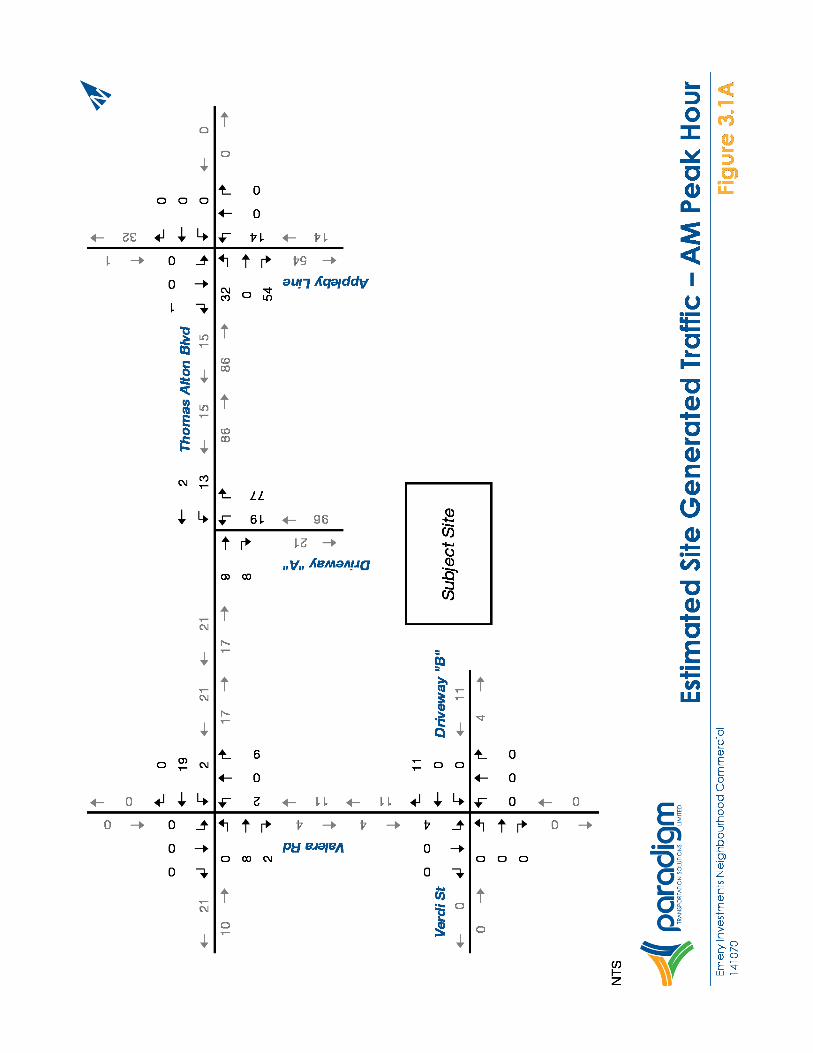
Using the trip generation data provided in Table 3.1 and the trip distribution provided in Table 3.2 the site generated traffic was assigned to the adjacent road network. The site-generated traffic is illustrated in Figure 3.1A and Figure 3.1B.
R2 In Out Total R2 In Out Total
232 - High-Rise Residential Condominium/Townhouse Units 407 0.98 28 119 147 0.99 95 58 153
28 119 147 95 58 153
10% -3 -12 -15 10% -10 -6 -16
25 107 132 85 52 137
Non-Auto Trips
Net Generation
Total Generation
PM Peak HourAM Peak HourNumberof Units
Units ofMeasure
ITE Land Use
Inbound Outbound Inbound Outbound
North via Appleby Line 5% 30% 30% 5%
South via Appleby Line 55% 50% 50% 55%
West via Thomas Alton Boulevard 40% 20% 20% 40%
Total 100% 100% 100% 100%
AM Peak Hour PM Peak HourOrigin/Destination/Route
Emery Investment’s Retail Site | Traffic Impact Study | 141070 | May 2015
Paradigm Transportation Solutions Limited | Page 13
Figure 3.1A: Estimated Site Generated Traffic – AM Peak Hour

Emery Investment’s Retail Site | Traffic Impact Study | 141070 | May 2015
Paradigm Transportation Solutions Limited | Page 14
Figure 3.1B: Estimated Site Generated Traffic – PM Peak Hour

Emery Investment’s Retail Site | Traffic Impact Study | 141070 | May 2015
Paradigm Transportation Solutions Limited | Page 15
3.3 Transportation Demand Management
Transportation Demand Management (TDM) refers to ways of making the capacity of our roads more efficient by reducing vehicle demand. TDM approaches consider how people’s choices of travel mode are affected by land use patterns, development design, parking availability, parking cost, and the relative cost, convenience and availability of alternative modes of travel. Various TDM strategies are used to influence those factors so that the alternatives are more competitive with driving alone and potentially reduce reliance on motor vehicles.
TDM strategies at a development can be divided into two basic categories:
Pre-occupancy: things that need to be done while a development is being designed and built; and
Post-occupancy: things that can be done once people are using the development.
The pre-occupancy actions are critical as they are most likely to determine how attractive, convenient, and safe alternative travel will be once the site is occupied. Before a site is occupied, it can be designed to be convenient and safe for pedestrians and cyclists, and vehicle parking can be provided to meet but not exceed demand.
After the development is built, incentives can be offered, but those incentives will not work as well if the site and its surroundings are oriented to cars. The incentives generally include subsidies to use transit, access to rideshare programs, and information about where and how to use alternatives.
The following TDM measures should strongly be considered when developing a site plan for the subject site.
Cycling Infrastructure
Visible, well-lit, short-term bicycle parking for visitors above the minimum provisions or recommendations; and
Secure, indoor bicycle parking storage for tenants/residents.
Walking Infrastructure
Safe and attractive walkways for pedestrians linking building entrances with public sidewalks; and
Enhanced pedestrian amenities on-site (benches, landscaping, lighting).

Emery Investment’s Retail Site | Traffic Impact Study | 141070 | May 2015
Paradigm Transportation Solutions Limited | Page 16
Transit Infrastructure
Enhance walking routes between main building entrance(s) and transit stops/stations;
Provide weather-protected waiting areas;
Bicycle parking located at or near transit stops; and
Provision of transit information on-site and adjacent to stops/stations.
Parking Infrastructure
Provide no more than the minimum number of required spaces for residents and visitors;
Reduced minimum parking requirements based on proximity to transit;
Cash-in-lieu of parking to fund public parking or fund sustainable transportation;
Shared parking with nearby developments or on-street spaces;
Reduced minimum parking requirements based on provision of dedicated carshare vehicle parking spaces;
Unbundle parking costs from unit costs; and
Provide on-site carshare vehicle(s).
Wayfinding/Travel Planning
Travel planning resources for residents (individualized marketing, active transportation maps, community resources); and
Wayfinding signage.
Education/Promotion, Incentives
Contribute to building a strong TDM brand; and
Include transit and active transportation maps and subsidized transit passes, carshare memberships, and/or bikeshare memberships with new home/condo purchase.
Integrating the above noted TDM measures into a comprehensive site plan can assist in mitigating the site’s impact on the adjacent road network, promote a strong and vibrant economy, and create a livable community that has a balanced transportation network that accommodates to all modes of transportation.

Emery Investment’s Retail Site | Traffic Impact Study | 141070 | May 2015
Paradigm Transportation Solutions Limited | Page 17
4 Future Traffic Conditions The assessment of the future conditions contained in this section includes the following components necessary to assess the traffic implications on the adjacent road network:
1. Future background traffic estimates;
2. Level of service analysis for background traffic (pre-development); and
3. Level of service analysis for background traffic plus the additional traffic generated by the build-out of the subject site (post-development).
4.1 Background Traffic Forecast
For analysis purposes, a six-year horizon (Year 2021) has been assessed in order to determine the impact of the subject site. The likely future background traffic volumes in the vicinity of the subject site are estimated to consist of:
Increased non-site traffic (generalized background traffic growth). The background traffic estimates were derived by applying a growth rate of 2.0 percent per annum to the existing traffic volumes. This growth rate was confirmed by Region of Halton staff during the pre-study consultation; and
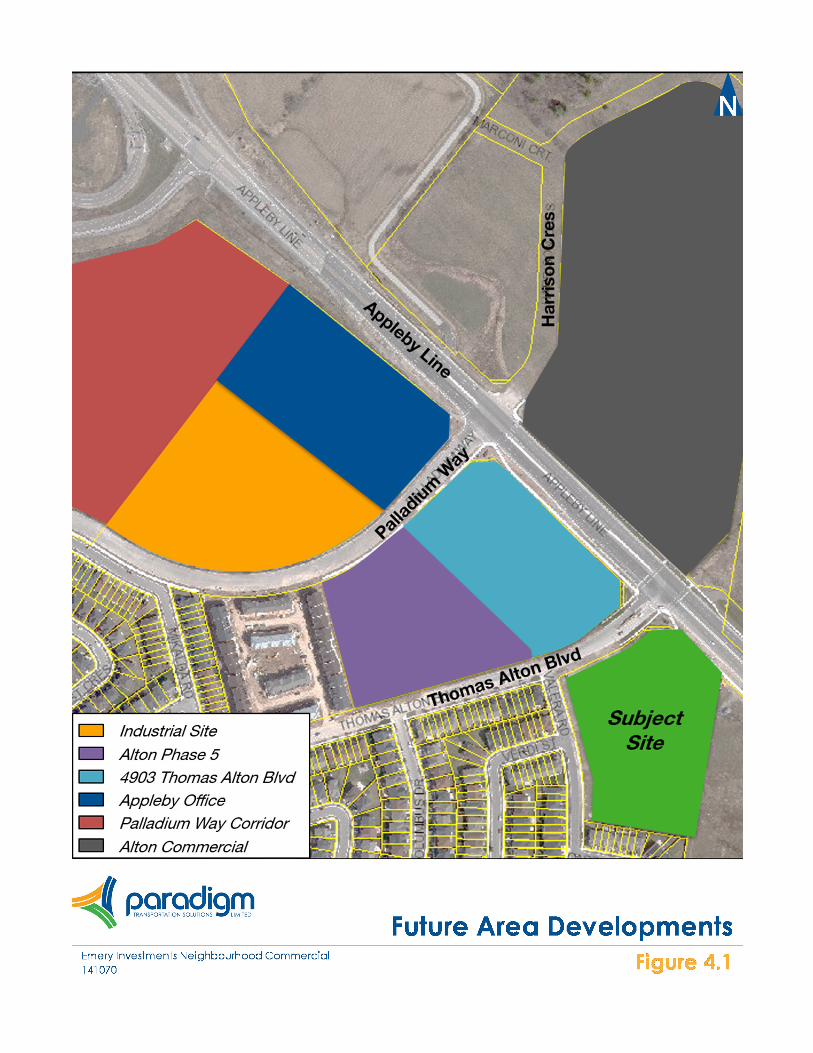
Traffic generated by the build-out of future surrounding developments. The sites of interest and the general location of each of the future developments plans is illustrated in Figure 4.1. The following development characteristics are noted:
Industrial Site, estimated to consist of approximately 12,245 square metres (131,800 square feet) of typical industrial land uses2;
Alton Phase 5, estimated to consist of approximately 242 residential condominiums/townhouses3;
4903 Thomas Alton Boulevard, estimated to consist of approximately 60,700 square feet of general office space and approximately 12,000 square feet of typical commercial retail space4;
Appleby Line Office Development, estimated to consist of approximately 268,710 square feet of typical office land uses;
2 ITE Trip Generation Estimates 3 Alton Phase 5 Traffic Impact Study, Paradigm Transportation Solutions Limited, October 2012 4 4903 Thomas Alton Boulevard – Traffic Assessment, Paradigm Transportation Solutions Limited, June 2011

Emery Investment’s Retail Site | Traffic Impact Study | 141070 | May 2015
Paradigm Transportation Solutions Limited | Page 18
Traffic generated by the build-out of the Palladium Way business corridor that is located north of Palladium Way between Appleby Line and Walkers Line5; and
The Alton Commercial Site6.
5 Emery Investments – Burlington Lands West of Appleby Line, City of Burlington Traffic Impact Study Addendum, BA Group Transportation Consultants, September 2007 6 Traffic Impact Study Alton Commercial Site Paletta International, Read, Voorhees & Associates, March 2012
Emery Investment’s Retail Site | Traffic Impact Study | 141070 | May 2015
Paradigm Transportation Solutions Limited | Page 19
Figure 4.1: Future Area Developments
Emery Investment’s Retail Site | Traffic Impact Study | 141070 | May 2015
Paradigm Transportation Solutions Limited | Page 20
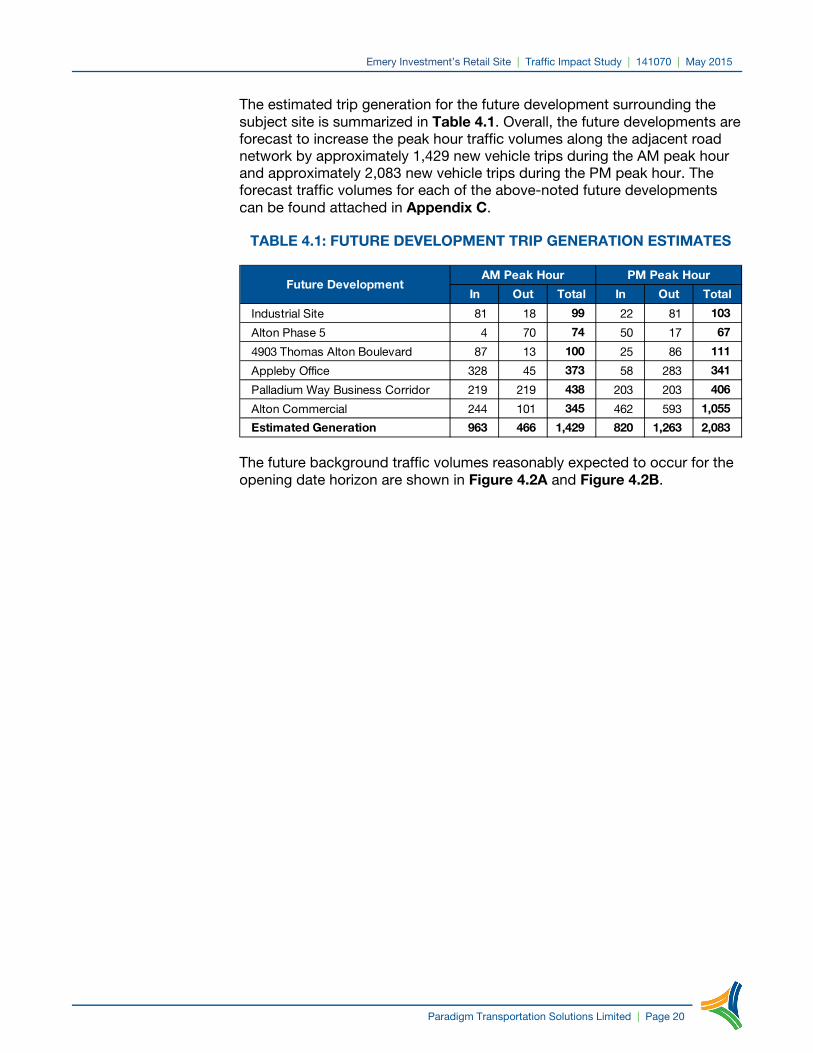
The estimated trip generation for the future development surrounding the subject site is summarized in Table 4.1. Overall, the future developments are forecast to increase the peak hour traffic volumes along the adjacent road network by approximately 1,429 new vehicle trips during the AM peak hour and approximately 2,083 new vehicle trips during the PM peak hour. The forecast traffic volumes for each of the above-noted future developments can be found attached in Appendix C.
TABLE 4.1: FUTURE DEVELOPMENT TRIP GENERATION ESTIMATES
The future background traffic volumes reasonably expected to occur for the opening date horizon are shown in Figure 4.2A and Figure 4.2B.
In Out Total In Out Total
Industrial Site 81 18 99 22 81 103
Alton Phase 5 4 70 74 50 17 67
4903 Thomas Alton Boulevard 87 13 100 25 86 111
Appleby Office 328 45 373 58 283 341
Palladium Way Business Corridor 219 219 438 203 203 406
Alton Commercial 244 101 345 462 593 1,055
Estimated Generation 963 466 1,429 820 1,263 2,083
Future DevelopmentAM Peak Hour PM Peak Hour

Emery Investment’s Retail Site | Traffic Impact Study | 141070 | May 2015
Paradigm Transportation Solutions Limited | Page 21
Figure 4.2A: Forecast Background Traffic – AM Peak Hour

Emery Investment’s Retail Site | Traffic Impact Study | 141070 | May 2015
Paradigm Transportation Solutions Limited | Page 22
Figure 4.2B: Forecast Background Traffic – PM Peak Hour

Emery Investment’s Retail Site | Traffic Impact Study | 141070 | May 2015
Paradigm Transportation Solutions Limited | Page 23
4.2 Background Traffic Operations
The operations of the intersections under the future background traffic conditions were evaluated using the same analytical approach that was used for the existing traffic operations along with the background traffic forecast volumes (Figure 4.1A and Figure 4.1B). No improvements to the road network are assumed to be in place. Signal timings have been optimized to help ensure that a reasonable level of service is maintained where possible. The resulting level of service conditions for the background traffic horizon are summarized in Table 4.2 and the following is noted:
AM Peak Hour
The 95th percentile queue length for the eastbound right-turn movement at the Appleby Line intersection with Thomas Alton Boulevard is estimated to extend beyond the available storage lane length for this movement. The extent of the queuing conditions estimated to occur is not anticipated to have a major impact on Appleby Line or Thomas Alton Boulevard. Eastbound queue lengths will need to be in the order of 130 metres before they begin to impact the Valera Road intersection.
No other movements at the study area intersections are considered to be critical.
PM Peak Hour
The 95th percentile queue length for the southbound left-turn and right-turn movements at the Appleby Line intersection with Thomas Alton Boulevard is estimated to extend beyond the available storage lane lengths. The extensive queueing may begin to impact the operation of southbound travel lanes on Appleby Line.
No other movements at the study area intersections are considered to be critical.
Detailed Synchro 9.0 output is provided in Appendix D.
The study area intersections appear to be designed with sufficient capacity to support the forecast background traffic and no geometric or traffic control improvements are required. Operationally, some modifications to the auxiliary turn lane storage lane lengths at the Appleby Line intersection with Thomas Alton Boulevard may be required in the future.

Emery Investment’s Retail Site | Traffic Impact Study | 141070 | May 2015
Paradigm Transportation Solutions Limited | Page 24
TABLE 4.2: BACKGROUND TRAFFIC OPERATIONS
Left
Thro
ugh
Rig
ht
Ap
pro
ach
Left
Thro
ugh
Rig
ht
Ap
pro
ach
Left
Thro
ugh
Rig
ht
Ap
pro
ach
Left
Thro
ugh
Rig
ht
Ap
pro
ach
LOS < C C C C C > C A A > A A A A A BDelay < 34.8 29.5 31.1 28.6 27.4 > 28.3 5.8 5.7 > 5.7 9.1 10.0 9.0 10.0 13.5V/C < 0.61 0.29 0.17 0.03 > 0.21 0.30 > 0.01 0.18 0.01 0.3995th < 49 42 17 9 > 27 60 > 5 50 8
Ex. < - 35 - - > 135 - > 50 - 50
Avail < - -7 - - > 108 - > 45 - 43
LOS < A > A < A > A < B > B < B > BDelay < 0.3 > 0.3 < 1.0 > 1.0 < 12.7 > 12.7 < 14.8 > 14.8V/C < 0.01 > < 0.01 > < 0.11 > < 0.02 >
95th < 6 > < 9 > < 14 > < 6 >
LOS A > A < A A A > ADelay 8.8 > 8.8 < 0.0 0.0 0.0 > 0.0V/C 0.02 > < 0.00 0.01 >
95th 12 > < 0 0 >
LOS < C C C D C > C C A > B C C C C CDelay < 26.9 25.9 26.2 36.1 25.8 > 33.3 26.6 6.9 > 13.1 23.6 31.4 23.1 30.4 23.0V/C < 0.26 0.15 0.69 0.14 > 0.78 0.28 > 0.09 0.75 0.12 0.7895th < 29 35 61 23 > 117 51 > 64 266 101
Ex. < - 35 - - > 135 - > 50 - 50
Avail < - 0 - - > 18 - > -14 - -51
LOS < A > A < A > A < B > B < C > CDelay < 0.1 > 0.1 < 1.6 > 1.6 < 11.6 > 11.6 < 24.3 > 24.3V/C < 0.00 > < 0.06 > < 0.06 > < 0.19 >
95th < 9 > < 24 > < 13 > < 18 >MOE - Measure of Effectiveness LOS - Level of Service > - Shared Right-Turn Lane Ex. - Existing Storage (m)TCS - Traffic Control Signal V/C - Volume to Capacity Ratio Q - Queue Length Avail. - Available Storage (m)TWSC - Two-Way Stop Control < - Shared Left-Turn Lane 95th - 95th Percentile Queue Length (m)
PM
Pea
k H
our
SouthboundNorthboundWestboundEastbound
AM
Pea
k H
our
1 - Appleby Line &Thomas Alton Boulevard
TCS
2 - Thomas Alton Boulevard &Valera Road TW
SC
Ana
lysi
s P
erio
d
IntersectionControl
TypeMOE
Direction / Movement / Approach
Ove
rall
3 - Verdi Street &Valera Road TW
SC
1 - Appleby Line &Thomas Alton Boulevard
TCS
2 - Thomas Alton Boulevard &Valera Road TW
SC

Emery Investment’s Retail Site | Traffic Impact Study | 141070 | May 2015
Paradigm Transportation Solutions Limited | Page 25
4.3 Future Total Traffic
The future total traffic volumes anticipated to occur in the study include the future background traffic volumes (Figure 4.2A and Figure 4.2B) and the site generated traffic volumes (Figure 3.1A and Figure 3.1B). The future total traffic reasonably expected to occur within the study area is shown in Figures 4.3A and Figure 4.3B. With the development of the subject site and the adjacent lands surrounding the subject site will essentially be fully built-out. The forecast traffic volumes are considered to be an upper limit for the area as no additional lands are anticipated to be developed.

Emery Investment’s Retail Site | Traffic Impact Study | 141070 | May 2015
Paradigm Transportation Solutions Limited | Page 26
Figure 4.3A: Forecast Total Traffic – AM Peak Hour

Emery Investment’s Retail Site | Traffic Impact Study | 141070 | May 2015
Paradigm Transportation Solutions Limited | Page 27
Figure 4.3B: Forecast Total Traffic – PM Peak Hour
Emery Investment’s Retail Site | Traffic Impact Study | 141070 | May 2015
Paradigm Transportation Solutions Limited | Page 28
4.4 Future Total Traffic Operations
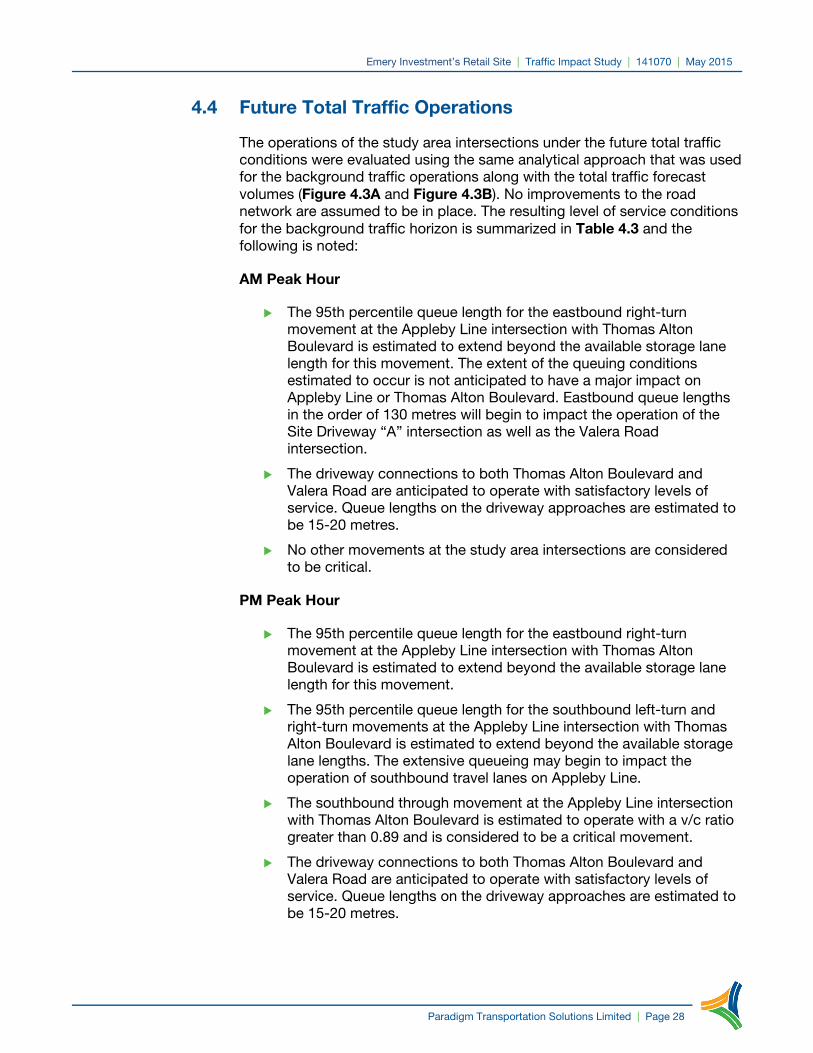
The operations of the study area intersections under the future total traffic conditions were evaluated using the same analytical approach that was used for the background traffic operations along with the total traffic forecast volumes (Figure 4.3A and Figure 4.3B). No improvements to the road network are assumed to be in place. The resulting level of service conditions for the background traffic horizon is summarized in Table 4.3 and the following is noted:
AM Peak Hour
The 95th percentile queue length for the eastbound right-turn movement at the Appleby Line intersection with Thomas Alton Boulevard is estimated to extend beyond the available storage lane length for this movement. The extent of the queuing conditions estimated to occur is not anticipated to have a major impact on Appleby Line or Thomas Alton Boulevard. Eastbound queue lengths in the order of 130 metres will begin to impact the operation of the Site Driveway “A” intersection as well as the Valera Road intersection.
The driveway connections to both Thomas Alton Boulevard and Valera Road are anticipated to operate with satisfactory levels of service. Queue lengths on the driveway approaches are estimated to be 15-20 metres.
No other movements at the study area intersections are considered to be critical.
PM Peak Hour
The 95th percentile queue length for the eastbound right-turn movement at the Appleby Line intersection with Thomas Alton Boulevard is estimated to extend beyond the available storage lane length for this movement.
The 95th percentile queue length for the southbound left-turn and right-turn movements at the Appleby Line intersection with Thomas Alton Boulevard is estimated to extend beyond the available storage lane lengths. The extensive queueing may begin to impact the operation of southbound travel lanes on Appleby Line.
The southbound through movement at the Appleby Line intersection with Thomas Alton Boulevard is estimated to operate with a v/c ratio greater than 0.89 and is considered to be a critical movement.
The driveway connections to both Thomas Alton Boulevard and Valera Road are anticipated to operate with satisfactory levels of service. Queue lengths on the driveway approaches are estimated to be 15-20 metres.

Emery Investment’s Retail Site | Traffic Impact Study | 141070 | May 2015
Paradigm Transportation Solutions Limited | Page 29
No other movements at the study area intersections are considered to be critical.
Detailed Synchro 9.0 output is provided in Appendix E.
The study area intersections appear to be designed with sufficient capacity to support the development of the subject site. From a capacity prospective, no geometric or traffic control improvements are required to support the development of the subject site. Operationally, some modifications to the auxiliary turn lane storage lane lengths at the Appleby Line intersection with Thomas Alton Boulevard may be required in the future.
TABLE 4.3: TOTAL TRAFFIC OPERATIONS
Left
Thro
ugh
Rig
ht
Ap
pro
ach
Left
Thro
ugh
Rig
ht
Ap
pro
ach
Left
Thro
ugh
Rig
ht
Ap
pro
ach
Left
Thro
ugh
Rig
ht
Ap
pro
ach
LOS < C C C C C > C A A > A B B B B BDelay < 33.8 28.9 30.5 26.7 25.4 > 26.4 6.8 6.8 > 6.8 10.5 11.6 10.4 11.6 14.6V/C < 0.64 0.42 0.17 0.03 > 0.25 0.31 > 0.02 0.19 0.01 0.4295th < 50 48 17 9 > 29 63 > 4 54 9
Ex. < - 35 - - > 135 - > 50 - 50
Avail < - -13 - - > 107 - > 46 - 42
LOS < A > A < A > A < B > B < C > CDelay < 0.3 > 0.3 < 1.0 > 1.0 < 13.1 > 13.1 < 15.5 > 15.5V/C < 0.01 > < 0.02 > < 0.13 > < 0.02 >
95th < 7 > < 11 > < 14 > < 8 >
LOS < A > A < A > A < A > A < A > ADelay < 9.0 > 9.0 < 8.5 > 8.5 < 0.0 > 0.0 < 1.5 > 1.5V/C < 0.02 > < 0.01 > < 0.00 > < 0.00 >
95th < 11 > < 0 > < 0 > < 9 >
A > A < A A B > B0.0 > 0.0 < 0.8 0.8 15.0 > 15.0
0.37 > < 0.01 0.21 >
95th 0 > < 11 18 >
LOS < C C C D C > C C A > B C D C D CDelay < 26.9 26.1 26.3 36.4 25.8 > 33.7 23.0 6.9 > 12.3 27.1 40.3 26.5 38.5 25.9V/C < 0.27 0.17 0.69 0.14 > 0.75 0.28 > 0.11 0.89 0.14 0.7895th < 34 36 58 25 > 119 53 > 68 350 109
Ex. < - 35 - - > 135 - > 50 - 50
Avail < - -1 - - > 16 - > -18 - -59
LOS < A > A < A > A < B > B < D > DDelay < 0.1 > 0.1 < 1.8 > 1.8 < 12.9 > 12.9 < 27.0 > 27.0V/C < 0.00 > < 0.07 > < 0.08 > < 0.22 >
95th < 13 > < 26 > < 13 > < 16 >
LOS < A > A < A > A < A > A < A > ADelay < 9.4 > 9.4 < 8.4 > 8.4 < 0.0 > 0.0 < 0.9 > 0.9V/C < 0.01 > < 0.00 > < 0.00 > < 0.01 >
95th < 9 > < 6 > < 0 > < 1 >
LOS A > A < A A C > CDelay 0.0 > 0.0 < 1.2 1.2 17.5 > 17.5V/C 0.21 > < 0.05 0.14 >Q 1 > < 24 16 >
MOE - Measure of Effectiveness LOS - Level of Service > - Shared Right-Turn Lane Ex. - Existing Storage (m)
TCS - Traffic Control Signal V/C - Volume to Capacity Ratio Q - Queue Length Avail. - Available Storage (m)TWSC - Two-Way Stop Control < - Shared Left-Turn Lane 95th - 95th Percentile Queue Length (m)
AM
Pea
k H
our
1 - Appleby Line &Thomas Alton Boulevard
TCS
2 - Thomas Alton Boulevard &Valera Road TW
SC
4 - Thomas Alton Boulevard &Driveway "A" TW
SC
Ana
lysi
s P
erio
d
IntersectionControl
TypeMOE
Direction / Movement / Approach
SouthboundNorthboundWestboundEastbound
Ove
rall
3 - Verdi Street &Valera Road TW
SC
PM
Pea
k H
our
1 - Appleby Line &Thomas Alton Boulevard
TCS
2 - Thomas Alton Boulevard &Valera Road TW
SC
3 - Verdi Street &Valera Road TW
SC
4 - Thomas Alton Boulevard &Driveway "A" TW
SC
Emery Investment’s Retail Site | Traffic Impact Study | 141070 | May 2015
Paradigm Transportation Solutions Limited | Page 30
5 Assessment of Improvements The level of service conditions outlined in Section 4.0 indicate that the study area intersections are anticipated to operate with supportable levels of service during the AM and PM peak hours. Several movements are estimated to experience higher than ideal v/c ratios and queue lengths greater than the current available storage lane lengths. The following section discusses the need auxiliary turn-lane storage requirements and the site’s impact on the existing road network.
5.1 Auxiliary Turn Lane Storage Requirements
The capacity issues outlined in Table 4.3 are primarily related to the queuing conditions at the signalized intersection of Appleby Line and Thomas Alton Boulevard. Appleby Line has been recently reconstructed between Taywood Drive and Highway 407 ETR. To accommodate the estimated 95th percentile queue lengths likely to occur following the build-out of the subject site the following modifications to the existing auxiliary turn lanes should be considered:
Appleby Line & Thomas Alton Boulevard
Eastbound right-turn lane – 15 metres of additional storage, 50 total metres of storage;
Southbound left-turn lane – 20 metres of additional storage, 70 total metres of storage; and
Southbound right-turn lane – 60 metres of additional storage, 110 total metres of storage.
It is recommended that the City of Burlington and the Halton Region monitor the operation of the intersections in the study area to ensure appropriate signal timings are in place and that queuing conditions do not deteriorate to a point where the operation of the intersections is reduced. If the queuing conditions deteriorate additional storage should be considered, where feasible.
5.2 Site Access Provisions
The level of service conditions outlined in Table 4.3 indicate that no intersection capacity-related improvements are necessary to accommodate the site driveway connections to either Thomas Alton Boulevard or Valera Road. The driveway intersections are anticipated to operate with low levels of delay that would not suggest the need for auxiliary turn lanes.
However, when the number of left-turning vehicles is such that it creates a hazard or reduces capacity, provisions of a separate left-turn lane should be considered. To support a left-turn movement from Thomas Alton Boulevard into the subject site at the Driveway “A”, an auxiliary left-turn lane should be
Emery Investment’s Retail Site | Traffic Impact Study | 141070 | May 2015
Paradigm Transportation Solutions Limited | Page 31
provided. The provision of a left-turn lane will separate turning traffic from through traffic and reduce any likelihood of queued westbound vehicles impacting the operation of the signalized Appleby Line intersection. Provision of this turn lane may also reduce the potential for rear-end collisions.
Based on the MTO left-turn lane warrants7 the following turn lanes are warranted along Thomas Alton Boulevard:
Thomas Alton Boulevard at Driveway “A” – Westbound left-turn lane with 25 metres of storage; and
Thomas Alton Boulevard at Valera Road – Eastbound left-turn lane with 25 metres of storage.
The left-turn lane warrant nomographs can be found attached in Appendix F.
The feasibility of developing the above noted turn lanes on Thomas Alton Boulevard should be further investigated. The proximity of the Valera Road and Driveway “A” intersections will present some design challenges. The spacing between the intersections is noted to be approximately 50 metres. Developing an auxiliary left-turn lane within this spacing will result in a substandard design.
7 Geometric Design Manual for Ontario Highways, Ministry of Transportation of Ontario, Queen’s Printer for Ontario, 1986
Emery Investment’s Retail Site | Traffic Impact Study | 141070 | May 2015
Paradigm Transportation Solutions Limited | Page 32
6 Conclusions & Recommendations
6.1 Conclusions
The main findings and conclusions of this study are as follows:
Proposed Development: The subject site could be developed to a maximum of 407 condominium apartment units under the high density residential designation contained in the Official Plan. The subject site’s parking demand is anticipated to be accommodated on site through use of an integrated parking structure.
Vehicular access to the subject site will be provided by a single driveway connection to Thomas Alton Boulevard, Driveway “A”, located approximately 50 metres (centre line to centreline) east of Valera Road and a single driveway connection to Valera Road opposite to Verdi Street.
Development Generated Traffic: The development of the subject site is estimated to generate approximately 147 total vehicle trips during the AM peak hour and approximately 153 total vehicle trips during the PM peak hour. A ten percent reduction in trip generation has been applied to account for transit oriented trips to/from the development. As a result the site’s net generation is estimated to be 132 AM peak hour trips and 137 PM peak hour trips.
Existing Traffic Conditions: The Appleby Line intersection with Thomas Alton Boulevard, and Valera Road intersections with Thomas Alton Boulevard and Verdi Street generally define the study area. From a capacity perspective, these intersections are currently operating with satisfactory levels of service during the AM and PM peak hours.
Forecast Background Traffic: The forecast background traffic volumes in the vicinity of the subject site have been assessed for a six-year horizon following the anticipated build-out of the subject site, Year 2021. The forecast traffic volumes are estimated to consist of a generalized growth rate of 2 percent per annum in addition to traffic related to the build-out of the surrounding lands.
Background Traffic Conditions: The study area intersections are anticipated to continue to operate with satisfactory levels of service during the AM and PM peak hours. Queuing issues at the Appleby Line intersection with Thomas Alton Boulevard are anticipated to occur.
Total Traffic Conditions: The study area intersections are anticipated to continue to operate with satisfactory levels of service during the AM and PM peak hours. Queuing issues at the Appleby Line intersection with Thomas Alton Boulevard are anticipated to continue to occur. Additionally, several movements are estimated to have v/c ratios greater than 0.85. These movements are not
Emery Investment’s Retail Site | Traffic Impact Study | 141070 | May 2015
Paradigm Transportation Solutions Limited | Page 33
considered overly critical as the area is generally anticipated to be fully built-out.
Roadway Improvements: To accommodate the forecast traffic volumes the eastbound right-turn along with the southbound left-turn and right-turn movements at the Appleby Line intersection with Thomas Alton Boulevard require additional storage.
A westbound left-turn lanes are warranted at the Thomas Alton Boulevard intersection with Valera Road and Driveway “A”.
6.2 Recommendations
Based on the findings of this study, the following is recommended:
When a final site concept plan is prepared an updated traffic impact study be prepared at the rezoning and site plan approval stage to document the site’s detailed impact on the adjacent road network. The following items should be identified on the future site plan:
The layout of building(s) and parking structures on site;
The layout and positioning of the site driveway connections to Thomas Alton Boulevard and Valera Road. The Thomas Alton Boulevard driveway connection will likely warrant the need for an auxiliary turn lane. The feasibly of providing this turn lane will need further review; and
The Transportation Demand Management measures outline in Section 3.3.
It is recommended that the City of Burlington and Region of Halton monitor the operation of the Appleby Line intersection with Thomas Alton Boulevard to ensure appropriate signal timings are in place and that queuing conditions do not deteriorate to a point where the operation of the signalized intersections are reduced. Should queue conditions deteriorate, consideration for additional storage lane lengths be considered, where feasible.
The City of Burlington review the proposed geometrics at the Valera Road intersection with Thomas Alton Boulevard and consider developing a westbound left-turn lane with 25 metres of storage.
No other roadway or traffic control improvements are required or recommended at this time to accommodate the future traffic within the study area.


Emery Investment’s Retail Site | Traffic Impact Study | 141070 | May 2015
Paradigm Transportation Solutions Limited | Appendices
Appendix A
Existing Count Data


Paradigm Transportation Solutions Limited22 King Street South, Suite 300
Waterloo, Ontario, Canada N2J 1N8519-896-3163 [email protected]
Count Name: Appleby Line & T AltonSite Code:Start Date: 03/19/2015Page No: 1
Turning Movement Data
Start Time
Appleby Line Thomas Alton Blvd Appleby Line Thomas Alton Blvd
Southbound Westbound Northbound Eastbound
Right Thru Left U-Turn Peds App.Total Right Thru Left U-Turn Peds App.
Total Right Thru Left U-Turn Peds App.Total Right Thru Left U-Turn Peds App.
Total Int. Total
7:00 AM 2 53 0 0 0 55 0 0 1 0 0 1 1 114 15 0 0 130 44 0 21 0 2 65 251
7:15 AM 5 79 0 0 0 84 1 0 1 0 0 2 3 134 11 0 0 148 66 0 34 0 0 100 334
7:30 AM 3 82 0 0 2 85 0 0 0 0 0 0 4 147 19 0 0 170 87 0 32 0 0 119 374
7:45 AM 2 116 0 1 0 119 0 0 2 0 0 2 11 164 27 0 0 202 77 1 32 0 0 110 433
Hourly Total 12 330 0 1 2 343 1 0 4 0 0 5 19 559 72 0 0 650 274 1 119 0 2 394 1392
8:00 AM 2 102 0 0 0 104 0 2 2 0 0 4 6 132 15 0 0 153 86 1 25 0 0 112 373
8:15 AM 5 104 0 0 0 109 0 1 4 0 0 5 9 142 25 0 0 176 81 0 28 1 0 110 400
8:30 AM 2 103 0 0 0 105 0 1 7 0 0 8 12 126 15 0 0 153 62 0 30 0 0 92 358
8:45 AM 3 93 0 0 0 96 1 0 9 0 0 10 6 119 28 0 0 153 58 1 24 0 0 83 342
Hourly Total 12 402 0 0 0 414 1 4 22 0 0 27 33 519 83 0 0 635 287 2 107 1 0 397 1473
*** BREAK *** - - - - - - - - - - - - - - - - - - - - - - - - -
3:00 PM 9 91 0 0 0 100 3 3 25 0 0 31 14 77 35 0 0 126 37 2 8 0 0 47 304
3:15 PM 5 124 0 0 0 129 2 2 18 0 0 22 22 98 53 0 0 173 44 0 7 0 0 51 375
3:30 PM 12 124 0 0 0 136 1 3 16 0 0 20 20 96 36 0 0 152 22 3 5 0 1 30 338
3:45 PM 13 120 0 0 0 133 0 1 21 0 0 22 20 105 56 0 0 181 38 2 3 0 0 43 379
Hourly Total 39 459 0 0 0 498 6 9 80 0 0 95 76 376 180 0 0 632 141 7 23 0 1 171 1396
4:00 PM 19 135 0 0 0 154 1 5 19 0 0 25 18 124 58 0 0 200 47 1 6 0 0 54 433
4:15 PM 16 129 0 0 0 145 3 0 16 0 0 19 20 151 62 0 0 233 42 0 5 0 0 47 444
4:30 PM 16 181 0 0 0 197 3 5 9 0 0 17 11 113 55 0 0 179 38 2 6 0 0 46 439
4:45 PM 22 186 0 0 0 208 0 3 6 0 0 9 13 120 94 0 0 227 47 1 8 0 0 56 500
Hourly Total 73 631 0 0 0 704 7 13 50 0 0 70 62 508 269 0 0 839 174 4 25 0 0 203 1816
5:00 PM 27 182 0 0 0 209 0 1 19 0 0 20 12 158 89 0 0 259 54 0 6 0 0 60 548
5:15 PM 39 188 0 0 0 227 0 3 12 0 0 15 18 136 90 0 0 244 41 1 10 0 1 52 538
5:30 PM 33 172 0 0 0 205 0 2 11 0 0 13 16 143 99 0 0 258 43 2 9 0 0 54 530
5:45 PM 25 173 1 0 0 199 0 1 11 0 0 12 12 91 74 0 0 177 52 1 5 0 0 58 446
Hourly Total 124 715 1 0 0 840 0 7 53 0 0 60 58 528 352 0 0 938 190 4 30 0 1 224 2062
Grand Total 260 2537 1 1 2 2799 15 33 209 0 0 257 248 2490 956 0 0 3694 1066 18 304 1 4 1389 8139
Approach % 9.3 90.6 0.0 0.0 - - 5.8 12.8 81.3 0.0 - - 6.7 67.4 25.9 0.0 - - 76.7 1.3 21.9 0.1 - - -
Total % 3.2 31.2 0.0 0.0 - 34.4 0.2 0.4 2.6 0.0 - 3.2 3.0 30.6 11.7 0.0 - 45.4 13.1 0.2 3.7 0.0 - 17.1 -
Lights 256 2451 1 1 - 2709 14 33 209 0 - 256 246 2370 937 0 - 3553 1047 18 300 1 - 1366 7884
% Lights 98.5 96.6 100.0 100.0 - 96.8 93.3 100.0 100.0 - - 99.6 99.2 95.2 98.0 - - 96.2 98.2 100.0 98.7 100.0 - 98.3 96.9
Mediums 3 61 0 0 - 64 1 0 0 0 - 1 1 88 19 0 - 108 19 0 4 0 - 23 196
% Mediums 1.2 2.4 0.0 0.0 - 2.3 6.7 0.0 0.0 - - 0.4 0.4 3.5 2.0 - - 2.9 1.8 0.0 1.3 0.0 - 1.7 2.4
Articulated Trucks 1 25 0 0 - 26 0 0 0 0 - 0 1 32 0 0 - 33 0 0 0 0 - 0 59
% ArticulatedTrucks 0.4 1.0 0.0 0.0 - 0.9 0.0 0.0 0.0 - - 0.0 0.4 1.3 0.0 - - 0.9 0.0 0.0 0.0 0.0 - 0.0 0.7
Pedestrians - - - - 2 - - - - - 0 - - - - - 0 - - - - - 4 - -
% Pedestrians - - - - 100.0 - - - - - - - - - - - - - - - - - 100.0 - -

Paradigm Transportation Solutions Limited22 King Street South, Suite 300
Waterloo, Ontario, Canada N2J 1N8519-896-3163 [email protected]
Count Name: Appleby Line & T AltonSite Code:Start Date: 03/19/2015Page No: 3
03/19/2015 7:00 AMEnding At03/19/2015 6:00 PM
LightsMediumsArticulated TrucksPedestrians
Appleby Line [N]
Out In Total
2685 2709 5394
93 64 157
32 26 58
0 0 0
2810 2799 5609
256 2451 1 1 0
3 61 0 0 0
1 25 0 0 0
0 0 0 0 2
260 2537 1 1 2R T L U P
267 0 1 1 265
Out
257 0 0 1 256
In
524 0 1 2 521
Total
Thomas A
lton Blvd [E
]
R 15 0 0 1 14
T 33 0 0 0 33
L 209 0 0 0 209
U 0 0 0 0 0
P 0 0 0 0 0
3707 3553 7260
80 108 188
25 33 58
0 0 0
3812 3694 7506Out In Total
Appleby Line [S]
U L T R P
0 937 2370 246 0
0 19 88 1 0
0 0 32 1 0
0 0 0 0 0
0 956 2490 248 0
Thom
as A
lton
Blv
d [W
]
Tota
l
2593 45 1 0
2639
In
1366 23 0 0
1389
Out
1227 22 1 0
1250
1 0 0 0 1 U
300 4 0 0 304 L
18 0 0 0 18 T
1047 19 0 0
1066 R
0 0 0 4 4 P
Turning Movement Data Plot
Paradigm Transportation Solutions Limited22 King Street South, Suite 300
Waterloo, Ontario, Canada N2J 1N8519-896-3163 [email protected]
Count Name: Appleby Line & T AltonSite Code:Start Date: 03/19/2015Page No: 4
Turning Movement Peak Hour Data (7:30 AM)
Start Time
Appleby Line Thomas Alton Blvd Appleby Line Thomas Alton Blvd
Southbound Westbound Northbound Eastbound
Right Thru Left U-Turn Peds App.Total Right Thru Left U-Turn Peds App.
Total Right Thru Left U-Turn Peds App.Total Right Thru Left U-Turn Peds App.
Total Int. Total
7:30 AM 3 82 0 0 2 85 0 0 0 0 0 0 4 147 19 0 0 170 87 0 32 0 0 119 374
7:45 AM 2 116 0 1 0 119 0 0 2 0 0 2 11 164 27 0 0 202 77 1 32 0 0 110 433
8:00 AM 2 102 0 0 0 104 0 2 2 0 0 4 6 132 15 0 0 153 86 1 25 0 0 112 373
8:15 AM 5 104 0 0 0 109 0 1 4 0 0 5 9 142 25 0 0 176 81 0 28 1 0 110 400
Total 12 404 0 1 2 417 0 3 8 0 0 11 30 585 86 0 0 701 331 2 117 1 0 451 1580
Approach % 2.9 96.9 0.0 0.2 - - 0.0 27.3 72.7 0.0 - - 4.3 83.5 12.3 0.0 - - 73.4 0.4 25.9 0.2 - - -
Total % 0.8 25.6 0.0 0.1 - 26.4 0.0 0.2 0.5 0.0 - 0.7 1.9 37.0 5.4 0.0 - 44.4 20.9 0.1 7.4 0.1 - 28.5 -
PHF 0.600 0.871 0.000 0.250 - 0.876 0.000 0.375 0.500 0.000 - 0.550 0.682 0.892 0.796 0.000 - 0.868 0.951 0.500 0.914 0.250 - 0.947 0.912
Lights 12 380 0 1 - 393 0 3 8 0 - 11 29 564 80 0 - 673 327 2 117 1 - 447 1524
% Lights 100.0 94.1 - 100.0 - 94.2 - 100.0 100.0 - - 100.0 96.7 96.4 93.0 - - 96.0 98.8 100.0 100.0 100.0 - 99.1 96.5
Mediums 0 19 0 0 - 19 0 0 0 0 - 0 0 17 6 0 - 23 4 0 0 0 - 4 46
% Mediums 0.0 4.7 - 0.0 - 4.6 - 0.0 0.0 - - 0.0 0.0 2.9 7.0 - - 3.3 1.2 0.0 0.0 0.0 - 0.9 2.9
Articulated Trucks 0 5 0 0 - 5 0 0 0 0 - 0 1 4 0 0 - 5 0 0 0 0 - 0 10
% ArticulatedTrucks 0.0 1.2 - 0.0 - 1.2 - 0.0 0.0 - - 0.0 3.3 0.7 0.0 - - 0.7 0.0 0.0 0.0 0.0 - 0.0 0.6
Pedestrians - - - - 2 - - - - - 0 - - - - - 0 - - - - - 0 - -
% Pedestrians - - - - 100.0 - - - - - - - - - - - - - - - - - - - -
Paradigm Transportation Solutions Limited22 King Street South, Suite 300
Waterloo, Ontario, Canada N2J 1N8519-896-3163 [email protected]
Count Name: Appleby Line & T AltonSite Code:Start Date: 03/19/2015Page No: 5
Peak Hour Data
03/19/2015 7:30 AMEnding At03/19/2015 8:30 AM
LightsMediumsArticulated TrucksPedestrians
Appleby Line [N]
Out In Total
682 393 1075
17 19 36
4 5 9
0 0 0
703 417 1120
12 380 0 1 0
0 19 0 0 0
0 5 0 0 0
0 0 0 0 2
12 404 0 1 2R T L U P
32 0 1 0 31
Out
11 0 0 0 11 In
43 0 1 0 42
Total
Thomas A
lton Blvd [E
]
R 0 0 0 0 0
T 3 0 0 0 3
L 8 0 0 0 8
U 0 0 0 0 0
P 0 0 0 0 0
715 673 1388
23 23 46
5 5 10
0 0 0
743 701 1444Out In Total
Appleby Line [S]
U L T R P
0 80 564 29 0
0 6 17 0 0
0 0 4 1 0
0 0 0 0 0
0 86 585 30 0
Thom
as A
lton
Blv
d [W
]
Tota
l
543
10 0 0 553
In 447 4 0 0 451
Out 96 6 0 0 102
1 0 0 0 1 U
117 0 0 0 117 L
2 0 0 0 2 T
327 4 0 0 331 R
0 0 0 0 0 P
Turning Movement Peak Hour Data Plot (7:30 AM)
Paradigm Transportation Solutions Limited22 King Street South, Suite 300
Waterloo, Ontario, Canada N2J 1N8519-896-3163 [email protected]
Count Name: Appleby Line & T AltonSite Code:Start Date: 03/19/2015Page No: 6
Turning Movement Peak Hour Data (4:45 PM)
Start Time
Appleby Line Thomas Alton Blvd Appleby Line Thomas Alton Blvd
Southbound Westbound Northbound Eastbound
Right Thru Left U-Turn Peds App.Total Right Thru Left U-Turn Peds App.
Total Right Thru Left U-Turn Peds App.Total Right Thru Left U-Turn Peds App.
Total Int. Total
4:45 PM 22 186 0 0 0 208 0 3 6 0 0 9 13 120 94 0 0 227 47 1 8 0 0 56 500
5:00 PM 27 182 0 0 0 209 0 1 19 0 0 20 12 158 89 0 0 259 54 0 6 0 0 60 548
5:15 PM 39 188 0 0 0 227 0 3 12 0 0 15 18 136 90 0 0 244 41 1 10 0 1 52 538
5:30 PM 33 172 0 0 0 205 0 2 11 0 0 13 16 143 99 0 0 258 43 2 9 0 0 54 530
Total 121 728 0 0 0 849 0 9 48 0 0 57 59 557 372 0 0 988 185 4 33 0 1 222 2116
Approach % 14.3 85.7 0.0 0.0 - - 0.0 15.8 84.2 0.0 - - 6.0 56.4 37.7 0.0 - - 83.3 1.8 14.9 0.0 - - -
Total % 5.7 34.4 0.0 0.0 - 40.1 0.0 0.4 2.3 0.0 - 2.7 2.8 26.3 17.6 0.0 - 46.7 8.7 0.2 1.6 0.0 - 10.5 -
PHF 0.776 0.968 0.000 0.000 - 0.935 0.000 0.750 0.632 0.000 - 0.713 0.819 0.881 0.939 0.000 - 0.954 0.856 0.500 0.825 0.000 - 0.925 0.965
Lights 121 719 0 0 - 840 0 9 48 0 - 57 59 543 369 0 - 971 178 4 32 0 - 214 2082
% Lights 100.0 98.8 - - - 98.9 - 100.0 100.0 - - 100.0 100.0 97.5 99.2 - - 98.3 96.2 100.0 97.0 - - 96.4 98.4
Mediums 0 6 0 0 - 6 0 0 0 0 - 0 0 12 3 0 - 15 7 0 1 0 - 8 29
% Mediums 0.0 0.8 - - - 0.7 - 0.0 0.0 - - 0.0 0.0 2.2 0.8 - - 1.5 3.8 0.0 3.0 - - 3.6 1.4
Articulated Trucks 0 3 0 0 - 3 0 0 0 0 - 0 0 2 0 0 - 2 0 0 0 0 - 0 5
% ArticulatedTrucks 0.0 0.4 - - - 0.4 - 0.0 0.0 - - 0.0 0.0 0.4 0.0 - - 0.2 0.0 0.0 0.0 - - 0.0 0.2
Pedestrians - - - - 0 - - - - - 0 - - - - - 0 - - - - - 1 - -
% Pedestrians - - - - - - - - - - - - - - - - - - - - - - 100.0 - -

Paradigm Transportation Solutions Limited22 King Street South, Suite 300
Waterloo, Ontario, Canada N2J 1N8519-896-3163 [email protected]
Count Name: Appleby Line & T AltonSite Code:Start Date: 03/19/2015Page No: 7
Peak Hour Data
03/19/2015 4:45 PMEnding At03/19/2015 5:45 PM
LightsMediumsArticulated TrucksPedestrians
Appleby Line [N]
Out In Total
575 840 1415
13 6 19
2 3 5
0 0 0
590 849 1439
121 719 0 0 0
0 6 0 0 0
0 3 0 0 0
0 0 0 0 0
121 728 0 0 0R T L U P
63 0 0 0 63
Out
57 0 0 0 57 In
120 0 0 0 120
Total
Thomas A
lton Blvd [E
]
R 0 0 0 0 0
T 9 0 0 0 9
L 48 0 0 0 48
U 0 0 0 0 0
P 0 0 0 0 0
945 971 1916
13 15 28
3 2 5
0 0 0
961 988 1949Out In Total
Appleby Line [S]
U L T R P
0 369 543 59 0
0 3 12 0 0
0 0 2 0 0
0 0 0 0 0
0 372 557 59 0
Thom
as A
lton
Blv
d [W
]
Tota
l
713
11 0 0 724
In 214 8 0 0 222
Out
499 3 0 0 502
0 0 0 0 0 U
32 1 0 0 33 L
4 0 0 0 4 T
178 7 0 0 185 R
0 0 0 1 1 P
Turning Movement Peak Hour Data Plot (4:45 PM)

L T R L T R L T R L T R L T R L T R 0 T R L T R07:15 0 89 0 0 0 0 1 0 1 15 0 0 2 0 0 0 0 0 8 0 0 0 0 0 0 0 0 0 0 0 0 0 11607:30 0 90 0 0 1 0 0 0 2 10 0 0 0 0 0 0 0 12 0 0 0 0 0 0 0 0 0 0 0 0 0 11507:45 0 112 0 0 1 0 0 0 4 17 0 0 2 0 0 0 1 0 14 1 0 0 0 0 0 1 0 0 0 0 0 0 15308:00 0 105 0 0 1 0 0 0 2 17 0 0 3 0 0 0 0 0 13 0 0 0 0 0 0 0 0 0 0 0 0 0 141 52508:15 0 97 0 0 0 0 0 0 4 18 0 0 0 0 0 0 0 11 0 0 0 0 1 0 0 0 0 0 0 0 0 131 54008:30 0 90 0 0 1 0 0 0 2 16 0 0 1 0 0 0 0 0 9 0 0 0 0 0 0 0 0 0 0 0 0 0 119 544
15:45 0 35 0 0 0 0 0 0 7 39 0 0 0 0 0 0 0 0 4 0 0 0 0 0 0 0 0 0 0 0 0 0 8516:00 0 25 0 0 1 0 0 0 6 40 1 0 0 0 0 1 0 0 5 0 0 0 0 0 0 0 0 0 0 0 0 0 7916:15 1 33 1 0 1 0 0 0 8 70 0 0 0 0 0 0 0 0 5 0 0 0 0 0 2 0 2 0 0 0 0 0 12316:30 5 50 0 0 0 0 0 0 9 90 2 0 1 0 0 0 3 0 3 0 0 0 0 0 1 1 1 0 0 0 0 0 166 45316:45 1 47 2 0 1 0 0 0 13 85 0 0 1 0 0 0 1 0 1 0 0 0 0 0 2 0 1 0 0 0 2 0 157 52517:00 0 28 0 0 1 0 0 0 8 102 0 0 0 0 0 0 0 0 8 0 0 0 0 1 0 1 3 0 0 0 3 1 156 60217:15 1 40 4 0 1 0 0 0 19 93 2 0 2 0 0 0 1 0 4 0 0 0 0 0 0 1 2 0 0 0 0 0 170 64917:30 0 32 4 0 1 0 0 0 19 105 0 0 1 0 0 0 0 0 6 0 0 0 0 0 0 0 1 0 0 0 0 0 169 65217:45 0 41 2 0 2 0 0 0 14 111 2 0 0 0 0 1 1 0 8 0 0 0 0 1 0 0 1 0 0 0 0 0 184 67918:00 1 37 2 0 1 0 0 0 12 102 2 0 1 0 0 1 1 0 4 0 0 0 0 0 2 0 1 0 0 0 3 0 170 693
L T R L T R L T R L T R L T R L T R L T R L T R08:45 5 0 0 0 0 0 0 0 0 0 0 0 0 0 0 0 0 11 0 0 0 0 0 0 0 1 1 0 0 0 0 0 1809:00 4 0 0 0 0 0 0 0 0 0 0 0 0 0 0 0 0 10 0 0 0 0 0 0 0 0 1 0 0 0 0 0 15
15:15 2 0 0 0 0 0 0 0 0 0 0 0 0 0 0 0 0 4 0 0 0 0 0 0 0 5 4 0 0 0 0 0 1515:30 2 0 0 0 0 0 0 0 0 0 0 0 0 0 0 0 0 4 0 0 0 0 0 0 0 10 1 0 0 0 0 0 17
TIME15
MINSUM
60MINSUM
CAR
&Thomas Alton Boulevard Valera RoadDate: 17-Jul-14 Counted By:
SouthboundNorthboundWestbound
AG
EastboundMurdoch StreetWebber Road
HV PED CYCCYC CAR HV PED CYC CARHV PED CYC CAR HV PED
Thomas Alton Boulevard & Valera RoadDate: 17-Jul-14 Counted By: AG
TIME
Webber Road Murdoch Street 15MINSUM
60MINSUM
Eastbound Westbound Northbound SouthboundCAR HV PED CYC CAR HV PED CYC CAR HV PED CYC CAR HV PED CYC

Emery Investment’s Retail Site | Traffic Impact Study | 141070 | May 2015
Paradigm Transportation Solutions Limited | Appendices
Appendix B
Existing Traffic Operational Conditions


Timings1: Appleby Line & Thomas Alton Boulevard Existing AM
PTSLPage 1
Lane Group EBL EBT EBR WBL WBT NBL NBT SBT SBRLane ConfigurationsVolume (vph) 117 2 331 8 3 86 585 404 12Turn Type Perm NA Perm Perm NA Perm NA NA PermProtected Phases 4 8 2 6Permitted Phases 4 4 8 2 6Detector Phase 4 4 4 8 8 2 2 6 6Switch PhaseMinimum Initial (s) 8.0 8.0 8.0 8.0 8.0 8.0 8.0 8.0 8.0Minimum Split (s) 41.0 41.0 41.0 41.0 41.0 32.0 32.0 32.0 32.0Total Split (s) 30.0 30.0 30.0 30.0 30.0 50.0 50.0 50.0 50.0Total Split (%) 37.5% 37.5% 37.5% 37.5% 37.5% 62.5% 62.5% 62.5% 62.5%Yellow Time (s) 4.0 4.0 4.0 4.0 4.0 4.0 4.0 4.0 4.0All-Red Time (s) 3.0 3.0 3.0 3.0 3.0 2.0 2.0 2.0 2.0Lost Time Adjust (s) -3.0 -3.0 -3.0 -3.0 -2.0 -2.0 -2.0 -2.0Total Lost Time (s) 4.0 4.0 4.0 4.0 4.0 4.0 4.0 4.0Lead/LagLead-Lag Optimize?Recall Mode None None None None None C-Max C-Max C-Max C-MaxAct Effct Green (s) 16.2 16.2 16.2 16.2 55.8 55.8 55.8 55.8Actuated g/C Ratio 0.20 0.20 0.20 0.20 0.70 0.70 0.70 0.70v/c Ratio 0.47 0.60 0.04 0.01 0.16 0.18 0.12 0.01Control Delay 32.8 7.4 23.2 22.3 5.9 4.6 4.6 0.0Queue Delay 0.0 0.0 0.0 0.0 0.0 0.0 0.0 0.0Total Delay 32.8 7.4 23.2 22.3 5.9 4.6 4.6 0.0LOS C A C C A A A AApproach Delay 14.1 23.0 4.8 4.5Approach LOS B C A A
Intersection SummaryCycle Length: 80Actuated Cycle Length: 80Offset: 0 (0%), Referenced to phase 2:NBTL and 6:SBTL, Start of GreenNatural Cycle: 75Control Type: Actuated-CoordinatedMaximum v/c Ratio: 0.60Intersection Signal Delay: 7.5 Intersection LOS: AIntersection Capacity Utilization 60.2% ICU Level of Service BAnalysis Period (min) 15
Splits and Phases: 1: Appleby Line & Thomas Alton Boulevard
HCM Signalized Intersection Capacity Analysis1: Appleby Line & Thomas Alton Boulevard Existing AM
PTSLPage 2
Movement EBL EBT EBR WBL WBT WBR NBL NBT NBR SBL SBT SBRLane ConfigurationsVolume (vph) 117 2 331 8 3 0 86 585 30 0 404 12Ideal Flow (vphpl) 1900 1900 1900 1900 1900 1900 1900 1900 1900 1900 1900 1900Lane Width 3.3 3.6 3.5 3.3 3.6 3.5 3.3 3.6 3.5 3.3 3.6 3.5Total Lost time (s) 4.0 4.0 4.0 4.0 4.0 4.0 4.0 4.0Lane Util. Factor 1.00 1.00 1.00 1.00 1.00 *1.00 *1.00 1.00Frpb, ped/bikes 1.00 1.00 1.00 1.00 1.00 1.00 1.00 0.98Flpb, ped/bikes 1.00 1.00 1.00 1.00 1.00 1.00 1.00 1.00Frt 1.00 0.85 1.00 1.00 1.00 0.99 1.00 0.85Flt Protected 0.95 1.00 0.95 1.00 0.95 1.00 1.00 1.00Satd. Flow (prot) 1808 1581 1745 1900 1629 5444 5377 1563Flt Permitted 0.73 1.00 0.63 1.00 0.50 1.00 1.00 1.00Satd. Flow (perm) 1381 1581 1155 1900 863 5444 5377 1563Peak-hour factor, PHF 0.90 0.90 0.90 0.90 0.90 0.90 0.90 0.90 0.90 0.90 0.90 0.90Adj. Flow (vph) 130 2 368 9 3 0 96 650 33 0 449 13RTOR Reduction (vph) 0 0 293 0 0 0 0 5 0 0 0 4Lane Group Flow (vph) 0 132 75 9 3 0 96 678 0 0 449 9Confl. Peds. (#/hr) 2 2 1 1Heavy Vehicles (%) 0% 0% 1% 0% 0% 0% 7% 4% 3% 0% 6% 0%Turn Type Perm NA Perm Perm NA Perm NA Perm NA PermProtected Phases 4 8 2 6Permitted Phases 4 4 8 2 6 6Actuated Green, G (s) 13.2 13.2 13.2 13.2 53.8 53.8 53.8 53.8Effective Green, g (s) 16.2 16.2 16.2 16.2 55.8 55.8 55.8 55.8Actuated g/C Ratio 0.20 0.20 0.20 0.20 0.70 0.70 0.70 0.70Clearance Time (s) 7.0 7.0 7.0 7.0 6.0 6.0 6.0 6.0Vehicle Extension (s) 3.0 3.0 3.0 3.0 3.0 3.0 3.0 3.0Lane Grp Cap (vph) 279 320 233 384 601 3797 3750 1090v/s Ratio Prot 0.00 c0.12 0.08v/s Ratio Perm c0.10 0.05 0.01 0.11 0.01v/c Ratio 0.47 0.23 0.04 0.01 0.16 0.18 0.12 0.01Uniform Delay, d1 28.1 26.7 25.6 25.5 4.1 4.2 4.0 3.7Progression Factor 1.00 1.00 1.00 1.00 1.00 1.00 1.00 1.00Incremental Delay, d2 1.3 0.4 0.1 0.0 0.6 0.1 0.1 0.0Delay (s) 29.4 27.1 25.7 25.5 4.7 4.3 4.1 3.7Level of Service C C C C A A A AApproach Delay (s) 27.7 25.7 4.3 4.0Approach LOS C C A A
Intersection SummaryHCM 2000 Control Delay 11.1 HCM 2000 Level of Service BHCM 2000 Volume to Capacity ratio 0.24Actuated Cycle Length (s) 80.0 Sum of lost time (s) 8.0Intersection Capacity Utilization 60.2% ICU Level of Service BAnalysis Period (min) 15c Critical Lane Group

HCM Unsignalized Intersection Capacity Analysis2: Valera Rd & Thomas Alton Boulevard Existing AM
PTSLPage 3
Movement EBL EBT EBR WBL WBT WBR NBL NBT NBR SBL SBT SBRLane ConfigurationsVolume (veh/h) 0 403 0 12 89 0 2 0 47 0 1 0Sign Control Free Free Stop StopGrade 0% 0% 0% 0%Peak Hour Factor 0.90 0.90 0.90 0.90 0.90 0.90 0.90 0.90 0.90 0.90 0.90 0.90Hourly flow rate (vph) 0 448 0 13 99 0 2 0 52 0 1 0PedestriansLane Width (m)Walking Speed (m/s)Percent BlockageRight turn flare (veh)Median type None NoneMedian storage veh)Upstream signal (m) 173pX, platoon unblockedvC, conflicting volume 99 448 574 573 448 626 573 99vC1, stage 1 conf volvC2, stage 2 conf volvCu, unblocked vol 99 448 574 573 448 626 573 99tC, single (s) 4.1 4.1 7.6 6.5 6.2 7.1 6.5 6.2tC, 2 stage (s)tF (s) 2.2 2.2 4.0 4.0 3.3 3.5 4.0 3.3p0 queue free % 100 99 99 100 92 100 100 100cM capacity (veh/h) 1507 1123 362 427 615 363 427 962
Direction, Lane # EB 1 WB 1 NB 1 SB 1Volume Total 448 112 54 1Volume Left 0 13 2 0Volume Right 0 0 52 0cSH 1507 1123 598 427Volume to Capacity 0.00 0.01 0.09 0.00Queue Length 95th (m) 0.0 0.3 2.4 0.1Control Delay (s) 0.0 1.1 11.6 13.5Lane LOS A B BApproach Delay (s) 0.0 1.1 11.6 13.5Approach LOS B B
Intersection SummaryAverage Delay 1.2Intersection Capacity Utilization 32.7% ICU Level of Service AAnalysis Period (min) 15
HCM Unsignalized Intersection Capacity Analysis3: Valera Rd & Verdi St Existing AM
PTSLPage 4
Movement EBL EBR NBL NBT SBT SBRLane ConfigurationsVolume (veh/h) 18 0 0 31 9 4Sign Control Stop Free FreeGrade 0% 0% 0%Peak Hour Factor 0.90 0.90 0.90 0.90 0.90 0.90Hourly flow rate (vph) 20 0 0 34 10 4PedestriansLane Width (m)Walking Speed (m/s)Percent BlockageRight turn flare (veh)Median type None NoneMedian storage veh)Upstream signal (m)pX, platoon unblockedvC, conflicting volume 47 12 14vC1, stage 1 conf volvC2, stage 2 conf volvCu, unblocked vol 47 12 14tC, single (s) 6.4 6.2 4.1tC, 2 stage (s)tF (s) 3.5 3.3 2.2p0 queue free % 98 100 100cM capacity (veh/h) 968 1074 1617
Direction, Lane # EB 1 NB 1 SB 1Volume Total 20 34 14Volume Left 20 0 0Volume Right 0 0 4cSH 968 1617 1700Volume to Capacity 0.02 0.00 0.01Queue Length 95th (m) 0.5 0.0 0.0Control Delay (s) 8.8 0.0 0.0Lane LOS AApproach Delay (s) 8.8 0.0 0.0Approach LOS A
Intersection SummaryAverage Delay 2.6Intersection Capacity Utilization 13.3% ICU Level of Service AAnalysis Period (min) 15

Queuing and Blocking ReportExisting AM
PTSL SimTraffic ReportPage 1
Intersection: 1: Appleby Line & Thomas Alton Boulevard
Movement EB EB WB WB NB NB NB NB SB SB SB SBDirections Served LT R L TR L T T TR T T T RMaximum Queue (m) 37.8 29.8 13.8 6.8 32.5 46.3 35.4 18.7 34.5 22.2 7.7 8.1Average Queue (m) 18.9 15.1 1.9 0.8 11.3 18.4 9.9 3.4 14.3 4.7 0.6 0.995th Queue (m) 33.6 25.0 8.6 4.5 24.7 36.1 25.3 12.1 29.8 15.3 4.2 4.9Link Distance (m) 138.4 98.5 98.5 231.4 231.4 231.4 289.5 289.5 289.5Upstream Blk Time (%)Queuing Penalty (veh)Storage Bay Dist (m) 35.0 135.0 50.0Storage Blk Time (%) 1 0Queuing Penalty (veh) 3 0
Intersection: 2: Valera Rd & Thomas Alton Boulevard
Movement WB NB SBDirections Served LTR LTR LTRMaximum Queue (m) 15.1 17.5 3.3Average Queue (m) 1.6 7.0 0.295th Queue (m) 8.1 14.0 2.1Link Distance (m) 138.4 72.3 56.4Upstream Blk Time (%)Queuing Penalty (veh)Storage Bay Dist (m)Storage Blk Time (%)Queuing Penalty (veh)
Intersection: 3: Valera Rd & Verdi St
Movement EBDirections Served LRMaximum Queue (m) 8.9Average Queue (m) 3.995th Queue (m) 11.1Link Distance (m) 71.6Upstream Blk Time (%)Queuing Penalty (veh)Storage Bay Dist (m)Storage Blk Time (%)Queuing Penalty (veh)
Network SummaryNetwork wide Queuing Penalty: 3
Timings1: Appleby Line & Thomas Alton Boulevard Existing PM
PTSLPage 1
Lane Group EBL EBT EBR WBL WBT NBL NBT SBL SBT SBRLane ConfigurationsVolume (vph) 43 0 191 2 0 380 749 1 924 141Turn Type Perm NA Perm Perm NA pm+pt NA Perm NA PermProtected Phases 4 8 5 2 6Permitted Phases 4 4 8 2 6 6Detector Phase 4 4 4 8 8 5 2 6 6 6Switch PhaseMinimum Initial (s) 8.0 8.0 8.0 8.0 8.0 7.0 8.0 8.0 8.0 8.0Minimum Split (s) 41.0 41.0 41.0 41.0 41.0 11.0 32.0 32.0 32.0 32.0Total Split (s) 30.0 30.0 30.0 30.0 30.0 13.0 70.0 57.0 57.0 57.0Total Split (%) 30.0% 30.0% 30.0% 30.0% 30.0% 13.0% 70.0% 57.0% 57.0% 57.0%Yellow Time (s) 4.0 4.0 4.0 4.0 4.0 3.0 4.0 4.0 4.0 4.0All-Red Time (s) 3.0 3.0 3.0 3.0 3.0 1.0 2.0 2.0 2.0 2.0Lost Time Adjust (s) -3.0 -3.0 -3.0 -3.0 0.0 -2.0 -2.0 -2.0 -2.0Total Lost Time (s) 4.0 4.0 4.0 4.0 4.0 4.0 4.0 4.0 4.0Lead/Lag Lead Lag Lag LagLead-Lag Optimize?Recall Mode None None None None None None C-Max C-Max C-Max C-MaxAct Effct Green (s) 12.6 12.6 12.6 12.6 79.4 79.4 58.2 58.2 58.2Actuated g/C Ratio 0.13 0.13 0.13 0.13 0.79 0.79 0.58 0.58 0.58v/c Ratio 0.26 0.55 0.01 0.00 0.68 0.18 0.00 0.30 0.15Control Delay 42.3 11.6 36.5 0.0 11.1 2.7 10.0 11.2 2.3Queue Delay 0.0 0.0 0.0 0.0 0.0 0.0 0.0 0.0 0.0Total Delay 42.3 11.6 36.5 0.0 11.1 2.7 10.0 11.2 2.3LOS D B D A B A A B AApproach Delay 17.3 24.3 5.5 10.0Approach LOS B C A B
Intersection SummaryCycle Length: 100Actuated Cycle Length: 100Offset: 0 (0%), Referenced to phase 2:NBTL and 6:SBTL, Start of GreenNatural Cycle: 85Control Type: Actuated-CoordinatedMaximum v/c Ratio: 0.68Intersection Signal Delay: 8.6 Intersection LOS: AIntersection Capacity Utilization 58.0% ICU Level of Service BAnalysis Period (min) 15
Splits and Phases: 1: Appleby Line & Thomas Alton Boulevard

HCM Signalized Intersection Capacity Analysis1: Appleby Line & Thomas Alton Boulevard Existing PM
PTSLPage 2
Movement EBL EBT EBR WBL WBT WBR NBL NBT NBR SBL SBT SBRLane ConfigurationsVolume (vph) 43 0 191 2 0 1 380 749 0 1 924 141Ideal Flow (vphpl) 1900 1900 1900 1900 1900 1900 1900 1900 1900 1900 1900 1900Lane Width 3.3 3.6 3.5 3.3 3.6 3.5 3.3 3.6 3.5 3.3 3.6 3.5Total Lost time (s) 4.0 4.0 4.0 4.0 4.0 4.0 4.0 4.0 4.0Lane Util. Factor 1.00 1.00 1.00 1.00 1.00 *1.00 1.00 *1.00 1.00Frpb, ped/bikes 1.00 1.00 1.00 0.99 1.00 1.00 1.00 1.00 1.00Flpb, ped/bikes 1.00 1.00 1.00 1.00 1.00 1.00 1.00 1.00 1.00Frt 1.00 0.85 1.00 0.85 1.00 1.00 1.00 1.00 0.85Flt Protected 0.95 1.00 0.95 1.00 0.95 1.00 0.95 1.00 1.00Satd. Flow (prot) 1802 1536 1745 1593 1727 5534 1744 5644 1597Flt Permitted 0.76 1.00 0.73 1.00 0.26 1.00 0.36 1.00 1.00Satd. Flow (perm) 1436 1536 1335 1593 471 5534 669 5644 1597Peak-hour factor, PHF 0.94 0.94 0.94 0.94 0.94 0.94 0.94 0.94 0.94 0.94 0.94 0.94Adj. Flow (vph) 46 0 203 2 0 1 404 797 0 1 983 150RTOR Reduction (vph) 0 0 177 0 1 0 0 0 0 0 0 63Lane Group Flow (vph) 0 46 26 2 0 0 404 797 0 1 983 87Confl. Peds. (#/hr) 2 2 1 1Heavy Vehicles (%) 0% 0% 4% 0% 0% 0% 1% 3% 0% 0% 1% 0%Turn Type Perm NA Perm Perm NA pm+pt NA Perm NA PermProtected Phases 4 8 5 2 6Permitted Phases 4 4 8 2 6 6Actuated Green, G (s) 9.6 9.6 9.6 9.6 77.4 77.4 56.2 56.2 56.2Effective Green, g (s) 12.6 12.6 12.6 12.6 77.4 79.4 58.2 58.2 58.2Actuated g/C Ratio 0.13 0.13 0.13 0.13 0.77 0.79 0.58 0.58 0.58Clearance Time (s) 7.0 7.0 7.0 7.0 4.0 6.0 6.0 6.0 6.0Vehicle Extension (s) 3.0 3.0 3.0 3.0 3.0 3.0 3.0 3.0 3.0Lane Grp Cap (vph) 180 193 168 200 580 4393 389 3284 929v/s Ratio Prot 0.00 c0.12 0.14 0.17v/s Ratio Perm c0.03 0.02 0.00 c0.42 0.00 0.05v/c Ratio 0.26 0.13 0.01 0.00 0.70 0.18 0.00 0.30 0.09Uniform Delay, d1 39.5 38.8 38.3 38.2 4.9 2.5 8.7 10.6 9.2Progression Factor 1.00 1.00 1.00 1.00 1.00 1.00 1.00 1.00 1.00Incremental Delay, d2 0.8 0.3 0.0 0.0 3.6 0.1 0.0 0.2 0.2Delay (s) 40.2 39.2 38.3 38.2 8.5 2.6 8.8 10.8 9.4Level of Service D D D D A A A B AApproach Delay (s) 39.4 38.3 4.6 10.6Approach LOS D D A B
Intersection SummaryHCM 2000 Control Delay 10.6 HCM 2000 Level of Service BHCM 2000 Volume to Capacity ratio 0.64Actuated Cycle Length (s) 100.0 Sum of lost time (s) 12.0Intersection Capacity Utilization 58.0% ICU Level of Service BAnalysis Period (min) 15c Critical Lane Group
HCM Unsignalized Intersection Capacity Analysis2: Valera Rd & Thomas Alton Boulevard Existing PM
PTSLPage 3
Movement EBL EBT EBR WBL WBT WBR NBL NBT NBR SBL SBT SBRLane ConfigurationsVolume (veh/h) 0 210 12 64 451 6 3 0 22 2 1 5Sign Control Free Free Stop StopGrade 0% 0% 0% 0%Peak Hour Factor 0.94 0.94 0.94 0.94 0.94 0.94 0.94 0.94 0.94 0.94 0.94 0.94Hourly flow rate (vph) 0 223 13 68 480 6 3 0 23 2 1 5Pedestrians 3Lane Width (m) 3.6Walking Speed (m/s) 1.2Percent Blockage 0Right turn flare (veh)Median type None NoneMedian storage veh)Upstream signal (m) 173pX, platoon unblocked 0.94 0.94 0.94 0.94 0.94 0.94vC, conflicting volume 489 236 855 855 230 875 858 486vC1, stage 1 conf volvC2, stage 2 conf volvCu, unblocked vol 430 236 817 817 230 839 821 427tC, single (s) 4.1 4.1 7.1 6.5 6.2 7.1 6.5 6.2tC, 2 stage (s)tF (s) 2.2 2.2 3.5 4.0 3.3 3.5 4.0 3.3p0 queue free % 100 95 99 100 97 99 100 99cM capacity (veh/h) 1075 1343 267 280 814 253 279 596
Direction, Lane # EB 1 WB 1 NB 1 SB 1Volume Total 236 554 27 9Volume Left 0 68 3 2Volume Right 13 6 23 5cSH 1075 1343 653 402Volume to Capacity 0.00 0.05 0.04 0.02Queue Length 95th (m) 0.0 1.3 1.0 0.5Control Delay (s) 0.0 1.4 10.7 14.1Lane LOS A B BApproach Delay (s) 0.0 1.4 10.7 14.1Approach LOS B B
Intersection SummaryAverage Delay 1.5Intersection Capacity Utilization 52.8% ICU Level of Service AAnalysis Period (min) 15

HCM Unsignalized Intersection Capacity Analysis3: Valera Rd & Verdi St Existing PM
PTSLPage 4
Movement EBL EBR NBL NBT SBT SBRLane ConfigurationsVolume (veh/h) 8 0 0 17 67 10Sign Control Stop Free FreeGrade 0% 0% 0%Peak Hour Factor 0.94 0.94 0.94 0.94 0.94 0.94Hourly flow rate (vph) 9 0 0 18 71 11PedestriansLane Width (m)Walking Speed (m/s)Percent BlockageRight turn flare (veh)Median type None NoneMedian storage veh)Upstream signal (m)pX, platoon unblockedvC, conflicting volume 95 77 82vC1, stage 1 conf volvC2, stage 2 conf volvCu, unblocked vol 95 77 82tC, single (s) 6.4 6.2 4.1tC, 2 stage (s)tF (s) 3.5 3.3 2.2p0 queue free % 99 100 100cM capacity (veh/h) 910 990 1528
Direction, Lane # EB 1 NB 1 SB 1Volume Total 9 18 82Volume Left 9 0 0Volume Right 0 0 11cSH 910 1528 1700Volume to Capacity 0.01 0.00 0.05Queue Length 95th (m) 0.2 0.0 0.0Control Delay (s) 9.0 0.0 0.0Lane LOS AApproach Delay (s) 9.0 0.0 0.0Approach LOS A
Intersection SummaryAverage Delay 0.7Intersection Capacity Utilization 14.1% ICU Level of Service AAnalysis Period (min) 15
Queuing and Blocking ReportExisting PM
PTSL SimTraffic ReportPage 1
Intersection: 1: Appleby Line & Thomas Alton Boulevard
Movement EB EB WB WB NB NB NB NB SB SB SB SBDirections Served LT R L TR L T T TR L T T TMaximum Queue (m) 24.1 24.1 7.0 8.0 103.7 32.1 30.8 14.6 3.0 80.1 66.0 49.9Average Queue (m) 8.0 11.8 0.3 0.4 49.2 11.2 10.0 2.5 0.1 40.5 28.3 10.295th Queue (m) 18.5 20.9 3.0 3.1 92.9 28.6 24.3 9.3 1.4 69.7 57.3 32.2Link Distance (m) 138.4 98.7 98.7 232.9 232.9 232.9 289.5 289.5 289.5Upstream Blk Time (%)Queuing Penalty (veh)Storage Bay Dist (m) 35.0 135.0 50.0Storage Blk Time (%) 0 1 3 0Queuing Penalty (veh) 0 1 0 0
Intersection: 1: Appleby Line & Thomas Alton Boulevard
Movement SBDirections Served RMaximum Queue (m) 28.8Average Queue (m) 10.795th Queue (m) 22.2Link Distance (m)Upstream Blk Time (%)Queuing Penalty (veh)Storage Bay Dist (m) 50.0Storage Blk Time (%)Queuing Penalty (veh)
Intersection: 2: Valera Rd & Thomas Alton Boulevard
Movement WB NB SBDirections Served LTR LTR LTRMaximum Queue (m) 29.7 9.8 8.2Average Queue (m) 4.6 4.7 2.195th Queue (m) 17.4 11.5 8.0Link Distance (m) 138.4 72.3 56.4Upstream Blk Time (%)Queuing Penalty (veh)Storage Bay Dist (m)Storage Blk Time (%)Queuing Penalty (veh)

Queuing and Blocking ReportExisting PM
PTSL SimTraffic ReportPage 2
Intersection: 3: Valera Rd & Verdi St
Movement EBDirections Served LRMaximum Queue (m) 10.4Average Queue (m) 2.195th Queue (m) 8.5Link Distance (m) 71.6Upstream Blk Time (%)Queuing Penalty (veh)Storage Bay Dist (m)Storage Blk Time (%)Queuing Penalty (veh)
Network SummaryNetwork wide Queuing Penalty: 2

Emery Investment’s Retail Site | Traffic Impact Study | 141070 | May 2015
Paradigm Transportation Solutions Limited | Appendices
Appendix C
Background Traffic Forecasts


Thomas Alton Blvd
Verdi St Driveway "B"
NTS
0
0 0 0
0
0
0
0 0 0
0 0 0
0 0 0
0
0
0
21
00 0 0
0
0 0
Vale
ra R
d
0
Dri
vew
ay "
A"
0 4
0
Subject Site0
0 0
0
5
21 0 0
2 0
0
1
26
14 14 3 3 3 3 3
2 0 21 21 0 21
0 21 02 0 3
21
0 3
5 3
35 7
App
leby
Lin
e
0
0
4903 Thomas Alton Blvd Site Traffic - AM Peak Hour

Thomas Alton Blvd
Verdi St Driveway "B"
NTS
0
0 0 0
0
0
0
0 0 0
0 0 0
0 0 0
0
0
0
12
00 0 0
0
0 0
Vale
ra R
d
0
Dri
vew
ay "
A"
0 44
0
Subject Site0
0 0
0
1
12 0 0
9 0
0
15
13
3 3 24 24 24 24 24
12 0 12 12 0 12
0 12 012 0 24
12
0 29
36 29
15 10
App
leby
Lin
e
0
0
4903 Thomas Alton Blvd Site Traffic - PM Peak Hour

Thomas Alton Blvd
Verdi St Driveway "B"
NTS
0
0 0 0
0
0
0
0 0 0
0 0 0
0 0 0
0
0
0
3
700 0 0
0
0 0
Vale
ra R
d
0
Dri
vew
ay "
A"
0 44
0
Subject Site0
0 0
0
0
4 0 0
26 0
0
44
3
70 0 70 70 70 70 70
4 0 4 4 0 4
4 4 00 0 0
0
1 0
0 1
0 26
App
leby
Lin
e
0
0
Thomas Alton Phase 5 Site Traffic - AM Peak Hour

Thomas Alton Blvd
Verdi St Driveway "B"
NTS
0
0 0 0
0
0
0
0 0 0
0 0 0
0 0 0
0
0
0
42
170 0 0
0
0 0
Vale
ra R
d
0
Dri
vew
ay "
A"
0 11
0
Subject Site0
0 0
0
0
50 0 0
6 0
0
11
42
17 0 17 17 17 17 17
50 0 50 50 0 50
50 50 00 0 0
0
8 0
0 8
0 6
App
leby
Lin
e
0
0
Thomas Alton Phase 5 Site Traffic - PM Peak Hour

Thomas Alton Blvd
Verdi St Driveway "B"
NTS
0
0 3 0
0
1
3
0 0 0
0 0 0
0 1 0
0
1
3
0
240 0 3
0
0 0
Vale
ra R
d
1
Dri
vew
ay "
A"
0 61
0
Subject Site0
3 0
15
113
11 27 37
12 55
360
App
leby
Lin
e
149
0 0 0
0
2 34
24 0 27 27 27 27 27
10 1 11 11 0 11
40
0 126
4
1
10 11 9
Alton Commercial Site Paletta International - Figure 78 - AM Peak Hour
0
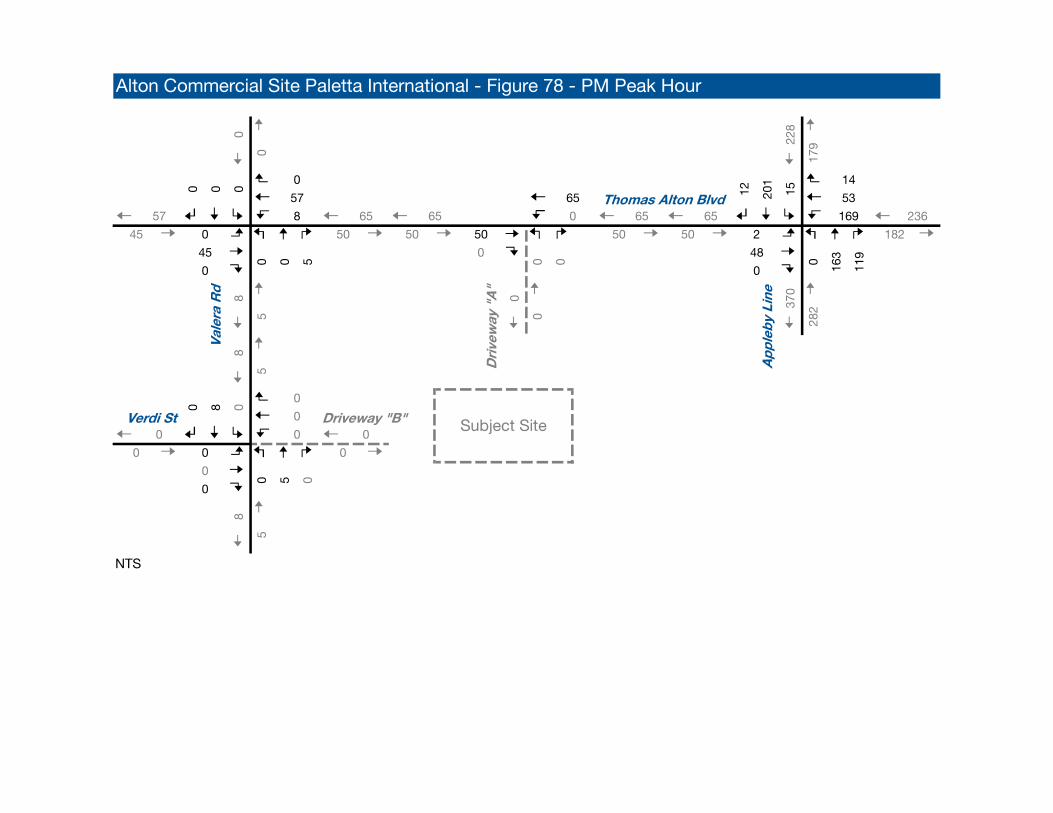
Thomas Alton Blvd
Verdi St Driveway "B"
NTS
0
0 5 0
0
8
5
0 0 0
0 0 0
0 8 0
0
8
5
0
450 0 5
0
0 0
Vale
ra R
d
8
Dri
vew
ay "
A"
0 370
0
Subject Site0
5 0
48
163
65 169 236
2 182
119
0
App
leby
Lin
e
282
0 0 0
0
12 201
45 0 50 50 50 50 50
57 8 65 65 0 65
228
0 179
15
14
57 65 53
Alton Commercial Site Paletta International - Figure 78 - PM Peak Hour
0

Thomas Alton Blvd
Verdi St Driveway "B"
NTS
Industrial Site Traffic - AM Peak Hour
App
leby
Lin
e
0
0
0
53
0 0 0
0 0
0
530
0 12
0 53
0 0 00 0 0
0
0 12
0 0 0 0 0 0 0
0 0 0 0 0 0
0 0 0
0 0
Vale
ra R
d
0
Dri
vew
ay "
A"
0
Subject Site0
0 0
0
0
0 0 0
0
00 0 0
0
0 0
12
0
0 0 0
0
0
0
0 0 0

Thomas Alton Blvd
Verdi St Driveway "B"
NTS
Industrial Site Traffic - PM Peak Hour
App
leby
Lin
e
0
0
0
14
0 0 0
0 0
0
140
0 53
0 14
0 0 00 0 0
0
0 53
0 0 0 0 0 0 0
0 0 0 0 0 0
0 0 0
0 0
Vale
ra R
d
0
Dri
vew
ay "
A"
0
Subject Site0
0 0
0
0
0 0 0
0
00 0 0
0
0 0
53
0
0 0 0
0
0
0
0 0 0

Thomas Alton Blvd
Verdi St Driveway "B"
NTS
Appleby Line Office Development - AM Peak Hour
App
leby
Lin
e
0
0
0
213
0 0 0
0 0
0
213
0
0 29
0 213
0 0 00 0 0
0
0 29
0 0 0 0 0 0 0
0 0 0 0 0 0
0 0 0
0 0
Vale
ra R
d
0
Dri
vew
ay "
A"
0
Subject Site0
0 0
0
0
0 0 0
0
00 0 0
0
0 0
29
0
0 0 0
0
0
0
0 0 0

Thomas Alton Blvd
Verdi St Driveway "B"
NTS
Appleby Line Office Development - PM Peak Hour
App
leby
Lin
e
0
0
0
38
0 0 0
0 0
0
380
0 184
0 38
0 0 00 0 0
0
0 184
0 0 0 0 0 0 0
0 0 0 0 0 0
0 0 0
0 0
Vale
ra R
d
0
Dri
vew
ay "
A"
0
Subject Site0
0 0
0
0
0 0 0
0
00 0 0
0
0 0
184
0
0 0 0
0
0
0
0 0 0

Emery Investment’s Retail Site | Traffic Impact Study | 141070 | May 2015
Paradigm Transportation Solutions Limited | Appendices
Appendix D
Background Traffic Operational Conditions


Timings1: Appleby Line & Thomas Alton Boulevard Background AM
PTSLPage 1
Lane Group EBL EBT EBR WBL WBT NBL NBT SBL SBT SBRLane ConfigurationsVolume (vph) 172 17 418 36 12 121 1043 4 533 17Turn Type Perm NA Perm Perm NA pm+pt NA Perm NA PermProtected Phases 4 8 5 2 6Permitted Phases 4 4 8 2 6 6Detector Phase 4 4 4 8 8 5 2 6 6 6Switch PhaseMinimum Initial (s) 4.0 4.0 4.0 4.0 4.0 4.0 4.0 4.0 4.0 4.0Minimum Split (s) 39.0 39.0 39.0 39.0 39.0 10.0 25.0 25.0 25.0 25.0Total Split (s) 45.0 45.0 45.0 45.0 45.0 15.0 45.0 30.0 30.0 30.0Total Split (%) 50.0% 50.0% 50.0% 50.0% 50.0% 16.7% 50.0% 33.3% 33.3% 33.3%Yellow Time (s) 4.0 4.0 4.0 4.0 4.0 3.0 4.0 4.0 4.0 4.0All-Red Time (s) 2.0 2.0 2.0 2.0 2.0 1.0 2.0 2.0 2.0 2.0Lost Time Adjust (s) -2.0 -2.0 -2.0 -2.0 0.0 -2.0 -2.0 -2.0 -2.0Total Lost Time (s) 4.0 4.0 4.0 4.0 4.0 4.0 4.0 4.0 4.0Lead/Lag Lead Lag Lag LagLead-Lag Optimize?Recall Mode None None None None None None C-Max C-Max C-Max C-MaxAct Effct Green (s) 20.1 20.1 20.1 20.1 61.9 61.9 49.9 49.9 49.9Actuated g/C Ratio 0.22 0.22 0.22 0.22 0.69 0.69 0.55 0.55 0.55v/c Ratio 0.61 0.63 0.17 0.03 0.21 0.30 0.01 0.18 0.02Control Delay 38.9 7.7 27.6 22.6 6.8 6.3 13.0 11.3 0.1Queue Delay 0.0 0.0 0.0 0.0 0.0 0.0 0.0 0.0 0.0Total Delay 38.9 7.7 27.6 22.6 6.8 6.3 13.0 11.3 0.1LOS D A C C A A B B AApproach Delay 17.4 26.3 6.3 11.0Approach LOS B C A B
Intersection SummaryCycle Length: 90Actuated Cycle Length: 90Offset: 15 (17%), Referenced to phase 2:NBTL and 6:SBTL, Start of GreenNatural Cycle: 75Control Type: Actuated-CoordinatedMaximum v/c Ratio: 0.63Intersection Signal Delay: 10.5 Intersection LOS: BIntersection Capacity Utilization 55.0% ICU Level of Service BAnalysis Period (min) 15
Splits and Phases: 1: Appleby Line & Thomas Alton Boulevard
HCM Signalized Intersection Capacity Analysis1: Appleby Line & Thomas Alton Boulevard Background AM
PTSLPage 2
Movement EBL EBT EBR WBL WBT WBR NBL NBT NBR SBL SBT SBRLane ConfigurationsVolume (vph) 172 17 418 36 12 1 121 1043 70 4 533 17Ideal Flow (vphpl) 1900 1900 1900 1900 1900 1900 1900 1900 1900 1900 1900 1900Lane Width 3.3 3.6 3.5 3.3 3.6 3.5 3.3 3.6 3.5 3.3 3.6 3.5Total Lost time (s) 4.0 4.0 4.0 4.0 4.0 4.0 4.0 4.0 4.0Lane Util. Factor 1.00 1.00 1.00 1.00 1.00 *1.00 1.00 *1.00 1.00Frpb, ped/bikes 1.00 1.00 1.00 1.00 1.00 1.00 1.00 1.00 0.98Flpb, ped/bikes 1.00 1.00 1.00 1.00 1.00 1.00 1.00 1.00 1.00Frt 1.00 0.85 1.00 0.99 1.00 0.99 1.00 1.00 0.85Flt Protected 0.96 1.00 0.95 1.00 0.95 1.00 0.95 1.00 1.00Satd. Flow (prot) 1813 1581 1745 1876 1630 5432 1745 5377 1561Flt Permitted 0.74 1.00 0.51 1.00 0.43 1.00 0.27 1.00 1.00Satd. Flow (perm) 1395 1581 928 1876 732 5432 497 5377 1561Peak-hour factor, PHF 1.00 1.00 1.00 1.00 1.00 1.00 1.00 1.00 1.00 1.00 1.00 1.00Adj. Flow (vph) 172 17 418 36 12 1 121 1043 70 4 533 17RTOR Reduction (vph) 0 0 316 0 1 0 0 5 0 0 0 8Lane Group Flow (vph) 0 189 102 36 12 0 121 1108 0 4 533 9Confl. Peds. (#/hr) 2 2 1 1Heavy Vehicles (%) 0% 0% 1% 0% 0% 0% 7% 4% 3% 0% 6% 0%Turn Type Perm NA Perm Perm NA pm+pt NA Perm NA PermProtected Phases 4 8 5 2 6Permitted Phases 4 4 8 2 6 6Actuated Green, G (s) 18.1 18.1 18.1 18.1 59.9 59.9 47.9 47.9 47.9Effective Green, g (s) 20.1 20.1 20.1 20.1 59.9 61.9 49.9 49.9 49.9Actuated g/C Ratio 0.22 0.22 0.22 0.22 0.67 0.69 0.55 0.55 0.55Clearance Time (s) 6.0 6.0 6.0 6.0 4.0 6.0 6.0 6.0 6.0Vehicle Extension (s) 3.0 3.0 3.0 3.0 3.0 3.0 3.0 3.0 3.0Lane Grp Cap (vph) 311 353 207 418 567 3736 275 2981 865v/s Ratio Prot 0.01 0.02 c0.20 0.10v/s Ratio Perm c0.14 0.06 0.04 0.12 0.01 0.01v/c Ratio 0.61 0.29 0.17 0.03 0.21 0.30 0.01 0.18 0.01Uniform Delay, d1 31.4 29.0 28.2 27.3 5.6 5.5 9.0 9.9 9.0Progression Factor 1.00 1.00 1.00 1.00 1.00 1.00 1.00 1.00 1.00Incremental Delay, d2 3.3 0.5 0.4 0.0 0.2 0.2 0.1 0.1 0.0Delay (s) 34.8 29.5 28.6 27.4 5.8 5.7 9.1 10.0 9.0Level of Service C C C C A A A B AApproach Delay (s) 31.1 28.3 5.7 10.0Approach LOS C C A B
Intersection SummaryHCM 2000 Control Delay 13.5 HCM 2000 Level of Service BHCM 2000 Volume to Capacity ratio 0.39Actuated Cycle Length (s) 90.0 Sum of lost time (s) 12.0Intersection Capacity Utilization 55.0% ICU Level of Service BAnalysis Period (min) 15c Critical Lane Group
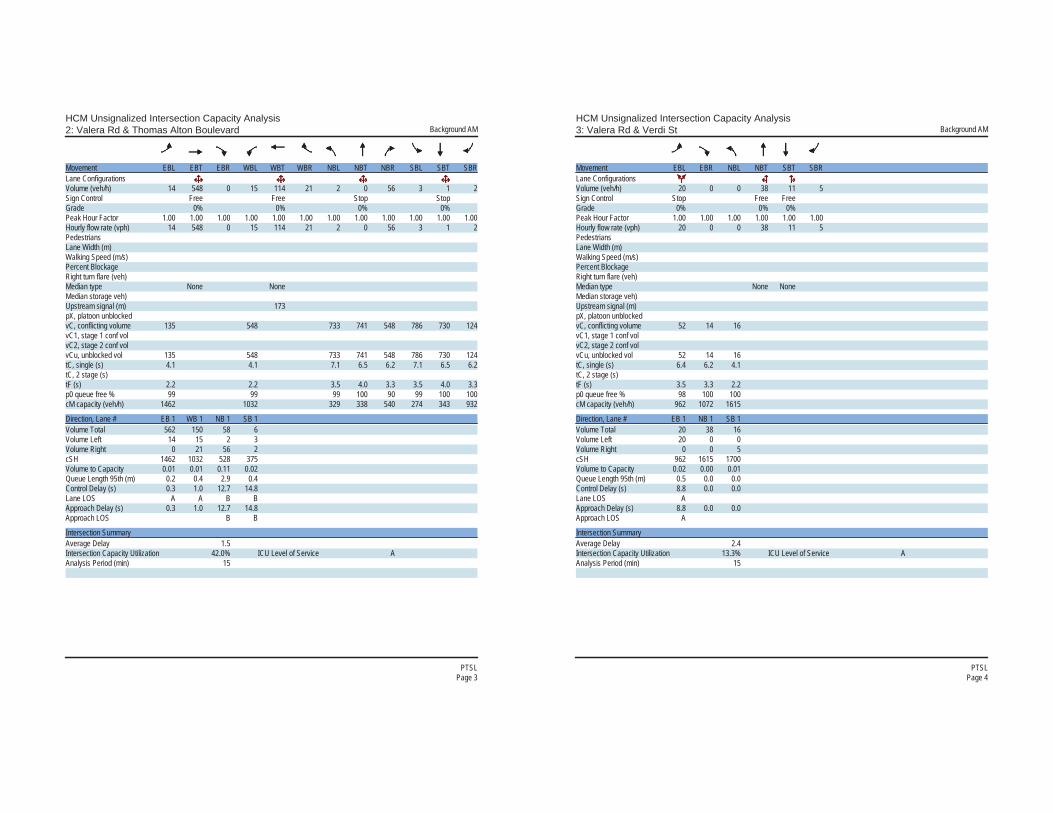
HCM Unsignalized Intersection Capacity Analysis2: Valera Rd & Thomas Alton Boulevard Background AM
PTSLPage 3
Movement EBL EBT EBR WBL WBT WBR NBL NBT NBR SBL SBT SBRLane ConfigurationsVolume (veh/h) 14 548 0 15 114 21 2 0 56 3 1 2Sign Control Free Free Stop StopGrade 0% 0% 0% 0%Peak Hour Factor 1.00 1.00 1.00 1.00 1.00 1.00 1.00 1.00 1.00 1.00 1.00 1.00Hourly flow rate (vph) 14 548 0 15 114 21 2 0 56 3 1 2PedestriansLane Width (m)Walking Speed (m/s)Percent BlockageRight turn flare (veh)Median type None NoneMedian storage veh)Upstream signal (m) 173pX, platoon unblockedvC, conflicting volume 135 548 733 741 548 786 730 124vC1, stage 1 conf volvC2, stage 2 conf volvCu, unblocked vol 135 548 733 741 548 786 730 124tC, single (s) 4.1 4.1 7.1 6.5 6.2 7.1 6.5 6.2tC, 2 stage (s)tF (s) 2.2 2.2 3.5 4.0 3.3 3.5 4.0 3.3p0 queue free % 99 99 99 100 90 99 100 100cM capacity (veh/h) 1462 1032 329 338 540 274 343 932
Direction, Lane # EB 1 WB 1 NB 1 SB 1Volume Total 562 150 58 6Volume Left 14 15 2 3Volume Right 0 21 56 2cSH 1462 1032 528 375Volume to Capacity 0.01 0.01 0.11 0.02Queue Length 95th (m) 0.2 0.4 2.9 0.4Control Delay (s) 0.3 1.0 12.7 14.8Lane LOS A A B BApproach Delay (s) 0.3 1.0 12.7 14.8Approach LOS B B
Intersection SummaryAverage Delay 1.5Intersection Capacity Utilization 42.0% ICU Level of Service AAnalysis Period (min) 15
HCM Unsignalized Intersection Capacity Analysis3: Valera Rd & Verdi St Background AM
PTSLPage 4
Movement EBL EBR NBL NBT SBT SBRLane ConfigurationsVolume (veh/h) 20 0 0 38 11 5Sign Control Stop Free FreeGrade 0% 0% 0%Peak Hour Factor 1.00 1.00 1.00 1.00 1.00 1.00Hourly flow rate (vph) 20 0 0 38 11 5PedestriansLane Width (m)Walking Speed (m/s)Percent BlockageRight turn flare (veh)Median type None NoneMedian storage veh)Upstream signal (m)pX, platoon unblockedvC, conflicting volume 52 14 16vC1, stage 1 conf volvC2, stage 2 conf volvCu, unblocked vol 52 14 16tC, single (s) 6.4 6.2 4.1tC, 2 stage (s)tF (s) 3.5 3.3 2.2p0 queue free % 98 100 100cM capacity (veh/h) 962 1072 1615
Direction, Lane # EB 1 NB 1 SB 1Volume Total 20 38 16Volume Left 20 0 0Volume Right 0 0 5cSH 962 1615 1700Volume to Capacity 0.02 0.00 0.01Queue Length 95th (m) 0.5 0.0 0.0Control Delay (s) 8.8 0.0 0.0Lane LOS AApproach Delay (s) 8.8 0.0 0.0Approach LOS A
Intersection SummaryAverage Delay 2.4Intersection Capacity Utilization 13.3% ICU Level of Service AAnalysis Period (min) 15
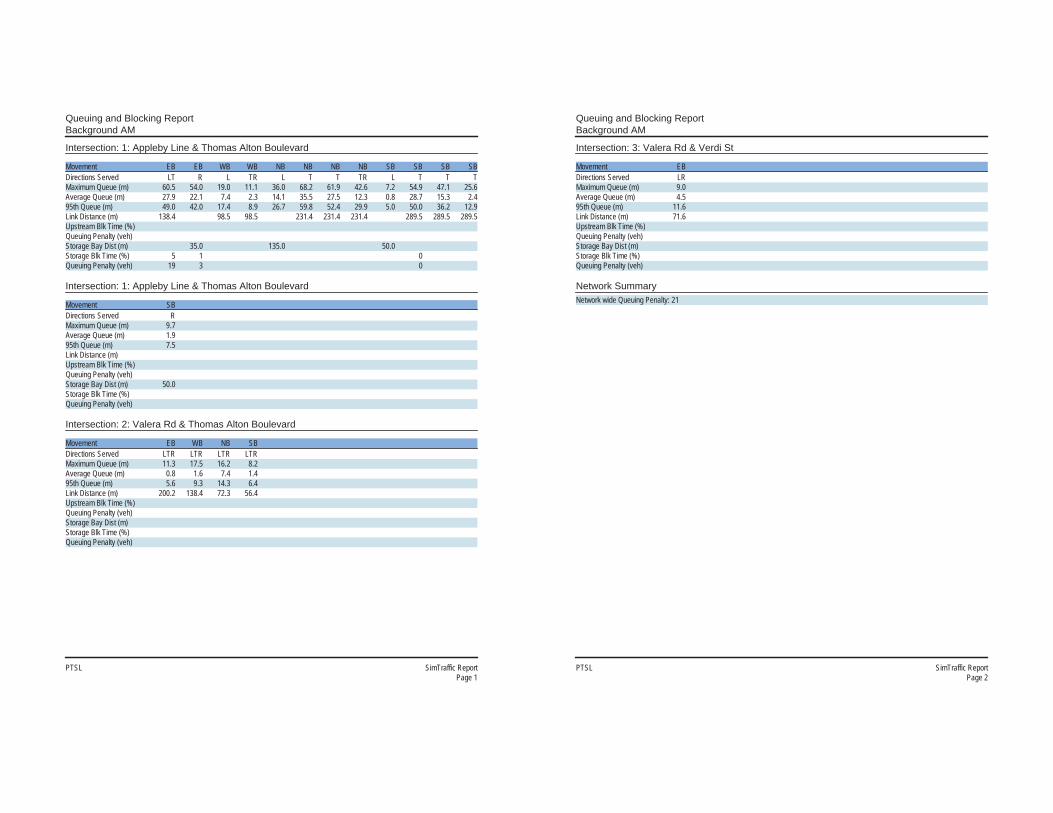
Queuing and Blocking ReportBackground AM
PTSL SimTraffic ReportPage 1
Intersection: 1: Appleby Line & Thomas Alton Boulevard
Movement EB EB WB WB NB NB NB NB SB SB SB SBDirections Served LT R L TR L T T TR L T T TMaximum Queue (m) 60.5 54.0 19.0 11.1 36.0 68.2 61.9 42.6 7.2 54.9 47.1 25.6Average Queue (m) 27.9 22.1 7.4 2.3 14.1 35.5 27.5 12.3 0.8 28.7 15.3 2.495th Queue (m) 49.0 42.0 17.4 8.9 26.7 59.8 52.4 29.9 5.0 50.0 36.2 12.9Link Distance (m) 138.4 98.5 98.5 231.4 231.4 231.4 289.5 289.5 289.5Upstream Blk Time (%)Queuing Penalty (veh)Storage Bay Dist (m) 35.0 135.0 50.0Storage Blk Time (%) 5 1 0Queuing Penalty (veh) 19 3 0
Intersection: 1: Appleby Line & Thomas Alton Boulevard
Movement SBDirections Served RMaximum Queue (m) 9.7Average Queue (m) 1.995th Queue (m) 7.5Link Distance (m)Upstream Blk Time (%)Queuing Penalty (veh)Storage Bay Dist (m) 50.0Storage Blk Time (%)Queuing Penalty (veh)
Intersection: 2: Valera Rd & Thomas Alton Boulevard
Movement EB WB NB SBDirections Served LTR LTR LTR LTRMaximum Queue (m) 11.3 17.5 16.2 8.2Average Queue (m) 0.8 1.6 7.4 1.495th Queue (m) 5.6 9.3 14.3 6.4Link Distance (m) 200.2 138.4 72.3 56.4Upstream Blk Time (%)Queuing Penalty (veh)Storage Bay Dist (m)Storage Blk Time (%)Queuing Penalty (veh)
Queuing and Blocking ReportBackground AM
PTSL SimTraffic ReportPage 2
Intersection: 3: Valera Rd & Verdi St
Movement EBDirections Served LRMaximum Queue (m) 9.0Average Queue (m) 4.595th Queue (m) 11.6Link Distance (m) 71.6Upstream Blk Time (%)Queuing Penalty (veh)Storage Bay Dist (m)Storage Blk Time (%)Queuing Penalty (veh)
Network SummaryNetwork wide Queuing Penalty: 21
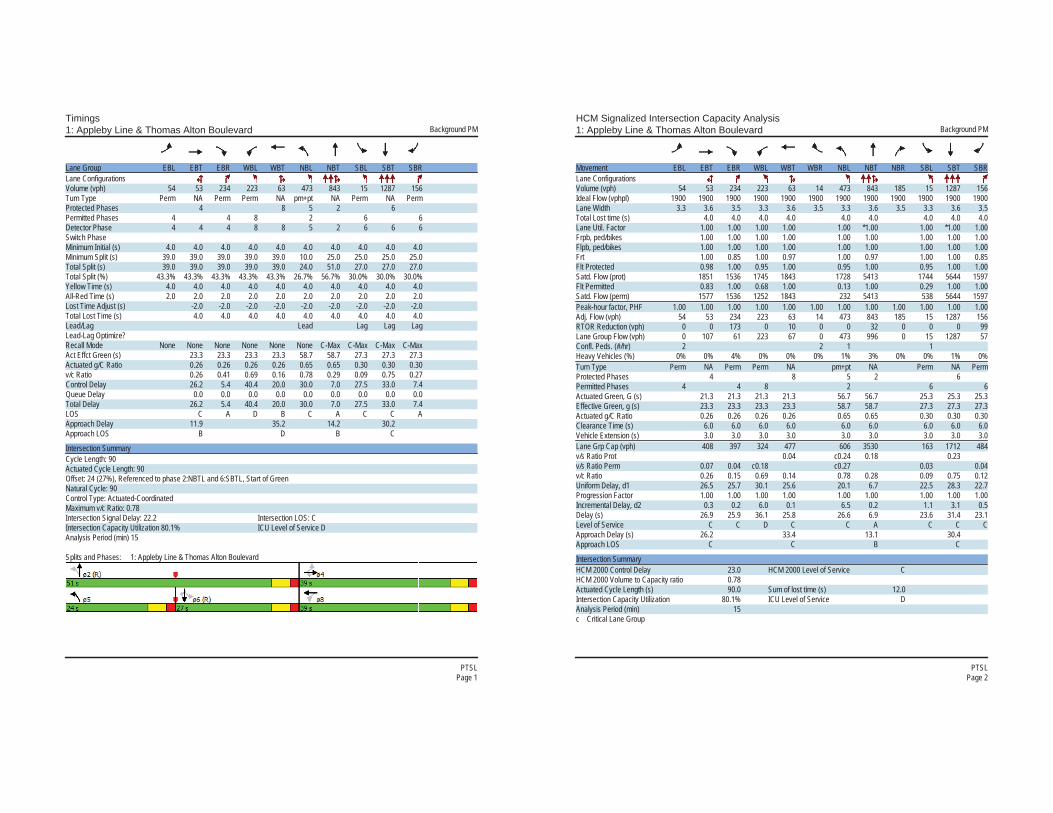
Timings1: Appleby Line & Thomas Alton Boulevard Background PM
PTSLPage 1
Lane Group EBL EBT EBR WBL WBT NBL NBT SBL SBT SBRLane ConfigurationsVolume (vph) 54 53 234 223 63 473 843 15 1287 156Turn Type Perm NA Perm Perm NA pm+pt NA Perm NA PermProtected Phases 4 8 5 2 6Permitted Phases 4 4 8 2 6 6Detector Phase 4 4 4 8 8 5 2 6 6 6Switch PhaseMinimum Initial (s) 4.0 4.0 4.0 4.0 4.0 4.0 4.0 4.0 4.0 4.0Minimum Split (s) 39.0 39.0 39.0 39.0 39.0 10.0 25.0 25.0 25.0 25.0Total Split (s) 39.0 39.0 39.0 39.0 39.0 24.0 51.0 27.0 27.0 27.0Total Split (%) 43.3% 43.3% 43.3% 43.3% 43.3% 26.7% 56.7% 30.0% 30.0% 30.0%Yellow Time (s) 4.0 4.0 4.0 4.0 4.0 4.0 4.0 4.0 4.0 4.0All-Red Time (s) 2.0 2.0 2.0 2.0 2.0 2.0 2.0 2.0 2.0 2.0Lost Time Adjust (s) -2.0 -2.0 -2.0 -2.0 -2.0 -2.0 -2.0 -2.0 -2.0Total Lost Time (s) 4.0 4.0 4.0 4.0 4.0 4.0 4.0 4.0 4.0Lead/Lag Lead Lag Lag LagLead-Lag Optimize?Recall Mode None None None None None None C-Max C-Max C-Max C-MaxAct Effct Green (s) 23.3 23.3 23.3 23.3 58.7 58.7 27.3 27.3 27.3Actuated g/C Ratio 0.26 0.26 0.26 0.26 0.65 0.65 0.30 0.30 0.30v/c Ratio 0.26 0.41 0.69 0.16 0.78 0.29 0.09 0.75 0.27Control Delay 26.2 5.4 40.4 20.0 30.0 7.0 27.5 33.0 7.4Queue Delay 0.0 0.0 0.0 0.0 0.0 0.0 0.0 0.0 0.0Total Delay 26.2 5.4 40.4 20.0 30.0 7.0 27.5 33.0 7.4LOS C A D B C A C C AApproach Delay 11.9 35.2 14.2 30.2Approach LOS B D B C
Intersection SummaryCycle Length: 90Actuated Cycle Length: 90Offset: 24 (27%), Referenced to phase 2:NBTL and 6:SBTL, Start of GreenNatural Cycle: 90Control Type: Actuated-CoordinatedMaximum v/c Ratio: 0.78Intersection Signal Delay: 22.2 Intersection LOS: CIntersection Capacity Utilization 80.1% ICU Level of Service DAnalysis Period (min) 15
Splits and Phases: 1: Appleby Line & Thomas Alton Boulevard
HCM Signalized Intersection Capacity Analysis1: Appleby Line & Thomas Alton Boulevard Background PM
PTSLPage 2
Movement EBL EBT EBR WBL WBT WBR NBL NBT NBR SBL SBT SBRLane ConfigurationsVolume (vph) 54 53 234 223 63 14 473 843 185 15 1287 156Ideal Flow (vphpl) 1900 1900 1900 1900 1900 1900 1900 1900 1900 1900 1900 1900Lane Width 3.3 3.6 3.5 3.3 3.6 3.5 3.3 3.6 3.5 3.3 3.6 3.5Total Lost time (s) 4.0 4.0 4.0 4.0 4.0 4.0 4.0 4.0 4.0Lane Util. Factor 1.00 1.00 1.00 1.00 1.00 *1.00 1.00 *1.00 1.00Frpb, ped/bikes 1.00 1.00 1.00 1.00 1.00 1.00 1.00 1.00 1.00Flpb, ped/bikes 1.00 1.00 1.00 1.00 1.00 1.00 1.00 1.00 1.00Frt 1.00 0.85 1.00 0.97 1.00 0.97 1.00 1.00 0.85Flt Protected 0.98 1.00 0.95 1.00 0.95 1.00 0.95 1.00 1.00Satd. Flow (prot) 1851 1536 1745 1843 1728 5413 1744 5644 1597Flt Permitted 0.83 1.00 0.68 1.00 0.13 1.00 0.29 1.00 1.00Satd. Flow (perm) 1577 1536 1252 1843 232 5413 538 5644 1597Peak-hour factor, PHF 1.00 1.00 1.00 1.00 1.00 1.00 1.00 1.00 1.00 1.00 1.00 1.00Adj. Flow (vph) 54 53 234 223 63 14 473 843 185 15 1287 156RTOR Reduction (vph) 0 0 173 0 10 0 0 32 0 0 0 99Lane Group Flow (vph) 0 107 61 223 67 0 473 996 0 15 1287 57Confl. Peds. (#/hr) 2 2 1 1Heavy Vehicles (%) 0% 0% 4% 0% 0% 0% 1% 3% 0% 0% 1% 0%Turn Type Perm NA Perm Perm NA pm+pt NA Perm NA PermProtected Phases 4 8 5 2 6Permitted Phases 4 4 8 2 6 6Actuated Green, G (s) 21.3 21.3 21.3 21.3 56.7 56.7 25.3 25.3 25.3Effective Green, g (s) 23.3 23.3 23.3 23.3 58.7 58.7 27.3 27.3 27.3Actuated g/C Ratio 0.26 0.26 0.26 0.26 0.65 0.65 0.30 0.30 0.30Clearance Time (s) 6.0 6.0 6.0 6.0 6.0 6.0 6.0 6.0 6.0Vehicle Extension (s) 3.0 3.0 3.0 3.0 3.0 3.0 3.0 3.0 3.0Lane Grp Cap (vph) 408 397 324 477 606 3530 163 1712 484v/s Ratio Prot 0.04 c0.24 0.18 0.23v/s Ratio Perm 0.07 0.04 c0.18 c0.27 0.03 0.04v/c Ratio 0.26 0.15 0.69 0.14 0.78 0.28 0.09 0.75 0.12Uniform Delay, d1 26.5 25.7 30.1 25.6 20.1 6.7 22.5 28.3 22.7Progression Factor 1.00 1.00 1.00 1.00 1.00 1.00 1.00 1.00 1.00Incremental Delay, d2 0.3 0.2 6.0 0.1 6.5 0.2 1.1 3.1 0.5Delay (s) 26.9 25.9 36.1 25.8 26.6 6.9 23.6 31.4 23.1Level of Service C C D C C A C C CApproach Delay (s) 26.2 33.4 13.1 30.4Approach LOS C C B C
Intersection SummaryHCM 2000 Control Delay 23.0 HCM 2000 Level of Service CHCM 2000 Volume to Capacity ratio 0.78Actuated Cycle Length (s) 90.0 Sum of lost time (s) 12.0Intersection Capacity Utilization 80.1% ICU Level of Service DAnalysis Period (min) 15c Critical Lane Group

HCM Unsignalized Intersection Capacity Analysis2: Valera Rd & Thomas Alton Boulevard Background PM
PTSLPage 3
Movement EBL EBT EBR WBL WBT WBR NBL NBT NBR SBL SBT SBRLane ConfigurationsVolume (veh/h) 3 285 14 80 593 19 3 0 30 26 1 18Sign Control Free Free Stop StopGrade 0% 0% 0% 0%Peak Hour Factor 1.00 1.00 1.00 1.00 1.00 1.00 1.00 1.00 1.00 1.00 1.00 1.00Hourly flow rate (vph) 3 285 14 80 593 19 3 0 30 26 1 18Pedestrians 3Lane Width (m) 3.6Walking Speed (m/s) 1.2Percent Blockage 0Right turn flare (veh)Median type None NoneMedian storage veh)Upstream signal (m) 173pX, platoon unblocked 0.87 0.87 0.87 0.87 0.87 0.87vC, conflicting volume 615 299 1079 1073 292 1094 1070 606vC1, stage 1 conf volvC2, stage 2 conf volvCu, unblocked vol 485 299 1017 1010 292 1034 1008 475tC, single (s) 4.1 4.1 7.1 6.5 6.2 7.1 6.5 6.2tC, 2 stage (s)tF (s) 2.2 2.2 3.5 4.0 3.3 3.5 4.0 3.3p0 queue free % 100 94 98 100 96 85 99 97cM capacity (veh/h) 947 1274 173 196 752 168 197 517
Direction, Lane # EB 1 WB 1 NB 1 SB 1Volume Total 302 692 33 45Volume Left 3 80 3 26Volume Right 14 19 30 18cSH 947 1274 577 231Volume to Capacity 0.00 0.06 0.06 0.19Queue Length 95th (m) 0.1 1.6 1.5 5.6Control Delay (s) 0.1 1.6 11.6 24.3Lane LOS A A B CApproach Delay (s) 0.1 1.6 11.6 24.3Approach LOS B C
Intersection SummaryAverage Delay 2.5Intersection Capacity Utilization 72.1% ICU Level of Service CAnalysis Period (min) 15
HCM Unsignalized Intersection Capacity Analysis3: Valera Rd & Verdi St Background PM
PTSLPage 4
Movement EBL EBR NBL NBT SBT SBRLane ConfigurationsVolume (veh/h) 9 0 0 24 84 11Sign Control Stop Free FreeGrade 0% 0% 0%Peak Hour Factor 1.00 1.00 1.00 1.00 1.00 1.00Hourly flow rate (vph) 9 0 0 24 84 11PedestriansLane Width (m)Walking Speed (m/s)Percent BlockageRight turn flare (veh)Median type None NoneMedian storage veh)Upstream signal (m)pX, platoon unblockedvC, conflicting volume 114 90 95vC1, stage 1 conf volvC2, stage 2 conf volvCu, unblocked vol 114 90 95tC, single (s) 6.4 6.2 4.1tC, 2 stage (s)tF (s) 3.5 3.3 2.2p0 queue free % 99 100 100cM capacity (veh/h) 888 974 1512
Direction, Lane # EB 1 NB 1 SB 1Volume Total 9 24 95Volume Left 9 0 0Volume Right 0 0 11cSH 888 1512 1700Volume to Capacity 0.01 0.00 0.06Queue Length 95th (m) 0.2 0.0 0.0Control Delay (s) 9.1 0.0 0.0Lane LOS AApproach Delay (s) 9.1 0.0 0.0Approach LOS A
Intersection SummaryAverage Delay 0.6Intersection Capacity Utilization 15.1% ICU Level of Service AAnalysis Period (min) 15

Queuing and Blocking ReportBackground PM
PTSL SimTraffic ReportPage 1
Intersection: 1: Appleby Line & Thomas Alton Boulevard
Movement EB EB WB WB NB NB NB NB SB SB SB SBDirections Served LT R L TR L T T TR L T T TMaximum Queue (m) 34.3 41.3 71.9 25.5 132.8 69.6 48.0 44.2 79.8 270.4 259.1 230.4Average Queue (m) 15.2 17.9 38.6 11.3 68.8 25.8 24.4 19.4 15.2 168.0 155.1 130.395th Queue (m) 29.2 35.3 60.6 23.1 117.3 51.0 43.1 39.6 64.0 281.1 265.9 234.6Link Distance (m) 138.4 98.7 98.7 232.9 232.9 232.9 289.5 289.5 289.5Upstream Blk Time (%) 2 0 0Queuing Penalty (veh) 0 0 0Storage Bay Dist (m) 35.0 135.0 50.0Storage Blk Time (%) 0 1 1 71 51Queuing Penalty (veh) 0 1 2 11 80
Intersection: 1: Appleby Line & Thomas Alton Boulevard
Movement SBDirections Served RMaximum Queue (m) 80.0Average Queue (m) 48.095th Queue (m) 101.0Link Distance (m)Upstream Blk Time (%)Queuing Penalty (veh)Storage Bay Dist (m) 50.0Storage Blk Time (%) 0Queuing Penalty (veh) 0
Intersection: 2: Valera Rd & Thomas Alton Boulevard
Movement EB WB NB SBDirections Served LTR LTR LTR LTRMaximum Queue (m) 15.0 38.7 13.8 21.5Average Queue (m) 1.0 7.5 5.9 8.395th Queue (m) 9.1 23.5 12.9 17.5Link Distance (m) 200.2 138.4 72.3 56.4Upstream Blk Time (%)Queuing Penalty (veh)Storage Bay Dist (m)Storage Blk Time (%)Queuing Penalty (veh)
Queuing and Blocking ReportBackground PM
PTSL SimTraffic ReportPage 2
Intersection: 3: Valera Rd & Verdi St
Movement EBDirections Served LRMaximum Queue (m) 8.9Average Queue (m) 2.295th Queue (m) 8.3Link Distance (m) 71.6Upstream Blk Time (%)Queuing Penalty (veh)Storage Bay Dist (m)Storage Blk Time (%)Queuing Penalty (veh)
Network SummaryNetwork wide Queuing Penalty: 94
Emery Investment’s Retail Site | Traffic Impact Study | 141070 | May 2015
Paradigm Transportation Solutions Limited | Appendices
Appendix E
Total Traffic Operational Conditions


Timings1: Appleby Line & Thomas Alton Boulevard Total AM
PTSLPage 1
Lane Group EBL EBT EBR WBL WBT NBL NBT SBL SBT SBRLane ConfigurationsVolume (vph) 204 17 472 36 12 135 1043 4 533 18Turn Type Perm NA Perm Perm NA pm+pt NA Perm NA PermProtected Phases 4 8 5 2 6Permitted Phases 4 4 8 2 6 6Detector Phase 4 4 4 8 8 5 2 6 6 6Switch PhaseMinimum Initial (s) 4.0 4.0 4.0 4.0 4.0 4.0 4.0 4.0 4.0 4.0Minimum Split (s) 39.0 39.0 39.0 39.0 39.0 10.0 25.0 25.0 25.0 25.0Total Split (s) 45.0 45.0 45.0 45.0 45.0 15.0 45.0 30.0 30.0 30.0Total Split (%) 50.0% 50.0% 50.0% 50.0% 50.0% 16.7% 50.0% 33.3% 33.3% 33.3%Yellow Time (s) 4.0 4.0 4.0 4.0 4.0 3.0 4.0 4.0 4.0 4.0All-Red Time (s) 2.0 2.0 2.0 2.0 2.0 1.0 2.0 2.0 2.0 2.0Lost Time Adjust (s) -2.0 -2.0 -2.0 -2.0 0.0 -2.0 -2.0 -2.0 -2.0Total Lost Time (s) 4.0 4.0 4.0 4.0 4.0 4.0 4.0 4.0 4.0Lead/Lag Lead Lag Lag LagLead-Lag Optimize?Recall Mode None None None None None None C-Max C-Max C-Max C-MaxAct Effct Green (s) 22.6 22.6 22.6 22.6 59.4 59.4 46.9 46.9 46.9Actuated g/C Ratio 0.25 0.25 0.25 0.25 0.66 0.66 0.52 0.52 0.52v/c Ratio 0.64 0.67 0.17 0.03 0.24 0.31 0.02 0.19 0.02Control Delay 37.3 9.8 25.2 20.5 8.2 7.5 15.5 13.3 0.1Queue Delay 0.0 0.0 0.0 0.0 0.0 0.0 0.0 0.0 0.0Total Delay 37.3 9.8 25.2 20.5 8.2 7.5 15.5 13.3 0.1LOS D A C C A A B B AApproach Delay 18.6 24.0 7.6 12.8Approach LOS B C A B
Intersection SummaryCycle Length: 90Actuated Cycle Length: 90Offset: 15 (17%), Referenced to phase 2:NBTL and 6:SBTL, Start of GreenNatural Cycle: 75Control Type: Actuated-CoordinatedMaximum v/c Ratio: 0.67Intersection Signal Delay: 12.0 Intersection LOS: BIntersection Capacity Utilization 58.4% ICU Level of Service BAnalysis Period (min) 15
Splits and Phases: 1: Appleby Line & Thomas Alton Boulevard
HCM Signalized Intersection Capacity Analysis1: Appleby Line & Thomas Alton Boulevard Total AM
PTSLPage 2
Movement EBL EBT EBR WBL WBT WBR NBL NBT NBR SBL SBT SBRLane ConfigurationsVolume (vph) 204 17 472 36 12 1 135 1043 70 4 533 18Ideal Flow (vphpl) 1900 1900 1900 1900 1900 1900 1900 1900 1900 1900 1900 1900Lane Width 3.3 3.6 3.5 3.3 3.6 3.5 3.3 3.6 3.5 3.3 3.6 3.5Total Lost time (s) 4.0 4.0 4.0 4.0 4.0 4.0 4.0 4.0 4.0Lane Util. Factor 1.00 1.00 1.00 1.00 1.00 *1.00 1.00 *1.00 1.00Frpb, ped/bikes 1.00 1.00 1.00 1.00 1.00 1.00 1.00 1.00 0.98Flpb, ped/bikes 1.00 1.00 1.00 1.00 1.00 1.00 1.00 1.00 1.00Frt 1.00 0.85 1.00 0.99 1.00 0.99 1.00 1.00 0.85Flt Protected 0.96 1.00 0.95 1.00 0.95 1.00 0.95 1.00 1.00Satd. Flow (prot) 1811 1581 1745 1876 1630 5432 1745 5377 1561Flt Permitted 0.73 1.00 0.47 1.00 0.42 1.00 0.27 1.00 1.00Satd. Flow (perm) 1389 1581 865 1876 722 5432 497 5377 1561Peak-hour factor, PHF 1.00 1.00 1.00 1.00 1.00 1.00 1.00 1.00 1.00 1.00 1.00 1.00Adj. Flow (vph) 204 17 472 36 12 1 135 1043 70 4 533 18RTOR Reduction (vph) 0 0 305 0 1 0 0 6 0 0 0 9Lane Group Flow (vph) 0 221 167 36 12 0 135 1107 0 4 533 9Confl. Peds. (#/hr) 2 2 1 1Heavy Vehicles (%) 0% 0% 1% 0% 0% 0% 7% 4% 3% 0% 6% 0%Turn Type Perm NA Perm Perm NA pm+pt NA Perm NA PermProtected Phases 4 8 5 2 6Permitted Phases 4 4 8 2 6 6Actuated Green, G (s) 20.6 20.6 20.6 20.6 57.4 57.4 44.9 44.9 44.9Effective Green, g (s) 22.6 22.6 22.6 22.6 57.4 59.4 46.9 46.9 46.9Actuated g/C Ratio 0.25 0.25 0.25 0.25 0.64 0.66 0.52 0.52 0.52Clearance Time (s) 6.0 6.0 6.0 6.0 4.0 6.0 6.0 6.0 6.0Vehicle Extension (s) 3.0 3.0 3.0 3.0 3.0 3.0 3.0 3.0 3.0Lane Grp Cap (vph) 348 397 217 471 546 3585 258 2802 813v/s Ratio Prot 0.01 0.02 c0.20 0.10v/s Ratio Perm c0.16 0.11 0.04 0.13 0.01 0.01v/c Ratio 0.64 0.42 0.17 0.03 0.25 0.31 0.02 0.19 0.01Uniform Delay, d1 30.0 28.2 26.3 25.4 6.6 6.5 10.4 11.5 10.4Progression Factor 1.00 1.00 1.00 1.00 1.00 1.00 1.00 1.00 1.00Incremental Delay, d2 3.8 0.7 0.4 0.0 0.2 0.2 0.1 0.2 0.0Delay (s) 33.8 28.9 26.7 25.4 6.8 6.8 10.5 11.6 10.4Level of Service C C C C A A B B BApproach Delay (s) 30.5 26.4 6.8 11.6Approach LOS C C A B
Intersection SummaryHCM 2000 Control Delay 14.6 HCM 2000 Level of Service BHCM 2000 Volume to Capacity ratio 0.42Actuated Cycle Length (s) 90.0 Sum of lost time (s) 12.0Intersection Capacity Utilization 58.4% ICU Level of Service BAnalysis Period (min) 15c Critical Lane Group
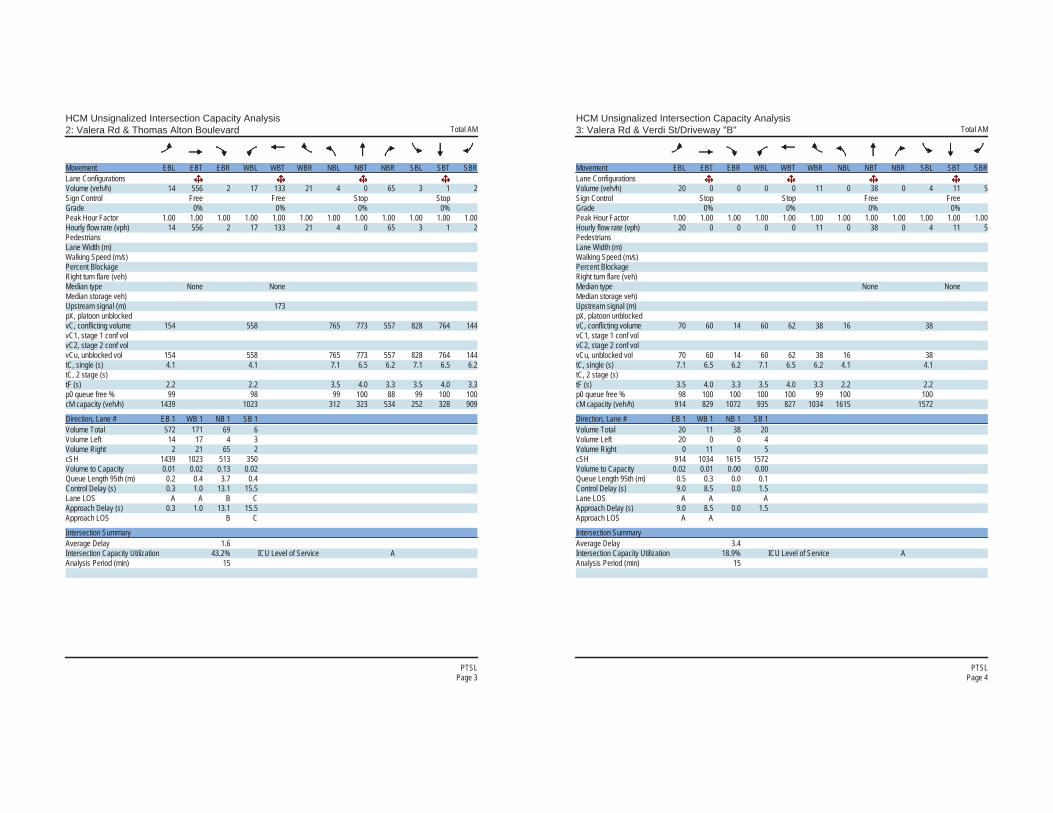
HCM Unsignalized Intersection Capacity Analysis2: Valera Rd & Thomas Alton Boulevard Total AM
PTSLPage 3
Movement EBL EBT EBR WBL WBT WBR NBL NBT NBR SBL SBT SBRLane ConfigurationsVolume (veh/h) 14 556 2 17 133 21 4 0 65 3 1 2Sign Control Free Free Stop StopGrade 0% 0% 0% 0%Peak Hour Factor 1.00 1.00 1.00 1.00 1.00 1.00 1.00 1.00 1.00 1.00 1.00 1.00Hourly flow rate (vph) 14 556 2 17 133 21 4 0 65 3 1 2PedestriansLane Width (m)Walking Speed (m/s)Percent BlockageRight turn flare (veh)Median type None NoneMedian storage veh)Upstream signal (m) 173pX, platoon unblockedvC, conflicting volume 154 558 765 773 557 828 764 144vC1, stage 1 conf volvC2, stage 2 conf volvCu, unblocked vol 154 558 765 773 557 828 764 144tC, single (s) 4.1 4.1 7.1 6.5 6.2 7.1 6.5 6.2tC, 2 stage (s)tF (s) 2.2 2.2 3.5 4.0 3.3 3.5 4.0 3.3p0 queue free % 99 98 99 100 88 99 100 100cM capacity (veh/h) 1439 1023 312 323 534 252 328 909
Direction, Lane # EB 1 WB 1 NB 1 SB 1Volume Total 572 171 69 6Volume Left 14 17 4 3Volume Right 2 21 65 2cSH 1439 1023 513 350Volume to Capacity 0.01 0.02 0.13 0.02Queue Length 95th (m) 0.2 0.4 3.7 0.4Control Delay (s) 0.3 1.0 13.1 15.5Lane LOS A A B CApproach Delay (s) 0.3 1.0 13.1 15.5Approach LOS B C
Intersection SummaryAverage Delay 1.6Intersection Capacity Utilization 43.2% ICU Level of Service AAnalysis Period (min) 15
HCM Unsignalized Intersection Capacity Analysis3: Valera Rd & Verdi St/Driveway "B" Total AM
PTSLPage 4
Movement EBL EBT EBR WBL WBT WBR NBL NBT NBR SBL SBT SBRLane ConfigurationsVolume (veh/h) 20 0 0 0 0 11 0 38 0 4 11 5Sign Control Stop Stop Free FreeGrade 0% 0% 0% 0%Peak Hour Factor 1.00 1.00 1.00 1.00 1.00 1.00 1.00 1.00 1.00 1.00 1.00 1.00Hourly flow rate (vph) 20 0 0 0 0 11 0 38 0 4 11 5PedestriansLane Width (m)Walking Speed (m/s)Percent BlockageRight turn flare (veh)Median type None NoneMedian storage veh)Upstream signal (m)pX, platoon unblockedvC, conflicting volume 70 60 14 60 62 38 16 38vC1, stage 1 conf volvC2, stage 2 conf volvCu, unblocked vol 70 60 14 60 62 38 16 38tC, single (s) 7.1 6.5 6.2 7.1 6.5 6.2 4.1 4.1tC, 2 stage (s)tF (s) 3.5 4.0 3.3 3.5 4.0 3.3 2.2 2.2p0 queue free % 98 100 100 100 100 99 100 100cM capacity (veh/h) 914 829 1072 935 827 1034 1615 1572
Direction, Lane # EB 1 WB 1 NB 1 SB 1Volume Total 20 11 38 20Volume Left 20 0 0 4Volume Right 0 11 0 5cSH 914 1034 1615 1572Volume to Capacity 0.02 0.01 0.00 0.00Queue Length 95th (m) 0.5 0.3 0.0 0.1Control Delay (s) 9.0 8.5 0.0 1.5Lane LOS A A AApproach Delay (s) 9.0 8.5 0.0 1.5Approach LOS A A
Intersection SummaryAverage Delay 3.4Intersection Capacity Utilization 18.9% ICU Level of Service AAnalysis Period (min) 15

HCM Unsignalized Intersection Capacity Analysis4: Driveway "A" & Thomas Alton Boulevard Total AM
PTSLPage 5
Movement EBT EBR WBL WBT NBL NBRLane ConfigurationsVolume (veh/h) 616 8 13 152 19 77Sign Control Free Free StopGrade 0% 0% 0%Peak Hour Factor 1.00 1.00 1.00 1.00 1.00 1.00Hourly flow rate (vph) 616 8 13 152 19 77PedestriansLane Width (m)Walking Speed (m/s)Percent BlockageRight turn flare (veh)Median type None NoneMedian storage veh)Upstream signal (m) 120pX, platoon unblocked 1.00vC, conflicting volume 624 798 620vC1, stage 1 conf volvC2, stage 2 conf volvCu, unblocked vol 624 796 620tC, single (s) 4.1 6.4 6.2tC, 2 stage (s)tF (s) 2.2 3.5 3.3p0 queue free % 99 95 84cM capacity (veh/h) 967 353 492
Direction, Lane # EB 1 WB 1 NB 1Volume Total 624 165 96Volume Left 0 13 19Volume Right 8 0 77cSH 1700 967 456Volume to Capacity 0.37 0.01 0.21Queue Length 95th (m) 0.0 0.3 6.3Control Delay (s) 0.0 0.8 15.0Lane LOS A BApproach Delay (s) 0.0 0.8 15.0Approach LOS B
Intersection SummaryAverage Delay 1.8Intersection Capacity Utilization 45.4% ICU Level of Service AAnalysis Period (min) 15
Queuing and Blocking ReportTotal AM
PTSL SimTraffic ReportPage 1
Intersection: 1: Appleby Line & Thomas Alton Boulevard
Movement EB EB WB WB NB NB NB NB SB SB SB SBDirections Served LT R L TR L T T TR L T T TMaximum Queue (m) 58.4 56.3 18.8 10.9 35.5 72.5 62.6 44.6 7.6 61.4 50.7 19.3Average Queue (m) 29.1 27.3 7.3 2.7 15.9 37.4 29.1 16.5 0.6 31.7 18.3 2.795th Queue (m) 49.9 47.8 16.9 9.2 28.5 62.9 52.9 36.2 3.8 54.3 40.4 11.7Link Distance (m) 90.2 98.5 98.5 231.4 231.4 231.4 290.3 290.3 290.3Upstream Blk Time (%)Queuing Penalty (veh)Storage Bay Dist (m) 35.0 135.0 50.0Storage Blk Time (%) 6 4 1 0Queuing Penalty (veh) 29 9 0 0
Intersection: 1: Appleby Line & Thomas Alton Boulevard
Movement SBDirections Served RMaximum Queue (m) 8.7Average Queue (m) 2.595th Queue (m) 8.5Link Distance (m)Upstream Blk Time (%)Queuing Penalty (veh)Storage Bay Dist (m) 50.0Storage Blk Time (%)Queuing Penalty (veh)
Intersection: 2: Valera Rd & Thomas Alton Boulevard
Movement EB WB NB SBDirections Served LTR LTR LTR LTRMaximum Queue (m) 14.9 16.7 18.8 8.7Average Queue (m) 1.0 2.6 7.8 1.895th Queue (m) 6.8 10.5 14.4 7.6Link Distance (m) 200.2 33.2 74.1 57.2Upstream Blk Time (%)Queuing Penalty (veh)Storage Bay Dist (m)Storage Blk Time (%)Queuing Penalty (veh)

Queuing and Blocking ReportTotal AM
PTSL SimTraffic ReportPage 2
Intersection: 3: Valera Rd & Verdi St/Driveway "B"
Movement EB WBDirections Served LTR LTRMaximum Queue (m) 9.0 9.1Average Queue (m) 4.3 2.795th Queue (m) 11.4 9.4Link Distance (m) 71.5 64.0Upstream Blk Time (%)Queuing Penalty (veh)Storage Bay Dist (m)Storage Blk Time (%)Queuing Penalty (veh)
Intersection: 4: Driveway "A" & Thomas Alton Boulevard
Movement WB NBDirections Served LT LRMaximum Queue (m) 17.3 22.1Average Queue (m) 2.4 10.895th Queue (m) 10.5 17.7Link Distance (m) 90.2 50.8Upstream Blk Time (%)Queuing Penalty (veh)Storage Bay Dist (m)Storage Blk Time (%)Queuing Penalty (veh)
Network SummaryNetwork wide Queuing Penalty: 38
Timings1: Appleby Line & Thomas Alton Boulevard Total PM
PTSLPage 1
Lane Group EBL EBT EBR WBL WBT NBL NBT SBL SBT SBRLane ConfigurationsVolume (vph) 56 53 263 223 63 516 843 15 1287 182Turn Type Perm NA Perm Perm NA pm+pt NA Perm NA PermProtected Phases 4 8 5 2 6Permitted Phases 4 4 8 2 6 6Detector Phase 4 4 4 8 8 5 2 6 6 6Switch PhaseMinimum Initial (s) 4.0 4.0 4.0 4.0 4.0 4.0 4.0 4.0 4.0 4.0Minimum Split (s) 39.0 39.0 39.0 39.0 39.0 10.0 25.0 25.0 25.0 25.0Total Split (s) 39.0 39.0 39.0 39.0 39.0 24.0 51.0 27.0 27.0 27.0Total Split (%) 43.3% 43.3% 43.3% 43.3% 43.3% 26.7% 56.7% 30.0% 30.0% 30.0%Yellow Time (s) 4.0 4.0 4.0 4.0 4.0 4.0 4.0 4.0 4.0 4.0All-Red Time (s) 2.0 2.0 2.0 2.0 2.0 2.0 2.0 2.0 2.0 2.0Lost Time Adjust (s) -2.0 -2.0 -2.0 -2.0 -2.0 -2.0 -2.0 -2.0 -2.0Total Lost Time (s) 4.0 4.0 4.0 4.0 4.0 4.0 4.0 4.0 4.0Lead/Lag Lead Lag Lag LagLead-Lag Optimize?Recall Mode None None None None None None C-Max C-Max C-Max C-MaxAct Effct Green (s) 23.3 23.3 23.3 23.3 58.7 58.7 23.2 23.2 23.2Actuated g/C Ratio 0.26 0.26 0.26 0.26 0.65 0.65 0.26 0.26 0.26v/c Ratio 0.27 0.44 0.69 0.16 0.75 0.29 0.11 0.89 0.34Control Delay 26.3 5.5 40.8 20.0 27.5 7.0 28.2 41.0 7.8Queue Delay 0.0 0.0 0.0 0.0 0.0 0.0 0.0 0.0 0.0Total Delay 26.3 5.5 40.8 20.0 27.5 7.0 28.2 41.0 7.8LOS C A D B C A C D AApproach Delay 11.6 35.4 13.8 36.8Approach LOS B D B D
Intersection SummaryCycle Length: 90Actuated Cycle Length: 90Offset: 24 (27%), Referenced to phase 2:NBTL and 6:SBTL, Start of GreenNatural Cycle: 90Control Type: Actuated-CoordinatedMaximum v/c Ratio: 0.89Intersection Signal Delay: 24.6 Intersection LOS: CIntersection Capacity Utilization 82.5% ICU Level of Service EAnalysis Period (min) 15
Splits and Phases: 1: Appleby Line & Thomas Alton Boulevard

HCM Signalized Intersection Capacity Analysis1: Appleby Line & Thomas Alton Boulevard Total PM
PTSLPage 2
Movement EBL EBT EBR WBL WBT WBR NBL NBT NBR SBL SBT SBRLane ConfigurationsVolume (vph) 56 53 263 223 63 14 516 843 185 15 1287 182Ideal Flow (vphpl) 1900 1900 1900 1900 1900 1900 1900 1900 1900 1900 1900 1900Lane Width 3.3 3.6 3.5 3.3 3.6 3.5 3.3 3.6 3.5 3.3 3.6 3.5Total Lost time (s) 4.0 4.0 4.0 4.0 4.0 4.0 4.0 4.0 4.0Lane Util. Factor 1.00 1.00 1.00 1.00 1.00 *1.00 1.00 *1.00 1.00Frpb, ped/bikes 1.00 1.00 1.00 1.00 1.00 1.00 1.00 1.00 1.00Flpb, ped/bikes 1.00 1.00 1.00 1.00 1.00 1.00 1.00 1.00 1.00Frt 1.00 0.85 1.00 0.97 1.00 0.97 1.00 1.00 0.85Flt Protected 0.97 1.00 0.95 1.00 0.95 1.00 0.95 1.00 1.00Satd. Flow (prot) 1850 1536 1745 1843 1728 5413 1744 5644 1597Flt Permitted 0.83 1.00 0.68 1.00 0.15 1.00 0.29 1.00 1.00Satd. Flow (perm) 1569 1536 1245 1843 267 5413 538 5644 1597Peak-hour factor, PHF 1.00 1.00 1.00 1.00 1.00 1.00 1.00 1.00 1.00 1.00 1.00 1.00Adj. Flow (vph) 56 53 263 223 63 14 516 843 185 15 1287 182RTOR Reduction (vph) 0 0 195 0 10 0 0 32 0 0 0 122Lane Group Flow (vph) 0 109 68 223 67 0 516 996 0 15 1287 60Confl. Peds. (#/hr) 2 2 1 1Heavy Vehicles (%) 0% 0% 4% 0% 0% 0% 1% 3% 0% 0% 1% 0%Turn Type Perm NA Perm Perm NA pm+pt NA Perm NA PermProtected Phases 4 8 5 2 6Permitted Phases 4 4 8 2 6 6Actuated Green, G (s) 21.3 21.3 21.3 21.3 56.7 56.7 21.2 21.2 21.2Effective Green, g (s) 23.3 23.3 23.3 23.3 58.7 58.7 23.2 23.2 23.2Actuated g/C Ratio 0.26 0.26 0.26 0.26 0.65 0.65 0.26 0.26 0.26Clearance Time (s) 6.0 6.0 6.0 6.0 6.0 6.0 6.0 6.0 6.0Vehicle Extension (s) 3.0 3.0 3.0 3.0 3.0 3.0 3.0 3.0 3.0Lane Grp Cap (vph) 406 397 322 477 685 3530 138 1454 411v/s Ratio Prot 0.04 c0.26 0.18 c0.23v/s Ratio Perm 0.07 0.04 c0.18 0.23 0.03 0.04v/c Ratio 0.27 0.17 0.69 0.14 0.75 0.28 0.11 0.89 0.14Uniform Delay, d1 26.6 25.9 30.1 25.6 18.3 6.7 25.5 32.1 25.8Progression Factor 1.00 1.00 1.00 1.00 1.00 1.00 1.00 1.00 1.00Incremental Delay, d2 0.4 0.2 6.3 0.1 4.7 0.2 1.6 8.2 0.7Delay (s) 26.9 26.1 36.4 25.8 23.0 6.9 27.1 40.3 26.5Level of Service C C D C C A C D CApproach Delay (s) 26.3 33.7 12.3 38.5Approach LOS C C B D
Intersection SummaryHCM 2000 Control Delay 25.9 HCM 2000 Level of Service CHCM 2000 Volume to Capacity ratio 0.78Actuated Cycle Length (s) 90.0 Sum of lost time (s) 12.0Intersection Capacity Utilization 82.5% ICU Level of Service EAnalysis Period (min) 15c Critical Lane Group
HCM Unsignalized Intersection Capacity Analysis2: Valera Rd & Thomas Alton Boulevard Total PM
PTSLPage 3
Movement EBL EBT EBR WBL WBT WBR NBL NBT NBR SBL SBT SBRLane ConfigurationsVolume (veh/h) 3 299 16 91 612 19 5 0 33 26 1 18Sign Control Free Free Stop StopGrade 0% 0% 0% 0%Peak Hour Factor 1.00 1.00 1.00 1.00 1.00 1.00 1.00 1.00 1.00 1.00 1.00 1.00Hourly flow rate (vph) 3 299 16 91 612 19 5 0 33 26 1 18Pedestrians 3Lane Width (m) 3.6Walking Speed (m/s) 1.2Percent Blockage 0Right turn flare (veh)Median type None NoneMedian storage veh)Upstream signal (m) 173pX, platoon unblocked 0.86 0.86 0.86 0.86 0.86 0.86vC, conflicting volume 634 315 1135 1129 307 1152 1128 624vC1, stage 1 conf volvC2, stage 2 conf volvCu, unblocked vol 498 315 1078 1071 307 1098 1069 487tC, single (s) 4.1 4.1 7.1 6.5 6.2 7.1 6.5 6.2tC, 2 stage (s)tF (s) 2.2 2.2 3.5 4.0 3.3 3.5 4.0 3.3p0 queue free % 100 93 97 100 96 83 99 96cM capacity (veh/h) 928 1257 155 177 738 149 178 504
Direction, Lane # EB 1 WB 1 NB 1 SB 1Volume Total 318 722 38 45Volume Left 3 91 5 26Volume Right 16 19 33 18cSH 928 1257 493 208Volume to Capacity 0.00 0.07 0.08 0.22Queue Length 95th (m) 0.1 1.9 2.0 6.4Control Delay (s) 0.1 1.8 12.9 27.0Lane LOS A A B DApproach Delay (s) 0.1 1.8 12.9 27.0Approach LOS B D
Intersection SummaryAverage Delay 2.7Intersection Capacity Utilization 73.4% ICU Level of Service DAnalysis Period (min) 15
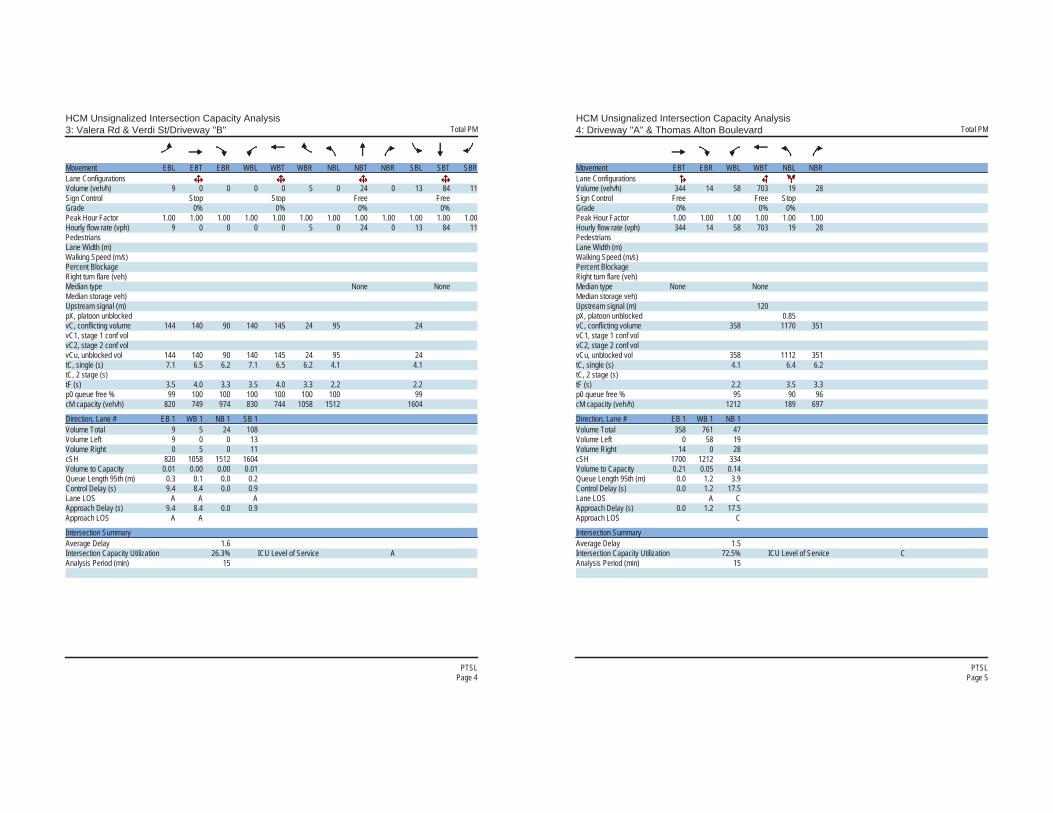
HCM Unsignalized Intersection Capacity Analysis3: Valera Rd & Verdi St/Driveway "B" Total PM
PTSLPage 4
Movement EBL EBT EBR WBL WBT WBR NBL NBT NBR SBL SBT SBRLane ConfigurationsVolume (veh/h) 9 0 0 0 0 5 0 24 0 13 84 11Sign Control Stop Stop Free FreeGrade 0% 0% 0% 0%Peak Hour Factor 1.00 1.00 1.00 1.00 1.00 1.00 1.00 1.00 1.00 1.00 1.00 1.00Hourly flow rate (vph) 9 0 0 0 0 5 0 24 0 13 84 11PedestriansLane Width (m)Walking Speed (m/s)Percent BlockageRight turn flare (veh)Median type None NoneMedian storage veh)Upstream signal (m)pX, platoon unblockedvC, conflicting volume 144 140 90 140 145 24 95 24vC1, stage 1 conf volvC2, stage 2 conf volvCu, unblocked vol 144 140 90 140 145 24 95 24tC, single (s) 7.1 6.5 6.2 7.1 6.5 6.2 4.1 4.1tC, 2 stage (s)tF (s) 3.5 4.0 3.3 3.5 4.0 3.3 2.2 2.2p0 queue free % 99 100 100 100 100 100 100 99cM capacity (veh/h) 820 749 974 830 744 1058 1512 1604
Direction, Lane # EB 1 WB 1 NB 1 SB 1Volume Total 9 5 24 108Volume Left 9 0 0 13Volume Right 0 5 0 11cSH 820 1058 1512 1604Volume to Capacity 0.01 0.00 0.00 0.01Queue Length 95th (m) 0.3 0.1 0.0 0.2Control Delay (s) 9.4 8.4 0.0 0.9Lane LOS A A AApproach Delay (s) 9.4 8.4 0.0 0.9Approach LOS A A
Intersection SummaryAverage Delay 1.6Intersection Capacity Utilization 26.3% ICU Level of Service AAnalysis Period (min) 15
HCM Unsignalized Intersection Capacity Analysis4: Driveway "A" & Thomas Alton Boulevard Total PM
PTSLPage 5
Movement EBT EBR WBL WBT NBL NBRLane ConfigurationsVolume (veh/h) 344 14 58 703 19 28Sign Control Free Free StopGrade 0% 0% 0%Peak Hour Factor 1.00 1.00 1.00 1.00 1.00 1.00Hourly flow rate (vph) 344 14 58 703 19 28PedestriansLane Width (m)Walking Speed (m/s)Percent BlockageRight turn flare (veh)Median type None NoneMedian storage veh)Upstream signal (m) 120pX, platoon unblocked 0.85vC, conflicting volume 358 1170 351vC1, stage 1 conf volvC2, stage 2 conf volvCu, unblocked vol 358 1112 351tC, single (s) 4.1 6.4 6.2tC, 2 stage (s)tF (s) 2.2 3.5 3.3p0 queue free % 95 90 96cM capacity (veh/h) 1212 189 697
Direction, Lane # EB 1 WB 1 NB 1Volume Total 358 761 47Volume Left 0 58 19Volume Right 14 0 28cSH 1700 1212 334Volume to Capacity 0.21 0.05 0.14Queue Length 95th (m) 0.0 1.2 3.9Control Delay (s) 0.0 1.2 17.5Lane LOS A CApproach Delay (s) 0.0 1.2 17.5Approach LOS C
Intersection SummaryAverage Delay 1.5Intersection Capacity Utilization 72.5% ICU Level of Service CAnalysis Period (min) 15

Queuing and Blocking ReportTotal PM
PTSL SimTraffic ReportPage 1
Intersection: 1: Appleby Line & Thomas Alton Boulevard
Movement EB EB WB WB NB NB NB NB SB SB SB SBDirections Served LT R L TR L T T TR L T T TMaximum Queue (m) 42.7 45.5 68.6 33.0 134.3 77.9 44.7 38.3 79.9 298.5 292.2 284.6Average Queue (m) 17.0 20.8 36.5 11.3 73.3 25.1 24.3 18.8 16.9 229.8 221.6 206.995th Queue (m) 33.9 36.4 57.8 25.1 119.3 53.1 41.8 34.9 67.8 349.6 346.7 345.0Link Distance (m) 90.2 98.7 98.7 232.8 232.8 232.8 290.3 290.3 290.3Upstream Blk Time (%) 33 30 33Queuing Penalty (veh) 0 0 0Storage Bay Dist (m) 35.0 135.0 50.0Storage Blk Time (%) 1 1 0 79 70Queuing Penalty (veh) 1 1 1 12 127
Intersection: 1: Appleby Line & Thomas Alton Boulevard
Movement SBDirections Served RMaximum Queue (m) 80.0Average Queue (m) 67.495th Queue (m) 109.1Link Distance (m)Upstream Blk Time (%)Queuing Penalty (veh)Storage Bay Dist (m) 50.0Storage Blk Time (%) 0Queuing Penalty (veh) 2
Intersection: 2: Valera Rd & Thomas Alton Boulevard
Movement EB WB NB SBDirections Served LTR LTR LTR LTRMaximum Queue (m) 30.2 33.9 12.4 22.0Average Queue (m) 1.6 9.9 6.2 7.995th Queue (m) 13.3 26.1 12.5 16.3Link Distance (m) 200.2 33.2 74.1 57.2Upstream Blk Time (%) 0Queuing Penalty (veh) 2Storage Bay Dist (m)Storage Blk Time (%)Queuing Penalty (veh)
Queuing and Blocking ReportTotal PM
PTSL SimTraffic ReportPage 2
Intersection: 3: Valera Rd & Verdi St/Driveway "B"
Movement EB WB SBDirections Served LTR LTR LTRMaximum Queue (m) 8.9 10.4 1.8Average Queue (m) 2.4 1.0 0.195th Queue (m) 8.8 5.9 1.3Link Distance (m) 71.5 64.0 74.1Upstream Blk Time (%)Queuing Penalty (veh)Storage Bay Dist (m)Storage Blk Time (%)Queuing Penalty (veh)
Intersection: 4: Driveway "A" & Thomas Alton Boulevard
Movement EB WB NBDirections Served TR LT LRMaximum Queue (m) 1.4 36.4 19.9Average Queue (m) 0.0 8.5 8.895th Queue (m) 1.0 24.3 16.3Link Distance (m) 33.2 90.2 50.8Upstream Blk Time (%)Queuing Penalty (veh)Storage Bay Dist (m)Storage Blk Time (%)Queuing Penalty (veh)
Network SummaryNetwork wide Queuing Penalty: 146


Emery Investment’s Retail Site | Traffic Impact Study | 141070 | May 2015
Paradigm Transportation Solutions Limited | Appendices
Appendix F
Left-Turn Lane Warrants

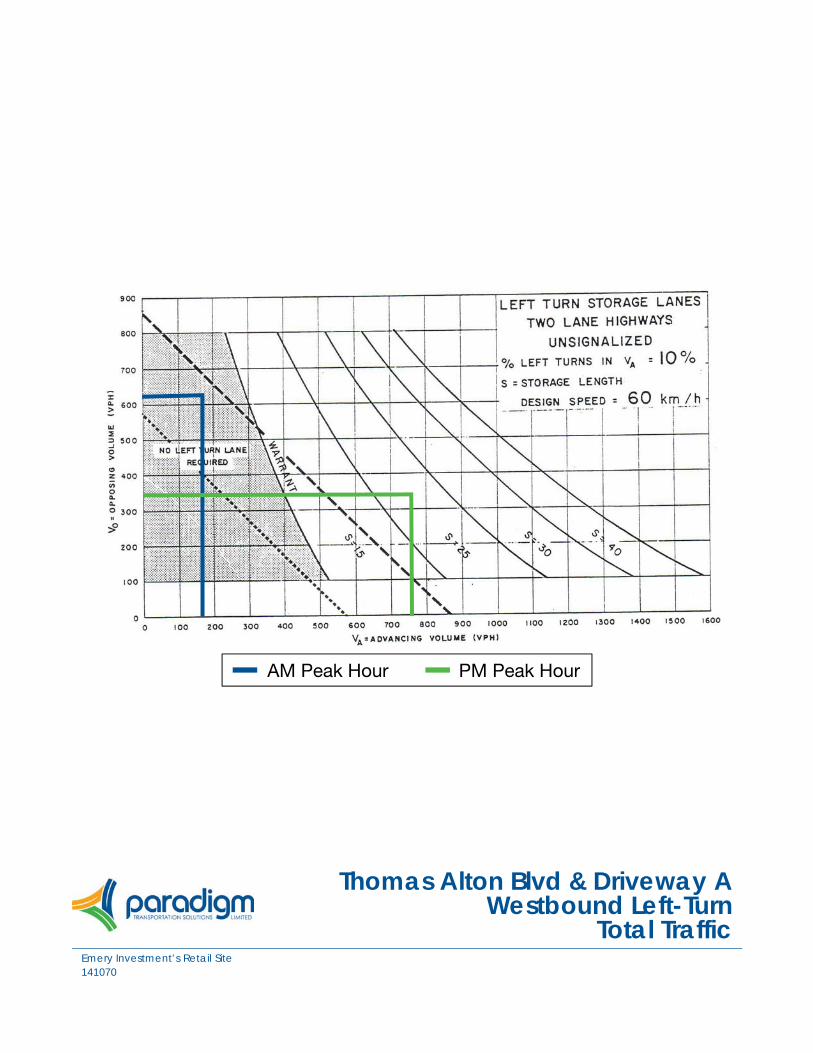
Thomas Alton Blvd & Driveway AWestbound Left-Turn
Total TrafficEmery Investment’s Retail Site141070
AM Peak Hour PM Peak Hour

Thomas Alton Blvd & Valear RdWestbound Left-Turn
Total TrafficEmery Investment’s Retail Site141070
AM Peak Hour PM Peak Hour

Thomas Alton Blvd & Valear RdEastbound Left-Turn
Total TrafficEmery Investment’s Retail Site141070
AM Peak Hour PM Peak Hour
Related Documents