Emerging technologies—beyond the chasm: Assessing technological forecasting and its implication for innovation management in Korea Hyoung Joon An a,1 , Sang-Jin Ahn b, ⁎ ,1 a School of History and Sociology, Georgia Institute of Technology, Atlanta, GA 30332-0225, USA b Office of Strategic Foresight, Korea Institute of Science and Technology Evaluation and Planning, Seoul 137-711, Republic of Korea article info abstract Article history: Received 29 December 2014 Received in revised form 6 May 2015 Accepted 20 June 2015 Available online xxxx Technology forecasting is inevitable in modern society; however, few studies have assessed it under an innovation management framework. By employing the Innovation Readiness Level, we have assessed the innovation performance of the 10 Emerging Future Technologies reported in 2009. The data-mining process, including a patent analysis and survey results, validates the following hypotheses. 1) Technological innovation activities involving the 10 Emerging Future Technologies have increased after their announcement. 2) A chasm exists in the commerciali- zation process of the 10 Emerging Future Technologies. 3) Interaction between innovation practitioners is correlated with overcoming the chasm. 4) Government support is useful for groups having difficulties in overcoming the chasm. Those foundations stress the roles of technological forecasting when entrepreneur assumes the risk associated with uncertainty in commercializing emerging technologies. © 2015 Elsevier Inc. All rights reserved. Keywords: Chasm Technological forecasting Foresight assessment Entrepreneurship Emerging technology Innovation 1. Introduction Any individual, organization, or nation that can be affected by technological change inevitably engages in Technology Forecasting (TF) with every decision that allocates resources to particular purposes. A technological change may invalidate a resource allocation decision. Therefore, every decision is based on the forecast that technology either will not change or will change favorably. If technological change is inevitable, TF can be justified based on its use in decision making, which implies that TF facilitates better decision making. In particular, forecasts play specific roles in improving the quality of decision making in each innovation management stage (Martino, 1993). Hébert and Link (2009) have reported the entrepreneur exhibit no fewer than 12 identities of the entrepreneur in the historical economics literature. The entrepreneur can be the person who assumes the risk associated with uncertainty, the person who supplies financial capital, an innovator, a decision maker, an industrial leader, a manager, an organizer of economic resources, the owner of an enterprise, an employer of factors of production, a contractor, an arbitrageur, or an allocator of resources among alternative uses. Link and Scott (2010) have defined ‘government as entrepreneur’ as a unique lens through which to characterize a specific subset of government policy actions. If TF is indispensable to entrepre- neur, its role should be determined from the 12 identities of entrepreneur. Since innovation management frameworks have developed in the entrepreneurial perspectives, the entrepreneurial roles of TF can turn out from assessing it by innovation management framework. Among the diverse innovation management Technological Forecasting & Social Change xxx (2015) xxx–xxx Abbreviations: TF, Technology Forecasting; IRL, Innovation Readiness Level; EF Techs, Emerging Future Technologies; BMI, Brain Machine Interface; RNA, Ribo-Nucleic Acid; IoE, Internet of Everything; iPS, induced Pluripotent Stem Cell; IPC, International Patent Classification; CIS, Community Innovation Survey; O1, non-overcoming group; O2, overcoming group. ⁎ Corresponding author. Tel.: +82 2 589 2254; fax: +82 2 589 5231. E-mail address: [email protected] (S.-J. Ahn). 1 Two authors have equally contributed to the work as first author. TFS-18239; No of Pages 11 http://dx.doi.org/10.1016/j.techfore.2015.06.015 0040-1625/© 2015 Elsevier Inc. All rights reserved. Contents lists available at ScienceDirect Technological Forecasting & Social Change Please cite this article as: An, H.J., Ahn, S.-J., Emerging technologies—beyond the chasm: Assessing technological forecasting and its implication..., Technol. Forecast. Soc. Change (2015), http://dx.doi.org/10.1016/j.techfore.2015.06.015

Welcome message from author
This document is posted to help you gain knowledge. Please leave a comment to let me know what you think about it! Share it to your friends and learn new things together.
Transcript

Technological Forecasting & Social Change xxx (2015) xxx–xxx
TFS-18239; No of Pages 11
Contents lists available at ScienceDirect
Technological Forecasting & Social Change
Emerging technologies—beyond the chasm: Assessing technologicalforecasting and its implication for innovation management in Korea
Hyoung Joon An a,1, Sang-Jin Ahnb,⁎,1a School of History and Sociology, Georgia Institute of Technology, Atlanta, GA 30332-0225, USAb Office of Strategic Foresight, Korea Institute of Science and Technology Evaluation and Planning, Seoul 137-711, Republic of Korea
a r t i c l e i n f o
Abbreviations: TF, Technology Forecasting; IRL, InnovEF Techs, Emerging Future Technologies; BMI, Brain MRibo-Nucleic Acid; IoE, Internet of Everything; iPS, indCell; IPC, International Patent Classification; CIS, CSurvey; O1, non-overcoming group; O2, overcoming gro⁎ Corresponding author. Tel.: +82 2 589 2254; fax: +
E-mail address: [email protected] (S.-J. Ahn).1 Two authors have equally contributed to the work a
http://dx.doi.org/10.1016/j.techfore.2015.06.0150040-1625/© 2015 Elsevier Inc. All rights reserved.
Please cite this article as: An, H.J., Ahn, S.-J.,implication..., Technol. Forecast. Soc. Chang
a b s t r a c t
Article history:Received 29 December 2014Received in revised form 6 May 2015Accepted 20 June 2015Available online xxxx
Technology forecasting is inevitable in modern society; however, few studies have assessed itunder an innovation management framework. By employing the Innovation Readiness Level, wehave assessed the innovation performance of the 10 Emerging Future Technologies reported in2009. The data-mining process, including a patent analysis and survey results, validates thefollowing hypotheses. 1) Technological innovation activities involving the 10 Emerging FutureTechnologies have increased after their announcement. 2) A chasm exists in the commerciali-zation process of the 10 Emerging Future Technologies. 3) Interaction between innovationpractitioners is correlated with overcoming the chasm. 4) Government support is useful forgroups having difficulties in overcoming the chasm. Those foundations stress the roles oftechnological forecasting when entrepreneur assumes the risk associated with uncertainty incommercializing emerging technologies.
© 2015 Elsevier Inc. All rights reserved.
Keywords:ChasmTechnological forecastingForesight assessmentEntrepreneurshipEmerging technologyInnovation
1. Introduction
Any individual, organization, or nation that can be affectedby technological change inevitably engages in TechnologyForecasting (TF) with every decision that allocates resourcesto particular purposes. A technological changemay invalidate aresource allocation decision. Therefore, every decision is basedon the forecast that technology either will not change or willchange favorably. If technological change is inevitable, TF canbe justified based on its use in decision making, which impliesthat TF facilitates better decisionmaking. In particular, forecasts
ation Readiness Level;achine Interface; RNA,uced Pluripotent Stemommunity Innovationup.82 2 589 5231.
s first author.
Emerging technologies—e (2015), http://dx.doi.o
play specific roles in improving the quality of decision makingin each innovation management stage (Martino, 1993).
Hébert and Link (2009) have reported the entrepreneurexhibit no fewer than 12 identities of the entrepreneur in thehistorical economics literature. The entrepreneur can be theperson who assumes the risk associated with uncertainty, theperson who supplies financial capital, an innovator, a decisionmaker, an industrial leader, a manager, an organizer ofeconomic resources, the owner of an enterprise, an employerof factors of production, a contractor, an arbitrageur, or anallocator of resources among alternative uses. Link and Scott(2010) have defined ‘government as entrepreneur’ as a uniquelens through which to characterize a specific subset ofgovernment policy actions. If TF is indispensable to entrepre-neur, its role should be determined from the 12 identities ofentrepreneur.
Since innovation management frameworks have developedin the entrepreneurial perspectives, the entrepreneurial rolesof TF can turn out from assessing it by innovationmanagementframework. Among the diverse innovation management
beyond the chasm: Assessing technological forecasting and itsrg/10.1016/j.techfore.2015.06.015

2 H.J. An, S.-J. Ahn / Technological Forecasting & Social Change xxx (2015) xxx–xxx
techniques such as the Technology Readiness Level (Mankins,1995) and Market Adoption Model (Moore, 1999), we adoptIRL (Tao et al., 2010) as evaluation framework. The IRL is amodel integrating extant studies considering technologydevelopment and market evolution. Its innovation readinessconcept involves dividing the whole innovation cycle into sixphases and the readiness level into five key aspects to provideoverall, explicit, and practical evaluation items for eachelement, so it has an advantage by discovering a chasm if ithas a level less than 4. Adams et al. (2006) stressed that othertechniques have not integrated sufficiently to conceptualizeinnovation as a process, differentiate its constituent phases. IRLcan provide a comprehensive framework to measure them.Although IRL has a potential advantage in linking TF toentrepreneurship by assessing TF, very little research hasfocused on these advantages. In fact, TF have an important rolein innovation management but its ex post evaluation hasscarcely been reported on. The previous pioneering casestudies, such as Japan (Kameoka et al., 2004) and Turkey(Öner and Beşer, 2011), have contributed marginally toprogress linking TF to entrepreneurship, but the chasm-related researches, known as pertinent entrepreneurial issues,have not explored in assessing TF.
Based on the IRL, our study reveals the contributions toinnovation, of the 10 EF Techs reported in 2009, such as TFeffectiveness, its commercialization implications, and theeffectiveness of public policies. For a brief introduction to thecontents, we structure this report as follows. Section 2describes the 10 EF Techs announced in 2009 and themethodological approaches have discussed in the Section 3.Section 4 deals with the assessment results. Section 5 presentsdiscussions on the implications of assessing the TF. The finalsection closes with conclusions and suggestions.
Table 1Commercialization tracing by patent disclosures.
Cause: disclosure Lag(yr.)
Effect(sales/capital)
Effect(sales/employee
Forward Reverse Forward Reve
BMI 1 8.718⁎ 0.071 0.002 0.12 5.213 3.244 23.76⁎ 7.6
RNA-based therapeutic agent 1 28.42⁎⁎ 0.217 0.701 3.42 8.961 0.673 3.498 0.2
Graphene nanostructure 1 0.334 0.431 2.111 7.52 38.23⁎⁎ 6.452 16.02⁎ 2.6
Clean coal technology 1 0.071 0.325 0.396 0.32 1.034 2.698 0.667 3.0
Dye-sensitized solar cell 1 1.012 2.847 3.015 2.62 0.731 0.782 1.565 0.6
IoE 1 0.002 0.982 0.141 0.52 0.416 0.297 1.228 2.4
iPS 1 0.959 2.283 22.71⁎⁎ 6.02 5.46 0.787 4.35 5.7
Human body communication 1 0.267 0.136 0.222 0.42 1.89 7.392 0.495 3.2
Cognitive robotics 1 0.942 0.006 1.327 0.02 0.375 9.156 0.451 1.4
Life-logging technology 1 27.54⁎⁎ 1.15 0.05 17.42 22.15⁎ 0.823 2.707 5.7
⁎ p b 0.05.⁎⁎ p b 0.01.
Please cite this article as: An, H.J., Ahn, S.-J., Emerging technologies—implication..., Technol. Forecast. Soc. Change (2015), http://dx.doi.o
2. Background
2.1. The 10 EF Techs in Korea
Several organizations have forecasted emerging technologiesand reported on their forecasts. Some well-known forecasts are“Disruptive technologies” (Mckinsey Global Institute, 2013), “10Breakthrough Technologies” (MIT, 2012), “Next 5 in 5” (IBM,2012), and “Top10Strategic Technologies” (GartnerGroup, 2012).
Similarly, in Korea, emerging technologies, which can becrucial to increasing the nation's prosperity, have reportedregularly, because of their potential advantage in adding newvalue and reducing social opportunity cost. “The 10 EF Techs inKorea” (KISTEP, 2009) have been reported since 2009. Thewiki-based approach have been applied to the first report of the10 EF Techs since it can take its own advantage of the effectiveknowledge formation process in incorporating members'opinions, framing policies, and leading to the discovery ofknowledge through a standardized consensual process. Afteridentifying 25 candidates by the economic impacts expectedover the following 10 years, thewiki-based expert review haveselected the final 10 technologies depending on the purpose offorecasting. The final 10 technologies were BMI, RNA-basedtherapeutic agent, graphene nanostructure, clean coal technol-ogy, dye-sensitized solar cell, IoE, iPS, human body communi-cation, cognitive robotics, and life-logging technology.
2.2. Conceptual framework
The year 2014 marks five years since the announcement ofthe 10 EF Techs in 2009. Therefore, an interim check isnecessary because, normally, a 10-year period is consideredwhen selecting such technologies, to evaluate their realization
)Effect(capital/employee)
Effect (sales) Effect (capital)
rse Forward Reverse Forward Reverse Forward Reverse
56 3.483 0.099 0.002 0.156 1.155 4.03127 2.218 2.646 23.76⁎ 7.627 14.89⁎ 3.44299 0.047 0.146 0.008 0.645 0.108 7.27222 0.285 2.094 0.049 5.723 16.52⁎ 2.5913⁎ 0.204 2.824 – – – –04 0.845 7.38 – – – –96 2.133 0.183 – – – –26 0.675 22.91⁎ – – – –82 0.733 2.749 – – – –4 0.746 0.374 – – – –53 1.118 3.852 – – – –11 0.796 1.141 – – – –98 6.119⁎ 0.03 – – – –96 14.1⁎ 1.591 – – – –67 0.007 1.413 – – – –63 2.469 2.696 – – – –19 9.965⁎ 0.013 27.9⁎⁎ 0.002 1.891 0.00276 2.937 3.734 20.85⁎ 1.104 0.823 1.7145⁎⁎ 1.63 0.102 – – – –39 0.04 6.653 – – – –
beyond the chasm: Assessing technological forecasting and itsrg/10.1016/j.techfore.2015.06.015

Table 2Commercialization tracing by patent registrations.
Cause: registration Lag(yr.)
Effect(sales/capital)
Effect(sales/employee)
Effect(capital/employee)
Effect (sales) Effect (capital)
Forward Reverse Forward Reverse Forward Reverse Forward Reverse Forward Reverse
BMI 1 6.2 18.31⁎⁎ 1.979 4.977 0.922 8.239⁎ 1.979 4.977 0.066 0.8882 2.574 3.182 13.53⁎ 21.61⁎ 0.652 1.929 13.53⁎ 21.62⁎ 2.062 19.13⁎
RNA-based therapeutic agent 1 8.32⁎ 0.692 0.311 0.273 0.059 2.165 0.517 3.875 1.732 0.9882 0.141 0.709 1.176 0.688 0.578 1.828 0.155 1.532 0.647 1.144
Graphene nanostructure 1 1.875 1.867 1.487 18.16⁎⁎ 0.035 3.194 – – – –2 5.585⁎ 3.468 0.817 1.201 0.253 0.31 – – – –
Clean coal technology 1 1.682 1.729 2.466 35.12⁎⁎ 4.82 14.14⁎⁎ – – – –2 10.22⁎ 60.85⁎⁎ 4.093 9.723⁎ 1.197 1.545 – – – –
Dye-sensitized solar cell 1 11.55⁎ 3.431 0.241 8.078⁎ 0.136 3.41 – – – –2 15.97⁎ 0.841 7.075 2.606 0.588 2.797 – – – –
IoE 1 1.204 4.675 2.758 0.076 0.762 5.266 – – – –2 3.263 0.792 0.241 1.468 2.676 9.162 – – – –
iPS 1 0.308 1.523 3.731 40.91⁎⁎⁎ 1.004 55.42 – – – –2 – – – – – – – – – –
Human body communication 1 1.04 10.4 4.94 8.095⁎ 2.793 2.87 – – – –2 0.776 2.502 1.563 1.751 1.983 36.45⁎⁎ – – – –
Cognitive robotics 1 0.51 4.98 3.678 2.256 0.786 1.802 0.013 2.794 2.545 0.0312 0.133 3.546 3.659 3.075 2.193 0.681 0.685 1.005 1.246 4.015
Life-logging technology 1 27.54⁎⁎ 1.15 0.05 17.45⁎⁎ 1.63 0.102 – – – –2 22.15⁎ 0.824 2.706 5.739 0.04 6.654 – – – –
⁎ p b 0.05.⁎⁎ p b 0.01.⁎⁎⁎ p b 0.001.
2 There is the assistance of the professional survey corporation, that is GallupKorea, in that process.
3H.J. An, S.-J. Ahn / Technological Forecasting & Social Change xxx (2015) xxx–xxx
and resulting effects. Such an interim check is vital for aneffective selection of the 10 EF Techs, the establishmentof follow-up measures, and the finalization of the investmenttarget. This study employed the IRL, an innovation manage-ment tool, as the conceptual framework to perform the interimcheck on the 10 EF Techs announced in 2009 from theperspective of the parties using the technology foresightresults. This study aims to test the following hypotheses.
Hypothesis 1. Technological innovation activities involvingthe 10 EF Techs have increased after they were reported.
Hypothesis 2. A chasm exists in the commercializationprocess of the 10 EF Techs.
Hypothesis 3. Interaction between innovation practi-tioners is correlated with overcoming the chasm.
Hypothesis 4. Government support is useful for groupsthat face difficulties in overcoming the chasm.
Hypothesis 1 is related to the assessment of TF whilehypotheses 2, 3, and 4 are concerned with the implications oflinking TF to strategic public policy. To this end, hypotheses 1, 2,3, and 4 were reviewed based on (i) data mining using patentanalysis and (ii) survey results.
3. Methods
First, patent disclosure, registration, patent holders, andcollaborative patents were chosen for innovation activities inthe data-mining process. A Granger causality test (Seth, 2007)has been applied to the trace commercialization process of eachtechnology.
Please cite this article as: An, H.J., Ahn, S.-J., Emerging technologies—implication..., Technol. Forecast. Soc. Change (2015), http://dx.doi.o
Second, the questions for the survey were framed based onthe Oslo Manual (OECD, 2005)—the source of standardizedinternational guidelines for innovative activity data collectionand application. The Community Innovation Survey (CIS) (STEPI,2010) has been implemented in Korea since 2002. For this study,the CIS survey on the manufacturing sector published in 2010was amended for the purposes of this study, and new questionswere added to it to finalize 28 detailed items in 11 areas. In thisstudy, we choose the inventors in each corresponding 10 EFTechs as a related survey target for the practical reasons. Tomaximize relevant respondents,wehave collected the inventor'sinformation in each corresponding 10 EF Techs from patentmining because the patent activities can be as a trace ofindustrialization. The following results of Granger causality test,shown in the Tables 1 and 2, can prove the patent activities are atrace of industrialization. As a result, 218 inventors among thewhole 256 survey targets can be secured through patent miningand 38 inventors of themwill be based on the recommendation(snowball sampling). After collecting the preliminary respon-dents, we contact to the whole targets by phone and explain theagenda of the survey to encourage their responses.2 The Internetsurvey period for this study extended from September 12 toOctober 15, 2014. There were 63 survey respondents, of whom49.2% indicated that the 10 EF Techs-related activities werecrucial for their organizations whereas 33.3% said lower. Thisimplies that the representativeness of the sample survey groupcan be recognized.
beyond the chasm: Assessing technological forecasting and itsrg/10.1016/j.techfore.2015.06.015

4 H.J. An, S.-J. Ahn / Technological Forecasting & Social Change xxx (2015) xxx–xxx
4. TF and its assessment
4.1. Hypothesis 1: Technological innovation activities involving the10 EF Techs have increased after they were reported.
If the cumulative patents (disclosed/registered) or patentholders over time are expressed in a normalized distributionwith time, it can be understood as an S-curve type oftechnology lifecycle. The time evolution of the cumulativepatents or patent holders can be illustrated as a concave curvein the introductory phase, whereas it can be displayed as aconvex curve in the maturity phase. In addition, moderncomplex network theory predicts that network evolution isgenerated by an increase in nodes and links (phase 1),demonstration of preferential attachment (phase 2), extremelyconcentrated hubs forming their own organizations (phase 3),and network aging (phase 4) (Albert and Barabasi, 2002; Böneret al., 2004; Valverde et al., 2007). Therefore, the time variationof a collaborative patent network can determine the stage ofdevelopment in a partnership.
Fig. 1(a) and (c) show that the time evolution of thecumulated patents can be understood as a concave pattern
Fig. 1. Time evolution of technology: (a) patent disclosures of the 10 EF Techs, (b) pateIPC code, and (d) registrations of each corresponding IPC code. The 10 EF Techs: 1. Btechnology, 5. Dye-sensitized solar cell, 6. IoE, 7. iPS, 8. Human body communication, 9
Please cite this article as: An, H.J., Ahn, S.-J., Emerging technologies—implication..., Technol. Forecast. Soc. Change (2015), http://dx.doi.o
regardless of the type of technology; therefore, we candemonstrate that Hypothesis 1 is true as regards the technol-ogy aspect of IRL. This is an intrinsic effect of the 10 EF Techsbecause the timedependence of each corresponding IPC code isrepresented in a linear fashion, as shown in Fig. 1(b) and (d).The time evolution of the cumulated patent holders can beunderstood similarly to the cumulated patents depicted inFig. 2. Therefore, Hypothesis 1 is true as regards the organiza-tion aspect of IRL.
As the 10 EF Techs are emerging technologies in a nascentstage, it is highly unlikely for their evolution to reach phase3. The collaboration networks can be exhibited as small-world characteristics (Barabasi et al., 2002; Watts, 1999;Watts and Strogatz, 1998). Such a network evolution statusis examined in the disclosed and registered patents on the 10technologies. Consequently, graphene nanostructure, dye-sensitized solar cell, and IoE frequently display the risingre-link probability from 2009—an initial change in networkevolution. The evolution of collaboration networks in thedye-sensitized solar cell and IoE is displayed in Fig. 3. Thisanalytic result proves that Hypothesis 1 is true in apartnership in the IRL.
nt registrations of the 10 EF Techs, (c) patent disclosures of each correspondingMI, 2. RNA-based therapeutic agent, 3. Graphene nanostructure, 4. Clean coa. Cognitive robotics, and 10. Life-logging technology.
beyond the chasm: Assessing technological forecasting and itsrg/10.1016/j.techfore.2015.06.015
l

Fig. 2. Time evolution of organization: (a) patentees by disclosures and(b) patentees by registrations. The numbers of the 10 EF Techs correspond toFig. 1.
5H.J. An, S.-J. Ahn / Technological Forecasting & Social Change xxx (2015) xxx–xxx
The evolution of innovation activities can be analyzed by eachlevel of the IRL, with the modified CIS survey. Fig. 4 shows thatthe readiness levels have progressed in all areas from the pre-2009 period to the post-2009 period. This can help to provewhether Hypothesis 1 is true. Therefore the TF for the 10 EFTechs reported in 2009 was significant.
4.2. Hypothesis 2: A chasm exists in the commercialization processof the 10 EF Techs.
The existence of a chasm between technology and themarket can be verified by the Granger casualty test, evaluatingthe causal relationships between innovation practitioners'patent activities (disclosed/registered) and enterprises' eco-nomic activities. Of the causal relationships, if there is aforward causal relation from technology toward the market,patent activities can be viewed as making a certain level ofeconomic contribution to partly overcome the technology-market chasm. However, if such a forward causal relation doesnot exist or even if a reverse causal relationship exists, thetechnology-market chasm is presumed not to have beenovercome.
Please cite this article as: An, H.J., Ahn, S.-J., Emerging technologies—implication..., Technol. Forecast. Soc. Change (2015), http://dx.doi.o
The results of the causality test for the 10 EF Techs havebeen summarized in Tables 1 and 2. The results reveal thatstatistically significant causality has not been found in thefour disclosed cases (clean coal technology, dye-sensitizedsolar cell, IoE, and human body communication) and thefour registered cases (IoE, iPS, human body communication,and cognitive robotics). In particular, forward causalitycannot be found in IoE and human body communication.Therefore, it can be concluded that Hypothesis 2 is true, andFig. 4 can serve as corroborative evidence to support thisconclusion. A significant number of respondents are concen-trated below the 4th level, which strongly suggests theexistence of a chasm.
4.3. Hypothesis 3: Interaction between innovation practitioners iscorrelated with overcoming the chasm.
Collaborations in patents have received attention in relationto Triple Helix indicators for knowledge-based innovationsystems (Leydesdorff and Meyer, 2006); therefore, the corre-lation between the collaboration network and commercializa-tion might be expected. However, Table 3 cannot demonstratethat Hypothesis 3 will be true. This contradiction may implythat the 10 EF Techs cases cannot provide sufficient data to bemeaningful because they are in nascent stage.
Moreover, we examine differences in innovation diffusion,innovative activity, product and process innovation, thepurpose and effect of innovation, innovation activity disturbingfactors, organization innovation, marketing innovation, andgovernment support. Specifically, of the five key IRL aspects,those with a valid number of samples are selected in thechasm-overcoming groups (4–6th phases) and non-overcoming groups (1–3rd phases). Statistical analyses (chi-square test and variance analysis) are performed for eachsurvey item of the chosen factors between the two groups. Anyitem with a statistically significant difference is considered tohave significant correlation with chasm-overcoming.
Consequently, the two aspects—technology and organiza-tion—are found to have enough size in both groups for asurvey group-specific statistical analysis, and only theorganization aspect produces statistically significant results.Therefore, the subsequent descriptions of this work arelimited solely to the organization of the IRL. First, the non-overcoming group (O1) and overcoming group (O2) displaya statistically significant difference in the preliminaryidentification of cooperative and competitive relationships.Table 4 shows that O2 has a more specific understanding ofits competitors than O1 at the beginning of the innovationactivity. Table 5 shows that O2 has a more specificunderstanding of the cooperative relationship for outcomesthan O1. Therefore, overcoming the chasm has a statisticallysignificant relationship with the interaction between inno-vation practitioners (the preliminary identification of thecooperative and competitive relationships), and Hypothesis3 becomes true.
4.4. Hypothesis 4: Government support is useful for groups thatface difficulties in overcoming the chasm.
The effectiveness of government support is found to bedifferent betweenO2andO1. The chi-square test is implemented
beyond the chasm: Assessing technological forecasting and itsrg/10.1016/j.techfore.2015.06.015

Fig. 3. Time evolution of partnership: (a) dye-sensitized solar cell (2004–2008), (b) IoE (2004–2008), (c) dye-sensitized solar cell (2009–2014), and (d) IoE(2009–2014).
6 H.J. An, S.-J. Ahn / Technological Forecasting & Social Change xxx (2015) xxx–xxx
for O1 and O2 for the effectiveness of government support forfive years before and after 2009. Consequently, Table 6 showssignificant differences exist in tax benefits for technologydevelopment, commercialization support (financial support),and technology assistance and guidelines. O1, when comparedwith O2, ismore effective as regards tax benefits for technologydevelopment, commercialization support, and recent five-yeartechnology assistance and guidelines. Therefore, Hypothesis 4is found to be true.
In addition, we will look at several more items withsignificant differences between the chasm-overcominggroup and non-overcoming group in the Table 7. O2 is
Please cite this article as: An, H.J., Ahn, S.-J., Emerging technologies—implication..., Technol. Forecast. Soc. Change (2015), http://dx.doi.o
found to have fewer disturbances due to the absence of acooperative partner in its product and process innovationthan O1. In other words, cooperation with a partner inproduct and process innovation is helpful for chasm-overcoming in the organization aspect. Also in this aspect,O2 tends to establish “product or service quality improve-ment” or “internal/external organizational informationsharing or communication skill improvement” more fre-quently as its key purpose for organization innovation. Sincethe number of respondents may be an important limitationin terms of reliability of the result, only a few determinantsfor overcoming the chasm has found in this study. If the
beyond the chasm: Assessing technological forecasting and itsrg/10.1016/j.techfore.2015.06.015
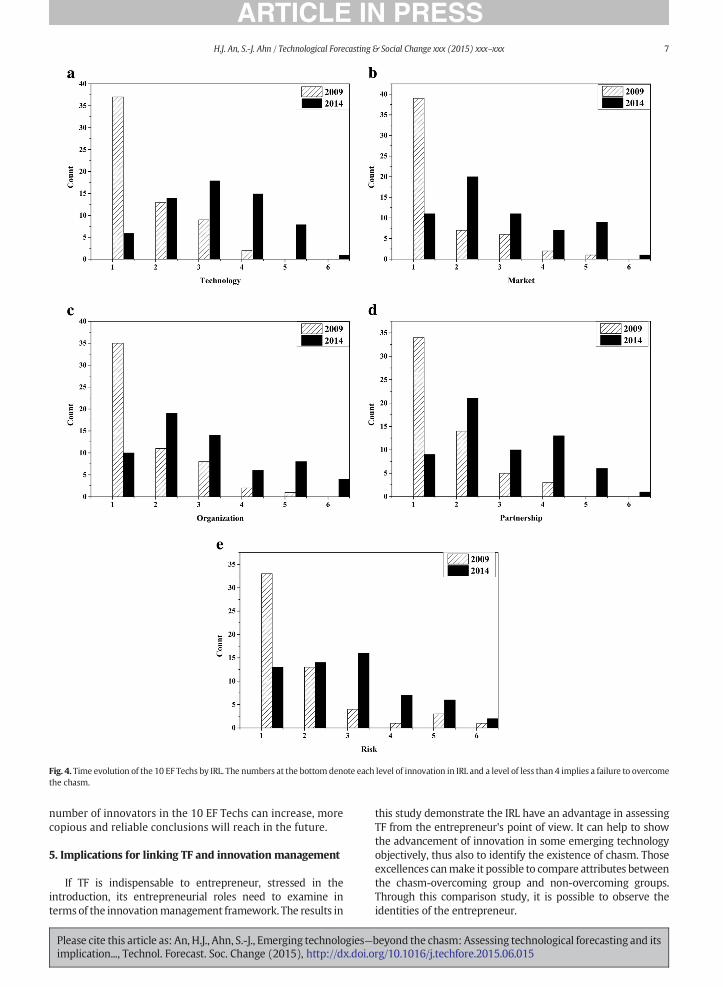
Fig. 4. Time evolution of the 10 EF Techs by IRL. The numbers at the bottom denote each level of innovation in IRL and a level of less than 4 implies a failure to overcomethe chasm.
7H.J. An, S.-J. Ahn / Technological Forecasting & Social Change xxx (2015) xxx–xxx
number of innovators in the 10 EF Techs can increase, morecopious and reliable conclusions will reach in the future.
5. Implications for linking TF and innovation management
If TF is indispensable to entrepreneur, stressed in theintroduction, its entrepreneurial roles need to examine interms of the innovationmanagement framework. The results in
Please cite this article as: An, H.J., Ahn, S.-J., Emerging technologies—implication..., Technol. Forecast. Soc. Change (2015), http://dx.doi.o
this study demonstrate the IRL have an advantage in assessingTF from the entrepreneur's point of view. It can help to showthe advancement of innovation in some emerging technologyobjectively, thus also to identify the existence of chasm. Thoseexcellences canmake it possible to compare attributes betweenthe chasm-overcoming group and non-overcoming groups.Through this comparison study, it is possible to observe theidentities of the entrepreneur.
beyond the chasm: Assessing technological forecasting and itsrg/10.1016/j.techfore.2015.06.015

Table 3Correlation between commercialization and collaboration network.
Small world characteristics
No Yes
Patent disclosure Forwardcausality
Yes BMI, RNA-based therapeutic agent, iPS, Cognitive robotics, Life-loggingtechnology
Graphene nanostructure
No Clean coal technology, Human body communication Dye-sensitized solar cell,IoE
Patentregistration
Forwardcausality
Yes BMI, RNA-based therapeutic agent, Clean coal technology, Life-loggingtechnology
Dye-sensitized solar cell
No iPS, Human body communication, Cognitive robotics IoE
Table 4Degree of identifying competitors related with research outcome.
(Unit: %)
Starting point Now
Respondents(number)
Notmuch
Normallevel
Ratherspecific
Veryspecific
F Respondents(number)
Never Notmuch
Normallevel
Ratherspecific
Veryspecific
F
Total 31 12.9 35.5 45.2 6.5 – 38 2.6 7.9 21.1 39.5 28.9 –Technology Not overcome 16 18.8 37.5 37.5 6.3 1.223 22 4.5 13.6 18.2 36.4 27.3 1.282
Overcome 14 7.1 28.6 57.1 7.1 16 0 0 25 43.8 31.3Uncategorized 1 0 100 0 0 – – – – – –
Market Not overcome 11 9.1 45.5 36.4 9.1 0.057 18 5.6 16.7 16.7 33.3 27.8 1.349Overcome 17 11.8 29.4 52.9 5.9 19 0 0 26.3 47.4 26.3Uncategorized 3 33.3 33.3 33.3 0 1 0 0 0 0 100
Organization Not overcome 20 20 45 30 5 7.860⁎⁎ 26 3.8 11.5 26.9 30.8 26.9 2.907Overcome 10 0 10 80 10 12 0 0 8.3 58.3 33.3Uncategorized 1 0 100 0 0 – – – – – –
Partnership Not overcome 11 9.1 36.4 45.5 9.1 0.022 17 5.9 17.6 17.6 29.4 29.4 1.925Overcome 18 11.1 33.3 50 5.6 21 0 0 23.8 47.6 28.6Uncategorized 2 50 50 0 0 – – – – – –
Risk Not overcome 4 0 0 75 25 4.748⁎ 7 14.3 0 14.3 28.6 42.9 0.005Overcome 24 12.5 41.7 41.7 4.2 29 0 10.3 20.7 44.8 24.1Uncategorized 3 33.3 33.3 33.3 0 2 0 0 50 0 50
⁎ p b 0.05.⁎⁎ p b 0.01.
Table 5Degree of identifying collaborators related with research outcome.
(Unit: %)
Starting point Now
Respondents(number)
Notmuch
Normallevel
Ratherspecific
Veryspecific
F Respondents(number)
Notmuch
Normallevel
Ratherspecific
Veryspecific
F
Total 31 6.5 45.2 38.7 9.7 – 38 5.3 21.1 42.1 31.6 –Technology Not overcome 16 12.5 50 31.3 6.3 2.071 22 4.5 22.7 40.9 31.8 0
Overcome 14 0 42.9 42.9 14.3 16 6.3 18.8 43.8 31.3Uncategorized 1 0 0 100 0 – – – – –
Market Not overcome 11 9.1 63.6 18.2 9.1 2.376 18 5.6 22.2 38.9 33.3 0.033Overcome 17 0 41.2 47.1 11.8 19 5.3 21.1 47.4 26.3Uncategorized 3 33.3 0 66.7 0 1 0 0 0 100
Organization Not overcome 20 10 60 20 10 4.450⁎ 26 7.7 23.1 42.3 26.9 1.467Overcome 10 0 20 70 10 12 0 16.7 41.7 41.7Uncategorized 1 0 0 100 0 – – – – –
Partnership Not overcome 11 9.1 54.5 27.3 9.1 1.164 17 5.9 23.5 35.3 35.3 0Overcome 18 0 44.4 44.4 11.1 21 4.8 19 47.6 28.6Uncategorized 2 50 0 50 0 – – – – –
Risk Not overcome 4 25 50 25 0 2.556 7 0 14.3 42.9 42.9 0.954Overcome 24 0 50 37.5 12.5 29 6.9 20.7 44.8 27.6Uncategorized 3 33.3 0 66.7 0 2 0 50 0 50
⁎ p b 0.05.
8 H.J. An, S.-J. Ahn / Technological Forecasting & Social Change xxx (2015) xxx–xxx
Please cite this article as: An, H.J., Ahn, S.-J., Emerging technologies—beyond the chasm: Assessing technological forecasting and itsimplication..., Technol. Forecast. Soc. Change (2015), http://dx.doi.org/10.1016/j.techfore.2015.06.015

Table 6Effectiveness of the government subsidy (technology development and commercialization support).
(Unit: %)
2004–2008 2009–2013
Respondents (number) Yes No Chi square Respondents (number) Yes No Chi square
Total 44 52.3 47.7 – 63 46 54 –Technology Not overcome 25 52 48 0.002 38 55.3 44.7 2.841
Overcome 19 52.6 47.4 24 33.3 66.7Uncategorized – – – 1 0 100
Market Not overcome 20 55 45 0.028 31 58.1 41.9 2.947Overcome 21 52.4 47.6 28 35.7 64.3Uncategorized 3 33.3 66.7 4 25 75
Organization Not overcome 30 56.7 43.3 0.403 43 55.8 44.2 3.999⁎
Overcome 13 46.2 53.8 18 27.8 72.2Uncategorized 1 0 100 2 0 100
Partnership Not overcome 20 45 55 0.834 30 56.7 43.3 2.411Overcome 22 59.1 40.9 30 36.7 63.3Uncategorized 2 50 50 3 33.3 66.7
Risk Not overcome 9 44.4 55.6 0.289 13 53.8 46.2 0.358Overcome 33 54.5 45.5 45 44.4 55.6Uncategorized 2 50 50 5 40 60
⁎ p b 0.05.
9H.J. An, S.-J. Ahn / Technological Forecasting & Social Change xxx (2015) xxx–xxx
Among 12 identities, TF can be useful for entrepreneurs, whenthey will act as both an innovator and the person who assumesthe risk associated with uncertainty. The four hypothesesexamined in this study and their verifications can provide cluesto solve the following questions.
(1) Which factors affect the success of entrepreneurship andtechnology foresight?
(2) What kind of mechanisms and partnerships affect theemergence of successful entrepreneurship and technol-ogy foresight outcomes?
Table 7Existence of hurdles in product or process innovation (absence of collaborators).
(Unit: %)
2004–2008
Respondents (number) Low Normal High
Total 24 8.3 25 66.7Technology Not overcome 11 9.1 18.2 72.7
Overcome 13 7.7 30.8 61.5Uncategorized – – – –
Market Not overcome 9 0 11.1 88.9Overcome 13 15.4 30.8 53.8Uncategorized 2 0 50 50
Organization Not overcome 14 0 14.3 85.7Overcome 10 20 40 40Uncategorized – – – –
Partnership Not overcome 7 0 14.3 85.7Overcome 16 12.5 31.3 56.3Uncategorized 1 0 0 100
Risk Not overcome 4 0 0 100Overcome 18 11.1 27.8 61.1Uncategorized 2 0 50 50
⁎ p b 0.05.⁎⁎ p b 0.01.⁎⁎⁎ p b 0.001.
Please cite this article as: An, H.J., Ahn, S.-J., Emerging technologies—implication..., Technol. Forecast. Soc. Change (2015), http://dx.doi.o
Among five types of innovations, our study on the 10 EFTechs shows that organization innovation will be the mostimportant determinant for success. This implies that entrepre-neurs should focus on promoting their organization innovationon the basis of information from TF. Then the question arises,“what kind of information is essential in the emergence stage?”The results of our analytics strongly indicate that it is crucial toidentify the enemies and friends in the supply chain as early aspossible. It means that entrepreneurs can overcome the chasmwhen they assume the risk associated with uncertainty. Thus,the reliable results from risk analysis are essential in linking TF
2009–2013
Chi square Respondents (number) Low Normal High Chi square
– 32 3.1 28.1 68.8 –0.503 19 0 26.3 73.7 1.964
12 8.3 33.3 58.31 0 0 100
3.247 16 0 25 75 2.13913 7.7 38.5 53.83 0 0 100
6.171⁎ 18 0 22.2 77.8 2.70813 7.7 38.5 53.81 0 0 100
2.06⁎⁎ 13 0 30.8 69.2 0.79217 5.9 29.4 64.72 0 0 100
2.281⁎⁎⁎ 5 0 20 80 0.63924 4.2 33.3 62.53 0 0 100
beyond the chasm: Assessing technological forecasting and itsrg/10.1016/j.techfore.2015.06.015

10 H.J. An, S.-J. Ahn / Technological Forecasting & Social Change xxx (2015) xxx–xxx
to entrepreneurship. It can also explain why government actsas entrepreneur in the provision of technology infrastructurewhen its involvement is both innovative and characterized byentrepreneurial risk (i.e., uncertainty).
Collaborations in patents cannot guarantee success inthe earliest emergence stage. This means that business fromthe 10 EF Techs in Korea can be associated with a laissez-faire regime from the neo-institutional perspectives of theTriple Helix model (Etzkowitz, 2008; Etzkowitz andLeydesdorff, 2000). In this regime, intervention in theeconomy is limited and industry is the driving force, withthe other two spheres as ancillary support structures andhaving limited roles in innovation; further, a universityacts primarily as a provider of skilled human capital, andgovernment primarily as a regulator of social and economicmechanisms.
Our methodology for assessing TF, based on IRL, will not belimited in this specific case. It can take advantage of combiningmeasures for TF with indicators understanding innovation.Therefore, it can be tailored by investigator's intention and beapplied to improve the understanding of linking TF andinnovation management.
6. Conclusions
In this study, an interim check was performed for the 10 EFTechs announced in 2009. Although there is not enough data onthe ET Techs essentially, four hypotheses can be verifiedthrough a data-mining process and a survey.
It is confirmed that technological innovation activitiesinvolving the 10 EF Techs have increased after their announce-ment. This implies that the forecasting of the 10 EF Techs in2009 has had a significant effect. Although we have noevidence to show whether the announcement of the 10 EFTechs helped stimulate technology innovation activities, the2009 technology foresight was found to be valid as at thecurrent time.
It is demonstrated that a chasm exists in the commer-cialization process of the 10 EF Techs and that interactionbetween innovation practitioners is correlated with overcomingthe chasm. Overcoming the chasm is deemed a strategy toturn these technologies into national economic drivers. Ourevidence indicates that organization innovation will be the mostimportant determinant of success among the five types ofinnovations.
The chasm-overcoming group and non-overcoming groupshowed a statistically significant difference in the interactionbetween innovation practitioners (cooperative relationshipand competitive relationship) and government support effec-tiveness. The cooperative patent did not affect chasm-overcoming in any distinctive positive way. Thus, it cannot becategorically stated that cooperation among different organi-zations is a key factor for successful chasm-overcoming.However, the early identification of innovation practitionerswho were its partners and competitors was found to have apositive effect on chasm-overcoming.
In addition, the chasm non-overcoming group performedbetter in response to government support than the overcominggroup. This finding is interpreted to mean that governmentsupport is more effectively used by a group having difficultiesin overcoming a chasm. If cooperation with a partner is
Please cite this article as: An, H.J., Ahn, S.-J., Emerging technologies—implication..., Technol. Forecast. Soc. Change (2015), http://dx.doi.o
reinforced in product and process innovation or if aninnovation practitioner formed a suitable environment forcooperation inside his or her organization, these can be viewedas key success factors to overcome the chasm. Some examplesof this are the organizations in which innovation purposesinclude product or service quality upgrade, internal/externalorganizational information sharing, and communication skillimprovement.
Based on the above discussion, entrepreneurs shouldidentify the enemies and friends in the supply chain as earlyas possible. Thus, the reliable results from risk analysis areessential in linking TF to entrepreneurship. Moreover, businessfrom the 10 EF Techs in Korea can be associated with a laissez-faire regime. Policy makers should consider the characteristicsof these innovation environments in framing an innovationpolicy. In a laissez-faire regime, intervention in the economy islimited and industry is the driving force; a university actsprimarily as a provider of skilled human capital, and thegovernment primarily as a regulator of social and economicmechanisms.
References
Adams, R., Bessant, J., Phelps, R., 2006. Innovation management measurement:a review. Int. J. Manag. Rev. 8 (1), 21–47.
Albert, R., Barabasi, A.L., 2002. Statistical mechanics of complex networks. Rev.Mod. Phys. 74, 47–97.
Barabasi, A.L., Jeong, H., Neda, Z., Ravasz, E., Shubert, A., Vicsek, T., 2002.Evolution of the social network of scientific collaborations. Phys. A 311,590–614.
Böner, K., Maru, J.T., Goldstone, R.L., 2004. The simultaneous evolution of authorpaper network. Proc. Natl. Acad. Sci. U. S. A. 101, 5266–5273.
Etzkowitz, H., 2008. The Triple Helix: University–Industry–GovernmentInnovation in Action. Routledge, London, England.
Etzkowitz, H., Leydesdorff, L., 2000. The dynamics of innovation: from nationalsystems and ‘mode 2’ to a triple helix of university–industry–governmentrelations. Res. Policy 29, 109–123.
Gartner Group, 2012. Gartner Identifies the Top 10 Strategic Technology Trendsfor 2013.
Hébert, R.F., Link, A.N., 2009. A History of Entrepreneurship. Routledge, London.IBM, 2012. The 5 in 5.Kameoka, A., Yokoo, Y., Kuwahara, T., 2004. A challenge of integrating
technology foresight and assessment in industrial strategy developmentand policymaking. Technol. Forecast. Soc. Chang. 71, 579–598.
KISTEP, 2009. The 10 Emerging Future Technologies (in Korean).Leydesdorff, L., Meyer, M., 2006. Triple helix indicators of knowledge-based
innovation systems: introduction to the special issue. Res. Policy 35,1441–1449.
Link, A.N., Scott, J.T., 2010. Government as entrepreneur: evaluating thecommercialization success of SBIR projects. Res. Policy 39, 589–601.
Mankins, J.C., 1995. Technology Readiness Levels. Advanced Concepts Office,Office of Space Access and Technology, NASA.
Martino, J.P., 1993. Technological Forecasting for Decision Making. 3rd ed.McGraw-Hill, Inc., US.
Mckinsey Global Institute, 2013. Disruptive Technologies.MIT, 2012. Breakthrough technologies. MIT Tech. Rev.Moore, G.A., 1999. Crossing the Chasm. Harper Business, New York, NY.OECD, 2005. OsloManual: Guidelines for Collecting and Interpreting Innovation
Data. 3rd edition. (www.oecd.org/sti/oslomanual).Öner, M.A., Beşer, S.G., 2011. Assessment of corporate foresight project results:
case of a multinational company in Turkey. Foresight 13 (2), 49–63.Seth, A.K., 2007. Granger causality. Scholarpedia 2 (7), 1667.STEPI, 2010. Community Innovation Survey (in Korean).Tao, L., Probert, D., Phaal, R., 2010. Toward an integrated framework for
managing the process of innovation. Res. Dev. Manag. 40 (1), 19–30.Valverde, S., Sole, R.V., Bedau,M.A., Packard,N., 2007. Topology and evolution of
technology innovation networks. Phys. Rev. E 76, 056118.Watts, D.J., 1999. SmallWorlds: The Dynamics of Networks BetweenOrder and
Randomness. Princeton University Press.Watts, D.J., Strogatz, S.H., 1998. Collective dynamics of ‘small-world’ networks.
Nature 393, 440–442.
beyond the chasm: Assessing technological forecasting and itsrg/10.1016/j.techfore.2015.06.015
11H.J. An, S.-J. Ahn / Technological Forecasting & Social Change xxx (2015) xxx–xxx
Hyuong Joon An is a Ph. D candidate at the School of History and Sociology atthe Georgia Institute of Technology. He received his M.S. in the philosophy ofscience at Seoul National University and worked as a science journalist foryears. Also he took charge of the institutional evaluation for government-funded research institutes at Korea Research Council for Industrial Science &Technology before joined Georgia Tech. Currently, he is writing a Ph. D.dissertation on the history of Korean rocket/space programs since 1950s.
Sang-Jin Ahn is a research fellow in Korea Institute of S&T Evaluation andPlanning (KISTEP), Korea. He received his Ph. D. in Physics from KoreaAdvanced Institute of Science and Technology in 2005. He has two yearresearch experiences as a senior researcher in Samsung Electronics. He hasjoined in KISTEP since 2007 and took part in developing the 1st edition ofstandard guideline for implementing preliminary feasibility study on R&Dprogram. He has worked as feasibility analyst and futurist. His researchinterests are preliminary feasibility analysis on R&D program, R&D life-cyclemanagement, scientometrics, technological forecasting, future foresight, andstatistical mechanics of social & economic system.
Please cite this article as: An, H.J., Ahn, S.-J., Emerging technologies—beyond the chasm: Assessing technological forecasting and itsimplication..., Technol. Forecast. Soc. Change (2015), http://dx.doi.org/10.1016/j.techfore.2015.06.015
Related Documents