1 Emerging Opportunities for System Dynamics in UK Health and Social care - The Market-Pull for Systemic Thinking Eric Wolstenholme, (Director Symmetric SD and Professor of Business Learning, London South Bank University), Douglas McKelvie, (Associate Symmetric SD) David Monk, (Director Symmetric SD), David Todd (Symmetric SD) Dr Carol Brady, General Manager Psychological Therapies and Primary Care, Lincolnshire Partnership Foundation NHS Trust Abstract The field of health and social care in the UK has been very receptive to systemic thinking in recent years and has been extensively and successfully modelled. This paper describes two trends in health care thinking in the UK which build upon this receptivity and are creating market pulls for whole systems ideas. These are the related areas of health needs analysis and service-line reporting, two concepts that are in search of a language and methodology to help deliver their potential. The paper describes how system dynamics is being applied to both these trends. The work is creating a natural progression for communicating system dynamics models and improving their impact on the thinking of clinicians and managers, particularly in mental health as epitomized by the contribution to this paper of the general manager responsible for the case study used. Introduction There have been numerous highly successful applications of system dynamics in health in recent years. These have covered health reform (Hirsch et al, 2005), capacity planning (Lacey, 2005; Lane et al, 2000; Royston, 1999; Taylor and Dangerfield, 2005), older people’s services (Wolstenholme, 1993, 1996, 1999, 2007, 2008), disease management (Dangerfield and Roberts, 1999) and mental health (Wolstenholme et al, 20054, 2008). Much of the modelling effort to date has been to create composite models of multiple health delivery systems. It has long been the contention of the authors here that whilst this approach can be successful the resultant models can often be too complex to counter their main purpose, which is to develop the mental models of clinicians and managers. We are not alone in recognising this problem. The introduction of modifications to the system dynamics method, such as systems thinking (Senge, 1990) and strategy dynamics (Warren, 2002) are ways that exist to improve the realisation of the systemic objectives of the method. However, these methods achieve their aim by eliminating some components of system dynamics - systems thinking by leaving out stocks and flows and simulation, and strategy dynamics by largely leaving out feedback.

Welcome message from author
This document is posted to help you gain knowledge. Please leave a comment to let me know what you think about it! Share it to your friends and learn new things together.
Transcript
1
Emerging Opportunities for System Dynamics in UK
Health and Social care - The Market-Pull for Systemic Thinking
Eric Wolstenholme, (Director Symmetric SD and Professor of Business Learning, London
South Bank University),
Douglas McKelvie, (Associate Symmetric SD)
David Monk, (Director Symmetric SD),
David Todd (Symmetric SD)
Dr Carol Brady, General Manager Psychological Therapies and Primary Care, Lincolnshire
Partnership Foundation NHS Trust
Abstract
The field of health and social care in the UK has been very receptive to systemic thinking in
recent years and has been extensively and successfully modelled. This paper describes two
trends in health care thinking in the UK which build upon this receptivity and are creating
market pulls for whole systems ideas. These are the related areas of health needs analysis and
service-line reporting, two concepts that are in search of a language and methodology to help
deliver their potential. The paper describes how system dynamics is being applied to both
these trends. The work is creating a natural progression for communicating system dynamics
models and improving their impact on the thinking of clinicians and managers, particularly in
mental health as epitomized by the contribution to this paper of the general manager
responsible for the case study used.
Introduction
There have been numerous highly successful applications of system dynamics in health in
recent years. These have covered health reform (Hirsch et al, 2005), capacity planning
(Lacey, 2005; Lane et al, 2000; Royston, 1999; Taylor and Dangerfield, 2005), older people’s
services (Wolstenholme, 1993, 1996, 1999, 2007, 2008), disease management (Dangerfield
and Roberts, 1999) and mental health (Wolstenholme et al, 20054, 2008).
Much of the modelling effort to date has been to create composite models of multiple health
delivery systems. It has long been the contention of the authors here that whilst this approach
can be successful the resultant models can often be too complex to counter their main
purpose, which is to develop the mental models of clinicians and managers.
We are not alone in recognising this problem. The introduction of modifications to the system
dynamics method, such as systems thinking (Senge, 1990) and strategy dynamics (Warren,
2002) are ways that exist to improve the realisation of the systemic objectives of the method.
However, these methods achieve their aim by eliminating some components of system
dynamics - systems thinking by leaving out stocks and flows and simulation, and strategy
dynamics by largely leaving out feedback.
2
Health and social care has long recognised the need for a whole systems view of the world
and created a market for systemic thinking in health. There are now trends emerging in health
management in the UK which take a further step in this direction and provide a natural way
of improving the communication and impact on thinking of the full system dynamics method.
There is a growing trend in UK health, particularly mental health, toward understanding how
services can be better targeted at specific patient needs. There is an urgent search for an
agreed set of needs-based clusters – often referred to as currency – and the service lines or
care pathways along which people flow to receive treatment based on their allocation of
service needs. Further there is a focus on service line reporting (Monitor, 2006a and 2006b)
to help design services and monitor service performance.
These trends require an understanding of both the dynamics of need and service delivery that
system dynamics is well-placed to satisfy. However, in the past, system dynamics models in
health either tended to focus on needs dynamics, with little attention to service dynamics, or
vice versa. Models in UK health are now being increasingly developed as a balanced ‘matrix’
of need and service.
Further, service models have tended to move quickly to multiple services. Now models
increasingly concentrate on individual service lines first. This approach is proving very
beneficial in its own right as these models can incorporate other UK health initiatives such as
the idea of payment by results (rather than the more traditional payment by block contract)
and patient choice. They can also help improve service line performance and understanding.
One of the major benefits is that the modelling of service lines provides a platform for
introducing the full system dynamics method through simple steps, without eliminating
components and whilst maintaining management touch with model components. Progressive
development of individual service models into more complex composite models of service
delivery can then be achieved much more fluently and the real benefits of whole system
thinking across services more easily realised.
The paper will discuss in detail the way in which service-line reporting and needs analysis
thinking are being supported by system dynamics modelling and how these concepts are
providing a much needed platform to enhance realisation of the benefits of system dynamics
modelling.
Recent trends in thinking about health service delivery in the UK
Service-line Reporting
In recent years health and social care have recognised the need for better understanding of
patient movements through care delivery systems. Since the “care in the community” reforms
of the early 1990’s, health and social care providers in the UK have increasingly been
required to plan and deliver services jointly. Although delivery models vary substantially, it
has become much more important to form a shared understanding of patient movements
through the different delivery systems. Initially, process mapping and business reengineering
3
were used to improve the description of patient journeys and the idea of ‘patient pathways’
introduced.
Recent trends take these ideas further and involve thinking about developing patient
pathways as service delivery lines and even as service ‘products’. The study of patient
pathways in this way is known as service-line reporting (SLR). The origins of SLR lie in the
development of both health service delivery and health service commissioning (the
purchasers of health services by Primary Care Trusts). In health delivery, hospitals in
England are being transformed into Foundation Trusts with powers to control their own
finances. In health commissioning there are moves toward awarding contracts on a ‘payment-
by-results’ basis, rather than traditional block contracts, and towards improving patient
choice.
For improved performance and quality in both monitoring and delivery, both types of
stakeholders need to quantify all service-lines in terms of costs and tariffs.
The challenges for service providers are to:
1. think about whether to define service-lines along existing specialties or to group
services into new business units
2. create shared understanding of service-lines between managers, clinicians and
operational management across a range of service-modes
3. define appropriate key performance indicators (KPIs) to align behaviour and
performance across the whole service-line
4. avoid unintended consequences and perverse incentives
5. create a balance between tariff, commissioning demand and patient choice
SLR has particular consequences for information needs and performance measurement.
Service providers need to understand the gap between the information needs of their
organisation and the existing management information and to decide whether to adapt
existing information systems or to re-engineer a patient level information process.
Service-line reporting and system dynamics
System Dynamics provides a ready-made language of stocks and flows through which it is
possible to define rigorously the patient states in, and flows through, the service-line and its
resource needs.
By the use of mapping and simulation, system dynamics assists shared understanding of
service-lines and the testing of operational and financial outcomes under different policies,
information and demand/choice scenarios. Rather than simply developing the services in real
life and then making costly adjustments as problems emerge, simulation and scenario
analysis can help to predict and consider any unintended consequences from the beginning.
This process, which merges strategic thinking with operational outcomes, minimises risk and
promotes early realisation of benefits.
4
Further, by allowing comparisons of the difference between mental and computer
simulations, system dynamics helps clinicians and managers with understanding the gap
between the information needs of service-lines and existing management information.
Health Needs Analysis
A growing trend in UK health services is the issue of how better to relate service delivery to
patient need. Patient need arises from a number of sources, for example socio-economic
factors or their particular state within the condition from which they suffer. To target health
delivery more appropriately to the right people, commissioners and service providers need to
think about how both needs clusters and whole systems of service delivery together.
To perform needs analysis health system must be broken down into ‘needs progression’ and
‘service progression’:
1. ‘needs progression’ – is the natural progression of people over time, through a series
of states of need. Such a progression represents for example the epidemiology of a
condition if no treatment services exist.
2. ‘service progression’ – is the progression of diagnosed patients through a variety of
capacity constrained human intervention treatment states or patient pathways, each
with different diagnostic and treatment times, available to differing cohorts of
patients.
Diagnostics and treatments have two effects on the progression of need. If successful, they
can slow down the progression or, additionally, for some needs such as non-degenerative
conditions, can move patients back upstream to less intense states of need.
Analysis in health and social care has strongly developed the concept of ‘service
progression’, but often ignored ‘needs progression’. The reason for this is that for many
common needs, health service clinicians and managers usually perceive only service
progressions, because these are the whole focus of their work. They also sometimes confuse
need progressions with service progressions. Health professionals often have little knowledge
of the numbers of people in each state of need. This is particularly true for conditions
characterised by very large numbers of people in a healthy state, many of whom make one-
off use of health treatment with little ‘repeat treatment’.
There are numerous needs which are almost closed systems, where the population of people
with the need in any locality tend to be relatively small and known in number, essentially
static and tend to cycle between treatment and health. Conditions such as the more severe
forms of mental illness, diabetes, etc. fall into this category
By contrast, people move through the various levels of depression and anxiety more
frequently, and in both directions (improving as well as deteriorating). Although for many
sufferers these are long-term needs, there is not a fixed population, and full recovery is
possible.
5
Health Needs Analysis and System Dynamics
System dynamics modelling in health has the capability of embracing both ‘need
progression’ using ‘need chains’ and ‘service progressions’ using ‘service chains’.
From a needs clustering point of view, system dynamics provides assistance from its
contribution to ‘aggregation’ thinking. One of the main problems in modelling patient
pathways is that of defining appropriate grouping for the types of patients who can access any
service. There will always be a certain degree of variability in patients, but more often there
are multiple populations of patients with quite differing characteristics. For example, there
are ‘simple’ and ‘complex’ cohorts of people progressing through hospitals, characterised by
significantly different treatment times and differing needs for downstream services such as
post-hospital social care (Wolstenholme, et al, 2007). Aggregation thinking allows definition
of the smallest possible number of clusters to create insight, commensurate with retaining
simplicity.
The ‘needs chain’ is a variant of the generic ‘aging chain’ structure of system dynamics,
extensively used in modelling a variety of fields from asset management to workforce
planning. This construct has some interesting characteristics in health and social care. The
progression within the chain can be bi-directional involving both natural deterioration and
improvement in condition or need.
In the past, system dynamics models in health have tended to reflect the data limitations of
needs analysis. They have usually focussed on ‘needs chains’ with little attention to ‘service
chains’, or vice versa. However, with better information now available on needs
progressions, particularly for mental health conditions, this situation is changing.
Consequently, health professionals are increasingly attracted to maps and models which
include ‘matrix’ representations of both needs and service states and which allow
understanding of how patients progress over time through different states of need and along
and between states of service. In this way a better understanding can be developed of how
services can be better targeted at needs.
However, whilst the move towards matrix representation in models has strong potential to
develop understanding and comprehensively capture health and social issues, matrix models
can themselves still easily become overly complex. Moreover, they can postulate treatment
states that do not yet exist and can be difficult to populate with data. Nonetheless, they can be
extremely useful and their usefulness is often more to do with designing future structures and
data needs of heath and social care than solving issues within known data limits.
SLR and conditions models in practice – an example
Designing service clusters and their performance
6
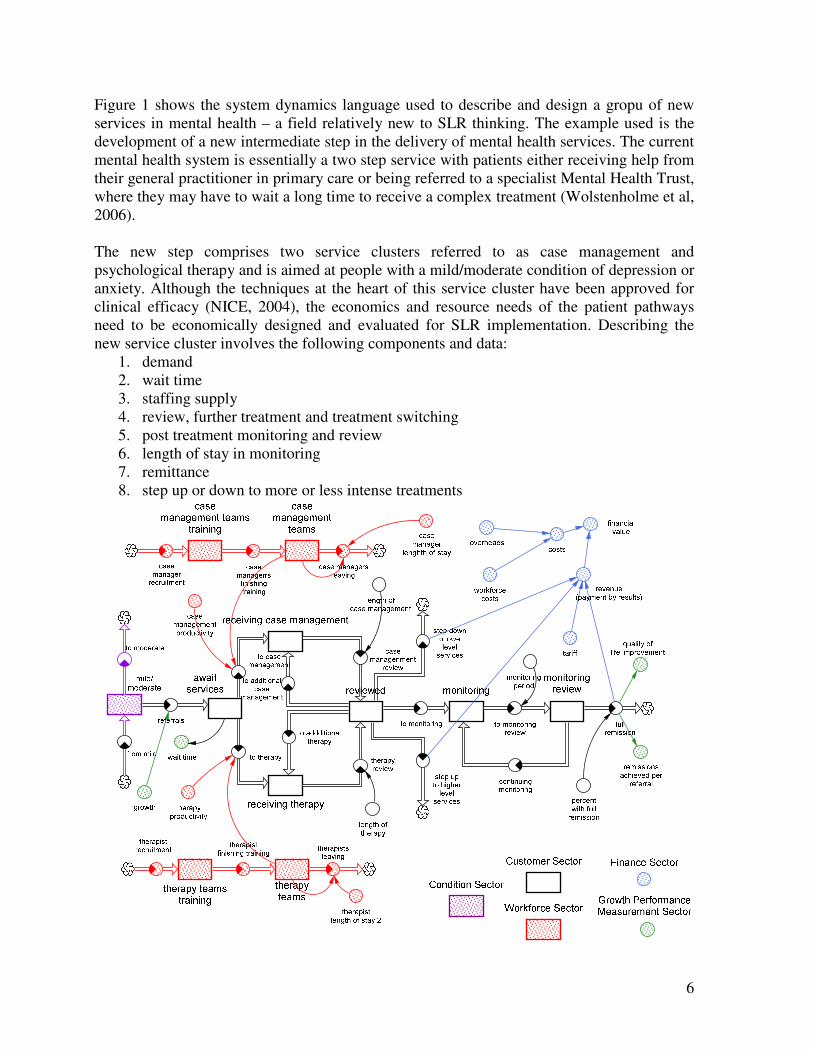
Figure 1 shows the system dynamics language used to describe and design a gropu of new
services in mental health – a field relatively new to SLR thinking. The example used is the
development of a new intermediate step in the delivery of mental health services. The current
mental health system is essentially a two step service with patients either receiving help from
their general practitioner in primary care or being referred to a specialist Mental Health Trust,
where they may have to wait a long time to receive a complex treatment (Wolstenholme et al,
2006).
The new step comprises two service clusters referred to as case management and
psychological therapy and is aimed at people with a mild/moderate condition of depression or
anxiety. Although the techniques at the heart of this service cluster have been approved for
clinical efficacy (NICE, 2004), the economics and resource needs of the patient pathways
need to be economically designed and evaluated for SLR implementation. Describing the
new service cluster involves the following components and data:
1. demand
2. wait time
3. staffing supply
4. review, further treatment and treatment switching
5. post treatment monitoring and review
6. length of stay in monitoring
7. remittance
8. step up or down to more or less intense treatments
7
Figure 1: Example of Service Pathway Model Representation of New Primary Care Stepped
Service for Depression and Anxiety
The unique attribute of system dynamics demonstrated in Figure 1 is the ability to link
together the dynamics of needs progression with the dynamics of service progression,
covering all operational and financial facets of the service grouping. The model is sectored
for clarity into needs states and service states, with the latter additionally broken down by
sectors of the balanced scorecard to assist performance monitoring.
The design of the new service group is dynamically complex and initially requires data
estimates which can be refined as pilot studies and real practice take place. By creating a
system dynamics model of the service cluster, confidence can be gained as to levels of staff
resources and costs required for treatment and monitoring under different assumptions about
demand, acceptable wait times and length of stay to achieve a given level of successful
remittance. The model also enables data needs to be defined for performance monitoring.
There is also the added bonus of running the model 2 ways. One to see how many people can
be treated and remitted under given costs and how much service investment is required to
treat a given demand. Such information is vital both to the service provider offering a
treatment capability and to the commissioners to the commissioners purchasing the service.
Multiple Service Matrix Models in action – A Case Study - Modelling Stepped Care
Services for Depression, Anxiety and Post-Traumatic Stress Disorder in Lincolnshire,
UK.
Although the testing of SLR service groups is useful in its own right, one of the major
benefits of a system dynamics model is to provide a means of amalgamating service groups
into complete treatment delivery systems for specific health communities. In particular, this
is where analysis of the viability of each service group can really be tested against the
dynamics of the needs chain and assistance given to the analysis of service against need.
The Issue
Two years prior to the project to be described, a new service model had been put in place
within part of the county. This changed the work practices of staff working in primary care
mental health, delivered shorter waits, and was well received both locally and nationally, as
an example of good practice. However, this service did not address the level of service
which dealt with more severe and complex cases, and there remained bottlenecks and long
waits for psychology. This new service had developed in response to pressure from the
commissioners about waiting lists, and had been achieved without significant additional
investment. The reconfigured service therefore continued to work under considerable
pressure. The service was evaluated after 8 months of operation, and a decision taken to “roll
out” this way of working across the county. Staffing was calculated based on a population
based extrapolation from that within the pilot area. The expansion still took no account of the
whole system, and only focussed on the Primary Care Mental Health service – within the
current paper steps 2 and 3.
8
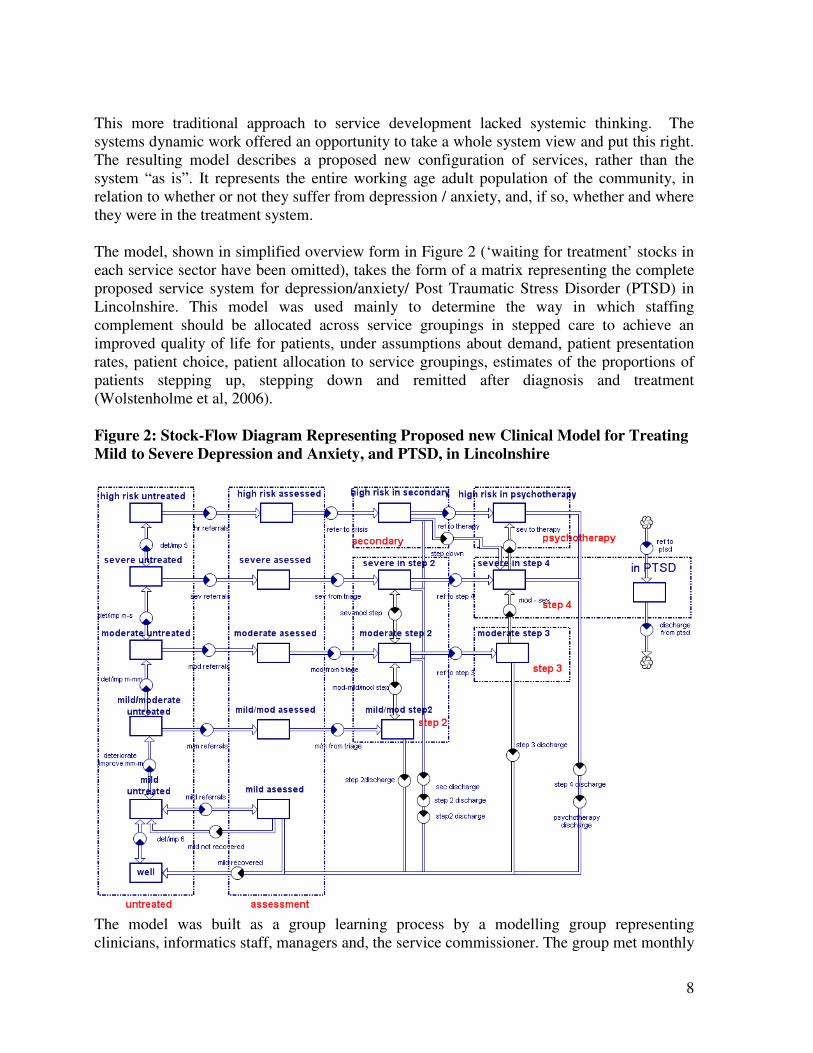
This more traditional approach to service development lacked systemic thinking. The
systems dynamic work offered an opportunity to take a whole system view and put this right.
The resulting model describes a proposed new configuration of services, rather than the
system “as is”. It represents the entire working age adult population of the community, in
relation to whether or not they suffer from depression / anxiety, and, if so, whether and where
they were in the treatment system.
The model, shown in simplified overview form in Figure 2 (‘waiting for treatment’ stocks in
each service sector have been omitted), takes the form of a matrix representing the complete
proposed service system for depression/anxiety/ Post Traumatic Stress Disorder (PTSD) in
Lincolnshire. This model was used mainly to determine the way in which staffing
complement should be allocated across service groupings in stepped care to achieve an
improved quality of life for patients, under assumptions about demand, patient presentation
rates, patient choice, patient allocation to service groupings, estimates of the proportions of
patients stepping up, stepping down and remitted after diagnosis and treatment
(Wolstenholme et al, 2006).
Figure 2: Stock-Flow Diagram Representing Proposed new Clinical Model for Treating
Mild to Severe Depression and Anxiety, and PTSD, in Lincolnshire
The model was built as a group learning process by a modelling group representing
clinicians, informatics staff, managers and, the service commissioner. The group met monthly

9
over an initial series of five meetings, crucially, retaining a consistent attendance. The model
was built iteratively by combining service-line models of each treatment (for example, each
Step in Figure 2 effectively subsumes the service clusters outlined in Figure 1) and
contributed towards the group achieving a remarkable degree of consensus about how
services should be configured. It is interesting to note however that not all conditions are
linked to all treatments.
This was in contrast to the usual approach to service design, which is be as inclusive as
possible, but which can be cumbersome, and difficult to manage. The direction of travel for
the service was clear from national policy, and so only key personnel were included on the
modelling group. The modelling was based on assumptions drawn from the emerging
evidence on stepped care. The process of the groups resulted in much debate and discussion
of how services operate and how clinicians, managers and commissioners wanted them to
work.
Using a small group of the people with the knowledge facilitated the process, in that meetings
could be set up with less difficulty, with a consistent membership.
The vertical dimension of the model in Figure 2 represents levels of severity of depression,
and the horizontal dimension represents treatment stages (or steps).
The diagrams that follow describe sectors of the model within Figure 2.
10
Figure 3: The Untreated Population
This part of the model represents the potential demand
for services. To the extent that people are unwell and not
in service, it also represents unmet need.
The stocks on the left hand column represent people at all
levels, who are not in service.
At all times, people flow in both directions between the
different levels. In any time step some people will go
from being moderately to severely depressed, or the other
way, even although not being treated.
This represents something of a challenge in estimating
data inputs for these rates, because such transitions were
not captured in any public health data known to the
group. The progression / deterioration rates were
calibrated to ensure the best possible fit with what is
known about the prevalence of depression in the
population.
The stocks in the right hand column represent people who
have sought help and are being referred into the single
point of access to primary care mental health.
Normally, there would be very few people in these
“waiting” stocks, because the capacity of the single point
of access is such that new assessments can generally be
done on demand.
11
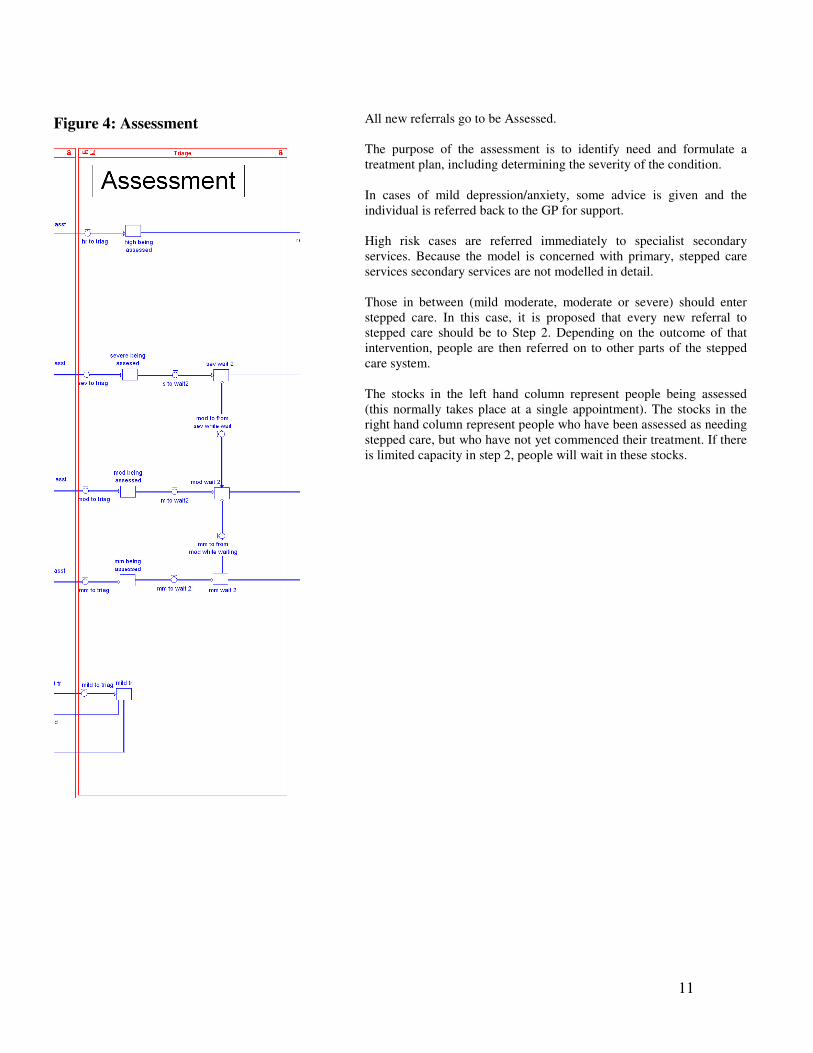
Figure 4: Assessment
All new referrals go to be Assessed.
The purpose of the assessment is to identify need and formulate a
treatment plan, including determining the severity of the condition.
In cases of mild depression/anxiety, some advice is given and the
individual is referred back to the GP for support.
High risk cases are referred immediately to specialist secondary
services. Because the model is concerned with primary, stepped care
services secondary services are not modelled in detail.
Those in between (mild moderate, moderate or severe) should enter
stepped care. In this case, it is proposed that every new referral to
stepped care should be to Step 2. Depending on the outcome of that
intervention, people are then referred on to other parts of the stepped
care system.
The stocks in the left hand column represent people being assessed
(this normally takes place at a single appointment). The stocks in the
right hand column represent people who have been assessed as needing
stepped care, but who have not yet commenced their treatment. If there
is limited capacity in step 2, people will wait in these stocks.
12
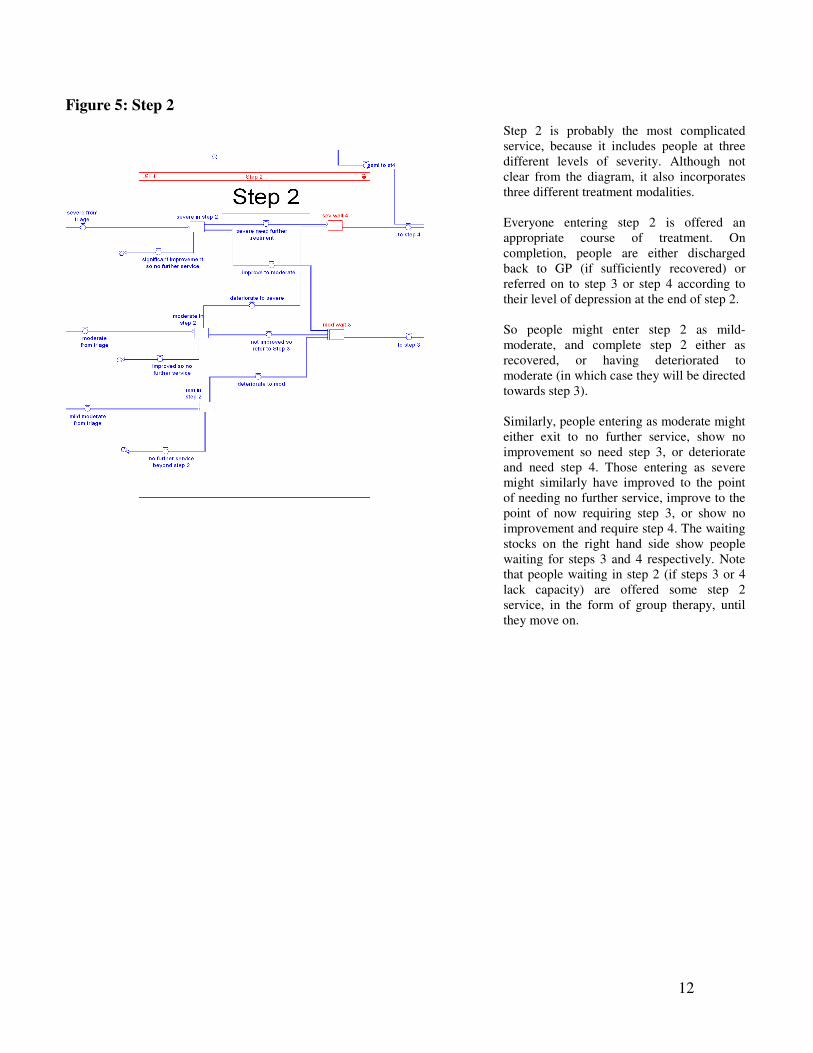
Figure 5: Step 2
Step 2 is probably the most complicated
service, because it includes people at three
different levels of severity. Although not
clear from the diagram, it also incorporates
three different treatment modalities.
Everyone entering step 2 is offered an
appropriate course of treatment. On
completion, people are either discharged
back to GP (if sufficiently recovered) or
referred on to step 3 or step 4 according to
their level of depression at the end of step 2.
So people might enter step 2 as mild-
moderate, and complete step 2 either as
recovered, or having deteriorated to
moderate (in which case they will be directed
towards step 3).
Similarly, people entering as moderate might
either exit to no further service, show no
improvement so need step 3, or deteriorate
and need step 4. Those entering as severe
might similarly have improved to the point
of needing no further service, improve to the
point of now requiring step 3, or show no
improvement and require step 4. The waiting
stocks on the right hand side show people
waiting for steps 3 and 4 respectively. Note
that people waiting in step 2 (if steps 3 or 4
lack capacity) are offered some step 2
service, in the form of group therapy, until
they move on.
13
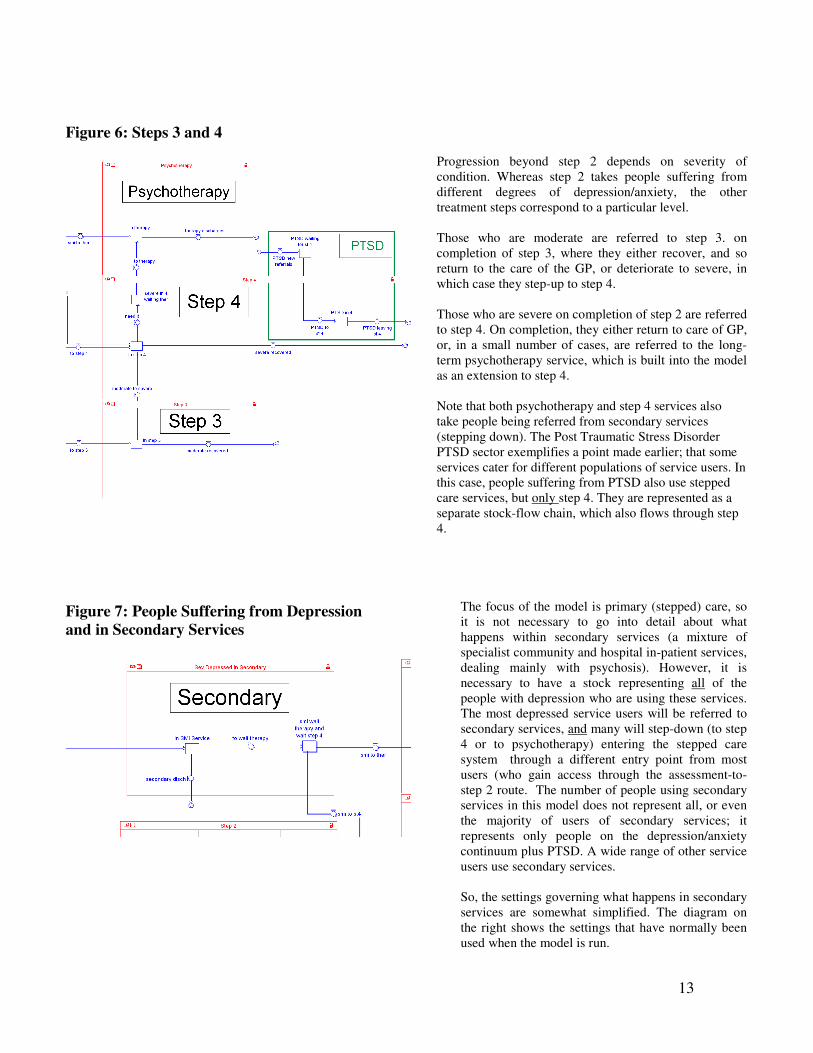
Figure 6: Steps 3 and 4
Progression beyond step 2 depends on severity of
condition. Whereas step 2 takes people suffering from
different degrees of depression/anxiety, the other
treatment steps correspond to a particular level.
Those who are moderate are referred to step 3. on
completion of step 3, where they either recover, and so
return to the care of the GP, or deteriorate to severe, in
which case they step-up to step 4.
Those who are severe on completion of step 2 are referred
to step 4. On completion, they either return to care of GP,
or, in a small number of cases, are referred to the long-
term psychotherapy service, which is built into the model
as an extension to step 4.
Note that both psychotherapy and step 4 services also
take people being referred from secondary services
(stepping down). The Post Traumatic Stress Disorder
PTSD sector exemplifies a point made earlier; that some
services cater for different populations of service users. In
this case, people suffering from PTSD also use stepped
care services, but only step 4. They are represented as a
separate stock-flow chain, which also flows through step
4.
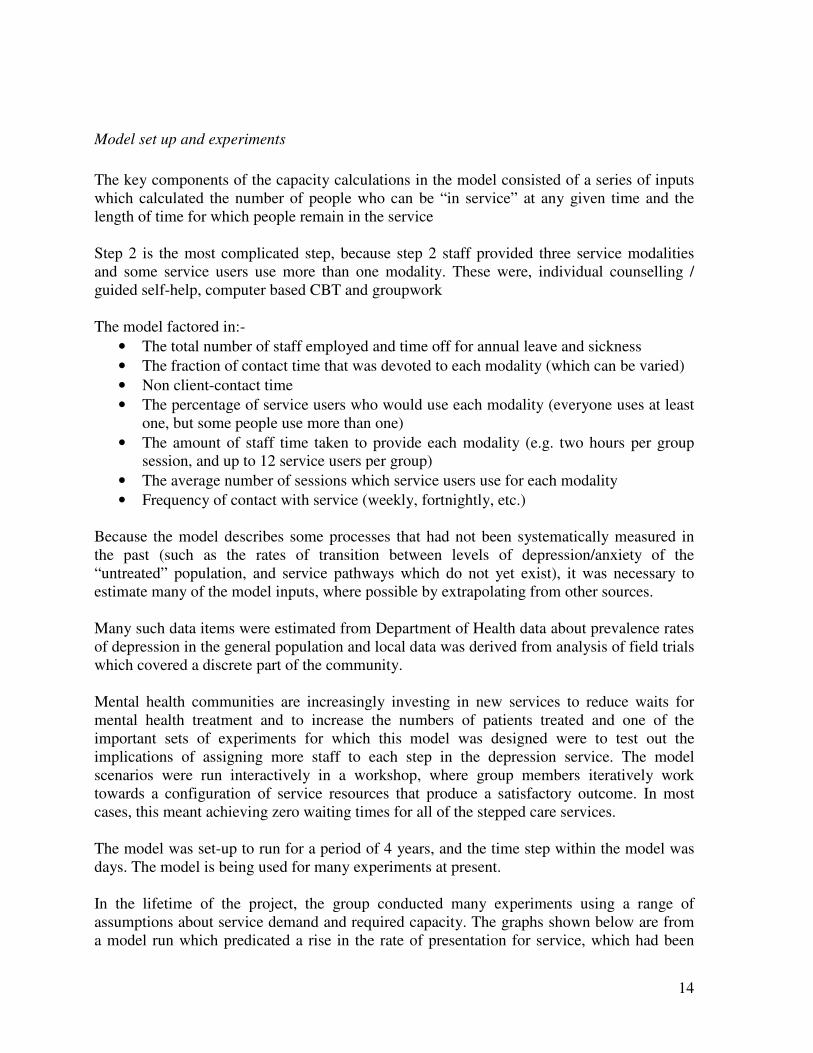
Figure 7: People Suffering from Depression
and in Secondary Services
The focus of the model is primary (stepped) care, so
it is not necessary to go into detail about what
happens within secondary services (a mixture of
specialist community and hospital in-patient services,
dealing mainly with psychosis). However, it is
necessary to have a stock representing all of the
people with depression who are using these services.
The most depressed service users will be referred to
secondary services, and many will step-down (to step
4 or to psychotherapy) entering the stepped care
system through a different entry point from most
users (who gain access through the assessment-to-
step 2 route. The number of people using secondary
services in this model does not represent all, or even
the majority of users of secondary services; it
represents only people on the depression/anxiety
continuum plus PTSD. A wide range of other service
users use secondary services.
So, the settings governing what happens in secondary
services are somewhat simplified. The diagram on
the right shows the settings that have normally been
used when the model is run.
14
Model set up and experiments
The key components of the capacity calculations in the model consisted of a series of inputs
which calculated the number of people who can be “in service” at any given time and the
length of time for which people remain in the service
Step 2 is the most complicated step, because step 2 staff provided three service modalities
and some service users use more than one modality. These were, individual counselling /
guided self-help, computer based CBT and groupwork
The model factored in:-
• The total number of staff employed and time off for annual leave and sickness
• The fraction of contact time that was devoted to each modality (which can be varied)
• Non client-contact time
• The percentage of service users who would use each modality (everyone uses at least
one, but some people use more than one)
• The amount of staff time taken to provide each modality (e.g. two hours per group
session, and up to 12 service users per group)
• The average number of sessions which service users use for each modality
• Frequency of contact with service (weekly, fortnightly, etc.)
Because the model describes some processes that had not been systematically measured in
the past (such as the rates of transition between levels of depression/anxiety of the
“untreated” population, and service pathways which do not yet exist), it was necessary to
estimate many of the model inputs, where possible by extrapolating from other sources.
Many such data items were estimated from Department of Health data about prevalence rates
of depression in the general population and local data was derived from analysis of field trials
which covered a discrete part of the community.
Mental health communities are increasingly investing in new services to reduce waits for
mental health treatment and to increase the numbers of patients treated and one of the
important sets of experiments for which this model was designed were to test out the
implications of assigning more staff to each step in the depression service. The model
scenarios were run interactively in a workshop, where group members iteratively work
towards a configuration of service resources that produce a satisfactory outcome. In most
cases, this meant achieving zero waiting times for all of the stepped care services.
The model was set-up to run for a period of 4 years, and the time step within the model was
days. The model is being used for many experiments at present.
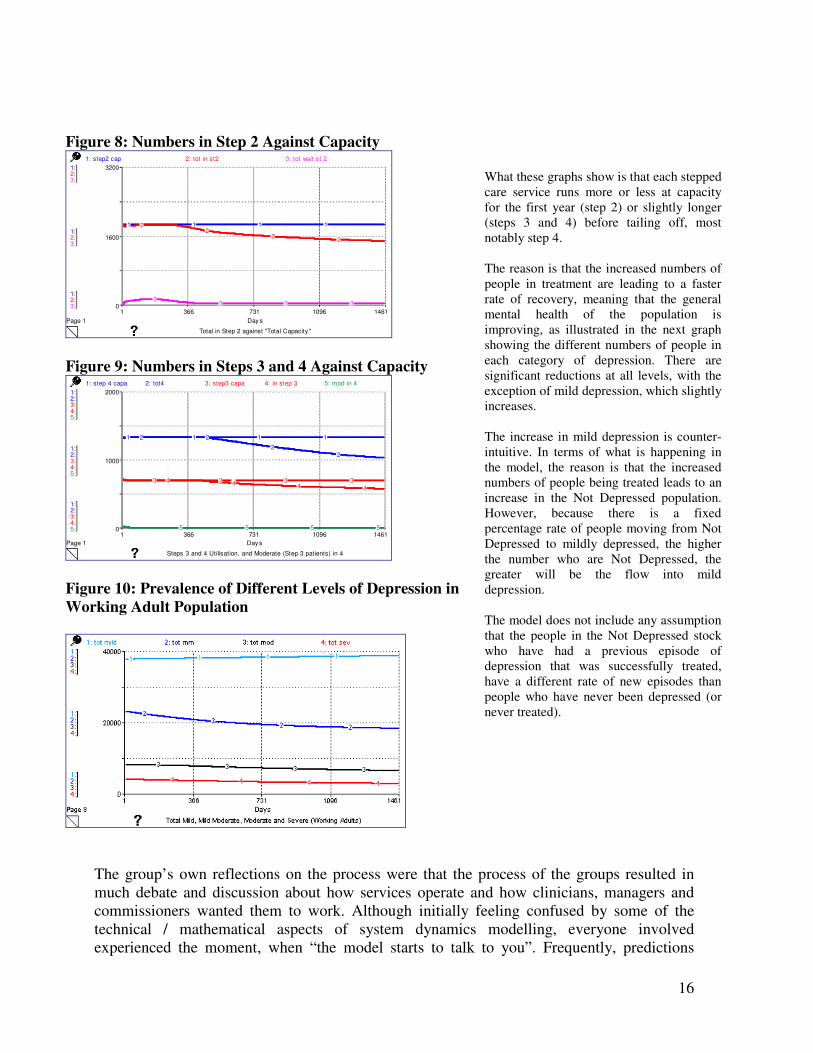
In the lifetime of the project, the group conducted many experiments using a range of
assumptions about service demand and required capacity. The graphs shown below are from
a model run which predicated a rise in the rate of presentation for service, which had been
15
observed during the time for which this project was running. At the start of the model run,
sufficient staff were “recruited” to enable the model to run without any waits.
One of the most surprising results for managers and of interest to the theme of this paper was
that the significant investment in capacity needed to ensure zero waiting times for most1
services could probably be reduced one or two years into the simulation. This is a good
example of limits to growth (and often in health a limited growth is of more benefit than an
unlimited); if services are effective, and if previously untreated depression / anxiety is now
treated, this results in a gradual improvement in the mental health of the general population,
and eventually to fewer people who require the service. This result could only be observed in
a model of both needs and service progression. To illustrate the point, the Figures 8, 9 and 10
show the numbers of people in each service step in this scenario
1 Empirically, the psychotherapy service had a significant backlog which, with existing staffing, would take
several years to clear
16
Figure 8: Numbers in Step 2 Against Capacity
Total in Step 2 against "Total Capacity "
Page 1
1 366 731 1096 1461
Day s
1:
1:
1:
2:
2:
2:
3:
3:
3:
0
1600
3200
1: step2 cap 2: tot in st2 3: tot wait st 2
1 1 1 122
22
33 3 3
Figure 9: Numbers in Steps 3 and 4 Against Capacity
Steps 3 and 4 Utilisation, and Moderate (Step 3 patients) in 4
Page 1
1 366 731 1096 1461
Day s
1:
1:
1:
2:
2:
2:
3:
3:
3:
4:
4:
4:
5:
5:
5:
0
1000
2000
1: step 4 capa 2: tot4 3: step3 capa 4: in step 3 5: mod in 4
1 1 1 12 2
2
2
3 3 3 34 4 4 4
5 5 5 5
Figure 10: Prevalence of Different Levels of Depression in
Working Adult Population
What these graphs show is that each stepped
care service runs more or less at capacity
for the first year (step 2) or slightly longer
(steps 3 and 4) before tailing off, most
notably step 4.
The reason is that the increased numbers of
people in treatment are leading to a faster
rate of recovery, meaning that the general
mental health of the population is
improving, as illustrated in the next graph
showing the different numbers of people in
each category of depression. There are
significant reductions at all levels, with the
exception of mild depression, which slightly
increases.
The increase in mild depression is counter-
intuitive. In terms of what is happening in
the model, the reason is that the increased
numbers of people being treated leads to an
increase in the Not Depressed population.
However, because there is a fixed
percentage rate of people moving from Not
Depressed to mildly depressed, the higher
the number who are Not Depressed, the
greater will be the flow into mild
depression.
The model does not include any assumption
that the people in the Not Depressed stock
who have had a previous episode of
depression that was successfully treated,
have a different rate of new episodes than
people who have never been depressed (or
never treated).
The group’s own reflections on the process were that the process of the groups resulted in
much debate and discussion about how services operate and how clinicians, managers and
commissioners wanted them to work. Although initially feeling confused by some of the
technical / mathematical aspects of system dynamics modelling, everyone involved
experienced the moment, when “the model starts to talk to you”. Frequently, predictions
17
made by group members about how the model would operate with particular staffing levels,
turned out to be wrong, typically based on assumptions which were not system-based. It was
only when team members began to understand how the model as a whole worked, and began
to think systemically, that they could agree that results which seemed counter-intuitive, were
in fact, correct.
There had been a “common sense” view that services, and the staffing required should be
pyramid shaped, with less required at the higher levels. But this failed to take account of the
increased demand per patient at higher levels of complexity, and in fact the shape adopted by
the model was of an hour glass, needing considerably more staff at step 4 than currently. At
times, this felt like something of a leap of faith, when it has been counter-intuitive. However,
service development has typically been undertaken by “best guesses” based on available
public health information coupled with trial and error in real life, and it is reassuring to be
able to do a simulation based on more scientific principles.
Another major benefit has been that the model variables are being linked to the information
system, so that future monitoring of service performance can be reported against the stock-
flow structure, and even mapped onto a diagram of the model.
Conclusions
This paper has described the role of service-line reporting and health needs analysis in UK
health commissioning and delivery and suggested that:
1. system dynamics provides a much needed language and tool set to realise the benefits
of service-line reporting and needs analysis and
2. service-line reporting and needs analysis thinking provide a natural and welcoming
platform for system dynamics modelling.
Incorporation of both patient needs and services into whole system models is fundamental to
achieving better understand of the economics of service/needs analysis in health. It is the
conclusion of the authors of this paper that whilst whole system service delivery models have
enormous contributions to make to health thinking (Wolstenholme et al, 2006), moving
straight to them in the first instance is just too big a leap for most managers and
implementation can suffer due to lack of detailed understanding of the subsumed service-
lines. It is being found that involvement of managers and clinicians in the construction of
individual service-line models and their aggregation into whole service delivery models has
the potential to improve the role, impact and implementation of both types of model.
By engaging managers in service delivery and commissioning by amalgamating models of
service-line groups, an important need is satisfied for SLR whilst at the same time the way is
paved for better understanding of the use of the system dynamics method for strategic shifts
in total service delivery. The concepts of SLR and needs analysis gives credence to the time
spent on really understanding individual service groups and the way they relate to specific
needs.
18
There is much evidence from the recent past that the health service in the UK is making great
strides in embracing complexity and understanding the benefits of systemic analysis. The
links with SLR and health needs analysis take this many stages further.
The main insight is that the benefits of system dynamics will always be better realised by
integration with current major initiatives which have strong management focus (market pull),
than by applying it directly in its own right for its own sake (methodology push).
References
Dangerfield B, Roberts C 1999. Optimisation as a statistical estimation tool: an example in
estimating the AIDS treatment free incubation period distribution, System Dynamics Review,
Vol. 15, No. 3.
Hirsch G, Homer J, McDonnell G, Milstein B. 2005. Achieving Health Care Reform in the
United States: Towards a Whole System Understanding, Proceedings of the International
System Dynamics Conference, Boston, USA.
Lacey P (2005). Futures through the Eyes of a Health System Simulator Proceedings of the
International System Dynamics Conference, Boston, USA.
Lane D C, Monefeldt C, Rosenhead J V. 2000. Looking in the Wrong Place for Healthcare
Improvements: A system dynamics study of an accident and emergency department, Journal
of the Operational Research Society 51(5): 518-531).
Manley W, Homer J, Hoard M 2005. A dynamic model to support surge capacity planning in
a rural hospital. , Proceedings of the International System Dynamics Conference, Boston,
USA.
Monitor – Independent Regulator of NHS Foundation Trusts (2006a) Guide to Developing
Reliable Financial Data for Service-Line Reporting, Monitor, London, UK
Monitor – Independent Regulator of NHS Foundation Trusts (2006b) How Service-Line
Reporting can Improve the Productivity and Performance of NHS Foundation Trusts,
Monitor, London, UK
National Institute for Clinical Excellence Depression: management of depression in primary
and secondary care - NICE guidance, National Clinical Practice Guideline Number 23,
December 2004
Roysten G, Dost A, Townsend J, Turner H. 1999. Using System Dynamics to help develop
and implement policies and programmes in Health Care in England, System Dynamics
Review, Vol. 15, No 3.
Senge, P. (1990) The Fifth Discipline Doubleday.
19
Taylor K, Dangerfield B. 2005 Modelling the feedback effects of reconfiguring health
services, JORS Vol.56 pp658-675.
Warren K (2003) Competitive Strategy Dynamics, Wiley, Chichester
Wolstenholme E F. 1993 A Case Study in Community Care using Systems Thinking, Journal
of the Operational Research Society, Vol. 44 No. 9, September, pp 925-934.
Wolstenholme EF. 1996. A Management Flight Simulator for Community Care, In
Enhancing Decision Making in the NHS, Ed. S. Cropper, Open University Press, Milton
Keynes
Wolstenholme E F. 1999. A Patient Flow Perspective of UK Health Service, System
Dynamics Review. Vol. 15, no. 3, 253-273.
Wolstenholme E F Repper D Monk D Todd D McKelvie D (2006) Reforming Mental Health
Services in the UK - Using System Dynamics to support the Design and Implementation of a
Stepped Care approach to Depression in North West England. Proceedings of the 2006
System Dynamics Conference, Nijmegen, Netherlands
Wolstenholme E F Monk D, McKelvie D 2007, ‘Influencing and Interpreting Health and
Social Care Policy in the UK’ in Complex Decision Making: Theory and Practice Ed.
Qudrat-Ullah H Spector M J & Davidsen P I. Springer-Verlag, US.
Wolstenholme E F, Monk D, McKelvie D, Todd D, Arnold A 2007,Coping but not Coping in
Health and Social Care - masking the reality of running organisations beyond safe design
capacity. SDR, Vol, 23. Number 4 Winter 2007 pp371-389.
Related Documents