EMERGENCY MANAGEMENT PROGRAMS IN HIGHER EDUCATION: STATUS UPDATE 2018 FEMA Higher Education Program Report Students Resources Faculty Programs Curriculum DeeDee Bennett, Ph.D.

Welcome message from author
This document is posted to help you gain knowledge. Please leave a comment to let me know what you think about it! Share it to your friends and learn new things together.
Transcript

EMERGENCY MANAGEMENT PROGRAMS IN HIGHER EDUCATION:
STATUS UPDATE 2018 FEMA Higher Education Program Report
Students
Resources
Faculty Programs
Curriculum
DeeDee Bennett, Ph.D.

2018 EM Higher Ed: Status Update
D. Bennett, University of Nebraska at Omaha ii
ACKNOWLEDGEMENTS
This report would not be possible without the efforts of the FEMA Emergency Management Higher Education Program. Specifically, the continued support of Wendy Walsh, Barbara Johnson, and Danielle Green was instrumental in reaching active emergency management programs. Additionally, a special thanks to Dr. Carol Cwiak for the use of her initial survey instrument and to all of the institutional representatives who took the time to participate in this survey.
CITATION
Bennett, DeeDee. (June, 2018). “2018 Higher Education Emergency Management Programs: Status Update.” Report for FEMA Higher Education Program. Emmitsburg, MD.

2018 EM Higher Ed: Status Update
D. Bennett, University of Nebraska at Omaha iii
EXECUTIVE SUMMARY
The purpose of this report is to summarize the results from the 2018 survey of programs offering degrees, minors, certificates, or concentrations related to emergency management at universities, colleges, or other institutions of higher learning. The purpose of this survey was four-fold:
(1) Learn about the current degree offerings and classroom settings of the colleges and universities offering emergency management-related courses
(2) Identify the types of students interested in the program and where they typically work following graduation
(3) Gain knowledge on the faculty and program support for the field on higher education campuses (4) Identify which FEMA services and products are useful among emergency management higher
education programs While the survey focused on U.S. based programs, international programs were invited to participate as they also may benefit from the services and products offered by the FEMA Higher Education program. Emergency Management program representatives from a total 310 different schools were contacted via email to participate in this survey. The report summarizes the results from 89 different schools representing 100 different programs, for a 30.3% response rate. Three international schools responded, as well. Degree Offerings and Classroom Settings The responding institutions indicated from program name, department and classification of instructional program (CIP) code that their program was indeed focused primarily on emergency management. Majority of the programs indicated that their primary focus is to prepare students for public sector (federal, state, and local government) employment. Most programs cater to undergraduate degree offerings and coursework. While most respondents were comfortable with their current curriculum offerings, approximately 35% indicated that they were still developing new programs or coursework. Over 80% of respondents reported that they offer coursework through some form of distance learning (online). Types of Students The estimates show nearly 46,000 students have graduated from emergency-management related programs. The diversity of the student body is increasing. Approximately 39% of the student body is female. Over 70% of the programs indicated an observed increase in the diversity of their students. This year we have estimates on the demographic landscape of emergency management students with 16% International students, 17% African American, 15% Hispanic/Latino and 8% Asian. Faculty and Program Support Majority of the responding programs reported that they rely on part-time faculty to support their program. However, nearly 39% indicated that they attempted to hire new faculty or program staff in the past year. Over half of the new hires were for part-time faculty. Over 30% of the faculty, at each level, have a practitioner background, with over half of the part-time faculty having emergency management (and related) experience. Most programs indicated available program support was in library resources and from their local, state, and national emergency management communities. FEMA Higher Education Programs Majority of the respondents used the FEMA Higher Ed online resources. The most used resource was the ‘Principles of Emergency Management’ document by both the undergraduate and graduate programs. Similarly, the second most frequently used resource was the independent study courses. With regards to participation in FEMA Higher Ed services, a majority of the programs have sent a representative to participate in the Annual Symposium. However, less than one-third of respondents have engaged in the FEMA special interest or focus groups.

2018 EM Higher Ed: Status Update
D. Bennett, University of Nebraska at Omaha iv
TABLE OF CONTENTS ACKNOWLEDGEMENTS ..................................................................................................................... II
CITATION............................................................................................................................................ II EXECUTIVE SUMMARY ...................................................................................................................... III TABLE OF CONTENTS ....................................................................................................................... IV
LIST OF FIGURES .................................................................................................................................. V LIST OF TABLES ................................................................................................................................... V
OVERVIEW ........................................................................................................................................... 1 METHODOLOGY .................................................................................................................................... 2
PROGRAM ............................................................................................................................................ 3 DEGREE OFFERINGS ............................................................................................................................ 5 SECTOR FOCUS ................................................................................................................................... 5 CURRICULUM ....................................................................................................................................... 6
STUDENTS ........................................................................................................................................... 7 ENROLLMENT ....................................................................................................................................... 7 POST GRADUATION .............................................................................................................................. 8 DIVERSITY ........................................................................................................................................... 8
FACULTY AND INSTITUTIONAL SUPPORT ....................................................................................... 9 TYPE OF FACULTY ................................................................................................................................ 9 ACCESS TO PROGRAM SUPPORT ......................................................................................................... 11 ANTICIPATED CHANGES ...................................................................................................................... 12 METRICS OF SUCCESS ........................................................................................................................ 13
FEMA EMI HIGHER ED RESOURCES ............................................................................................... 13 ONLINE RESOURCES .......................................................................................................................... 13 PARTICIPATION IN PROGRAMS ............................................................................................................. 15 IDEAS FOR DIFFERENT PRODUCTS AND SERVICES ................................................................................ 16
RESPONSES BY PROGRAM TYPE ................................................................................................... 18 UNDERGRADUATE DEGREE-GRANTING PROGRAMS .............................................................................. 18 GRADUATE PROGRAMS ...................................................................................................................... 19 INTERNATIONAL SCHOOLS .................................................................................................................. 19
DISCUSSION ...................................................................................................................................... 21 CONCLUSION..................................................................................................................................... 22 REFERENCES .................................................................................................................................... 23 APPENDIX I ........................................................................................................................................ 24
LIST OF PARTICIPATING INSTITUTIONS ................................................................................................. 24

2018 EM Higher Ed: Status Update
D. Bennett, University of Nebraska at Omaha v
LIST OF FIGURES
Figure 1. Survey sample of emergency management higher education programs 1 Figure 2. Survey responses over a month 3 Figure 3. Bar chart of department homes for respondent emergency management programs 3 Figure 4. Top words used in the names of emergency management-related programs 4 Figure 5. Type of degree offerings from surveyed programs 5 Figure 6. Program coursework by percentage offered online 6 Figure 7. Enrollment and graduation over the past three years and projections for the next
three years 8 Figure 8. Observed increase in diversity of the emergency management student body 9 Figure 9. Average percentage of students from diverse backgrounds enrolled in emergency
management programs 9 Figure 10. Faculty with a practitioner background 11 Figure 11. Key anticipated changes identified from respondents 12 Figure 12. Use of FEMA Higher Education program online resources 13 Figure 13. Types of classes in which the ‘Principles of Emergency Management’ document was used 14 Figure 14. Primary use of Independent Study (IS) courses 14 Figure 15. Participation in specific FEMA Higher Education program offerings 15 Figure 16. Interest in FEMA Higher Education Special Interest Groups (SIGs) 15 Figure 17. Interest in FEMA Higher Education Focus Groups 15 Figure 18. Awareness of FEMA Higher Ed Webinars 16 Figure 19. Use of the ‘Prototype Curriculum for Associates Degrees’ 19
LIST OF TABLES
Table 1. List of popular CIP codes of the emergency management-related programs surveyed 4 Table 2. Sector focus of emergency management programs 6 Table 3. Number of graduates from emergency management programs 7 Table 4. Type of faculty in emergency management programs 10 Table 5. Total number of faculty as reported, by type 10 Table 6. Accessibility of various types of programs support 11 Table 7. Comparison of the access and support indicators 12

2018 EM Higher Ed: Status Update
D. Bennett, University of Nebraska at Omaha 1
OVERVIEW
This annual report is one of the few documents that provides consistent data related to the faculty, curriculum, and student body for emergency management programs. The project was initiated in 2004 by former FEMA Higher Education Program Director, Dr. Wayne Blanchard and initially conducted by Dr. Henry Fischer (Cwiak, 2016). The survey has been conducted every year except for 2005, 2006 and 2013. Dr. DeeDee Bennett at the University of Nebraska at Omaha has been contracted to conduct the survey for 2017 and 2018. Before 2017, the effort was contracted to Dr. Carol Cwiak between the years of 2007 and 2016. The purpose of this project is to assess the usefulness of the products and services provided by the FEMA Emergency Management Institute Higher Education program (FEMA Higher Ed) and to collect data on the current status of emergency management programs. The sample of programs contacted was identified from the FEMA Higher Ed database. The FEMA Higher Ed database contained 293 schools with emergency management-related programs across the country and 17 international schools with emergency management-related programs abroad. Using these 310 schools as the sample size, a survey was sent to over 500 contacts to answer four basic assessment questions:
(1) What is the focus of the EM program? (2) Who are the students that benefit from this program? (3) Which type of support is accessible to the program? (4) How are FEMA Higher Ed services used by EM programs?
Similar surveys have been sent annually for the last 14 years. Included for the first time in this survey were questions about the classification of instructional programs (CIP) codes, as identified by the Department of Education, program success measurements, percent of diversity among the student body, and percentage of faculty with a practitioner background. Of the 293 U.S. based schools in the sample, a total of 89 schools completed the survey for a ‘straightforward’ 30.3% response rate. The 89 responding schools represented 196-degree, certificate, or secondary offerings. However, of the 310 schools contacted, several opted out of receiving the survey (N=11), and some emails bounced (N=12). Eight potential respondents replied to the email request that they were no longer offering emergency management-related programs and were asked to select the ‘opt out field’ so that they could be properly counted. For conservative estimates, this report uses the ‘straightforward’ 30.3% response rate. The breakdown of overall response is shown in Figure 1.
Figure 1. Survey sample of emergency management higher education programs
The sample of potential respondents was identified from the FEMA Higher Ed database, which contained 310 different institutions. This survey assumes that nearly 100% of institutions that offer emergency management related courses are represented in the FEMA Higher Ed database. Therefore,
U.S. based schools
included32%
Schools abroad
included1%
U.S. based programs not
included54%
Schools abroad not
included5%
Opted out4%
Bounced emails
4%

2018 EM Higher Ed: Status Update
D. Bennett, University of Nebraska at Omaha 2
the survey respondents from 89 participating institutions represent 30.3% of the programs. Any program not within the FEMA Higher Ed database was not contacted. Approximately 18% of international institutions from the FEMA database responded to the survey. International institutions only represent nearly 5% (n=17) of the programs that benefit from the FEMA Higher Ed program. Appendix I lists the names of most of the participating institutions reflected in this survey.
METHODOLOGY
The results in this report are from a web-based survey, administered online. Invitations to participate (and reminders) were sent via email during one month. The survey used a single-stage sampling technique in which the researcher used the FEMA Higher Ed database to invite all known emergency management higher education programs that had at one time used a product or service offered by FEMA (Cresswell, 2008; Dillman, Smyth, and Christian, 2014). All representatives listed as the point of contact for the emergency management programs were invited to participate in the online survey via email. A total of 542 emails were sent, with many institutions have more than one point of contact. The survey instrument used was modified from the previous survey administered in 2017 by DeeDee Bennett, adapted from the 2016 instrument, with permission (Bennett, 2017; Cwiak, 2016). The administered instrument was modified to include specific questions related to student diversity, success metrics, faculty backgrounds, and detailed information about the products and services provided by FEMA Higher Ed program. The 2018 version of the survey used logic question blocks to minimize the respondents' survey time and receipt of irrelevant questions. Approximately 51% of respondents took less than 20 minutes finish. Furthermore, none of the questions (except the first one consenting to the survey) required a response from every program. For example, only programs that indicated they offered associates degrees were asked subsequent questions relating to the associate’s degree curriculum. Therefore, for each section of this report, take note of the total number of program respondents, reported as “n,” which may vary. The survey instrument was administered on the University of Nebraska at Omaha Qualtrics Insight Platform-hosted website. Answers to open-ended short-answer questions were rudimentarily coded by semantic content analysis, grouping the frequency of similar answers (such as services, curriculum) and any final qualifiers (positive or negative) to give an overview of respondent sentiment (Krippendorff, 2004). Each university and college representative from the FEMA database were contacted by email to participate on February 6, 2018. A follow-up email was sent February 14th to all representatives that did not start (or complete the survey). A second reminder email was sent on February 28th to remind representatives of the survey close date of March 6th. The stacked chart, Figure 2, shows the response rate over the month period.
2018 EM Higher Ed: Status Update
D. Bennett, University of Nebraska at Omaha 3
Figure 2. Survey responses over a month
The results are highlighted in the following sections related to the four-fold focus for all U.S. based programs; information about the program, the students, the faculty and institutional support, and the use of the FEMA Higher Ed products and services. Subsequent sections report the results from undergraduate, graduate, and international programs. Where appropriate, comparisons are made between the results of the 2018 survey with the report from the 2017 survey.
PROGRAM
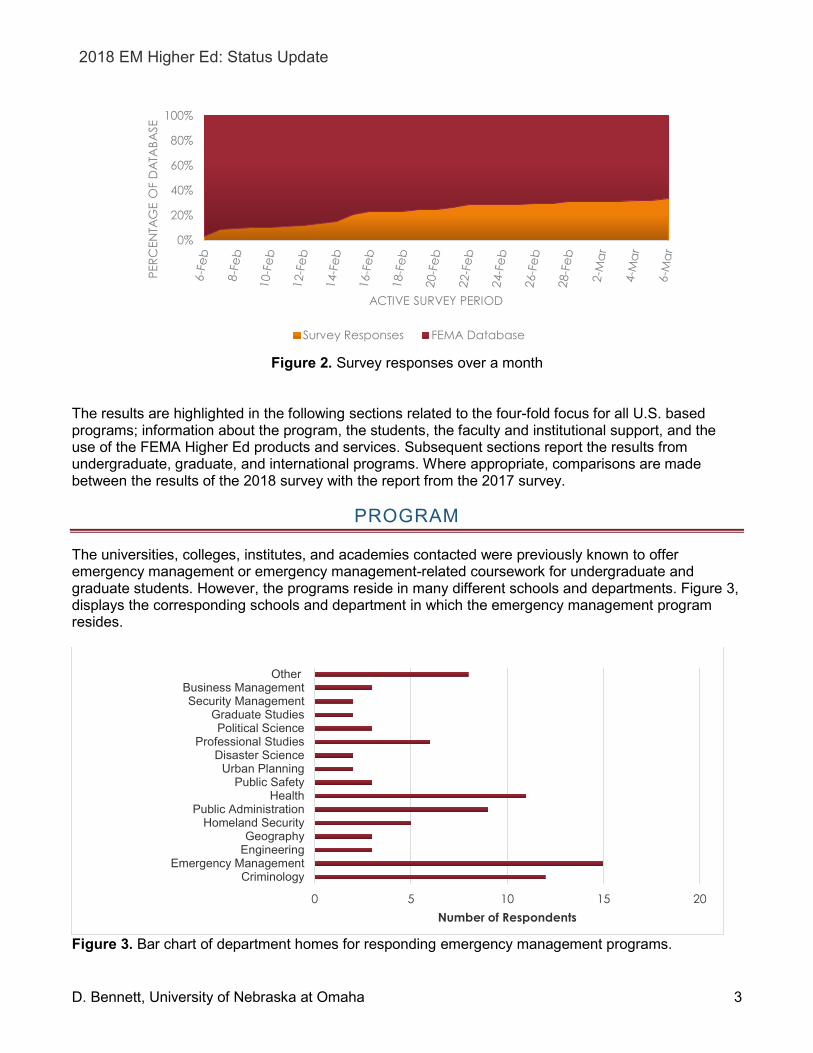
The universities, colleges, institutes, and academies contacted were previously known to offer emergency management or emergency management-related coursework for undergraduate and graduate students. However, the programs reside in many different schools and departments. Figure 3, displays the corresponding schools and department in which the emergency management program resides.
Figure 3. Bar chart of department homes for responding emergency management programs.
0%
20%
40%
60%
80%
100%
PERC
ENTA
GE
OF
DAT
ABA
SE
ACTIVE SURVEY PERIOD
Survey Responses FEMA Database
0 5 10 15 20
CriminologyEmergency Management
EngineeringGeography
Homeland SecurityPublic Administration
HealthPublic Safety
Urban PlanningDisaster Science
Professional StudiesPolitical Science
Graduate StudiesSecurity Management
Business ManagementOther
Number of Respondents

2018 EM Higher Ed: Status Update
D. Bennett, University of Nebraska at Omaha 4
Most of the program representatives responded that their programs are housed in emergency management departments. Other popular departments were also identified as Criminology/Criminal Justice, Health, Public Administration, and Professional Studies. Seven programs indicated homes in less apparent departments including a Medical School, Leadership Studies, Sociology, and International relations. Previous reports noted that program names often do not mirror that of the department in which they are housed; therefore, respondents were asked to provide the full names of their programs. Figure 4 highlights the top words used for each of the programs, showcasing an overall emphasis on emergency and management. The program names (n=97) provided indicate a majority of respondents were representatives of emergency and management programs housed in departments of emergency management, criminology or criminal justice.
Figure 4. Top words used in the names of emergency management-related programs Emergency management program representatives were also asked about their CIP code(s) as developed by the U.S. Department of Education's National Center for Education Statistics (NCES). Table 1 identifies the responses from 66 respondents, including the corresponding typology title. A few respondents replied with more than one CIP code, indicating an interdisciplinary program. Table 1. List of popular CIP codes of the emergency management-related programs surveyed.
CIP Code Typology Title Frequency 43.0301 Homeland Security 9 14.0804 Transportation and Highway Engineering 1 34 Health-related knowledge and skills 1 51.X Health Services/Allied Health/ Health Sciences, general 6 45.X Social Sciences 4 43.0302 Crisis/Emergency/Disaster Management 19 43 Homeland Security, Law Enforcement, Firefighting and related
protective services 15
30.999 Multi-Interdisciplinary studies, other 2 24.0199 Liberal Arts and Sciences, General Studies and humanities,
other 1
44.X Public Administration and Social Service Professions 3 52.X Business/Commerce, general 1 unknown 8
Total 70
01020304050607080
Num
ber o
fRe
spon
dent
s

2018 EM Higher Ed: Status Update
D. Bennett, University of Nebraska at Omaha 5
As shown, a majority of the programs are classified as either Homeland Security or Crisis/Emergency/Disaster Management, regardless of program name or the department in which they reside. There were at least 13 other programs that identify as Health Services, Social Sciences, or Public Administration. Also note, that 12% of respondents did not know their CIP code. Depending on the institution, the CIP code may not be known to the actual survey participant responding on behalf of their program. Program directors, professors, and academic advisors represented the survey participants for the programs reported.
DEGREE OFFERINGS
The curriculums varied by level and type of degrees offered. The responding programs provided a total of 196 degree, concentrations, and certificates. Majority of the responses indicated that nearly half of respondents cater to undergraduate (n= 50) and graduate level (n= 49). A total of 86 programs offer emergency management degrees at the associate's, bachelor’s, master’s, or doctoral level. Figure 5 shows the types of degrees offered by the emergency management (EM) and related programs surveyed and compares to the 2017 report.
Figure 5. Types of degree offerings from surveyed programs
SECTOR FOCUS
Emergency management is a unique field of study that can lead to employment in the public, private, and non-profit sectors, both domestically and abroad. Since the curriculum may change based on program focus, this survey contained questions related to the sector to which the programs prepare
0
5
10
15
20
25
30
35
40
45
Degree offerings
EM Degrees offered (2018) EM Degrees offered (2017)

2018 EM Higher Ed: Status Update
D. Bennett, University of Nebraska at Omaha 6
their students. Majority of the responding programs offer a curriculum that prepares students for the public sector (93%), as a stand-alone focus (33%) or in combination with others (64%), see Table 2. Nearly 48% of the programs focus on all sectors, domestically and abroad. Note that Table 2 also includes a comparison from the 2017-reported percentage of sector focus. Table 2. Sector focus of emergency management programs
Sector Focus 2017 Percent (%)
2018 Percent (%)
2018 n
Public Sector 31.67 32.61 30
Private Sector 01.67 2.17 2
Non-profit (VOAD) Sector 00.00 0 0 Humanitarian (global Emergency Management) 00.83 0 0
All of the above 41.67 47.83 44 Other 02.50 1 1
Various combination 21.67 16.30 15 Total 92
Within the ‘various combination’ focus, all respondents indicated that they focused on the public sector in combination with one or more other sectors, but not all sectors. Within the ‘other’ category, one program indicated they focused on hazards.
CURRICULUM
The programs reflected in this report were generally comfortable with their curriculum offerings. Only 35% of respondents indicated that they plan on developing new coursework over the next year (n=28). Some of the types of programs under consideration include Cyber Disaster Management, Environmental Health and Safety, Emergency Management Leadership, and Geospatial Information Systems. Majority of emergency management- related classes are taught all or in-part online. Over 80% of respondents report that they offer coursework through online or distance learning (n=73). Approximately, 57% of classes are offered both online and in-person, and more than 70% of courses are offered only online. Figure 6 shows the program coursework provided only online or both online and in person. Compared to the 2017 report, there is a reported increase in the number of programs that offer 100% of their coursework both online.
Figure 6. Program coursework by percentage offered online
0
5
10
15
20
25
0-19% 20-49% 50-79% 80-99% 100%
Num
ber o
f pro
gram
s
Online Only Both Online and in person

2018 EM Higher Ed: Status Update
D. Bennett, University of Nebraska at Omaha 7
Some programs indicated that they no longer offered courses related to emergency management. While they were asked to select the ‘opt-out’ feature of the email request, many were also asked why their schools stopped their program. The most common answers were due to lack of enrollment and lack of funding. These were the same response for those opting out in the 2017 survey.
STUDENTS
In this past academic year, 2,956 students graduated, as reported by respondents. Assuming the FEMA Higher Education Program database represents 100% of the EM programs, extrapolation for a total number of students is based on 30.3% of U.S. based programs represented in the survey. From extrapolation, approximately 9,755 students graduated from an emergency management program during the 2017-2018 academic year, see Table 3. Table 3. Number of graduates from emergency management programs (partially adapted from Cwiak, 2016, 16)
2017 raw
numbers
2017 extrapolated
est.
2018 raw
numbers
2018 extrapolated
est.
Number of EM graduates 2,364 6,389 2,956 9755
Number graduates since inception of FEMA Higher Ed.
__ 36,049 __ 45,804
According to the previous report in 2017, 36,049 students graduated from emergency management programs since the inception of the FEMA Higher Education Program (Bennett, 2017). Adding in the extrapolated data from this year, the estimated number of graduates since inception is nearly 46,000 as of 2018.
ENROLLMENT
Enrollment has generally increased over the past three years according to nearly 56% of respondents (n=81). Only 16% of emergency management programs observed a decrease in enrollment. Most programs were optimistic about the next three years, where nearly 60% of programs anticipated an increase in enrollment. On average 43% of programs reported an increase in the number of graduates in the past year (n=81). However, 46% of programs reported no change in the number of graduates in the past year. Again, most programs (58%) are optimistic about the number of students graduating in the next three years.

2018 EM Higher Ed: Status Update
D. Bennett, University of Nebraska at Omaha 8
Figure 7. Enrollment and graduation over the past three years and projections for the next three years
Compared with the results from the 2017 survey, the enrollment and graduation forecasts appear similar. However, there is a shift in projected enrollment. Respondents are more cautious in their estimates. In 2017, 71% of respondents anticipated an increase in enrollment over the next three years, and in 2018 only 58% expect the same growth. Similarly, in 2017, 66% of respondents indicated a projected increase in graduates over the next three years, wherein 2018, only 58% anticipated the same growth. As shown in Figure 7, this is the first year in which more programs reported that there was no change in the number of graduates over the past three years (46%), with only 43% reporting an increase in the number of graduates.
POST GRADUATION
Nearly 47% of respondents tracked their graduates’ employment (n=40), and most of the emergency management students have entered jobs in the public sector. On average approximately 53% of graduates moved into employment positions at the federal, state, and local government level. Programs reported that about 27% of students move into the business sector, 16% in the non-profit sector, and nearly 15% in the humanitarian or global emergency management area.
DIVERSITY
The student body is becoming more diverse. Respondents estimated on average, approximately 39% of female students in their program (n=81). This survey further examined the demographic make-up of the emergency management student body. Nearly 70% of respondents have observed an increase in diversity among their student body (n=57). While most of the growth has been seen among female students, other traditionally underrepresented groups have increased enrollment in emergency management programs including racial and ethnic minorities, international students, first-generation college students and non-traditional students. Figure 7 shows the observed increase in estimated percentage as reported by respondents (n=55).
05
101520253035404550
Enrollment -past 3 years
Enrollment -projected 3
years
Graduation -past 3 years
Graduation -projected 3
years
Num
ber o
f pro
gram
s
Increase
No Change
Decrease

2018 EM Higher Ed: Status Update
D. Bennett, University of Nebraska at Omaha 9
Figure 8: Observed increase in diversity among the emergency management student body.
For the first time, respondents were asked to identify the percentage of students from diverse backgrounds enrolled in their programs. The average portion of each program is shown in Figure 8. Enrollment in emergency management programs indicate that approximately 18% of students identify as Black or African American, 15% of students identify as Hispanic or Latino. Asian, American Indian/Alaskan Native, and Native Hawaiian/Pacific Islander students have not yet made up 10% of the student population. Additionally, Figure 9 shows approximately 16% of the student body population is comprised of international students.
Figure 9: Average percentage of students from diverse backgrounds enrolled in emergency
management programs.
FACULTY AND INSTITUTIONAL SUPPORT
TYPE OF FACULTY
At the university level, faculty can generally be categorized into four categories; tenure-track, tenured, full time non-tenured, and part-time (or adjunct). Most often tenure-track faculty are the assistant
0 10 20 30 40 50 60
FemaleNon-traditional Students
Black or African AmericanFirst generation college students
International StudentsOther Ethnic Group
AsianAmerican Indian or Alaska Native
Native Hawaiian or Pacific Islander
Observed increase (percentage)
17.74
6.388.09
3.44
15.17 16.1518.38
02468
101214161820
Black/African
American
AmericanIndian/
Alaska Native
Asian NativeHawaiian/
PacificIslander
Hispanic orLatino
InternationalStudents
Other ethnicgroup
average percentage

2018 EM Higher Ed: Status Update
D. Bennett, University of Nebraska at Omaha 10
professors (and occasionally associate professors) working towards specific research, teaching, and service metrics as prescribed by the university and department. Tenured faculty members are most often full professors, associate professors, or equivalent. Lecturers, Instructors, and other full-time faculty often do not have the same metrics for research as the tenured or tenure-track professors and instead focus the majority of their time on teaching. Similarly, part-time faculty members (such as adjuncts) also do not have research duties and are focused on teaching, usually one class and one semester at a time. Furthermore, many part-time faculty members have professional careers outside of the university, which limits the number of courses (and frequency) they teach. For many accrediting bodies in other disciplines, the type of faculty teaching in the program is indicative of the governance of the program and curriculum offered. Affiliated or associated faculty represent those who may not be housed in the same program but often teach the emergency management curriculum. In emergency management-related programs, respondents of the survey indicated that their programs rely heavily on part-time faculty (n=61). Table 4 shows the type of faculty used in the programs, the average for those reporting, as well as the standard deviation. The ‘n’ reported in Table 3 represents the number of programs reporting. Table 4. Type of faculty in emergency management programs
Min Max Mean Std. Dev n
Full-time tenure-track 0 100 4.84 14.19 61 Full-time tenured 0 100 12.78 25.41 61
Full-time non-tenured 0 51 4.52 9.90 61 Part-time faculty 1 100 21.85 30.65 61
Affiliated or associated faculty 0 89 8.92 17.56 61
Several programs reported not having any tenure-track faculty (31%). Approximately 20% of programs reported having one full-time tenured faculty. The standard deviation of the use of part-time faculty indicates that there is a difference in the use of part-time and full-time tenured faculty among the responding programs. As shown, there are over 1400 part-time faculty currently teaching in responding emergency management programs, see Table 5. Table 5. Total number of faculty as reported, by type
Number of faculty Full-time tenure-track 295
Full-time tenured 575 Full-time non-tenured 190
Part-time faculty 1442 Affiliated faculty 232
Nearly 39% (n=31) of responding emergency management-related programs attempted to hire new faculty or program staff within the last year. A majority (n=29), were successful in adding to their programs. Of those successful in hiring, nearly 52% of the new employees were part-time.
During several meetings at the FEMA Higher Ed Annual Symposium practitioner experience and faculty, background are often discussed at great length. This year, the annual survey asked about the practitioner experience of faculty in emergency management programs.
2018 EM Higher Ed: Status Update
D. Bennett, University of Nebraska at Omaha 11
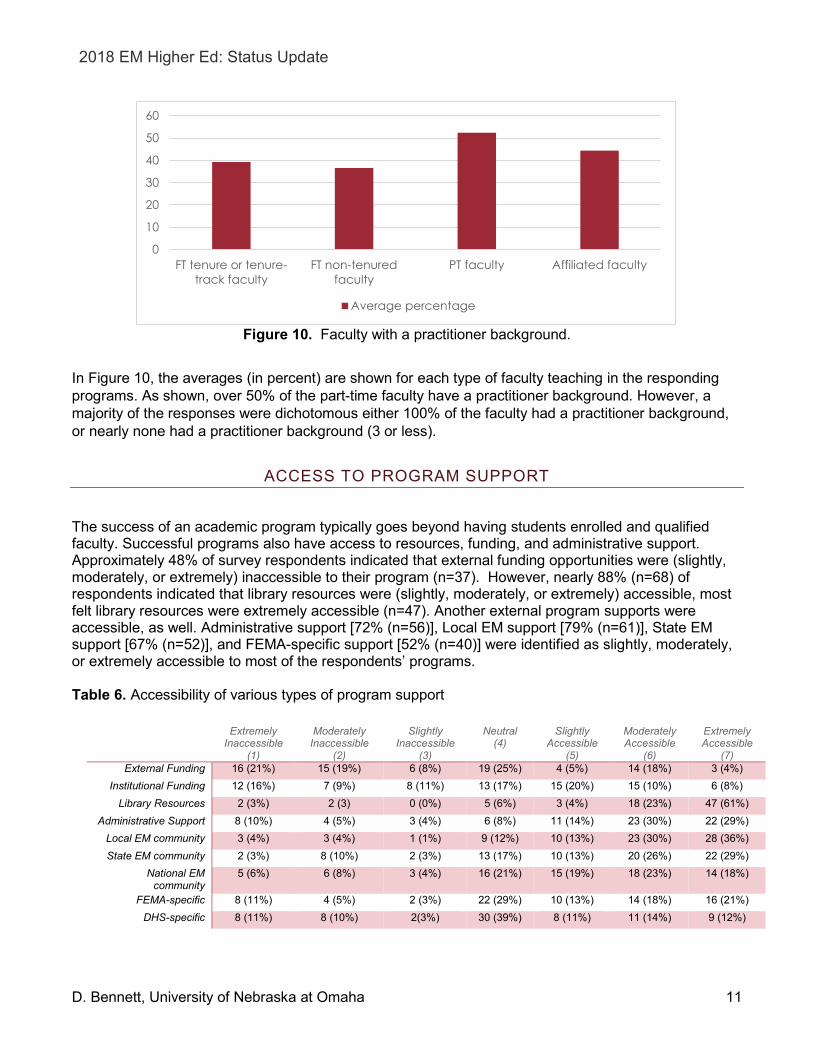
Figure 10. Faculty with a practitioner background.
In Figure 10, the averages (in percent) are shown for each type of faculty teaching in the responding programs. As shown, over 50% of the part-time faculty have a practitioner background. However, a majority of the responses were dichotomous either 100% of the faculty had a practitioner background, or nearly none had a practitioner background (3 or less).
ACCESS TO PROGRAM SUPPORT
The success of an academic program typically goes beyond having students enrolled and qualified faculty. Successful programs also have access to resources, funding, and administrative support. Approximately 48% of survey respondents indicated that external funding opportunities were (slightly, moderately, or extremely) inaccessible to their program (n=37). However, nearly 88% (n=68) of respondents indicated that library resources were (slightly, moderately, or extremely) accessible, most felt library resources were extremely accessible (n=47). Another external program supports were accessible, as well. Administrative support [72% (n=56)], Local EM support [79% (n=61)], State EM support [67% (n=52)], and FEMA-specific support [52% (n=40)] were identified as slightly, moderately, or extremely accessible to most of the respondents’ programs. Table 6. Accessibility of various types of program support
0
10
20
30
40
50
60
FT tenure or tenure-track faculty
FT non-tenuredfaculty
PT faculty Affiliated faculty
Average percentage
Extremely
Inaccessible (1)
Moderately Inaccessible
(2)
Slightly Inaccessible
(3)
Neutral (4)
Slightly Accessible
(5)
Moderately Accessible
(6)
Extremely Accessible
(7) External Funding 16 (21%) 15 (19%) 6 (8%) 19 (25%) 4 (5%) 14 (18%) 3 (4%)
Institutional Funding 12 (16%) 7 (9%) 8 (11%) 13 (17%) 15 (20%) 15 (10%) 6 (8%) Library Resources 2 (3%) 2 (3) 0 (0%) 5 (6%) 3 (4%) 18 (23%) 47 (61%)
Administrative Support 8 (10%) 4 (5%) 3 (4%) 6 (8%) 11 (14%) 23 (30%) 22 (29%) Local EM community 3 (4%) 3 (4%) 1 (1%) 9 (12%) 10 (13%) 23 (30%) 28 (36%) State EM community 2 (3%) 8 (10%) 2 (3%) 13 (17%) 10 (13%) 20 (26%) 22 (29%)
National EM community
5 (6%) 6 (8%) 3 (4%) 16 (21%) 15 (19%) 18 (23%) 14 (18%)
FEMA-specific 8 (11%) 4 (5%) 2 (3%) 22 (29%) 10 (13%) 14 (18%) 16 (21%) DHS-specific 8 (11%) 8 (10%) 2(3%) 30 (39%) 8 (11%) 11 (14%) 9 (12%)

2018 EM Higher Ed: Status Update
D. Bennett, University of Nebraska at Omaha 12
As shown in Table 6, several survey respondents were neutral on the accessibility of specific support for their programs. This can be an indication of not wanting to answer or the question may not have applied to the programs surveyed. Table 7 compares the findings of the accessibility of program support from the 2016 report with the 2017 results. The means shown in Table 7 are related to the 7-point Likert indicators listed in Table 6 (1= extremely inaccessible to 7= extremely accessible). Note: the 2016 survey asked the same question using 10-point Likert indicators with (1= not at all to 10 = very much so). Table 7. Comparison of the access and support indicators
2016 2017 2018 Mean Std.
Dev. n Mean Std.
Dev. n Mean Std.
Dev. n
External Funding 3.36 2.73 74 3.35 1.97 104 3.44 1.88 77 Institutional Funding 4.34 2.98 74 3.80 2.07 106 4.07 1.89 76
Library Resources 7.62 2.44 74 6.22 1.25 106 6.21 1.39 77 Administrative Support 6.12 3.02 74 4.90 1.95 106 5.14 1.95 77
Local EM community 7.45 2.29 74 5.49 1.60 104 5.61 1.59 77 State EM community 6.25 2.74 73 5.17 1.72 104 5.19 1.73 77
National EM community 5.13 2.66 72 4.64 1.62 104 4.82 1.74 77 FEMA-specific 6.82 2.51 72 4.68 1.65 104 4.68 1.87 76
DHS-specific 4.59 2.70 71 4.12 1.55 104 4.20 1.76 76
ANTICIPATED CHANGES
Overall there were six anticipated changes mentioned by 74 participants in open answer questions; organizational changes, new degree offerings, change in focus, new curriculum, adjustments in student enrollment, and potential changes in new faculty. Approximately 16% of respondents indicated that they did not anticipate any changes in the next three years, shown in Figure 11. Some programs expected more than one shift.
Figure 11. Key anticipated changes identified from respondents
02468
1012141618
Num
ber
of re
spon
dent
s
2018 EM Higher Ed: Status Update
D. Bennett, University of Nebraska at Omaha 13
METRICS OF SUCCESS
This year the survey also included a question to identify how each program measured success. The top three metrics of success indicated by respondents (n=74) were: a number of graduates, students enrolled and graduate job placement, 61%, 53%, and 38% respectively. Some respondents mentioned other metrics from the students such as course evaluations, exit surveys, and publications from students or graduates. A few additional respondents suggested metrics related to student composition and external stakeholders, such as diversity, program self-study, job promotion, alum interviews, and internship or employer surveys. One program mentioned accreditation standards; however, they did not indicate which criteria.
FEMA EMI HIGHER ED RESOURCES
Respondents were asked many questions regarding their use of FEMA Higher Ed program resources. This section is divided based on online resources, in-person meetings, and virtual programs offered by FEMA Higher Ed.
ONLINE RESOURCES
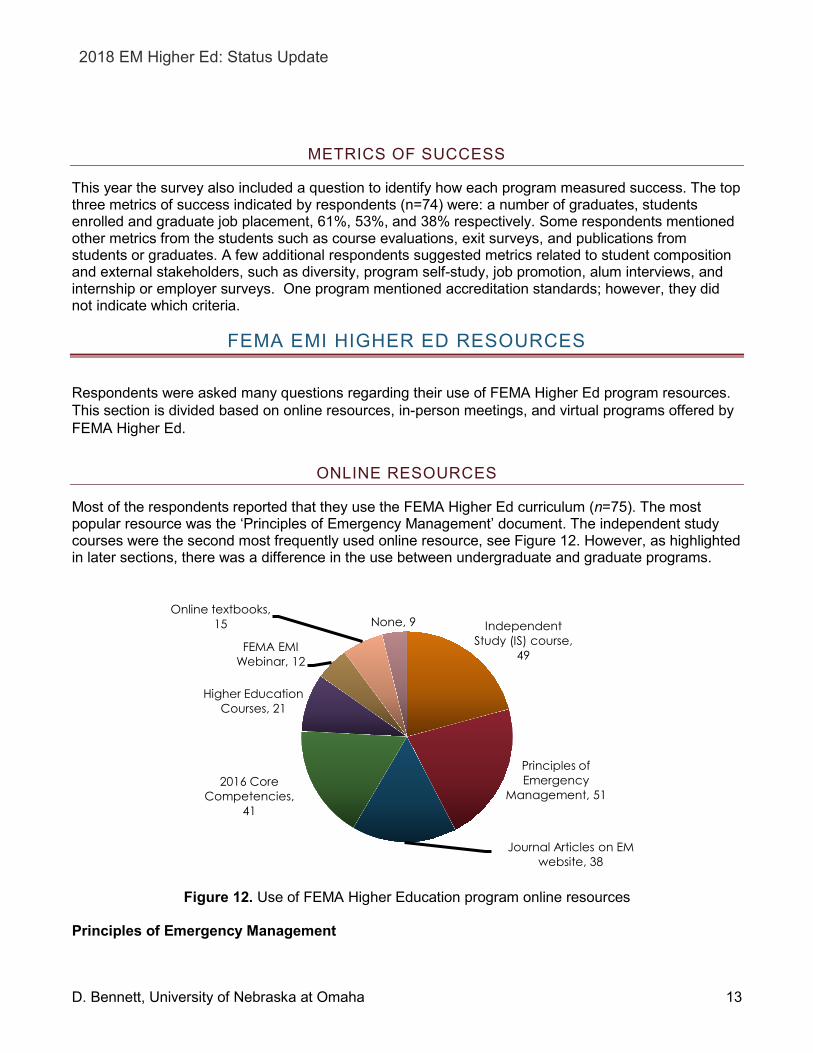
Most of the respondents reported that they use the FEMA Higher Ed curriculum (n=75). The most popular resource was the ‘Principles of Emergency Management’ document. The independent study courses were the second most frequently used online resource, see Figure 12. However, as highlighted in later sections, there was a difference in the use between undergraduate and graduate programs.
Figure 12. Use of FEMA Higher Education program online resources Principles of Emergency Management
Independent Study (IS) course,
49
Principles of Emergency
Management, 51
Journal Articles on EM website, 38
2016 Core Competencies,
41
Higher Education Courses, 21
FEMA EMI Webinar, 12
Online textbooks, 15 None, 9

2018 EM Higher Ed: Status Update
D. Bennett, University of Nebraska at Omaha 14
Approximately 68% of the respondents indicated that they use the ‘Principles of Emergency Management’ document (n=51). Approximately 54% of the responding programs use the document in undergraduate programs (n=31), see Figure 13. Of the programs that do not use the ‘Principles of Emergency Management’ document, 63% were aware of the document (n=12).
Figure 13. Types of classes in which the ‘Principles of Emergency Management’ document was used
Independent Study (IS) Course Nearly 65% of the respondents use the independent study (IS) courses (n=75). As reported the IS courses are primarily used as a supplemental material, 100% (n=43), see Figure 14.
Figure 14. Primary use of Independent Study (IS) courses
Next Generation Core Competencies (2016) Nearly 54% of programs indicated that they use the Next Generation Core Competencies in their curriculum (n=14), from Figure 11. However, of the respondents that did not use the Next Generation Core Competencies, nearly 53% were not aware of this resource. Higher Education Courses From Figure 11, nearly 28% of responding programs indicated that the FEMA Higher education courses were used in their curriculum (n=21). These responding programs were asked to select all of the courses their programs used (n=19). From this question, the FEMA Higher Education Courses were ranked by most use, see below: National Incident Management Systems Course (NIMS) 8.66% Technology and Emergency Management 6.30% Disaster Response Operations and Management 5.51% Homeland Security and Emergency Management 5.51% Building Disaster Resilient Communities 4.72% Hazards, Disasters and U.S. Emergency Management - An Introduction (working draft) 4.72% Hazards Risk Management 4.72% Public Administration and Emergency Management 4.72% Sociology of Disaster 4.72% Social Vulnerability Approach to Disasters 4.72%
0.00% 10.00% 20.00% 30.00% 40.00% 50.00% 60.00%
UndergraduateGraduate
Other
Percentage of Respondents
0% 20% 40% 60% 80% 100% 120%
Used as supplemental materialUsed alone as primary source of information
Percentage of respondents

2018 EM Higher Ed: Status Update
D. Bennett, University of Nebraska at Omaha 15
Terrorism and Emergency Management 4.72% Business Crisis and Continuity Management 3.94% Social Dimensions of Disaster 3.94% Holistic Disaster Recovery: Creating a More Sustainable Future 3.15% Principle, Practice, Philosophy and Doctrine of Emergency Management 3.15% Research and Analysis Methods in Emergency Management 3.15% Catastrophe Readiness and Response Course 2.36% Coastal Hazards Management 2.36% Comparative Emergency Management 2.36% Earthquake Hazard and Emergency Management 2.36% Floodplain Management: Principles and Current Practices 2.36% Principles and Practice of Hazard Mitigation 2.36% Breaking the Disaster Cycle: Future Directions in Natural Hazard Mitigation 1.57% Emergency Management Principles and App. for Tourism, Hospitality & Travel Mgmt. 1.57% Flood Plain Management (Graduate Level) 1.57% Hazard Mapping and Modeling 1.57% Individual and Community Disaster Education 1.57% Political and Policy Basis of Emergency Management 1.57%
PARTICIPATION IN PROGRAMS
Of the 77 programs reporting, less than 30% have participated in the FEMA EMI special interest groups (SIGs) or the FEMA EMI Focus groups. Conversely, nearly 60% participated in the FEMA EMI Symposium (n=46), with less than 10% not aware of the opportunity prior to taking this survey. Figure 15 shows program participation in FEMA Higher Ed in-person opportunities.
Figure 15. Participation in specific FEMA Higher Education program offerings
FEMA EMI Special Interest and Focus Groups More than half of the respondents (n=42), who do not previously participate in the FEMA Special Interest Groups (SIGs), would like to learn more information (57%) or be invited to join (23%). Figure 16
01020304050607080
FEMA EMI SIGs FEMA EMI FocusGroups
FEMA EMI AnnualSymposium
Num
ber
of P
rogr
ams
Yes No not aware

2018 EM Higher Ed: Status Update
D. Bennett, University of Nebraska at Omaha 16
displays the number of programs interested in participating or receiving more information.
Figure 16. Interest in FEMA Higher Education Special Interest Groups (SIGs)
Similarly, more than half of the respondents (n=30), who have not previously participated in the FEMA Higher Ed focus groups, would like to learn more information (44%) or be invited to join (29%). Their responses are displayed in Figure 17.
Figure 17. Interest in FEMA Higher Education Focus Groups
Of the 53 respondents who have not attended the FEMA Higher Ed webinars, 43% were not aware of the webinars, 23% indicated that the webinars occur at an inconvenient time, 17% noted the topics are often not related to their immediate interests.
Figure 18. Awareness of FEMA Higher Ed Webinars
Figure 18 shows the number of program representatives responding to questions regarding the FEMA Higher Ed webinars. Of the six respondents who indicated ‘other’ in response to why they do not participate in the webinars, two made references to time constraints, and two mentioned a need for better information about the webinars.
IDEAS FOR DIFFERENT PRODUCTS AND SERVICES
0 5 10 15 20 25 30 35
Want to joinWant more info
Not interested at this time
Number of programs responding
0 5 10 15 20 25 30 35
Want to joinWant more information
Not interested at this time
Number of programs responding
0 5 10 15 20 25
Not awareInconvenient timeTopics not related
OtherUnable to use plaform
Number of programs responding
2018 EM Higher Ed: Status Update
D. Bennett, University of Nebraska at Omaha 17
Respondents were given the opportunity to provide ideas for different products and services they would like to see from the FEMA EMI Higher Education Program. Their responses were loosely grouped and coded into six different ideas [ranked in order of popularity], (1) FEMA resources, (2) student internships and job opportunities, (3) generally satisfied, (4) program or curriculum assessment, (5) service learning assistance, and (6) research assistance (n=37). With regards to the FEMA resources, respondents focused on updating the materials. Other ideas were more detailed, asking for more innovative curriculum. See some key responses below:
“Please update all of the college courses. They are so very outdated.”
“[Include] teaching materials (focusing on simulations).”
“I think it’s time to update some the course materials.”
“The list of journal articles is small and some are dated. A more comprehensive list would be nice.”
“More resources to incorporate into classroom curriculum that are innovative and provide opportunities for interaction.”
Many respondents also mentioned concerns with the lack of student internships and job opportunities. Some of the responses are below:
“Funding for applied disaster management research, assistance in linking practitioners to academic community for interns, research collaborations,
needs assessment.”
“Cutting edge information and career opportunities that can be used in the classroom.”
“Greater cooperative initiatives and opportunities for students (internship, career, etc.). At times it is difficult to find and maintain a point of contact with Federal agencies. They often tend to "go where the money is"
and interact more thoroughly with the bigger schools. As an urban institution and Hispanic serving institution we have tremendous human
capital.”
The third most popular comment to the open-ended question regarding ideas for different products and services from the FEMA EMI Higher Education Program were generally satisfactory in nature. Select responses below: “Just keep doing what you are doing. I can't think of any recommendations at
this time.” “FEMA/EMI is doing a great job. I have nothing new to recommend at this
moment.”
However, on the other end of the spectrum, there were responses that indicate a lack of interest in being part of the FEMA Higher Ed community One respondent noted:
“We anticipate no longer going to the Symposium.”

2018 EM Higher Ed: Status Update
D. Bennett, University of Nebraska at Omaha 18
RESPONSES BY PROGRAM TYPE
There were differences in the responses based on the type of degree offered. In this section, the differences are reviewed separately based on U.S.-based programs that provide undergraduate degrees (certificates and concentrations at the associates and bachelor’s level included) and those that offer graduate degrees (certificates, concentrations at the master’s and doctorate degrees included). Note that in the separate analysis performed below, there is some overlap. Several programs offer both undergraduate and graduate degrees; therefore, their response was reported in both sections.
UNDERGRADUATE DEGREE-GRANTING PROGRAMS
Majority of the responding institutions offer undergraduate degrees (n=42). Very few (15%) of the undergraduate programs are housed in emergency management departments. Nearly 90% of the undergraduate programs offer their coursework online. Approximately 71% of the curriculum is provided 100% online. Most of the programs (54%) do not intend on developing new coursework (n=21). Nearly 95% of programs are focused solely or in part on the public sector. The student body at the undergraduate level is becoming more diverse, nearly 79% (n=30) indicate an observed increase in diversity of students. Women are approximately 34% of the undergraduate student body. On average the undergraduate student body population is comprised of 16% African American students, 15% Hispanic/Latino students, 8% Asian and 8% of American Indian/Alaskan Native. Majority of undergraduate programs have seen an increase in enrollment over the past three years (58%) and expect an increase in enrollment over the next three years (61%). A little less than half (48%, n=19) track their graduates’ employment. For the programs that do track their graduates’ employment they report that most students find positions in the public sector (50%); however, all sectors were represented. The least popular sector for employment was humanitarian or global emergency management; programs reported that 10% of the graduates found work in the field. Most of the undergraduate programs are staffed primarily with part-time faculty. At least 12 respondents indicated that their program was staffed with 100% part-time faculty. Nearly 55% of undergraduate programs are averaging approximately 18 adjuncts or equivalent, with a total of 528 part-time faculty members. Many programs also rely on tenure-track faculty, nearly 28% of programs reported an average of 3 assistant professors or equivalent, a total of 263. More than half of undergraduate programs indicate they also have full-time non-tenured faculty, such as lecturers or instructors, a total of 78 faculty. Approximately 38% of undergraduate programs attempted to hire new faculty and 100% (n=14) of them successful in their search. Most of the hires (53%) were for more full-time faculty. Nearly half of the undergraduate programs found access to external funding inaccessible, with 26% neutral on the topic. Majority of the programs have excellent support from the local, state, and national emergency management offices, with favorable responses of 89%, 74%, 57%, respectively. Specific to programs offering associates degrees, the FEMA EMI program “Prototype Curriculum for Associate Degrees in Emergency Management” is not readily used in approximately 27% of the program (n=4). Figure 19 shows the responses from relevant programs.

2018 EM Higher Ed: Status Update
D. Bennett, University of Nebraska at Omaha 19
Figure 19. Use of the ‘Prototype Curriculum for Associates Degrees in Emergency Management’
The most used FEMA EMI Higher education resource at the undergraduate level is the ‘Principles of Emergency Management’ document (24%), followed by the independent study courses (23%). Most of the undergraduate programs that do not use the principles of emergency management are aware of the document 71%. The least used resources are the higher education online course material (6%). The most used course material is the National Incident Management System (NIMS) (9%)
Only 5% of the undergraduate programs have joined the FEMA EMI Webinar. Majority of the responding representatives from undergraduate programs indicated that they attend or have attended the FEMA EMI Annual Symposium (66%) or participated in a FEMA EMI Focus group (34%). Many have not yet joined a FEMA EMI Special Interest Group (37%). An equal number of respondents has either attended the symposium every year or has only participated once or twice, 35%.
GRADUATE PROGRAMS
Nearly 87% of the graduate programs offered coursework online (n=28). Approximately 53% of the coursework is delivered both online and in person. Most graduate programs (55%) are not planning on developing new coursework in the near future. While the general primary focus of graduate programs was on curriculum for the public sector, nearly 69% indicated that they focused on all sectors.
Majority of graduate programs have seen an increase in enrollment over the past three years (46%) and expect an increase in enrollment over the next three years (57%). The observed diversity in higher education programs extends to the graduate level. Majority of program representatives (76%) indicate a perceived increase in diversity. Again, most of that diversity is with the enrollment of women, approximately 95% of graduate programs reported this observation. On average women students are 41% of the graduate student base. The percentages of diverse populations in the graduate programs are 19% International, 17% Hispanic/Latino, 13% Black or African American, and 10% Asian.
Unlike the undergraduate programs, the majority (61%) of the graduate programs track their graduates’ employment. Most programs observed their graduates finding jobs in public (47% of students) or private sectors (36% of students).
Graduate programs are just as likely to rely on part-time faculty, 57% of the faculty are part-time. However, most of the programs use no more than two part-time faculty for graduate coursework. Nearly 46% of graduate programs attempted to hire more faculty, 50% for both part-time and full-time
26.67%
73.33%
0.00% 10.00% 20.00% 30.00% 40.00% 50.00% 60.00% 70.00% 80.00%
Used in the program
Not used in the program
Percentage of programs responding

2018 EM Higher Ed: Status Update
D. Bennett, University of Nebraska at Omaha 20
positions. In graduate curriculums, several of the faculty have a practitioner background, 34% full-time tenured (or tenure-track), 45% full-time non-tenured, 49% part-time faculty and 37% associate faculty.
The most remote support for graduate programs is from funding both external and internal, with 44% and 31% of the programs reporting, respectively. Support, based on all other metrics (including administrative, library, federal, state, or local emergency management agencies) were generally accessible to graduate programs. However, many of the programs remained neutral, committing neither to a positive or negative response. Many of the graduate programs (38%) were neutral with regards to DHS specific response. Similarly, programs were neutral on FEMA specific support (23%).
Similar to the undergraduate programs, the most used FEMA EMI Higher education resource at the undergraduate level was the principles of emergency management document (25%). The second most used resource was the independent study courses (19%), followed by the journal articles online (18%). The least used resource was the FEMA EMI webinars. Only 7% of the respondents indicated the use of the Higher Education Courses. There were three courses tied for most usage (6.5%), Social Dimensions of Disaster, National Incident Management System (NIMS), and Technology and Emergency Management.
More than half of the responding representatives from graduate programs (67%) indicated that they attend or have attended the FEMA EMI Annual Symposium Nearly 39% of respondents have participated in the symposium every year. Most responding representatives were not aware of the Special Interests Groups (48%) or the Focus groups (44%). Most respondents would like to receive more information about these opportunities or in joining.
INTERNATIONAL SCHOOLS
This year international schools were invited to participate, as well. Only 3 of the 17 identified schools abroad responded (18% response rate). One program was housed in an emergency management department. All of the programs are focused on a combination of sectors. Interestingly, none of the international-based programs offered a graduate degree in the field. Instead, they primarily focus on undergraduate level degree offerings. All plan on developing new programs over the next year. Two programs will be focused on Homeland Security or Business Continuity Management. The other school is preparing a post-graduate certificate in specialized areas. Only one of the three respondents indicated their program delivers 100% of the coursework through distance (online) education. Combined the programs have graduated 55 students. All track their graduates’ employment, a majority of their students find work in the public sector 70%, and 35% in the private sector. All of the programs indicated that they were staffed with full-time faculty, with at least one tenured professor. Just like their U.S.-based counterparts, they also rely heavily on part-time (or adjunct) faculty. Nearly 75% of their full-time tenured (or tenure-track) faculty have a practitioner background. More than half of the full-time non-tenured or part-time faculty have a practitioner background, 51%, and 58%, respectively. Two programs hired in the last year, most were full-time faculty. There are similarities in the accessibility of program support. Most of the respondents indicated a concern with access to external funding and not with access to library resources or administrative support. All respondents reported that they have access to local, state, and national level support for

2018 EM Higher Ed: Status Update
D. Bennett, University of Nebraska at Omaha 21
their programs. The programs anticipate changes in their programs, some of the programs include an increase in student enrollment, addition of new faculty, and an expansion in their course offerings. International programs are using FEMA EMI resources. Three resources are tied for most popular, principles of emergency management document, 2016 emergency management core competencies, and journal articles available on the website. The only higher education course used was the Comparative Emergency Management course. Only one program was not aware of the FEMA Annual Symposium. Two of the international program respondents were not aware of the special interest groups or focus groups and would like to have more information.
DISCUSSION
This report summarizes the data collected from the annual survey on the current status of emergency management programs and on the usefulness of the products and services provided by the FEMA Emergency Management Institute Higher Education program (FEMA Higher Ed). Interpretation of the results was separated into four (4) categories, program curriculum, students, faculty and program support, and use of FEMA Higher Education (FEMA Higher Ed) products and services. The responding 89 institutions indicated from program name, department and classification of instructional program (CIP) code that their program was indeed focused primarily on emergency management. Majority of the programs indicated that their primary focus is to prepare students for public sector (federal, state, and local government) employment. Most programs cater to undergraduate degree offerings and coursework. While most respondents were comfortable with their current curriculum offerings, a little over one-third indicated that they were still developing new programs or coursework. Over three-fourths of respondents reported that they offer coursework through some form of distance learning (online). Approximately half of the programs responded that enrollment has generally increased over the past three years. The estimated number of graduates did increase from the 2017 academic school year estimates. Extrapolation of current number students and recent graduates was predicated on the assumption that the FEMA Higher Ed database represents 100% of emergency-management related programs in the U.S. The estimates show nearly 46,000 students have graduated from emergency-management related programs. The diversity of the student body is increasing. Approximately two-fifths of the student body is female. Over two-thirds of the programs indicated an observed increase in the diversity of their students. Some of the growth was reported among racial and ethnic minorities, first-generation college students and international students. This year we have estimates on the demographic landscape of emergency management students with 16% International students, 17% African American, 15% Hispanic/Latino and 8% Asian. Nearly two-fifths of programs reported that they track their graduates’ employment. True to the primary focus of most programs, the majority of graduates tracked found work in the public sector. Majority of the responding programs reported that they rely on part-time faculty to support their program. However, nearly two-fifths indicated that they attempted to hire new faculty or program staff in the past year. Over half of the new hires were for part-time faculty. Over one-third of the faculty (at each level) have a practitioner background, with over half of the part-time faculty having emergency management (and related) experience. In addition to faculty, program support also stems from access to funding, resources, and administrative support. Most programs indicated available program support was in library resources and from their local, state, and national emergency management communities.

2018 EM Higher Ed: Status Update
D. Bennett, University of Nebraska at Omaha 22
Conversely, the least available program support were external and institutional funding resources. The most popular measures of success were the number of students enrolled, number of their graduates and job placement of their graduates. Some programs also use course evaluations, exit surveys or external stakeholders to contribute to their success metrics. Majority of the respondents used the FEMA Higher Ed online resources. The most used resource was the ‘Principles of Emergency Management’ document by both the undergraduate and graduate programs. Similarly, the second most frequently used resource was the independent study courses. Only one-fifth of programs reported that they used the FEMA Higher Ed courses provided online. The overall most frequent course used was the National Incident Management System (NIMS) curriculum, this was also the most frequently used course at the undergraduate level. At the graduate level, three courses tied for the most use: Social Dimensions of Disaster, National Incident Management System (NIMS), and Technology and Emergency Management. Only one of these 27 courses were used among international programs: Comparative Emergency Management course With regards to participation in FEMA Higher Ed services, a majority of the programs have sent a representative to participate in the Annual Symposium. However, less than one-third of respondents have engaged in the FEMA special interest or focus groups. Most programs indicate a willingness to receive more information about the special interests and focus groups, and this is similar to the findings in 2017. The respondents mentioned several anticipated changes to their programs. The three most frequently cited were related to the changes in current curriculum, faculty adjustments, and student enrollment. Few other programs mentioned shifting focus, introducing an entirely new degree offering, or changes in the organization of their institution. Respondents were also asked if they had any ideas for different products and services that could be offered by the FEMA Higher Ed program. Their proposed ideas centered around six different ideas:(1) FEMA resources, (2) student internships and job opportunities, (3) generally satisfied, (4) program or curriculum assessment, (5) service learning assistance, and (6) research assistance. Many of these were similar to ideas mentioned in the 2017 report.
CONCLUSION
This report depicts an emergency management community that is more grounded and diverse than is often given credit. Connecting to the reported measures of success, this report shows that the student body is observed as becoming more diverse and the graduation rate is on a steady incline. The percentage of diversity indicates there is still room for improvement but is encouraging. Most (tracked) graduates are employed in the public sector, on par with the primary curriculum focus. Few programs are concerned about their projected enrollment and graduation rates over the next three years. While we still rely heavily on part-time faculty, many represent our connection to those in practice. Over half of our part-time faculty have emergency management or related professional experience. As this report indicates there is still be room for policy considerations at the institutional level within universities on the support for the continuance of these programs. Many of the program representatives responded that there was a lack of support for external and institutional funding for their students and for research. However, support from the local, state, and national emergency management agencies is strong. The FEMA Higher Ed program resources are used to a great extent by many of the programs but is on the decline. Many of the respondents indicate a need to update the resource content, primarily that on

2018 EM Higher Ed: Status Update
D. Bennett, University of Nebraska at Omaha 23
the website. There is significant interest in the SIGs, focus groups, and the webinars, indicating that more information should be provided about these opportunities. This is an encouraging time for emergency management programs, most program are reporting increases in student enrollment and graduation rates, and those that hired in the past year were looking for part-time and full-time faculty, equally. This report (like the previous ones) only provides a baseline for this year. However, this report identifies areas of success among the emergency management programs, and we should celebrate that, as we push through to improve on areas of potential weakness.
“We are what we repeatedly do. Excellence then, is not an act, but a habit.” – Aristotle
REFERENCES
Bennett, DeeDee. (June,2017) “2017 Higher Education Emergency Management Programs: Status
Update.” Report for FEMA Higher Education Program. Emmitsburg, MD. https://training.fema.gov/hiedu/docs/readinglist/bennett%20%202017%20higher%20education%20emergency%20management%20programs%20final.docx
Cresswell, John. 2008. Research Design: Qualitative, Quantitative, and Mixed Methods Approaches, third edition. Sage Publications: Thousand Oaks, California
Cwaik, Carol. 2016. Emergency Management Higher Education: Where Do We Stand? 2016 FEMA Higher Education Program Report.
Dillman, Don A., Smyth, Jolene D. and Leah Melani Christian. 2014. Internet, Phone, Mail, and Mixed Mode Surveys: A Tailored Design Model. John Wiley & Sons: Hoboken, New Jersey.
Krippendorff, Klaus. 2004. Content Analysis: an introduction to its methodology, second edition. Sage Publications: Thousand Oaks, California.

2018 EM Higher Ed: Status Update
D. Bennett, University of Nebraska at Omaha 24
APPENDIX I
LIST OF PARTICIPATING INSTITUTIONS
Adelphi University Alma College American InterContinental University Anderson University Arkansas State University Barry University Boston University Brandon University California Maritime Academy California State University, Long Beach Citrus College Coastal Carolina Community College College of Southern Maryland Colorado State University - Global Campus Columbia Southern University Drury University Durham Technical Community College East Carolina University Eastern New Mexico University Endicott College Fairleigh Dickinson University Fredrick Community College George Mason University Georgia State University Guilford Technical Community College Hesston College Indiana University Purdue University Indianapolis Jackson State University John Jay College, City University of New York
Kansas Wesleyan University Kaplan University Lakeland Community College Louisiana State University MacMurray College Massachusetts Maritime Academy Mercer University's Penfield College Millersville University of Pennsylvania National University Naval Postgraduate School New Jersey City University New York Institute of Technology New York Medical College North Dakota State University Northeastern State University Northeastern University Northern Alberta Institute of Technology Pacific Union College Park University Philadelphia University Portland Community College Rabdan Academy Rutgers University Saginaw Valley State University Saint Louis University Sam Houston State University San Antonio College San Diego State University Southwestern College State University of New York, Rockland Community College Thomas Edison State University
Tulane University Union College University of Akron University of California, Irvine Extension University of Cincinnati University of Delaware University of Denver University of Florida University of Maine Fort Kent University of Maryland, Baltimore County University of Maryland University College University of Massachusetts Lowell University of Nebraska at Omaha University of Nevada at Las Vegas University of New Haven University of New Orleans University of North Carolina at Pembroke University of North Carolina, Chapel Hill University of North Texas University of Oklahoma University of South Carolina University of South Florida University of Washington University of Wisconsin Oshkosh Upper Iowa University Virginia Tech West Texas A&M University Western Washington University Wright State University

2018 EM Higher Ed: Status Update
D. Bennett, University of Nebraska at Omaha 1
Related Documents