FS 98-12 July, 1998 Emergence of U.S. Organic Agriculture: Can We Compete? (Revised August 1998) Karen Klonsky and Laura Tourte Gary D. Thompson Luanne Lohr Barry Krissoff

Welcome message from author
This document is posted to help you gain knowledge. Please leave a comment to let me know what you think about it! Share it to your friends and learn new things together.
Transcript

FS 98-12 July, 1998
Emergence of U.S. Organic Agriculture:Can We Compete?
(Revised August 1998)
Karen Klonsky and Laura TourteGary D. Thompson
Luanne LohrBarry Krissoff

FS 98-12 July, 1998
EMERGENCE OF U.S. ORGANIC AGRICULTURE:CAN WE COMPETE?
(Revised August 1998)
KAREN KLONSKY AND LAURA TOURTEGARY D. THOMPSON
LUANNE LOHRBARRY KRISSOFF
Karen Klonsky is Extension Specialist, University of California-Davis, Laura Tourte is ResearchAssociate, University of California-Davis, Gary Thompson is Associate Professor, University ofArizona, Luanne Lohr is Assistant Professor, University of Georgia, and Barry Krissoff isEconomist, Economic Research Service, USDA.
______________________________________________________________________________
Dept. of Agricultural & Applied EconomicsCollege of Agricultural & Environmental Sciences
University of Georgia______________________________________________________________________________

EMERGENCE OF U.S. ORGANIC AGRICULTURE:CAN WE COMPETE?
KAREN KLONSKY AND LAURA TOURTEGARY D. THOMPSON
LUANNE LOHR*BARRY KRISSOFF
*Department of Agricultural and Applied Economics
University of Georgia
Athens, GA 30602-7509
ABSTRACT---This compilation of papers for principal papers session PP-03 at the AAEA 1998 Annual Meetingassesses the current status of the organic agriculture industry in the United States. Paper topicsaddress production, market and certification issues faced by the industry, research challenges andemerging conditions shaping domestic and international markets.
-----KEY WORDS-----
production, marketing, industry structure, international trade, certification, organic agriculture
Faculty Series are circulated without formal review. The views contained in this paper are thesole responsibility of the authors.
The University of Georgia is committed to the principle of affirmative action and shall notdiscriminate against otherwise qualified persons on the basis of race, color, religion, nationalorigin, sex, age physical or mental handicap, disability, or veteran’s status in its recruitment,admissions, employment, facility and program accessibility, or services.
Copyright © 1998 by Luanne Lohr. All rights reserved. Readers may make verbatim copies ofthis document for non-commercial purposes by any means, provided that this copyright noticeappears on all such copies.

Organic Agricultural Production in the United States: Debates and Directions
Karen Klonsky and Laura TourteDepartment of Agricultural and Resource Economics
University of California - Davis
1
The beginnings of modern organic agriculture are generally attributed to writings in the
1940’s of Sir Albert Howard and Lady Eve Balfour, which espoused that the health of plants, soil,
livestock and people are interrelated. It followed that farming practices should work in harmony
with nature using inputs produced on-farm. Farming techniques adopted by the organic
movement outside of the United States included such practices as the use of compost, application
of manure, and shallow cultivation to minimize the disruption of soil microorganism activities. It
is not surprising that the primary focus was on soil, crop and animal husbandry since petroleum -
based inputs were not yet widely used. Organic agriculture was popularized in the United States
during the 1940’s by J.I. Rodale through the magazine Organic Farming and Gardening. Rodale
advocated a fundamental approach to farming based on understanding and working with natural
systems rather than attempting to control them.
In the late 1940’s and into the 50’s, chemical - intensive agriculture successfully boosted
agricultural productivity at relatively low cost thus diverting attention away from the organic
movement. However, the publication of Rachel Carlson’s Silent Spring in 1962, which
documented some of the negative consequences associated with agrichemical use, gave rise to
environmental consciousness and a renewed focus on organic agriculture.
The organic movement broadened its scope in the 1960’s and 1970’s to include the
relationship between agriculture and resource conservation by emphasizing the limited use of
nonrenewable resources. Although organic agriculture continued to encourage the use of on-farm
inputs, farming techniques expanded to include the newly coined integrated pest management,
biorational pesticides, and pheromone confusion. Advocates of organic agriculture maintained
2
that their cultural practices offered solutions to the problems caused by the chemical and energy
intensive systems that characterized U.S. agriculture. (Youngberg et al.).
By the 1980's growing public concerns with the negative impacts of conventional farming
manifested itself in two divergent ways. One way was the proliferation of new terms such as low
– input, ecological and sustainable to describe a type of agriculture that was environmentally
benign, economically sound and socially just. Ultimately, the term sustainable preempted all other
terms, including organic, in public policy arenas related to questions of the environment and
resource conservation.
The second manifestation was the successful use of the term ‘organic’ in the marketplace
to differentiate between agricultural products giving the organic industry an economic stature thus
far unrealized. This growing success created a need to standardize labeling of organic
commodities. Several individual states began to set production standards to distinguish between
acceptable and unacceptable farming practices by restricting the use of certain inputs. It is
important to realize that these regulations were directed at producer and consumer protection as
well as market enhancement and not overtly aimed at deriving any of the perceived environmental,
social or health benefits of organic agriculture. Farming practices can be regulated because it is
relatively straightforward to ascertain the presence and absence of inputs. In contrast, farming
that focuses on natural systems and ecological processes cannot be mandated because it is
conceptual and open to interpretation. Therefore, it is not surprising that regulation of organic
production manifested itself as a listing of acceptable and unacceptable inputs.
Lampkin (1994) criticized this approach to regulating organic agriculture because it
focuses on inputs rather than promoting processes devoted to maintaining ecological harmony.
3
At one extreme, it creates the potential for organic farming by neglect, while at the other it
sanctions the overuse of acceptable off – farm inputs. Others within the organic community see
the listing of inputs as an important first step toward standardization (Swezey, personal
communication). A third view, embraced in this paper, is that while it is theoretically possible to
comply with organic standards without incorporating new approaches to farming, these farms
would probably not be economically viable either because of poor performance associated with
passive management or high production costs resulting from sole reliance on input substitution.
The federal Organic Foods Production Act of 1990 (OFPA) follows the same basic
approach to regulation of organic agriculture found in state laws in that it requires the
promulgation of a list of allowable and prohibited materials. Interestingly, proposed standards of
the OFPA state that products labeled as organic must be grown following an organic farm plan
agreed to by the grower and an accredited certifying agent. Once implemented, the OFPA’s
certification/organic farm plan requirement provides a mechanism to move organic agriculture
beyond ‘farming by neglect’ and ‘input overuse’ dilemmas.
In fact, certification agencies have already been working toward this end. For example,
California Certified Organic Farmers (CCOF), the largest certifying agency active in California,
requires "a long-term program of ecological soil management" in addition to adherence to state
law, which prohibits the use of synthetically compounded materials. CCOF standards further state
that , "it is not acceptable to simply eliminate the use of synthetic materials and manage by 'benign
neglect'. This approach can lead to exhaustion of soil resources, poor quality crops, and ultimate
operation failure." (CCOF).

4
The nature of organic production and marketing as well as regulations unique to organic
agriculture mean that organic farmers operate under a set of constraints quite apart from their
conventional counterparts. Therefore, it is not surprising that while virtually all commercially
produced commodities can also be grown organically, organic agriculture is not simply a
proportionately smaller version of conventional agriculture. This paper discusses the current
status and direction of organic production in the United States, first in terms of farming practices,
and then on a regional and commodity basis.
Organic Production Practices
Successful organic growers integrate management decisions with innovative production
strategies and continually experiment on-farm as new information and technologies arise. At the
same time, organic farmers accept that complex biological interactions within systems are
commonplace rather than extraordinary and acknowledge that many cause and effect relationships
are not well understood.
There are a number of similarities, as well as some notable differences, between
conventional and organic practices (Klonsky, et. al). Areas of similarity include land preparation,
planting operations, cultivation and irrigation. It is important to point out that while slight
variations may take place in the number of passes for a cultivation, or in type of planting or seed
stock, the actual approach to these operations is essentially the same. Two areas of production in
which management approaches differ considerably are that of soil and pest management.
Soil Management
Working with a soil’s physical, chemical and biological characteristics constitutes a
significant challenge to organic farmers because organic fertilizing materials require some period
5
of time to decompose and mineralize before nutrients are made available for plant uptake and
utilization. The contribution a fertilizing material makes towards supplying crops with essential
nutrients depends on numerous factors including soil and climatic conditions and microbial
processes.
The lynchpin for soil fertility management in organic farming systems is a cover crop,
which is often used in combination with manure or compost. Supplemental fertilizers and soil
amendments such as gypsum, mined limestone and fish and kelp products are only employed on
an ‘as needed’ basis.
Cover crops are planted with multiple potential benefits in mind including: the addition of
organic matter to the soil, the addition of nitrogen through nitrogen fixation processes, as a
habitat to attract and sustain beneficial insects, to suppress weed growth, and to assist in soil
erosion control. There are also a number of potential disadvantages associated with cover crop
use, including increased the cash costs for planting and cover crop management, potentially higher
costs for the rental or purchase of specialized farm equipment, and the attraction of pests such as
insects, snails and rodents to the farming operation. In addition, cover crops with tall or vining
growth habits may interfere with some irrigation system designs.
Livestock manure and composts are applied to the soil to add organic matter and
nutrients, and to stimulate soil microbial diversity and activity (Van Horn). This, in turn, can
improve soil physical properties such as structure and aggregate stability, which are important in
water relations and for soil erosion control. Compost use has also been shown to suppress some
soil-borne pathogens (Van Horn). However, livestock manure or improperly produced and

6
handled compost may introduce viable weed seeds or pathogens to farming systems. Its
considerable bulk and application procedures may also require the purchase or rental of
specialized farm equipment, or necessitate contractual arrangements with a custom operator.
Pest Management
Practices commonly used by organic growers to manage pests include cover crops, crop
rotation and diversification, sequential planting, and water management. These practices often
serve multiple purposes including the enhancement of beneficial insect populations as well as
disease and weed control. Organic farmers may also take land out of production on a short-term
or permanent basis as part of their management strategy. For example, land may be utilized as
buffer zones for separation of organic and conventional production, to plant biologically diverse
habitats, or left fallow to break pest and disease cycles. However, the substitution of land for
other inputs reduces acreage in marketable production.
All pests that are found in conventional farming operations are also found in organic
systems. However, many organic growers have observed that pests, particularly diseases and
insects, do not pose serious production problems when soil fertility and crop health is carefully
managed, and when biological controls are utilized. Biorational pesticides are available to assist
in pest control and reduce short-run economic risks when necessary. It is generally recognized
that some legally allowed pest control products for organic production are less effective for acute
problems than the synthetically formulated prohibited pesticides. This is consistent with the fact
that organic agriculture takes a long- term preventative approach that does not rely on ‘quick
fixes’ to manage pests.

7
Of all aspects of pest management, weed control poses the greatest challenge to organic
growers. Multiple control strategies are employed to manage weeds, including mechanical
cultivation, hand weeding, flame weeding, animal grazing and water management. Mechanical
cultivation and hand weeding remain the most commonly used alternative to the herbicides used in
conventional farming enterprises. Many organic crops require multiple mechanical cultivations for
weed control each year. This is not only costly in terms of fuel use and labor hours, but may also
interfere with the scheduling of other operations. In addition, tillage practices may disrupt
decomposition and nutrient cycling activities of micro (e.g., fungi) and macro (e.g., earthworms)
soil organisms. The risk of injury to trees and vines may also increase if mechanical cultivations
are not properly performed. Hand weeding, though labor intensive and costly, may be the only
viable alternative for certain crops and production conditions. Other practices such as flame
weeding and animal grazing are methods of weed control for organic crops that are used less
often than mechanical and hand cultivation.
Certified Organic Agriculture as a Subsector of US Agriculture
The impending federal law will require that growers grossing over $5,000 be certified by
an accredited certifying agent. Approximately 30 states have laws regulating organic agriculture
(CAFF), while 13 state and 30 private agencies actively conduct certification services in the
United States (OFRF). All of the state and most of the private organizations certify in one state
only although there are several that certify broadly. The Organic Crop Improvement Association
(OCIA), which certifies both nationally and internationally, certifies in 23 states, more than any

8
other certifier (OFRF). Certification organizations differ with respect to the certification process,
requirements and associated costs.
Nationwide statistics for the number of organic growers, acreage and commodities grown
is available only for certified growers. According to a national survey conducted by the Organic
Farming Research Foundation (OFRF), there are also a number of growers in organic production
who are not certified. Statistics from California shed light on the question of whether statistical
information for certified growers provide a reasonable estimate of the size of the entire organic
industry on a national scale.
California state law requires organic farmers to register with the state but certification is
currently voluntary. In 1994, certified farms represented only 38 percent of registered farms but
82 percent of the registered acreage and 90 percent of sales (Tourte and Klonsky). Virtually all of
the high income growers (over $500,000 gross value of sales per year) were certified while over
two - thirds of the low income growers (under $10,000 gross value of sales per year) were not. If
the California experience holds true for the rest of the country, then the national statistics for
certified organic growers is representative of the industry in terms of acreage while underestimat-
ing the number of growers.
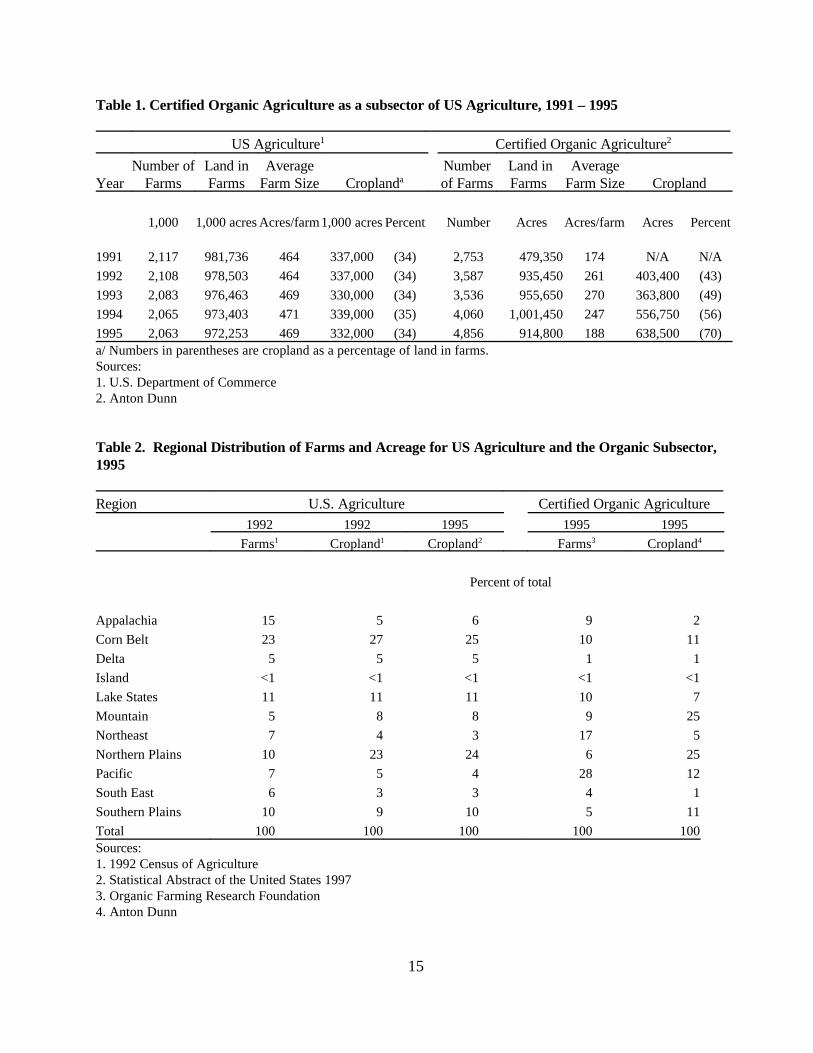
Certified organic agriculture accounts for less than one percent of farmers and farmland in
the United States (Table 1). However, the number of certified organic farms and acres almost
doubled between 1991 and 1995 while the number of US farms and acres decreased slightly over
the same time period. The average farm size for the organic sector is much smaller than for the
entire US; 188 acres compared to 469 acres in 1995. Further, the size of the average certified

9
organic farm has changed over time increasing by 50 percent between 1991 and 1993 and then
decreasing 30 percent by 1995.
The higher proportion of cropland in the organic subsector explains in part the smaller
average farm size for certified organic farms compared to all US farms assuming that the average
crop operation is smaller than the average livestock operation. Further, the dramatic decrease in
the size of the average certified organic farm corresponds to a decreased proportion of rangeland
and pasture over the same time period.
This decrease in certified rangeland and pasture indicates significant exit of livestock
production from the organic industry. However, it is important to realize that 86 percent of the
range and pastureland was located in Colorado, with another seven percent in Montana and Idaho
in 1995 (Anton Dunn). Therefore, most of the changes in certified pasture and rangeland
undoubtedly took place in the Mountain region. It is entirely possible that the decrease in
rangeland and pasture acreage could represent only a few growers dropping their certification.
Certified organic farms are located in all regions of the United States and all but five
states, notably Alabama, Alaska, Delaware, Mississippi and Nevada (OFRF). Certified organic
farms are highly concentrated in the Pacific and Northeast regions, which represented almost half
of the growers but only a third of the acreage in 1995 (Table 2). At the other extreme, the
Mountain and Northern Plains regions combined comprise only 15 percent of certified organic
growers but 50 percent of the acreage. The regional distribution of farms and acreage for the
entire US show important differences. The Pacific and Northeast regions comprise only 14
percent of farms and less than ten percent of cropland. The Mountain and Northern Plains

10
represent 12 percent of farms and 31 percent of cropland. Interestingly, roughly one – fourth of
all US farms and cropland are located in the Corn Belt while only ten percent of certified organic
farms and cropland are within this region.
Differences between the organic sector and the entire agricultural sector with respect to
commodities grown help explain the regional distribution of farms and acreage described above.
Almost three - fourths of organic farms grew vegetable, fruit and nut crops in 1994 (USDA)
explaining the high concentration of farms in the Pacific and Northeast regions. Land in produce
represented 20 percent of organic certified acreage but only three percent of total US cropland in
1995 (Table 3). Wheat and soybeans are two of the most important crops for organic and total
US agriculture and are grown in the same regions (Anton Dunn, 1997). Corn is much less
important for organic agriculture than for the whole of US agriculture which explains the
relatively small organic acreage in the Corn Belt.
Registered Organic Agriculture as a Subsector of California Agriculture
California state law requires all producers marketing their commodities as organic to
register with the California Department of Food and Agriculture Organic Program. The registra-
tion system, mandated by the California Organic Foods Act of 1990 (COFA) was implemented in
1992. Registration procedures provide data on organic agriculture that is not available for the
rest of the country—most notably for gross sales. In California, certification is separate from
registration and is not a requirement of COFA. Therefore, certified organic growers are a subset
of registered organic growers.
One important question in organic agriculture is whether organic farms have lower
incomes than conventional farms. Sales information from registration forms in California along

11
with Census of Agriculture statistics make possible comparison of income distribution for organic
farms in California, all farms in California and all US farms for 1992. Classifying farms in size
groups based on the total value of their annual gross sales reveals that there was a much higher
proportion of organic farms with gross sales under $10,000 (64 percent) than for all farms in
California (48 percent) or on a national basis (47 percent) (Table 4). At the other end of the
spectrum, only two percent of organic farms grossed more than $500,000 compared to nine
percent in California and three percent nationwide.
Because of the high concentration of produce farms in California’s organic industry, it is
perhaps more instructive to limit the comparisons of income distributions to these farms. In point
of fact, produce generated 95 percent of the total value of organic production from approximately
80 percent of the registered acreage and 95 percent of growers in 1994 (Tourte and Klonsky).
It turns out that the income distribution for organic produce farms is almost identical to
the distribution for all organic farms in California. However, income distributions for produce
farms in California and the US show fewer small farms and more large farms than the distributions
for all farms. Consequently, when looking only at produce farms the differences between the
income distributions of California organic farms and all farms, both for California and the US, are
even more dramatic.
12
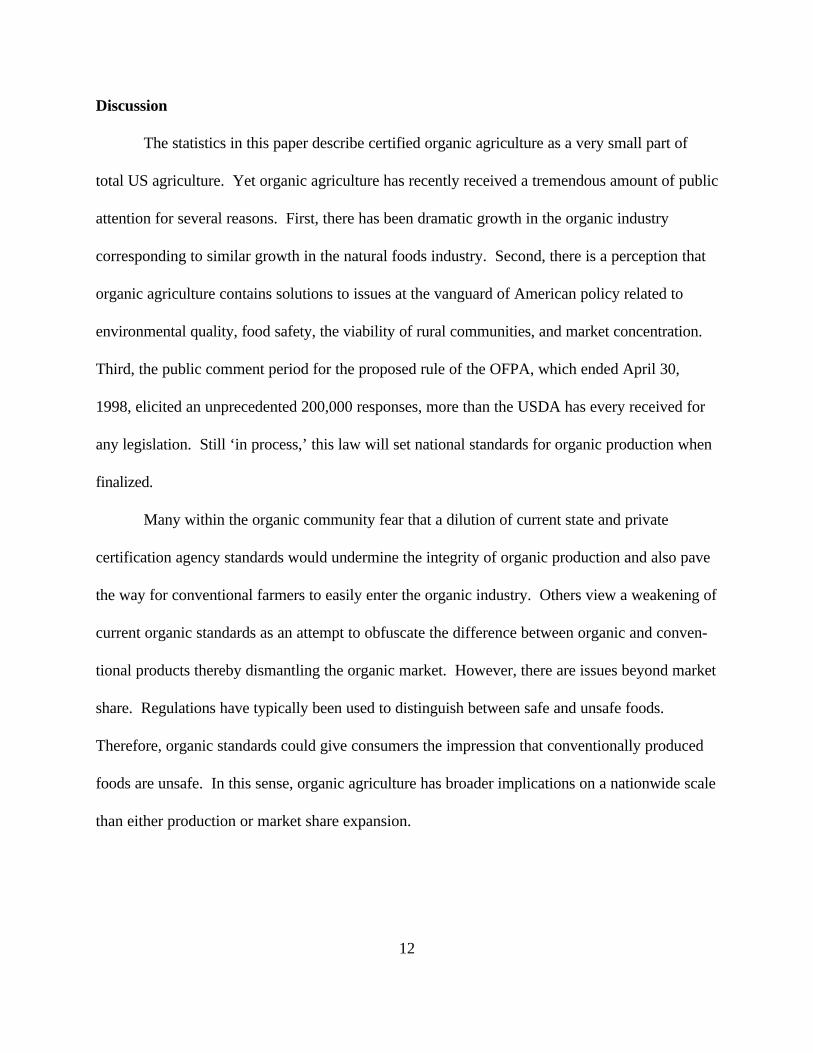
Discussion
The statistics in this paper describe certified organic agriculture as a very small part of
total US agriculture. Yet organic agriculture has recently received a tremendous amount of public
attention for several reasons. First, there has been dramatic growth in the organic industry
corresponding to similar growth in the natural foods industry. Second, there is a perception that
organic agriculture contains solutions to issues at the vanguard of American policy related to
environmental quality, food safety, the viability of rural communities, and market concentration.
Third, the public comment period for the proposed rule of the OFPA, which ended April 30,
1998, elicited an unprecedented 200,000 responses, more than the USDA has every received for
any legislation. Still ‘in process,’ this law will set national standards for organic production when
finalized.
Many within the organic community fear that a dilution of current state and private
certification agency standards would undermine the integrity of organic production and also pave
the way for conventional farmers to easily enter the organic industry. Others view a weakening of
current organic standards as an attempt to obfuscate the difference between organic and conven-
tional products thereby dismantling the organic market. However, there are issues beyond market
share. Regulations have typically been used to distinguish between safe and unsafe foods.
Therefore, organic standards could give consumers the impression that conventionally produced
foods are unsafe. In this sense, organic agriculture has broader implications on a nationwide scale
than either production or market share expansion.

13
References
Anton Dunn, J. Certified Organic Production in the United States: Half a Decade of Growth.
Wind Gap PA: AgriSystems International, 1997
Anton Dunn, J. Organic Food and Fiber: An Analysis of 1994 Certified Production in the United
States. Washington DC: USDA, 1995.
Balfour, E. The Living Soil. London UK: Faber and Faber, 1943.
California Certified Organic Farmers . CCOF Certification Handbook. Santa Cruz CA: California
Certified Organic Farmers, 1996.
Carlson, R. Silent Spring. Greenwich CT: Fawcett Publications, 1962.
Community Alliance with Family Farmers. National Organic Directory. Davis CA: Community
Alliance with Family Farmers, 1998.
Howard, A. An Agricultural Testament. London UK: Oxford University Press, 1943.
Klonsky et al., 1992- . Production Practices and Sample Costs for Organic… (Series detailing
production inputs and costs of specific crops and locations). Department of Agricultural
and Resource Economics. University of California Cooperative Extension. Davis,
California.
Lampkin, N. “Organic Farming: Sustainable Agriculture in Practice.” The Economics of Organic
Farming. N.H. Lampkin and S. Padel, eds. Wallingford UK: CAB International,1994.
Organic Farming Research Foundation. National Organic Certifiers Directory. Santa Cruz CA:
Organic Farming Research Foundation, 1995 and 1997.

14
Tourte, L. and K. Klonsky. Statistical Review of California’s Organic Agriculture - 1992-95.
Davis CA: Agricultural Issues Center, University of California, 1998.
Van Horn, M. Compost Production and Utilization: A Grower’s Guide. Oakland CA: University
of California Division of Agriculture and Natural Resources, 1995.
Youngberg, G., N. Schaller and K. Merrigan. “The Sustainable Agriculture Policy Agenda in the
United States: Politics and Prospects”. Food for the Future. P. Allen, ed. New York: John
Wiley and Sons, 1993.
15
Table 1. Certified Organic Agriculture as a subsector of US Agriculture, 1991 – 1995
US Agriculture1 Certified Organic Agriculture2
YearNumber of
FarmsLand inFarms
AverageFarm Size Croplanda
Numberof Farms
Land inFarms
AverageFarm Size Cropland
1,000 1,000 acres Acres/farm1,000 acres Percent Number Acres Acres/farm Acres Percent
1991 2,117 981,736 464 337,000 (34) 2,753 479,350 174 N/A N/A
1992 2,108 978,503 464 337,000 (34) 3,587 935,450 261 403,400 (43)
1993 2,083 976,463 469 330,000 (34) 3,536 955,650 270 363,800 (49)
1994 2,065 973,403 471 339,000 (35) 4,060 1,001,450 247 556,750 (56)
1995 2,063 972,253 469 332,000 (34) 4,856 914,800 188 638,500 (70)a/ Numbers in parentheses are cropland as a percentage of land in farms.Sources:1. U.S. Department of Commerce2. Anton Dunn
Table 2. Regional Distribution of Farms and Acreage for US Agriculture and the Organic Subsector,1995
Region U.S. Agriculture Certified Organic Agriculture1992 1992 1995 1995 1995
Farms1 Cropland1 Cropland2 Farms3 Cropland4
Percent of total
Appalachia 15 5 6 9 2
Corn Belt 23 27 25 10 11
Delta 5 5 5 1 1
Island <1 <1 <1 <1 <1
Lake States 11 11 11 10 7
Mountain 5 8 8 9 25
Northeast 7 4 3 17 5
Northern Plains 10 23 24 6 25
Pacific 7 5 4 28 12
South East 6 3 3 4 1
Southern Plains 10 9 10 5 11
Total 100 100 100 100 100Sources: 1. 1992 Census of Agriculture2. Statistical Abstract of the United States 19973. Organic Farming Research Foundation4. Anton Dunn

16
Table 3. Crop Acreage for Selected Crops – US Agriculture and the Organic Subsector, 1995
United States1 Certified Organic2
1000 acres % Total 1000 Acres % Total
Corn 71,826 25 33 6
Wheat 62,712 20 96 18
Hay 59,679 19 84 16
Soybeans 57,347 19 47 9
Cotton 12,783 4 33 6
Barley 6,753 2 17 3
Rice 2,833 1 8 2
Rye 381 <1 3 1
Sunflower 2,486 1 14 3
Vegetables 3,405 1 62 12
Orchards 3,685 2 44 8
Other 24,733 8 36 7
Total Cropland 308,623 100 536 100Sources: 1. NASS.2. Anton Dunn
Table 4. Economic Class Distribution of Registered Organic Farms in California, Organic ProduceFarms in CA, Produce Farms in CA and the US, All US Farms – 1992
Economic class(Gross Value of Sales)
California Organic Farms3
US Farms1 California Farms2 Registered Certified
All Farms Produce All Farms Produce All Farms Produce All Farms Produce
Percent of total
Less than $10,000 47 38 48 33 64 66 41 44
$10,000 - $49,999 26 28 12 15 20 19 30 29
$50,000 - $99,999 10 11 17 23 6 6 11 11
$100,000 - $249,999 11 12 9 12 5 4 9 8
$250,000 – $499,999 4 6 5 6 3 3 5 5
$500,00 or more 3 6 9 11 2 2 4 3
Total 100 100 100 100 100 100 100 100Sources:1.1992 Census of Agriculture, United States2. 1992 Census of Agriculture, California3. Tourte and Klonsky

Consumer Demand for Organic Foods
Gary D. Thompson
Department of Agricultural & Resource Economics
University of Arizona
Tucson, AZ 85721-0023
May 1998
This paper is part of the AAEA Principal Paper session entitled “Emergence of U.S. Organic
Agriculture--Can We Compete?” to be presented at the Annual Meeting of the American
Agricultural Economics Association, Salt Lake City, UT, August 2-5, 1998.

1
Consumer Demand for Organic Foods
Demand for organic foods in the United States, Europe, and elsewhere is growing rapidly
yet market shares remain quite small. In the United States, organic food sales have grown during
the 1990’s at an annual average of 24 percent with an estimated market share at retail of 1–1.5
percent in 1996 (Raterman). In Denmark, where government subsidies and industry promotion
have lowered price premiums for organic products, market share has grown to 3–4% of the retail
food market (Michelsen). By contrast, organics account for only 0.3 percent of retail food value
in France (FAS). Although reliable estimates for Canada, Japan, and Australia do not exist,
organic market shares in these countries appear to be quite small.
The array of organic products now available and the retail channels through which they
are sold in the United States have evolved markedly over the last decade. Growth and
consolidation of natural foods supermarket chains have led to more retail sales of organic
products. Traditional supermarkets have countered in some locales by promoting organic
products to compete with natural foods supermarkets. At the same time, the array of organic
products has expanded well beyond fresh produce to include baby foods, dairy products, meats,
and prepared convenience items.
Consumer Demand Studies
Studies of consumer demand for organic products have relied almost exclusively on self-
reporting of purchase behavior and attitudes as elicited through questionnaires or interviews;
direct observation of consumer behavior at retail markets is almost nonexistent.1 This reliance on
self-reported behavior appears to result largely from the thin nature of the organic market: with
such a small market share at retail and many past purchases occurring in coops, health food
stores, and direct markets, scanner data are nonexistent. Retail sales data on individual fresh
2
produce items were nearly impossible to obtain before the advent of price lookup (PLU) codes
and even since then sales data measured by PLU’s have not been widely collected by scanner data
services.2
Weaving a coherent picture of the nature of demand for organic foods in the United States
requires comparing highly disparate industry and academic studies (see Table 1).3 The studies
included in Table 1 are not an exhaustive list but they do include most published studies during
the last decade which report information regarding demographic and socio-economic
characteristics. A striking feature of these studies is that only recently have researchers begun to
consider organic products other than fresh produce. As the array of fresh and processed organic
items continues to expand at retail, the applicability of past studies focusing on fresh produce
becomes more tenuous. Brand loyalty, in-store promotion (Reicks et al.), packaging, and
convenience affect consumer purchases of processed products more than most fresh produce
items which are minimally processed, packaged, and branded.
The geographic focus of some studies also limits their applicability. Most national studies
(Parkwood Associates, Hartman Group, The Packer) indicate that consumers in the West display
a higher propensity to consume organic products.4 Natural foods supermarkets have targeted
specific urban areas such as Phoenix and Minneapolis as sites with high demand for organic
products. The specific geographic focus of many past studies may not track national trends
accurately or reveal growing urban markets.
Many studies have targeted shoppers at specific types of retail venues such as coops
(Goldman and Clancy; Thompson and Kidwell), direct markets (Swanson and Lewis), mainstream
supermarkets (Baker and Crosbie), and natural foods supermarkets (Thompson and Kidwell;
Reicks et al.). Voluntary participation in surveys varies by where consumers were sampled

3
suggesting that non-response bias differs across studies. Also, to the extent choice of venue is
influenced by the propensity to buy organic products, sampling shoppers at specific types of
venues results in selectivity bias. Statewide and national surveys using representative samples do
not suffer such shortcomings.
Despite the hazards in comparing the studies in Table 1, some similarities and differences
regarding the economic and demographic characteristics of consumers favoring organic products
are highlighted hereafter.
Price Elasticities. Apparently no studies have employed retail purchase data—cross-
sectional, time series, or panel—to estimate own- and cross-price elasticities for organic and
conventional foods. Reicks et al. tracked sales of organic foods but report no prices. Eastwood
reported sales and prices for various types of carrots including organic but estimated no price
elasticities. Given the large size of many organic price premiums (Estes and Smith; Thompson
and Kidwell) and the small market share of organic products, estimates of consumers’
responsiveness to price changes are urgently needed.
Income. National studies generally suggest that higher income households are more likely
to purchase organic products (Parkwood Associates; FMI/PREVENTION) but there seem to be
significant exceptions. The Hartman Group notes that one segment of its sample, dubbed “True
Naturals” (7 percent of the sample), had a higher than average presence of households with
income under $25,000 (43 percent vs. a total sample percentage of 36). The Fresh Trends survey
also alludes to a slightly bimodal pattern in purchase history or future plans to buy organic: the
under $25,000 and over $50,000 groups were more likely to have bought organic produce (26
and 30 percent, respectively) than those in groups between $25–50,000 (22–25 percent). A few
regional and local studies provide additional insights. Misra et al. found that willingness to pay

4
(WTP) for pesticide-free produce declined in higher income groups. Baker and Crosbie tend to
corroborate the price sensitivity of higher income groups in San Jose, CA. In Tucson, AZ
propensity to shop at the natural foods supermarket rose with income, yet higher price differences
between organic and conventional produce reduced the likelihood of choosing organics at the
natural foods supermarket but not at the food coop (Thompson and Kidwell). Jointly these study
results seem to suggest that despite high price premiums for organic foods, higher household
incomes do not necessarily indicate higher likelihood of organic purchases. Some consumer
segments with relatively lower incomes are apparently more entrenched buyers of organic
products and they tend to have shopped for organics at retail outlets other than mainstream
supermarkets (Hartman Group).
Store Effects. Consumers’ choice of where to shop is apparently influenced by their
disposition to buy organic foods. Hence, sampling consumers at particular types of retail venues
is liable to result in self-selection by consumers. Hartman Group’s study reveals that only 13
percent of the sample had ever shopped at a health food store whereas 41 percent of the “True
Naturals” had done so. Reicks et al. found significant differences in the relationship between
demographic variables and organic purchase behavior in shoppers at upscale stores but not in
those at discount stores.5 Thompson and Kidwell also encountered significant differences in
behavior across stores: organic and conventional price differences were statistically significant in
explaining the choice of organic produce at a natural foods supermarket but not at a cooperative.
Byrne et al. (1994) determined that jointly demographic variables explain choice of supermarkets
offering residue-free produce. These diverse findings suggest that store choice is a critical
variable in explaining purchases of organic foods so long as organic products persist in not being
regularly available in the majority of mainstream supermarkets.
5
Age. The Hartman Group found that the consumer segment with the highest propensity
to purchase organics, “True Naturals,” contained a higher than average proportion of people forty
years and over (79 percent in the category vs. 65 percent in the entire sample). Another segment
very interested in purchasing organics but with less disposable income (the “Young Recyclers”
who account for 10 percent of the sample) displayed a higher than average proportion of
consumers under 35 years. The Fresh Trends survey tends to corroborate these differences in
purchases by age: the highest percentages of consumers having bought organic produce were
found in the 18–29 and 40–49 years age brackets whereas the age group least likely to buy is the
over 60 bracket. Whether these differences are statistically significant across age groups is not
tested in either survey. Age differences were statistically significant in only three of the regional
or local studies. Jolly found that purchasers had a lower average age, 40.9 years, than did
nonpurchasers of organic produce, 48.6 years. For Georgia consumers, Misra et al. found that
those in the 36–60 year bracket were less likely to pay for residue-free produce. Measuring age
as a continuous variable, Groff et al. obtained a negative relationship between age and consumers
having rated organic produce much better. The joint evidence suggests that the effects of age on
organic purchase behavior may be pronounced in certain segments of the population such as with
older people in the Hartman Group’s “True Naturals” or younger consumers in the “Young
Recyclers.”
Gender. National surveys suggest only small differences in purchase behavior
corresponding to gender (The Packer). The Hartman Group does characterize one segment with
potential for purchasing organics (“Affluent Healers” who represent 12 percent of the sample) as
having a higher than average presence of female heads of household. In one local study females
were more concerned about pesticide residues (Baker and Crosbie) while in Delaware they were

6
more likely to purchase organic produce even if it cost more (Byrne 1991). The limited evidence
suggests that gender per se contributes little to explaining differences in organic purchase
behavior although gender and marital status together may be important in identifying some
organic consumers.
Marital Status. The Hartman Group finds that a distinguishing feature of two segments
relates to marital status: the “True Naturals” display a high percentage of divorcees while the
“Young Recyclers” have a higher proportion of never-married persons. In contrast, the
FMI/PREVENTION’s “Healthy Eaters” group—the group with the highest percentage of
respondents willing to pay more for organic foods—had a higher percentage of married people
(66 percent) than in the total population (60 percent). No other national studies reported
information about marital status. Only one of the other studies employed information on marital
status and the effects of being married were statistically insignificant (Groff et al.). With such
sparse evidence, the effects of marital status are difficult to assess but research on single-headed
households may be warranted.
Education. The effects of educational attainment on organic purchase behavior have been
measured both with continuous variables for years of schooling and with categorical variables.
The national evidence suggests positive correlation between education and organic purchases.
Higher than average proportions of college graduates are found in the Hartman Group’s “True
Natural” and “Affluent Healer” segments. FMI/PREVENTION’s “Healthy Eaters” and “Trusting
Nutritional Converts” segments also contain higher than average percentages of college graduates
(42 and 37 percent, respectively, vs. 32 percent in the total sample). At Alaskan direct markets,
buyers of organic produce tended to be more educated (Swanson and Lewis) but in California
there was no statistical difference in education levels between buyers and nonbuyers of organic
7
produce (Jolly). Frequency of organic purchases was not associated statistically with educational
levels among coop patrons in New York (Goldman and Clancy). In the studies distinguishing
graduate study from undergraduate study, however, higher educational attainment lowers the
probability of choosing organic products (Thompson and Kidwell) or of considering organic
produce better (Byrne et al. 1991; Groff et al.). Using a dummy variable for having had either
college or post-graduate education, Misra et al. found the presence of college education lowers
the likelihood of being willing to pay more for pesticide-free produce. These conflicting results
regarding the effects of educational attainment on organic purchase behavior underscore the
importance of how education is measured. Post-graduate college education may be associated
with a lower propensity to buy organic foods but further investigation at the national level is
needed.
Household Size. Household size and, more specifically, the presence and age of children
is one of the least investigated demographic characteristics. The only national survey explicitly
including presence of children is Fresh Trends. Differences in purchases of organic produce vary
only slightly given the presence of children 18 years or younger: 25 percent of those with vs. 27
percent of those without children. Household size did not differ among purchasers of organics in
Alaska (Swanson and Lewis). Dummy variables for the presence of children had no statistically
significant effects in the Delaware studies (Groff et al., Byrne et al. 1994). Willingness to buy
organic produce even if it had sensory defects did increase with household size in Georgia
(Huang). Thompson and Kidwell found the probability of choosing organic produce increased
with the number of children in the household. None of the foregoing studies reported the age of
children. Given that the market share of organic baby food is 2.5 percent (Harris), apparently
larger than the share of all organic foods in the United States, future studies should pay attention
8
to the ages of children. The potential for habit formation should be investigated because parents
raising babies on organic baby food may buy other organic foods as their children grow.
Conclusions
Although a quarter of U.S. consumers apparently have purchased organic foods (The
Packer, FMI/PREVENTION), organic market share at retail remains quite small. Attitudes,
motives, and willingness-to-pay for organic products have been measured but apparently no retail
data have been available to estimate own-price, cross-price, and income elasticities. While high
retail price premiums for organic foods persist, elasticity estimates appear to be critically
important for gauging how the U.S. market for organic food may grow in the future.
Demographic variables such as age, marital status, number and age of children, and
educational attainment may be important variables in explaining and predicting consumer demand
for organic products. Estimates of habit persistence linked to age and household composition
may also be important for measuring the potential growth of organic foods.
Accounting for where foods are purchased is likely to be important in understanding
where potential growth in organic foods may occur. The emergence of natural foods
supermarkets demonstrates how new types of retail outlets can promote organic products and
change consumers’ buying habits. Because households buy with varying degrees of frequency at a
variety of retail outlets—mainstream and natural foods supermarkets, club stores, health food
stores, food coops, gourmet stores, etc.—analysts may want to model the effects of store choice
and frequency of visits on organic product choices. Scanner data linked with consumer panels
may facilitate this avenue of research.
With over 40 percent of retail food expenditures made on food away from home, another
9
potentially important area of investigation will be how household decisions to purchase food away
from home can affect the demand for organic products. Non-traditional, perhaps proprietary,
data sources may be required to estimate the demand for organic foods as a component of the
demand for food away from home. If retail data are not readily available, food service purveyors
and fresh produce consolidators may be a source of data for indirect measurement of demand for
fresh and processed organic foods.

10
Footnotes
Gary D. Thompson, Associate Professor, Department of Agricultural and Resource Economics,
University of Arizona, Tucson, AZ 85721-0023, Tel. 520-621-6249, Fax. 520-621-6250, e-
mail: [email protected].
1 A.C. Nielsen has announced collaboration with Spence Information Systems to collect scanner
data (SCANTRAC:SPINS Natural Track ) from a statistically representative sample of
supermarkets in the United States with about 40 product categories.
2 Eastwood provides an extensive explanation of PLU’s and documents how PLU and scanner
data may be used to track fresh produce sales. With the emergence of fresh processed products
such as bagged salads, carrots, and other vegetables, bar codes are available for scanning some
fresh produce items.
3 A number of studies of European countries were not included in this review because of space
limitations and difficulties in comparing results across countries in which the structure of retail
channels varies significantly as do consumer shopping behavior and expenditures on food.
4 One national study found, however, that 37 percent of consumers in the East purchase organic
produce versus 29 percent in the West (FMI/PREVENTION).
5 Statistically significant differences in the effects of age at the upscale stores also differed across
stores with intensive point of purchase advertising vs. those without intensive advertising,
suggesting that in-store variables affect purchase behavior as well.
11
References
Baker, G. A. and P. J. Crosbie. “Measuring food Safety Preferences: Identifying Consumer
Segments,” J. Agr. and Resource Econ. 18 (December 1993):277–287.
Byrne, P. J., U. C. Toensmeyer, C. L. German, and H. R. Muller. “Analysis of Consumer
Attitudes Toward Organic Produce and Purchase Likelihood,” J. Food Dist. Res. 22(June
1991):49–62.
Byrne, P. J., J. R. Bacon, and U. C. Toensmeyer. “Pesticide Residue Concerns and Shopping
Location Likelihood,” Agribus. 10(1994):491–501.
Eastwood, D. B. “Information Technology and Fresh Produce: A Case Study Using Store Level
Scan Data to Analyze Sales,” Working Paper 97-04, The Retail Food Industry Center,
University of Minnesota, July 1997.
Estes, E. A. and V. K. Smith. “Price, Quality, and Pesticide Related Health Risk Considerations
in Fruit and Vegetable Purchases: An Hedonic Analysis of Tucson, Arizona
Supermarkets,” J. Food Dist. Res. 27(October 1996):59–76.
Food Marketing Institute and PREVENTION Magazine. “Shopping for Health 1997: Balancing
Convenience, Nutrition and Taste,” prepared by Princeton Survey Research Associates,
Princeton, NJ, Washington, DC and Emmaus, PA: FMI/PREVENTION, 1997
Foreign Agricultural Service. “Organic Foods in France Update,” FAS Online, Attache Query
Detail, 12/23/96. http://ffas.usda.gov/scriptsw/AttacheRep/attache_ dout.
idc?Rep_ID=10005942.0.
Goldman, B. J. and K. L. Clancy. “A Survey of Organic Produce Purchases and Related
Attitudes of Food Cooperative Shoppers,” Am. J. Alternative Agr. 6(1991):89–96.
Groff, A. J., C. R. Kreider, and U. C. Toensmeyer. “Analysis of the Delaware Market for

12
Organically Grown Produce,” J. of Food Dist. Res. 24(February 1993):118–125.
Harris, J. M. “Consumers Pay a Premium for Organic Baby Foods,” Food Review May-August
1997:13–16.
Hartman Group, “Food and the Environment: A Consumer’s Perspective, Phase I,” Bellevue,
WA: The Hartman Group, Summer 1996.
Huang, C. L. “Consumer Preferences and Attitudes Towards Organically Grown Produce,”
European Rev. Agr. Econ. 23(1996):331–342.
Jolly, D. A. “Determinants of Organic Horticultural Products Consumption Based on a Sample of
California Consumers,” Acta Horticulturae 295(1991):141–148.
Michelsen, J. “Organic Farmers and Conventional Distribution Systems: The Recent Expansion
of the Organic Food Market in Denmark" Am. J. Alternative Agr. 11(1996):18–24.
Misra, S. K., C. L. Hang, and S. L. Ott. “Consumer Willingness to Pay for Pesticide-Free Fresh
Produce,” Western J. Agr. Econ. 16(December 1991):218–227.
The Packer. Fresh Trends 1998. Overland Park, KS: Vance Publishing, 1998.
Parkwood Research Associates. “Shopping for Organic: Food Shoppers’ View on Organically
Grown Produce, Summary Report,” Emmaus, PA: Rodale Press, March 1994.
Raterman, K. “Market Overview ’96: Contradictions Propel Industry Growth,” Natural Foods
Merchandiser, 28(June 1997):1,26–30.
Reicks, M., P. Splett, and A. Fishman. “Shelf Labeling of Organic Foods: Effects on Customer
Perceptions and Sales,” Working Paper 97-03, The Retail Food Industry Center,
University of Minnesota, St. Paul, MN, June 1997.
Swanson, R. B. and C.E. Lewis. “Alaskan Direct-Market Consumers: Perception of Organic
Produce,” Home Econ. Research J. 22(December 1993):138–155.

13
Thompson, G. D. and J. Kidwell. “Explaining the Choice of Organic Produce: Cosmetic Defects,
Prices, and Consumer Preferences,” Am. J. Agr. Econ. forthcoming May 1998.

Table 1. Selected Characteristics of Studies of Organic Products.
Survey Organic Geographic Scope Purpose of Study Survey Method Sample AuthorsYear Products Size1
1987 Produce 3 Counties, CA Distinguish organic Mail 955 Jolly et al.buyers vs. nonbuyers (54%)
1988 Produce Upstate NY Measure attitudes & Randomly handed out in 350 Goldman & Clancypurchase behavior. food coop; mail return. (88%)
1989 Residue-free Statewide, GA Explain willingness Mail 389 Misra et al.; HuangProduce to pay. (78%)
1990 Produce Statewide, DE Explain attitudes & Mail 753 Byrne et al.; purchase behavior. (12%) Groff et al.
1992 Apples San Jose, CA Identify consumer seg- Interviewed entering 160 Baker & Crosbiements and preferences. 2 Safeway stores. (?)
1992 ? Produce 4 sites, Alaska Distinguish organic Mail survey of direct 417 Swanson & Lewisbuyers vs. nonbuyers. market customers. (74%)
1994 Produce National Poll attitudes & Telephone 1,000 Parkwood Researchwillingness to pay. (?) Associates
1994 Produce Tucson, AZ Explain choice of Questionnaire in coop & 360 Thompson & Kidwellorganic produce. natural food supermarket. (?)
1996 14 Organic Minneapolis/ Measure impacts of Customer-intercept 400 Reicks et al.Food Items St.Paul, MN point-of-purchase interviews in upscale & (?)
advertising discount supermarkets.
1996 Earth sustain- National Identify consumer Telephone sample of 1,079 Hartman Groupable/ organics segments & attitudes. national panel (250,000). (37%)2
1997 Produce & National Identify consumer Stratified random 1,005 FMI/PREVENTIONOther segments & attitudes. telephone sample. (?)
1997 Produce National Poll attitudes & Telephone sample of 1,000 The Packerbehavior. national panel (400,000). (?)
1 Response rate to survey in parentheses, e.g. 54 percent of 1,769 questionnaires resulted in 955 responses.
2 1,879 full or partial responses (65%) were received initially but subsequent cleaning of data reduced the sample size.

Implications of Organic Certification for Market Structure and Trade
Luanne Lohr
Dept. of Agricultural and Applied EconomicsUniversity of Georgia
Athens, GA 30602-7509706-542-0847
Prepared for “Emergence of U.S. Organic Agriculture - Can We Compete?”, a principal papersession at the American Agricultural Economics Association annual meeting in Salt Lake City,Utah, August 2-5, 1998.

1
Organic food constitutes a product category that is growing worldwide. One estimate
projects growth for “bioproducts” at 5 percent (Bio-Fair), reaching a high of 5 to 10 percent
market share in some developed countries by 2000 (UNCTAD). Segger suggests world trade in
organic products will reach $100 billion by 2006. Purchasers in both developed and developing
countries tend to be urban, well-educated, health and environment conscious consumers (Chander
and Tewari; UNCTAD; CCICED).
Certification of organic products serves three functions. First, it assures consumers that a
product that is not observably different from nonorganic food was grown, processed and
packaged according to rules that limit or ban synthetic inputs and protect the environment.
Second, it assures producers that unscrupulous use of the term ‘organic’ does not defraud them of
price premiums and market share that can be earned from certified foods. Third, it makes the
market more efficient by reducing information asymmetry along the marketing channel from
producer to consumer.
To fulfill these functions, certification must be a credible process. Michaud, Redman and
Dalby described the process as setting standards, verifying that standards are followed by
inspecting the facility and operating records, and approving the producer or processor. Approval
confers the license to display the certifier’s label on the product. The label conveys information
about the production process to intermediaries and consumers. Organic price premiums will only
be paid when label confidence exists. Many certification programs are organized within political
boundaries, and a single certifier often dominates a regional or national market.
With expansion of markets, distance and time increase information asymmetry about
products. The evolution of multiple labels with differing certification requirements gave rise to

2
accreditation schemes. While certifiers verify that their standards are met by the producers and
processors, accreditors check that minimum requirements are incorporated in the standards
certifiers use. Certifiers may promote both economic and social goals in setting and verifying
standards; accreditors insure market efficiency and credibility (Michaud, Redman and Dalby). For
this reason, accreditors are typically national or transnational (European Union) government
entities.
Formal acceptance of a certifier’s standards by an accreditor permits free entry into
markets overseen by the accreditor. Lack of equivalence of standards across accreditors hinders
market access and substantially increase transactions costs. Currently, equivalence is not
universal. Even if equivalence is legally recognized, there is no guarantee that consumers will
accept foreign labels; however, harmonization of U.S. standards with those in major market is a
necessary step toward acceptance.
Scope of International Markets
The United States is by far the largest single-country market for organic products, with
$4.5 billion in sales projected for 1997 (Retzloff). The 1997 organic food market in the European
Union (EU) is estimated to be worth $4.5 billion, and that of Japan $1.7 billion (Segger; Seki).
Annual growth rates of 25 to 30 percent have been experienced in the EU (Segger) and in the
United States (Retzloff) for over five years. Based on these figures, Segger projects the EU
market will reach $58 billion and the U.S. market $47 billion by 2006. The Japanese market for
organic foods is projected at $2.6 billion by 2000 (Mergentime).
Table 1 shows the extent of selected organic markets outside the United States. The list is
necessarily incomplete, since few governments keep statistics on sales of organic foods. Even

3
with industry and USDA Foreign Agricultural Service (FAS) estimates, it is difficult to develop an
exact picture of the entire world situation.
Markets for U.S. exports include direct consumption and re-export of raw commodities.
In addition, because set percentages of organic ingredients are required for certified processed
foods, U.S. commodities may be components for foods processed in foreign countries that are
then consumed or exported elsewhere.
The main markets for U.S. organics include high income countries in Northern Europe and
Australasia, Canada and China, which has an elite group of high income consumers who favor
organics. Many developed and developing countries that produce and consume organic foods
were excluded from Table 1 due to their small size, low income, or emphasis on value-added
export and tourism markets. Some developing countries such as Mexico and Singapore have
nascent health food markets, in which organics may play a role.
Within Europe, Germany, France, the United Kingdom and the Netherlands have the
largest organic retail sales. Denmark, Sweden and Switzerland have small populations, but
organic food is a relatively large share of total food sales. Both these countries aim to increase
domestic organic production, in Sweden’s case to 10 percent of acreage and in Denmark’s to 100
percent (UNCTAD). Consumer commitment to organics is strong throughout the EU, with 20 to
38 percent regularly or occasionally purchasing organic foods. Retail price premiums in Europe
average from 10 to 50 percent above conventional products.
Less information is available about Australia and Canada, where organics currently
compose 0.5 to 1 percent of the retail market. Both countries are active in exporting organics,
Australia to Asia and Canada to the United States and Europe. Domestic consumption of organic

4
products is relatively low. Ahmed suggests the Australian market could grow to $571 million by
2000, while LaFond projects the value of Canadian organics to reach $145 million by 2006. Price
premiums of 10 to 30 percent are typical. Yet, with 20 to 30 percent annual sales increases in the
United States, EU and Japan projected for the next five years, Australia and Canada will focus on
exports.
Among Asian countries, Japan ($1.7 billion) and China ($1.2 billion) offer large retail
markets. Table 1 lists two sets of figures for Japan due to large discrepancies in estimates. Price
premiums in these countries other are similar to those in the EU, ranging from 10 to 50 percent.
Market participation rates are also similar, between 27 percent and 36 percent. Interest in organic
foods in Hong Kong and Taiwan is expected to increase as Chinese awareness of the market
develops. Premiums in Taiwan, Hong Kong and Singapore range from 200 to 500 percent, due
to limited domestic production.
Two factors affect interpretation of these statistics. First, Japan and China have
successive categories of organic or ecological food, some of which permit chemical use on
certified food. Second, domestic organic distribution in Asia is heavily dependent on direct farm
to consumer sales, typically through memberships. Thus, the extent of the organic market open to
import competition may be more limited than suggested by the figures for these countries.
These data are only a sample of the countries who are developing organic markets. A
review of the USDA FAS Trade Leads from November 1995 through May 1998 reveals market
offers for a range of organic products. In this period, there were more than 50 postings for juice,
pulses, frozen and fresh fruit and grain from over a dozen different countries. The Republic of
Korea, which has an organic market valued at $120 million and increasing at 30 to 40 percent per

5
year (UNCTAD), posted several of these. The market figures presented highlight the importance
of obtaining equivalence to access organic markets.
Equivalence and Market Access
Most organic certification programs began as grass-roots movements (Gadhia and Gadhia;
Michaud, Redman and Dalby). International accreditation and certification standards co-evolved
with market expansion. There are now both governmental and nongovernmental certifiers and
accreditors, but only governmental accreditors currently have legal standing to appeal trade
problems before the World Trade Organization (WTO) (Vaupel and Commins).
The structure of certification and accreditation is evocative of market development. In
Germany, which is the largest EU market, there are 50 independent control bodies and eight
farmers’ association that certify organic production (Bio-Fair). Each German Länder (state) has
authority to grant import licenses and accredit certifiers (Vaupel and Commins). Each certifier
sets its own standards and label, subject to the EU requirements designated by Council Rule (CR)
2092/91 and amendments, and to state regulations. Contrast this with Denmark, which has one
control organization operated by the national government, and consequently one major label
(Borgen). More labels may be perceived to mean more choice for consumers and producers,
although they also may generate more confusion.
Other countries are less formal in their certification and accreditation. Australia has
voluntary national standards for domestic production, which are mandatory for imports destined
for re-exportation (Vaupel and Commins). Taiwan has a trial program for domestic producers,
with no requirements for imports (Perng). China’s and Japan’s standards are state-supported, but

6
certification lags requests and confusion arises from the permitting of chemical use under organic
designations (CCICED; Ahmed).
Organic trade is operating at multiple levels of standards. Within the legal system that is
overseen by the WTO, national standards are required to adjudicate disputes, since only nations
have standing before the WTO. The WTO refers to the Codex Alimentarius (Codex) and,
increasingly, to the International Organization of Standardization (ISO) for the international
principles that govern all national regulations (Vaupel and Commins). Codex has draft guidelines
that require governments to set national standards and accredit certification programs, but is
examining whether other means of proving equivalence in a trade dispute might be acceptable.
Governments are usually not motivated to adopt national standards until domestic and
international commerce in organics become great enough to justify regulation for consumer and
producer protection. In Europe, many national standards evolved prior to CR 2092/91 or were
modified later to cover areas not regulated by the EU such as livestock and wild products
production. For many countries, particularly in the developing world, international market
opportunities have outdistanced domestic market growth (UNCTAD). While organic production
is expanding only for export and very small domestic markets, it is uneconomic to set domestic
controls.
Independent accrediting and certifying bodies have filled this void. The International
Federal of Organic Agriculture Movements (IFOAM), representing over 500 organizations in
more than 100 countries, including 140 certification entities, is the most widely recognized of
these (Vaupel and Commins, UNCTAD, Gadhia and Gadhia). The size and geographical extent
of membership has enabled IFOAM to influence development of national standards in Brazil,

7
China, Egypt, and Argentina (UNCTAD). Accreditation through IFOAM does not automatically
confer equivalence with national standards for import purposes. However, in recognition of the
harmonizing role played by the IFOAM certification criteria and accreditation service, several EU
national authorities use these standards for granting import licenses (Vaupel and Commins).
Equivalence is granted only between accreditors who have legal standing in trade matters.
The EU importation requirements probably will have the greatest impact on U.S. organic trade
initially. Whether the foreign importer is from an approved or a non-approved country, an EU-
based certified importer must be used, and a transaction certificate stipulating the type of
equivalence must be filed (Michaud, Redman and Dalby). Statutory approval, which is
permanent, is granted only to countries who apply to the EU for approval of their organic
standards and accreditation, a process that takes about three years. As of March 1997, five
countries had been approved (Vaupel and Commins). A recent amendment to CR 2092/91
permits member states to request statutory approval for third country certifiers .
The EU states independently authorize imports from non-approved countries. The EU-
based importer verifies the certification system used for the product and documents consistency in
its application, and the national control authority determines equivalence on a case-by-case basis
(Michaud, Redman and Dalby). Since the determination is subject to national standards and the
transaction does not permit direct negotiation by the exporter, costs of importation can vary
widely and exporters need to be selective in choosing a point of entry. The Netherlands, which
accounted for 28 percent of the 459 organic import authorizations issued in 1995 is a gateway
country to organic markets in the EU (Harst-Collaris and Scandurra).

8
Vaupel and Commins report that more recently, emphasis has shifted away from the
specific product’s equivalence and toward the certifier’s equivalence. This improves the
competitive situation for international accreditors and certifiers such as IFOAM as familiarity
from repeated transactions will reduce the need for strict scrutiny, and thus reduce costs.
Nongovernmental certification of a final product containing or composed of imported
ingredients may entail additional requirements for which equivalence must be proven. In these
cases, equivalence may be established by re-certification and certification transference (Vaupel
and Commins). Re-certification is granted on a case-by-case basis according to a comparison of
the inspection and certification documents of the imported product with the domestic certifier’s
standards. Transference occurs when the end-product certifier approves the certifier of the
exported product, similar to an accreditation. IFOAM criteria are routinely used as the basis for
transference.
Issues for the United States
The United States is likely to attempt to establish reciprocal third-country approval with
the EU and other countries once national organic standards are implemented here. The U.S.
standards as originally proposed were consistent with CR 2092/91 and Codex (Schmidt and
Haccius). Changes in the interim prompted over 225,000 responses during the public comment
period by U.S. farmers, processors, agricultural interests and consumers objecting to portions that
are incompatible with EU and IFOAM standards. Aspects in the latest proposed regulations such
confined animal feeding could block reciprocal approval as these contradict most other proposed
and existing country standards. While trade would still be possible via transference, re-
9
certification and import authorizations, the additional cost could be substantial, not to mention
consumer avoidance of organic products certified under USDA standards.
This raises the question of how new innovations will be introduced to organic farming
systems without violating standards, or more to the point, how standards can evolve to take
account of new innovations. Given the complexity of motivations for producing and purchasing
organic products, changes to standards necessarily must involve public input about what is
acceptable. In this regard, consumers tend to rely more on producers than on scientists to form
their opinions. Scientists must realize that organic status of innovations will continue to be
defined by producers and consumers, and codified by certifying and accrediting organizations.
Consumers tend to choose a single label that for them signifies the attributes they are
purchasing when they “buy organic,” even when more than one label is available (Vaupel and
Commins; Michaud, Redman and Dalby; Alvensleben; Ekelund and Fröman). Getting access to
an international market is only the first step in gaining market share. The United States should
provide export promotion support for organic products to help generate confidence in U.S. labels.
Care should be taken during the drafting of the national organic standards that U.S.
products are not disadvantaged by lower requirements. Inconsistencies with the standards of
major trading partners should be eliminated from the final rules. In an increasingly competitive
global market for organics, the United States must insure that its organic food products are held
to the highest quality requirements to win market share.

10
References
FAS Online reports are at http://ffas.usda.gov. Search Attache Reports by AGR Nr.
Achilles, D. “A Guide to Exporting Organic Food and Beverage Products to Germany- The
Organic Market.” FAS Online, 4/8/98. AGR Nr. GM8020. Bonn:USDA-FAS, 1998.
Ahmed, S. The Production and Marketing of Organic Produce in Japan: Practice, Problems
and Potential. No. 40 Envir. Series. Honolulu: East-West Center, 1995.
Alvensleben, R. v. “Determinants of the Demand for Organic Food in Germany.” Acta Hort.
203(1987):235-242.
Bio-Fair. International Organic Market Study. C. Haest, ed. San Jose, Costa Rica: Camar de
Comercio de Costa Rica, 1996.
Borgen, M. EcoGuide 1995/96. Århus C, Denmark: The Organic Service Centre, 1995.
Chandar, M., and H C. Tewari. “Consumer Response to Organic Production: A Case Study of
Emerging Trends in Developing Countries.” In W. Lockeretz, ed., Agricultural
Production and Nutrition. Medford, MA: Tufts Univ., 1997.
China Council for International Cooperation on Environment and Development (CCICED).
China’s Green Food Development and Environmental Protection. Beijing: National
Environmental Protection Agency, 1996.
Christie, R. “Organic Grains and Oil Seeds.” Agri-Food Canada Biweekly Bulletin. 8(Sept. 15,
1995).
Conacher, J., and A. Conacher. “Update on Organic Farming and Development of the Organic
Industry in Australia.” Biol. Agric. Hort. 8(1991):1-16.

11
Ekelund, L. and E. Fröman. Consumer Attitudes Toward Vegetables - A Study of Conventional
and Organic Products. (In Swedish) Report 60. Swedish Univ. Agric. Sci., Dept. of Hort.
Sci., Alnarp, Sweden. 1991.
Gadhia, S., and D. Gadhia. “International Movements in Organic Agriculture and Trade.” In P.
K. Thampan, ed., Organic Agriculture. Cochin, Karala, India: Peekay Tree Crops
Development Foundation, 1995.
GIRA EuroConsulting. Study of French Retail and Wholesale Market for Organic Foods.
Surrey, UK: GIRA EuroConsulting, 1997.
Harst-Collaris, T. van der, and L. G. Scandurra. “Dutch Organic Food Market Offers All-Natural
Potential for U.S. Firms.” AgExporter. 9(1997):10-15.
Hudson, R. B. The Domestic Market for Australian Organic Produce: An Update. Rural
Industries Research and Development Corp. Canberra, Australia: Hassall and Assoc. Pty
Ltd., 1996.
Japan External Trade Organization (JETRO). Your Market in Japan - Organic Vegetables. No.
100. Tokyo:JETRO, 1994.
Krucsay, W. “Organic Agriculture and Food in Austria.” FAS Online, 11/6/96. AGR Nr.
AU6055. Vienna: USDA-FAS, 1996.
LaFond, G. P. “Predictions for 2006.” Spokin’ Out Newsletter. Specialized Crop Production
Area, Agri-Food Innovation Fund, Saskatchewan, Canada. June 1997.
McCrea, D. “U.K. Supplies Short to Meet Booming Consumer Demand for Organic Foods.”
AgriSystems International 6(1997):6.
12
Mergentime, K. “Japan’s Blooming Organic Market.” Natural Foods Merchandiser.
http://www.nfm-online.com/nfm_backs/Sep_97/japan.html. 1997.
Michaud, M., M. Redman and J. Dalby. “Organic Certification and the Importation of Organically
Produced Foods.” In S. Wright, ed., Handbook of Organic Food Processing and
Production. London: Blackie Acad. Prof. Pub., 1994.
Myles, G. C. “The Organic Food Market in Canada.” FAS Online, 6/10/97. AGR Nr. CA7032.
Ottawa: USDA-FAS, 1997.
Perng, C. M. “Organic Food Market on Taiwan.” FAS Online, 3/20/98. AGR Nr. TW8015.
Taipei:USDA-FAS, 1998.
Produce Studies Consulting (PSC). 1998. The European Organic Food Market. Final Report to
USDA. The Hague, Netherlands:USDA, 1998.
Retzloff, M. “Current Markets and Future Trends - Chairman’s Introduction.” The Future
Agenda for Organic Trade. Proc. 5th IFOAM Intern. Conf. on Trade in Organic
Products. Tholey-Theley, Germany: IFOAM, 1997.
Schmidt, H., and M. Haccius. EEC Regulation “Organic Agriculture” - Market Access for
Third Countries and a Comparative View of Codex Alimentarius, EEC and U.S.A.
Regulations. Tholey-Theley, Germany: IFOAM, 1993.
Segger, P. “World Trade in Organic Foods: A Growing Reality.” The Future Agenda for
Organic Trade. Proc. 5th IFOAM Intern. Conf. on Trade in Organic Products. Tholey-
Theley, Germany: IFOAM, 1997.
Seki, T. “Study on Japanese Organic Food Market.” Market and Industry Services Branch,
Agriculture and Agri-Food Canada. September 1997.
13
Sidiropoulos, L., and S. Putland. “Opportunities in North Asia for Victoria’s Agricultural and
Food Industries.” Dept. of Natural Resources, Victoria, Australia. 1997.
United Nations Conference on Trade and Development (UNCTAD). Organic Production in
Developing Countries: Potential for Trade, Environmental Improvement, and Social
Development. New York: UNCTAD, 1996.
U. S. Embassy. “Market Brief - Sweden: Organic Products.” FAS Gain Report #SW8009.
Stockholm, Sweden: USDA-FAS, 1998.
Vaupel, S., and K. Commins. Guide to Regulatory Requirements for Exporting Organic Foods
into International Markets. Jamestown, ND: IOAS, 1997.
Wang, Q, C. Halbrendt, S-E. Webb. “Consumer Demand for Organic Foods in Urban China:
Evidence from Survey Data.” In W. Lockeretz, ed., Agricultural Production and
Nutrition. Medford, MA: Tufts Univ., 1997.
Wyler, A. “Swiss Organic Market.” AGR Nr. SZ8006. FAS Online, 5/27/98. Bern:USDA-
FAS, 1998.
Yuen, C. “Hong Kong Market for Organic and Healthier Foods.” FAS Online, 12/11/96. AGR
Nr. HK6117. Hong Kong:USDA-FAS, 1996.

14
Table 1. Organic Markets Outside the United States1
Approximate Organic Share of Import Share of Average Retail Country Retail Value (US$) Year2 Total Food Sales Organic Sales Price Premium Source
Austria $270 million 1997 2.5% 30% 20-30% PSC; Krucsay
Belgium $ 75 million 1997 1.0% 50% 20% PSC; Bio-Fair
Denmark $190 million 1997 < 3.0% 25% 15-40% PSC; Bio-Fair
France $508 million 1996 0.4% 10% 25-35% GIRA EuroConsulting
Germany $ 1.6 billion 1997 1.5% 60% 30% PSC; Achilles
Netherlands $230 million 1997 1.5% 60% 15-20% PSC; Harst-Collaris
Sweden $200 million 1997 2.0% 30% 15-50% PSC; U.S. Embassy
Switzerland $190 million 1996 5.0% n.a. n.a. Wyler
United $445 million 1997 2.0% 70% 0-30% PSC; McCreaKingdom
Canada $ 68 million 1995 1.0% 80% 30% Myles; Bio-Fair; Christie
Australia $ 59 million3 1995 < 0.5% n.a. 10-20% Hudson; Conacher & Conacher
China4 $ 1.2 billion 1995 6.0%3 0% 30% CCICED; Wang et al.
Hong Kong4 n.a. 1996 0.5%5 n.a. 50-300% Yuen
Japan4 $500 million6 1994 1.0%3, 6 1%6 13-40%6 JETRO; Sidiropoulos Putland $ 1.7billion 1997 n.a. n.a. 20-30% Seki
Taiwan4 n.a. 1998 1-3%5 n.a. 200-300% Perng
1 “n.a.” means data are not available.2 Year given is for retail value data, if available. If not, year given is for organic share data.3 Based on production, not retail sales.4 In this country, organic includes “low chemical.”5 Share of sales in the largest supermarket chain in the country selling both organic and conventional foods.6 Fresh produce sales only.
Emergence of U.S. Organic Agriculture - Can We Compete: Discussion
Barry KrissoffEconomic Research Service, USDA
1800 M StreetWashington DC 20036
Prepared for “Emergence of U.S. Organic Agriculture - Can We Compete?” a principal paper
session at the American Agricultural Economics Association annual meeting in Salt Lake City,
Utah, August 2-5, 1998.

1Barry Krissoff is an agricultural economist at Economic Research Service, U.S.Department of Agriculture. I appreciate the comments from my ERS colleagues Lewrene Glaser,Catherine Greene, and Ann Vandeman.
1
Emergence of U.S. Organic Agriculture - Can We Compete: Discussion
Barry Krissoff1
The theme of this session is the expansion and market competitiveness of organic
agriculture. Since there is no single definition in economics or agriculture of the terms
competitiveness or organics, let me start by offering some definitions. The National Organic
Standards Board defines organic agriculture as an ecological production management system that
promotes and enhances biodiversity, biological cycles and soil biological activity. The focus of
the definition is on ecologically compatible production systems, not on the product itself, or
allowable (or non-allowable) specific inputs.
In contrast, a discussion on markets and competitiveness focus on the product itself. In an
introductory economics textbook, competitiveness is defined as striving among a number of rivals
in a contest aimed at purchasing or selling a particular product (Bronfenbrenner et al). Firms
producing organic products compete with each other for a share of the organics market but the
arena for the “contest” is much more centered on organic relative to other natural and
conventional foods and fibers. Organic product sales are estimated to be $3.5 billion in 1996,
which is approximately a 30 percent share of the natural food market (Hartman and New Hope).
With the 1990s income growth of middle class consumers in industrialized economies, and to a
lesser extent, the rise of middle class consumers in developing economies, the demand for goods
possessing various quality attributes, often based on production systems, has grown rapidly.
Consumers, through the marketplace, have expressed demand for food products that reflect
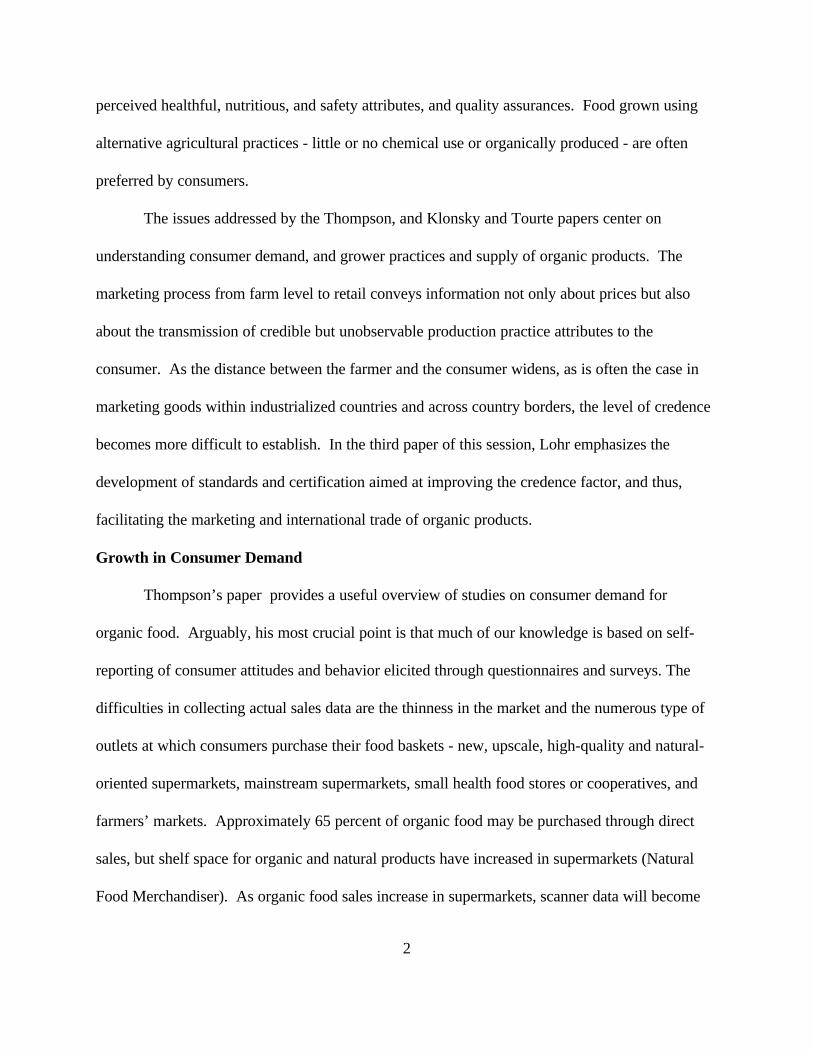
2
perceived healthful, nutritious, and safety attributes, and quality assurances. Food grown using
alternative agricultural practices - little or no chemical use or organically produced - are often
preferred by consumers.
The issues addressed by the Thompson, and Klonsky and Tourte papers center on
understanding consumer demand, and grower practices and supply of organic products. The
marketing process from farm level to retail conveys information not only about prices but also
about the transmission of credible but unobservable production practice attributes to the
consumer. As the distance between the farmer and the consumer widens, as is often the case in
marketing goods within industrialized countries and across country borders, the level of credence
becomes more difficult to establish. In the third paper of this session, Lohr emphasizes the
development of standards and certification aimed at improving the credence factor, and thus,
facilitating the marketing and international trade of organic products.
Growth in Consumer Demand
Thompson’s paper provides a useful overview of studies on consumer demand for
organic food. Arguably, his most crucial point is that much of our knowledge is based on self-
reporting of consumer attitudes and behavior elicited through questionnaires and surveys. The
difficulties in collecting actual sales data are the thinness in the market and the numerous type of
outlets at which consumers purchase their food baskets - new, upscale, high-quality and natural-
oriented supermarkets, mainstream supermarkets, small health food stores or cooperatives, and
farmers’ markets. Approximately 65 percent of organic food may be purchased through direct
sales, but shelf space for organic and natural products have increased in supermarkets (Natural
Food Merchandiser). As organic food sales increase in supermarkets, scanner data will become

3
more available, particularly for processed foods. Anton Dunn indicates that food product
manufacturing is the fastest growing segment of the market. Spence Information Services
(SPINS) and A.C. Nielsen have prepared a commercially sold report on actual organic purchases
of 12 processed product categories, which includes, among others: cold cereals; chips, pretzels,
and snacks; frozen desserts; frozen entrees, pizzas, and convenience foods; and cookies and snack
bars. Sales information on organic fresh products are more limited since fresh produce, meats,
and poultry are either not scanned or labeled as organic. As Thompson suggests, the advent of
price lookup (PLU) codes for fresh produce may mitigate this shortcoming in future years. Fresh
organic produce has the number 9 as a prefix in PLU codes.
Thompson compares and contrasts different studies with respect to their findings on
economic and demographic characteristics. As he indicates, there are a limited number of national
studies aimed at discerning price and income parameters; clearly estimates for own and cross price
elasticities with respect to conventional products and across alternative natural products are
critical for understanding potential growth of organic markets. Moreover, having limited
information on whether organic products are more likely to be purchased at higher income levels
is a limiting factor in the sector’s ability to market. Thompson also reviews the demographic
characteristics which the literature has addressed, namely: age, gender, marital status, education,
and household size. The findings over a range of regional and national studies - which often focus
on different products, geographic regions, and retail outlets - suggest younger age groups, higher
levels of education (college), and families with a larger number of children are more likely to buy
organics, but there is often mixed evidence. Again, having socioeconomic (income strata),

4
geographic (east vs west, urban vs rural), and demographic cross sectional and time series data on
actual sales across different marketing venues would provide a much stronger basis for analysis.
One public policy issue may be critical in influencing consumer demand for organic
products. Are consumers attaining the environmental and food safety attributes that they
associate with organic products? Consumer surveys indicate that consumers prefer organically
produced food because of taste, appearance, and personal health reasons and because they prefer
food without pesticide residues (Fresh Trends). Some consumers may also be concerned about
general health and environmental issues: farm worker safety, soil and water quality, and wildlife
habitat. With the 1990s expansion in organic markets, revealed preference suggests that many
consumers perceive they are receiving these attributes. Further solidification and expansion of the
domestic market may require greater transparency and assurances of the attributes.
Production and Market Structure
The paper by Klonsky and Tourte (KT) focuses on comparing organic and conventional
agricultural production practices and discusses how widespread adoption has occurred both
geographically and across commodities. Early in the paper, KT suggest that a long-term
approach with innovative production strategies and recognition of the complex biological
interactions is a necessary condition for an organic grower to be economically viable. Soil and
pest management strategies are areas in which management approaches differ significantly from
conventional growers. Based on information from the U.S. Department of Commerce and Anton
Dunn, KT indicate that the average U.S. farm size is 469 acres compared to 188 acres for the
average certified organic farm. Labor intensities in organic operated systems may partly explain
the difference in size.

5
Having time series information on the distribution of farm size and crops grown would be
helpful in understanding the structure of the organic industry. Are we seeing market behavior
developing where smaller farms sell primarily fresh produce to local grocery stores, restaurants,
and consumers; and large scale operations, which are more likely to pay fees for certification,
selling to distributors and processors competing at the national and international level? KT are
able to provide more detailed data from California. Farms that are certified as organic, not just
registered, are larger in terms of acres and sales, and seem to be more interested in certification
because of marketing requirements of handlers and processors. Smaller growers often choose not
to certify because of costly certification fees and administrative costs, and because they may
market directly.
Growth in organic sales may be very dependent on the ability of the industry to bring to
market a consistent supply of diverse food products and marketed by large scale supermarkets.
Price premia may decline as economies of scale are attained in marketing and distribution.
Increasing farm, agribusiness, and food marketing investments in alternatively produced products
suggest a responsiveness to the growing interest in organic foods. New food retailing chains,
such as Whole Foods, are expanding across the nation, and conventional retailers are adding more
natural foods product lines. Many large-scale mergers and buyouts are occurring in the natural
foods industry, including Whole Foods merging with Fresh Fields ($135 million); H.J. Heinz
Company purchasing Earth’s Best, Inc., an organic baby food producer; and Trefoil Partners II,
purchasing a controlling interest in Cascadian Farms, a Seattle-based company (Murphy). At the
same time farmers’ markets and internet sales are growing and public/private partnerships to
develop wholesale markets for small farmers are being created to encourage development in rural
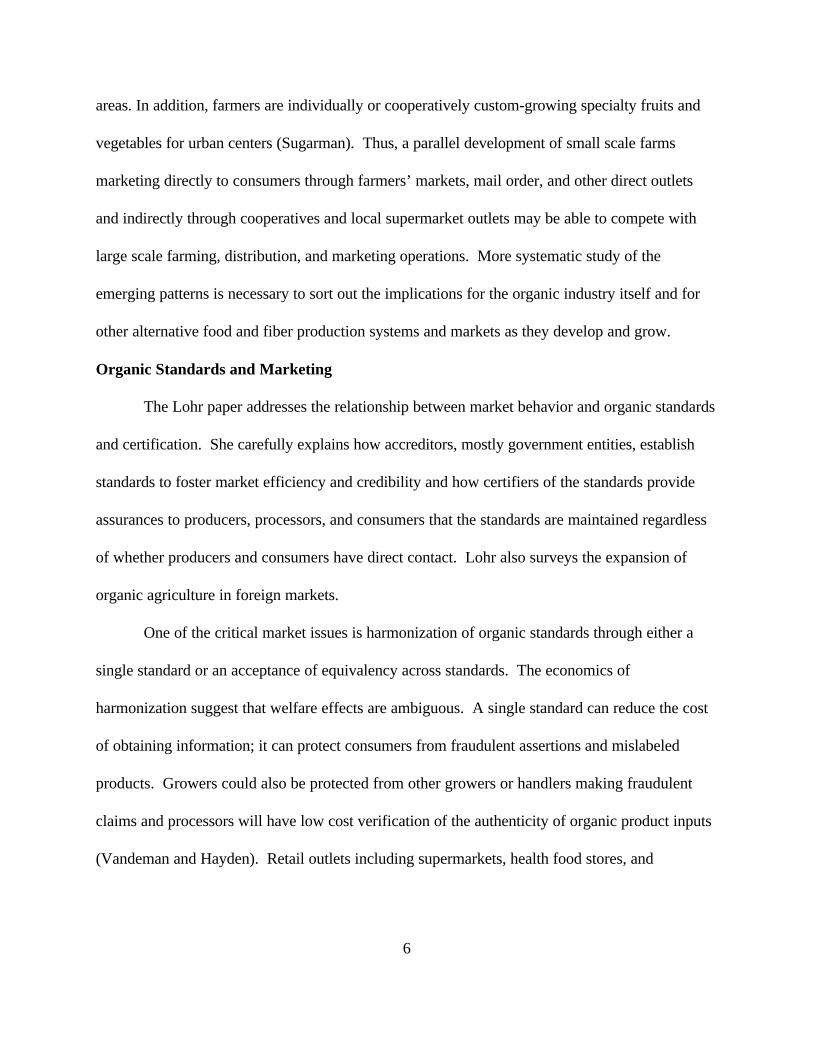
6
areas. In addition, farmers are individually or cooperatively custom-growing specialty fruits and
vegetables for urban centers (Sugarman). Thus, a parallel development of small scale farms
marketing directly to consumers through farmers’ markets, mail order, and other direct outlets
and indirectly through cooperatives and local supermarket outlets may be able to compete with
large scale farming, distribution, and marketing operations. More systematic study of the
emerging patterns is necessary to sort out the implications for the organic industry itself and for
other alternative food and fiber production systems and markets as they develop and grow.
Organic Standards and Marketing
The Lohr paper addresses the relationship between market behavior and organic standards
and certification. She carefully explains how accreditors, mostly government entities, establish
standards to foster market efficiency and credibility and how certifiers of the standards provide
assurances to producers, processors, and consumers that the standards are maintained regardless
of whether producers and consumers have direct contact. Lohr also surveys the expansion of
organic agriculture in foreign markets.
One of the critical market issues is harmonization of organic standards through either a
single standard or an acceptance of equivalency across standards. The economics of
harmonization suggest that welfare effects are ambiguous. A single standard can reduce the cost
of obtaining information; it can protect consumers from fraudulent assertions and mislabeled
products. Growers could also be protected from other growers or handlers making fraudulent
claims and processors will have low cost verification of the authenticity of organic product inputs
(Vandeman and Hayden). Retail outlets including supermarkets, health food stores, and

7
restaurants can sell a myriad of organic products with greater assurance behind a uniform organic
standard.
However, establishing a single standard or equivalency of standards across states or
nations is made difficult because of diverse characteristics developed by organic farmers. U.S.
Department of Agriculture’s Agricultural Marketing Service has received 220,000 comments on a
proposed national standard, many of which have been critical of allowing genetically engineered
foods, sewage sludge as fertilizer, and irradiation to kill bacteria, among other issues. Secretary
of Agriculture Glickman quickly responded by indicating that major changes will be made to the
proposed standards. Some organizations also would like the standards to be more exclusive with
respect to specific materials, open space requirements, antibiotic use, and feeds allowed for
livestock, and have alternative approaches to developing an organic management plan. Others
would like to see organic standards favor small farms, rural community goals, and “fair” trade.
Having multiple standards allows producers and consumers to capture welfare gains from these
different organic characteristics, but it creates costlier production and marketing expenditures,
additional certification fees, and may generate confusion among consumers. How consumer
purchases of organic foods and fibers may change at the margin with a national standard and
equivalency of international standards remains to be determined.
In summary, the expansion in consumer expenditures for organic foods has been quite
extraordinary. The three papers in this session surveyed consumer demand for organic foods,
reviewed the practices and management approaches taken by organic growers, and examined the
development of organic food markets within the United States and abroad. Several demand and
supply side factors appear to be critical for future growth of the industry. Continued demand

8
increases are contingent on consumers preferring food which is perceived to be healthier and
produced in an environmentally friendly way. Consumer responsiveness to changes in price
premia, disposable income, and well accepted standards are key factors. On the production side,
research, education, and extension will help ensure a consistent supply to the market, lower
grower costs, and reduce price premia. Finally, expansion both domestically and internationally
will be dependent on the evolution in market structure and performance, particularly with respect
to economies of scale.
References
Anton Dunn, Julie. “Organic Foods Find Opportunity in the Natural Foods Industry.”
FoodReview. September - December 1995: 7-12.
Bronfenbrenner, Martin, Werner Sichel, and Wayland Gardner. Economics. Houghton Mifflin,
Third Edition. Boston, Massachusetts, 1990.
Fresh Trends. Vance Publishing Corporation, 1996.
Goldreich, Samuel. “Farmers Fear Redefined ‘Organic’ Standards.” Washington Times. April 27,
1998: D15,18.
Hartman and New Hope. The Evolving Organic Market Place. Bellevue, Washington, 1997.
Murphy, K. “Organic Food Makers Reap Green Yields of Revenue, A Widening Popularity
Brings Acquisitions.” The New York Times. October 26, 1996: 37.
Natural Food Merchandiser. New Hope Natural Media Incorporated, May 1997.
Sugarman, Carole. “Farming a la Carte.” The Washington Post. April 22, 1998: E1,10.
Vandeman, Ann V. and Beth Hayden. “New Law Paves Way for Expanding Organic Market.”
FoodReview. May-August 1997: 28-32.
Related Documents