American Journal of Public Health | March 2008, Vol 98, No. 3 468 | Research and Practice | Peer Reviewed | Yang et al. RESEARCH AND PRACTICE Objectives. We examined whether socioeconomic inequalities in smoking and overweight and obesity emerged in early adulthood and the contribution of fam- ily background, adolescent smoking, and body mass index to socioeconomic inequalities. Methods. Using data from the National Longitudinal Study of Adolescent Health we employed multinomial regression analyses to estimate relative odds of heavy or light-to-moderate smoking to nonsmoking and of overweight or obesity to normal weight. Results. For smoking, we found inequalities by young adult socioeconomic position in both genders after controlling for family background and smoking during adolescence. However, family socioeconomic position was not strongly associated with smoking in early adulthood. For overweight and obesity, we found socioeconomic inequalities only among women both by young adult and family socioeconomic position after adjusting for birthweight, other family back- ground, and body mass index during adolescence. Conclusions. Socioeconomic inequalities in smoking emerged in early adult- hood according to socioeconomic position. Among women, inequalities in over- weight or obesity were already evident by family socioeconomic position and strengthened by their own socioeconomic position. The relative importance of family background and current socioeconomic circumstances varied between smoking and overweight or obesity. (Am J Public Health. 2008;98:468–477. doi:10.2105/AJPH.2007.111609) Emergence of Socioeconomic Inequalities in Smoking and Overweight and Obesity in Early Adulthood: The National Longitudinal Study of Adolescent Health | Seungmi Yang, PhD, John Lynch, PhD, John Schulenberg, PhD, Ana V. Diez Roux, PhD, and Trivellore Raghunathan, PhD We had 2 specific objectives. First, using the National Longitudinal Study of Adoles- cent Health (Add Health), we examined whether socioeconomic inequalities in smok- ing and in overweight and obesity emerged in early adulthood by young adults’ first achieved SEP, that is, their labor market posi- tion or further education after high school. Second, we assessed to what extent family background such as family SEP, smoking, and obesity, and adolescent smoking and BMI contributed to the socioeconomic pattern of smoking and overweight or obesity in early adulthood. METHODS Study Participants Add Health is a longitudinal study with a nationally representative sample of US ado- lescents. Wave 1 interviews were conducted Smoking and obesity among adults are major determinants of population health 1 and are associated with adult socioeconomic position (SEP). 2,3 Understanding developmental processes of smoking and obesity and their socioeconomic patterns across the life course is crucial to determine optimal times in life for interventions to better limit the population health burden and reduce socioeconomic in- equalities in health. 4 Smoking and its popula- tion health burden are determined at rela- tively young ages: initiation of smoking occurs most frequently at ages 12 to 14 years and less than 10% of adult smokers initiated smoking after age 19. 5,6 On the other hand, despite relatively strong tracking of childhood overweight into adult- hood, only one third of obese adults are esti- mated to have been overweight as a child, 7 although this may vary by birth cohort. Smoking by adults is strongly patterned by adult SEP, 8 but inconsistent patterns are found during adolescence when most smok- ing is established. 9–12 This may be because of the blurring of socioeconomic distinctions be- cause of more broad-based patterns of experi- mentation with smoking among adolescents. Similarly, there is an unclear relationship be- tween SEP and overweight in childhood, 13 but both family and adult SEP are predictive of adult obesity. 14–16 Thus, socioeconomic in- equalities in smoking and obesity seem to be crystallized at some time after adolescence, yet our knowledge on when in adulthood such inequalities emerge is limited. We focused on individuals aged in their early 20s for 2 reasons. First, early adulthood is a pivotal time in the life course that repre- sents a major transitional period in which changes such as residential and financial inde- pendence from parents, entry into the labor market, seeking of further education, marriage, and parenthood occur. 17,18 Such transitions in early adulthood may also influence behaviors such as smoking and physical activity. 19,20 Second, the process of sorting into different socioeconomic paths during early adulthood is of central importance in determining adult SEP. Young adults who pursue tertiary educa- tion tend to achieve a higher adult SEP than those who enter the labor market directly after high school. Therefore, young adult SEP is both a marker of cumulative socioeco- nomic processes transmitted via family back- ground and of future life trajectory that would affect SEP and health in later life. To untangle the effect of young adults’ own SEP on smoking and overweight or obesity in early adulthood from that of family back- ground, we accounted for family background and adolescent factors including smoking and body mass index (BMI; weight in kilograms divided by height in meters squared) during adolescence.

Welcome message from author
This document is posted to help you gain knowledge. Please leave a comment to let me know what you think about it! Share it to your friends and learn new things together.
Transcript
American Journal of Public Health | March 2008, Vol 98, No. 3468 | Research and Practice | Peer Reviewed | Yang et al.
RESEARCH AND PRACTICE
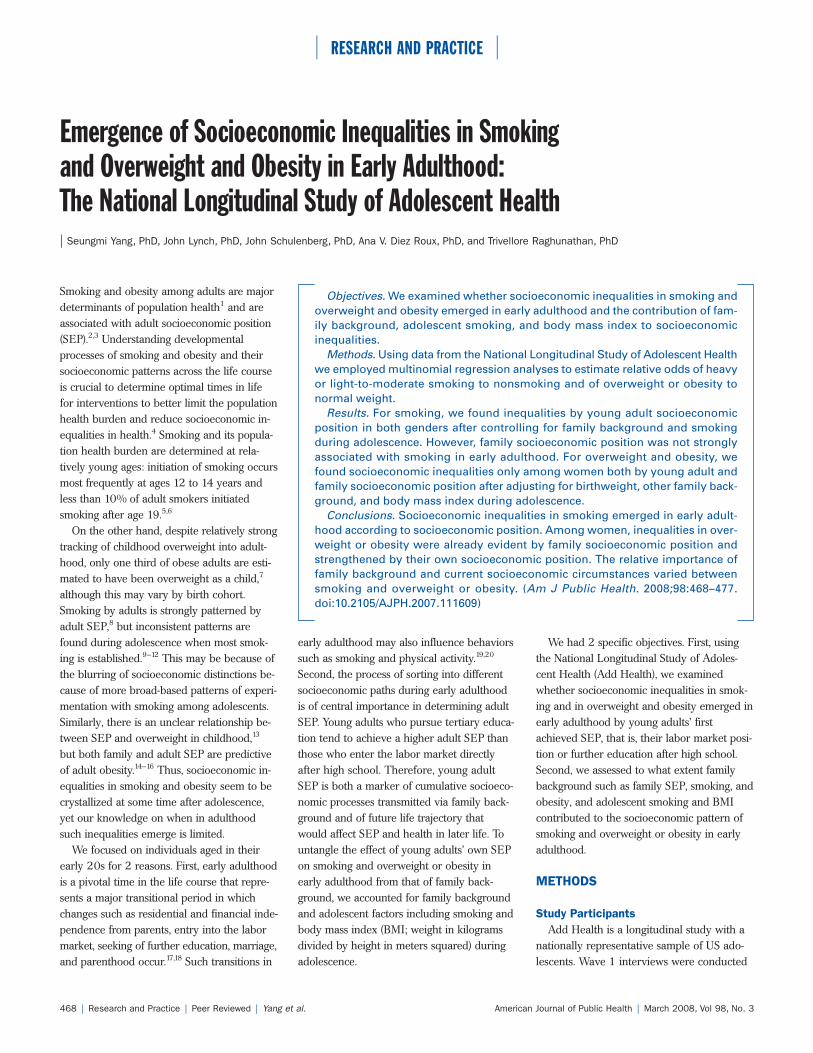
Objectives. We examined whether socioeconomic inequalities in smoking andoverweight and obesity emerged in early adulthood and the contribution of fam-ily background, adolescent smoking, and body mass index to socioeconomicinequalities.
Methods. Using data from the National Longitudinal Study of Adolescent Healthwe employed multinomial regression analyses to estimate relative odds of heavyor light-to-moderate smoking to nonsmoking and of overweight or obesity tonormal weight.
Results. For smoking, we found inequalities by young adult socioeconomicposition in both genders after controlling for family background and smokingduring adolescence. However, family socioeconomic position was not stronglyassociated with smoking in early adulthood. For overweight and obesity, wefound socioeconomic inequalities only among women both by young adult andfamily socioeconomic position after adjusting for birthweight, other family back-ground, and body mass index during adolescence.
Conclusions. Socioeconomic inequalities in smoking emerged in early adult-hood according to socioeconomic position. Among women, inequalities in over-weight or obesity were already evident by family socioeconomic position andstrengthened by their own socioeconomic position. The relative importance offamily background and current socioeconomic circumstances varied betweensmoking and overweight or obesity. (Am J Public Health. 2008;98:468–477.doi:10.2105/AJPH.2007.111609)
Emergence of Socioeconomic Inequalities in Smoking and Overweight and Obesity in Early Adulthood: The National Longitudinal Study of Adolescent Health| Seungmi Yang, PhD, John Lynch, PhD, John Schulenberg, PhD, Ana V. Diez Roux, PhD, and Trivellore Raghunathan, PhD
We had 2 specific objectives. First, usingthe National Longitudinal Study of Adoles-cent Health (Add Health), we examinedwhether socioeconomic inequalities in smok-ing and in overweight and obesity emerged inearly adulthood by young adults’ firstachieved SEP, that is, their labor market posi-tion or further education after high school.Second, we assessed to what extent familybackground such as family SEP, smoking, andobesity, and adolescent smoking and BMIcontributed to the socioeconomic pattern ofsmoking and overweight or obesity in earlyadulthood.
METHODS
Study ParticipantsAdd Health is a longitudinal study with a
nationally representative sample of US ado-lescents. Wave 1 interviews were conducted
Smoking and obesity among adults are majordeterminants of population health1 and areassociated with adult socioeconomic position(SEP).2,3 Understanding developmentalprocesses of smoking and obesity and theirsocioeconomic patterns across the life courseis crucial to determine optimal times in lifefor interventions to better limit the populationhealth burden and reduce socioeconomic in-equalities in health.4 Smoking and its popula-tion health burden are determined at rela-tively young ages: initiation of smoking occursmost frequently at ages 12 to 14 years andless than 10% of adult smokers initiatedsmoking after age 19.5,6
On the other hand, despite relatively strongtracking of childhood overweight into adult-hood, only one third of obese adults are esti-mated to have been overweight as a child,7
although this may vary by birth cohort.Smoking by adults is strongly patterned byadult SEP,8 but inconsistent patterns arefound during adolescence when most smok-ing is established.9–12 This may be because ofthe blurring of socioeconomic distinctions be-cause of more broad-based patterns of experi-mentation with smoking among adolescents.Similarly, there is an unclear relationship be-tween SEP and overweight in childhood,13
but both family and adult SEP are predictiveof adult obesity.14–16 Thus, socioeconomic in-equalities in smoking and obesity seem to becrystallized at some time after adolescence,yet our knowledge on when in adulthoodsuch inequalities emerge is limited.
We focused on individuals aged in theirearly 20s for 2 reasons. First, early adulthoodis a pivotal time in the life course that repre-sents a major transitional period in whichchanges such as residential and financial inde-pendence from parents, entry into the labormarket, seeking of further education, marriage,and parenthood occur.17,18 Such transitions in
early adulthood may also influence behaviorssuch as smoking and physical activity.19,20
Second, the process of sorting into differentsocioeconomic paths during early adulthoodis of central importance in determining adultSEP. Young adults who pursue tertiary educa-tion tend to achieve a higher adult SEP thanthose who enter the labor market directlyafter high school. Therefore, young adultSEP is both a marker of cumulative socioeco-nomic processes transmitted via family back-ground and of future life trajectory thatwould affect SEP and health in later life. Tountangle the effect of young adults’ own SEPon smoking and overweight or obesity inearly adulthood from that of family back-ground, we accounted for family backgroundand adolescent factors including smoking andbody mass index (BMI; weight in kilogramsdivided by height in meters squared) duringadolescence.

March 2008, Vol 98, No. 3 | American Journal of Public Health Yang et al. | Peer Reviewed | Research and Practice | 469
RESEARCH AND PRACTICE
on a stratified random sample of 20745adolescents who were in grades 7 through12 in 1995. Wave 2 interviews were com-pleted in 1996 by 14736 adolescents whowere in grades 7 through 11 at wave 1.Wave 3 interviews, on which our analyseswere based, targeted 19962 wave 1 respon-dents who were aged at least 18 years andhad wave 1 sampling weights. A total of15197 respondents aged 18 to 26 years in2001 to 2002 were interviewed yielding anoverall 76% response rate.21
Wave 3 participants who did not have thestratification (region), cluster (school) variable,or wave 3 sampling weight were excludedfrom the study (n=875). We further ex-cluded those who, at wave 3, were still at-tending high school (n=90), were currentlyserving in the full-time active-duty military(n=107), had missing information on educa-tion or occupation (n=376), or were cur-rently pregnant (n=288). This yielded a totalof 13461 participants, of which 2924 partici-pants had missing values on smoking vari-ables and 486 on overweight and obesity atwave 3. Additionally, there were 13% to 18%of participants whose parents were not inter-viewed or who had missing values on parent-report information and 0.2% to 4% of partic-ipants with missing information on otherstudy variables from their interview.
The final samples of complete case analy-ses thus were based on 8230 individuals forsmoking and 9542 individuals for overweightand obesity. Forty-eight percent of the partici-pants were women, and the mean age was21.9 years for men and 21.7 years forwomen at wave 3. There were 67% non-Hispanic White, 15.7% non-Hispanic Black,11.8% Hispanic, and 5% other racial/ethnicminorities.
Measures of Smoking and of Overweightand Obesity in Early Adulthood (Wave 3)
Smoking status was obtained by self-reporton whether respondents had smoked in thepast 30 days, the number of days they hadsmoked, and the number of cigarettes smokedper day during the past 30 days. Heavy smok-ing was defined as smoking 300 or more ciga-rettes in the past 30 days (i.e., smoking a halfpack or more every day). Those who smokedfewer than 300 cigarettes in the past 30
days were categorized as light-to-moderatesmokers. Body mass index, calculated frommeasured height and weight, was used to de-termine overweight (BMI=25.0–29.9 kg/m2) and obesity (BMI≥30.0 kg/m2).
Measures of Young AdultSocioeconomic Position (Wave 3)
Young adult SEP was based on self-reportof current employment and educational his-tory after high school (or equivalent) to indi-cate the first achieved SEP in adulthood. Thehighest SEP was assigned to those who wereattending a 4-year college or graduate schoolor in the labor market after obtaining an un-dergraduate degree or higher at wave 3.They were categorized as “going into furthereducation.” For others not in further educa-tion, their current occupation, recorded ac-cording to the 1998 Standard OccupationalClassification list from the Bureau of LaborStatistics, was initially classified into 5 cate-gories22: management or professional, service,sales or office, natural resources or construc-tion or maintenance, and production or trans-portation or material moving. Because of sim-ilar patterns of smoking and of overweightand obesity across categories and small num-bers in some occupations (e.g., production ortransport, construction or maintenance occu-pation among women), we used 2 collapsedcategories: blue-collar occupation (productionor transportation, construction or mainte-nance, and service) and white-collar occupa-tion (sales or office and management or pro-fessional). Individuals who were neither in thelabor market nor in further education com-prised the lowest SEP category (“no furthereducation and economically inactive”).
Measures of Covariates (Wave 1 or 2)Covariates were obtained primarily from
wave 1 when participants were in grades 7through 12. Wave 2 data were used in caseswhen information was missing at wave 1.Family SEP was based on the occupation ofthe head of household (unemployed=1; un-skilled manual=2; skilled manual=3; non-manual=4), household income (quartile dis-tributions scored 1 to 4), and maternaleducation (less than high school=1; highschool or equivalent=2; some college=3;college graduate or higher = 4). These 3
variables were summed to create a compositevariable (range=3–12) and divided into ter-tiles to indicate low (3–7), middle (8–9), andhigh (10–12) family SEP. Family structurewas coded as 2-parent, single-parent, andother. Family connectedness was measuredby 13 items about closeness, perceived caring,and feeling loved and wanted in family(1=not at all; 5=very much). A sum of 13items (range=13–65) was used; a higherscore meant higher family connectedness(Cronbach α=0.83).23
Family smoking was measured by thepresence of a smoker in household (yes orno) and easy access to cigarettes at homeduring adolescence (yes or no). Parentalobesity was categorized into at least 1 par-ent or no parents being obese, by parentalreport. Measures of smoking and BMI dur-ing adolescence represented the partici-pants’ smoking (yes or no) and BMI (contin-uous) during the high school years.Self-reported grades were used to calculategrade point average (GPA, range = 1.0–4.0).Depressive symptoms were measured by theCenter for Epidemiological Studies Depres-sion Scale.23,24 Birthweight was included inour analysis of overweight and obesity. Ofthese covariates, household income, mater-nal education, presence of a smoker in thehousehold, parental obesity, and birthweightof study participants were obtained by pa-rental interviews completed mostly bymothers at wave 1. All other covariateswere obtained from participants.
Statistical AnalysisGender-specific multinomial regression
analyses were conducted to estimate the rela-tive odds of heavy or light-to-moderate smok-ing to nonsmoking and the relative odds ofoverweight or obesity to normal weight. Weinitially estimated age- and race/ethnicity–adjusted associations of young adult SEP withsmoking and overweight or obesity. This asso-ciation was then assessed with sequential ad-justment for family SEP (model 1), other fam-ily characteristics (model 2), and individualfactors during adolescence (model 3). Finally,model 4 further adjusted for smoking andBMI during adolescence. We also carried outage-stratified analyses for those aged 11 to 14years and 15 years and older at wave 1 and
American Journal of Public Health | March 2008, Vol 98, No. 3470 | Research and Practice | Peer Reviewed | Yang et al.
RESEARCH AND PRACTICE
found no differences in the results across agegroups. Therefore, we presented the resultsfrom age-adjusted analyses.
RESULTS
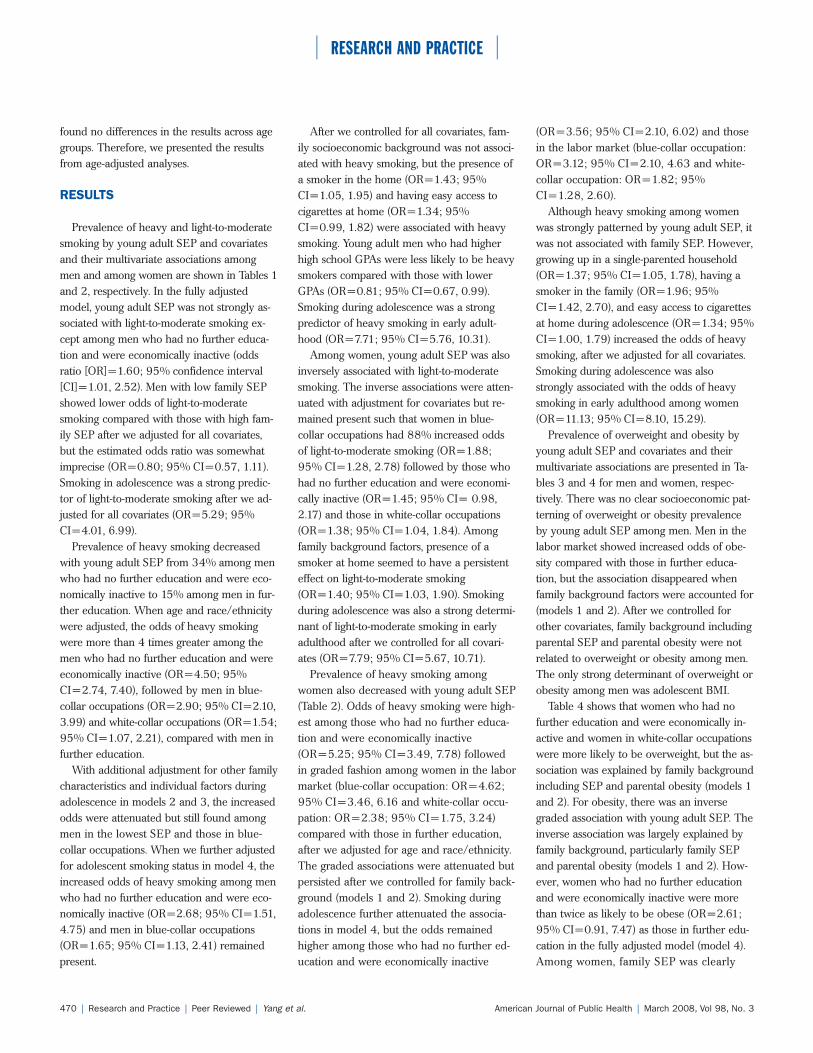
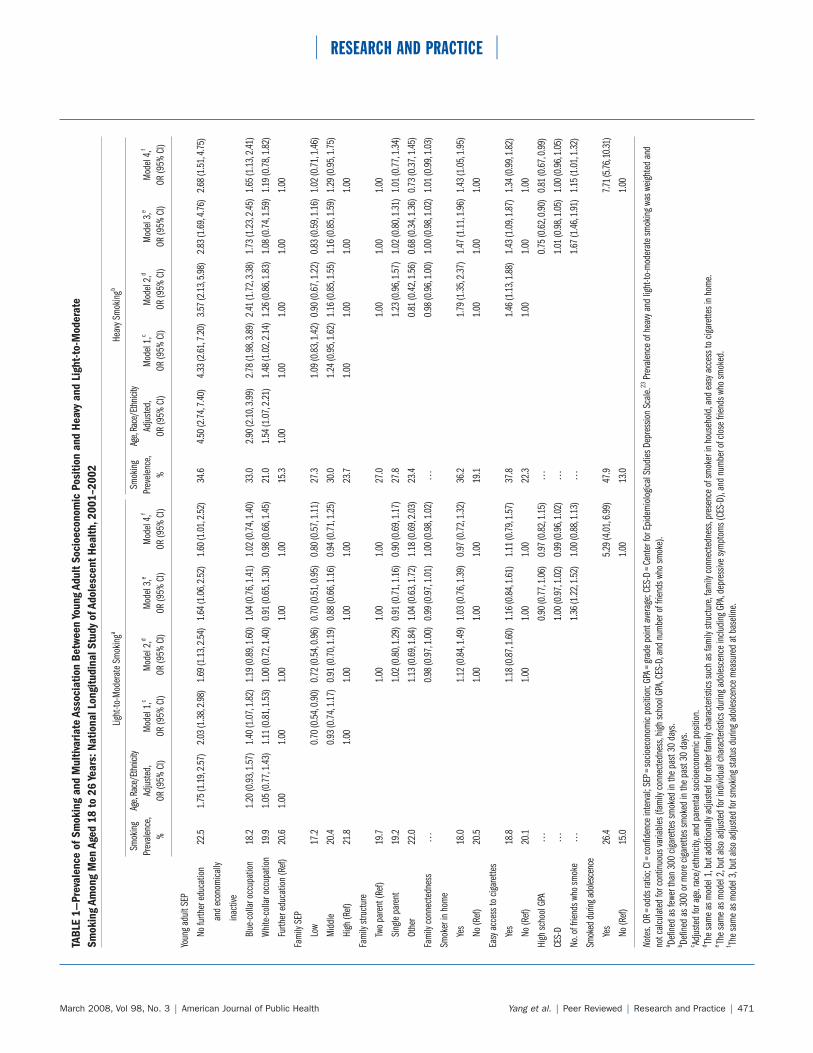
Prevalence of heavy and light-to-moderatesmoking by young adult SEP and covariatesand their multivariate associations amongmen and among women are shown in Tables 1and 2, respectively. In the fully adjustedmodel, young adult SEP was not strongly as-sociated with light-to-moderate smoking ex-cept among men who had no further educa-tion and were economically inactive (oddsratio [OR]=1.60; 95% confidence interval[CI]=1.01, 2.52). Men with low family SEPshowed lower odds of light-to-moderatesmoking compared with those with high fam-ily SEP after we adjusted for all covariates,but the estimated odds ratio was somewhatimprecise (OR=0.80; 95% CI=0.57, 1.11).Smoking in adolescence was a strong predic-tor of light-to-moderate smoking after we ad-justed for all covariates (OR=5.29; 95%CI=4.01, 6.99).
Prevalence of heavy smoking decreasedwith young adult SEP from 34% among menwho had no further education and were eco-nomically inactive to 15% among men in fur-ther education. When age and race/ethnicitywere adjusted, the odds of heavy smokingwere more than 4 times greater among themen who had no further education and wereeconomically inactive (OR=4.50; 95%CI=2.74, 7.40), followed by men in blue-collar occupations (OR=2.90; 95% CI=2.10,3.99) and white-collar occupations (OR=1.54;95% CI=1.07, 2.21), compared with men infurther education.
With additional adjustment for other familycharacteristics and individual factors duringadolescence in models 2 and 3, the increasedodds were attenuated but still found amongmen in the lowest SEP and those in blue-collar occupations. When we further adjustedfor adolescent smoking status in model 4, theincreased odds of heavy smoking among menwho had no further education and were eco-nomically inactive (OR=2.68; 95% CI=1.51,4.75) and men in blue-collar occupations(OR=1.65; 95% CI=1.13, 2.41) remainedpresent.
After we controlled for all covariates, fam-ily socioeconomic background was not associ-ated with heavy smoking, but the presence ofa smoker in the home (OR=1.43; 95%CI=1.05, 1.95) and having easy access tocigarettes at home (OR=1.34; 95%CI=0.99, 1.82) were associated with heavysmoking. Young adult men who had higherhigh school GPAs were less likely to be heavysmokers compared with those with lowerGPAs (OR=0.81; 95% CI=0.67, 0.99).Smoking during adolescence was a strongpredictor of heavy smoking in early adult-hood (OR=7.71; 95% CI=5.76, 10.31).
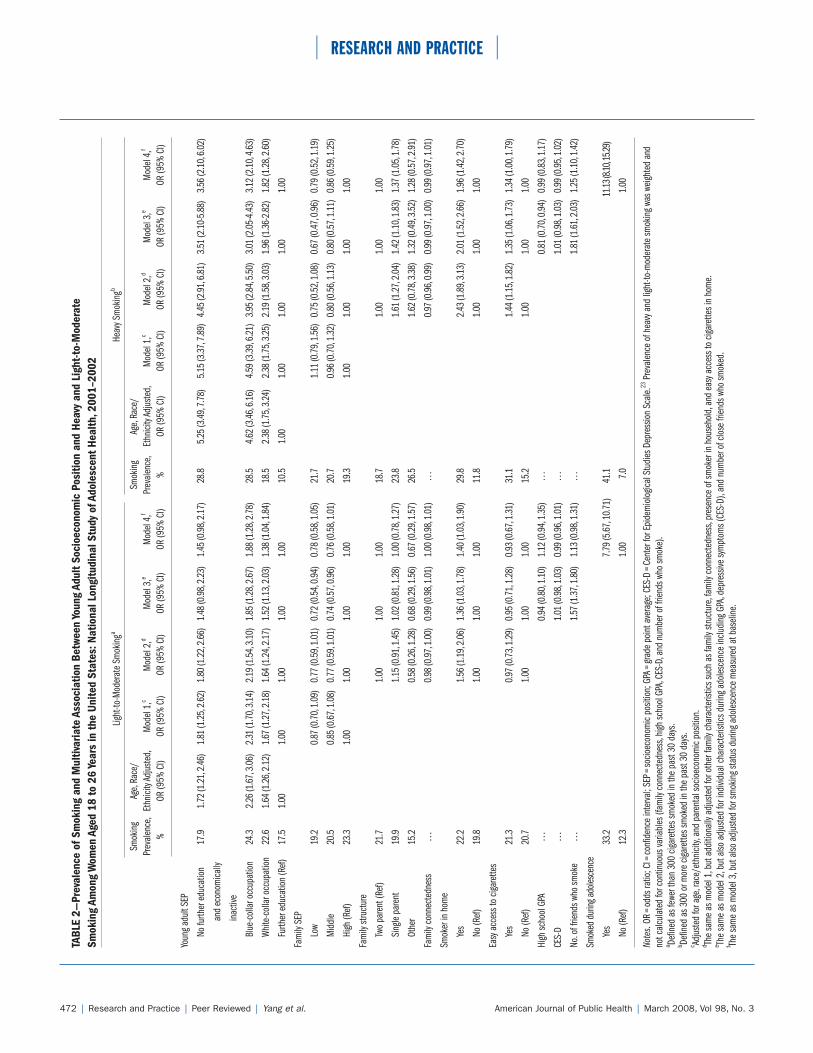
Among women, young adult SEP was alsoinversely associated with light-to-moderatesmoking. The inverse associations were atten-uated with adjustment for covariates but re-mained present such that women in blue-collar occupations had 88% increased oddsof light-to-moderate smoking (OR=1.88;95% CI=1.28, 2.78) followed by those whohad no further education and were economi-cally inactive (OR=1.45; 95% CI= 0.98,2.17) and those in white-collar occupations(OR=1.38; 95% CI=1.04, 1.84). Amongfamily background factors, presence of asmoker at home seemed to have a persistenteffect on light-to-moderate smoking(OR=1.40; 95% CI=1.03, 1.90). Smokingduring adolescence was also a strong determi-nant of light-to-moderate smoking in earlyadulthood after we controlled for all covari-ates (OR=7.79; 95% CI=5.67, 10.71).
Prevalence of heavy smoking amongwomen also decreased with young adult SEP(Table 2). Odds of heavy smoking were high-est among those who had no further educa-tion and were economically inactive(OR=5.25; 95% CI=3.49, 7.78) followedin graded fashion among women in the labormarket (blue-collar occupation: OR=4.62;95% CI=3.46, 6.16 and white-collar occu-pation: OR=2.38; 95% CI=1.75, 3.24)compared with those in further education,after we adjusted for age and race/ethnicity.The graded associations were attenuated butpersisted after we controlled for family back-ground (models 1 and 2). Smoking duringadolescence further attenuated the associa-tions in model 4, but the odds remainedhigher among those who had no further ed-ucation and were economically inactive
(OR=3.56; 95% CI=2.10, 6.02) and thosein the labor market (blue-collar occupation:OR=3.12; 95% CI=2.10, 4.63 and white-collar occupation: OR=1.82; 95%CI=1.28, 2.60).
Although heavy smoking among womenwas strongly patterned by young adult SEP, itwas not associated with family SEP. However,growing up in a single-parented household(OR=1.37; 95% CI=1.05, 1.78), having asmoker in the family (OR=1.96; 95%CI=1.42, 2.70), and easy access to cigarettesat home during adolescence (OR=1.34; 95%CI=1.00, 1.79) increased the odds of heavysmoking, after we adjusted for all covariates.Smoking during adolescence was alsostrongly associated with the odds of heavysmoking in early adulthood among women(OR=11.13; 95% CI=8.10, 15.29).
Prevalence of overweight and obesity byyoung adult SEP and covariates and theirmultivariate associations are presented in Ta-bles 3 and 4 for men and women, respec-tively. There was no clear socioeconomic pat-terning of overweight or obesity prevalenceby young adult SEP among men. Men in thelabor market showed increased odds of obe-sity compared with those in further educa-tion, but the association disappeared whenfamily background factors were accounted for(models 1 and 2). After we controlled forother covariates, family background includingparental SEP and parental obesity were notrelated to overweight or obesity among men.The only strong determinant of overweight orobesity among men was adolescent BMI.
Table 4 shows that women who had nofurther education and were economically in-active and women in white-collar occupationswere more likely to be overweight, but the as-sociation was explained by family backgroundincluding SEP and parental obesity (models 1and 2). For obesity, there was an inversegraded association with young adult SEP. Theinverse association was largely explained byfamily background, particularly family SEPand parental obesity (models 1 and 2). How-ever, women who had no further educationand were economically inactive were morethan twice as likely to be obese (OR=2.61;95% CI=0.91, 7.47) as those in further edu-cation in the fully adjusted model (model 4).Among women, family SEP was clearly
March 2008, Vol 98, No. 3 | American Journal of Public Health Yang et al. | Peer Reviewed | Research and Practice | 471
RESEARCH AND PRACTICE TA
BLE
1—Pr
eval
ence
of S
mok
ing
and
Mul
tivar
iate
Ass
ocia
tion
Betw
een
Youn
g Ad
ult S
ocio
econ
omic
Pos
ition
and
Hea
vy a
nd L
ight
-to-
Mod
erat
e Sm
okin
g Am
ong
Men
Age
d 18
to 2
6 Ye
ars:
Nat
iona
l Lon
gitu
dina
l Stu
dy o
f Ado
lesc
ent H
ealth
,200
1–20
02
Light
-to-M
oder
ate
Smok
inga
Heav
y Sm
okin
gb
Smok
ing
Age,
Race
/Eth
nicity
Sm
okin
g Ag
e,Ra
ce/E
thnic
ity
Prev
alen
ce,
Adju
sted,
Mod
el 1,
c M
odel
2,d
Mod
el 3,
e M
odel
4,f
Prev
elenc
e,Ad
juste
d,M
odel
1,c
Mod
el 2,
d M
odel
3,e
Mod
el 4,
f
%OR
(95%
CI)
OR (9
5% C
I)OR
(95%
CI)
OR (9
5% C
I)OR
(95%
CI)
%OR
(95%
CI)
OR (9
5% C
I)OR
(95%
CI)
OR (9
5% C
I)OR
(95%
CI)
Youn
g ad
ult S
EP
No fu
rther
edu
catio
n 22
.51.
75 (1
.19,
2.57
)2.
03 (1
.38,
2.98
)1.
69 (1
.13,
2.54
)1.
64 (1
.06,
2.52
)1.
60 (1
.01,
2.52
)34
.64.
50 (2
.74,
7.40
)4.
33 (2
.61,
7.20
)3.
57 (2
.13,
5.98
)2.
83 (1
.69,
4.76
)2.
68 (1
.51,
4.75
)
and
econ
omica
lly
inac
tive
Blue
-col
lar o
ccup
atio
n18
.21.
20 (0
.93,
1.57
)1.
40 (1
.07,
1.82
)1.
19 (0
.89,
1.60
)1.
04 (0
.76,
1.41
)1.
02 (0
.74,
1.40
)33
.02.
90 (2
.10,
3.99
)2.
78 (1
.98,
3.89
)2.
41 (1
.72,
3.38
)1.
73 (1
.23,
2.45
)1.
65 (1
.13,
2.41
)
Whi
te-c
olla
r occ
upat
ion
19.9
1.05
(0.7
7,1.
43)
1.11
(0.8
1,1.
53)
1.00
(0.7
2,1.
40)
0.91
(0.6
5,1.
30)
0.98
(0.6
6,1.
45)
21.0
1.54
(1.0
7,2.
21)
1.48
(1.0
2,2.
14)
1.26
(0.8
6,1.
83)
1.08
(0.7
4,1.
59)
1.19
(0.7
8,1.
82)
Furth
er e
duca
tion
(Ref
)20
.61.
001.
001.
001.
001.
0015
.31.
001.
001.
001.
001.
00
Fam
ily S
EP
Low
17.2
0.70
(0.5
4,0.
90)
0.72
(0.5
4,0.
96)
0.70
(0.5
1,0.
95)
0.80
(0.5
7,1.
11)
27.3
1.09
(0.8
3,1.
42)
0.90
(0.6
7,1.
22)
0.83
(0.5
9,1.
16)
1.02
(0.7
1,1.
46)
Mid
dle
20.4
0.93
(0.7
4,1.
17)
0.91
(0.7
0,1.
19)
0.88
(0.6
6,1.
16)
0.94
(0.7
1,1.
25)
30.0
1.24
(0.9
5,1.
62)
1.16
(0.8
5,1.
55)
1.16
(0.8
5,1.
59)
1.29
(0.9
5,1.
75)
High
(Ref
)21
.81.
001.
001.
001.
0023
.71.
001.
001.
001.
00
Fam
ily st
ruct
ure
Two
pare
nt (R
ef)
19.7
1.00
1.00
1.00
27.0
1.00
1.00
1.00
Sing
le pa
rent
19.2
1.02
(0.8
0,1.
29)
0.91
(0.7
1,1.
16)
0.90
(0.6
9,1.
17)
27.8
1.23
(0.9
6,1.
57)
1.02
(0.8
0,1.
31)
1.01
(0.7
7,1.
34)
Othe
r22
.01.
13 (0
.69,
1.84
)1.
04 (0
.63,
1.72
)1.
18 (0
.69,
2.03
)23
.40.
81 (0
.42,
1.56
)0.
68 (0
.34,
1.36
)0.
73 (0
.37,
1.45
)
Fam
ily c
onne
cted
ness
...
0.98
(0.9
7,1.
00)
0.99
(0.9
7,1.
01)
1.00
(0.9
8,1.
02)
...
0.98
(0.9
6,1.
00)
1.00
(0.9
8,1.
02)
1.01
(0.9
9,1.
03)
Smok
er in
hom
e
Yes
18.0
1.12
(0.8
4,1.
49)
1.03
(0.7
6,1.
39)
0.97
(0.7
2,1.
32)
36.2
1.79
(1.3
5,2.
37)
1.47
(1.1
1,1.
96)
1.43
(1.0
5,1.
95)
No (R
ef)
20.5
1.00
1.00
1.00
19.1
1.00
1.00
1.00
Easy
acc
ess t
o cig
aret
tes
Yes
18.8
1.18
(0.8
7,1.
60)
1.16
(0.8
4,1.
61)
1.11
(0.7
9,1.
57)
37.8
1.46
(1.1
3,1.
88)
1.43
(1.0
9,1.
87)
1.34
(0.9
9,1.
82)
No (R
ef)
20.1
1.00
1.00
1.00
22.3
1.00
1.00
1.00
High
scho
ol G
PA..
.0.
90 (0
.77,
1.06
)0.
97 (0
.82,
1.15
)..
.0.
75 (0
.62,
0.90
)0.
81 (0
.67,
0.99
)
CES-
D..
.1.
00 (0
.97,
1.02
)0.
99 (0
.96,
1.02
)..
.1.
01 (0
.98,
1.05
)1.
00 (0
.96,
1.05
)
No.o
f frie
nds w
ho sm
oke
...
1.36
(1.2
2,1.
52)
1.00
(0.8
8,1.
13)
...
1.67
(1.4
6,1.
91)
1.15
(1.0
1,1.
32)
Smok
ed d
uring
ado
lesce
nce
Yes
26.4
5.29
(4.0
1,6.
99)
47.9
7.71 (
5.76,
10.31
)
No (R
ef)
15.0
1.00
13.0
1.00
Note
s.OR
=odd
s rat
io; C
I=co
nfid
ence
inte
rval;
SEP=
socio
econ
omic
posit
ion;
GPA
=gra
de p
oint
ave
rage
; CES
-D=C
ente
r for
Epi
dem
iolo
gical
Stu
dies
Dep
ress
ion
Scal
e.23
Prev
alen
ce o
f hea
vy a
nd li
ght-t
o-m
oder
ate
smok
ing
was w
eight
ed a
ndno
t cal
cula
ted
for c
ontin
uous
varia
bles
(fam
ily c
onne
cted
ness
,high
scho
ol G
PA,C
ES-D
,and
num
ber o
f frie
nds w
ho sm
oke)
.a De
fined
as f
ewer
than
300
ciga
rette
s sm
oked
in th
e pa
st 30
day
s.b De
fined
as 3
00 o
r mor
e cig
aret
tes s
mok
ed in
the
past
30 d
ays.
c Adju
sted
for a
ge,r
ace/
ethn
icity,
and
pare
ntal
socio
econ
omic
posit
ion.
d The
sam
e as
mod
el 1,
but a
dditi
onal
ly ad
juste
d fo
r oth
er fa
mily
cha
ract
erist
ics su
ch a
s fam
ily st
ruct
ure,
fam
ily c
onne
cted
ness
,pre
senc
e of
smok
er in
hou
seho
ld,a
nd e
asy a
cces
s to
cigar
ette
s in
hom
e.e Th
e sa
me
as m
odel
2,bu
t also
adj
uste
d fo
r ind
ividu
al c
hara
cter
istics
dur
ing
adol
esce
nce
inclu
ding
GPA
,dep
ress
ive sy
mpt
oms (
CES-
D),a
nd n
umbe
r of c
lose
frien
ds w
ho sm
oked
.f Th
e sa
me
as m
odel
3,bu
t also
adj
uste
d fo
r sm
okin
g sta
tus d
urin
g ad
oles
cenc
e m
easu
red
at b
aseli
ne.
American Journal of Public Health | March 2008, Vol 98, No. 3472 | Research and Practice | Peer Reviewed | Yang et al.
RESEARCH AND PRACTICE TA
BLE
2—Pr
eval
ence
of S
mok
ing
and
Mul
tivar
iate
Ass
ocia
tion
Betw
een
Youn
g Ad
ult S
ocio
econ
omic
Pos
ition
and
Hea
vy a
nd L
ight
-to-
Mod
erat
e Sm
okin
g Am
ong
Wom
en A
ged
18 to
26
Year
s in
the
Uni
ted
Stat
es: N
atio
nal L
ongi
tudi
nal S
tudy
of A
dole
scen
t Hea
lth,2
001–
2002
Light
-to-M
oder
ate
Smok
inga
Heav
y Sm
okin
gb
Smok
ing
Age,
Race
/Sm
okin
g Ag
e,Ra
ce/
Prev
alen
ce,
Ethn
icity
Adju
sted,
Mod
el 1,
c M
odel
2,d
Mod
el 3,
e M
odel
4,f
Prev
alen
ce,
Ethn
icity
Adju
sted,
Mod
el 1,
c M
odel
2,d
Mod
el 3,
e M
odel
4,f
%OR
(95%
CI)
OR (9
5% C
I)OR
(95%
CI)
OR (9
5% C
I)OR
(95%
CI)
%OR
(95%
CI)
OR (9
5% C
I)OR
(95%
CI)
OR (9
5% C
I)OR
(95%
CI)
Youn
g ad
ult S
EP
No fu
rther
edu
catio
n 17
.91.
72 (1
.21,
2.46
)1.
81 (1
.25,
2.62
)1.
80 (1
.22,
2.66
)1.
48 (0
.98,
2.23
)1.
45 (0
.98,
2.17
)28
.85.
25 (3
.49,
7.78
)5.
15 (3
.37,
7.89
)4.
45 (2
.91,
6.81
)3.
51 (2
.10-
5.88
)3.
56 (2
.10,
6.02
)
and
econ
omica
lly
inac
tive
Blue
-col
lar o
ccup
atio
n24
.32.
26 (1
.67,
3.06
)2.
31 (1
.70,
3.14
)2.
19 (1
.54,
3.10
)1.
85 (1
.28,
2.67
)1.
88 (1
.28,
2.78
)28
.54.
62 (3
.46,
6.16
)4.
59 (3
.39,
6.21
)3.
95 (2
.84,
5.50
)3.
01 (2
.05-
4.43
)3.
12 (2
.10,
4.63
)
Whi
te-c
olla
r occ
upat
ion
22.6
1.64
(1.2
6,2.
12)
1.67
(1.2
7,2.
18)
1.64
(1.2
4,2.
17)
1.52
(1.1
3,2.
03)
1.38
(1.0
4,1.
84)
18.5
2.38
(1.7
5,3.
24)
2.38
(1.7
5,3.
25)
2.19
(1.5
8,3.
03)
1.96
(1.3
6-2.
82)
1.82
(1.2
8,2.
60)
Furth
er e
duca
tion
(Ref
)17
.51.
001.
001.
001.
001.
0010
.51.
001.
001.
001.
001.
00
Fam
ily S
EP
Low
19.2
0.87
(0.7
0,1.
09)
0.77
(0.5
9,1.
01)
0.72
(0.5
4,0.
94)
0.78
(0.5
8,1.
05)
21.7
1.11
(0.7
9,1.
56)
0.75
(0.5
2,1.
08)
0.67
(0.4
7,0.
96)
0.79
(0.5
2,1.
19)
Mid
dle
20.5
0.85
(0.6
7,1.
08)
0.77
(0.5
9,1.
01)
0.74
(0.5
7,0.
96)
0.76
(0.5
8,1.
01)
20.7
0.96
(0.7
0,1.
32)
0.80
(0.5
6,1.
13)
0.80
(0.5
7,1.
11)
0.86
(0.5
9,1.
25)
High
(Ref
)23
.31.
001.
001.
001.
0019
.31.
001.
001.
001.
00
Fam
ily st
ruct
ure
Two
pare
nt (R
ef)
21.7
1.00
1.00
1.00
18.7
1.00
1.00
1.00
Sing
le pa
rent
19.9
1.15
(0.9
1,1.
45)
1.02
(0.8
1,1.
28)
1.00
(0.7
8,1.
27)
23.8
1.61
(1.2
7,2.
04)
1.42
(1.1
0,1.
83)
1.37
(1.0
5,1.
78)
Othe
r15
.20.
58 (0
.26,
1.28
)0.
68 (0
.29,
1.56
)0.
67 (0
.29,
1.57
)26
.51.
62 (0
.78,
3.38
)1.
32 (0
.49,
3.52
)1.
28 (0
.57,
2.91
)
Fam
ily c
onne
cted
ness
...
0.98
(0.9
7,1.
00)
0.99
(0.9
8,1.
01)
1.00
(0.9
8,1.
01)
...
0.97
(0.9
6,0.
99)
0.99
(0.9
7,1.
00)
0.99
(0.9
7,1.
01)
Smok
er in
hom
e
Yes
22.2
1.56
(1.1
9,2.
06)
1.36
(1.0
3,1.
78)
1.40
(1.0
3,1.
90)
29.8
2.43
(1.8
9,3.
13)
2.01
(1.5
2,2.
66)
1.96
(1.4
2,2.
70)
No (R
ef)
19.8
1.00
1.00
1.00
11.8
1.00
1.00
1.00
Easy
acc
ess t
o cig
aret
tes
Yes
21.3
0.97
(0.7
3,1.
29)
0.95
(0.7
1,1.
28)
0.93
(0.6
7,1.
31)
31.1
1.44
(1.1
5,1.
82)
1.35
(1.0
6,1.
73)
1.34
(1.0
0,1.
79)
No (R
ef)
20.7
1.00
1.00
1.00
15.2
1.00
1.00
1.00
High
scho
ol G
PA..
.0.
94 (0
.80,
1.10
)1.
12 (0
.94,
1.35
)..
.0.
81 (0
.70,
0.94
)0.
99 (0
.83,
1.17
)
CES-
D..
.1.
01 (0
.98,
1.03
)0.
99 (0
.96,
1.01
)..
.1.
01 (0
.98,
1.03
)0.
99 (0
.95,
1.02
)
No.o
f frie
nds w
ho sm
oke
...
1.57
(1.3
7,1.
80)
1.13
(0.9
8,1.
31)
...
1.81
(1.6
1,2.
03)
1.25
(1.1
0,1.
42)
Smok
ed d
uring
ado
lesce
nce
Yes
33.2
7.79
(5.6
7,10
.71)
41.1
11.13
(8.10
,15.2
9)
No (R
ef)
12.3
1.00
7.0
1.00
Note
s.OR
=odd
s rat
io; C
I=co
nfid
ence
inte
rval;
SEP=
socio
econ
omic
posit
ion;
GPA
=gra
de p
oint
ave
rage
; CES
-D=C
ente
r for
Epi
dem
iolo
gical
Stu
dies
Dep
ress
ion
Scal
e.23
Prev
alen
ce o
f hea
vy a
nd li
ght-t
o-m
oder
ate
smok
ing
was w
eight
ed a
ndno
t cal
cula
ted
for c
ontin
uous
varia
bles
(fam
ily c
onne
cted
ness
,high
scho
ol G
PA,C
ES-D
,and
num
ber o
f frie
nds w
ho sm
oke)
.a De
fined
as f
ewer
than
300
ciga
rette
s sm
oked
in th
e pa
st 30
day
s.b De
fined
as 3
00 o
r mor
e cig
aret
tes s
mok
ed in
the
past
30 d
ays.
c Adju
sted
for a
ge,r
ace/
ethn
icity,
and
pare
ntal
socio
econ
omic
posit
ion.
d The
sam
e as
mod
el 1,
but a
dditi
onal
ly ad
juste
d fo
r oth
er fa
mily
cha
ract
erist
ics su
ch a
s fam
ily st
ruct
ure,
fam
ily c
onne
cted
ness
,pre
senc
e of
smok
er in
hou
seho
ld,a
nd e
asy a
cces
s to
cigar
ette
s in
hom
e.e Th
e sa
me
as m
odel
2,bu
t also
adj
uste
d fo
r ind
ividu
al c
hara
cter
istics
dur
ing
adol
esce
nce
inclu
ding
GPA
,dep
ress
ive sy
mpt
oms (
CES-
D),a
nd n
umbe
r of c
lose
frien
ds w
ho sm
oked
.f Th
e sa
me
as m
odel
3,bu
t also
adj
uste
d fo
r sm
okin
g sta
tus d
urin
g ad
oles
cenc
e m
easu
red
at b
aseli
ne.

March 2008, Vol 98, No. 3 | American Journal of Public Health Yang et al. | Peer Reviewed | Research and Practice | 473
RESEARCH AND PRACTICE TA
BLE
3—Pr
eval
ence
of O
verw
eigh
t and
Obe
sity
and
Mul
tivar
iate
Ass
ocia
tion
Betw
een
Youn
g Ad
ult S
ocio
econ
omic
Pos
ition
and
Ove
rwei
ght
and
Obes
ity A
mon
g M
en A
ged
18 to
26
Year
s in
the
Uni
ted
Stat
es: N
atio
nal L
ongi
tudi
nal S
tudy
of A
dole
scen
t Hea
lth,2
001–
2002
Over
weigh
tOb
esity
Over
weigh
t Ag
e,Ra
ce/
Obes
ity
Age,
Race
/Pr
eval
ence
,Et
hnici
ty Ad
juste
d,M
odel
1,a
Mod
el 2,
b M
odel
3,c
Mod
el 4,
d Pr
eval
ence
,Et
hnici
ty Ad
juste
d,M
odel
1,a
Mod
el 2,
b M
odel
3,c
Mod
el 4,
d
%OR
(95%
CI)
OR (9
5% C
I)OR
(95%
CI)
OR (9
5% C
I)OR
(95%
CI)
%OR
(95%
CI)
OR (9
5% C
I)OR
(95%
CI)
OR (9
5% C
I)OR
(95%
CI)
Youn
g ad
ult S
EP
No fu
rther
edu
catio
n 26
.50.
68 (0
.51,
0.91
)0.
63 (0
.45,
0.87
)0.
42 (0
.21,
0.86
)0.
49 (0
.24,
1.00
)0.
46 (0
.20,
1.05
)25
.61.
21 (0
.85,
1.72
)1.
03 (0
.71,
1.51
)0.
68 (0
.31,
1.49
)0.
75 (0
.34,
1.66
)0.
95 (0
.32,
2.79
)
and
econ
omica
lly
inac
tive
Blue
-col
lar o
ccup
atio
n32
.50.
91 (0
.74,
1.13
)0.
90 (0
.72,
1.12
)0.
70 (0
.42,
1.16
)0.
74 (0
.45,
1.22
)0.
71 (0
.40,
1.25
)25
.11.
32 (1
.01,
1.72
)1.
14 (0
.84,
1.55
)1.
00 (0
.58,
1.73
)0.
98 (0
.56,
1.73
)1.
15 (0
.54,
2.45
)
Whi
te-c
olla
r occ
upat
ion
32.6
0.97
(0.7
6,1.
24)
0.96
(0.7
5,1.
23)
1.16
(0.6
4,2.
12)
1.20
(0.6
6,2.
15)
1.20
(0.6
2,2.
31)
26.4
1.46
(1.1
0,1.
93)
1.31
(0.9
6,1.
79)
1.44
(0.7
4,2.
80)
1.45
(0.7
5,2.
80)
1.78
(0.7
6,4.
14)
Furth
er e
duca
tion
(Ref
)36
.11.
001.
001.
001.
001.
0019
.61.
001.
001.
001.
001.
00
Fam
ily S
EP
Low
31.1
1.09
(0.8
6,1.
37)
0.93
(0.5
2,1.
67)
0.98
(0.5
4,1.
78)
1.20
(0.6
3,2.
27)
26.5
1.49
(1.1
5,1.
91)
1.29
(0.7
4,2.
26)
1.37
(0.7
8,2.
40)
1.83
(0.8
8,3.
77)
Mid
dle
33.4
1.10
(0.9
1,1.
34)
1.09
(0.6
3,1.
87)
1.10
(0.6
3,1.
90)
1.17
(0.6
5,2.
10)
24.6
1.34
(1.0
3,1.
73)
1.11
(0.6
8,1.
82)
1.11
(0.6
8,1.
82)
1.14
(0.6
1,2.
12)
High
(Ref
)32
.91.
001.
001.
001.
0021
.61.
001.
001.
001.
00
Birth
weigh
t (pe
r 100
g)
...
1.02
(1.0
1,1.
04)
1.03
(1.0
0,1.
07)
1.03
(1.0
0,1.
07)
1.03
(1.0
0,1.
07)
...
1.03
(1.0
1,1.
04)
1.01
(0.9
8,1.
05)
1.01
(0.9
8,1.
05)
1.03
(0.9
9,1.
07)
Fam
ily st
ruct
ure
Two-
pare
nt (R
ef)
33.0
1.00
1.00
1.00
24.2
1.00
1.00
1.00
Sing
le-pa
rent
31.0
0.75
(0.4
6,1.
23)
0.80
(0.4
8,1.
32)
0.68
(0.3
7,1.
22)
23.7
0.73
(0.4
3,1.
23)
0.78
(0.4
6,1.
33)
0.49
(0.2
2,1.
10)
Othe
r33
.71.
34 (0
.18,
9.86
)0.
77 (0
.06,
9.77
)0.
68 (0
.08,
6.00
)27
.32.
98 (0
.66,
13.4
6)2.
81 (0
.59,
13.4
4)2.8
1 (0.5
4,14
.74)
Fam
ily c
onne
cted
ness
...
1.00
(0.9
7,1.
03)
1.00
(0.9
7,1.
04)
1.00
(0.9
8,1.
04)
...
1.02
(0.9
9,1.
05)
1.03
(1.0
0,1.
06)
1.02
(0.9
8,1.
05)
Pare
ntal
obe
sity
At le
ast 1
obe
se p
aren
t 21
.80.
94 (0
.55,
1.59
)0.
97 (0
.57,
1.63
)0.
91 (0
.51,
1.63
)54
.92.
19 (1
.34,
3.57
)2.
28 (1
.39,
3.73
)1.
59 (0
.82,
3.06
)
No o
bese
par
ent (
Ref)
32.6
1.00
1.00
1.00
33.8
1.00
1.00
1.00
High
scho
ol G
PA..
.1.
13 (0
.85,
1.51
)1.
02 (0
.75,
1.37
)..
.1.
01 (0
.76,
1.34
)0.
92 (0
.66,
1.27
)
CES-
D..
.1.
02 (0
.97,
1.07
)1.
01 (0
.97,
1.06
)..
.1.
02 (0
.97,
1.08
)1.
00 (0
.93,
1.07
)
BMI d
urin
g ad
oles
cenc
e..
.1.
40 (1
.30,
1.52
)..
.1.
90 (1
.70,
2.12
)
Note
s.BM
I=bo
dy m
ass i
ndex
; OR=
odds
ratio
; CI=
conf
iden
ce in
terva
l; SE
P=so
cioec
onom
ic po
sitio
n; G
PA=g
rade
poi
nt a
vera
ge; C
ES-D
=Cen
ter f
or E
pide
mio
logic
al S
tudi
es D
epre
ssio
n Sc
ale.
23 Pr
eval
ence
of o
verw
eight
and
obe
sity w
aswe
ighte
d an
d no
t cal
cula
ted
for c
ontin
uous
varia
bles
(birt
hweig
ht,f
amily
con
nect
edne
ss,h
igh sc
hool
GPA
,and
CES
-D).
Over
weigh
t was
def
ined
as 2
5.0
to 2
9.9
kg/m
2 .Obe
sity w
as d
efin
ed a
s 30
kg/m
2or
gre
ater
.a Ad
juste
d fo
r age
,rac
e/et
hnici
ty,an
d pa
rent
al so
cioec
onom
ic po
sitio
n ba
sed
on p
aren
tal o
ccup
atio
n,ed
ucat
ion,
and
hous
ehol
d in
com
e m
easu
red
at w
ave
1 an
d bi
rthwe
ight r
epor
ted
by a
par
ent.
b The
sam
e as
mod
el 1,
but a
lso a
djus
ted
for f
amily
cha
ract
erist
ics in
cludi
ng fa
mily
stru
ctur
e,fa
mily
con
nect
edne
ss,a
nd p
aren
tal o
besit
y.c Th
e sa
me
as m
odel
2,bu
t also
adj
uste
d fo
r GPA
and
dep
ress
ive sy
mpt
oms (
CES-
D).
d The
sam
e as
mod
el 3,
but a
dditi
onal
ly ad
juste
d fo
r BM
I in
adol
esce
nce.

American Journal of Public Health | March 2008, Vol 98, No. 3474 | Research and Practice | Peer Reviewed | Yang et al.
RESEARCH AND PRACTICE TA
BLE
4—Pr
eval
ence
of O
verw
eigh
t and
Obe
sity
and
Mul
tivar
iate
Ass
ocia
tion
(Adj
uste
d Od
ds R
atio
s) B
etw
een
Youn
g Ad
ult S
ocio
econ
omic
Pos
ition
an
d Ov
erw
eigh
t and
Obe
sity
Am
ong
Wom
en A
ged
18 to
26
Year
s in
the
Uni
ted
Stat
es: N
atio
nal L
ongi
tudi
nal S
tudy
of A
dole
scen
t Hea
lth,2
001–
2002
Over
weigh
tOb
esity
Over
weigh
t Ag
e,Ra
ce/
Obes
ity
Age,
Race
/Pr
eval
ence
,Et
hnici
ty Ad
juste
d,M
odel
1,a
Mod
el 2,
b M
odel
3,c
Mod
el 4,
d Pr
eval
ence
,Et
hnici
ty Ad
juste
d,M
odel
1,a
Mod
el 2,
b M
odel
3,c
Mod
el 4,
d OR
%
OR (9
5% C
I)OR
(95%
CI)
OR (9
5% C
I)OR
(95%
CI)
OR (9
5% C
I)%
OR (9
5% C
I)OR
(95%
CI)
OR (9
5% C
I)OR
(95%
CI)
(95%
CI)
Youn
g ad
ult S
EP
No fu
rther
edu
catio
n 24
.91.
54 (1
.16,
2.05
)1.
35 (0
.96,
1.91
)1.
57 (0
.74,
3.33
)1.
95 (0
.88,
4.29
)2.
03 (0
.89,
4.60
)37
.22.
84 (2
.15-
3.74
)2.
39 (1
.74,
3.28
)2.
56 (1
.26,
5.19
)2.
57 (1
.25,
5.29
)2.
61 (0
.91,
7.47
)
and
econ
omica
lly
inac
tive
Blue
-col
lar o
ccup
atio
n22
.21.
17 (0
.95,
1.45
)1.
03 (0
.81,
1.32
)1.
03 (0
.56,
1.91
)1.
23 (0
.64,
2.37
)1.
04 (0
.49,
2.21
)29
.82.
01 (1
.58-
2.56
)1.
76 (1
.35,
2.30
)1.
25 (0
.71,
2.17
)1.
20 (0
.68,
2.12
)0.
74 (0
.29,
1.85
)
Whi
te-c
olla
r occ
upat
ion
25.1
1.27
(1.0
3,1.
57)
1.22
(0.9
7,1.
52)
1.12
(0.7
1,1.
75)
1.25
(0.8
1,1.
93)
1.23
(0.7
7,1.
95)
25.4
1.65
(1.3
2-2.
07)
1.47
(1.1
5,1.
87)
1.05
(0.6
5,1.
69)
1.00
(0.6
1,1.
64)
1.03
(0.5
4,1.
98)
Furth
er e
duca
tion
(Ref
)22
.91.
001.
001.
001.
001.
0018
.31.
001.
001.
001.
001.
00
Fam
ily S
EP
Low
24.8
1.41
(1.1
0,1.
81)
1.10
(0.6
3,1.
93)
1.07
(0.5
8,2.
00)
1.04
(0.5
3,2.
02)
33.6
1.93
(1.5
0,2.
48)
2.28
(1.4
1,3.
68)
2.08
(1.2
8,3.
39)
2.47
(1.1
8,5.
18)
Mid
dle
24.9
1.39
(1.0
9,1.
78)
1.90
(1.1
7,3.
08)
1.96
(1.1
6,3.
31)
2.01
(1.1
6,3.
48)
27.1
1.73
(1.3
3,2.
23)
3.08
(1.9
1,4.
96)
2.81
(1.7
3,4.
56)
4.21
(2.1
1,8.
42)
High
(Ref
)22
.21.
001.
001.
001.
0018
.31.
001.
001.
001.
00
Birth
weigh
t (pe
r 100
g)
...
1.02
(1.0
0,1.
03)
1.04
(1.0
0,1.
08)
1.04
(1.0
0,1.
07)
1.03
(0.9
9,1.
07)
...
1.03
(1.0
1,1.
05)
1.04
(1.0
0,1.
07)
1.04
(1.0
1,1.
08)
1.03
(0.9
8,1.
08)
Fam
ily st
ruct
ure
Two
pare
nt (R
ef)
24.0
1.00
1.00
1.00
24.2
1.00
1.00
1.00
Sing
le pa
rent
23.5
1.19
(0.6
7,2.
09)
1.24
(0.7
6,2.
03)
1.11
(0.6
5,1.
90)
32.5
1.44
(0.9
7,2.
13)
1.60
(1.0
8,2.
35)
1.28
(0.6
8,2.
42)
Othe
r23
.50.
43 (0
.04,
4.24
)0.
10 (0
.01,
0.70
)0.
08 (0
.01,
0.54
)28
.80.
54 (0
.07,
4.28
)0.
92 (0
.10,
8.64
)1.7
2 (0.1
6,18
.82)
Fam
ily c
onne
cted
ness
...
1.01
(0.9
8,1.
03)
1.00
(0.9
7,1.
03)
1.00
(0.9
8,1.
03)
...
1.02
(1.0
0,1.
04)
1.02
(0.9
9,1.
05)
1.03
(0.9
9,1.
08)
Pare
ntal
obe
sity
At le
ast 1
obe
se p
aren
t19
.81.
69 (1
.07,
2.68
)1.
82 (1
.12,
2.97
)1.
98 (1
.12,
3.49
)57
.13.
62 (2
.26,
5.78
)3.
68 (2
.28,
5.93
)3.
43 (1
.88,
6.27
)
No o
bese
par
ent (
Ref)
23.5
1.00
1.00
1.00
35.1
1.00
1.00
1.00
High
scho
ol G
PA..
.1.
12 (0
.81,
1.55
)1.
14 (0
.81,
1.58
)..
.0.
82 (0
.63,
1.09
)0.
86 (0
.61,
1.23
)
CES-
D..
.1.
00 (0
.95,
1.06
)1.
02 (0
.95,
1.08
)..
.1.
00 (0
.96,
1.05
)1.
04 (0
.98,
1.10
)
BMI d
urin
g ad
oles
cenc
e..
.1.
31 (1
.19,
1.44
)..
.1.
94 (1
.72,
2.18
)
Note
s.BM
I=bo
dy m
ass i
ndex
; OR=
odds
ratio
; CI=
conf
iden
ce in
terva
l; SE
P=so
cioec
onom
ic po
sitio
n; G
PA=g
rade
poi
nt a
vera
ge; C
ES-D
=Cen
ter f
or E
pide
mio
logic
al S
tudi
es D
epre
ssio
n Sc
ale.
23 Pr
eval
ence
of o
verw
eight
and
obe
sity w
aswe
ighte
d an
d no
t cal
cula
ted
for c
ontin
uous
varia
bles
(birt
hweig
ht,f
amily
con
nect
edne
ss,h
igh sc
hool
GPA
,and
CES
-D).
Over
weigh
t was
def
ined
as 2
5.0
to 2
9.9
kg/m
2 .Obe
sity w
as d
efin
ed a
s 30
kg/m
2or
gre
ater
.a Ad
juste
d fo
r age
,rac
e/et
hnici
ty,an
d pa
rent
al so
cioec
onom
ic po
sitio
n ba
sed
on p
aren
tal o
ccup
atio
n,ed
ucat
ion,
and
hous
ehol
d in
com
e m
easu
red
at w
ave
1 an
d bi
rthwe
ight r
epor
ted
by a
par
ent.
b The
sam
e as
mod
el 1,
but a
lso a
djus
ted
for f
amily
cha
ract
erist
ics in
cludi
ng fa
mily
stru
ctur
e,fa
mily
con
nect
edne
ss,a
nd p
aren
tal o
besit
y.c Th
e sa
me
as m
odel
2,bu
t also
adj
uste
d fo
r GPA
and
dep
ress
ive sy
mpt
oms (
CES-
D).
d The
sam
e as
mod
el 3,
but a
dditi
onal
ly ad
juste
d fo
r BM
I in
adol
esce
nce.

March 2008, Vol 98, No. 3 | American Journal of Public Health Yang et al. | Peer Reviewed | Research and Practice | 475
RESEARCH AND PRACTICE
associated with overweight and obesity afteradjustment for all covariates and showed a 2-to 4-times increase in the odds of overweightor obesity among those with lower familySEP. Parental obesity and adolescent BMIwere also associated with higher odds ofoverweight and obesity in early adulthood.
DISCUSSION
Consistent with the aims of the study, wefound clear socioeconomic inequalities insmoking according to one’s own SEP amongboth men and women in their early 20s irre-spective of family background and smokingduring adolescence. Second, family socioeco-nomic background was not clearly associ-ated with smoking in early adulthood, butfamily influences were observed throughfamily smoking patterns among both menand women as also found in other studies.25
Family SEP was also not strongly associatedwith smoking during adolescent years inour data (data not shown, but tables avail-able from the authors upon request). Thefinding that young adults’ own SEP was amore important contributor to smokingamong adolescents and young adults thanfamily SEP is also consistent with other stud-ies.26,27 This suggests that despite tracking ofsmoking from adolescence into young adult-hood28 and their potential influences onsocial trajectory through young adulthood,29
the socioeconomic patterning of smokingemerged and crystallized as individuals’ ownsocioeconomic position crystallized in theirearly 20s.
For overweight and obesity, socioeconomicpatterning was found both by family SEP andyoung adult SEP among women only, sug-gesting persistent effects of socioeconomicbackground and strengthening effects ofyoung adults’ own SEP. Family socioeco-nomic background showed a persistent effectirrespective of parental obesity and youngadults’ own SEP among women. Althoughwomen with larger BMI as adolescents weremore likely to be obese as young adults andto achieve lower SEP, consistent with otherstudies,30,31 the socioeconomic patterning ofobesity evident by family background wasfurther strengthened by the women’s ownSEP when they were in their early 20s.
Notably, we found a persistent effect ofhigh school GPA on heavy smoking in earlyadulthood as observed in other studies,26 inparticular among young men. Among women,the association of high school GPA withheavy smoking disappeared with adjustmentfor adolescent smoking. Koivusilta et al.32 sug-gested that school grades are a more sensitiveindicator of social stratification than tradi-tional indicators such as parental SEP to re-veal health inequalities among adolescents.Although our results may lend support totheir conclusions, high school GPA was notrelated to overweight or obesity in our study.It is also worth noting that young adult SEPwas associated with obesity only amongyoung women. Studies have found that theassociation between SEP and obesity isstronger and more consistent among adultwomen than among men.14,33 A recent studyby Wardle et al.34 showed that the associationvaried by measures of SEP in men such thateducation was associated with obesity in bothmen and women whereas occupation-basedclassification was associated with obesity onlyin women, which might partly explain the ab-sence of association among men in our study.
Study LimitationsTo assess the potential selection bias
caused by loss to follow-up, we compared ouranalytic sample to the original wave 1 sam-ple. The 2 samples were not different onmajor variables including parental SEP, smok-ing, and BMI during adolescence. However,those lost to follow-up had lower GPA andwere more likely to be from a single-parentfamily. Because we found that individualswith lower grades and from a single-parentfamily were more likely to smoke heavily andto have lower SEP in early adulthood, the as-sociations reported here could be underesti-mates. We also carried out sensitivity analysisby assigning those lost to follow-up as non-smokers and normal-weight individuals andour conclusions remained unchanged (resultsnot shown). To examine the robustness of ourresults in relation to missing variables, we re-analyzed our data with a category to indicatemissing information for our study variables,and our conclusions remained identical.
Although we found clear socioeconomicpatterning of smoking and obesity (among
women) in young adulthood by their firstachieved SEP, there could be other plausibleexplanations for the observed socioeconomicinequalities. For example, because there is a4- or 5-year gap between measurements ofsmoking during adolescence (wave 1 or 2)and early adulthood (wave 3), it is possiblethat participants would have started smokingafter the wave 1 or 2 interview and those ini-tiators may have dropped out of high schoolor entered blue-collar occupations beforewave 3.
Alternatively, the observed associations be-tween young adult SEP and smoking mayhave been caused by differential cessationrates across SEP.35 A total of 20% hadstopped smoking by wave 3 in our data. Prev-alence of cessation in the no further educa-tion and economically inactive, blue-collar oc-cupation, white-collar occupation, and furthereducation groups was 17%, 19%, 23%, and22%, respectively, among men. The corre-sponding figures for women were 21%, 17%,23%, and 23%. Therefore, it seems plausiblethat the observed socioeconomic inequalitiesin smoking by young adult SEP in our studycan be partly explained by differential cessa-tion rates by early adulthood. Similarly, socio-economic inactivity among young womenmay reflect their marital status and childbear-ing which would be in turn related to theirsmoking behavior and BMI. However, furtheradjustment for marital status, parenthood, andparity did not change our conclusions (resultsnot shown).
Other limitations pertained to the measuresused in our study. Our definitions of heavyand light-to-moderate smoking are somewhatarbitrary because there is no consensus indefining heavy smoking in the literature.However, our sensitivity analysis that useddaily smoking as an outcome showed essen-tially unchanged results. Second, our measureof young adult SEP is not conventional. Wecombined measures of educational historyand occupation at the labor market entryrather than using 1 of them or both sepa-rately in our multivariate analysis. Our ration-ale was that because 21.5% of the samplewere attending a university or graduateschool at the time of the wave 3 interviewand they were the most likely to obtainupper–white-collar occupations at their labor

American Journal of Public Health | March 2008, Vol 98, No. 3476 | Research and Practice | Peer Reviewed | Yang et al.
RESEARCH AND PRACTICE RESEARCH AND PRACTICE
market entry, a measure that combined edu-cation and occupation would likely yield abetter measure of social position in youngadulthood than education or occupationtaken separately.
ConclusionsOur results showed that smoking was crys-
tallized in a socioeconomically graded fashionas individuals’ own socioeconomic trajectoryalso became crystallized, such as through pur-suing tertiary education or getting a job, irre-spective of their family background. By con-trast, family socioeconomic background hadpersistent influences for overweight and obe-sity and its socioeconomic patterning wasstrengthened by the individuals’ own SEP, atleast among women. Importantly, our studyalso demonstrated that the relative impor-tance of family background and current SEPas determinants of health and behavior var-ied by outcomes. Smoking was more stronglyrelated to an individual’s own social positionas a young adult than to family SEP. How-ever, overweight and obesity in early adult-hood were related to both family SEP andyoung adult SEP.
This suggests that, although both smokingand overweight or obesity were patterned byadult SEP, the developmental origins of theseinequalities lie in different periods across thelife course. The observed differences betweensmoking and overweight or obesity high-lighted the importance of considering devel-opmentally specific processes related to socio-economic disadvantage that linksocioeconomic trajectories to health and be-havioral trajectories over the life course.Therefore, beneficial effects of interventionefforts to reduce the overall population bur-den and socioeconomic inequalities in smok-ing and obesity would be maximized forsmoking by targeting young adults who are ina socioeconomically transitional period, andfor overweight and obesity by targeting indi-viduals in an earlier stage of life, particularlywomen.
About the AuthorsSeungmi Yang and John Lynch are with the Department ofEpidemiology, Biostatistics and Occupational Health,McGill University, Montreal, Quebec. John Schulenberg iswith the Department of Psychology, University of Michi-gan, Ann Arbor. Ana V. Diez Roux is with the Center for
Social Epidemiology and Population Health, School ofPublic Health, University of Michigan, Ann Arbor. Trivel-lore Raghunathan is with the Department of Biostatistics,School of Public Health, University of Michigan, AnnArbor.
Requests for reprints should be sent to Seungmi Yang,Department of Epidemiology, Biostatistics and Occupa-tional Health, McGill University, 1020 Pine Ave West,Montreal, Quebec H3A 12A, Canada (e-mail:[email protected]).
This article was accepted May 16, 2007.
ContributorsS. Yang and J. Lynch originated the study and com-pleted the analyses. All authors helped to interpret find-ings and contributed to writing the article.
AcknowledgmentsS. Yang was funded in part by the Canadian Institute ofHealth Research (grant HOA-80072).
Human Participant ProtectionThe study was approved by the health sciences institu-tional review board at the University of Michigan.
References1. Yusuf S, Hawken S, Ounpuu S, et al. Effect of po-
tentially modifiable risk factors associated with myocar-dial infarction in 52 countries (the INTERHEARTstudy): case-control study. Lancet. 2004;364:937–952.
2. Lynch JW, Kaplan GA, Salonen JT. Why do poorpeople behave poorly? Variation in adult health behav-iours and psychosocial characteristics by stages of thesocioeconomic lifecourse. Soc Sci Med. 1997;44:809–819.
3. Marmot M, Wilkinson RG. Social Determinants ofHealth. New York, NY: Oxford University Press; 1999.
4. Lynch J, Davey Smith G. A life course approach tochronic disease epidemiology. Annu Rev Public Health.2005;26:1–35.
5. Johnston LD, O’Malley PM, Bachman JG, Schulen-berg JE. Monitoring the Future national survey resultson drug use, 1975–2003: Volume I, Secondary schoolstudents. Bethesda, Md: National Institute on DrugAbuse; 2003.
6. Preventing Tobacco Use Among Young People: A Re-port of the Surgeon General. Atlanta, Ga: National Cen-ter for Chronic Disease Prevention and Health Promo-tion; 1994.
7. Freedman DS, Khan LK, Dietz WH, SrinivasanSR, Berenson GS. Relationship of childhood obesity tocoronary heart disease risk factors in adulthood: theBogalusa Heart Study. Pediatrics. 2001;108:712–718.
8. Jarvis MJ, Wardle J. Social patterning of individualhealth behaviours: the case of cigarette smoking. In:Marmot M, Wilkinson RG, eds. Social Determinants ofHealth. Oxford, England: Oxford University Press;1999:240–255.
9. Lowry R, Kann L, Collins JL, Kolbe LJ. The effectof socioeconomic status on chronic disease risk behav-iors among US adolescents. JAMA. 1996;276:792–797.
10. Faulkner DL, Escobedo LG, Zhu BP, Chrismon
JH, Merritt RK. Race and the incidence of cigarettesmoking among adolescents in the United States. J NatlCancer Inst. 1996;88:1158–1160.
11. Glendinning A, Shucksmith J, Hendry L. Socialclass and adolescent smoking behaviour. Soc Sci Med.1994;38:1449–1460.
12. Soteriades ES, DiFranza JR. Parent’s socioeco-nomic status, adolescents’ disposable income, and ado-lescents’ smoking status in Massachusetts. Am J PublicHealth. 2003;93:1155–1160.
13. Parsons TJ, Power C, Logan S, Summerbell CD.Childhood predictors of adult obesity: a systematic re-view. Int J Obes Relat Metab Disord. 1999;23(suppl 8):S1–S107.
14. Sobal J, Stunkard AJ. Socioeconomic status andobesity: a review of the literature. Psych Bull. 1989;105:260–275.
15. Gillman MW. A life course approach to obesity.In: Kuh D, Ben-Shlomo Y, eds. A Life Course Approachto Chronic Disease Epidemiology. 2nd ed. Oxford, En-gland: Oxford University Press; 2004:189–217.
16. Power C, Matthews S. Origins of health inequali-ties in a national population sample. Lancet. 1997;350:1584–1589.
17. Schulenberg JE, Maggs JL. A developmental per-spective on alcohol use and heavy drinking during ado-lescence and the transition to young adulthood. J StudAlcohol Suppl. 2002;(14):54–70.
18. Arnett JJ. Emerging Adulthood: The Winding RoadFrom the Late Teens Through the Twenties. New York,NY: Oxford University Press; 2004.
19. Baranowski T, Cullen KW, Basen-Engquist K, etal. Transitions out of high school: time of increasedcancer risk? Prev Med. 1997;26:694–703.
20. Cullen KW, Koehly LM, Anderson C, et al. Gen-der differences in chronic disease risk behaviorsthrough the transition out of high school. Am J PrevMed. 1999;17:1–7.
21. Chantala K, Kalsbeek WD, Andraca E. Non-response in Wave III of the Add Health Study, 2004.Available at: http://www.cpc.unc.edu/projects/addhealth/files/W3nonres.pdf. Accessed March 9,2007.
22. Salmon L. 1998 standard occupational classifica-tion. Ind Relations. 1999;38:231–235.
23. Radloff LS. The CES-D scale: a self-report depres-sion scale for research in the general population. ApplPsychol Meas. 1977;1:385–401.
24. Resnick MD, Bearman PS, Blum RW, et al. Pro-tecting adolescents from harm. Findings from the Na-tional Longitudinal Study on Adolescent Health. JAMA.1997;278:823–832.
25. Kestila L, Koskinen S, Martelin T, et al. Influenceof parental education, childhood adversities, and cur-rent living conditions on daily smoking in early adult-hood. Eur J Public Health. 2006;16:617–626.
26. Karvonen S, Rimpela AH, Rimpela MK. Socialmobility and health related behaviours in young peo-ple. J Epidemiol Community Health. 1999;53:211–217.
27. Paavola M, Vartiainen E, Haukkala A. Smokingfrom adolescence to adulthood: the effects of parentaland own socioeconomic status. Eur J Public Health.2004;14:417–421.
28. Kandel DB, Chen K, Warner LA, Kessler RC,
March 2008, Vol 98, No. 3 | American Journal of Public Health Yang et al. | Peer Reviewed | Research and Practice | 477
RESEARCH AND PRACTICE
Grant B. Prevalence and demographic correlates ofsymptoms of last year dependence on alcohol, nicotine,marijuana and cocaine in the US population. Drug Al-cohol Depend. 1997;44:11–29.
29. Koivusilta L, Rimpela A, Vikat A. Health behav-iours and health in adolescence as predictors of educa-tional level in adulthood: a follow-up study from Fin-land. Soc Sci Med. 2003;57:577–593.
30. Whitaker RC, Wright JA, Pepe MS, Seidel KD,Dietz WH. Predicting obesity in young adulthood fromchildhood and parental obesity. N Engl J Med. 1997;337:869–873.
31. Gortmaker SL, Must A, Perrin JM, Sobol AM,Dietz WH. Social and economic consequences of over-weight in adolescence and young adulthood. N Engl JMed. 1993;329:1008–1012.
32. Koivusilta LK, Rimpela AH, Kautiainen SM.Health inequality in adolescence. Does stratificationoccur by familial social background, family affluence,or personal social position? BMC Public Health. 2006;6:110.
33. Leigh JP, Fries JF, Hubert HB. Gender and racedifferences in the correlation between body mass andeducation in the 1971–1975 NHANES I. J EpidemiolCommunity Health. 1992;46:191–196.
34. Wardle J, Waller J, Jarvis MJ. Sex differences inthe association of socioeconomic status with obesity.Am J Public Health. 2002;92:1299–1304.
35. Power C, Graham H, Due P, et al. The contribu-tion of childhood and adult socioeconomic position toadult obesity and smoking behaviour: an internationalcomparison. Int J Epidemiol. 2005;34:335–344.
Related Documents