RESEARCH ARTICLE Open Access Emergence of bimodal cell population responses from the interplay between analog single-cell signaling and protein expression noise Marc R Birtwistle 1,2,3,4 , Jens Rauch 2 , Anatoly Kiyatkin 3† , Edita Aksamitiene 3† , Maciej Dobrzyński 2† , Jan B Hoek 3 , Walter Kolch 2 , Babatunde A Ogunnaike 4* and Boris N Kholodenko 2,3* Abstract Background: Cell-to-cell variability in protein expression can be large, and its propagation through signaling networks affects biological outcomes. Here, we apply deterministic and probabilistic models and biochemical measurements to study how network topologies and cell-to-cell protein abundance variations interact to shape signaling responses. Results: We observe bimodal distributions of extracellular signal-regulated kinase (ERK) responses to epidermal growth factor (EGF) stimulation, which are generally thought to indicate bistable or ultrasensitive signaling behavior in single cells. Surprisingly, we find that a simple MAPK/ERK-cascade model with negative feedback that displays graded, analog ERK responses at a single cell level can explain the experimentally observed bimodality at the cell population level. Model analysis suggests that a conversion of graded input–output responses in single cells to digital responses at the population level is caused by a broad distribution of ERK pathway activation thresholds brought about by cell-to-cell variability in protein expression. Conclusions: Our results show that bimodal signaling response distributions do not necessarily imply digital (ultrasensitive or bistable) single cell signaling, and the interplay between protein expression noise and network topologies can bring about digital population responses from analog single cell dose responses. Thus, cells can retain the benefits of robustness arising from negative feedback, while simultaneously generating population-level on/off responses that are thought to be critical for regulating cell fate decisions. Background Development, growth and homeostasis of multi-cellular organisms depend on the ability of individual cells to convert noisy, analog signals into clear, yes-or-no cell fate decisions, such as apoptosis, proliferation and differ- entiation. One way that cells make such decisions is through the use of signal transduction systems that sense the strength of an analog input signal, and then convert it into one of several distinct activity states, such as “on” or “off” output states of highly ultrasensitive or bistable sys- tems [1-3]. For example, various mitogen concentrations can cause bistable activation of cyclin-dependent kinases to drive cell cycle transition decisions [4-6]. Theoretical stud- ies have shown that signaling networks containing positive or double negative feedback loops [3], opposing modifica- tion enzymes exhibiting saturation kinetics [1] and multi- site modification cycles [2,7] can exhibit digital (bistable or ultrasensitive) behavior. However, not all networks that contain such motifs will necessarily exhibit digital behavior; such behavior arises from the cell’ s precise tuning of quanti- tative, spatiotemporal aspects of the network. Indeed, the signal transduction network connecting epidermal growth factor (EGF) to activation of extracellular signal-regulated kinase 1/2 (ERK) contains many elements that potentially can lead to switch-like behavior. However, previous single cell studies in different mammalian cell lines have reported both graded [8,9] and “all-or-nothing” [10] EGF-induced ERK activation responses. One determinant of whether * Correspondence: [email protected]; [email protected] † Equal contributors 4 Dept. of Chemical and Biomolecular Engineering, University of Delaware, Newark, DE 19716, USA 2 Systems Biology Ireland, University College Dublin, Belfield, Dublin 4, Ireland Full list of author information is available at the end of the article © 2012 Birtwistle et al.; licensee BioMed Central Ltd. This is an Open Access article distributed under the terms of the Creative Commons Attribution License (http://creativecommons.org/licenses/by/2.0), which permits unrestricted use, distribution, and reproduction in any medium, provided the original work is properly cited. Birtwistle et al. BMC Systems Biology 2012, 6:109 http://www.biomedcentral.com/1752-0509/6/109

Welcome message from author
This document is posted to help you gain knowledge. Please leave a comment to let me know what you think about it! Share it to your friends and learn new things together.
Transcript
Birtwistle et al. BMC Systems Biology 2012, 6:109http://www.biomedcentral.com/1752-0509/6/109
RESEARCH ARTICLE Open Access
Emergence of bimodal cell population responsesfrom the interplay between analog single-cellsignaling and protein expression noiseMarc R Birtwistle1,2,3,4, Jens Rauch2, Anatoly Kiyatkin3†, Edita Aksamitiene3†, Maciej Dobrzyński2†, Jan B Hoek3,Walter Kolch2, Babatunde A Ogunnaike4* and Boris N Kholodenko2,3*
Abstract
Background: Cell-to-cell variability in protein expression can be large, and its propagation through signalingnetworks affects biological outcomes. Here, we apply deterministic and probabilistic models and biochemicalmeasurements to study how network topologies and cell-to-cell protein abundance variations interact to shapesignaling responses.
Results: We observe bimodal distributions of extracellular signal-regulated kinase (ERK) responses to epidermalgrowth factor (EGF) stimulation, which are generally thought to indicate bistable or ultrasensitive signaling behaviorin single cells. Surprisingly, we find that a simple MAPK/ERK-cascade model with negative feedback that displaysgraded, analog ERK responses at a single cell level can explain the experimentally observed bimodality at the cellpopulation level. Model analysis suggests that a conversion of graded input–output responses in single cells todigital responses at the population level is caused by a broad distribution of ERK pathway activation thresholdsbrought about by cell-to-cell variability in protein expression.
Conclusions: Our results show that bimodal signaling response distributions do not necessarily imply digital(ultrasensitive or bistable) single cell signaling, and the interplay between protein expression noise and networktopologies can bring about digital population responses from analog single cell dose responses. Thus, cells canretain the benefits of robustness arising from negative feedback, while simultaneously generating population-levelon/off responses that are thought to be critical for regulating cell fate decisions.
BackgroundDevelopment, growth and homeostasis of multi-cellularorganisms depend on the ability of individual cells toconvert noisy, analog signals into clear, yes-or-no cellfate decisions, such as apoptosis, proliferation and differ-entiation. One way that cells make such decisions isthrough the use of signal transduction systems that sensethe strength of an analog input signal, and then convert itinto one of several distinct activity states, such as “on” or“off” output states of highly ultrasensitive or bistable sys-tems [1-3]. For example, various mitogen concentrations
* Correspondence: [email protected]; [email protected]†Equal contributors4Dept. of Chemical and Biomolecular Engineering, University of Delaware,Newark, DE 19716, USA2Systems Biology Ireland, University College Dublin, Belfield, Dublin 4, IrelandFull list of author information is available at the end of the article
© 2012 Birtwistle et al.; licensee BioMed CentrCommons Attribution License (http://creativecreproduction in any medium, provided the or
can cause bistable activation of cyclin-dependent kinases todrive cell cycle transition decisions [4-6]. Theoretical stud-ies have shown that signaling networks containing positiveor double negative feedback loops [3], opposing modifica-tion enzymes exhibiting saturation kinetics [1] and multi-site modification cycles [2,7] can exhibit digital (bistable orultrasensitive) behavior. However, not all networks thatcontain such motifs will necessarily exhibit digital behavior;such behavior arises from the cell’s precise tuning of quanti-tative, spatiotemporal aspects of the network. Indeed, thesignal transduction network connecting epidermal growthfactor (EGF) to activation of extracellular signal-regulatedkinase 1/2 (ERK) contains many elements that potentiallycan lead to switch-like behavior. However, previous singlecell studies in different mammalian cell lines have reportedboth graded [8,9] and “all-or-nothing” [10] EGF-inducedERK activation responses. One determinant of whether
al Ltd. This is an Open Access article distributed under the terms of the Creativeommons.org/licenses/by/2.0), which permits unrestricted use, distribution, andiginal work is properly cited.
Birtwistle et al. BMC Systems Biology 2012, 6:109 Page 2 of 12http://www.biomedcentral.com/1752-0509/6/109
signaling is graded or switch-like is the spatial localizationof signal processing proteins [11].Under idealized conditions of cell-to-cell homogeneity,
experimental techniques such as immunoblotting thatmeasure average population responses may be able todetect all-or-none signaling responses, as long as the cell-to-cell variability in response activation thresholds arenegligible [12]. However, it is becoming clear that the fun-damental processes of transcription and translation are in-herently stochastic, and give rise to significant cell-to-cellvariability in protein levels [13-20]. The primary stochasticfactors are (i) the rate of transcription, which is burst-likedue to the low number (two) of genes for a particular pro-tein in a cell [21,22] and (ii) the number of proteins pro-duced per mRNA, which is random due to competitionbetween ribosomes and RNase for the mRNA [13,23,24].Protein degradation also contributes to expression noise,but usually to a lesser extent, since protein copy numbersare typically large enough to dampen the comparativelysmall stochastic fluctuations in degradation rate. Thus,even genetically identical cells show substantial variationsin protein and mRNA abundance, and as a result, mayalso show differences in their signaling responses [25]. Be-cause of such heterogeneity in protein abundance, po-pulation average measurements are not sufficient forinvestigating “all-or-nothing” responses; single-cell meas-urement techniques capable of capturing the dynamics ofdigital signal transduction are needed [12].Here, we use flow cytometry to measure EGF-induced,
single-cell ERK activation responses in a HEK293 cellpopulation. We observe bimodal response distributionsin cell populations that are usually thought to indicateswitch-like behavior in single cells. Surprisingly, an ERKcascade signaling model incorporating negative feedbackand a graded, analog single cell dose response is shownto be consistent with the observed population responses.Our model analysis suggests that such a conversion ofanalog responses in single cells to digital responses atthe population level is due to protein abundance vari-ability, which gives rise to a broad distribution of ERKpathway activation thresholds and RasGTP levels. Thus,bimodal response distributions do not necessarily implydigital single cell signaling; such distributions can arisefrom the interplay between protein expression noise andnegative feedback-mediated, analog single-cell responses.
ResultsAnalyses of ERK responses to EGF in individual cells andpopulationsWe used a flow cytometry-based phosphorylation assay(FCPA) [26] to determine the kinetics and dose responseof ERK activation by EGF in HEK293 cells. We show thatpopulation averages obtained from FCPA results corres-pond well to traditional Western blot measurements of
activated (dually phosphorylated) ppERK levels in cellpopulations (Additional file 1: Figure S1). However, theFCPA also reveals how individual cells contribute to thiscollective population response (Figure 1A-D; Additionalfile 1: Figure S2). The increase in mean values of ppERKwas dose-dependent after two minutes of EGF stimulation,suggesting that analog signaling has occurred in individualcells. However, a fraction of cells contain ppERK levelssimilar to those of the basal state. We refer to this featureof the distribution as a shoulder. Although the height ofthis shoulder decreases with increasing EGF dose, its pos-ition remains unchanged, indicating a dose-dependentfraction of cells failing to activate ERK. At five minutesafter EGF stimulation, the ppERK distribution is unam-biguously bimodal, implying digital “on-off” behavior.Higher EGF doses increase the fraction of cells with highppERK (”ERK-on”) at the expense of the “ERK-off” popula-tion. Thus, in a dose-dependent manner, EGF increasesthe probability that a cell will have ERK turned on. At latertime points, a bimodal distribution persists at some EGFdoses, while data from other doses show “shouldering”patterns similar to the behavior at 2 minutes. Thus, theEGF-induced ERK response on the population level iscomplex consisting of both analog and digital elements.Next, we investigated how cell-to-cell variability in total
ERK abundance affects the ppERK responses. Measure-ments of the total ERK distribution by flow cytometry, asexpected, revealed substantial cell-to-cell variability intotal ERK levels (Figure 1E). The data are well-approximated by a gamma distribution, which has beenpostulated by others to be a good representation of cell-to-cell variability in protein levels (Figure 1E-green line)[22,27-31]. We then stimulated cells with 0.1 and 1 nMEGF for 5 minutes and measured both ppERK and ERKlevels simultaneously (Figures 1F-I). Normalizing theppERK levels by the amount of total ERK in each individ-ual cell does not change the variance of “ERK-off” popula-tion (Figures 1F-G—compare green to black lines). This ismost likely because measurement variability is dominantat these low ppERK levels, and normalizing by total ERKlevels does not correct for measurement variability. Nor-malizing the ppERK levels by total ERK levels does reducethe variability of the “ERK-on” population, but does notchange the fraction of cells in the “ERK-on” and “ERK-off”populations (Figures 1F-G). This assertion is reinforced bythe fact that ppERK levels in both the “ERK-off” and“ERK-on” populations span the entire spectrum of totalERK levels (Figures 1H-I). Moreover, there is significantpositive correlation between total ERK and ppERK levels inboth the ERK-off and ERK-on populations (Figures 1H-I).Thus, although cell-to-cell variability in ERK abundancecontributes to ppERK response variability, it does not con-trol bimodality, raising the question of what other factorscontribute to the observed bimodality.
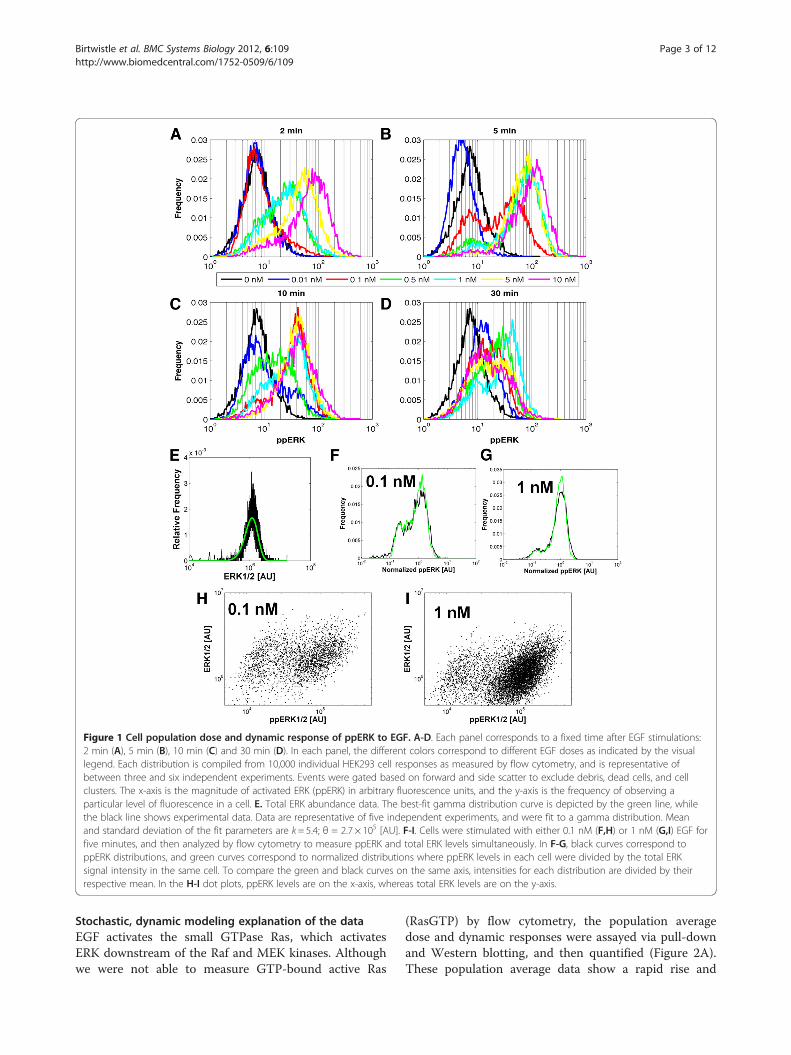
Figure 1 Cell population dose and dynamic response of ppERK to EGF. A-D. Each panel corresponds to a fixed time after EGF stimulations:2 min (A), 5 min (B), 10 min (C) and 30 min (D). In each panel, the different colors correspond to different EGF doses as indicated by the visuallegend. Each distribution is compiled from 10,000 individual HEK293 cell responses as measured by flow cytometry, and is representative ofbetween three and six independent experiments. Events were gated based on forward and side scatter to exclude debris, dead cells, and cellclusters. The x-axis is the magnitude of activated ERK (ppERK) in arbitrary fluorescence units, and the y-axis is the frequency of observing aparticular level of fluorescence in a cell. E. Total ERK abundance data. The best-fit gamma distribution curve is depicted by the green line, whilethe black line shows experimental data. Data are representative of five independent experiments, and were fit to a gamma distribution. Meanand standard deviation of the fit parameters are k= 5.4; θ = 2.7 × 10⁵ [AU]. F-I. Cells were stimulated with either 0.1 nM (F,H) or 1 nM (G,I) EGF forfive minutes, and then analyzed by flow cytometry to measure ppERK and total ERK levels simultaneously. In F-G, black curves correspond toppERK distributions, and green curves correspond to normalized distributions where ppERK levels in each cell were divided by the total ERKsignal intensity in the same cell. To compare the green and black curves on the same axis, intensities for each distribution are divided by theirrespective mean. In the H-I dot plots, ppERK levels are on the x-axis, whereas total ERK levels are on the y-axis.
Birtwistle et al. BMC Systems Biology 2012, 6:109 Page 3 of 12http://www.biomedcentral.com/1752-0509/6/109
Stochastic, dynamic modeling explanation of the dataEGF activates the small GTPase Ras, which activatesERK downstream of the Raf and MEK kinases. Althoughwe were not able to measure GTP-bound active Ras
(RasGTP) by flow cytometry, the population averagedose and dynamic responses were assayed via pull-downand Western blotting, and then quantified (Figure 2A).These population average data show a rapid rise and
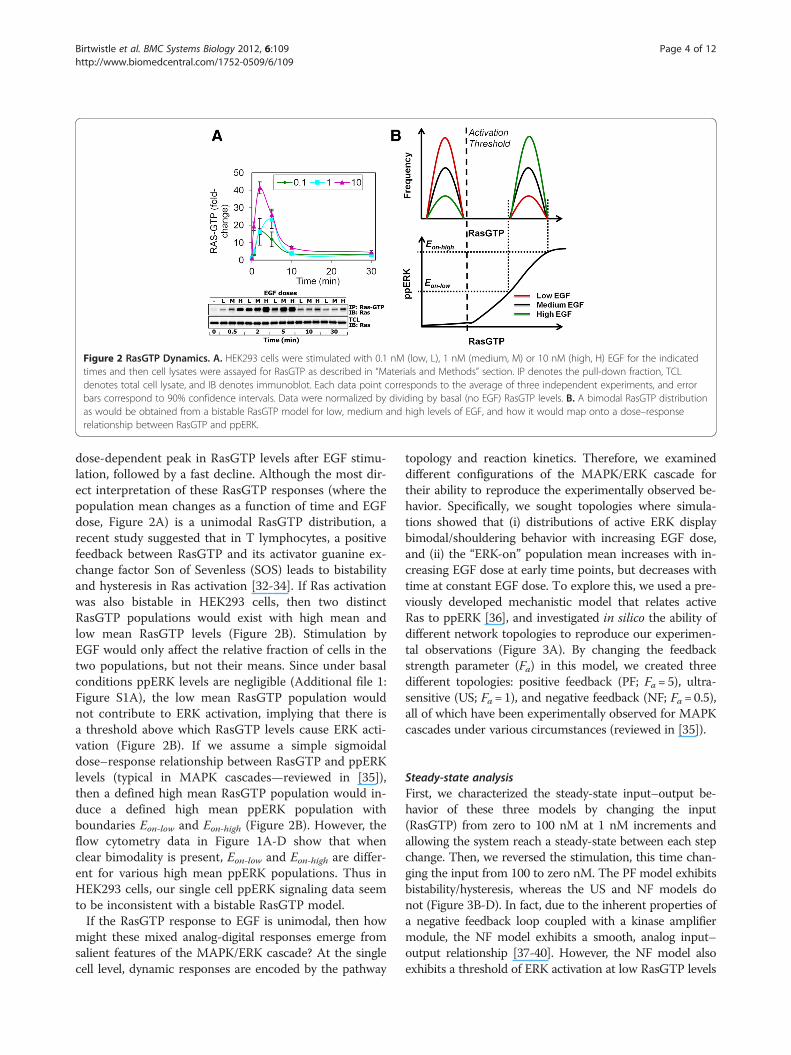
Figure 2 RasGTP Dynamics. A. HEK293 cells were stimulated with 0.1 nM (low, L), 1 nM (medium, M) or 10 nM (high, H) EGF for the indicatedtimes and then cell lysates were assayed for RasGTP as described in “Materials and Methods” section. IP denotes the pull-down fraction, TCLdenotes total cell lysate, and IB denotes immunoblot. Each data point corresponds to the average of three independent experiments, and errorbars correspond to 90% confidence intervals. Data were normalized by dividing by basal (no EGF) RasGTP levels. B. A bimodal RasGTP distributionas would be obtained from a bistable RasGTP model for low, medium and high levels of EGF, and how it would map onto a dose–responserelationship between RasGTP and ppERK.
Birtwistle et al. BMC Systems Biology 2012, 6:109 Page 4 of 12http://www.biomedcentral.com/1752-0509/6/109
dose-dependent peak in RasGTP levels after EGF stimu-lation, followed by a fast decline. Although the most dir-ect interpretation of these RasGTP responses (where thepopulation mean changes as a function of time and EGFdose, Figure 2A) is a unimodal RasGTP distribution, arecent study suggested that in T lymphocytes, a positivefeedback between RasGTP and its activator guanine ex-change factor Son of Sevenless (SOS) leads to bistabilityand hysteresis in Ras activation [32-34]. If Ras activationwas also bistable in HEK293 cells, then two distinctRasGTP populations would exist with high mean andlow mean RasGTP levels (Figure 2B). Stimulation byEGF would only affect the relative fraction of cells in thetwo populations, but not their means. Since under basalconditions ppERK levels are negligible (Additional file 1:Figure S1A), the low mean RasGTP population wouldnot contribute to ERK activation, implying that there isa threshold above which RasGTP levels cause ERK acti-vation (Figure 2B). If we assume a simple sigmoidaldose–response relationship between RasGTP and ppERKlevels (typical in MAPK cascades—reviewed in [35]),then a defined high mean RasGTP population would in-duce a defined high mean ppERK population withboundaries Eon-low and Eon-high (Figure 2B). However, theflow cytometry data in Figure 1A-D show that whenclear bimodality is present, Eon-low and Eon-high are differ-ent for various high mean ppERK populations. Thus inHEK293 cells, our single cell ppERK signaling data seemto be inconsistent with a bistable RasGTP model.If the RasGTP response to EGF is unimodal, then how
might these mixed analog-digital responses emerge fromsalient features of the MAPK/ERK cascade? At the singlecell level, dynamic responses are encoded by the pathway
topology and reaction kinetics. Therefore, we examineddifferent configurations of the MAPK/ERK cascade fortheir ability to reproduce the experimentally observed be-havior. Specifically, we sought topologies where simula-tions showed that (i) distributions of active ERK displaybimodal/shouldering behavior with increasing EGF dose,and (ii) the “ERK-on” population mean increases with in-creasing EGF dose at early time points, but decreases withtime at constant EGF dose. To explore this, we used a pre-viously developed mechanistic model that relates activeRas to ppERK [36], and investigated in silico the ability ofdifferent network topologies to reproduce our experimen-tal observations (Figure 3A). By changing the feedbackstrength parameter (Fa) in this model, we created threedifferent topologies: positive feedback (PF; Fa= 5), ultra-sensitive (US; Fa=1), and negative feedback (NF; Fa=0.5),all of which have been experimentally observed for MAPKcascades under various circumstances (reviewed in [35]).
Steady-state analysisFirst, we characterized the steady-state input–output be-havior of these three models by changing the input(RasGTP) from zero to 100 nM at 1 nM increments andallowing the system reach a steady-state between each stepchange. Then, we reversed the stimulation, this time chan-ging the input from 100 to zero nM. The PF model exhibitsbistability/hysteresis, whereas the US and NF models donot (Figure 3B-D). In fact, due to the inherent properties ofa negative feedback loop coupled with a kinase amplifiermodule, the NF model exhibits a smooth, analog input–output relationship [37-40]. However, the NF model alsoexhibits a threshold of ERK activation at low RasGTP levels
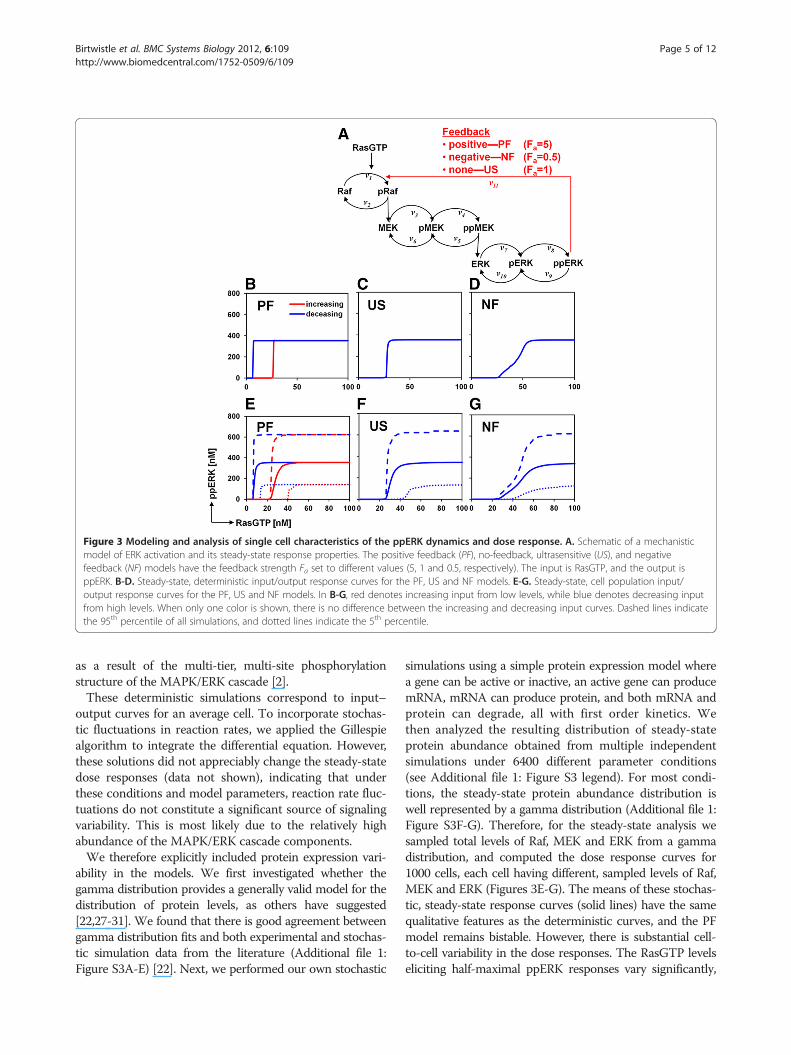
Figure 3 Modeling and analysis of single cell characteristics of the ppERK dynamics and dose response. A. Schematic of a mechanisticmodel of ERK activation and its steady-state response properties. The positive feedback (PF), no-feedback, ultrasensitive (US), and negativefeedback (NF) models have the feedback strength Fa set to different values (5, 1 and 0.5, respectively). The input is RasGTP, and the output isppERK. B-D. Steady-state, deterministic input/output response curves for the PF, US and NF models. E-G. Steady-state, cell population input/output response curves for the PF, US and NF models. In B-G, red denotes increasing input from low levels, while blue denotes decreasing inputfrom high levels. When only one color is shown, there is no difference between the increasing and decreasing input curves. Dashed lines indicatethe 95th percentile of all simulations, and dotted lines indicate the 5th percentile.
Birtwistle et al. BMC Systems Biology 2012, 6:109 Page 5 of 12http://www.biomedcentral.com/1752-0509/6/109
as a result of the multi-tier, multi-site phosphorylationstructure of the MAPK/ERK cascade [2].These deterministic simulations correspond to input–
output curves for an average cell. To incorporate stochas-tic fluctuations in reaction rates, we applied the Gillespiealgorithm to integrate the differential equation. However,these solutions did not appreciably change the steady-statedose responses (data not shown), indicating that underthese conditions and model parameters, reaction rate fluc-tuations do not constitute a significant source of signalingvariability. This is most likely due to the relatively highabundance of the MAPK/ERK cascade components.We therefore explicitly included protein expression vari-
ability in the models. We first investigated whether thegamma distribution provides a generally valid model for thedistribution of protein levels, as others have suggested[22,27-31]. We found that there is good agreement betweengamma distribution fits and both experimental and stochas-tic simulation data from the literature (Additional file 1:Figure S3A-E) [22]. Next, we performed our own stochastic
simulations using a simple protein expression model wherea gene can be active or inactive, an active gene can producemRNA, mRNA can produce protein, and both mRNA andprotein can degrade, all with first order kinetics. Wethen analyzed the resulting distribution of steady-stateprotein abundance obtained from multiple independentsimulations under 6400 different parameter conditions(see Additional file 1: Figure S3 legend). For most condi-tions, the steady-state protein abundance distribution iswell represented by a gamma distribution (Additional file 1:Figure S3F-G). Therefore, for the steady-state analysis wesampled total levels of Raf, MEK and ERK from a gammadistribution, and computed the dose response curves for1000 cells, each cell having different, sampled levels of Raf,MEK and ERK (Figures 3E-G). The means of these stochas-tic, steady-state response curves (solid lines) have the samequalitative features as the deterministic curves, and the PFmodel remains bistable. However, there is substantial cell-to-cell variability in the dose responses. The RasGTP levelseliciting half-maximal ppERK responses vary significantly,
Birtwistle et al. BMC Systems Biology 2012, 6:109 Page 6 of 12http://www.biomedcentral.com/1752-0509/6/109
as do the maximum ppERK levels. According to theseresults, stochastic variability in protein expression is amajor contributor to steady-state, cell-to-cell signaling vari-ability, inducing a wide distribution of ERK activationthresholds.
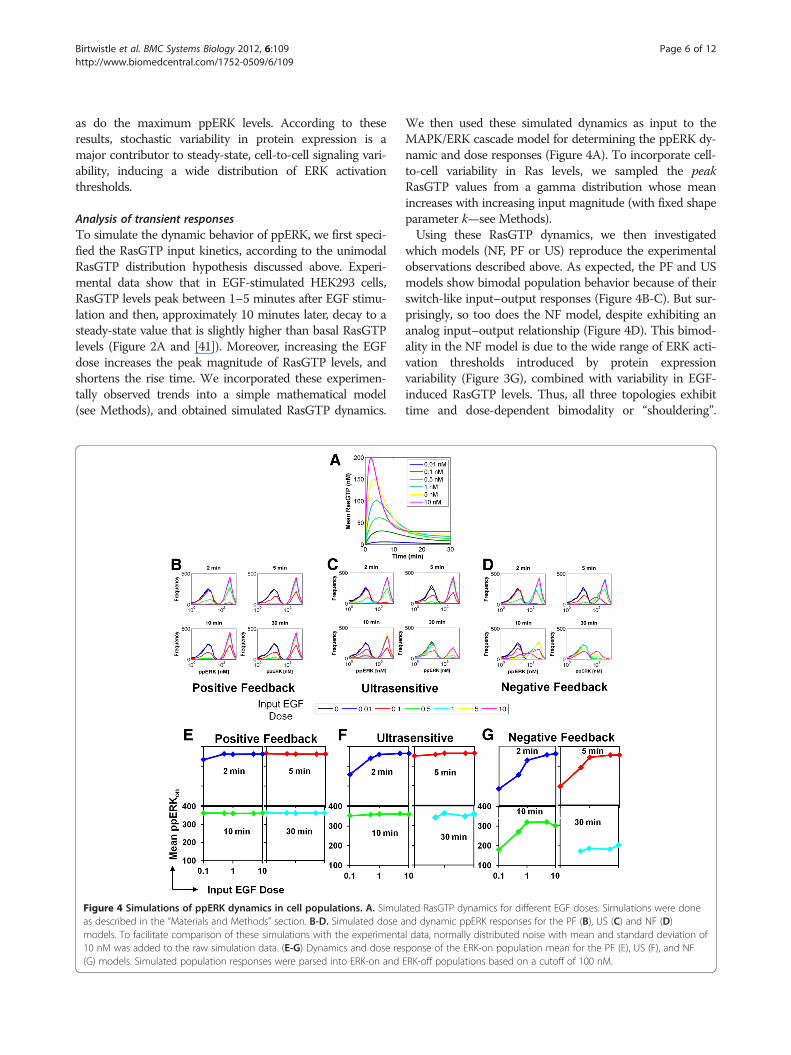
Analysis of transient responsesTo simulate the dynamic behavior of ppERK, we first speci-fied the RasGTP input kinetics, according to the unimodalRasGTP distribution hypothesis discussed above. Experi-mental data show that in EGF-stimulated HEK293 cells,RasGTP levels peak between 1–5 minutes after EGF stimu-lation and then, approximately 10 minutes later, decay to asteady-state value that is slightly higher than basal RasGTPlevels (Figure 2A and [41]). Moreover, increasing the EGFdose increases the peak magnitude of RasGTP levels, andshortens the rise time. We incorporated these experimen-tally observed trends into a simple mathematical model(see Methods), and obtained simulated RasGTP dynamics.
Figure 4 Simulations of ppERK dynamics in cell populations. A. Simulaas described in the “Materials and Methods” section. B-D. Simulated dose amodels. To facilitate comparison of these simulations with the experimenta10 nM was added to the raw simulation data. (E-G) Dynamics and dose res(G) models. Simulated population responses were parsed into ERK-on and
We then used these simulated dynamics as input to theMAPK/ERK cascade model for determining the ppERK dy-namic and dose responses (Figure 4A). To incorporate cell-to-cell variability in Ras levels, we sampled the peakRasGTP values from a gamma distribution whose meanincreases with increasing input magnitude (with fixed shapeparameter k—see Methods).Using these RasGTP dynamics, we then investigated
which models (NF, PF or US) reproduce the experimentalobservations described above. As expected, the PF and USmodels show bimodal population behavior because of theirswitch-like input–output responses (Figure 4B-C). But sur-prisingly, so too does the NF model, despite exhibiting ananalog input–output relationship (Figure 4D). This bimod-ality in the NF model is due to the wide range of ERK acti-vation thresholds introduced by protein expressionvariability (Figure 3G), combined with variability in EGF-induced RasGTP levels. Thus, all three topologies exhibittime and dose-dependent bimodality or “shouldering”.
ted RasGTP dynamics for different EGF doses. Simulations were donend dynamic ppERK responses for the PF (B), US (C) and NF (D)l data, normally distributed noise with mean and standard deviation ofponse of the ERK-on population mean for the PF (E), US (F), and NFERK-off populations based on a cutoff of 100 nM.
Birtwistle et al. BMC Systems Biology 2012, 6:109 Page 7 of 12http://www.biomedcentral.com/1752-0509/6/109
However, only the NF model simulations, and not those ofthe US or PF models, reproduce proper behavior of theERK-on population mean, namely that the mean increasesas a function of dose at short times (Figure 4E-G; Figure 1),and decreases as a function of time at a particular EGFdose (Figure 4E-G; Additional file 1: Figure S2).We conclude that for the realistic parameter values used
here, the NF model with protein expression variability ismost consistent with experimental data. To examine if thisconclusion holds over a wide range of parameter values,we employed parameter sensitivity analysis (see Methodsand Additional file 1: Figure S4). This analysis showedthat models with negative feedback preferentiallydemonstrated the experimentally observed signalingcharacteristics over the examined parameter ranges(Additional file 1: Figure S4). Yet, we cannot rule outthe possibility that positive feedback and ultrasensitivesystems may also exhibit the experimentally observedbehavior. Indeed, sensitivity analysis also showed thatunder some rare parameter conditions, the mean ppERKlevels in the ERK-on population increase as a function ofdose at short times for the PF and US models (Additionalfile 1: Figure S4A,C). One mechanism that may lead tothis PF and US model behavior is if the ppERK activationkinetics were slow, such that the behavior at 2 and 5 minpost EGF stimulation were due to transient effects, ratherthan a pseudo-steady state phenomenon. Yet, for PFmodels, simulated ppERK signaling remains high over the30-minute time course (Additional file 1: Figure S4B,D),rather than returning closer to basal levels as the experi-mental data show (Additional file 1: Figure S2). Thus, theERK cascade model with negative feedback seems to bethe most consistent with our experimental observationsover a wide range of parameter values.
Test of the negative feedback predictionAlthough the preceding analysis suggests that in ourHEK293 cell system the most likely net feedback strengthfrom ERK is negative, parameter sensitivity analysisshowed that ultrasensitive or positive feedback systems
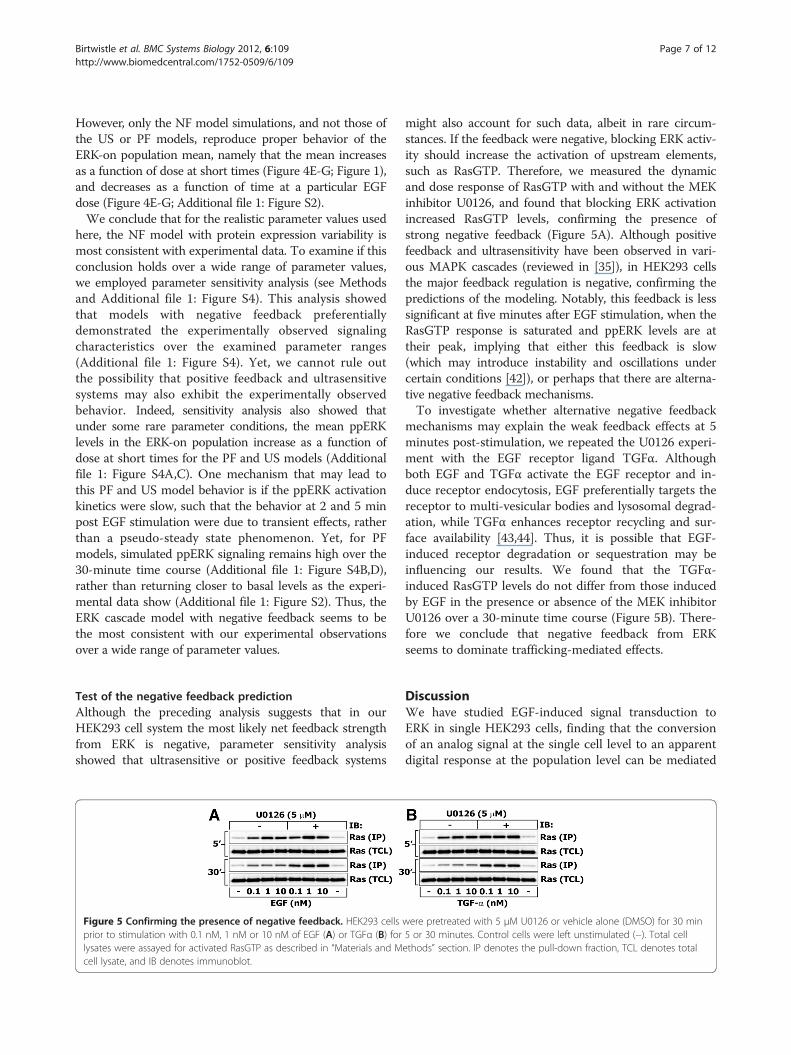
Figure 5 Confirming the presence of negative feedback. HEK293 cellsprior to stimulation with 0.1 nM, 1 nM or 10 nM of EGF (A) or TGFα (B) forlysates were assayed for activated RasGTP as described in “Materials and Mcell lysate, and IB denotes immunoblot.
might also account for such data, albeit in rare circum-stances. If the feedback were negative, blocking ERK activ-ity should increase the activation of upstream elements,such as RasGTP. Therefore, we measured the dynamicand dose response of RasGTP with and without the MEKinhibitor U0126, and found that blocking ERK activationincreased RasGTP levels, confirming the presence ofstrong negative feedback (Figure 5A). Although positivefeedback and ultrasensitivity have been observed in vari-ous MAPK cascades (reviewed in [35]), in HEK293 cellsthe major feedback regulation is negative, confirming thepredictions of the modeling. Notably, this feedback is lesssignificant at five minutes after EGF stimulation, when theRasGTP response is saturated and ppERK levels are attheir peak, implying that either this feedback is slow(which may introduce instability and oscillations undercertain conditions [42]), or perhaps that there are alterna-tive negative feedback mechanisms.To investigate whether alternative negative feedback
mechanisms may explain the weak feedback effects at 5minutes post-stimulation, we repeated the U0126 experi-ment with the EGF receptor ligand TGFα. Althoughboth EGF and TGFα activate the EGF receptor and in-duce receptor endocytosis, EGF preferentially targets thereceptor to multi-vesicular bodies and lysosomal degrad-ation, while TGFα enhances receptor recycling and sur-face availability [43,44]. Thus, it is possible that EGF-induced receptor degradation or sequestration may beinfluencing our results. We found that the TGFα-induced RasGTP levels do not differ from those inducedby EGF in the presence or absence of the MEK inhibitorU0126 over a 30-minute time course (Figure 5B). There-fore we conclude that negative feedback from ERKseems to dominate trafficking-mediated effects.
DiscussionWe have studied EGF-induced signal transduction toERK in single HEK293 cells, finding that the conversionof an analog signal at the single cell level to an apparentdigital response at the population level can be mediated
were pretreated with 5 μM U0126 or vehicle alone (DMSO) for 30 min5 or 30 minutes. Control cells were left unstimulated (−). Total cellethods” section. IP denotes the pull-down fraction, TCL denotes total
Birtwistle et al. BMC Systems Biology 2012, 6:109 Page 8 of 12http://www.biomedcentral.com/1752-0509/6/109
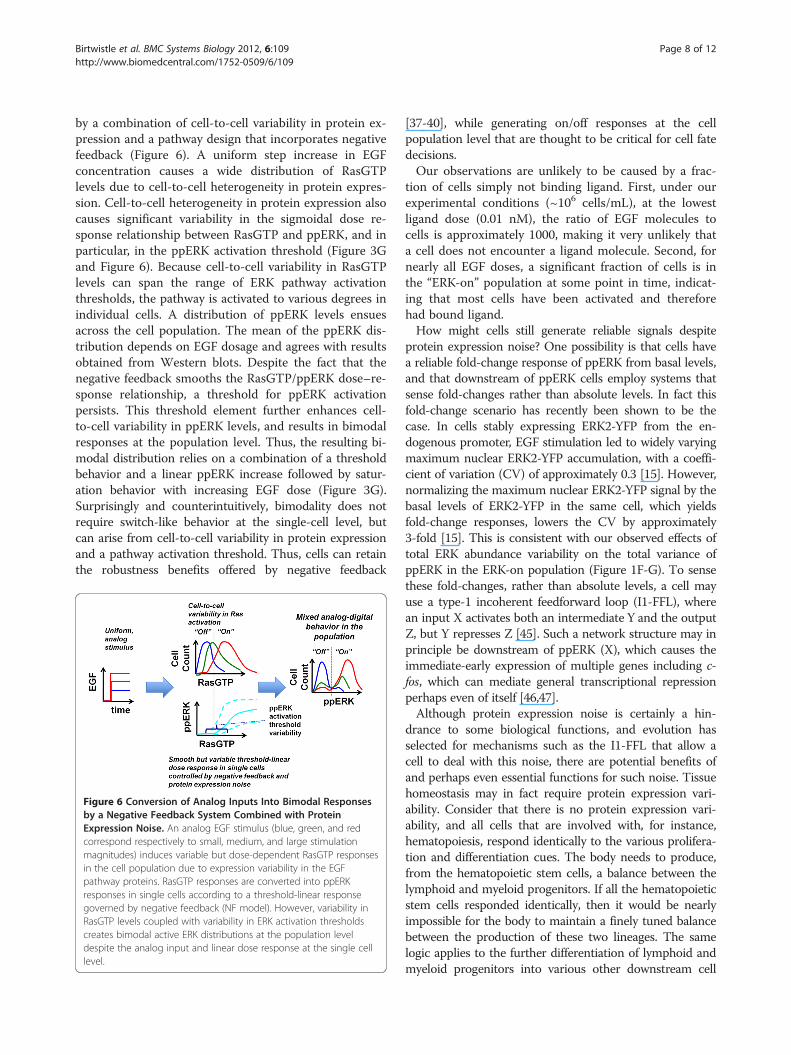
by a combination of cell-to-cell variability in protein ex-pression and a pathway design that incorporates negativefeedback (Figure 6). A uniform step increase in EGFconcentration causes a wide distribution of RasGTPlevels due to cell-to-cell heterogeneity in protein expres-sion. Cell-to-cell heterogeneity in protein expression alsocauses significant variability in the sigmoidal dose re-sponse relationship between RasGTP and ppERK, and inparticular, in the ppERK activation threshold (Figure 3Gand Figure 6). Because cell-to-cell variability in RasGTPlevels can span the range of ERK pathway activationthresholds, the pathway is activated to various degrees inindividual cells. A distribution of ppERK levels ensuesacross the cell population. The mean of the ppERK dis-tribution depends on EGF dosage and agrees with resultsobtained from Western blots. Despite the fact that thenegative feedback smooths the RasGTP/ppERK dose–re-sponse relationship, a threshold for ppERK activationpersists. This threshold element further enhances cell-to-cell variability in ppERK levels, and results in bimodalresponses at the population level. Thus, the resulting bi-modal distribution relies on a combination of a thresholdbehavior and a linear ppERK increase followed by satur-ation behavior with increasing EGF dose (Figure 3G).Surprisingly and counterintuitively, bimodality does notrequire switch-like behavior at the single-cell level, butcan arise from cell-to-cell variability in protein expressionand a pathway activation threshold. Thus, cells can retainthe robustness benefits offered by negative feedback
Figure 6 Conversion of Analog Inputs Into Bimodal Responsesby a Negative Feedback System Combined with ProteinExpression Noise. An analog EGF stimulus (blue, green, and redcorrespond respectively to small, medium, and large stimulationmagnitudes) induces variable but dose-dependent RasGTP responsesin the cell population due to expression variability in the EGFpathway proteins. RasGTP responses are converted into ppERKresponses in single cells according to a threshold-linear responsegoverned by negative feedback (NF model). However, variability inRasGTP levels coupled with variability in ERK activation thresholdscreates bimodal active ERK distributions at the population leveldespite the analog input and linear dose response at the single celllevel.
[37-40], while generating on/off responses at the cellpopulation level that are thought to be critical for cell fatedecisions.Our observations are unlikely to be caused by a frac-
tion of cells simply not binding ligand. First, under ourexperimental conditions (~106 cells/mL), at the lowestligand dose (0.01 nM), the ratio of EGF molecules tocells is approximately 1000, making it very unlikely thata cell does not encounter a ligand molecule. Second, fornearly all EGF doses, a significant fraction of cells is inthe “ERK-on” population at some point in time, indicat-ing that most cells have been activated and thereforehad bound ligand.How might cells still generate reliable signals despite
protein expression noise? One possibility is that cells havea reliable fold-change response of ppERK from basal levels,and that downstream of ppERK cells employ systems thatsense fold-changes rather than absolute levels. In fact thisfold-change scenario has recently been shown to be thecase. In cells stably expressing ERK2-YFP from the en-dogenous promoter, EGF stimulation led to widely varyingmaximum nuclear ERK2-YFP accumulation, with a coeffi-cient of variation (CV) of approximately 0.3 [15]. However,normalizing the maximum nuclear ERK2-YFP signal by thebasal levels of ERK2-YFP in the same cell, which yieldsfold-change responses, lowers the CV by approximately3-fold [15]. This is consistent with our observed effects oftotal ERK abundance variability on the total variance ofppERK in the ERK-on population (Figure 1F-G). To sensethese fold-changes, rather than absolute levels, a cell mayuse a type-1 incoherent feedforward loop (I1-FFL), wherean input X activates both an intermediate Y and the outputZ, but Y represses Z [45]. Such a network structure may inprinciple be downstream of ppERK (X), which causes theimmediate-early expression of multiple genes including c-fos, which can mediate general transcriptional repressionperhaps even of itself [46,47].Although protein expression noise is certainly a hin-
drance to some biological functions, and evolution hasselected for mechanisms such as the I1-FFL that allow acell to deal with this noise, there are potential benefits ofand perhaps even essential functions for such noise. Tissuehomeostasis may in fact require protein expression vari-ability. Consider that there is no protein expression vari-ability, and all cells that are involved with, for instance,hematopoiesis, respond identically to the various prolifera-tion and differentiation cues. The body needs to produce,from the hematopoietic stem cells, a balance between thelymphoid and myeloid progenitors. If all the hematopoieticstem cells responded identically, then it would be nearlyimpossible for the body to maintain a finely tuned balancebetween the production of these two lineages. The samelogic applies to the further differentiation of lymphoid andmyeloid progenitors into various other downstream cell
Birtwistle et al. BMC Systems Biology 2012, 6:109 Page 9 of 12http://www.biomedcentral.com/1752-0509/6/109
types, such as megakaryocytes, erythrocytes, B cells, T cells,and natural killer cells, where finely tuned control of differ-ential cell-fate decisions is even more critical. Thus, it islikely that without protein expression noise-inducedphenotypic variability, homeostasis of hematopoiesis, andprobably other tissues, would not be possible. This logicargues for a conceptual model whereby growth factor con-centration, in tissues, controls the probability a cell willchoose a particular fate.
ConclusionsIt is commonly thought that the existence of bimodal sig-naling behavior on the population level is indicative of so-called digital behavior (such as all-or-none switches) of theunderlying signaling network in single cells. Our workdemonstrates that this is not necessarily the case; proteinexpression noise coupled with nonlinear network dynamicscan bring about digital population responses from analogsingle cell dose responses. In particular, we show that anetwork combining an activation threshold and strongnegative feedback also robustly displays such bimodalpopulation behavior due to cell-to-cell variability in proteinexpression levels. This system retains the benefits of robust-ness arising from negative feedback, while simultaneouslygenerating population-level on/off responses thought to becritical for cell fate decisions. Overall, the results extend ourunderstanding of the amazing behavioral complexity thatcan be displayed by even small molecular networks [48].
MethodsCell cultureHuman Embryonic Kidney 293 (HEK293) cells wereobtained from the American Type Culture Collection(Manassas, VA). Cells were maintained in a humidified 5%CO2 incubator at 37°C and cultured in Dulbecco's modi-fied Eagle's medium/F-12 supplemented with 10% fetalbovine serum (Life Technologies-Invitrogen, Carlsbad, CA)and penicillin-streptomycin solution (100 μg/ml, ThermoFisher Scientific).
Flow cytometryHEK293 cells were serum starved for 16 hours before theexperiment. The cells were then lifted (by scraping or tryp-sinization), washed twice with serum-free medium (con-taining soybean trypsin inhibitor in the case of trypticlifting), allowed to equilibrate for 30 minutes, and stimu-lated with EGF (Sigma-Aldrich, St. Louis, MO). We veri-fied that the bimodal ppERK behavior was not affected bycell detachment (Additional file 1: Figure S5). After EGFstimulation for the desired time interval, cells were fixedwith 2% paraformaldehyde (Sigma-Aldrich) for 10 minutesat 37°C, and then cooled on ice. After centrifugation, thecells were permeabilized in ice-cold 90% methanol (Sigma-Aldrich) for 30 minutes. The cells were then washed by
centrifugation and 5x10⁵ cells were resuspended in 90 μLincubation/blocking buffer (0.5% BSA in PBS) for 10 min-utes. The cells were then incubated for 60 minutes in thedark at room temperature with phospho-ERK1/2 (T202/Y204) mouse mAb (E10) Alexa 488 Conjugate for activeERK and ERK1/2 rabbit mAb (4695) detected by secondarystaining with an anti-rabbit Alexa 647-conjugate (Cell Sig-naling Technologies, Beverley, MA). The cells were washedby centrifugation with PBS and resuspended in 0.5 mL ofPBS. The samples were then analyzed with a Becton-Dickinson FACSCalibur or on an Accuri C6. For each sam-ple, 10,000 events (cells) were analyzed. Data were processedusing FlowJo™ software (Tree Star, Inc.) and MATLAB™ (TheMathworks). Post-gating by forward and side scatter wasperformed to remove events corresponding to dead cells,debris, and cell clusters (i.e. doublets). As controls westained cells with non-specific, isotype-matched control anti-bodies (also obtained from Cell Signaling). We verified thespecificity of the antibodies (Additional file 1: Figure S1).
Western blottingThe above procedure for cell preparation was followed,but instead of fixing cells in paraformaldhyde, cells werelysed and processed for Western blotting analysis asdescribed previously [49,50]. RasGTP pull-downs wereperformed as described previously [49,50].
Mechanistic model simulationsMATLAB and the function ode15s was used to simulatea previously developed, ordinary differential equation-based ERK cascade model [36], which is described in de-tail in Tables 1 and 2. The function gamrnd was used togenerate realizations of peak RasGTP, Raf, MEK, andERK levels for individual “cells” in the stochastic simula-tions according to the gamma distribution
f Nð Þ ¼ N k�1ð Þe�Nθ
θkΓ kð Þ ð1Þ
where N specifies a protein level, k is the shape param-eter, and θ is the scale parameter. We specified the k(shape) parameter of each gamma distribution as 5.4, aswas measured for total ERK (see Figure 1E), assumingroughly similar expression regulation. Since the mean ofa gamma distribution is equal to kθ, the θ parameter ofeach gamma distribution was changed as needed to at-tain the desired distribution mean (see Table 1 for valuesof mean protein levels).To estimate the parameters for the RasGTP dynamics,
which are described by a simple exponential rise and decaymodel (see Table 2 for differential equations), we used leastsquares optimization to ensure that desired initial magni-tude (Io), peak magnitude (Imax), time-to-peak (τmax), time-to-inflection (τinfl), time-to-steady-state (τss), and steady-state
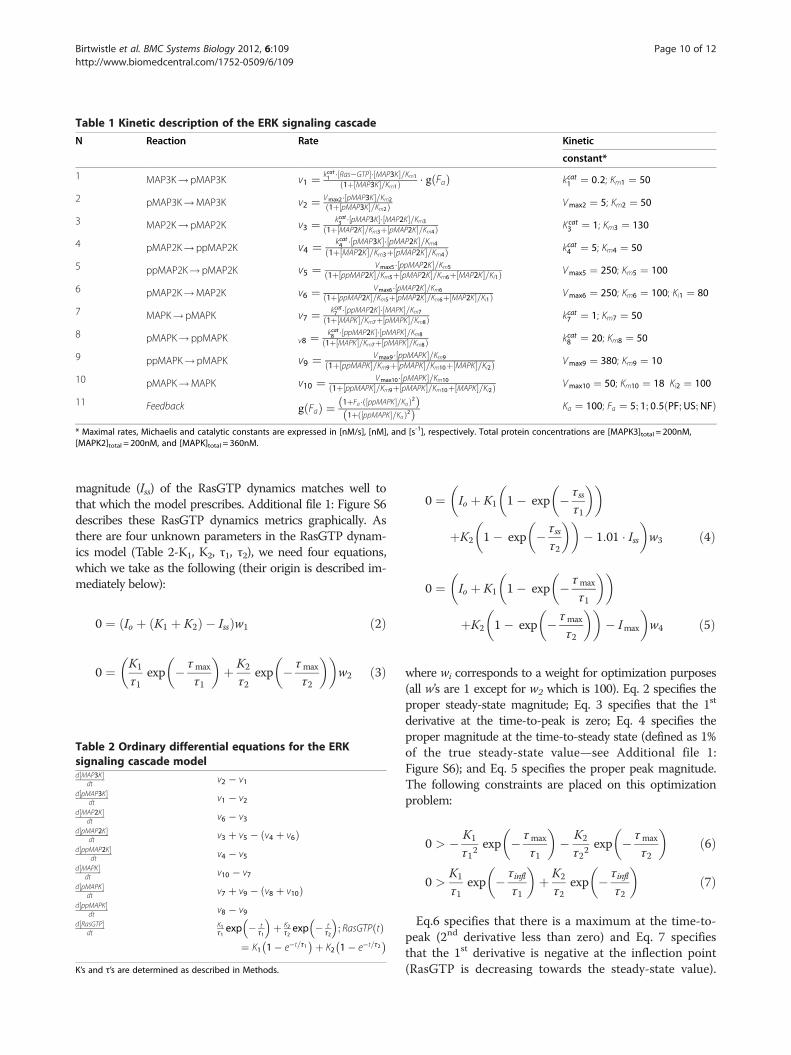
Table 1 Kinetic description of the ERK signaling cascade
N Reaction Rate Kinetic
constant*
1 MAP3K!pMAP3K v1 ¼ kcat1 � Ras�GTP½ �� MAP3K½ �=Km1
1þ MAP3K½ �=Km1ð Þ � g Fað Þ kcat1 ¼ 0:2; Km1 ¼ 50
2 pMAP3K!MAP3K v2 ¼ Vmax2 � pMAP3K½ �=Km2
1þ pMAP3K½ �=Km2ð Þ Vmax2 ¼ 5; Km2 ¼ 50
3 MAP2K!pMAP2K v3 ¼ kcat3 � pMAP3K½ �� MAP2K½ �=Km3
1þ MAP2K½ �=Km3þ pMAP2K½ �=Km4ð Þ Kcat3 ¼ 1; Km3 ¼ 130
4 pMAP2K!ppMAP2K v4 ¼ kcat4 � pMAP3K½ �� pMAP2K½ �=Km4
1þ MAP2K½ �=Km3þ pMAP2K½ �=Km4ð Þ kcat4 ¼ 5; Km4 ¼ 50
5 ppMAP2K! pMAP2K v5 ¼ Vmax5 � ppMAP2K½ �=Km5
1þ ppMAP2K½ �=Km5þ pMAP2K½ �=Km6þ MAP2K½ �=Ki1ð Þ Vmax5 ¼ 250; Km5 ¼ 100
6 pMAP2K!MAP2K v6 ¼ Vmax6 � pMAP2K½ �=Km6
1þ ppMAP2K½ �=Km5þ pMAP2K½ �=Km6þ MAP2K½ �=Ki1ð Þ Vmax6 ¼ 250; Km6 ¼ 100; Ki1 ¼ 80
7 MAPK!pMAPK v7 ¼ kcat7 � ppMAP2K½ �� MAPK½ �=Km7
1þ MAPK½ �=Km7þ pMAPK½ �=Km8ð Þ kcat7 ¼ 1; Km7 ¼ 50
8 pMAPK!ppMAPK v8 ¼ kcat8 � ppMAP2K½ �� pMAPK½ �=Km8
1þ MAPK½ �=Km7þ pMAPK½ �=Km8ð Þ kcat8 ¼ 20; Km8 ¼ 50
9 ppMAPK!pMAPK v9 ¼ Vmax9 � ppMAPK½ �=Km9
1þ ppMAPK½ �=Km9þ pMAPK½ �=Km10þ MAPK½ �=Ki2ð Þ Vmax9 ¼ 380; Km9 ¼ 10
10 pMAPK!MAPK v10 ¼ Vmax10� pMAPK½ �=Km10
1þ ppMAPK½ �=Km9þ pMAPK½ �=Km10þ MAPK½ �=Ki2ð Þ Vmax10 ¼ 50; Km10 ¼ 18 Ki2 ¼ 100
11 Feedback g Fað Þ ¼ 1þFa �ð ppMAPK½ �=KaÞ2ð Þ1þð ppMAPK½ �=KaÞ2ð Þ Ka ¼ 100; Fa ¼ 5; 1; 0:5 PF;US;NFð Þ
* Maximal rates, Michaelis and catalytic constants are expressed in [nM/s], [nM], and [s-1], respectively. Total protein concentrations are [MAPK3]total = 200nM,[MAPK2]total = 200nM, and [MAPK]total = 360nM.
Birtwistle et al. BMC Systems Biology 2012, 6:109 Page 10 of 12http://www.biomedcentral.com/1752-0509/6/109
magnitude (Iss) of the RasGTP dynamics matches well tothat which the model prescribes. Additional file 1: Figure S6describes these RasGTP dynamics metrics graphically. Asthere are four unknown parameters in the RasGTP dynam-ics model (Table 2-K1, K2, τ1, τ2), we need four equations,which we take as the following (their origin is described im-mediately below):
0 ¼ Io þ K1 þ K2ð Þ � Issð Þw1 ð2Þ
0 ¼ K1
τ1exp � τmax
τ1
� �þ K2
τ2exp � τmax
τ2
� �� �w2 ð3Þ
Table 2 Ordinary differential equations for the ERKsignaling cascade modeld MAP3K½ �
dt v2 � v1d pMAP3K½ �
dt v1 � v2d MAP2K½ �
dt v6 � v3d pMAP2K½ �
dt v3 þ v5 � v4 þ v6ð Þd ppMAP2K½ �
dt v4 � v5d MAPK½ �
dt v10 � v7d pMAPK½ �
dt v7 þ v9 � v8 þ v10ð Þd ppMAPK½ �
dt v8 � v9d RasGTP½ �
dtK1τ1exp � t
τ1
� �þ K2
τ2exp � t
τ2
� �; RasGTP tð Þ
¼ K1 1� e�t=τ1� �þ K2 1� e�t=τ2
� �K’s and τ’s are determined as described in Methods.
0 ¼�Io þ K1 1� exp � τss
τ1
� �� �
þK2 1� exp � τssτ2
� �� �� 1:01 � Iss
�w3 ð4Þ
ð4Þ0 ¼
�Io þ K1 1� exp � τmax
τ1
� �� �
þK2 1� exp � τmax
τ2
� �� �� Imax
�w4 ð5Þ
ð5Þwhere wi corresponds to a weight for optimization purposes(all w’s are 1 except for w2 which is 100). Eq. 2 specifies theproper steady-state magnitude; Eq. 3 specifies that the 1st
derivative at the time-to-peak is zero; Eq. 4 specifies theproper magnitude at the time-to-steady state (defined as 1%of the true steady-state value—see Additional file 1:Figure S6); and Eq. 5 specifies the proper peak magnitude.The following constraints are placed on this optimizationproblem:
0 > � K1
τ12exp � τmax
τ1
� �� K2
τ22exp � τmax
τ2
� �ð6Þ
0 >K1
τ1exp � τinfl
τ1
� �þ K2
τ2exp � τinfl
τ2
� �ð7Þ
Eq.6 specifies that there is a maximum at the time-to-peak (2nd derivative less than zero) and Eq. 7 specifiesthat the 1st derivative is negative at the inflection point(RasGTP is decreasing towards the steady-state value).
Birtwistle et al. BMC Systems Biology 2012, 6:109 Page 11 of 12http://www.biomedcentral.com/1752-0509/6/109
Mean peak RasGTP levels (Imax) were increased to simu-late increasing input, and were linearly spaced between10 nM and 200 nM using 6 points (10, 48, 86, 124, 162,and 200 nM), which correspond to EGF doses (in nM)of 0.01, 0.1, 0.5, 1, 5, and 10. Following the trends of theexperimental data in Additional file 1: Figure 2A and[41], peak times for RasGTP (τmax) were sampledlinearly between 7 min and 2 min (7, 6, 5, 4, 3, 2), with 7min corresponding to the lowest peak RasGTP level(EGF dose). Also, we took τss as 10 min, Iss as 15% ofImax realizations, Io as 0, and τinfl as (τmax+ τss)/2.All code is available upon request.
Parameter sensitivity analysisFive hundred different parameter sets were generated vialatin hypercube sampling (MATLAB function lhsdesign)from a 23-dimensional uniform distribution that spans +/− 1order of magnitude around each nominal parameter value(taken from Table 1 with the exception of Fa—the feedbackstrength). For each of these parameter sets stochastic simu-lations were performed as described above. Briefly, totalprotein and RasGTP levels were sampled from a gammadistribution and 500 individual cell responses were simu-lated for each parameter set and feedback condition (nega-tive, ultrasensitive with no feedback, positive). The resultsof these simulations were then analyzed for three features:the “analogicity” of the ERK-on population, the “transience”of the ERK-on population, and bimodality. The analogicityof a particular feedback/parameter set combination was cal-culated as follows, and is illustrated in Additional file 1:Figure S4A. First, the ERK-on population was defined bythose cells having ppERK levels over 200 nM. Then, themean ppERK levels in the ERK-on populations were calcu-lated for those that contained greater than 10 cells. Theanalogicity of a given time point is defined as the maximumERK-on population mean minus the minimum (as com-pared across EGF doses). The analogicity of a feedback/par-ameter set combination is the sum of the 2 and 5 minutetime point analogicities. The 10 and 30 minute time pointsare left out because these show very little analogicity inthe experimental data (Figure 1 and Additional file 1:Figure S2). Parameter sets showing zero analogicitywere discarded as inconsistent with experimental data.The transience of a particular feedback/parameter setcombination is defined for a particular EGF dose asfollows, and is pictorially illustrated in Additional file1: Figure S4B. First, the ERK-on population wasdefined as described above for analogicity, and anyEGF dose where the ERK-on population did not existfor all time points was not used for further transiencecalculations. The transience of an individual EGF doseis the mean of the ERK-on population at 2 and 5minutes minus that at 10 and 30 min. The transience of afeedback/parameter set combination is the sum over those
from the individual EGF doses. Bimodality was evaluatedvia Hartigan’s Dip Test [51,52]. MATLAB code for this testwas downloaded from http://www.nicprice.net/diptest/.The result is a p-value associated with the hypothesis testthat the empirical distribution of interest is unimodal asopposed to the alternative that it is not. We rejected thenull hypothesis at the 0.05 level of significance. The bi-modal fraction for a particular feedback/parameter set com-bination is defined as the number of non-unimodaldistributions divided by the total number of dose/timepoint combinations. Parameter sets showing no bimodalitywere discarded as inconsistent with experimental data.
Additional file
Additional file 1: This additional file contains all the supplementaryfigures along with their legends.
Competing interestsThe authors declared that they have no competing interests.
Authors’ contributionsMB and JR performed and designed research and wrote the paper. MD, AK,and EA performed research. JH designed research. WK wrote the paper. BOand BK designed research and wrote the paper. All authors read andapproved the final manuscript.
AcknowledgementsWe thank Claudio Gelmi and Erik Welf for helpful discussions. This work wassupported by Science Foundation Ireland [06/CE/B1129]. MRB acknowledgesa Marie Curie International Incoming Fellowship [236758] and an EMBOlong-term fellowship [ALTF 815–2010].
Author details1Dept. of Pharmacology and Systems Therapeutics, Mount Sinai School ofMedicine, New York, NY 10029, USA. 2Systems Biology Ireland, UniversityCollege Dublin, Belfield, Dublin 4, Ireland. 3Dept. of Anatomy, Pathology, andCell Biology, Thomas Jefferson University, Philadelphia, PA 19107, USA. 4Dept.of Chemical and Biomolecular Engineering, University of Delaware, Newark,DE 19716, USA.
Received: 7 May 2012 Accepted: 27 July 2012Published: 24 August 2012
References1. Goldbeter A, Koshland DE Jr: An amplified sensitivity arising from
covalent modification in biological systems. Proc Natl Acad Sci U S A 1981,78(11):6840–6844.
2. Markevich NI, Hoek JB, Kholodenko BN: Signaling switches and bistabilityarising from multisite phosphorylation in protein kinase cascades. J CellBiol 2004, 164(3):353–359.
3. Ferrell JE Jr: Self-perpetuating states in signal transduction: positive feedback,double-negative feedback and bistability. Curr Opin Cell Biol 2002, 14(2):140–148.
4. Pomerening JR, Sontag ED, Ferrell JE Jr: Building a cell cycle oscillator: hysteresisand bistability in the activation of Cdc2. Nat Cell Biol 2003, 5(4):346–351.
5. Sha W, Moore J, Chen K, Lassaletta AD, Yi CS, Tyson JJ, Sible JC: Hysteresisdrives cell-cycle transitions in Xenopus laevis egg extracts. Proc Natl AcadSci U S A 2003, 100(3):975–980.
6. Tyson JJ, Csikasz-Nagy A, Novak B: The dynamics of cell cycle regulation.Bioessays 2002, 24(12):1095–1109.
7. Huang CY, Ferrell JE Jr: Ultrasensitivity in the mitogen-activated proteinkinase cascade. Proc Natl Acad Sci U S A 1996, 93(19):10078–10083.
8. Santos SD, Verveer PJ, Bastiaens PI: Growth factor-induced MAPK networktopology shapes Erk response determining PC-12 cell fate. Nat Cell Biol2007, 9(3):324–330.
Birtwistle et al. BMC Systems Biology 2012, 6:109 Page 12 of 12http://www.biomedcentral.com/1752-0509/6/109
9. Mackeigan JP, Murphy LO, Dimitri CA, Blenis J: Graded mitogen-activatedprotein kinase activity precedes switch-like c-Fos induction inmammalian cells. Mol Cell Biol 2005, 25(11):4676–4682.
10. Harding A, Tian T, Westbury E, Frische E, Hancock JF: Subcellularlocalization determines MAP kinase signal output. Curr Biol 2005,15(9):869–873.
11. Inder K, Harding A, Plowman SJ, Philips MR, Parton RG, Hancock JF:Activation of the MAPK module from different spatial locationsgenerates distinct system outputs. Mol Biol Cell 2008, 19(11):4776–4784.
12. Ferrell JE Jr, Machleder EM: The biochemical basis of an all-or-none cellfate switch in Xenopus oocytes. Science 1998, 280(5365):895–898.
13. McAdams HH, Arkin A: Stochastic mechanisms in gene expression.Proc Natl Acad Sci U S A 1997, 94(3):814–819.
14. Bar-Even A, Paulsson J, Maheshri N, Carmi M, O'Shea E, Pilpel Y, Barkai N:Noise in protein expression scales with natural protein abundance. NatGenet 2006, 38(6):636–643.
15. Cohen-Saidon C, Cohen AA, Sigal A, Liron Y, Alon U: Dynamics andvariability of ERK2 response to EGF in individual living cells. Mol Cell2009, 36(5):885–893.
16. Niepel M, Spencer SL, Sorger PK: Non-genetic cell-to-cell variability andthe consEquationuences for pharmacology. Curr Opin Chem Biol 2009,13(5–6):556–561.
17. Spencer SL, Gaudet S, Albeck JG, Burke JM, Sorger PK: Non-genetic originsof cell-to-cell variability in TRAIL-induced apoptosis. Nature 2009,459(7245):428–432.
18. Chang HH, Hemberg M, Barahona M, Ingber DE, Huang S: Transcriptome-wide noise controls lineage choice in mammalian progenitor cells.Nature 2008, 453(7194):544–547.
19. Raser JM, O'Shea EK: Noise in gene expression: origins,consEquationuences, and control. Science 2005, 309(5743):2010–2013.
20. Wilkinson DJ: Stochastic modelling for quantitative description ofheterogeneous biological systems. Nat Rev Genet 2009, 10(2):122–133.
21. Pedraza JM, Paulsson J: Effects of molecular memory and bursting onfluctuations in gene expression. Science 2008, 319(5861):339–343.
22. Raj A, Peskin CS, Tranchina D, Vargas DY, Tyagi S: Stochastic mRNAsynthesis in mammalian cells. PLoS Biol 2006, 4(10):e309.
23. Yu J, Xiao J, Ren X, Lao K, Xie XS: Probing gene expression in live cells,one protein molecule at a time. Science 2006, 311(5767):1600–1603.
24. Cai L, Friedman N, Xie XS: Stochastic protein expression in individual cellsat the single molecule level. Nature 2006, 440(7082):358–362.
25. Colman-Lerner A, Gordon A, Serra E, Chin T, Resnekov O, Endy D, Pesce CG,Brent R: Regulated cell-to-cell variation in a cell-fate decision system.Nature 2005, 437(7059):699–706.
26. Perez OD, Nolan GP: Phospho-proteomic immune analysis by flowcytometry: from mechanism to translational medicine at the single-celllevel. Immunol Rev 2006, 210:208–228.
27. Taniguchi Y, Choi PJ, Li GW, Chen H, Babu M, Hearn J, Emili A, Xie XS:Quantifying E. coli proteome and transcriptome with single-moleculesensitivity in single cells. Science 2010, 329(5991):533–538.
28. Shahrezaei V, Swain PS: Analytical distributions for stochastic geneexpression. Proc Natl Acad Sci U S A 2008, 105(45):17256–17261.
29. Cohen AA, Kalisky T, Mayo A, Geva-Zatorsky N, Danon T, Issaeva I, Kopito RB,Perzov N, Milo R, Sigal A, et al: Protein dynamics in individual human cells:experiment and theory. PLoS One 2009, 4(4):e4901.
30. Paulsson J, Berg OG, Ehrenberg M: Stochastic focusing: fluctuation-enhanced sensitivity of intracellular regulation. Proc Natl Acad Sci U S A2000, 97(13):7148–7153.
31. Friedman N, Cai L, Xie XS: Linking stochastic dynamics to populationdistribution: an analytical framework of gene expression. Phys Rev Lett2006, 97(16):168302.
32. Boykevisch S, Zhao C, Sondermann H, Philippidou P, Halegoua S, Kuriyan J,Bar-Sagi D: Regulation of ras signaling dynamics by Sos-mediatedpositive feedback. Curr Biol 2006, 16(21):2173–2179.
33. Das J, Ho M, Zikherman J, Govern C, Yang M, Weiss A, Chakraborty AK,Roose JP: Digital signaling and hysteresis characterize ras activation inlymphoid cells. Cell 2009, 136(2):337–351.
34. Prasad A, Zikherman J, Das J, Roose JP, Weiss A, Chakraborty AK: Origin ofthe sharp boundary that discriminates positive and negative selection ofthymocytes. Proc Natl Acad Sci U S A 2009, 106(2):528–533.
35. Kholodenko BN, Birtwistle MR: Four-dimensional dynamics of MAPKinformation processing systems. Wiley Interdiscip Rev Syst Biol Med 2009,1(1):28–44.
36. Markevich NI, Tsyganov MA, Hoek JB, Kholodenko BN: Long-rangesignaling by phosphoprotein waves arising from bistability in proteinkinase cascades. Mol Syst Biol 2006, 2:61.
37. Sauro HM, Kholodenko BN: Quantitative analysis of signaling networks.Prog Biophys Mol Biol 2004, 86(1):5–43.
38. Birtwistle MR, Kolch W: Biology using engineering tools: the negativefeedback amplifier. Cell Cycle 2011, 10(13):2069–2076.
39. Sturm OE, Orton R, Grindlay J, Birtwistle M, Vyshemirsky V, Gilbert D, CalderM, Pitt A, Kholodenko B, Kolch W: The mammalian MAPK/ERK pathwayexhibits properties of a negative feedback amplifier. Sci Signal 2010,3(153):ra90.
40. Fritsche-Guenther R, Witzel F, Sieber A, Herr R, Schmidt N, Braun S, BrummerT, Sers C, Bluthgen N: Strong negative feedback from Erk to Raf confersrobustness to MAPK signalling. Mol Syst Biol 2011, 7:489.
41. Borisov N, Aksamitiene E, Kiyatkin A, Legewie S, Berkhout J, Maiwald T,Kaimachnikov NP, Timmer J, Hoek JB, Kholodenko BN: Systems-levelinteractions between insulin-EGF networks amplify mitogenic signaling.Mol Syst Biol 2009, 5:256.
42. Kholodenko BN: Negative feedback and ultrasensitivity can bring aboutoscillations in the mitogen-activated protein kinase cascades. Eur JBiochem 2000, 267(6):1583–1588.
43. French AR, Tadaki DK, Niyogi SK, Lauffenburger DA: Intracellular traffickingof epidermal growth factor family ligands is directly influenced by thepH sensitivity of the receptor/ligand interaction. J Biol Chem 1995,270(9):4334–4340.
44. Roepstorff K, Grandal MV, Henriksen L, Knudsen SL, Lerdrup M, Grovdal L,Willumsen BM, van Deurs B: Differential effects of EGFR ligands onendocytic sorting of the receptor. Traffic 2009, 10(8):1115–1127.
45. Goentoro L, Shoval O, Kirschner MW, Alon U: The incoherent feedforwardloop can provide fold-change detection in gene regulation. Mol Cell2009, 36(5):894–899.
46. Nakakuki T, Birtwistle MR, Saeki Y, Yumoto N, Ide K, Nagashima T, Brusch L,Ogunnaike BA, Okada-Hatakeyama M, Kholodenko BN: Ligand-specificc-Fos expression emerges from the spatiotemporal control of ErbBnetwork dynamics. Cell 2010, 141(5):884–896.
47. Gius D, Cao XM, Rauscher FJ 3rd, Cohen DR, Curran T, Sukhatme VP:Transcriptional activation and repression by Fos are independentfunctions: the C terminus represses immediate-early gene expression viaCArG elements. Mol Cell Biol 1990, 10(8):4243–4255.
48. Kholodenko BN: Cell-signalling dynamics in time and space. Nat Rev MolCell Biol 2006, 7:165–176. PMID: 16482094.
49. Kiyatkin A, Aksamitiene E, Markevich NI, Borisov NM, Hoek JB, KholodenkoBN: Scaffolding protein Grb2-associated binder 1 sustains epidermalgrowth factor-induced mitogenic and survival signaling by multiplepositive feedback loops. J Biol Chem 2006, 281(29):19925–19938.
50. Aksamitiene E, Achanta S, Kolch W, Kholodenko BN, Hoek JB, Kiyatkin A:Prolactin-stimulated activation of ERK1/2 mitogen-activated proteinkinases is controlled by PI3-kinase/Rac/PAK signaling pathway in breastcancer cells. Cell Signal 2011, 23(11):1794–1805.
51. Hartigan JA, Hartigan PM: The Dip Test of Unimodality. Ann Stat 1985,13(1):70–84.
52. Hartigan PM: Computation of the Dip Statistic to Test for Unimodality.Appl Stat J R Stat Soc Ser C 1985, 34(3):320–325.
doi:10.1186/1752-0509-6-109Cite this article as: Birtwistle et al.: Emergence of bimodal cellpopulation responses from the interplay between analog single-cellsignaling and protein expression noise. BMC Systems Biology 2012 6:109.
Related Documents


