Abbott Molecular FISH Catalog 2011 For Africa, Europe, India, and Middle East

EMEAI__FISHcatalog2011b
Oct 23, 2015
Abbott FISH Vysis catalogue
Welcome message from author
This document is posted to help you gain knowledge. Please leave a comment to let me know what you think about it! Share it to your friends and learn new things together.
Transcript

Abbott Molecular
FISH Catalog 2011For Africa, Europe, India, and Middle East

The information provided is accurate as of January 2011 based on the current information available. Our business is dynamic and we are continuously updating our catalog and websites adding new products, content, and information to service our customers better. As such, the information may have slight variations and may include typographical errors or inaccuracies due to these changes to our business. Please contact your customer service or sales person for the latest information.

Welcome
As a leader in molecular diagnostics, Abbott is committed to exploring new clinical frontiers through the development and delivery of innovative systems and assay solutions that provide earlier disease diagnosis, selection of appropriate therapies and monitoring of disease progression at the molecular level. Our expanding portfolio brings your molecular laboratory multiple technology and platform options that enable the fast, accurate results you require. Our state-of-the-art research and development and manufacturing facilities are dedicated to producing the highest quality, most reliable systems and reagents available in the field of molecular diagnostics today providing you confidence through the delivery of consistent results.
Abbott Molecular is pleased to demonstrate our continued investment to advancing science, by introducing a cadre of new products in this catalog edition including; new FISH products, the Xmatrx Automated Slide-Staining System (for FISH) and a completely new styled web presence with updated chromosome search function. Further details of some of these significant releases are highlighted in a special “What’s New” Section of this catalog on the following pages.
Building on a proven track record of service to the worldwide community of researchers and clinicians, Abbott continues to deliver patented Vysis FISH Technology that incorporates a proprietary direct fluorescence labeling technique providing the following benefits:
• Specific high intensity signals without the requirement of separate amplification and/or detection steps
• Superior reproducibility • Clearer results • Easy interpretation
Abbott Molecular FISH Automation solutions unlock the potential to extend laboratory capabilities by increasing throughput, improving reproducibility and expanding assay menues. Various platform options provide the flexibility to select the desired level of automation for your specific laboratory needs.
Please contact our scientific experts or your local representative today if you have further questions on any of our products or visit our web site at: www.abbottmolecular.com.

How to use the find function in this document
Use the “Find” Function for quick searchThis catalog is created in Adobe Acrobat (pdf) and allows a very simple way to search for items.
First check that the “Find” function in activated in the Tool Bar. If this function is not shown as in this figure, then follow these simple instructions to active it.Click on “Tools” from the main menu. In the drop down menu select “Customize Toolbars..”. In the next drop down menu select and click on “Find Toolbar”, and click the checkbox.The “Find” Function should now apear at the top of the screen.
Searching the pdf document works in a similar way to search functions in web browsers. Simply type in the item you wish to search for, click “enter” and Acrobat will find the first occurence in the document. By clicking on “enter” again, you will jump to the next occurrence of the search item.

3All products, except where indicated, are Analyte Specific Reagents. Analytical and performance characteristics are not established.
What’s New at Abbott Molecular
Introducing the Xmatrx Automated Slide Staining SystemXmatrx is the first truly auto-mated slide staining system designed specifically for front-end FISH processing. It meets the needs of today’s molecular laboratories by increasing throughput and simplifying assay workflow.
The Xmatrx reduces hands-on time by more than 90 % over manual processing while maxi-mizing consistency, reproduc-ibility and quality of results. This breakthrough advance in automation will change the way your lab views FISH assay processing.
See page 1-4
Vysis Melanoma FISH Probe KitA new tool to improve Melanoma diagnostics is available.The Vysis Melanoma FISH Probe Kit delivers valuable information about mela-nocytic lesions through accurate detective of specific genetic ab-berations.
The Vysis Melanoma FISH Probe Kit is a multi-color probe panel designed to be used in formalin-fixed, paraffin-embedded human skin tissue specimens and detects 4 genetic abberations to assist in the diagnosis of melanoma.
All products, except where indicated, are Analyte Specific Reagents. Analytical and performance characteristics are not established.4
What’s New at Abbott Molecular
HUGO Gene NamesIn order to remain consistent with current scientific nomenclature, Abbott Molecular is incorporating the latest Human Genome Organization (HUGO) naming convention into new products as well as re-packaged existing products. HUGO strives to foster interaction and coordination of information and technology among investigators and the global society in genomics, proteomics, bioinformatics, systems biology and the clinical services in order to provide consistency and simplicity for everyday use of genetic information.
The HUGO Gene Nomenclature Committee (HGNC) at the European Bioinformatics Institute assigns a unique name and symbol to every human gene.
The HGNC is a non-profit body which is jointly funded by the US National Human Genome Research Institute (NHGRI) and the Wellcome Trust (UK) and is part of the Human Genome Organization (HUGO).
Abbott Molecular is proud of its efforts to promote global standardization, consistency and stability in the naming and identification of genomic segments. Cross referencing previous Vysis probe names and new HUGO gene names can be performed by visiting the HUGO gene nomenclature committee website at www.genenames.org.
Example:
Old Abbott Molecular Product: Vysis LSI CHOP (12q13) Dual Color, Break Apart Rearrangement Probe
New Abbott Molecular Product name according to HUGO gene nomenclature: Vysis LSI DDIT3 Break Apart FISH Probe Kit

5All products, except where indicated, are Analyte Specific Reagents. Analytical and performance characteristics are not established.
What’s New at Abbott Molecular
A new way to manage your molecular world, online.Announcing the launch of our new website abbottmolecular.com,a web portal devoted to advancing molecular science. The transformation of our on-line presence enables improved navigation and enhanced search functionality.
Search. Simplified. Clear Guidance for Laboratory Professionals.At your request, we’ve re-engineered the Chromosome Search Tool to provide faster access to the most up-to-date Vysis FISH Probe information – experience a faster, more comprehensive chromosome search.
You’re just a click away: www.abbottmolecular.com
All products, except where indicated, are Analyte Specific Reagents. Analytical and performance characteristics are not established.6
What’s New at Abbott Molecular
1
2
5
6
5 7
3
4
8
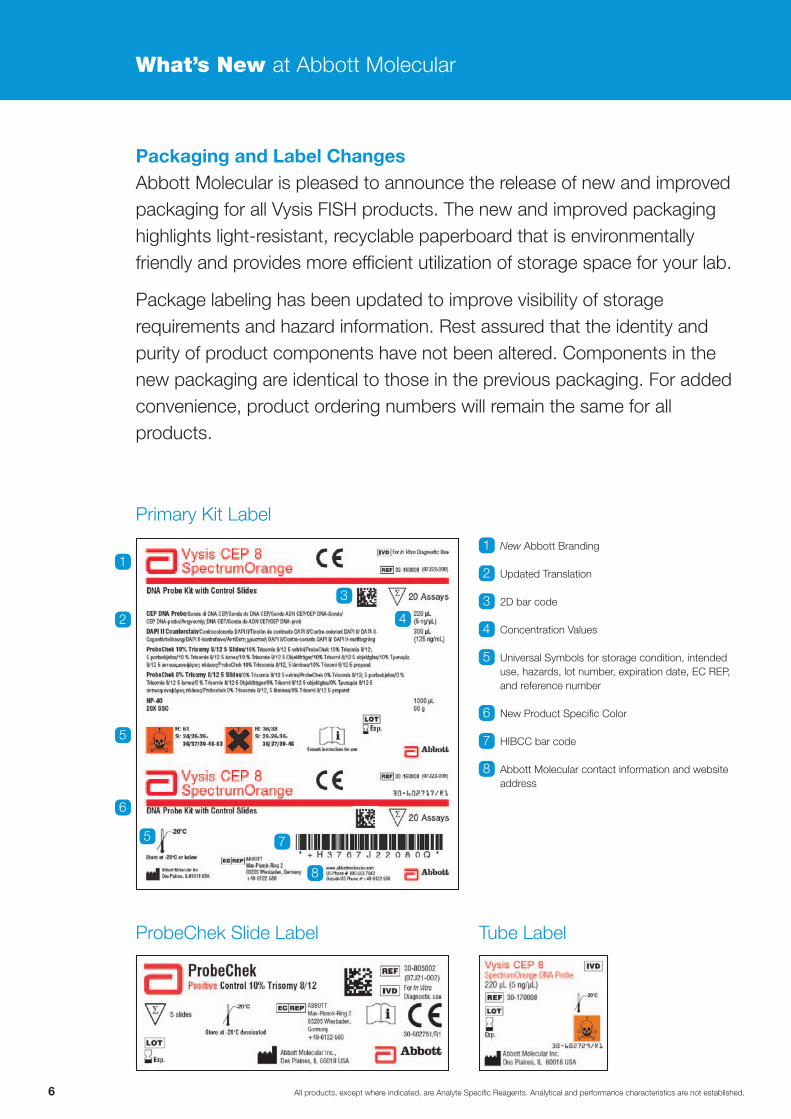
Packaging and Label ChangesAbbott Molecular is pleased to announce the release of new and improved packaging for all Vysis FISH products. The new and improved packaging highlights light-resistant, recyclable paperboard that is environmentally friendly and provides more efficient utilization of storage space for your lab.
Package labeling has been updated to improve visibility of storage requirements and hazard information. Rest assured that the identity and purity of product components have not been altered. Components in the new packaging are identical to those in the previous packaging. For added convenience, product ordering numbers will remain the same for all products.
1 �New Abbott Branding
2 Updated Translation
3 2D bar code
4 Concentration Values
5 Universal Symbols for storage condition, intended use, hazards, lot number, expiration date, EC REP, and reference number
6 New Product Specific Color
7 HIBCC bar code
8 Abbott Molecular contact information and website address
Primary Kit Label
ProbeChek Slide Label Tube Label

Abbott Molecular Catalog
Section
Automation – FISH 1
Genetics 2
Oncology – Bladder Cancer 3
Oncology – Breast Cancer 4
Oncology – Solid Tumor Probes 5
Oncology – Hematology 6
Oncology – Enumeration and Identification 7
Accessories 8
Index 9
Ordering Information 10


1-1All products, except where indicated, are Analyte Specific Reagents. Analytical and performance characteristics are not established.
AutomationFISH
Automation is essential for laboratories interested in reducing the amount of hands-on-time required to run FISH assays, while increasing laboratory throughput, flexibility, reproducibility and productivity. Abbott Molecular is pleased to offer FISH automation options to suit the needs of your laboratory.
• Our VP 2000 Processor is designed to automate tedious front end FISH preparation procedures such as de-paraffinization and slide pretreatment. With the flexibility to perform batches of up to 50 slides at a time, and 3 heated and 12 ambient temperature basins, the VP 2000 is well suited for the needs of today’s FISH laboratory.
• The ThermoBrite Slide Processing System is a temperature programmable, humidity controlled instrument designed to automate denaturation and hybridization steps for FISH. Rapid temperature ramping and accuracy within +/– 1 °C ensure superior temperature uniformity across all 12 slide positions. Up to 40 user defined protocols and 3 operating modes ensure ease of use and flexibility.
• For the ultimate level of FISH automation, Abbott Molecular offers the Xmatrx Automated Slide Staining System. Xmatrx reduces 33 manual steps to 3 and hands-on time from 7.5 hours for manual FISH processing to 0.5 hours. Simply load AutoFISH reagents and slides, choose and run desired protocols, and then remove the slides for enumeration and analysis. The Xmatrx can run up to 40 slides at a time under multiple protocols and offers continuous access for maximum flexibility. It is the only system designed specifically for front-end FISH processing. Engage a new level of laboratory efficiency with Xmatrx.

All products, except where indicated, are Analyte Specific Reagents. Analytical and performance characteristics are not established.1-2
Automation – FISH
Product description Quantity Order No.Page
Number
ThermoBrite 200/240 VAC CE marked 7J91-20 1-3
ThermoBrite Humidity Strips 10 pk 7J68-01 1-3
Xmatrx Automated Slide Staining System CE marked 1-4
VP 2000 Processor, 230 VAC, 50/60 HZ CE marked 2J11-04 1-5
PC Monitor for VP 2000 1N32-01 1-5
PC Unit for VP 2000 7J98-01 1-5
1-3All products, except where indicated, are Analyte Specific Reagents. Analytical and performance characteristics are not established.
Automation – FISH
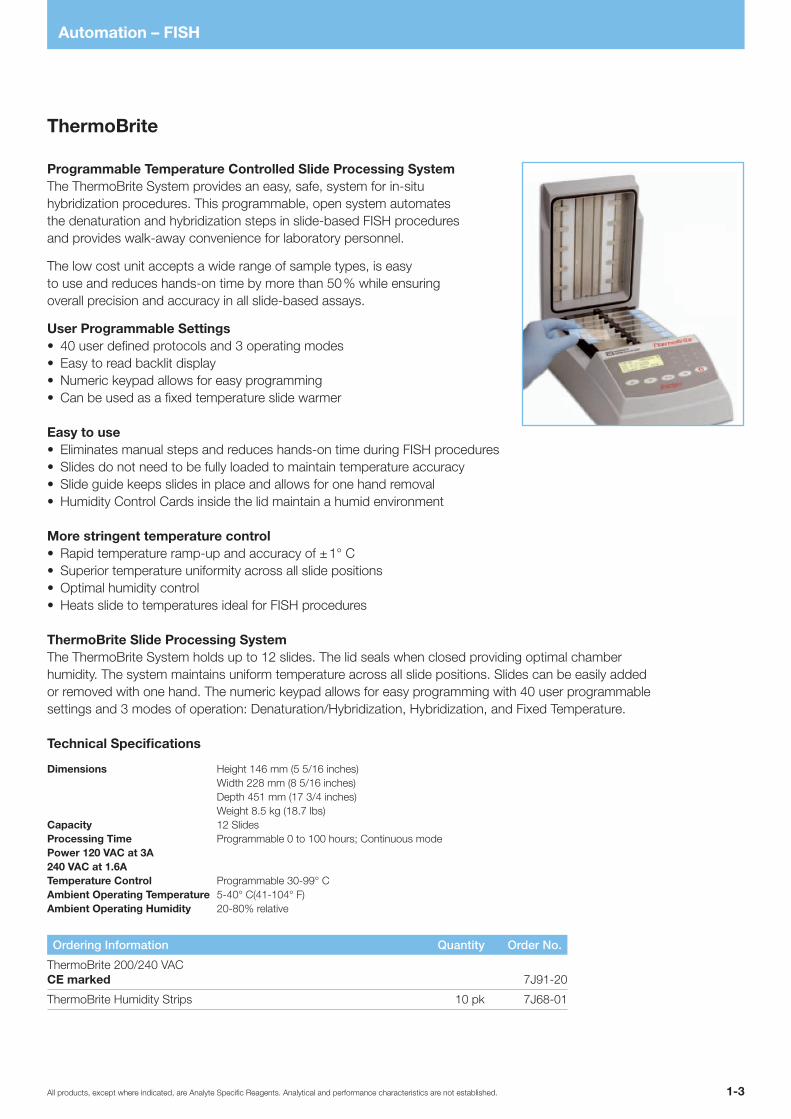
ThermoBrite
Programmable Temperature Controlled Slide Processing SystemThe ThermoBrite System provides an easy, safe, system for in-situ hybridization procedures. This programmable, open system automates the denaturation and hybridization steps in slide-based FISH procedures and provides walk-away convenience for laboratory personnel.
The low cost unit accepts a wide range of sample types, is easy to use and reduces hands-on time by more than 50 % while ensuring overall precision and accuracy in all slide-based assays.
User Programmable Settings• 40 user defined protocols and 3 operating modes• Easy to read backlit display• Numeric keypad allows for easy programming• Can be used as a fixed temperature slide warmer
Easy to use• Eliminates manual steps and reduces hands-on time during FISH procedures• Slides do not need to be fully loaded to maintain temperature accuracy• Slide guide keeps slides in place and allows for one hand removal• Humidity Control Cards inside the lid maintain a humid environment
More stringent temperature control• Rapid temperature ramp-up and accuracy of ± 1° C• Superior temperature uniformity across all slide positions• Optimal humidity control• Heats slide to temperatures ideal for FISH procedures
ThermoBrite Slide Processing SystemThe ThermoBrite System holds up to 12 slides. The lid seals when closed providing optimal chamber humidity. The system maintains uniform temperature across all slide positions. Slides can be easily added or removed with one hand. The numeric keypad allows for easy programming with 40 user programmable settings and 3 modes of operation: Denaturation/Hybridization, Hybridization, and Fixed Temperature.
Technical Specifications
Dimensions Height 146 mm (5 5/16 inches)Width 228 mm (8 5/16 inches) Depth 451 mm (17 3/4 inches) Weight 8.5 kg (18.7 lbs)
Capacity 12 Slides Processing Time Programmable 0 to 100 hours; Continuous mode Power 120 VAC at 3A240 VAC at 1.6A Temperature Control Programmable 30-99° C Ambient Operating Temperature 5-40° C(41-104° F) Ambient Operating Humidity 20-80% relative
Ordering Information Quantity Order No.
ThermoBrite 200/240 VAC CE marked 7J91-20
ThermoBrite Humidity Strips 10 pk 7J68-01
All products, except where indicated, are Analyte Specific Reagents. Analytical and performance characteristics are not established.1-4
Automation – FISH
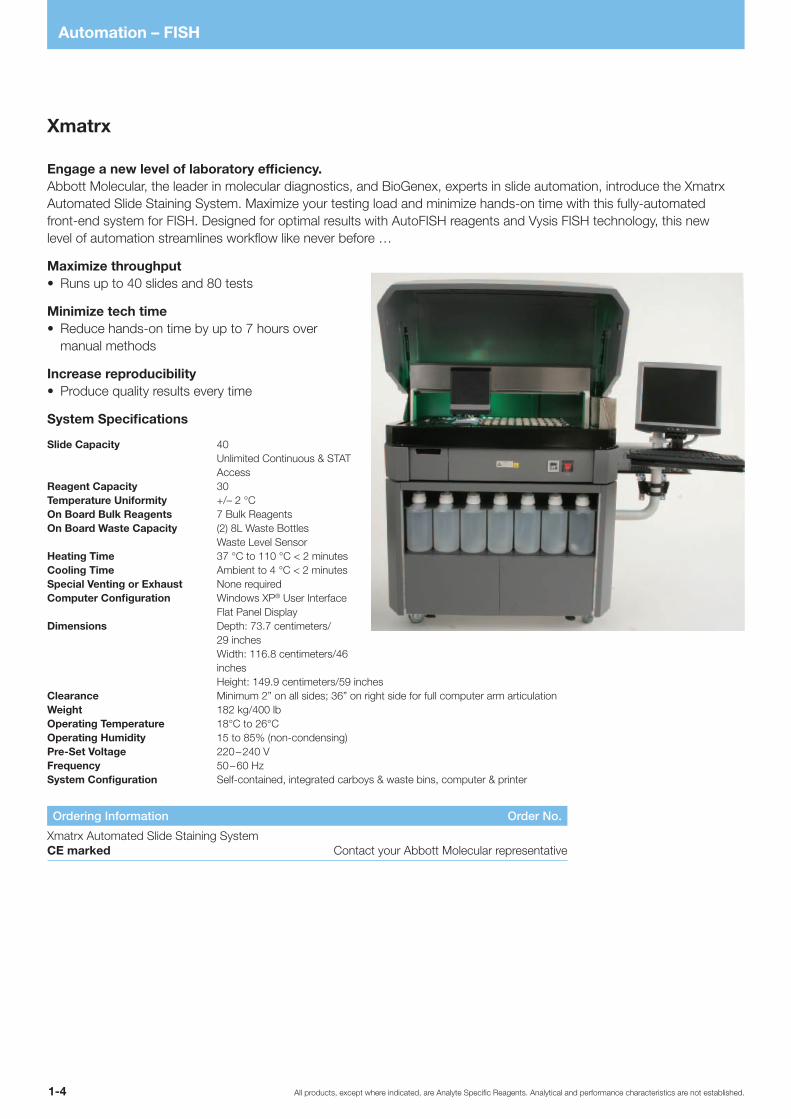
Xmatrx
Engage a new level of laboratory efficiency.Abbott Molecular, the leader in molecular diagnostics, and BioGenex, experts in slide automation, introduce the Xmatrx Automated Slide Staining System. Maximize your testing load and minimize hands-on time with this fully-automated front-end system for FISH. Designed for optimal results with AutoFISH reagents and Vysis FISH technology, this new level of automation streamlines workflow like never before …
Maximize throughput• Runs up to 40 slides and 80 tests
Minimize tech time• Reduce hands-on time by up to 7 hours over
manual methods
Increase reproducibility• Produce quality results every time
System Specifications
Slide Capacity 40Unlimited Continuous & STAT Access
Reagent Capacity 30Temperature Uniformity +/– 2 °COn Board Bulk Reagents 7 Bulk ReagentsOn Board Waste Capacity (2) 8L Waste Bottles Waste Level SensorHeating Time 37 °C to 110 °C < 2 minutesCooling Time Ambient to 4 °C < 2 minutesSpecial Venting or Exhaust None requiredComputer Configuration Windows XP® User Interface Flat Panel DisplayDimensions Depth: 73.7 centimeters/
29 inches Width: 116.8 centimeters/46 inches Height: 149.9 centimeters/59 inches
Clearance Minimum 2” on all sides; 36” on right side for full computer arm articulationWeight 182 kg/400 lbOperating Temperature 18°C to 26°COperating Humidity 15 to 85% (non-condensing)Pre-Set Voltage 220 – 240 VFrequency 50 – 60 HzSystem Configuration Self-contained, integrated carboys & waste bins, computer & printer
Ordering Information Order No.
Xmatrx Automated Slide Staining System CE marked Contact your Abbott Molecular representative
1-5All products, except where indicated, are Analyte Specific Reagents. Analytical and performance characteristics are not established.
Automation – FISH
VP 2000 Processor
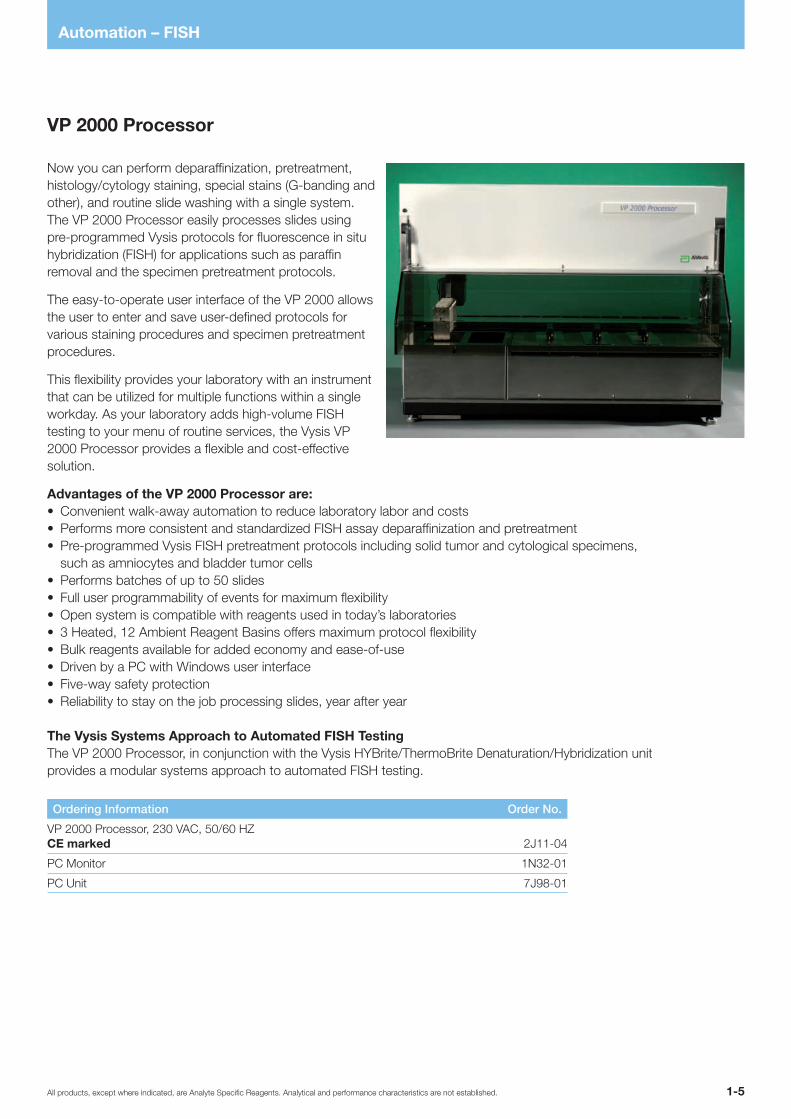
Now you can perform deparaffinization, pretreatment, histology/cytology staining, special stains (G-banding and other), and routine slide washing with a single system. The VP 2000 Processor easily processes slides using pre-programmed Vysis protocols for fluorescence in situ hybridization (FISH) for applications such as paraffin removal and the specimen pretreatment protocols.
The easy-to-operate user interface of the VP 2000 allows the user to enter and save user-defined protocols for various staining procedures and specimen pretreatment procedures.
This flexibility provides your laboratory with an instrument that can be utilized for multiple functions within a single workday. As your laboratory adds high-volume FISH testing to your menu of routine services, the Vysis VP 2000 Processor provides a flexible and cost-effective solution.
Advantages of the VP 2000 Processor are:• Convenient walk-away automation to reduce laboratory labor and costs• Performs more consistent and standardized FISH assay deparaffinization and pretreatment• Pre-programmed Vysis FISH pretreatment protocols including solid tumor and cytological specimens,
such as amniocytes and bladder tumor cells• Performs batches of up to 50 slides• Full user programmability of events for maximum flexibility• Open system is compatible with reagents used in today’s laboratories• 3 Heated, 12 Ambient Reagent Basins offers maximum protocol flexibility• Bulk reagents available for added economy and ease-of-use• Driven by a PC with Windows user interface• Five-way safety protection• Reliability to stay on the job processing slides, year after year
The Vysis Systems Approach to Automated FISH TestingThe VP 2000 Processor, in conjunction with the Vysis HYBrite/ThermoBrite Denaturation/Hybridization unit provides a modular systems approach to automated FISH testing.
Ordering Information Order No.
VP 2000 Processor, 230 VAC, 50/60 HZ CE marked 2J11-04
PC Monitor 1N32-01
PC Unit 7J98-01

2-1All products, except where indicated, are Analyte Specific Reagents. Analytical and performance characteristics are not established.
Genetics – Prenatal, Postnatal and Preimplantation Genetics
GeneticsPrenatal, Postnatal and Preimplantation Genetics
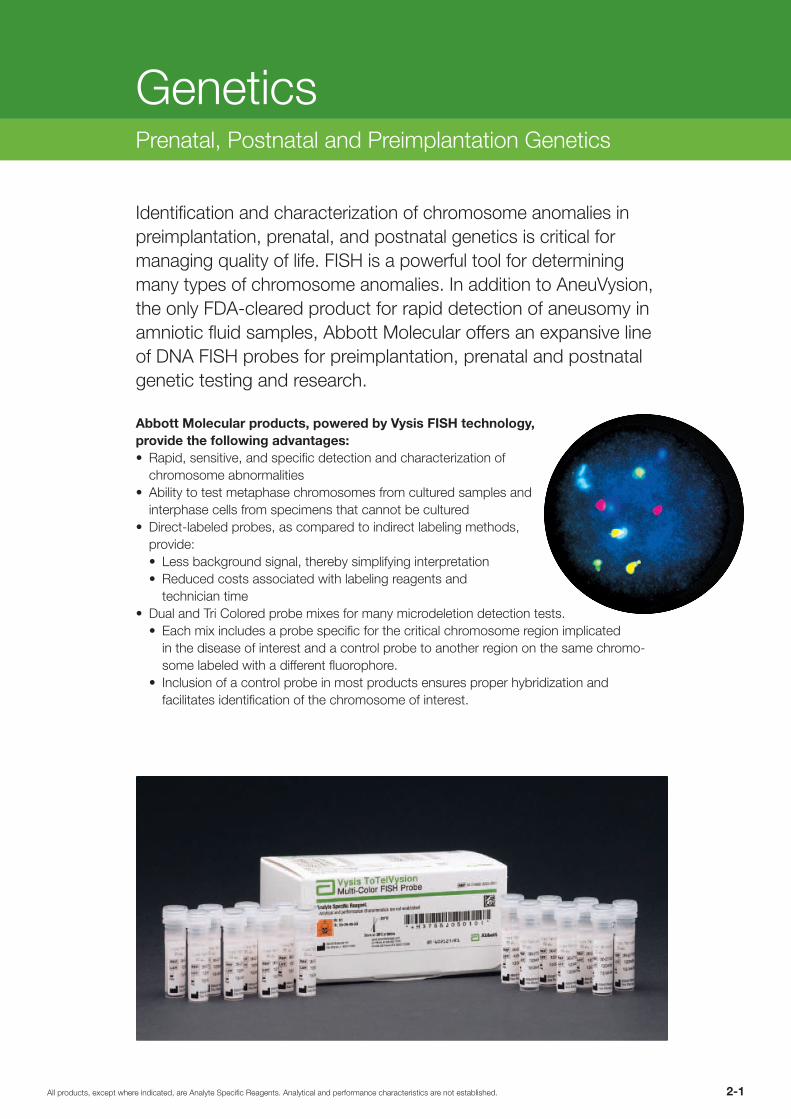
Identification and characterization of chromosome anomalies in preimplantation, prenatal, and postnatal genetics is critical for ma naging quality of life. FISH is a powerful tool for determining many types of chromosome anomalies. In addition to AneuVysion, the only FDA-cleared product for rapid detection of aneusomy in amniotic fluid samples, Abbott Molecular offers an expansive line of DNA FISH probes for preimplantation, prenatal and postnatal genetic testing and research.
Abbott Molecular products, powered by Vysis FISH technology, provide the following advantages:• Rapid, sensitive, and specific detection and characterization of
chromosome abnormalities• Ability to test metaphase chromosomes from cultured samples and
interphase cells from specimens that cannot be cultured• Direct-labeled probes, as compared to indirect labeling methods,
provide:• Less background signal, thereby simplifying interpretation• Reduced costs associated with labeling reagents and
technician time• Dual and Tri Colored probe mixes for many microdeletion detection tests.
• Each mix includes a probe specific for the critical chromosome region implicated in the disease of interest and a control probe to another region on the same chromo-some labeled with a different fluorophore.
• Inclusion of a control probe in most products ensures proper hybridization and facilitates identification of the chromosome of interest.

All products, except where indicated, are Analyte Specific Reagents. Analytical and performance characteristics are not established.2-2
Genetics – Prenatal, Postnatal and Preimplantation Genetics
Product description Quantity Order No.Page
Number
Aneuploidy ProbesAneuVysion Multicolor DNA Probe Kit FDA Cleared CE marked 10 Assays 5J38-10 2-3
AneuVysion Multicolor DNA Probe Kit FDA Cleared CE marked 30 Assays 5J38-30 2-3
AneuVysion Multicolor DNA Probe Kit FDA Cleared CE marked 50 Assays 5J38-50 2-3
Microdeletion ProbesCri-du-Chat Region Probes
Vysis Cri-du-Chat Region Probe – LSI D5S23, D5S721 SpectrumGreen 20 µl 5J20-25 2-5
Vysis LSI EGR1/D5S23, D5S721 Dual Color Probe CE markedPreviously: Vysis Cri-du-Chat Region Probe – LSI EGR1 SO/D5S23, D5S721 SGr 20 µl 8L68-20 2-5
DiGeorge Region Probes
Vysis LSI D22S75 (N25 region) SO/LSI ARSA SGn Probe 10 µl 5N24-10 2-7
Vysis DiGeorge Region Probe – LSI TUPLE 1 SpectrumOrange/LSI ARSA SpectrumGreen CE marked 20 µl 8L59-20 2-7
Vysis DiGeorge Region Probe – LSI TUPLE1 SpectrumOrange/TelVysion 22q SpectrumGreen 10 µl 1N14-10 2-8
Prader-Willi/Angelman Region Probes
Prader-Willi/Angelman Region Probe – LSI D15S10 SpectrumOrange/CEP 15 (D15Z1) SpectrumAqua/PML SpectrumGreen 10 µl 1N13-10 2-9
Vysis Prader-Willi/Angelman Region Probe – LSI D15S11 SpectrumOrange/CEP 15 (D15Z1) SpectrumGreen Probe 20 µl 5J19-14 2-9
Vysis Prader-Willi/Angelman Region Probe – LSI GABRB3 SpectrumOrange/CEP 15 (D15Z1) SpectrumGreen 20 µl 5J22-15 2-10
LSI SNRPN SpectrumOrange/CEP 15 (D15Z1) SpectrumAqua/LSI PML SpectrumGreen TriColor Probe 10 µl 1N12-10 2-10
Others
Vysis 1p36 Microdeletion Region Probe – LSI p58 (1p36) SpectrumOrange/TelVysion 1p SpectrumGreen/LSI 1q25 (SA) 20 µl 5J21-20 2-11
Vysis Kallman Region Probe – LSI KAL SpectrumOrange/CEP X SpectrumGreen 20 µl 5J23-70 2-11
Vysis LSI MAPT SpectrumGreen Probe 10 µl 2N19-10 2-12
Vysis Miller-Dieker Region/Isolated Lissencephaly Probe LSI LIS1 SpectrumOrange/LSI RARA SpectrumGreen 20 µl 5J88-01 2-12
Vysis Smith-Magenis Region Probe – LSI SMS Region SpectrumOrange/LSI RARA SpectrumGreen 20 µl 5J25-03 2-13
Vysis Sotos Region Probe – LSI NSD1 (5q35) SpectrumOrange Probe 20 µl 5J48-07 2-13
Vysis SRY Probe – LSI SRY SpectrumOrange 20 µl 5J27-79 2-14
Vysis SRY Probe LSI SRY SpectrumOrange/CEP X SpectrumGreen 20 µl 5J27-07 2-14
Vysis Steroid Sulfatase Defi ciency Probe – LSI STS SpectrumOrange/LSI CEP X SpectrumGreen 20 µl 5J28-04 2-15
Vysis Williams Region Probe – LSI ELN SpectrumOrange/LSI D7S486, D7S522 SpectrumGreen 20 µl 5J30-45 2-16
Vysis Wolf-Hirschhorn Region Probe – LSI WHS SpectrumOrange/CEP 4 SpectrumGreen 20 µl 5J29-74 2-16
Vysis LSI Xq 13.2 (XIST) SpectrumOrange Probe 10 µl 1N61-01 2-17
PreimplantationVysis MultiVysion PB Multi-color Probe CE marked 60 µl 8L62-20 2-18
Vysis MultiVysion PGT Multi-color Probe CE marked 30 µl 8L69-10 2-19
Telomere ProbesVysis ToTelVysion 30 µl 5J05-01 2-21
Vysis TelVysion Probes 5 µl see listing 2-22

2-3All products, except where indicated, are Analyte Specific Reagents. Analytical and performance characteristics are not established.
Genetics – Prenatal, Postnatal and Preimplantation Genetics
References1. Am, J., Hum, Genet, 1992; 51: 55-65.2. Am, J., Obstet, Gynecol, 1991; 1055-1057.3. Prenat Diagn 2000; 20: 1-6.4. Prenat Diagn 2000; 20: 1-6.5. Prenat Diag 2001; 21: 293-301.6. Genetics in Medicine 2000; 26: 356 – 361.
Aneuploidy Probes
AneuVysion Multicolor DNA Probe Kit
The AneuVysion Prenatal Test is an FDA cleared test, which utilizes pat-ented fluorescence in situ hybridization (FISH) technology applied to uncultured amniocytes, and provides detection of trisomies 13, 18, and 21 (Down syndrome) and sex chromosome aneusomies in as little as 24 hours. Together these conditions account for nearly two-thirds of all abnormalities identified at the time of amniocentesis, and 85 – 90 % of clinically significant chromosomal abnormalities detected in live-born infants. Review of AneuVysion testing of over 29,000 amniotic fluid samples has found that the test is 99.9 % accurate for the detection of trisomies 13, 18, 21, and aneusomies of X and Y.
There are several benefits of the AneuVysion Test. Because the results are rapidly available, within 24 hours after the amniocentesis sample is received in the laboratory (rather than 7– 22 days for routine chromosome analysis), patients can benefit psychologically from a shorter time period of uncer-tainty. A normal AneuVysion result may allow patients a sense of relief in knowing that the majority of chromosome abnormalities for which their fetus was at risk have been ruled out with a very high degree of accuracy. Importantly, in accordance with professional standards, the availability of AneuVysion results along with consistent clinical information (i. e., fetal anomalies detected by ultrasonography) allows for pregnancy management options that otherwise might not be available due to late gestational age. Finally, in the rare case of a culture failure when standard cytogenetic results cannot be obtained, information on chromosome number for the most likely aneusomies is available.
Ordering Information Quantity Order No.
AneuVysion FDA Cleared CE marked 10 Assays 5J38-10
AneuVysion FDA Cleared CE marked 30 Assays 5J38-30
AneuVysion FDA Cleared CE marked 50 Assays 5J38-50
Analysis of an uncultured amniocyte (sometimes referred to as direct analysis) hybridized with the AneuVysion 18/X/Y probe set. Abnormal result: three aqua signals indicate three copies of chromosome 18, one green signal indicates one copy of the X chromo-some and one orange signal indicates one copy of the Y chromosome.
All products, except where indicated, are Analyte Specific Reagents. Analytical and performance characteristics are not established.2-4
Genetics – Prenatal, Postnatal and Preimplantation Genetics
Aneuploidy Probes
AneuVysion
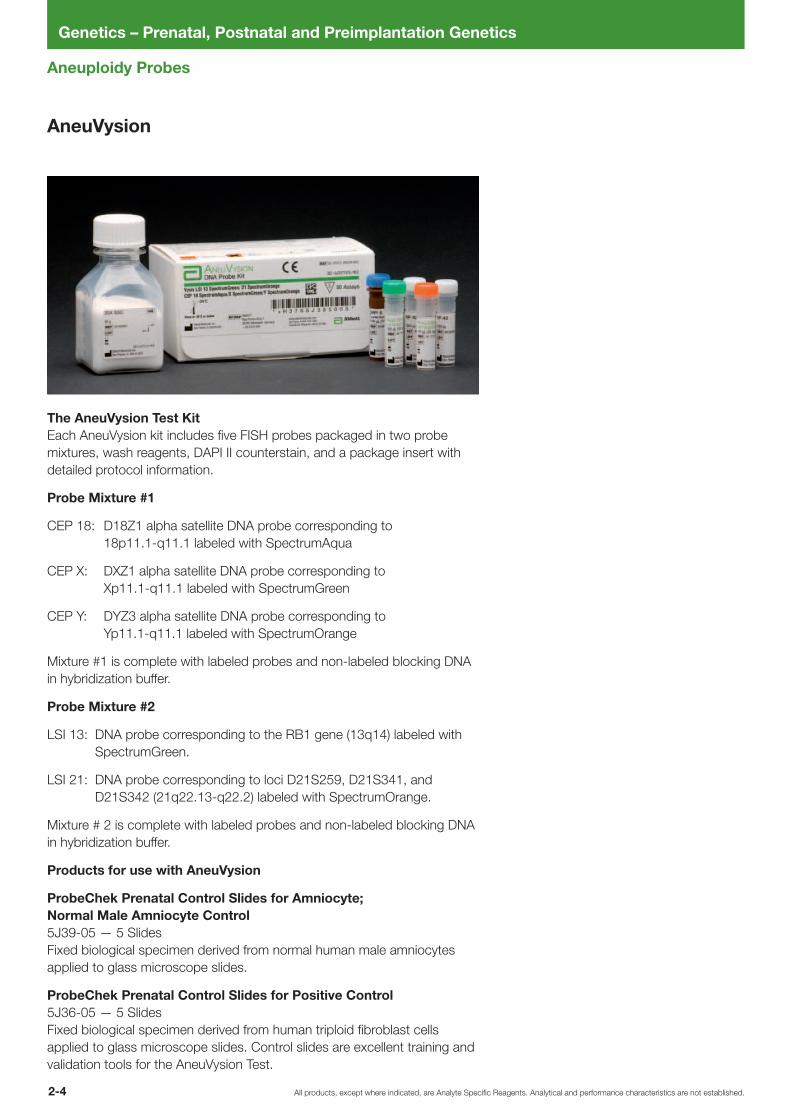
The AneuVysion Test KitEach AneuVysion kit includes five FISH probes packaged in two probe mixtures, wash reagents, DAPI II counterstain, and a package insert with detailed protocol information.
Probe Mixture #1
CEP 18: D18Z1 alpha satellite DNA probe corresponding to 18p11.1-q11.1 labeled with SpectrumAqua
CEP X: DXZ1 alpha satellite DNA probe corresponding to Xp11.1-q11.1 labeled with SpectrumGreen
CEP Y: DYZ3 alpha satellite DNA probe corresponding to Yp11.1-q11.1 labeled with SpectrumOrange
Mixture #1 is complete with labeled probes and non-labeled blocking DNA in hybridization buffer.
Probe Mixture #2
LSI 13: DNA probe corresponding to the RB1 gene (13q14) labeled with SpectrumGreen.
LSI 21: DNA probe corresponding to loci D21S259, D21S341, and D21S342 (21q22.13-q22.2) labeled with SpectrumOrange.
Mixture # 2 is complete with labeled probes and non-labeled blocking DNA in hybridization buffer.
Products for use with AneuVysion
ProbeChek Prenatal Control Slides for Amniocyte; Normal Male Amniocyte Control5J39-05 — 5 Slides Fixed biological specimen derived from normal human male amniocytes applied to glass microscope slides.
ProbeChek Prenatal Control Slides for Positive Control 5J36-05 — 5 SlidesFixed biological specimen derived from human triploid fibroblast cells applied to glass microscope slides. Control slides are excellent training and validation tools for the AneuVysion Test.

2-5All products, except where indicated, are Analyte Specific Reagents. Analytical and performance characteristics are not established.
Genetics – Prenatal, Postnatal and Preimplantation Genetics
~450 kb
5p15.2 region
D5S
23
CentromereTelomere
LSI D5S721, D5S23
D5S
2064
D5S
630
D5S
721
D5S
1514
E
D5S
1518
E
Microdeletion Probes – Cri-du-Chat Region Probes
LSI D5S23, D5S721 probe detects deletions of 5p15.2. The LSI D5S23, D5S721 probe is available alone, or in combination with LSI EGR1 (5q31) as a control.
Ordering Information Quantity Order No.
Vysis Cri-du-Chat Region Probe – LSI D5S23, D5S721 SpectrumGreen 20 µl 5J20-25
References1. Church DM, Yang J, et al.; Genomic Res 7, 8:787.801, 1997
chromosome abnormality. Clin Genet 64:310-316, 2003.2. Heilstedt HA et al., Physical map of 1p36, placement of monosomy 1p36, and clinical
characterization of the syndrome. Am J Hum Genet 72:1200-1212, 2003.
Vysis Cri-du-Chat Region Probe – LSI D5S23, D5S721 SpectrumGreen
All products, except where indicated, are Analyte Specific Reagents. Analytical and performance characteristics are not established.2-6
Genetics – Prenatal, Postnatal and Preimplantation Genetics
Microdeletion Probes – Cri-du-Chat Region Probes
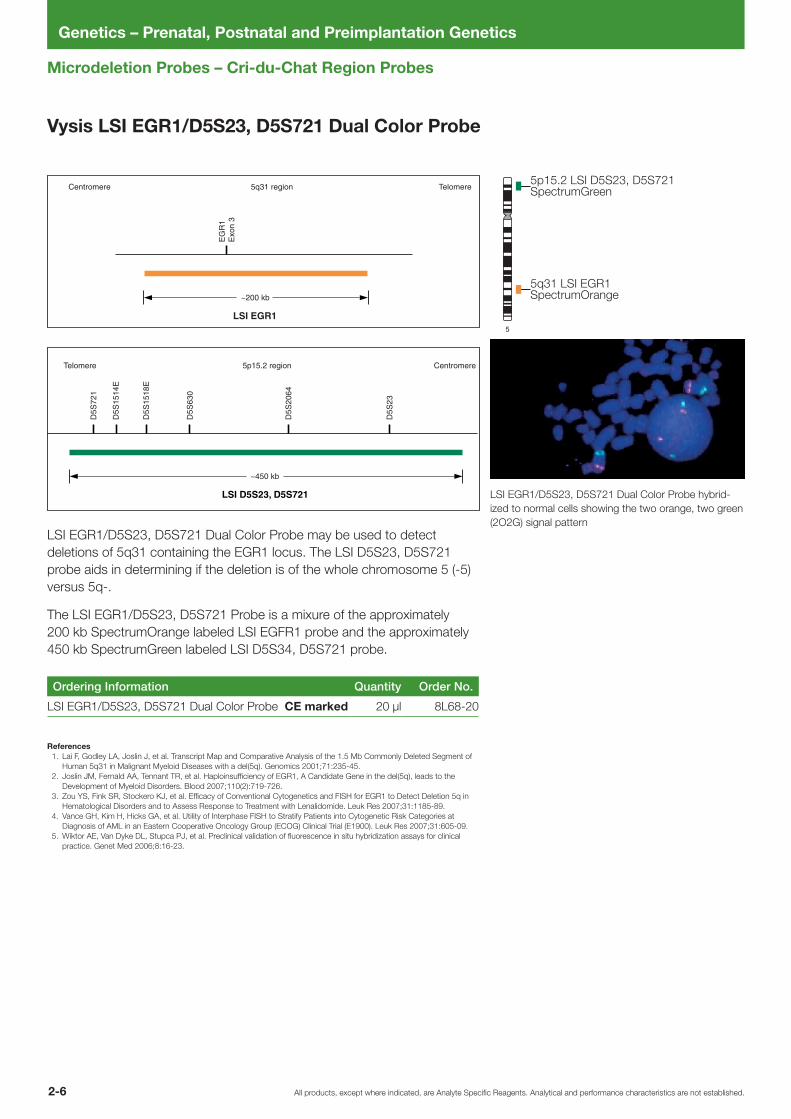
LSI EGR1/D5S23, D5S721 Dual Color Probe may be used to detect deletions of 5q31 containing the EGR1 locus. The LSI D5S23, D5S721 probe aids in determining if the deletion is of the whole chromosome 5 (-5) versus 5q-.
The LSI EGR1/D5S23, D5S721 Probe is a mixure of the approximately 200 kb SpectrumOrange labeled LSI EGFR1 probe and the approximately 450 kb SpectrumGreen labeled LSI D5S34, D5S721 probe.
Ordering Information Quantity Order No.
LSI EGR1/D5S23, D5S721 Dual Color Probe CE marked 20 µl 8L68-20
References1. Lai F, Godley LA, Joslin J, et al. Transcript Map and Comparative Analysis of the 1.5 Mb Commonly Deleted Segment of
Human 5q31 in Malignant Myeloid Diseases with a del(5q). Genomics 2001;71:235-45.2. Joslin JM, Fernald AA, Tennant TR, et al. Haploinsufficiency of EGR1, A Candidate Gene in the del(5q), leads to the
Development of Myeloid Disorders. Blood 2007;110(2):719-726.3. Zou YS, Fink SR, Stockero KJ, et al. Efficacy of Conventional Cytogenetics and FISH for EGR1 to Detect Deletion 5q in
Hematological Disorders and to Assess Response to Treatment with Lenalidomide. Leuk Res 2007;31:1185-89.4. Vance GH, Kim H, Hicks GA, et al. Utility of Interphase FISH to Stratify Patients into Cytogenetic Risk Categories at
Diagnosis of AML in an Eastern Cooperative Oncology Group (ECOG) Clinical Trial (E1900). Leuk Res 2007;31:605-09.5. Wiktor AE, Van Dyke DL, Stupca PJ, et al. Preclinical validation of fluorescence in situ hybridization assays for clinical
practice. Genet Med 2006;8:16-23.
LSI D5S23, D5S721
5p15.2 regionTelomere Centromere
~450 kb
LSI EGR1
5q31 regionCentromere Telomere
~200 kb
EG
R1
Exo
n 3
D5S
23
D5S
2064
D5S
630
D5S
721
D5S
1514
E
D5S
1518
E
5
LSI D5S23, D5S721
5p15.2 regionTelomere Centromere
~450 kb
LSI EGR1
5q31 regionCentromere Telomere
~200 kb
EG
R1
Exo
n 3
D
5S23
D5S
2064
D5S
630
D5S
721
D5S
1514
E
D5S
1518
E
Vysis LSI EGR1/D5S23, D5S721 Dual Color Probe
LSI EGR1/D5S23, D5S721 Dual Color Probe hybrid-ized to normal cells showing the two orange, two green (2O2G) signal pattern

2-7All products, except where indicated, are Analyte Specific Reagents. Analytical and performance characteristics are not established.
Genetics – Prenatal, Postnatal and Preimplantation Genetics
Microdeletion Probes – DiGeorge Region Probes
~110 kb
22q11.2 region
AD
U
N25
(D
22S
75)
CLA
TH
RIN
DG
CR
6
Centromere Telomere
DG
CR
2
CT
P
3' T
UP
LE 1
D22
S55
3D
22S
609
D22
S94
2D
22S
941
D22
S94
3
LSI TUPLE 1
22
The Vysis LSI D22S75 (N25 region) SpectrumOrange FISH probe covers a region including and flanking N25. The probe is coupled with a LSI ARSA control probe that maps to the telomeric end of 22q (22q13).
Ordering Information Quantity Order No.
Vysis LSI D22S75 (N25 region) SO/LSI ARSA Sgn Probe 10 µl 5N24-10
Metaphase and interphase cells hybridized with Vysis LSI D22S75 (N25) region probe (orange) and LSI ARSA probe (green).
Vysis LSI D22S75 (N25 region) SpectrumOrange/ LSI ARSA SpectrumGreen Probe
This probe mixture contains the SpectrumOrange LSI TUPLE (HIRA) probe (3´nocoding region of TUPLE1, D22S553, D22S609 and D22S942) and the SpectrumGreen LSI ARSA (Arylsulfatase A gene) control probe that maps to 22q13.2.
Continuation on the following page >
Vysis DiGeorge Region Probe – LSI TUPLE 1 SpectrumOrange/LSI ARSA SpectrumGreen
LSI TUPLE1 probe hybridized to metaphase and interphase cells. Absence of the orange signal on one chromosome 22 (arrow) indicates deletion of the TUPLE1 locus at 22q11.2.
All products, except where indicated, are Analyte Specific Reagents. Analytical and performance characteristics are not established.2-8
Genetics – Prenatal, Postnatal and Preimplantation Genetics
Microdeletion Probes – DiGeorge Region Probes
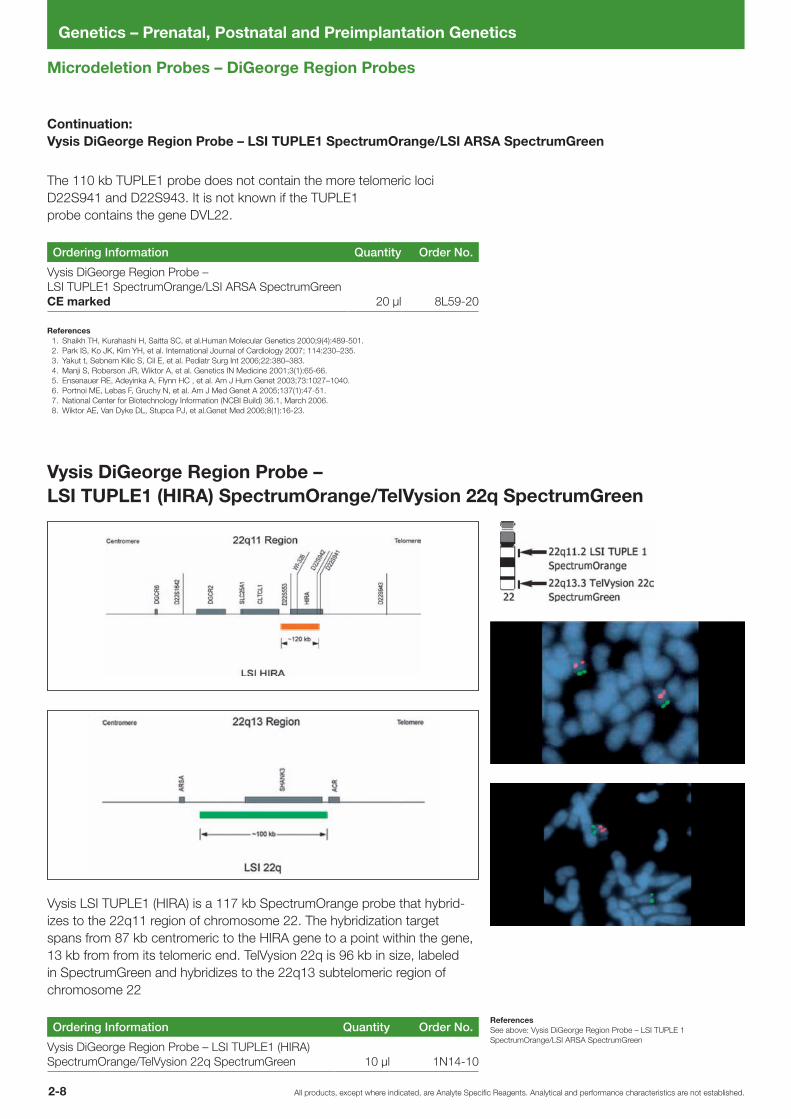
The 110 kb TUPLE1 probe does not contain the more telomeric loci D22S941 and D22S943. It is not known if the TUPLE1 probe contains the gene DVL22.
Ordering Information Quantity Order No.
Vysis DiGeorge Region Probe – LSI TUPLE1 SpectrumOrange/LSI ARSA SpectrumGreen CE marked 20 µl 8L59-20
References1. Shaikh TH, Kurahashi H, Saitta SC, et al.Human Molecular Genetics 2000;9(4):489-501.2. Park IS, Ko JK, Kim YH, et al. International Journal of Cardiology 2007; 114:230–235.3. Yakut t, Sebnem Kilic S, Cil E, et al. Pediatr Surg Int 2006;22:380–383.4. Manji S, Roberson JR, Wiktor A, et al. Genetics IN Medicine 2001;3(1):65-66.5. Ensenauer RE, Adeyinka A, Flynn HC , et al. Am J Hum Genet 2003;73:1027–1040.6. Portnoi ME, Lebas F, Gruchy N, et al. Am J Med Genet A 2005;137(1):47-51.7. National Center for Biotechnology Information (NCBI Build) 36.1, March 2006.8. Wiktor AE, Van Dyke DL, Stupca PJ, et al.Genet Med 2006;8(1):16-23.
Continuation: Vysis DiGeorge Region Probe – LSI TUPLE1 SpectrumOrange/LSI ARSA SpectrumGreen
Vysis LSI TUPLE1 (HIRA) is a 117 kb SpectrumOrange probe that hybrid-izes to the 22q11 region of chromosome 22. The hybridization target spans from 87 kb centromeric to the HIRA gene to a point within the gene, 13 kb from from its telomeric end. TelVysion 22q is 96 kb in size, labeled in SpectrumGreen and hybridizes to the 22q13 subtelomeric region of chromosome 22
Ordering Information Quantity Order No.
Vysis DiGeorge Region Probe – LSI TUPLE1 (HIRA) SpectrumOrange/TelVysion 22q SpectrumGreen 10 µl 1N14-10
Vysis DiGeorge Region Probe – LSI TUPLE1 (HIRA) SpectrumOrange/TelVysion 22q SpectrumGreen
ReferencesSee above: Vysis DiGeorge Region Probe – LSI TUPLE 1 SpectrumOrange/LSI ARSA SpectrumGreen

2-9All products, except where indicated, are Analyte Specific Reagents. Analytical and performance characteristics are not established.
Genetics – Prenatal, Postnatal and Preimplantation Genetics
Microdeletion Probes – Prader-Willi/Angelman Region Probes
Ordering Information Quantity Order No.
Vysis Prader-Willi/Angelman Region Probe – LSI D15S10 (SO)/CEP 15 (D15Z1) (SA)/PML (SG) 10 µl 1N13-10
Four products are offered for the detection or characterization of abnormali-ties involving 15q11-q13. Vysis 15q11-q13 probes are premixed with a CEP 15 control probe. The SNRPN and D15S10 probe mixes also include LSI PML (15q22), a control probe useful for detecting rare translocations in AS and PWS.
Ordering Information Quantity Order No.
Vysis Prader-Willi/Angelman Region Probe – LSI D15S11 SpectrumOrange/CEP 15 (D15Z1) SpectrumGreen 20 µl 5J19-14
References1. Cotter, P. 1999. Prenat. Diagn. 19:721-726.
Vysis Prader-Willi/Angelman Region Probe – LSI D15S10 SpectrumOrange/CEP 15 (D15Z1) SpectrumAqua/PML SpectrumGreen Probe
Vysis Prader-Willi/Angelman Region Probe – LSI D15S11 SpectrumOrange/CEP 15 (D15Z1) SpectrumGreen
All products, except where indicated, are Analyte Specific Reagents. Analytical and performance characteristics are not established.2-10
Genetics – Prenatal, Postnatal and Preimplantation Genetics
LSI GABRB3
~110 kb
15q11-q13 region TelomereCentromere
D15
S11
(1R
4-3R
)
D15
S13
(189
-1)
D15
S63
(PW
71)
SN
RP
N
D15
S10
(TD
3-21
)
D15
S11
3(L5
6-1)
GA
BR
B3
D15
S97
GA
BR
A5
UB
E3A
ZN
F12
7(D
15S
9)
15
Microdeletion Probes – Prader-Willi/Angelman Region Probes
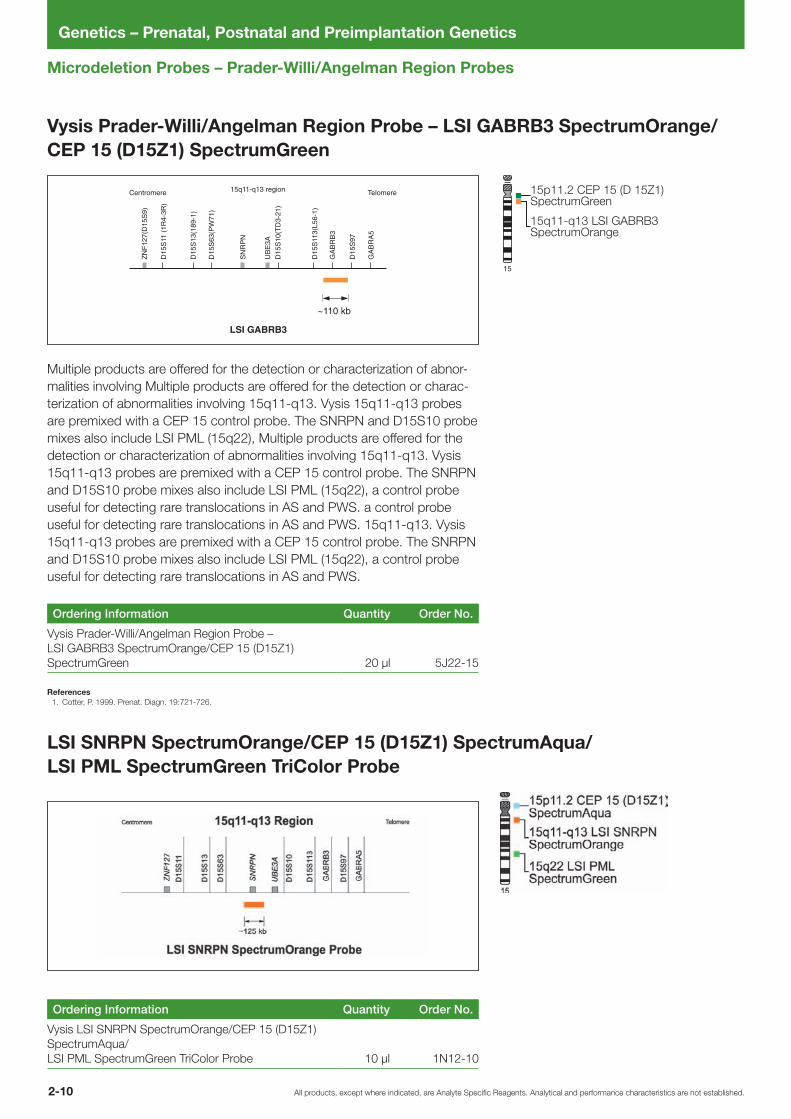
Multiple products are offered for the detection or characterization of abnor-malities involving Multiple products are offered for the detection or charac-terization of abnormalities involving 15q11-q13. Vysis 15q11-q13 probes are premixed with a CEP 15 control probe. The SNRPN and D15S10 probe mixes also include LSI PML (15q22), Multiple products are offered for the detection or characterization of abnormalities involving 15q11-q13. Vysis 15q11-q13 probes are premixed with a CEP 15 control probe. The SNRPN and D15S10 probe mixes also include LSI PML (15q22), a control probe useful for detecting rare translocations in AS and PWS. a control probe useful for detecting rare translocations in AS and PWS. 15q11-q13. Vysis 15q11-q13 probes are premixed with a CEP 15 control probe. The SNRPN and D15S10 probe mixes also include LSI PML (15q22), a control probe useful for detecting rare translocations in AS and PWS.
Ordering Information Quantity Order No.
Vysis Prader-Willi/Angelman Region Probe – LSI GABRB3 SpectrumOrange/CEP 15 (D15Z1) SpectrumGreen 20 µl 5J22-15
References1. Cotter, P. 1999. Prenat. Diagn. 19:721-726.
Vysis Prader-Willi/Angelman Region Probe – LSI GABRB3 SpectrumOrange/ CEP 15 (D15Z1) SpectrumGreen
Ordering Information Quantity Order No.
Vysis LSI SNRPN SpectrumOrange/CEP 15 (D15Z1) SpectrumAqua/ LSI PML SpectrumGreen TriColor Probe 10 µl 1N12-10
LSI SNRPN SpectrumOrange/CEP 15 (D15Z1) SpectrumAqua/ LSI PML SpectrumGreen TriColor Probe
2-11All products, except where indicated, are Analyte Specific Reagents. Analytical and performance characteristics are not established.
Genetics – Prenatal, Postnatal and Preimplantation Genetics
Microdeletion Probes – Others
1
CE
B10
8/T7
D1S
2520
~90 kb
~600 kb
~110 kb
CD
C2L
2FL
J130
62
Telomere Centromere1p36 Region
~160 kb
Xp22.3 regionTelomere Centromere
LSI KAL
DX
S12
23
DX
S11
38
Exo
n 7
Exo
n 4
Exo
n 1
5'3'
X
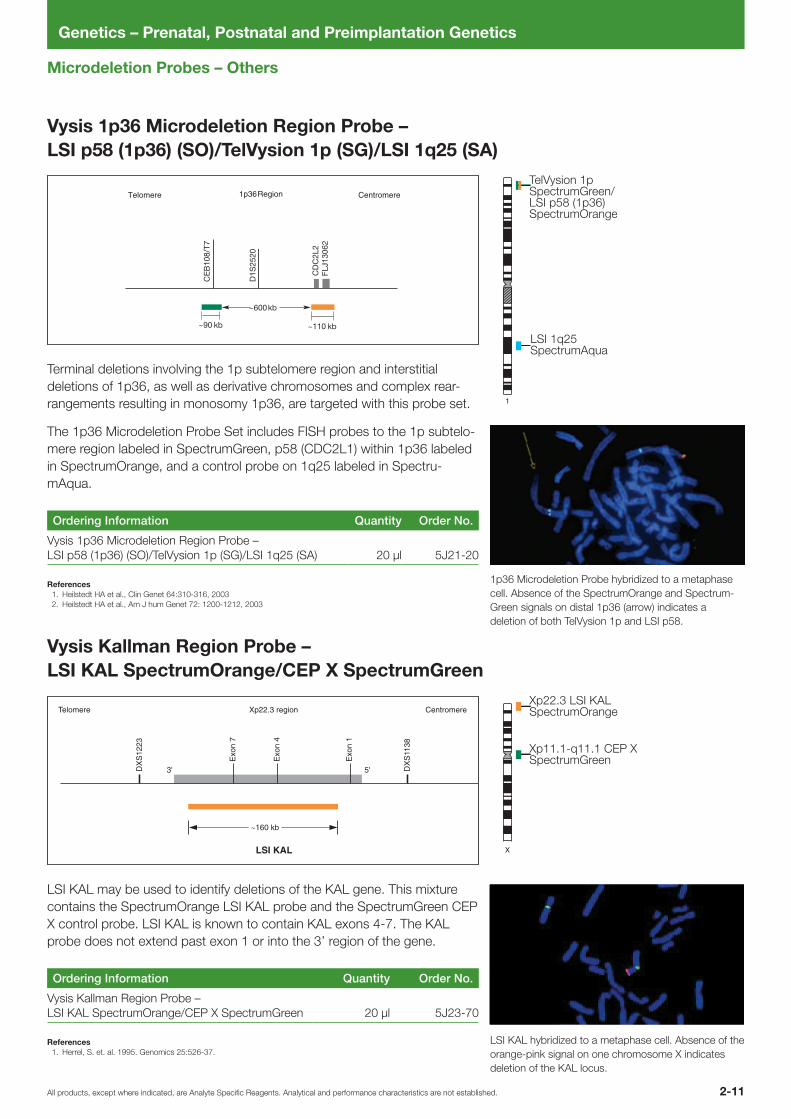
Terminal deletions involving the 1p subtelomere region and interstitial deletions of 1p36, as well as derivative chromosomes and complex rear-rangements resulting in monosomy 1p36, are targeted with this probe set.
The 1p36 Microdeletion Probe Set includes FISH probes to the 1p subtelo-mere region labeled in SpectrumGreen, p58 (CDC2L1) within 1p36 labeled in SpectrumOrange, and a control probe on 1q25 labeled in Spectru-mAqua.
Ordering Information Quantity Order No.
Vysis 1p36 Microdeletion Region Probe – LSI p58 (1p36) (SO)/TelVysion 1p (SG)/LSI 1q25 (SA) 20 µl 5J21-20
References1. Heilstedt HA et al., Clin Genet 64:310-316, 20032. Heilstedt HA et al., Am J hum Genet 72: 1200-1212, 2003
1p36 Microdeletion Probe hybridized to a metaphase cell. Absence of the SpectrumOrange and Spectrum-Green signals on distal 1p36 (arrow) indicates a deletion of both TelVysion 1p and LSI p58.
Vysis 1p36 Microdeletion Region Probe – LSI p58 (1p36) (SO)/TelVysion 1p (SG)/LSI 1q25 (SA)
LSI KAL may be used to identify deletions of the KAL gene. This mixture contains the SpectrumOrange LSI KAL probe and the SpectrumGreen CEP X control probe. LSI KAL is known to contain KAL exons 4-7. The KAL probe does not extend past exon 1 or into the 3’ region of the gene.
Ordering Information Quantity Order No.
Vysis Kallman Region Probe – LSI KAL Spectrum Orange/CEP X SpectrumGreen 20 µl 5J23-70
References1. Herrel, S. et. al. 1995. Genomics 25:526-37.
LSI KAL hybridized to a metaphase cell. Absence of the orange-pink signal on one chromosome X indicates deletion of the KAL locus.
Vysis Kallman Region Probe – LSI KAL SpectrumOrange/CEP X SpectrumGreen

All products, except where indicated, are Analyte Specific Reagents. Analytical and performance characteristics are not established.2-12
Genetics – Prenatal, Postnatal and Preimplantation Genetics
Microdeletion Probes – Others
~110 kb
17p13.3 regionTelomere Centromere
LSI LIS1
D17
S37
9
5' 3'LIS1 gene
~80 kb
17
Vysis LSI MAPT is a 329 kb SpectrumGreen probe that can be used for assessment of the presence or absence of the MAPT locus on chromo-some 17. It spans the entire MAPT gene.
Ordering Information Quantity Order No.
Vysis LSI MAPT SpectrumGreen Probe 10 µl 2N19-10
MAPT SpectrumGreen probe hybridized to a meta-phase cell. Absence of the green signal on one chromosome 17 indicates deletion of the MAPT locus.
Vysis LSI MAPT SpectrumGreen Probe
The Vysis LSI LIS1 FISH probe is approximately 110 kb in size and homo-logous to the LIS1 gene located at 17p13.3. The LSI LIS1 probe is directly labeled with SpectrumOrange and is mixed with a control probe, LSI RARA. LSI RARA is specific to the 17q21.1 region and is directly labeled with SpectrumGreen fluorophore.
Ordering Information Quantity Order No.
Vysis Miller-Dieker Region/Isolated Lissencephaly Probe LSI LIS1 SpectrumOrange/LSI RARA SpectrumGreen 20 µl 5J88-01
References1. Ledbetter, S. A. et. al. Microdeletions of Chromosome 17p13 as a Cause of Isolated Lissencephaly,
Am. J. Hum. Genet.50:182-189, 1992.2. Dobyns, W. B. et. al. Clinical and Molecular Diagnosis of Miller-Dieker Syndrome, Am. J. Hum. Genet. 48:584-594, 1991.3. Van Zelderen-Bhola, S.L et. al. Prenatal and Postnatal Investigation of a Case with Miller-Dieker Syndrome Due to
a Familial Cryptic Translocation t(17;20) (p13.3;q13.3) Detected by Fluorescence In Situ Hybridization, Prenatal Diagnosis 17:2:173-179, 1997.
4. Kuwano, A. et. al. Detection of Deletions and Cryptic Translocations in Miller-Dieker Syndrome by In Situ Hybridization, Am. J. Hum.Genet. 49:707-714,1991.
Metaphase spread containing one chromosome 17 with SpectrumGreen LSI RARA and absence of the SpectrumOrange LSI LIS1 signal (arrow). The normal chromosome 17 shows the presence of SpectrumOr-ange LSI LIS1 and SpectrumGreen LSI RARA.
Vysis Miller-Dieker Region/Isolated Lissencephaly Probe LSI LIS1 SpectrumOrange/LSI RARA SpectrumGreen

2-13All products, except where indicated, are Analyte Specific Reagents. Analytical and performance characteristics are not established.
Genetics – Prenatal, Postnatal and Preimplantation Genetics
Microdeletion Probes – Others
17p11.2 regionTelomere Centromere
LSI SMS
LLG
L1
FLI
I
TO
P3
SH
MT
1
~140 kb
17
17p11.2 LSI SMS SpectrumOrange
17q12-q21 LSI RARA SpectrumGreen
5
LSI SMS is approximately 140 kb in size and homologous to the Smith-Magenis region. The LSI SMS probe is directly labeled with Spectrum-Orange and is mixed with the LSI RARA control probe. LSI RARA is specific to 17q21.1 and is directly labeled with SpectrumGreen.
Ordering Information Quantity Order No.
Vysis Smith-Magenis Region Probe – LSI SMS Region SpectrumOrange/LSI RARA Spectrum Green 20 µl 5J25-03
References1. Juyal, R.C., et. al. Molecular Analyses of 17p11.2 Deletions in 62 Smith-Magenis Syndrome Patients,
Am. J. Hum. Genet. 58:998-1007, 1996.2. Zori, R.T. et. al. Clinical, Cytogenetic, and Molecular Evidence for an Infant With Smith-Magenis Syndrome Born From
a Mother Having Mosaic 17p11.2p12 Deletion, Am. J. Med. Genet. 47:504-511, 1993.3. Schmickel, R.D. Contiguous gene syndromes: a component of recognizable syndromes. J. Pediat 109:231-241 1986.4. Elsea, S..H., et. al. Haploinsuffi ciency of Cystolic Serine Hydroxymethyltransferase in the Smith-Magenis Syndrome.
Am. J. Med. Genet. 57:1342-1350, 1995.5. Cambell, H.D., et. al. Genomic Structure, Evolution, and Expression of Human FLII, a Gelsolin and Leucine-Rich-Repeat
Family Member: Overlap with LLGL. Genomics 42:46-54, 1997.6. Elsea, S.H., et. al. Gene for Topoisomerase III Maps within the Smith-Magenis Syndrome Critical Region:
Analysis of Cell-Cycle Distribution and Radiation Sensitivity. Am. J. Med. Genet. 75:104-108, 1998.
Metaphase spread containing one chromosome 17 with the SpectrumGreen LSI RARA Control Probe and absence of the SpectrumOrange LSI SMS Probe signal. The normal chromosome 17 shows the presence of the SpectrumOrange LSI SMS Probe and the SpectrumGreen LSI RARA Control Probe.
Vysis Smith-Magenis Region Probe – LSI SMS Region SpectrumOrange/ LSI RARA SpectrumGreen
Ordering Information Quantity Order No.
Vysis Sotos Region Probe – LSI NSD1 (5q35) SpectrumOrange Probe 20 µl 5J48-07
References1. Haqq C. and Donahoe P., 1998. Physiological Reviews 78:1, 1-33.2. Whitfield L. et. al., 1995. Genomics 27:306-311.3. Tuck-Muller, C.M., 1995. Hum. Genet. 96:1;119-129.4. Yenamandra A, et. al., 1997. Amer. J. Med. Genetics 72:125-128.5. Patsalis P., 1997. Clin Genet Mar;51(3):184-190.6. Reddy P., 1997. J of Urology 158:1305-1307.7. Sinclair, 1990. A.H. Nature 346: 240-244. LSI NSD1 (5q35) SpectrumOrange Probe Set hybridized
to a metaphase cell. Absence of the SpectrumOrange signals on distal 5q35 indicates a deletion.
Vysis Sotos Region Probe – LSI NSD1 (5q35) SpectrumOrange/ LSI D5S23, D5S721 SpectrumGreen Probe

All products, except where indicated, are Analyte Specific Reagents. Analytical and performance characteristics are not established.2-14
Genetics – Prenatal, Postnatal and Preimplantation Genetics
Yp11.3Telomere Centromere
LSI SRY
~120 kb
pseudoautosomalregion
region ofXY homology
SY
4
SY
13
p81
9 PAB
pse
udoa
utos
omal
bou
ndar
y
SR
Y
DY
S20
1p
H09
DY
S23
4
DY
S24
2
DY
S25
0
DY
S25
1
ZFY
Y
Microdeletion Probes – Others
The SRY gene is located within 10kb of the pseudoautosomal region of Yp. The LSI SRY probe is useful in detecting deletions of SRY or presence of the gene in rearrangements involving the X chromosome, autosomes and marker chromosomes.
The LSI SRY DNA FISH probe is an approximately 120 kb probe specific to the SRY gene and flanking sequences. This probe is directly labeled with SpectrumOrange and is available as a single probe or mixed with the CEP X SpectrumGreen probe.
Ordering Information Quantity Order No.
Vysis SRY Probe – LSI SRY SpectrumOrange 20 µl 5J27-79
Vysis SRY Probe – LSI SRY SpectrumOrange

2-15All products, except where indicated, are Analyte Specific Reagents. Analytical and performance characteristics are not established.
Genetics – Prenatal, Postnatal and Preimplantation Genetics
Microdeletion Probes – Others
Y
Yp11.3Telomere Centromere
LSI SRY
~120 kb
pseudoautosomalregion
region ofXY homology
SY
4
SY
13
p81
9 PAB
pse
udoa
utos
omal
bou
ndar
y
SR
Y
DY
S20
1p
H09
DY
S23
4
DY
S24
2
DY
S25
0
DY
S25
1
ZFY
The SRY gene is located within 10 kb of the pseudoautosomal region of Yp. The LSI SRY probe is useful in detecting deletions of SRY or presence of the gene in rearrangements involving the X chromosome, autosomes and marker chromosomes.
The LSI SRY DNA FISH probe is an approximately 120 kb probe specific to the SRY gene and flanking sequences. This probe is directly labeled with SpectrumOrange and is available as a single probe or mixed with the CEP X SpectrumGreen probe.
Ordering Information Quantity Order No.
Vysis SRY Probe LSI SRY SpectrumOrange/ CEP X SpectrumGreen 20 µl 5J27-07
References1. Haqq C. and Donahoe P., 1998. Physiological Reviews 78:1, 1-33.2. Whitfield L. et. al., 1995. Genomics 27:306-311.3. Tuck-Muller, C.M., 1995. Hum. Genet. 96:1;119-129.4. Yenamandra A, et. al., 1997. Amer. J. Med. Genetics 72:125-128.5. Patsalis P., 1997. Clin Genet Mar;51(3):184-190.6. Reddy P., 1997. J of Urology 158:1305-1307.7. Sinclair, 1990. A.H. Nature 346: 240-244
LSI SRY SpectrumOrange/CEP X SpectrumGreen hybridized to a specimen obtained from an XX male. Note the presence of an orange LSI SRY probe signal on one X chromosome.
Vysis SRY Probe LSI SRY SpectrumOrange/CEP X SpectrumGreen

All products, except where indicated, are Analyte Specific Reagents. Analytical and performance characteristics are not established.2-16
Genetics – Prenatal, Postnatal and Preimplantation Genetics
7q11.23 regionCentromere Telomere
LSI ELN
~180 kb
D7S
613
ELN
LIM
K1
Microdeletion Probes – Others
Targeting 7q11.23, the Elastin gene (ELN) gene region, the Williams (ELN) Region Probe consists of a probe (approximately 180 kb in size) for ELN, LIMK1, and the D7S613 locus, and a control probe for the region contain-ing loci D7S486 and D7S522 (7q31).
Ordering Information Quantity Order No.
Vysis Williams Syndrome Region Probe – LSI ELN SpectrumOrange/LSI D7S486, D7S522 SpectrumGreen 20 µl 5J30-45
References1. Osborne, L. et. al. 1996. Genomics 36; 328-336.
Vysis Williams Region Probe – LSI ELN SpectrumOrange/LSI D7S486, D7S522 SpectrumGreen
Metaphase and interphase cells hybridized with LSI ELN. Absence of the orange signal on one chromo-some 7 indicates a deletion of the Williams Region.
LAN
CLT
CL
22q11.2 regionCentromere Telomere
TU
PLE
1
N25
~100 kbLSI N25 X
LSI STS may be used to identify deletions of the STS gene located in band Xp22.3. This mixture contains the SpectrumOrange LSI STS probe and the SpectrumGreen CEP X control probe. The LSI STS, approximately 220 kb in size, includes the entire STS gene. The STS probe does not contain the more telomeric locus GMGXY3 or the more centromeric locus DXS237.
Ordering Information Quantity Order No.
Vysis Steroid Sulfatase Deficiency Probe – LSI STS SpectrumOrange/LSI CEP X SpectrumGreen 20 µl 5J28-04 LSI STS probe hybridized to a metaphase cell.
Absence of the orange signal on one chromosome X indicates a deletion of the STS gene.
Vysis Steroid Sulfatase Deficiency Probe – LSI STS SpectrumOrange/LSI CEP X SpectrumGreen

2-17All products, except where indicated, are Analyte Specific Reagents. Analytical and performance characteristics are not established.
Genetics – Prenatal, Postnatal and Preimplantation Genetics
~90 kb
4p16.3 regionTelomere Centromere
LSI WHS
Exo
n 25
a
WHSC1 gene
87 kb
~165 kb
WHSCR
Exo
n 12
b
Exo
n 1
4
Microdeletion Probes – Others
In a normal male cell hybridized with LSI Xq13.2 (XIST) SpectrumOrange probe, the expected signal pattern is one orange signal.
The Wolf-Hirschhorn (WHS) probe set targets p arm of chromosome 4.
The LSI WHS probe is directly labeled with SpectrumOrange and is mixed with a control probe, CEP 4 labeled with SpectrumGreen fluorophore.
Ordering Information Quantity Order No.
Vysis Wolf-Hirschhorn Region Probe – LSI WHS SpectrumOrange/CEP 4 SpectrumGreen 20 µl 5J29-74
References1. Hirshhorn, K., et. al., Deletion of Short Arms of Chromosome 4-5 in a child with defects of midline fusion.
Humangenetik, 1: 479-482, 1965.2. Estabrooks, L.L. et. al., Preliminary Phenotypic Map of Chromosome 4p16 Based on 4p Deletions.
Am J. Med. Genet., 57; 581-586, 1995.3. Altherr, M. R. et. al Molecular Confirmation of Wolf-Hirschhorn Syndrome with a Subtle Translocation of
Chromosome 4. Am. J. Hum. Genet., 49: 1235-1242, 1991. 4. Ingrid, S., et. al., WHSC1, a 90 kb SET domain-containing gene, expressed in early development and homologous to a
Drosophila dysmorphy gene maps in the Wolf-Hirschhorn syndrome critical region and is fused to IGH in t (4;14) multiple myeloma. Human Molecular Genetics, 7:1, 1071-1082, 1998.
Metaphase spread containing one chromosome 4 with the CEP 4 SpectrumGreen but without the LSI WHS SpectrumOrange signal.The normal chromosome 4 shows the presence of the LSI WHS SpectrumOrange and the CEP 4 SpectrumGreen.
Vysis Wolf-Hirschhorn Region Probe – LSI WHS SpectrumOrange/CEP 4 SpectrumGreen
Vysis LSI Xq13.2 (XIST) is a 155 kb SpectrumOrange probe that can be used for assessment of the presence or absence of the XIST locus on chro-mosome X. The probe spans the entire XIST geneOrdering Information Quantity Order No.
Vysis LSI Xq13.2 (XIST) SpectrumOrange Probe 10 µl 1N61-01
Vysis LSI Xq13.2 (XIST) SpectrumOrange Probe

All products, except where indicated, are Analyte Specific Reagents. Analytical and performance characteristics are not established.2-18
Genetics – Prenatal, Postnatal and Preimplantation Genetics
Preimplantation
13q14 region
LSI 13 RB1
~440 kb
RB1
180 kb5' 3'
21
21q22.13-q22.2 region
LSI 21
D21
S33
8
EG
R
D21
S33
9
D21
S34
2
D21
S34
1
D21
S25
9
~300 kb
Centromere 22q 11.2 region Telomere
Exo
n 1
Exo
n 2
Exo
n 3
M-bcr regionM-bcr region
LSI 22q
~300 kb
5’ 3’
1 2 3 4 5
13
18
16
22
MultiVysion PGT and MultiVysion PB fluorescence in situ hybridization (FISH) probe sets are designed for determination of chromosome copy number in single cells.
Unlabeled DNA is included with both probe sets to block sequences contained within the target loci that are common to other chromosomes. This probe set is premixed in Hybridization Buffer.
LSI 13: DNA probe spanning the RB1 (13q14) labeled with SpectrumRed.
CEP 16: D16Z3 satellite II DNA probe corresponding to 16q11.2 labeled with SpectrumAqua.
CEP 18: D18Z1 alpha-satellite DNA probe corresponding to 18p11.1-q11.1 labeled with SpectrumBlue.
LSI 21: DNA probe corresponding to loci D21S341, D21S342, D21S339, EGR, and D21S338 (21q22.13-q22.2) labeled with SpectrumGreen.
LSI 22: DNA probe corresponding to the BCR locus (22q11.2) labeled with SpectrumGold.
Human placental DNA labeled with (SpectrumAqua, SpectrumBlue, and SpectrumOrange) is included in the mixture to provide a nuclear stain.
Continuation on the following page >
Analysis of MultiVysion PB hybridized to an embryonic cell showing normal results with 2 signals for each color of probe.
Vysis MultiVysion PB Multi-color Probe

2-19All products, except where indicated, are Analyte Specific Reagents. Analytical and performance characteristics are not established.
Genetics – Prenatal, Postnatal and Preimplantation Genetics
Preimplantation
Ordering Information Quantity Order No.
Vysis MultiVysion PB Mulit-color FISH Probe Kit CE marked 60 µl * 8L62-20
* 60 µl calculated for 20 assays
References1. Munné S, Sandalinas M, Escudero T, et al. Improved implantation after preimplantation genetic diagnosis of aneuploidy.
Reprod Biomed Online. 2003;7(1):91-72. Munné S, Chen S, Fischer J, et al. Preimplantation genetic diagnosis reduces pregnancy loss in women aged 35 years
and older with a history of recurrent miscarriages. Fertil Steril. 2005;84(2):331-5. 3. Bloechle M, Marr S, Guillot P, et al. P-698: Polar body analysis of 314 unfertilized oocytes: what can we learn?
Fertil Steril. 2006;86(3) Suppl. 2:S392-3.4. Kahraman S, Benkhalifa M, Donmez E, et al. The results of aneuploidy screening in 276 couples undergoing assisted
reproductive techniques. Prenat Diagn. 2004;24(4):307-11.5. Baart EB, Martini E, and D. Van Opstal. Screening for aneuploidies of ten different chromosomes in two rounds of FISH:
a short and reliable protocol. Prenat Diagn. 2004;24(12):955-61.6. Verlinsky Y, Cieslak J, Freidine M, et al. Pregnancies following pre-conception diagnosis of common aneuploidies by
fluorescent in-situ hybridization. Hum Reprod. 1995;10(7):1923-19277. Verlinsky Y and Kuliev A, eds. Preimplantation Diagnosis of Genetic Diseases: A New Technique for Assisted
Reproduction. New York: Wiley Liss. 19948. Staessen C, Platteau P, Van Assche, et al. Comparison of blastocyst transfer with or without preimplantation genetic
diagnosis for aneuploidy screening in couples with advanced maternal age: a prospective randomized controlled trial. Hum Reprod 2004;19(12):2849-58
Continuation: Vysis MultiVysion PB Multi-color Probe

All products, except where indicated, are Analyte Specific Reagents. Analytical and performance characteristics are not established.2-20
Genetics – Prenatal, Postnatal and Preimplantation Genetics
Preimplantation
MultiVysion PGT and MultiVysion PB fluorescence in situ hybridization (FISH) probe sets are designed for determination of chromosome copy number in single cells.
Unlabeled DNA is included with both probe sets to block sequences contained within the target loci that are common to other chromosomes. This probe set is premixed in Hybridization Buffer.
LSI 13: DNA probe spanning the RB1 gene (13q14) labeled with SpectrumRed.
CEP 18: D18Z1 alpha-satellite DNA probe corresponding to 18p11.1-18q11.1 labeled with SpectrumAqua.
LSI 21: DNA probe corresponding to loci D21S341, D21S342, D21S339, EGR, and D21S338 (21q22.13-q22.2) labeled with SpectrumGreen.
CEP X: DXZ1 alpha-satellite DNA probe corresponding to Xp11.1-q11.1 labeled with SpectrumBlue.
CEP Y: DYZ3 alpha-satellite DNA probe corresponding to Yp11.1-q11.1 labeled with SpectrumGold.
Human placental DNA labeled with (SpectrumAqua, SpectrumBlue, and SpectrumOrange) is included in the mixture to provide a nuclear stain.
Ordering Information Quantity Order No.
Vysis MultiVysion PGT Multi-color FISH Probe Kit CE marked 30 µl 8L69-10
* 30 µl calculated for 10 assays
ReferencesSee Vysis MultiVysion PB Multi-color Probe (p. 2-19)
Analysis of MultiVysion PB hybridized to an embryonic cell showing normal results with 2 signals for each color of probe.
13q14 region
LSI 13 RB1
~440 kb
RB1
180 kb5' 3'
21q22.13-q22.2 region
LSI 21
D21
S33
8
EG
R
D21
S33
9
D21
S34
2
D21
S34
1
D21
S25
9
~300 kb
X
Xp11.1-q11.1 CEP XSpectrumBlue
13
21
18
Y
Yp11.1-q11.1CEP Y (DYZ3)SpectrumGold
Vysis MultiVysion PGT Multi-color Probe

2-21All products, except where indicated, are Analyte Specific Reagents. Analytical and performance characteristics are not established.
Genetics – Prenatal, Postnatal and Preimplantation Genetics
Telomere Probes
Vysis ToTelVysion
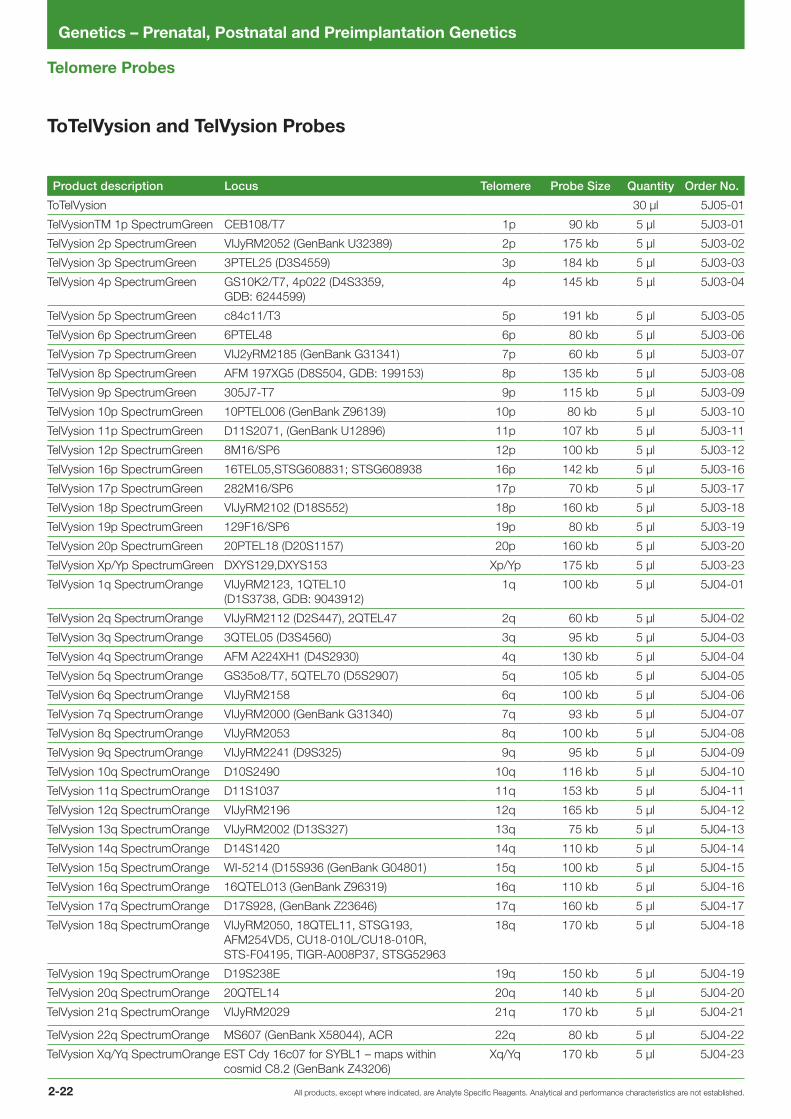
ToTelVysion consists of 41 TelVysion probes, including various LSI and CEP probes (62 probes in total).
The 41 TelVysion probes are specific to:
• p and q subtelomeres of chromosomes 1-12 and 16-20
• q subtelomeres of the acrocentric chromosomes (13, 14, 15, 21, and 22)
• Xp/Yp and Xq/Yq pseudo-autosomal region subtelomeres
• A unique region within 300 kb of each chromosome telomere
The probes in ToTelVysion are provided in 15 mixtures. All probes are directly labeled, providing bright signals with minimal background noise. By utilizing SpectrumOrange, SpectrumGreen, SpectrumAqua, and a combination of SpectrumOrange and SpectrumGreen (to yield a yellow signal), each probe within a mixture is labeled with a unique color.
Ordering Information Quantity Order No.
Vysis ToTelVysion 30 µl* 5J05-01 * 30 µl calculated for 10 assays
All products, except where indicated, are Analyte Specific Reagents. Analytical and performance characteristics are not established.2-22
Genetics – Prenatal, Postnatal and Preimplantation Genetics
Telomere Probes
Product description Locus Telomere Probe Size Quantity Order No.
ToTelVysion 30 µl 5J05-01
TelVysionTM 1p SpectrumGreen CEB108/T7 1p 90 kb 5 µl 5J03-01
TelVysion 2p SpectrumGreen VIJyRM2052 (GenBank U32389) 2p 175 kb 5 µl 5J03-02
TelVysion 3p SpectrumGreen 3PTEL25 (D3S4559) 3p 184 kb 5 µl 5J03-03
TelVysion 4p SpectrumGreen GS10K2/T7, 4p022 (D4S3359, GDB: 6244599)
4p 145 kb 5 µl 5J03-04
TelVysion 5p SpectrumGreen c84c11/T3 5p 191 kb 5 µl 5J03-05
TelVysion 6p SpectrumGreen 6PTEL48 6p 80 kb 5 µl 5J03-06
TelVysion 7p SpectrumGreen VIJ2yRM2185 (GenBank G31341) 7p 60 kb 5 µl 5J03-07
TelVysion 8p SpectrumGreen AFM 197XG5 (D8S504, GDB: 199153) 8p 135 kb 5 µl 5J03-08
TelVysion 9p SpectrumGreen 305J7-T7 9p 115 kb 5 µl 5J03-09
TelVysion 10p SpectrumGreen 10PTEL006 (GenBank Z96139) 10p 80 kb 5 µl 5J03-10
TelVysion 11p SpectrumGreen D11S2071, (GenBank U12896) 11p 107 kb 5 µl 5J03-11
TelVysion 12p SpectrumGreen 8M16/SP6 12p 100 kb 5 µl 5J03-12
TelVysion 16p SpectrumGreen 16TEL05,STSG608831; STSG608938 16p 142 kb 5 µl 5J03-16
TelVysion 17p SpectrumGreen 282M16/SP6 17p 70 kb 5 µl 5J03-17
TelVysion 18p SpectrumGreen VIJyRM2102 (D18S552) 18p 160 kb 5 µl 5J03-18
TelVysion 19p SpectrumGreen 129F16/SP6 19p 80 kb 5 µl 5J03-19
TelVysion 20p SpectrumGreen 20PTEL18 (D20S1157) 20p 160 kb 5 µl 5J03-20
TelVysion Xp/Yp SpectrumGreen DXYS129,DXYS153 Xp/Yp 175 kb 5 µl 5J03-23
TelVysion 1q SpectrumOrange VIJyRM2123, 1QTEL10 (D1S3738, GDB: 9043912)
1q 100 kb 5 µl 5J04-01
TelVysion 2q SpectrumOrange VIJyRM2112 (D2S447), 2QTEL47 2q 60 kb 5 µl 5J04-02
TelVysion 3q SpectrumOrange 3QTEL05 (D3S4560) 3q 95 kb 5 µl 5J04-03
TelVysion 4q SpectrumOrange AFM A224XH1 (D4S2930) 4q 130 kb 5 µl 5J04-04
TelVysion 5q SpectrumOrange GS35o8/T7, 5QTEL70 (D5S2907) 5q 105 kb 5 µl 5J04-05
TelVysion 6q SpectrumOrange VIJyRM2158 6q 100 kb 5 µl 5J04-06
TelVysion 7q SpectrumOrange VIJyRM2000 (GenBank G31340) 7q 93 kb 5 µl 5J04-07
TelVysion 8q SpectrumOrange VIJyRM2053 8q 100 kb 5 µl 5J04-08
TelVysion 9q SpectrumOrange VIJyRM2241 (D9S325) 9q 95 kb 5 µl 5J04-09
TelVysion 10q SpectrumOrange D10S2490 10q 116 kb 5 µl 5J04-10
TelVysion 11q SpectrumOrange D11S1037 11q 153 kb 5 µl 5J04-11
TelVysion 12q SpectrumOrange VIJyRM2196 12q 165 kb 5 µl 5J04-12
TelVysion 13q SpectrumOrange VIJyRM2002 (D13S327) 13q 75 kb 5 µl 5J04-13
TelVysion 14q SpectrumOrange D14S1420 14q 110 kb 5 µl 5J04-14
TelVysion 15q SpectrumOrange WI-5214 (D15S936 (GenBank G04801) 15q 100 kb 5 µl 5J04-15
TelVysion 16q SpectrumOrange 16QTEL013 (GenBank Z96319) 16q 110 kb 5 µl 5J04-16
TelVysion 17q SpectrumOrange D17S928, (GenBank Z23646) 17q 160 kb 5 µl 5J04-17
TelVysion 18q SpectrumOrange VIJyRM2050, 18QTEL11, STSG193, AFM254VD5, CU18-010L/CU18-010R, STS-F04195, TIGR-A008P37, STSG52963
18q 170 kb 5 µl 5J04-18
TelVysion 19q SpectrumOrange D19S238E 19q 150 kb 5 µl 5J04-19
TelVysion 20q SpectrumOrange 20QTEL14 20q 140 kb 5 µl 5J04-20
TelVysion 21q SpectrumOrange VIJyRM2029 21q 170 kb 5 µl 5J04-21
TelVysion 22q SpectrumOrange MS607 (GenBank X58044), ACR 22q 80 kb 5 µl 5J04-22
TelVysion Xq/Yq SpectrumOrange EST Cdy 16c07 for SYBL1 – maps within cosmid C8.2 (GenBank Z43206)
Xq/Yq 170 kb 5 µl 5J04-23
ToTelVysion and TelVysion Probes
3-1All products, except where indicated, are Analyte Specific Reagents. Analytical and performance characteristics are not established.
Oncology – Bladder Cancer
OncologyBladder Cancer
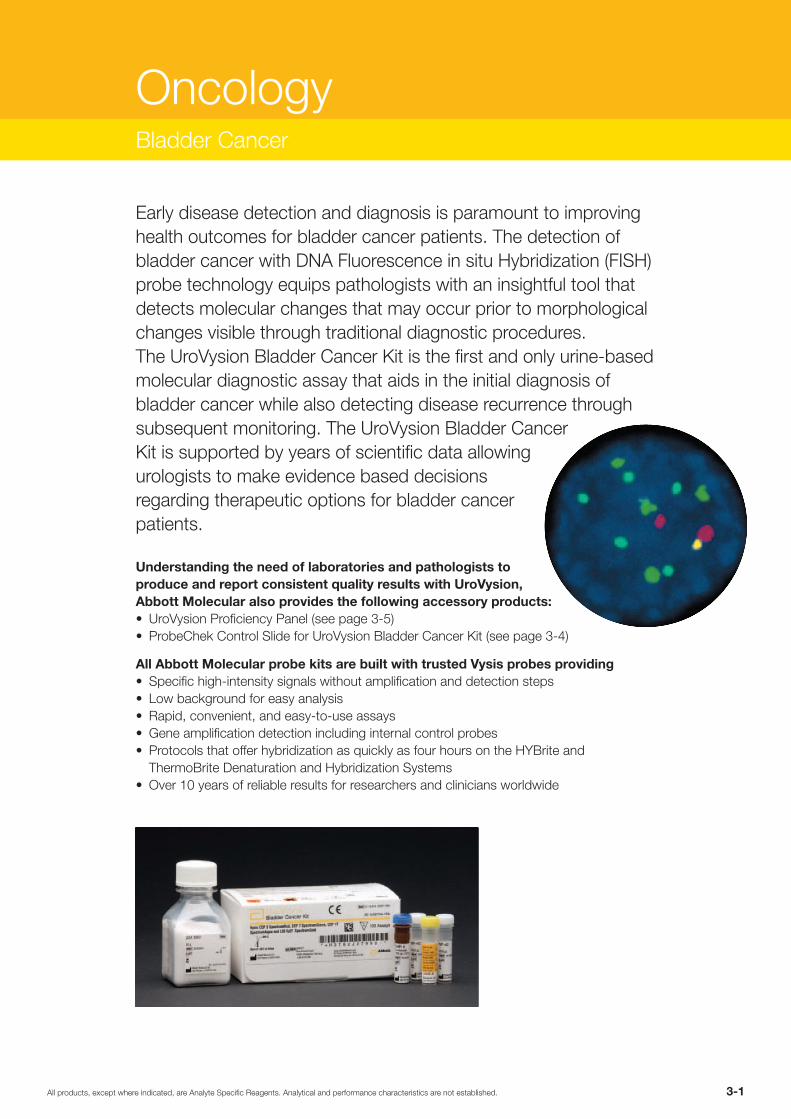
Early disease detection and diagnosis is paramount to improving health outcomes for bladder cancer patients. The detection of bladder cancer with DNA Fluorescence in situ Hybridization (FISH) probe technology equips pathologists with an insightful tool that detects molecular changes that may occur prior to morphological changes visible through traditional diagnostic procedures. The UroVysion Bladder Cancer Kit is the first and only urine-based molecular diagnostic assay that aids in the initial diagnosis of bladder cancer while also detecting disease recurrence through subsequent monitoring. The UroVysion Bladder Cancer Kit is supported by years of scientific data allowing urologists to make evidence based decisions regarding therapeutic options for bladder cancer patients.
Understanding the need of laboratories and pathologists to produce and report consistent quality results with UroVysion, Abbott Molecular also provides the following accessory products:• UroVysion Proficiency Panel (see page 3-5)• ProbeChek Control Slide for UroVysion Bladder Cancer Kit (see page 3-4)
All Abbott Molecular probe kits are built with trusted Vysis probes providing • Specific high-intensity signals without amplification and detection steps• Low background for easy analysis• Rapid, convenient, and easy-to-use assays• Gene amplification detection including internal control probes• Protocols that offer hybridization as quickly as four hours on the HYBrite and
ThermoBrite Denaturation and Hybridization Systems• Over 10 years of reliable results for researchers and clinicians worldwide

All products, except where indicated, are Analyte Specific Reagents. Analytical and performance characteristics are not established.3-2
Oncology – Bladder Cancer
Product description Quantity Order No.Page
Number
UroVysion – FDA Approved CE marked 20 Assays 2J27-20 3-3
UroVysion – FDA Approved CE marked 100 Assays 2J27-99 3-3
ProbeChek Control Slides for UroVysion Bladder Cancer Kit – CE marked 3 Slides 2J27-10 3-3
UroVysion Proficiency Panel 5 Slides 2N02-05 3-5
Vysis CDKN2A/CEP 9 FISH Probe Kit CE markedpreviously: Vysis LSI p16 (9p21) SpectrumOrange/CEP 9 SpectrumGreen Probe 20 µl 4N61-20 3-6
Vysis LSI TP53 (17p13.1) SpectrumOrange Probe CE marked 20 µl 8L64-20 3-7
Vysis TP53/CEP 17 FISH Probe Kit CE marked 20 µl 5N56-20 3-8

3-3All products, except where indicated, are Analyte Specific Reagents. Analytical and performance characteristics are not established.
Oncology – Bladder Cancer
3
9
17
7
LSI p16
9p21 region Telomere Centromere
~190 kb
p16 genep14 p15D
9S17
47
D9S
1749
D9S
1748
D9S
1752
3' 5' 3' 5'
UroVysion
The UroVysion Bladder Cancer Kit (UroVysion Kit) is FDA approved and designed to detect aneuploidy for chromosomes 3, 7, 17, and homozygous loss of the 9p21 locus via fluorescence in situ hybridization (FISH) in urine specimens. Results from the UroVysion Kit are intended for use, in conjunc-tion with and not in lieu of current standard diagnostic procedures, as an aid for initial diagnosis of bladder carcinoma in patients with hematuria and subsequent monitoring for tumor recurrence in patients previously diagnosed with bladder cancer.
The UroVysion Bladder Cancer Kit probes are directly labeled with one of the Vysis fluorophores; SpectrumRed, SpectrumGreen, SpectrumAqua or SpectrumGold. The UroVysion Bladder Cancer Kit consists of three alpha-satellite repeat sequence probes; CEP 3 SpectrumRed, CEP 7 SpectrumGreen, and CEP 17 SpectrumAqua that hybridize to the pericen-tromeric regions of chromosomes 3, 7, and 17, respectively. In addition, a unique sequence probe, LSI p16 (9p21) SpectrumGold, is included that hybridizes to the p16 gene at 9p21. This probe set is premixed in Hybrid-ization Buffer.
Results of HybridizationHybridization is viewed using a fluorescence microscope equipped with appropriate excitation and emission filters allowing visualization of the red, green, aqua, and gold fluorescent signals. Determination of results is conducted by enumeration of CEP 3, 7, 17, and LSI p16 (9p21) signals through microscopic examination of the nucleus. Processing The UroVysion Bladder Cancer Kit can be used with the Vysis VP2000 Processor for specimen pretreatment and the HYBrite or ThermoBrite Denaturation/Hybridization units for modular automation.
Continuation on the following page >
Aneusomic interphase cell obtained from a sample showing two copies of chromosome 3 (red), four copies of chromosome 7 (green), five copies of chromosome 17 (aqua) and one copy of p16 gene (gold) after the UroVysion Bladder Cancer Kit (UroVysi-on Kit) hybridization.

All products, except where indicated, are Analyte Specific Reagents. Analytical and performance characteristics are not established.3-4
Oncology – Bladder Cancer
Continuation: UroVysion
Vysis Microscope Filter RecommendationsUroVysion probe signals and DAPI counterstain should be viewed with the following Vysis filter sets:
• DAPI single bandpass (DAPI counterstain)
• Aqua single bandpass (chromosome 17)
• Yellow single bandpass (p16 gene)
• Red/Green dual bandpass (chromosomes 3 and 7)
An epi-fluorescence microscope equipped with a 100-watt mercury lamp is strongly recommended. Probe Mixture #2
Ordering Information Quantity Order No.
UroVysion FDA Approved , CE marked 20 Assays 2J27-20
UroVysion FDA Approved , CE marked 100 Assays 2J27-99
ProbeChek Control Slides for UroVysion Bladder Cancer Kit FDA Approved , CE marked 3 Slides 2J27-10
References1. Cairns, P. et al. (1995) Nat Genet 11:210-2.2. Cajulis, RS. et al. (1997) Diagn Cytopathol 13:214-24.3. Halling, KC. et al. (2000) J Urol 164, 1768-75.4. Hopman, AHN. et al. (1991) Cancer Res 51:644-51.5. Matsuyama, H. et al. (1994) Cancer Genet Cytogenet 77:118-24.6. Meloni, AM. et al. (1993) Cancer Genet Cytogenet 71:105-18.7. Sauter, G. et al. (1995) Cancer Genet Cytogenet 82:163-9.8. Smeets, W. et al. (1993) Cancer Genet Cytogenet 71:97-9.9. Sokolova, I. et al. (2001) Proceedings of the 92nd annual Meeting of AACR p. 357, Abstract No. 1923.
10. Waldman FM. et al. (1991) Cancer Res 51:3807-13.11. Wheeless, LL. et al. (1994) Cytometry 17:319-26.

3-5All products, except where indicated, are Analyte Specific Reagents. Analytical and performance characteristics are not established.
Oncology – Bladder Cancer
Reassure your staff, administrators and referring clinicians that UroVysion is being optimally performed and interpreted. It is convenient and efficient with the new UroVysion Proficiency Panel. The kit has five specimen slides with a mixture of cultured cell lines and cells obtained from urine samples. The slides mimic the finite set of possible results your lab may observe when performing the UroVysion assay on patient specimens.
• Excellent for training new staff members
• Helpful as a refresher for existing staff
• Insightful when confirming that UroVysion assays are being performed correctly
Submit your results for a complete analysis and recommendationsOnce your lab processes the UroVysion Proficiency Panel, complete and forward the Enumeration Report Forms to the Abbott Molecular Technical Services Team for a comprehensive analysis and confirmation of proficiency status. Technical Services will then provide results to you.
• A Certification of Completion will be issued to your lab if the panel was performed successfully
• If an opportunity to enhance performance is identified, the following services are made available: – On-site visit by our Technical Services Team – Training at an Abbott Molecular FISH Lab – Telephone consultation for labs conducting independent training
The UroVysion Proficiency Panel kit contains • Five fixed, voided urine specimens applied to five microscope slides • Six copies of the Enumeration Report Form for use in determining the
results of the five specimens; one extra form is included for convenience • A copy of the UroVysion Bladder Cancer Kit product insert which in-
cludes a complete hybridization protocol, direction for enumeration, clinical trial data, troubleshooting guide and intended use statement
Ordering Information Quantity Order No.
UroVysion Proficiency Panel 5 slides 2N02-05
UroVysion Proficiency Panel

All products, except where indicated, are Analyte Specific Reagents. Analytical and performance characteristics are not established.3-6
Oncology – Bladder Cancer
Alterations of the 9p21 locus including the tumor suppressor gene CD-KN2A (p16) are implicated in different Meningiomas and Gliomas1– 4. Studies support the association of CDKN2A homozygous deletion with malignant progression and suggest that is is a marker of worse prognosis in anaplas-tic oligodendroglimas.5 – 6
The Vysis LSI CDKN2A SpectrumOrange/CEP 9 SpectrumGreen Probes have been used in serval cytogenetic studies to detect losses of the CDKN2A gene.2, 7– 9 Using this probe set as well as other relevant markers (e. g. p53, RB1, 1p36, 19q13, all Vysis FISH probes), Kramar et al. investi-gated 82 samples from 81 patients with histologically confirmed glial tumors.7 In a study using the Vysis LSI CDKN2A SpectrumOrange/CEP 9 SpectrumGreen Probes on 189 confirmed glioblastoma patients less than 50 years old, Korshunov et al. found 9p21 deletion to be correlated with an unfavorable prognosis.
Vysis LSI CDKN2A/CEP 9 Probes are provided in one vial as a mixture of the LSI CDKN 2A probe labeled with SpectrumOrange and the CEP 9 probe labeled with SpectrumGreen. The LSI CDKN2A probe spans approximately 222 kb and contains a number of genetic loci including D9S1749, D9S1747, p16 (INK4B), p14 (ARF), D9S1748, p15 (INK4B), and D9S1752. The CEP 9 SpectrumGreen probe hybridizes to alpha satellite sequences specific to chromosome 9.
Results of HybridizationIn a normal sample, the expected pattern for a nucleus hybridized with the LSI CDKN2A/ CEP 9 probe is the two orange, two green (2O2G) signal pattern. If a deletion at the 190 kb region covered by the LSI p16 probe occurs on one chromosome 9 homolog and both centromeres from chromosome 9 are retained, the one orange, two green (1O2G) signal pattern is expected.Very small deletions may occur that do not delete the entire LSI p16 probe target and therefore will not be detected.
Ordering Information Quantity Order No.
Vysis CDKN2A/CEP 9 FISH Probe Kit CE marked 20 µl 4N61-20
References1. Ruas M, Peters G. The p16INK4a/CDKN2A tumor suppressor and its
relatives. Biochimic Biophys Acta. 1998;1378(2):F115 – F177.2. Perry A, Banerjee R, Lohse CM, et al. A role for chromosome 9p21
deletions in the malignant progression of meningiomas and the prognosis of anaplastic meningiomas. Brain Pathol. 2002;12(2):183 –190.
3. Boström J, Meyer-Puttlitz B, Wolter M, et al. Alterations of the tumor supressor genes CDKN2A (p16INK4a) p14ARF, CDKN2B (p15INK4b), and CDKN2C (p18INK4c) in atypical and anaplastic meningiomas. Am J Pathol. 2001;159(2):661– 669.
4. Smith JS, Jenkins RB. Genetic alterations in adult diffuse glioma: occurrence, significance, and prognostic implications. Front in Biosci. 2000;5:D213 – D231.
5. Cairncross JG, Ueki K, Zlatescu MC, et al. Specific genetic predictors of chemotherapeutic response and survival in patients with anaplastic oligodendrogliomas. J Natl Cancer Inst. 1998;90(19):1473 –1479.
6. Bortolotto S, Chiadó-Piat L, Cavalla P, et al. CDKN2A/p16 Inactivation in the prognosis of oligodendrogliomas. Int J Cancer. 2000;88(4):554-557.
7. Kramar F, Zemanova Z, Michalova K, et al. Cytogenetic analyses in 81 patients with brain gliomas: correlation with clinical outcome and morphological data. J Neurooncol. 2007;84(2):201– 211.
8. Rajaram V, Leuthardt EC, Singh PK, et al. 9p21 and 13q14 dosages in ependymomas. A clinicopathologic study of 101 cases. Mod Pathol. 2004;17(1):9 –14.
9. Korshunov A, Sycheva R, Golanov A. The prognostic relevance of molecular alterations in glioblastomas for patients age < 50 years. Cancer. 2005;104(4):825 – 832.
Vysis LSI CDKN2A/CEP 9 Dual Color Probe hybridized to a nucleus exhibiting the one orange and two green signal (1O2G) pattern. One p16 gene locus is deleted and both chromosome 9 homologs are present as indicated by one orange and two green signals, respectively.
Vysis CDKN2A/CEP 9 FISH Probe Kitpreviously: Vysis LSI p16 (9p21) SpectrumOrange/CEP 9 SpectrumGreen Probe

3-7All products, except where indicated, are Analyte Specific Reagents. Analytical and performance characteristics are not established.
Oncology – Bladder Cancer
p53 gene
LSI p53
17p13.1 regionTelomere Centromere
~145 kb
17
The LSI TP53 (previously designated as p53) Probe maps to the 17p13.1 region on chromosome 17 containing the p53 gene. The ability to use FISH probes such as the LSI p53 (17p13.1) for interphase cytogenetics has provided new insights into chromosomal aberrations. This probe may be used to detect the deletion (not mutation) or amplification of the p53 locus.
The LSI p53 (17p13.1) SpectrumOrange Probe is an approximately 145 kb probe.
Results of HybridizationIn a cell containing a deletion of the LSI p53 locus, one orange LSI p53 signal will be observed (1O signal pattern). In a cell harboring amplification of the p53 locus multiple copies of the orange signal will be observed. In a normal cell the two orange (2O) signal pattern is observed.
Ordering Information Quantity Order No.
Vysis LSI TP53 (17p13.1) SpectrumOrange Probe CE marked 20 µl 8L64-20
References1. Heim, S. & Mitelman, F. (1995) Cancer Cytogenetics 2nd ed. New York City, NY, JohnWiley & Sons, Inc.
Vysis LSI TP53 (17p13.1) SpectrumOrange Probe
LSI p53 Probe hybridized to a normal cell showing the two orange (2O) signal pattern.

All products, except where indicated, are Analyte Specific Reagents. Analytical and performance characteristics are not established.3-8
Oncology – Bladder Cancer
Normal nucleus showing the two green and two orange signals.
Abnormal nucleus showing the two green and one orange signal.
Vysis LSI TP53/CEP 17 FISH Probe Kit
The Vysis TP53/CEP 17 FISH Probe Kit is intended to detect the copy number of the LSI TP53 probe target located at chromosome 17p13.1 and of the CEP 17 probe target located at the centromere of chromosome 17.
A recurring deletion that occurs in various leukemias, such as CLL and multiple myeloma, is the loss of the 17p13 region, which has been associated with poor patient outcome, both in CLL and in myeloma.1, 2 The LSI TP53/CEP 17 probe combination has been used to detect the loss of the TP53 region in CLL and myeloma studies.3, 4, 5
The approximately 172 kb SpectrumOrange TP53 probe contains the complete TP53 gene and is located at chromosome 17p13.1. The Spec-trumGreen CEP 17 probe is a control probe which hybridizes to the centromere region of chromosome 17p11.1-q11.1.
Ordering Information Quantity Order No.
Vysis LSI TP53/CEP 17 FISH Probe Kit CE marked 20 µl 5N56-20
References1. Shanafelt T, Geyer SM, and Kay NE. Blood. 2004;103(4):1202 –10.2. Avet-Loiseau H, Attal M, Moreau P, et al. Blood. 2007;109(8):3489 – 95. 3. Dewald GW, Brockman SR, Paternoster SF, et al. Br J Haematol. 2003;121:287– 95. 4. Grever MR, Lucas DM, Dewald GW, et al. J Clin Oncol. 2007;25(7):799 – 804. 5. Fonseca R, Blood E, Rue M, et al. Blood. 2003;101(11):4569 – 75. 6. Wiktor AE, Van DL, Stupca PJ, et al. Genet Med. 2006;8(1):16 – 23

4-1All products, except where indicated, are Analyte Specific Reagents. Analytical and performance characteristics are not established.
Oncology – Breast Cancer
OncologyBreast Cancer
Advances in breast cancer testing and treatment have greatly improved patient outcomes. With DNA Fluorescence in situ Hybridization (FISH) probe technology, pathologists accurately and reliably detect genetic aberrations to help guide more confident diagnoses and treatment decisions. Abbott Molecular’s PathVysion HER-2 DNA probe kit is among the first examples of genomic disease management, or personalized medicine. Abbott Molecular also provides directly labeled Vysis DNA probes for additional biomarkers that have been linked to breast cancer.
Abbott Molecular probe kits are built with trusted Vysis probes providing• Specific high-intensity signals without amplification and detection
steps• Low background for easy analysis• Rapid, convenient, and easy-to-use assays• Many probes designed for gene amplification detection include
internal control probes• Protocols that offer hybridization as quickly as four hours on the
HYBrite and ThermoBrite Denaturation and Hybridization Systems• Solid tumor probes have been optimized for paraffin-embedded tissues• Over 10 years of reliable results for researchers and clinicians worldwide
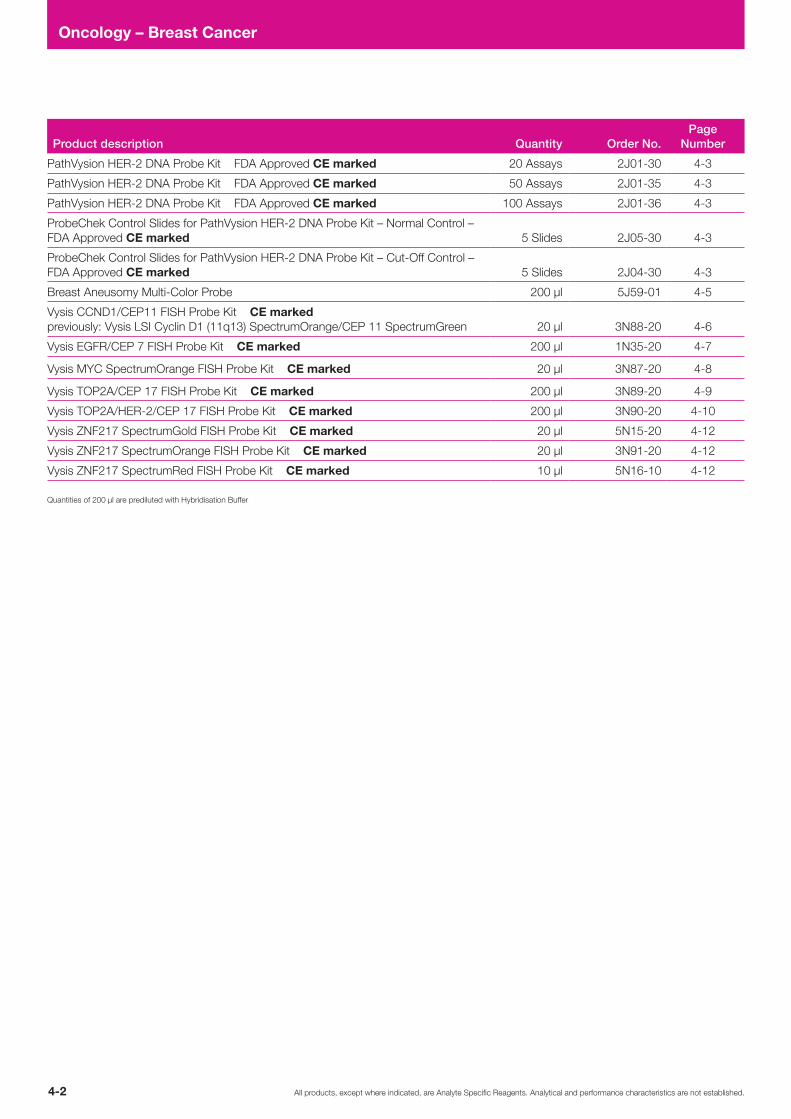
All products, except where indicated, are Analyte Specific Reagents. Analytical and performance characteristics are not established.4-2
Oncology – Breast Cancer
Product description Quantity Order No.Page
Number
PathVysion HER-2 DNA Probe Kit FDA Approved CE marked 20 Assays 2J01-30 4-3
PathVysion HER-2 DNA Probe Kit FDA Approved CE marked 50 Assays 2J01-35 4-3
PathVysion HER-2 DNA Probe Kit FDA Approved CE marked 100 Assays 2J01-36 4-3
ProbeChek Control Slides for PathVysion HER-2 DNA Probe Kit – Normal Control – FDA Approved CE marked 5 Slides 2J05-30 4-3
ProbeChek Control Slides for PathVysion HER-2 DNA Probe Kit – Cut-Off Control – FDA Approved CE marked 5 Slides 2J04-30 4-3
Breast Aneusomy Multi-Color Probe 200 µl 5J59-01 4-5
Vysis CCND1/CEP11 FISH Probe Kit CE marked previously: Vysis LSI Cyclin D1 (11q13) SpectrumOrange/CEP 11 SpectrumGreen 20 µl 3N88-20 4-6
Vysis EGFR/CEP 7 FISH Probe Kit CE marked 200 µl 1N35-20 4-7
Vysis MYC SpectrumOrange FISH Probe Kit CE marked 20 µl 3N87-20 4-8
Vysis TOP2A/CEP 17 FISH Probe Kit CE marked 200 µl 3N89-20 4-9
Vysis TOP2A/HER-2/CEP 17 FISH Probe Kit CE marked 200 µl 3N90-20 4-10
Vysis ZNF217 SpectrumGold FISH Probe Kit CE marked 20 µl 5N15-20 4-12
Vysis ZNF217 SpectrumOrange FISH Probe Kit CE marked 20 µl 3N91-20 4-12
Vysis ZNF217 SpectrumRed FISH Probe Kit CE marked 10 µl 5N16-10 4-12
Quantities of 200 µl are prediluted with Hybridisation Buffer

4-3All products, except where indicated, are Analyte Specific Reagents. Analytical and performance characteristics are not established.
Oncology – Breast Cancer
17q11.2-q12 region
LSI HER-2
~190 kb
HER-2 gene
Centromere Telomere
17
PathVysion HER-2 DNA Probe Kit
Advances in breast cancer testing and treatment have greatly improved patient outcomes. Knowing a woman’s HER-2 status is an essential component to understanding how to treat her breast cancer and potentially extend survival. The PathVysion HER-2 DNA Probe Kit is a vital tool in the fight against breast cancer. It is a precise test that provides clinicians and their patients with accurate and reliable HER-2 results.
The PathVysion HER-2 DNA probe kit is among the first examples of genomic disease management, or personalized medicine. The test enables the accurate assessment of a patient’s HER-2 status at the DNA level and guides doctors to make the most appropriate therapy decisions based on the patient’s genetic profile.
Intended UseThe PathVysion HER-2 DNA Probe Kit (PathVysion Kit) which is FDA approved is designed to detect amplification of the HER-2/neu gene via fluorescence in situ hybridization (FISH) in formalin-fixed, paraffin-embed-ded human breast cancer tissue specimens. Results from the PathVysion Kit are intended for use as an adjunct to existing clinical and pathologic information currently used as prognostic factors in stage II, node-positive breast cancer patients. The PathVysion Kit is further indicated as an aid to predict disease-free and overall survival in patients with stage II, node positive breast cancer treated with adjuvant cyclophosphamide, doxorubicin, and 5-fluorouracil (CAF) chemotherapy.
The PathVysion Kit is indicated as an aid in the assessment of patients for whom HERCEPTIN (Trastuzumab) treatment is being considered (see HERCEPTIN package insert).
HER-2/neu, also known as c-erbB2 or HER-2, is a gene that has been shown to play a key role in the regulation of cell growth. The gene codes for a 185 kd transmembrane cell surface receptor that is a member of the tyrosine kinase family. HER-2 has been shown to be amplified in human breast, ovarian, and other cancers.
Continuation on the following page >
PathVysion HER-2 DNA Probe Kit hybridized to breast tissue showing multiple copies of the HER-2 gene as represented by multiple orange signals. The ratio of orange to green probe signals is greater than 2.0 indicating HER-2 amplification.
All products, except where indicated, are Analyte Specific Reagents. Analytical and performance characteristics are not established.4-4
Oncology – Breast Cancer
Continuation: PathVysion HER-2 DNA Probe Kit
WarningThe Vysis PathVysion Kit is not intended for use to screen for or diagnose breast cancer. It is intended to be used as an adjunct to other prognostic factors currently used to predict disease-free and overall survival in stage II, node-positive breast cancer patients. In making decisions regarding adjuvant CAF treatment, all other available clinical information should also be taken into consideration, such as tumor size, number of involved lymph nodes, and steroid receptor status.No treatment decision for stage II, node-positive breast cancer patients should be based on HER-2/neu gene amplification status alone.
The PathVysion HER-2 DNA Probe Kit consists of two labeled DNA probes. The LSI HER-2 probe that spans the entire HER-2 gene is labeled in SpectrumOrange. The CEP 17 probe is labeled in SpectrumGreen and hybridizes to the alpha satellite DNA located at the centromere of chromo-some 17 (17p11.1-q11.1). Inclusion of the CEP 17 probe allows for the relative copy number of the HER-2 gene to be determined.
Results of HybridizationResults on enumeration of 20 interphase nuclei from tumor cells per target are reported as the ratio of average HER-2/neu copy number to that of CEP 17. Our clinical study found that specimens with amplification showed a LSI HER-2/neu and CEP 17 signal ratio of greater than or equal to 2.0; normal specimens showed a ratio of less than 2.0. Results at or near the cut-off point (1.8-2.2) should be interpreted with caution.
Ordering Information Quantity Order No.
PathVysion HER-2 DNA Probe Kit FDA Approved, CE marked 20 Assay 2J01-30
PathVysion HER-2 DNA Probe Kit FDA Approved, CE marked 50 Assays 2J01-35
PathVysion HER-2 DNA Probe Kit FDA Approved, CE marked 100 Assays 2J01-36
ProbeChek Control Slides for PathVysion HER-2 DNA Probe Kit – Normal Control FDA Approved, CE marked 5 Slides 2J05-30
ProbeChek Control Slides for PathVysion HER-2 DNA Probe Kit – Cut-Off Control FDA Approved, CE marked 5 Slides 2J04-30
References1. Press, et al. Clinical Cancer Research 2005; 11(18) September 15, 2005.2. Mass, R.D. et al. Clinical Breast Cancer, 2005, 6, (3), 240-6. 3. Dybdal, N. et al. Breast Cancer Research and Treatment 2005, 93, (1), 3-11. 4. Pauletti G, et al. Oncogene 1996; 13:63-72. 5. Pauletti G, et al: J Clin Oncol 2000; 18, 21: 3651-3664.

4-5All products, except where indicated, are Analyte Specific Reagents. Analytical and performance characteristics are not established.
Oncology – Breast Cancer
~470 kb
CentromereTelomere1p12 region
LSI 1
D1S
2465
WARS2 HA02 HSD3B2
1
8
17
11
Aneusomy in breast cancer has been well-documented and is considered an early event in breast carcinoma. In a study involving 106 fine needle aspirates of primary breast tumors, 96 % of malignant tumors showed aneusomy of one or more of chromosome 1, 11, or 17, and no aneusomy in benign tumors. Another study found that chromosome 1, 11, and 17 were aneusomic in 79 %, 59 %, and 59 % of 113 fine needle aspirates of breast tumors, respectively. Chromosome 8 was found to be the most frequent aneusomy out of 11 different chromosomes in a study of 55 breast tumor touch preparations.
For Research Use Only. Not for use in Diagnostic Procedures.The Breast Aneusomy Probe was designed as a research tool to help study aneusomies and patterns of aneusomy that can provide important informa-tion as it pertains to prognosis, progression, recurrence, and metastasis. This probe has been optimized for use in cytology specimens.
DNA Probe DescriptionThe LSI 1 probe is an approximately 470 kb clone contig positioned at 1p12. The probe is directly labeled in SpectrumGold.
The CEP 8 alpha satellite DNA probe hybridizes to the centromere region of chromosome 8. The probe is directly labeled with SpectrumRed (8p11.1-q11.1).
The CEP 11 alpha satellite DNA probe hybridizes to the centromere region of chromosome 11. The probe is directly labeled with SpectrumGreen (11p11.11-q11).
The CEP 17 alpha satellite DNA probe hybridizes to the centromere region of chromosome 17. The probe is directly labeled with SpectrumAqua (17p11.1-q11.1).
Results of HybridizationIn a normal diploid cell, two copies of each of LSI 1 (gold signals), CEP 8 (red signals), CEP 11 (green signals), and CEP 17 (aqua signals) should be observed.
Ordering Information Quantity Order No.
Breast Aneusomy Multi-Color Probe 200 µl 5J59-01
References1. Ichikawa,D., et al. Cancer 77 (10) (1996): 2064-2069.2. Tsukamto, F., et al. Cancer (Cancer Cytopathology) 93 (2) (2001): 165-170.3. Persons,D., et al. Clinical Cancer Research 2 (1996): 883-888.4. Heselmeyer-Haddad, K., et al. Cancer Research 62 (2002): 2365-2369.
Normal results observed in an interphase cell obtained from a Fine Needle Aspirate sample after the Breast Aneusomy probe hybridization. Each probe signal: LSI 1 (gold), CEP 8 (red), CEP 11 (green), and CEP 17 (aqua) is present in 2 copies.
Aneusomic interphase cell obtained from a fine needle aspirate sample showing 3 copies of LSI 1(gold), 3 copies of CEP 8 (red), 3 copies of CEP 11 (green), and 4 copies of CEP 17 (aqua) after Breast Aneusomy probe hybridization.
Breast Aneusomy Multi-Color Probe

All products, except where indicated, are Analyte Specific Reagents. Analytical and performance characteristics are not established.4-6
Oncology – Breast Cancer
References1. Schuuring E, Verhoeven E, Tinteren Hv et al.
Cancer Research 1992;52:5229 – 5234.2. Bieche I, Olivi M, Nogues C et al.
P. British Journal of Cancer 20002;86:580 – 586.3. Ormandy CJ, Musgrove EA, Hui R, et al.
Breast Cancer Research and Treatment 2003;78:323 – 335.4. Al-Kuraya K, Schraml P, Torhorst J, et al.
Cancer Research 2004;64:8534 – 8540.5. Jirström K, Stendahl M, Ryden L, et al.
Cancer Research 2005;65(17):8009-8016.6. Katz RL, Caraway NP, Gu J, et al.
American Journal of Clinical Pathology 2000;114:248 – 257.7. Wiktor AE, Van Dyke DL, Stupca PJ, et al.
Genetics in Medicine 2006;8(1):16 – 23.
Amplification of the chromosome 11q13 region, which harbors the Cyclin D1 (CCND1, PRAD1) oncogene, has been reported to occur in up to 15% of breast cancers. CCND1 amplification has been reported to be a prog-nostic marker.1, 2, 3
Several studies used the Vysis CCND1/CEP 11 FISH Probe Kit to detect CCND1 amplification in breast cancer samples. Al-Karaya et al. analyzed a tissue microarray of 2197 breast cancer samples using the probe kit and found CCND1 amplification in 20.1 % of cases.4 CCND1 amplification was associated with high tumor grade and a tendency toward shortened survival. Jirstrom et al. analyzed a tissue microarray of 500 breast cancer specimens from patients treated and not treated with adjuvant tamoxifen.5 The study found CCND1 amplification to be agonistic to tamoxifen with amplified patients having a significantly higher risk of recurrence.
The Vysis LSI CCND1 SpectrumOrange/CEP11 SpectrumGreen Probes have been applied to cancers other than breast cancer. For example, Katz et al.6 found elevated CCND1 copy number to be sensitive indicator of mantle cell lymphoma, and could distinguish mantle cell lymphoma from most other B-cell non Hodgkins lymphoma specimens.
The Vysis LSI Cyclin D1 (11q13) SpectrumOrange/CEP 11 SpectrumGreen Probe is a mixture of two probes, The CCND1 probe is approximately 300 kb , contains the CCND1 gene, and is labeled in SpectrumOrange. The second probe is specific to the D11Z1 alpha satellite centromeric repeat of chromosome 11 and is labeled in SpectrumGreen.
The Vysis LSI Cyclin D1 (11q13) SpectrumOrange/CEP 11 SpectrumGreen Probe is a mixture of two probes, The CCND1 probe is approximately 300 kb , contains the CCND1 gene, and is labeled in SpectrumOrange. The second probe is specific to the D11Z1 alpha satellite centromeric repeat of chromosome 11 and is labeled in SpectrumGreen.
Results of HybridizationHybridization of this probe to interphase nuclei of normal cells is expected to produce two orange and two green signals. The anticipated signal pattern in abnormal cells having a gain of copy number of the CCND1 target without a gain of the CEP 11 target is two green and multiple orange orange signals. Other patterns may be observed if additional genetic alterations are present.
Ordering Information Quantity Order No.
Vysis CCND1/CEP11 FISH Probe Kit CE marked 20 µl 3N88-20
LSI Cyclin D1 SpectrumOrange and CEP 11 Spec-trumGreen hybridized to abnormal tissue.
Vysis CCND1/CEP 11 FISH Probe Kit previously: Vysis LSI Cyclin D1 (11q13) SpectrumOrange/CEP 11 SpectrumGreen Probe

4-7All products, except where indicated, are Analyte Specific Reagents. Analytical and performance characteristics are not established.
Oncology – Breast Cancer
7
EGFR abnormalities including increased copy number and amplification have been correlated with the development of many solid tumors, including non-small cell lung cancer (NSCLC)1 which is the leading cause of cancer death worldwide.2
NSCLC has a 5-year survival rate of approximately 15 %.3 There is a pressing need for improvement in identifying patients most likely to respond to specific treatments for NSCLC. Inhibition of EGFR by agents that block its tyrosine kinase domain has been demonstrated to reduce proliferation of lung cancer cells, resulting in suppression of tumor growth.1, 4
Results of HybridizationIn a cell with normal copy number of the EGFR gene and chromosome 7, two orange signals (EGFR), and two green signals (chromosome 7) will be observed. Simultaneously, the copy number of chromosome 7 can be quantified by enumeration of the green signals observed within the same cell. Therefore, enumeration of both the orange EGFR and green CEP 7 signals provide a mechanism for determining EGFR copy number relative to total chromosome 7 copy number.
Ordering Information Quantity Order No.
Vysis EGFR/ CEP 7 FISH Probe Kit CE marked 200 µl * 1N35-20
* premixed in Hybridization Buffer
References1. Parkin MD. Global cancer statistics in the year 2000. Lancet Oncol 2001;2:533 – 432. 2. Jemal A, Thomas A, Murray T, et al. Cancer Statistics 2002. CA CancerJ Clin 2002;52:23 – 47.3. Hirsch FR, Varella-Garcia M, Bunn PA Jr, et al. J Clin Oncol 2006;21(20):3798 – 807.4. Wiktor AE, Dyke DL, Stupca PJ, et al. Genet Med 2006;8:16 – 23.
An abnormal cell hybridized with the Vysis LSI EGFR SpectrumOrange/CEP 7 SpectrumGreen Probes. The cell contains multiple EGFR (orange) signals and chromosome 7 (green signals).
Vysis EGFR/CEP 7 FISH Probe Kit
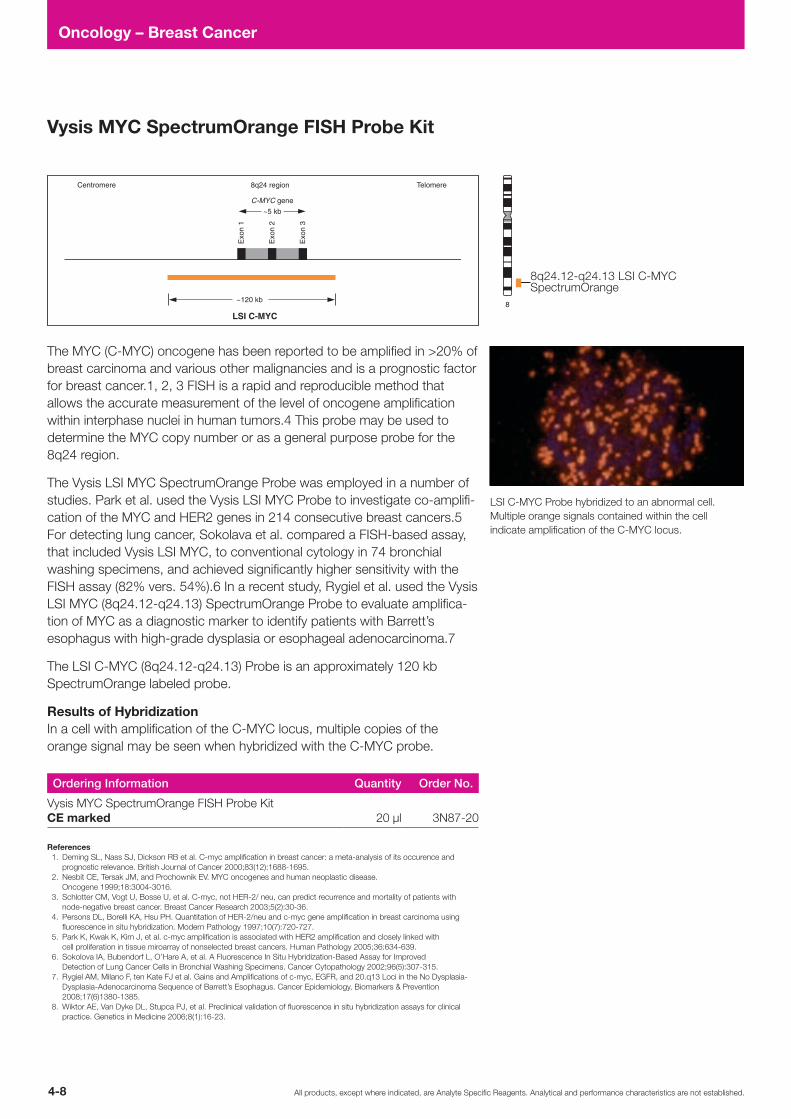
All products, except where indicated, are Analyte Specific Reagents. Analytical and performance characteristics are not established.4-8
Oncology – Breast Cancer
8
~5 kb
Exo
n 1
Exo
n 2
Exo
n 3
C-MYC gene
8q24 region
LSI C-MYC
~120 kb
Centromere Telomere
The MYC (C-MYC) oncogene has been reported to be amplified in >20% of breast carcinoma and various other malignancies and is a prognostic factor for breast cancer.1, 2, 3 FISH is a rapid and reproducible method that allows the accurate measurement of the level of oncogene amplification within interphase nuclei in human tumors.4 This probe may be used to determine the MYC copy number or as a general purpose probe for the 8q24 region.
The Vysis LSI MYC SpectrumOrange Probe was employed in a number of studies. Park et al. used the Vysis LSI MYC Probe to investigate co-amplifi-cation of the MYC and HER2 genes in 214 consecutive breast cancers.5 For detecting lung cancer, Sokolava et al. compared a FISH-based assay, that included Vysis LSI MYC, to conventional cytology in 74 bronchial washing specimens, and achieved significantly higher sensitivity with the FISH assay (82% vers. 54%).6 In a recent study, Rygiel et al. used the Vysis LSI MYC (8q24.12-q24.13) SpectrumOrange Probe to evaluate amplifica-tion of MYC as a diagnostic marker to identify patients with Barrett’s esophagus with high-grade dysplasia or esophageal adenocarcinoma.7
The LSI C-MYC (8q24.12-q24.13) Probe is an approximately 120 kb SpectrumOrange labeled probe.
Results of HybridizationIn a cell with amplification of the C-MYC locus, multiple copies of the orange signal may be seen when hybridized with the C-MYC probe.
Ordering Information Quantity Order No.
Vysis MYC SpectrumOrange FISH Probe Kit CE marked 20 µl 3N87-20
References1. Deming SL, Nass SJ, Dickson RB et al. C-myc amplification in breast cancer: a meta-analysis of its occurence and
prognostic relevance. British Journal of Cancer 2000;83(12):1688-1695.2. Nesbit CE, Tersak JM, and Prochownik EV. MYC oncogenes and human neoplastic disease.
Oncogene 1999;18:3004-3016.3. Schlotter CM, Vogt U, Bosse U, et al. C-myc, not HER-2/ neu, can predict recurrence and mortality of patients with
node-negative breast cancer. Breast Cancer Research 2003;5(2):30-36.4. Persons DL, Borelli KA, Hsu PH. Quantitation of HER-2/neu and c-myc gene amplification in breast carcinoma using
fluorescence in situ hybridization. Modern Pathology 1997;10(7):720-727.5. Park K, Kwak K, Kim J, et al. c-myc amplification is associated with HER2 amplification and closely linked with
cell proliferation in tissue miroarray of nonselected breast cancers. Human Pathology 2005;36:634-639.6. Sokolova IA, Bubendorf L, O’Hare A, et al. A Fluorescence In Situ Hybridization-Based Assay for Improved
Detection of Lung Cancer Cells in Bronchial Washing Specimens. Cancer Cytopathology 2002;96(5):307-315.7. Rygiel AM, Milano F, ten Kate FJ et al. Gains and Amplifications of c-myc, EGFR, and 20.q13 Loci in the No Dysplasia-
Dysplasia-Adenocarcinoma Sequence of Barrett’s Esophagus. Cancer Epidemiology, Biomarkers & Prevention 2008;17(6)1380-1385.
8. Wiktor AE, Van Dyke DL, Stupca PJ, et al. Preclinical validation of fluorescence in situ hybridization assays for clinical practice. Genetics in Medicine 2006;8(1):16-23.
Vysis MYC SpectrumOrange FISH Probe Kit
LSI C-MYC Probe hybridized to an abnormal cell. Multiple orange signals contained within the cell indicate amplification of the C-MYC locus.
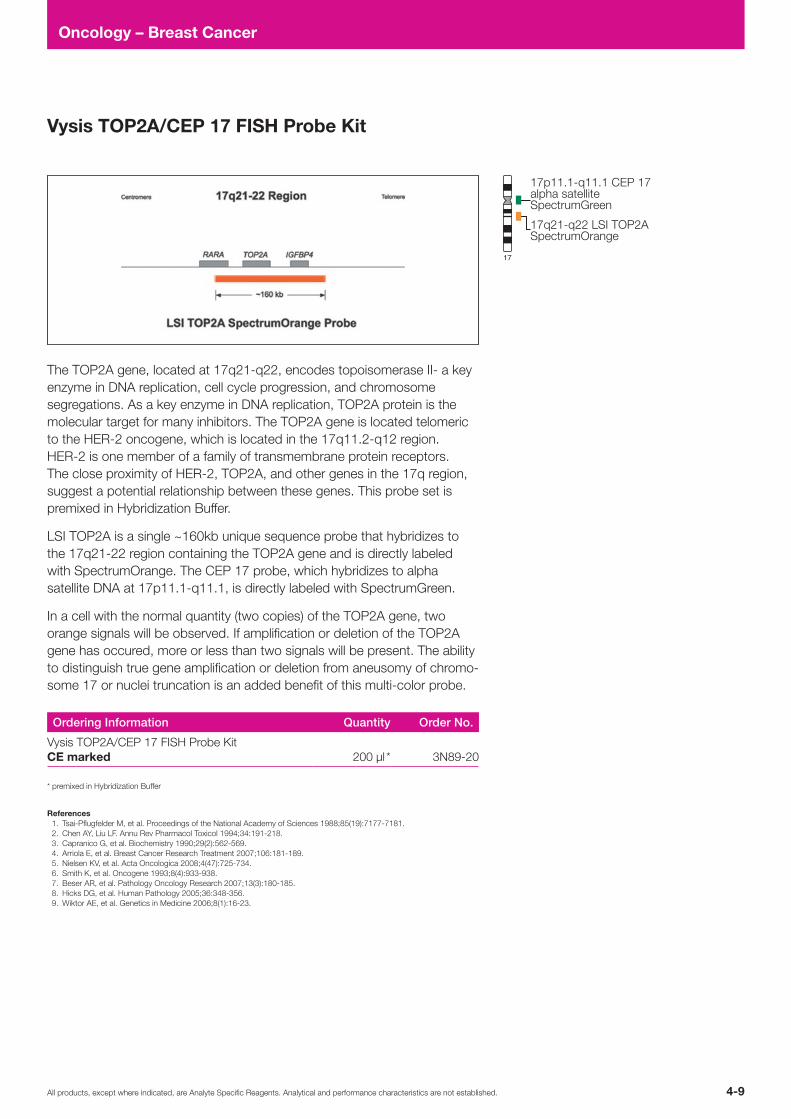
4-9All products, except where indicated, are Analyte Specific Reagents. Analytical and performance characteristics are not established.
Oncology – Breast Cancer
17
Vysis TOP2A/CEP 17 FISH Probe Kit
The TOP2A gene, located at 17q21-q22, encodes topoisomerase II- a key enzyme in DNA replication, cell cycle progression, and chromosome segregations. As a key enzyme in DNA replication, TOP2A protein is the molecular target for many inhibitors. The TOP2A gene is located telomeric to the HER-2 oncogene, which is located in the 17q11.2-q12 region. HER-2 is one member of a family of transmembrane protein receptors. The close proximity of HER-2, TOP2A, and other genes in the 17q region, suggest a potential relationship between these genes. This probe set is premixed in Hybridization Buffer.
LSI TOP2A is a single ~160kb unique sequence probe that hybridizes to the 17q21-22 region containing the TOP2A gene and is directly labeled with SpectrumOrange. The CEP 17 probe, which hybridizes to alpha satellite DNA at 17p11.1-q11.1, is directly labeled with SpectrumGreen.
In a cell with the normal quantity (two copies) of the TOP2A gene, two orange signals will be observed. If amplification or deletion of the TOP2A gene has occured, more or less than two signals will be present. The ability to distinguish true gene amplification or deletion from aneusomy of chromo-some 17 or nuclei truncation is an added benefit of this multi-color probe.
Ordering Information Quantity Order No.
Vysis TOP2A/CEP 17 FISH Probe Kit CE marked 200 µl * 3N89-20
* premixed in Hybridization Buffer
References1. Tsai-Pflugfelder M, et al. Proceedings of the National Academy of Sciences 1988;85(19):7177-7181.2. Chen AY, Liu LF. Annu Rev Pharmacol Toxicol 1994;34:191-218.3. Capranico G, et al. Biochemistry 1990;29(2):562-569.4. Arriola E, et al. Breast Cancer Research Treatment 2007;106:181-189.5. Nielsen KV, et al. Acta Oncologica 2008;4(47):725-734.6. Smith K, et al. Oncogene 1993;8(4):933-938.7. Beser AR, et al. Pathology Oncology Research 2007;13(3):180-185.8. Hicks DG, et al. Human Pathology 2005;36:348-356.9. Wiktor AE, et al. Genetics in Medicine 2006;8(1):16-23.

All products, except where indicated, are Analyte Specific Reagents. Analytical and performance characteristics are not established.4-10
Oncology – Breast Cancer
Result of the hybridization of the LSI TOP2A/HER-2/CEP 17 Multi-color Probe as observed in two normal interphase cells. In the nucleus located in the upper left, two copies of each of the three probes are observed: orange (TOP2A), green (HER-2), and aqua (CEP 17). The lower right nucleus exhibits normal hybridization results for LSI HER-2 and CEP 17 but is lacking one TOP2A signal.
Tumor cells hybridized with the LSI TOP2A/HER-2/CEP 17 Multi-color probe. The cells in this image show am plification of both TOP2A (orange signals) and HER-2 (green signals) as indicated by multiple signals of each color. Aqua signals from the CEP 17 probe indicate that chromosome 17 is present in the normal quantity (two copies).
Vysis TOP2A/HER-2/CEP 17 FISH Probe Kit
The TOP2A gene, located at 17q21-q22 encodes topoisomerase II-α, a key enzyme in DNA replication, cell cycle progression, and chromosome segregation.1, 2 As a key enzyme in DNA replication, TOP2A protein is the molecular target for many inhibitors.3 The TOP2A gene is located telomeric to the HER-2 oncogene, which is located in the 17q11.2-q12 region. HER-2 is one member of a family of transmembrane protein receptors.4, 5 The close proximity of HER-2, TOP2A, and other genes in the 17q region, suggest a potential relationship between these genes. The TOP2A gene has also been shown to be co-amplified with HER-2 in cell lines and in human breast cancers.6
The Vysis Locus Specific Identifier (LSI) TOP2A SpectrumOrange/HER-2 SpectrumGreen/CEP17 SpectrumAqua Probe Set utilizes locus specific probes for TOP2A and HER-2 as well as chromosome 17 centromeric probe. Each probe is labeled with a different fluorophore to allow accurate enumeration of each locus within individual nuclei. Simultaneous enumera-tion of all three probes reveals the copy number gains or losses of HER-2 and TOP2A relative to the copy number of chromosome 17. The ability to distinguish true gene amplification or deletion from aneusomy of chromo-some 17 or nuclei truncation is an added benefit of this multi color probe.
Continuation on the following page >
4-11All products, except where indicated, are Analyte Specific Reagents. Analytical and performance characteristics are not established.
Oncology – Breast Cancer
TOP2A and HER-2 gene status is of interest since topoisomerase II-α is a molecular target of anthracycline drugs and HER-2 is targeted by several small molecule tyrosine kinase inhibitors as well as antibodies against the HER-2 receptor protein. Beser et al. used the Vysis TOP2A/HER-2/CEP17 FISH Probe Kit to examine the frequency of TOP2A amplification and deletion relative to the HER-2 gene status and chromosome 17 aneusomy in a series of 50 breast tumors.7 Hicks et al. used the same probe set to similarly document the relationship between TOP2A and HER-2 genomic alterations and chromosome 17 aneusomy in 138 breast cancers.8
LSI TOP2A is a single ~160 kb unique sequence probe that hybridizes to the 17q21-22 region containing the TOP2A gene. In both products, the probe is directly labeled with SpectrumOrange. The HER-2 probe that spans the entire HER-2 gene at 17q11.2-q12 is an an ~190 kb unique sequence probe. In the LSI TOP2A/HER-2/CEP 17 product, this probe is directly labeled with SpectrumGreen. The The CEP 17 probe, which hybridizes to alpha satellite DNA at 17p11.1-q11.1, is directly labeled with SpectrumGreen or SpectrumAqua SpectrumAqua in the LSI TOP2A/CEP 17 and LSI TOP2A/HER-2/CEP 17 products, respectively.
Results of HybridizationAs with TOP2A and chromosome 17, a nucleus with a normal quantity (two copies) of HER-2 will appear with two green signals. Simultaneous enu-meration of all three probes will reveal the copy number of each as well well as the amplification or deletion status of TOP2A and HER-2 relative to chromosome 17 copy number. The ability to distinguish true gene amplifi-cation or deletion from aneusomy of chromosome 17 or nuclei truncation is an added benefit of this multi-color probe.
Ordering Information Quantity Order No.
Vysis TOP2A/HER-2/CEP 17 FISH Probe Kit CE marked 200 µl* 3N90-20
* premixed in Hybridization Buffer
References1. Tsai-Pflugfelder M, Liu LF, Liu AA, et al. Cloning and sequencing of cDNA topoisomerase II and localization of the gene to
chromosome region 17q21-22. Proceedings of the National Academy of Sciences 1988;85(19):7177-7181.2. Chen AY, Liu LF. DNA topoisomerases: essential enzymes and lethal targets.
Annu Rev Pharmacol Toxicol 1994;34:191-218.3. Capranico G, Zunino F, Kohn KW, et al. Sequence-selective topoisomerase II inhibition by anthracycline derivatives
inSV40 DNA: relationship with DNA binding affinity and cytotoxicity. Biochemistry 1990;29(2):562-569.4. Arriola E, Socorro MR, Lambros MBK, et al. Topoisomerase II alpha amplification may predict benefit from adjuvant
anthracyclines in HER2 positive early breast cancer. Breast Cancer Research Treatment 2007;106:181-189.5. Nielsen KV, Ejlertsen B, Moller S, et al. The value of TOP2A gene copy number variation as a biomarker in breast cancer:
Update of DBCG trial 89D. Acta Oncologica 2008;4(47):725-734.6. Smith K, Houlbrook S, Greenall M, et al. Topoisomerase II alpha co-amplification with erbB2 in human primary breast
cancer and breast cancer cell lines: relationship to m-AMSA and mitoxantrone sensitivity. Oncogene 1993;8(4):933-938.7. Beser AR, Tuzlali S, Guzey D, et al. HER-2, TOP2A and chromosome 17 alterations in breast cancer. Pathology Oncology
Research 2007;13(3):180-185.8. Hicks DG, Yoder BJ, Pettay J, et al. The incidence of topoisomerase II-alpha genomic alterations in adenocarcinoma of
the breast and their relationship to human epidermal growth factor receptor-2 gene amplification: a fluorescence in situ hybridization study. Human Pathology 2005;36:348-356.
9. Wiktor AE, Van Dyke DL, Stupca PJ, et al. Preclinical validation of fluorescence in situ hybridization assays for clinical practice. Genetics in Medicine 2006;8(1):16-23.
Continuation: Vysis TOP2A/HER-2/CEP 17 FISH Probe Kit

All products, except where indicated, are Analyte Specific Reagents. Analytical and performance characteristics are not established.4-12
Oncology – Breast Cancer
20
Continuation on the following page >
Ordering Information Quantity Order No.
Vysis ZNF217 SpectrumGold FISH Probe Kit CE marked 20 µl 5N15-20
Vysis ZNF217 SpectrumGold FISH Probe Kit
LSI ZNF217 (20q13.2) SpectrumOrange hybridized to abnormal cells. Note multiple orange-pink signals contained within some cells indicate amplification of the ZNF217.
Ordering Information Quantity Order No.
Vysis ZNF217 SpectrumOrange FISH Probe Kit CE marked 20 µl 3N91-20
Vysis ZNF217 SpectrumOrange FISH Probe Kit
Ordering Information Quantity Order No.
Vysis ZNF217 SpectrumRed FISH Probe Kit CE marked 10 µl 5N16-10
Vysis ZNF217 SpectrumRed FISH Probe Kit

4-13All products, except where indicated, are Analyte Specific Reagents. Analytical and performance characteristics are not established.
Oncology – Breast Cancer
The ZNF217 gene is a candidate oncogene suggested to play a key role during neoplastic transformation. ZNF217 is located at 20q13, a region that is frequently amplified in a variety of tumor types.1– 6 Amplification of ZNF217 in breast cancer is associated with aggressive tumor behaviour and poor clinical prognosis.7
The Vysis LSI ZNF217 (20q13.2) SpectrumOrange Probe was used in a study that indicated distinct differences in the role of genes known to be amplified in female breast cancer and their relevance for the pathogenesis of male breast cancer. In another study, fluorescence in situ hybridization was performed on 128 male breast tumors using the Vysis SpectrumOr-ange LSI ZNF217 in addition to other Vysis probes including, LSI HER-2, LSI CCND1, LSI MYC, and the corresponding centromeric probes to evaluate the frequencey of amplification of the genes in MBC.8 A third study used the Vysis LSI ZNF217 SpectrumOrange** Probe to identify gain of ZNF217 as an important abnormality and prognostic factor in larynx tumorigenesis. For this study a tissue microarray consisting of 863 larynx carcinomas was analysed.9
The LSI ZNF217 SpectrumGold and SpectrumRed Probes are single approximatelly 433 kb unique sequence probes directly labeled in SpectrumGold or SpectrumRed and hybridize to the 20q13.2 region of Chromosome 20 and include the 17.5 kb ZNF217 gene.
** Vysis LSI ZNF217 SpectrumOrange was used in studies, which are referenced here. Vysis LSI ZNF217 SpectrumGold Probe and SpectrumRed hybridzes t the same sequence as the Vysis LSI ZNF217 SpectrumOrange Probe, but labeled with another Fluorophore.
Results of Hybridization
When hybridized with the LSI ZNF217 Probe, a normal cell containing two copies of the 20q13.2 region will exhibit two signals. In a cell harboring amplification of the ZNF217 gene or 20q13.2 region, multiple copies of the gold, orange or red signal will be observed.
References1. Collins C, Rommens JM, Kowbel D, et al. Proceedings of the National Academy of Sciences USA 1998;95:8703-8708.2. Yang SH, Seo MY, Jeong HJ, et al. Clinical Cancer Research 2005;11:612-620.3. Iwabuchi H, Sakamoto M, Sakunaga H, et al. Cancer Research 1995;55(24):6172-6180.4. Zhu H, Lam DC, Han KC, et al. et al. Cancer Letters 2007;245:303-314.5. Bar-Shira A, Pinthus JH, Rozovsky U, et al. Cancer Research 2002;62(23):6803-6807.6. Lassmann S, Weis R, Markowiec F, et al. Journal of Molecular Medicine 2007;85(3):293-304.7. Tanner MM, Tirkkonen M, Kallioniemi A, et al. Clinical Cancer Research 1995;1:1455-1461.8. Bärlund M, Kuukasjärvi T, Syrjäkoski K, et al. International Journal of Cancer 2004;111:968-971.9. Koynova D, Tsenova V, Kunev K, et al. Biotechnology & Biotechnological Equipment 2006;128-131.
10. Wiktor AE, Van Dyke DL, Stupca PJ, et al. Genetics in Medicine 2006;8(1):16-23.
Continuation: Vysis ZNF217 SpectrumGold, SpectrumOrange & SpectrumRed FISH Probe Kit

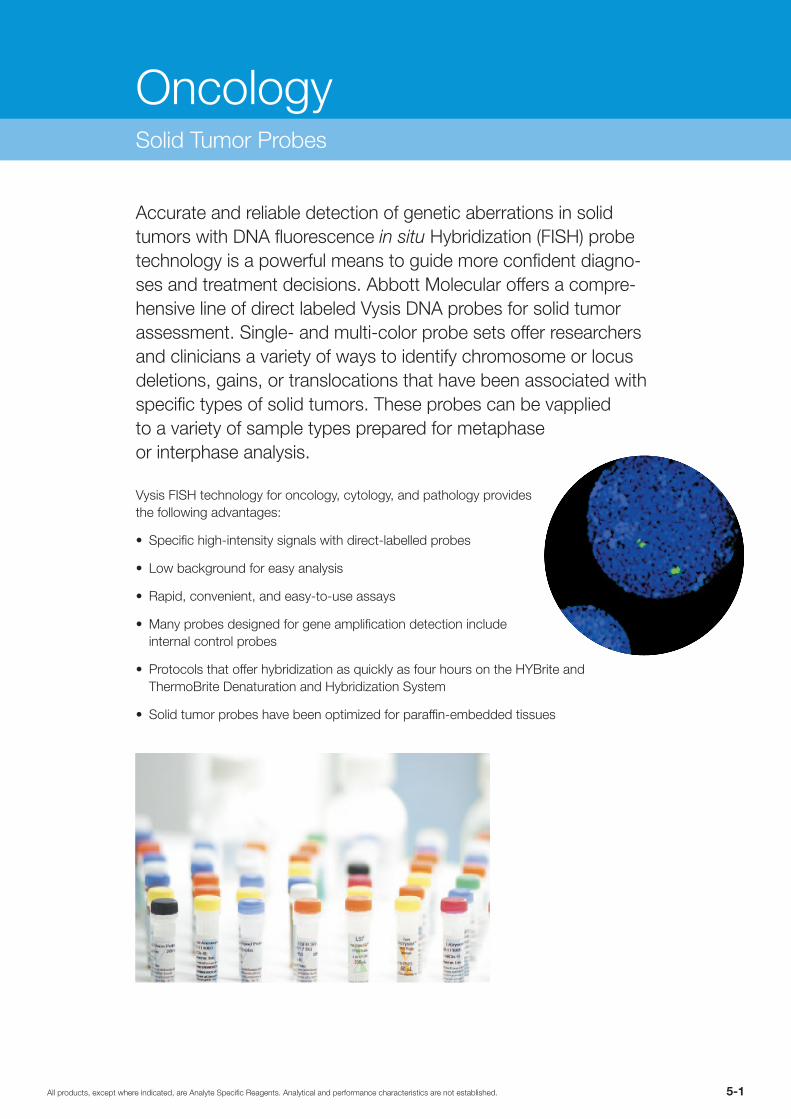
5-1All products, except where indicated, are Analyte Specific Reagents. Analytical and performance characteristics are not established.
Oncology – Solid Tumor Probes
OncologySolid Tumor Probes
Accurate and reliable detection of genetic aberrations in solid tumors with DNA fluorescence in situ Hybridization (FISH) probe technology is a powerful means to guide more confident diagno-ses and treatment decisions. Abbott Molecular offers a compre-hensive line of direct labeled Vysis DNA probes for solid tumor assessment. Single- and multi-color probe sets offer researchers and clinicians a variety of ways to identify chromosome or locus deletions, gains, or translocations that have been associated with specific types of solid tumors. These probes can be vapplied to a variety of sample types prepared for metaphase or interphase analysis.
Vysis FISH technology for oncology, cytology, and pathology provides the following advantages:
• Specific high-intensity signals with direct-labelled probes
• Low background for easy analysis
• Rapid, convenient, and easy-to-use assays
• Many probes designed for gene amplification detection include internal control probes
• Protocols that offer hybridization as quickly as four hours on the HYBrite and ThermoBrite Denaturation and Hybridization System
• Solid tumor probes have been optimized for paraffin-embedded tissues
All products, except where indicated, are Analyte Specific Reagents. Analytical and performance characteristics are not established.5-2
Oncology – Solid Tumor Probes
Product description Quantity Order No.Page
Number
Alphabetical ListingVysis LSI 13 (RB1) 13q14 SpectrumOrange Probe CE marked 20 µl 8L65-20 5-4
Vysis 1p36/1q25 and 19q13/19p13 FISH Probe Kit CE marked 2 x 200 µl 4N60-20 5-5
Vysis LSI 22 (BCR) SpectrumGreen Probe 20 µl 5J17-24 5-7
Vysis LSI Androgen Receptor Gene (Xq12) SpectrumOrange Probe 20 µl 5J44-01 5-7
Vysis CCND1/CEP 11 FISH Probe Kit CE marked previously: Vysis LSI Cyclin D1 (11q13) SOr/CEP 11 SGr Probe 20 µl 3N88-20 5-8
Vysis CDKN2A/CEP 9 FISH Probe Kit CE markedpreviously: Vysis LSI p16 (9p21) SO/CEP 9 SGr Probe 20 µl 4N61-20 5-9
Vysis Cervical FISH Probe Kit CE marked 200 µl 1N29-20 5-10
Vysis DDIT3 Break Apart FISH Probe Kit CE marked previously: Vysis LSI CHOP (12q13) Dual Color, Break Apart Rearrangement Probe 20 µl 3N57-20 5-12
Vysis LSI D5S23, D5S721 SpectrumGreen Probe 20 µl 4N30-20 5-13
Vysis LSI EGFR SpectrumRed Probe 20 µl 4N31-20 5-15
Vysis EGFR/CEP7 FISH Probe Kit CE marked 200 µl 1N35-20 5-15
Vysis Esophageal FISH Probe Kit CE marked 200 µl 4N19-20 5-13
Vysis EWSR1 Break Apart FISH Probe Kit CE marked 20 µl 3N59-20 5-16
Vysis FOXO1 Break Apart FISH Probe Kit CE markedpreviously: Vysis LSI FKHR (13q14) Dual Color, Break Apart Rearrangement Probe 20 µl 3N60-20 5-17
Vysis FUS Break Apart FISH Probe Kit CE marked 20 µl 3N58-20 5-18
Vysis LSI LPL SpectrumOrange Probe 20 µl 4N34-20 5-19
Vysis LSI MDM2 SpectrumOrange Probe 20 µl 1N15-20 5-20
Vysis Melanoma FISH Probe Kit CE marked 200 µl 1N89-20 5-19
Vysis LSI MYC SpectrumGold Probe 20 µl 4N35-20 5-21
Vysis LSI MYC SpectrumGreen Probe 20 µl 4N36-20 5-21
Vysis MYC SpectrumOrange FISH Probe Kit CE marked 20 µl 3N87-20 5-22
Vysis LSI N-MYC (2p24) SpectrumGreen/CEP 2 SO Probe 20 µl 7J72-01 5-23
Vysis LSI N-MYC (2p24) SpectrumOrange Probe 20 µl 5J50-01 5-24
Vysis PTEN/CEP 10 FISH Probe Kit CE marked 20 µl 4N62-20 5-25
Vysis LSI SS18 Break Apart FISH Probe Kit CE markedpreviously: Vysis LSI SYT (18q11.2) Dual Color, Break Apart Rearrangement Probe 20 µl 3N61-20 5-26
Vysis TOP2A/CEP 17 FISH Probe Kit CE marked 200 µl 3N89-20 5-27
Vysis TOP2A/HER-2/CEP 17 FISH Probe Kit CE marked 200 µl 3N90-20 5-28
Vysis LSI TP53 (17p13.1) SpectrumOrange Probe CE marked 20 µl 8L64-20 5-30
Vysis TP53/CEP 17 FISH Probe Kit CE marked 20 µl 5N56-20 5-31
Vysis ZNF217 SpectrumGold FISH Probe Kit CE marked 20 µl 5N15-20 5-32
Vysis ZNF217 SpectrumOrange FISH Probe Kit CE marked 20 µl 3N91-20 5-32
Vysis ZNF217 SpectrumRed FISH Probe Kit CE marked 10 µl 5N16-10 5-32
Quantities of 200 µl are prediluted with Hybridisation Buffer

5-3All products, except where indicated, are Analyte Specific Reagents. Analytical and performance characteristics are not established.
Oncology – Solid Tumor Probes
Product description Quantity Order No.Page
Number
Listing By Disease StateBarrett’s Esophagus
Vysis Esophageal FISH Probe Kit CE marked 200 µl 4N19-20 5-13
Cervical Cancer
Vysis Cervical FISH Probe Kit CE marked 200 µl 1N29-20 5-10
Gliomas
Vysis 1p36/1q25 and 19q13/19p13 FISH Probe Kit CE marked 2 x 200 µl 4N60-20 5-5
Vysis CDKN2A/CEP 9 FISH Probe Kit CE markedpreviously: Vysis LSI p16 (9p21) SO/CEP 9 SGr Probe 20 µl 4N61-20 5-9
Vysis EGFR/CEP7 FISH Probe Kit CE marked 200 µl 1N35-20 5-15
Vysis PTEN/CEP 10 FISH Probe Kit CE marked 20 µl 4N62-20 5-25
Vysis LSI TP53 (17p13.1) SpectrumOrange Probe CE marked 20 µl 8L64-20 5-30
Vysis TP53/CEP 17 FISH Probe Kit CE marked 20 µl 5N56-20 5-31
Lung Cancer
Vysis EGFR/CEP7 FISH Probe Kit CE marked 200 µl 1N35-20 5-15
Melanoma
Vysis Melanoma FISH Probe Kit CE marked 200 µl 1N89-20 5-19
Prostate Cancer
Vysis LSI Androgen Receptor Gene (Xq12) SpectrumOrange Probe 20 µl 5J44-01 5-7
Vysis MYC SpectrumOrange FISH Probe Kit CE marked 20 µl 3N87-20 5-22
Sarcomas
Vysis DDIT3 Break Apart FISH Probe Kit CE marked previously: Vysis LSI CHOP (12q13) Dual Color, Break Apart Rearrangement Probe 20 µl 3N57-20 5-12
Vysis EWSR1 Break Apart FISH Probe Kit CE marked 20 µl 3N59-20 5-16
Vysis FOXO1 Break Apart FISH Probe Kit CE markedpreviously: Vysis LSI FKHR (13q14) Dual Color, Break Apart Rearrangement Probe 20 µl 3N60-20 5-17
Vysis FUS Break Apart FISH Probe Kit CE marked 20 µl 3N58-20 5-18
Vysis LSI SS18 Break Apart FISH Probe Kit CE markedpreviously: Vysis LSI SYT (18q11.2) Dual Color, Break Apart Rearrangement Probe 20 µl 3N61-20 5-26
Other Cancers
Vysis LSI 13 (RB1) 13q14 SpectrumOrange Probe CE marked 20 µl 8L65-20 5-4
Vysis LSI 22 (BCR) SpectrumGreen Probe 20 µl 5J17-24 5-7
Vysis CCND1/CEP 11 FISH Probe Kit CE marked previously: Vysis LSI Cyclin D1 (11q13) SOr/CEP 11 SGr Probe 20 µl 3N88-20 5-8
Vysis LSI D5S23, D5S721 SpectrumGreen Probe 20 µl 4N30-20 5-13
Vysis EGFR/CEP7 FISH Probe Kit CE marked 200 µl 1N35-20 5-15
Vysis LSI EGFR SpectrumRed Probe 20 µl 4N31-20 5-15
Vysis LSI LPL SpectrumOrange Probe 20 µl 4N34-20 5-19
Vysis LSI MDM2 SpectrumOrange Probe 20 µl 1N15-20 5-20
Vysis MYC SpectrumOrange FISH Probe Kit CE marked 20 µl 3N87-20 5-22
Vysis TOP2A/CEP 17 FISH Probe Kit CE marked 200 µl 3N89-20 5-27
Vysis TOP2A/HER-2/CEP 17 FISH Probe Kit CE marked 200 µl 3N90-20 5-28
Vysis LSI TP53 (17p13.1) SpectrumOrange Probe CE marked 20 µl 8L64-20 5-30
Vysis TP53/CEP 17 FISH Probe Kit CE marked 20 µl 5N56-20 5-31
Vysis ZNF217 SpectrumGold FISH Probe Kit CE marked 20 µl 5N15-20 5-32
Vysis ZNF217 SpectrumOrange FISH Probe Kit CE marked 20 µl 3N91-20 5-32
Vysis ZNF217 SpectrumRed FISH Probe Kit CE marked 10 µl 5N16-10 5-32
Quantities of 200 µl are prediluted with Hybridisation Buffer
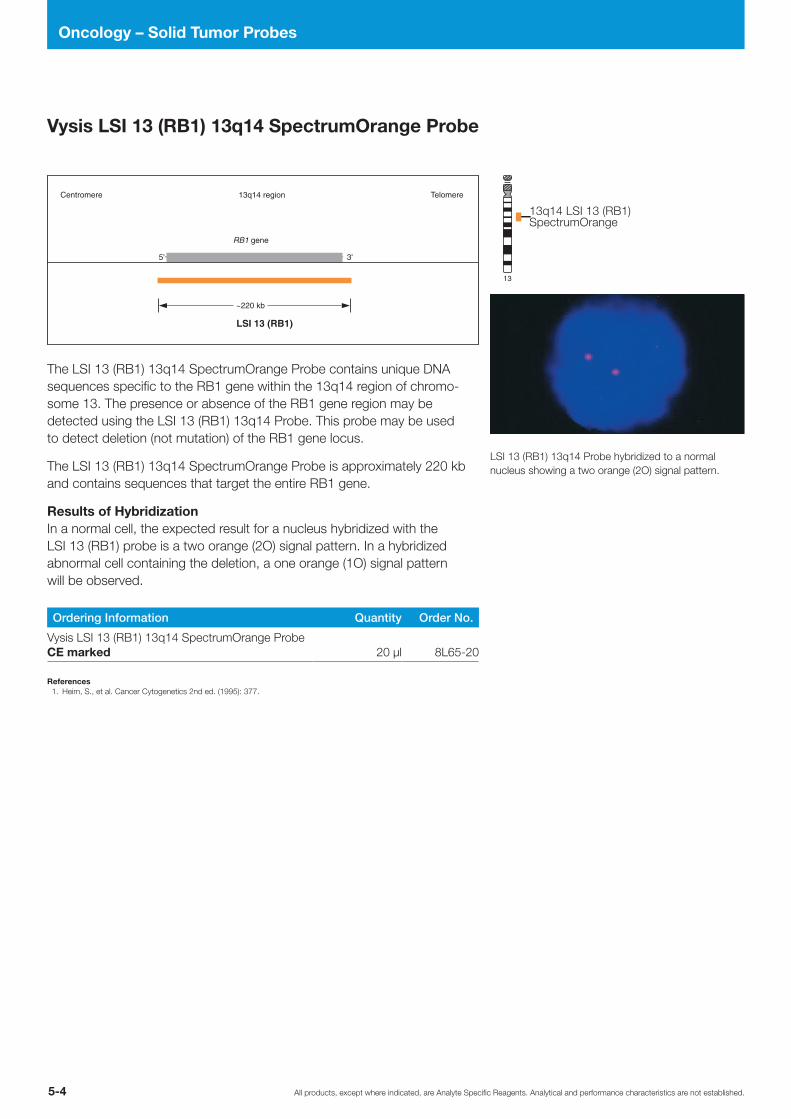
All products, except where indicated, are Analyte Specific Reagents. Analytical and performance characteristics are not established.5-4
Oncology – Solid Tumor Probes
13q14 region
LSI 13 (RB1)
5' 3'
~220 kb
RB1 gene
Centromere Telomere
13
The LSI 13 (RB1) 13q14 SpectrumOrange Probe contains unique DNA sequences specific to the RB1 gene within the 13q14 region of chromo-some 13. The presence or absence of the RB1 gene region may be detected using the LSI 13 (RB1) 13q14 Probe. This probe may be used to detect deletion (not mutation) of the RB1 gene locus.
The LSI 13 (RB1) 13q14 SpectrumOrange Probe is approximately 220 kb and contains sequences that target the entire RB1 gene.
Results of HybridizationIn a normal cell, the expected result for a nucleus hybridized with the LSI 13 (RB1) probe is a two orange (2O) signal pattern. In a hybridized abnormal cell containing the deletion, a one orange (1O) signal pattern will be observed.
Ordering Information Quantity Order No.
Vysis LSI 13 (RB1) 13q14 SpectrumOrange Probe CE marked 20 µl 8L65-20
References1. Heim, S., et al. Cancer Cytogenetics 2nd ed. (1995): 377.
LSI 13 (RB1) 13q14 Probe hybridized to a normal nucleus showing a two orange (2O) signal pattern.
Vysis LSI 13 (RB1) 13q14 SpectrumOrange Probe

5-5All products, except where indicated, are Analyte Specific Reagents. Analytical and performance characteristics are not established.
Oncology – Solid Tumor Probes
Centromere Telomere
1p36 Region
LSI - 1p36 SO
400kb
RH
7582
1
DIS
1347
DIS
1310
SH
GC
5724
3
EGFL3 TP73
1
19
1q25 Region
LSI 1q25 SG
Centromere Telomere
SH
GC
- 1
322
RH
4283
1
RH
2547
6
ANGPTL1 ABL2
620kb
Telomere Centromere
19p13 Region
LSI - 19p13 SG
500kb
RH
9287
6
WT-
4669
RH
5598
7
RH
9860
ZNF44 ZK1 MAN2B1
19q13 Region
LSI - 19q13 SO
400kb
RH
7652
9
SH
GC
- 4
664
RH
141
68
GLTSCR1 GLTSCR2 CRX
Centromere Telomere
Continuation on the following page >
Vysis 1p36/1q25 and 19q13/19p13 FISH Probe Kit
Diffuse gliomas of the central nervous system are classified based on their histological appearance as astrocytomas, oli-godendrogliomas and mixed oligoastrocytomas. Fluores-cence in situ hybridization using 1p36 and 19q13 LSI FISH probes showed that the oligodendroglial phenotype was also associated with the 1p deletion and that allelic loss of 1p was a powerful predictor of chemotherapeutic response. Combined 1p36-19q13 deletions were highly associated with classic oligodendroglioma histology and a longer survival rate.1– 5
The Vysis LSI 1p36/1q25 and 19q13/19p13 probes performed successfully in several studies to detect losses in 1p36 and 19q13.6-7 FISH testing using this probe set in an analysis of 81 histologically confirmed patient samples (glial tumors, WHO grade I-IV) supported previous study findings that loss of 1p36 and 19q13 is highly correlated with tumors with oligodendroglial component.6 Wharton et al. detected 1p and 19q deletions in the majority of samples graded as oligodendrogliomas, WHO grade II and III.7
These and other studies established FISH analysis using LSI 1p36/LSI 19q13 as a useful tool to complement morpho-logical diagnosis of malignant tumors with a oligodendroglial component.
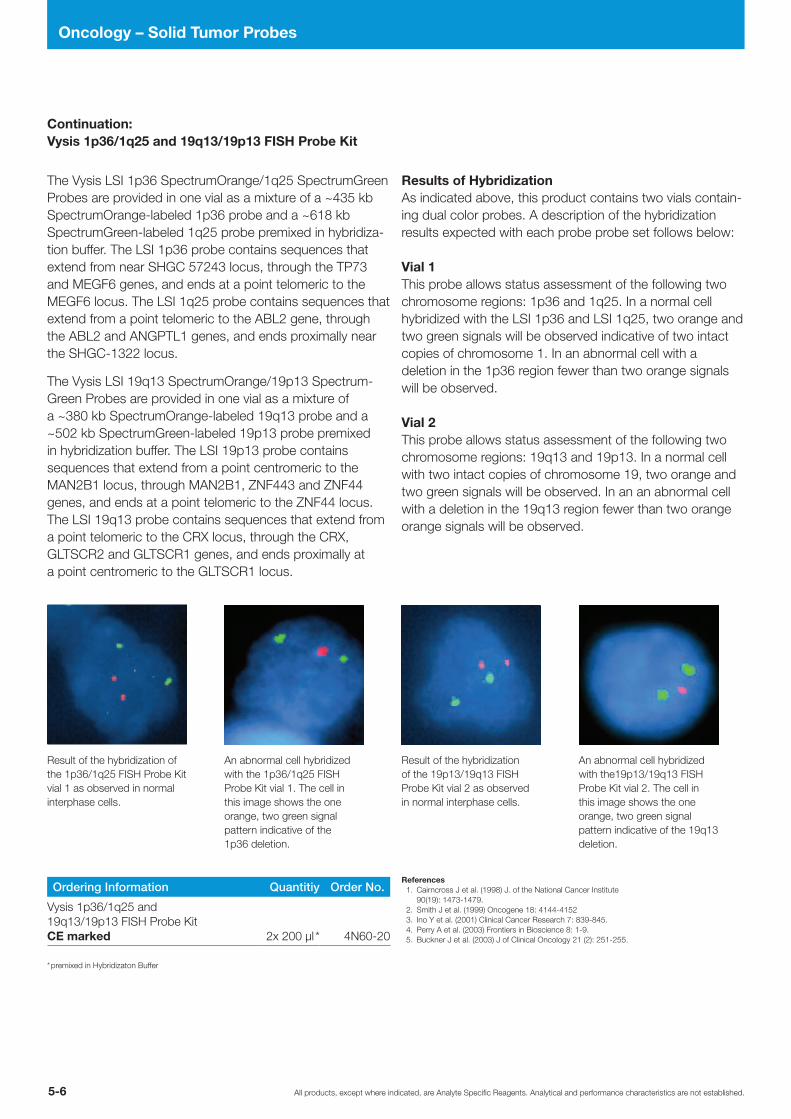
All products, except where indicated, are Analyte Specific Reagents. Analytical and performance characteristics are not established.5-6
Oncology – Solid Tumor Probes
The Vysis LSI 1p36 SpectrumOrange/1q25 SpectrumGreen Probes are provided in one vial as a mixture of a ~435 kb SpectrumOrange-labeled 1p36 probe and a ~618 kb SpectrumGreen-labeled 1q25 probe premixed in hybridiza-tion buffer. The LSI 1p36 probe contains sequences that extend from near SHGC 57243 locus, through the TP73 and MEGF6 genes, and ends at a point telomeric to the MEGF6 locus. The LSI 1q25 probe contains sequences that extend from a point telomeric to the ABL2 gene, through the ABL2 and ANGPTL1 genes, and ends proximally near the SHGC-1322 locus.
The Vysis LSI 19q13 SpectrumOrange/19p13 Spectrum-Green Probes are provided in one vial as a mixture of a ~380 kb SpectrumOrange-labeled 19q13 probe and a ~502 kb SpectrumGreen-labeled 19p13 probe premixed in hybridization buffer. The LSI 19p13 probe contains sequences that extend from a point centromeric to the MAN2B1 locus, through MAN2B1, ZNF443 and ZNF44 genes, and ends at a point telomeric to the ZNF44 locus. The LSI 19q13 probe contains sequences that extend from a point telomeric to the CRX locus, through the CRX, GLTSCR2 and GLTSCR1 genes, and ends proximally at a point centromeric to the GLTSCR1 locus.
Results of HybridizationAs indicated above, this product contains two vials contain-ing dual color probes. A description of the hybridization results expected with each probe probe set follows below:
Vial 1This probe allows status assessment of the following two chromosome regions: 1p36 and 1q25. In a normal cell hybridized with the LSI 1p36 and LSI 1q25, two orange and two green signals will be observed indicative of two intact copies of chromosome 1. In an abnormal cell with a deletion in the 1p36 region fewer than two orange signals will be observed.
Vial 2This probe allows status assessment of the following two chromosome regions: 19q13 and 19p13. In a normal cell with two intact copies of chromosome 19, two orange and two green signals will be observed. In an an abnormal cell with a deletion in the 19q13 region fewer than two orange orange signals will be observed.
Ordering Information Quantitiy Order No.
Vysis 1p36/1q25 and 19q13/19p13 FISH Probe Kit CE marked 2x 200 µl * 4N60-20
* premixed in Hybridizaton Buffer
References1. Cairncross J et al. (1998) J. of the National Cancer Institute
90(19): 1473-1479.2. Smith J et al. (1999) Oncogene 18: 4144-41523. Ino Y et al. (2001) Clinical Cancer Research 7: 839-845.4. Perry A et al. (2003) Frontiers in Bioscience 8: 1-9.5. Buckner J et al. (2003) J of Clinical Oncology 21 (2): 251-255.
Result of the hybridization of the 1p36/1q25 FISH Probe Kit vial 1 as observed in normal interphase cells.
Result of the hybridization of the 19p13/19q13 FISH Probe Kit vial 2 as observed in normal interphase cells.
An abnormal cell hybridized with the 1p36/1q25 FISH Probe Kit vial 1. The cell in this image shows the one orange, two green signal pattern indicative of the 1p36 deletion.
An abnormal cell hybridized with the19p13/19q13 FISH Probe Kit vial 2. The cell in this image shows the one orange, two green signal pattern indicative of the 19q13 deletion.
Continuation: Vysis 1p36/1q25 and 19q13/19p13 FISH Probe Kit

5-7All products, except where indicated, are Analyte Specific Reagents. Analytical and performance characteristics are not established.
Oncology – Solid Tumor Probes
Exo
n 1
Exo
n 2
Exo
n 3
Centromere
3'5'
m-bcr regionM-bcr region
1 2 3 4 5
22q11.2 region Telomere
~300 kb
LSI 22q (BCR)
22
>110 kb
Androgen receptor gene
Exo
n 1
Exo
n 2
Exo
n 3
Exo
n 8
5' 3'
Xq11.2-Xq12 region
LSI Androgen Receptor Gene
~380 kb
Centromere Telomere
X
The LSI 22 (BCR) Probe is an approximately 300 kb SpectrumGreen probe corresponding to 22q11.2.
Results of HybridizationIn a normal cell, the expected results for a nucleus hybridized with the LSI 22 (BCR) probe is a two green signal pattern.
Ordering Information Quantity Order No.
Vysis LSI 22 (BCR) SpectrumGreen Probe 20 µl 5J17-24References
1. Heim, S. & Mitelman, F. (1995) Cancer Cytogenetics 2nd ed. New York City, NY, JohnWiley & Sons, Inc.
References1. Heim, S., et al. Cancer Cytogenetics 2nd ed. (1995): 377.2. Visakorpi, et al. Nat. Genet. 9 (1995): 401-6.3. Wilson, J. N.Engl. J.Med. 332 (1995): 1440-1.
LSI 22 (BCR) SpectrumGreen hybridized to a normal interphase cell.
Vysis LSI 22 (BCR) SpectrumGreen Probe
The LSI Androgen Receptor Gene (Xq12) Probe may be used to detect copy number of the androgen receptor (AR) gene.
LSI Androgen Receptor (Xq12) Probe is an approximately 380 kb Spectru-mOrange labeled probe.
Results of HybridizationIn a normal male cell hybridized with LSI Androgen Receptor Gene (Xq12) Probe, the expected signal pattern is one orange (1O) signal. In a cell harboring amplification of the LSI Androgen Receptor Gene multiple copies of the orange signal will be observed.
Ordering Information Quantity Order No.
Vysis LSI Androgen Receptor Gene (Xq12) SpectrumOrange Probe 20 µl 5J44-01
LSI Androgen Receptor Gene (Xq12) Probe hybridized to a normal male cell showing the one orange (1O) signal pattern.
Vysis LSI Androgen Receptor Gene (Xq12) SpectrumOrange Probe

All products, except where indicated, are Analyte Specific Reagents. Analytical and performance characteristics are not established.5-8
Oncology – Solid Tumor Probes
11
Amplification of the chromosome 11q13 region, which harbors the Cyclin D1 (CCND1, PRAD1) oncogene, has been reported to occur in up to 15 % of breast cancers. CCND1 amplification has been reported to be a prognostic marker. 1,2,3
Several studies used the Vysis CCND1/CEP 11 FISH Probe Kit to detect CCND1 amplification in breast cancer samples. Al-Karaya et al. analyzed a tissue microarray of 2197 breast cancer samples using the probe kit and found CCND1 amplification in 20.1 % of cases.4 CCND1 amplification was associated with high tumor grade and a tendency toward shortened survival. Jirstrom et al. analyzed a tissue microarray of 500 breast cancer specimens from patients treated and not treated with adjuvant tamoxifen.5 The study found CCND1 amplification to be agonistic to tamoxifen with amplified patients having a significantly higher risk of recurrence.
The Vysis LSI CCND1 SpectrumOrange/CEP11 SpectrumGreen Probes have been applied to cancers other than breast cancer. For example, Katz et al.6 found elevated CCND1 copy number to be sensitive indicator of mantle cell lymphoma, and could distinguish mantle cell lymphoma from most other B-cell non Hodgkins lymphoma specimens.
The Vysis LSI Cyclin D1 (11q13) SpectrumOrange/CEP 11 SpectrumGreen Probe is a mixture of two probes, The CCND1 probe is approximately 300 kb , contains the CCND1 gene, and is labeled in SpectrumOrange. The second probe is specific to the D11Z1 alpha satellite centromeric repeat of chromosome 11 and is labeled in SpectrumGreen.
Results of HybridizationHybridization of this probe to interphase nuclei of normal cells is expected to produce two orange and two green signals. The anticipated signal pattern in abnormal cells having a gain of copy number of the CCND1 target without a gain of the CEP 11 target is two green and multiple orange signals. Other patterns may be observed if additional genetic alterations are present.
Ordering Information Quantity Order No.
Vysis CCND1/CEP 11 FISH Probe Kit CE marked 20 µl 3N88-20
References1. Schuuring E, Verhoeven E, Tinteren Hv et al.
Cancer Research 1992;52:5229-5234. 2. Bieche I, Olivi M, Nogues C et al.
British Journal of Cancer 2002;86:580-586. 3. Ormandy CJ, Musgrove EA, Hui R, et al.
BreastCancer Research and Treatment 2003;78:323-335. 4. Al-Kuraya K, Schraml P, Torhorst J, et al.
Cancer Research 2004;64:8534-8540. 5. Jirstrom K, Stendahl M, Ryden L, et al.
Cancer Research 2005;65(17):8009-8016. 6. Katz RL, Caraway NP, Gu J, et al.
American Journal of Clinical Pathology 2000;114:248-257. 7. Wiktor AE, Van Dyke DL, Stupca PJ, et al.
Genetics in Medicine 2006;8(1):16-23.
Vysis CCND1/CEP 11 FISH Probe hybridized to abnormal tissue.
Vysis CCND1/CEP 11 FISH Probe Kit previously: Vysis LSI Cyclin D1 (11q13) SpectrumOrange/CEP 11 SpectrumGreen Probe

5-9All products, except where indicated, are Analyte Specific Reagents. Analytical and performance characteristics are not established.
Oncology – Solid Tumor Probes
Alterations of the 9p21 locus including the tumor suppressor gene CDKN2A (p16) are implicated in different Meningiomas and Gliomas.1– 4 Studies support the association of CDKN2A homozygous deletion with malignant progression and suggest that it is a marker of worse prognosis in anaplastic oligodendrogliomas.5 – 6
The Vysis LSI CDKN2A SpectrumOrange/CEP 9 SpectrumGreen Probes have been used in several cytogenetic studies to detect losses of the CDKN2A gene.2, 7– 9 Using this probe set as well as other relevant markers (e. g. p53, RB1, 1p36, 19q13, all Vysis FISH probes), Kramar et al. investigated 82 samples from 81 patients with histolgically confirmed glial tumors.7 In a study using the Vysis LSI CDKN2A SpectrumOrange/CEP 9 SpectrumGreen Probes on 189 confirmed glioblastoma patients less than 50 years old, Korshunov et al. found 9p21 deletion to be correlated with an unfavorable prognosis.9
Vysis LSI CDKN2A/CEP 9 Probes are provided in one vial as a mixture of the LSI CDKN2A (p16) probe labeled with SpectrumOrange and the CEP 9 probe labeled with SpectrumGreen. The LSI CDKN2A probe spans approximately222 kb and contains a number of genetic loci including D9S1749, DS1747, p16 (INK4B), p14 (ARF), D9S1748, p15(INK4B), and D9S1752. The CEP 9 SpectrumGreen probe hybridizes to alpha satellite sequences specific to chromosome 9.
Results of HybridizationIn a normal sample, the expected pattern for a nucleus hybridized with the Vysis LSI CDKN2A/CEP 9 Probe is the two orange, two green (2O2G) signal pattern. If a deletion at the 190 kb region covered by the LSI p16 probe occurs on one chromosome 9 homolog and both centromeres from chromosome 9 are retained, the one orangte, two green (1O2G) signal pattern is expected. Very small deletions may occur that do not delete the entire LSI p16 probe target and therefore will not be detected.
Ordering Information Quantity Order No.
Vysis CDKN2A/CEP 9 FISH Probe Kit CE Marked 20 µl 4N61-20
Vysis LSI CDKN2A/CEP 9 Probe hybridized to a nucleus exhibiting the one orange and two green signal (1O2G) pattern. One p16 gene locus is deleted and both chromosome 9 homologs are present as indicated by one orange and two green signals, respectively
References1. Ruas M, Peters G. Biochimic Biophys Acta.
1998;1378(2):F115-F177. 2. Perry A, Banerjee R, Lohse CM, et al.
Brain Pathol. 2002;12(2):183-190. 3. Boström J, Meyer-Puttlitz B, Wolter M, et al.
Am J Pathol. 2001;159(2):661-669. 4. Smith JS, Jenkins RB.
Front in Biosci. 2000;5:D213-D231. 5. Cairncross JG, Ueki K, Zlatescu MC, et al.
J Natl Cancer Inst. 1998;90(19):1473-1479. 6. Bortolotto S, Chiadó-Piat L, Cavalla P, et al.
Int J Cancer. 2000;88(4):554-557. 7. Kramar F, Zemanova Z, Michalova K, et al.
J Neurooncol. 2007;84(2):201-211. 8. Rajaram V, Leuthardt EC, Singh PK, et al.
Mod Pathol. 2004;17(1):9-14. 9. Korshunov A, Sycheva R, Golanov A.
Cancer. 2005;104(4):825-832.
Vysis CDKN2A/CEP 9 FISH Probe Kit previously: Vysis LSI p16 (9p21) SpectrumOrange/CEP 9 SpectrumGreen Probe
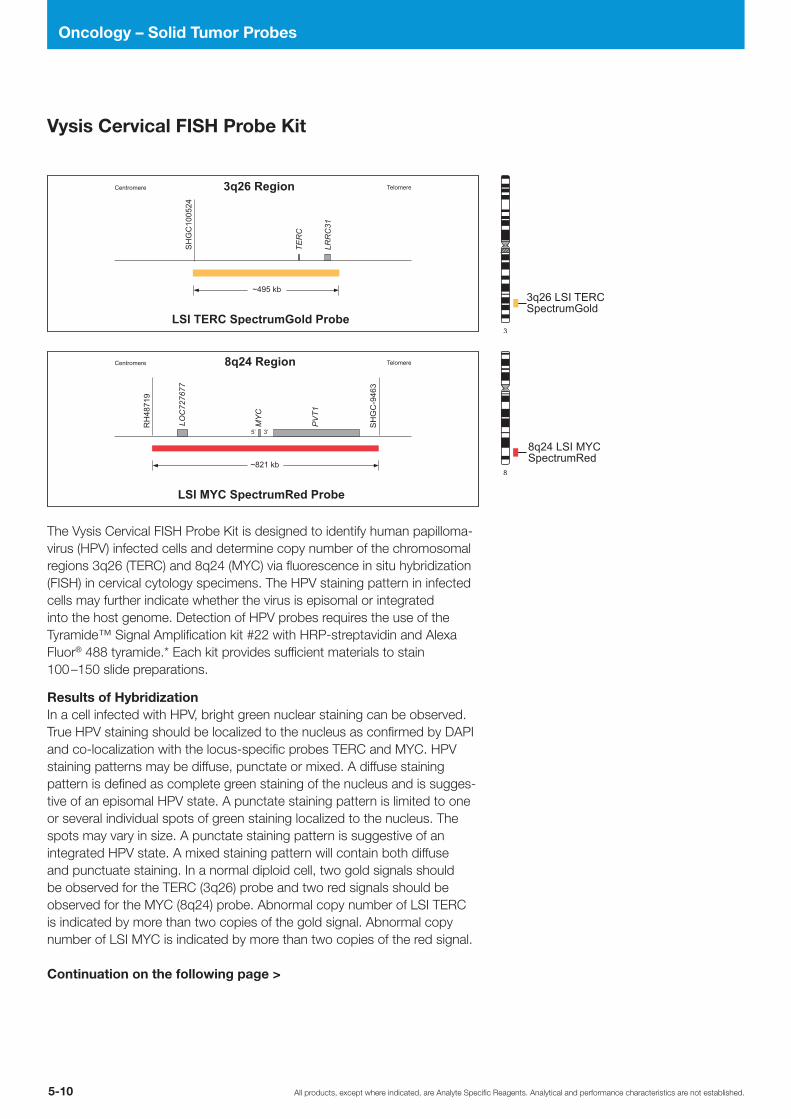
All products, except where indicated, are Analyte Specific Reagents. Analytical and performance characteristics are not established.5-10
Oncology – Solid Tumor Probes
The Vysis Cervical FISH Probe Kit is designed to identify human papilloma-virus (HPV) infected cells and determine copy number of the chromosomal regions 3q26 (TERC) and 8q24 (MYC) via fluorescence in situ hybridization (FISH) in cervical cytology specimens. The HPV staining pattern in infected cells may further indicate whether the virus is episomal or integrated into the host genome. Detection of HPV probes requires the use of the Tyramide™ Signal Amplification kit #22 with HRP-streptavidin and Alexa Fluor® 488 tyramide.* Each kit provides sufficient materials to stain 100 –150 slide preparations.
Results of HybridizationIn a cell infected with HPV, bright green nuclear staining can be observed. True HPV staining should be localized to the nucleus as confirmed by DAPI and co-localization with the locus-specific probes TERC and MYC. HPV staining patterns may be diffuse, punctate or mixed. A diffuse staining pattern is defined as complete green staining of the nucleus and is sugges-tive of an episomal HPV state. A punctate staining pattern is limited to one or several individual spots of green staining localized to the nucleus. The spots may vary in size. A punctate staining pattern is suggestive of an integrated HPV state. A mixed staining pattern will contain both diffuse and punctuate staining. In a normal diploid cell, two gold signals should be observed for the TERC (3q26) probe and two red signals should be observed for the MYC (8q24) probe. Abnormal copy number of LSI TERC is indicated by more than two copies of the gold signal. Abnormal copy number of LSI MYC is indicated by more than two copies of the red signal.
Continuation on the following page >
Vysis Cervical FISH Probe Kit

5-11All products, except where indicated, are Analyte Specific Reagents. Analytical and performance characteristics are not established.
Oncology – Solid Tumor Probes
Ordering Information Quantity Order No.
Vysis Cervical FISH Probe Kit CE Marked 200 µl* 1N29-20
Tyramide™ Signal Amplification kit #22 with HRP-streptavidin and Alexa Fluor® 488 tyramide*
100 –150 slides 3N02-01
* premixed in Hybridizaton Buffer
References1. Walboomers JM, Jacobs MV, Manos MM,et al. J Pathol 1999, 189:12-192. Schiffman MH, Bauer HM, Hoover RN, Glass AG, Cadell DM, Rush BB, Scott DR, Sherman ME, Kurman RJ,
Wacholder S, et al. J Natl Cancer Inst 1993, 85:958-9643. Snijders PJ, Steenbergen RD, Heideman DA, Meijer CJ. J Pathol 2006, 208:152-1644. Solomon D, Schiffman M, Tarone R. J Natl Cancer Inst 2001, 93:293-2995. Heselmeyer-Haddad, K., V. Janz, et al. (2003). Am J Pathol 163(4): 1405-1416
* This product is sold pursuant to a license from PerkinElmer LAS, Inc. for use of its tyramide technology for fluorescence in situ hybridization for cervical cancer diagnostic applications. Purchase does not include or carry any right to resell or transfer this product either as a stand-alone product or as a component of another product. Any use of this product other than the licensed use without the express written authorization of PerkinElmer LAS, Inc. is strictly prohibited. This product is subject to a patent license agreement of Molecular Probes, Inc. (a subsidiary of Life Technologies Corporation) regarding the rights to use the product solely as general purpose reagents for laboratory use by the buyer for fluorescent in situ hybridization in conjunction with ABBOTT PRODUCT # 03N02-001, in a manner consistent with the accompanying product literature.
Figure 3: Normal cell hybridization showing two gold and two red signals.
Figure 4: Abnormal cell hybridization.
Continuation:Vysis Cervical FISH Probe Kit
Figure 1: HPV infected cell with diffuse staining.
Figure 2: HPV infected cell with punctate staining.

All products, except where indicated, are Analyte Specific Reagents. Analytical and performance characteristics are not established.5-12
Oncology – Solid Tumor Probes
12
Chromosomal rearrangements involving the DDIT3 gene located on chromosome 12q13, are common in myxoid liposarcomas (MLS) and have also been identified in round cell (RC) and mixed liposarcomas (combined myxoid and round cell). A unique translocation t(12;16)(q13;p11) is present in > 95 % of MLS cases and is thus regarded as a diagnostic marker for MLS/RC. t(12;16) results in the fusion (and transcriptional deregulation) of the genes TLS (FUS) and DDIT3, a C/EBP-family transcription factor implicated in adipocyte differentiation.1, 2, 4 Hybridization with the LSI DDIT3 (12q13) Dual Color, Break Apart Rearrangement Probe will identify chromosomal rearrangement in the DDIT3 gene but not a specific gene-fusion partner.
The DDIT3 Dual Color, Break Apart Rearrangement Probe has been used in different studies to detect DDIT3 (12q13) gene rearrangements. Vysis LSI DDIT3 (12q13) Dual Color, Break Apart Rearrangement Probe successfully detected rearrangment of the DDIT3 (CHOP) gene in 18/18 formalin-fixed, paraffin-emmbedded tissues from myxoid liposarcoma.3 Matsui et al. used the LSI DDIT3 (CHOP) Dual Color, Break Apart Rearrangement Probe (Abbott Molecular, Inc.) to confirm rearrangement of the DDIT3 gene in a rare case of MLS bearing a variant chromosomal translocation t(12;22)(q13;q12) resulting in EWS-DDIT3 fusion gene.4
The Vysis LSI DDIT3 (12q13) Dual Color, Break Apart Rearrangement Probe consists of a mixture of two FISH DNA probes. The first probe, a 700 kb probe labeled in SpectrumOrange lies proximal to the DDIT3 gene. The second probe labeled in SpectrumGreen extends distally from the DDIT3 gene and is approximately 660 kb in length. The centromeric Spectrum-Orange probe contains most of the GLI1 oncogene, and this probe may be useful in detecting GLI amplification. The telomeric SpectrumGreen probe contains the CDK4 gene. CDK4 can be amplified in sarcoma and glioblas-toma. Not all the genes within the probes are shown on the map.
Results of HybridizationIn a normal cell that lacks a t(12q13) in the DDIT3 gene region, a two fusion signal pattern will be observed which reflects the two intact copies of DDIT3. In an abnormal cell with a simple t(12q13), a one fusion, one green, and one orange signal pattern will be expected.
Ordering Information Quantity Order No.
Vysis DDIT3 Break Apart FISH Probe Kit CE marked 20 µl 3N57-20
Vysis DDIT3 Break Apart FISH Probe Kit previously: Vysis LSI CHOP (12q13) Dual Color, Break Apart Rearrangement Probe
Abnormal cells hybridized with the Vysis LSI DDIT3 (12q13) Dual Color, Break Apart Rearrangement Probe. Two of the cells in this image show the one fusion, one orange, and one green signal pattern indicative of a rearrangement of one copy of the DDIT3 gene region.
References1. Antonescu, C., et al. Clinical Cancer Research 7 (2001): 3977-3987.2. Knight, J. C., et al. Cancer Research 55 (1995): 24-27.3. Downs-Kelly E, et al. Am J Surg Pathol 2008;32(1):8-13.4. Matsui Y, et al. Bioch Biophys Res Com 2006;348:437-440.5. Wiktor AE, et al. Genet Med 2006;8(1):16-23.
Result of the hybridization of the Vysis LSI DDIT3 (12q13) Dual Color, Break Apart Rearrangement Probe, showing the two fusion signal pattern as observed in normal interphase cells

5-13All products, except where indicated, are Analyte Specific Reagents. Analytical and performance characteristics are not established.
Oncology – Solid Tumor Probes
Vysis Esophageal FISH Probe Kit
The Vysis Esophageal FISH Probe Kit is designed to detect copy number of ERBB2 (17q12), p16 (9p21), MYC (8q24) and ZNF217 (20q13.2) loci via fluorescence in situ hybrid-ization (FISH) in cytology (esophageal brushing) specimens and in formalin-fixed, paraffin-embedded esophageal tissue specimens.
The Vysis Esophageal FISH Probe Kit utilizes four Locus-Specific Identifier (LSI) probes to identify copy number changes of the ERBB2 (17q12), p16 (9p21), MYC (8q24), and ZNF217 (20q13.2) chromosomal loci, using a multi-color FISH test. These four loci have been shown to be
associated with dysplasia and esophageal adenocarcinoma (EAC) in patients with Barrett’s esophagus (BE)1, 2. BE is believed to increase the risk of EAC3, 4. The rise in incidence of this pre-malignant condition has been linked to a rapid increase in the incidence of EAC in Western European countries, Canada, and the US5, 6, 7. The incidence of EAC has been growing at a rate exceeding that of any other cancer, 4 % to 10 % annually over the past two decades, while the 5-year survival rate remains less than 10%8, 9.
Continuation on the following page >
Vysis LSI D5S23, D5S721 SpectrumGreen Probe
Ordering Information Quantity Order No.
Vysis LSI D5S23, D5S721 SpectrumGreen Probe 20 µl 4N30-20

All products, except where indicated, are Analyte Specific Reagents. Analytical and performance characteristics are not established.5-14
Oncology – Solid Tumor Probes
Continuation: Vysis Esophageal FISH Probe Kit
FISH is a technique that allows the visualization of specific nucleic acid sequences within a cellular preparation. Specifically, FISH involves the precise annealing of a single stranded, fluorescently-labeled DNA probe to complementary target sequences. The hybridization of the probe with the cellular DNA site is visible by direct detection using fluorescence micros-copy10, 11. Interpretation of FISH results should be made utilizing appropriate controls and analytical techniques12 as well as taking into consideration other clinical and diagnostic test data.
The Vysis Esophageal FISH Probe Kit contains fluorescently labeled nucleic acid probes for use in in situ hybridization assays on esophageal brushing cytology specimens fixed on slides, or on formalin-fixed, paraffin-embed-ded human esophageal tissue. The Vysis Esophageal FISH Probe Kit is a four-color mixture of four DNA probe sequences.
The probes are pre-mixed in hybridization buffer for ease of use. Unlabeled blocking DNA is also included with the probes to suppress sequences contained within the target loci that are common to other chromosomes. When hybridized and visualized, these probes provide information on chromosome copy number.
The ERBB2 probe is labeled with SpectrumGreen and covers an approxi-mately 226 kb region that encompasses the entire ERBB2 gene on chro-mosome 17. The p16 probe is labeled with SpectrumRed and covers an approximately 190 kb region that encompasses the entire p16 gene on chromosome 9 as well as adjacent regions. The MYC probe is labeled with SpectrumAqua and covers an approximately 821 kb region that encom-passes the entire MYC gene on chromosome 8 as well as adjacent regions. The ZNF217 probe is labeled with SpectrumGold and covers an approxi-mately 433 kb region that encompasses the entire ZNF217 gene on chromosome 20 as well as adjacent regions.
Ordering Information Quantity Order No.
Vysis Esophageal FISH Probe Kit CE marked 200 µl 4N19-20
* premixed in Hybridizaton Buffer
References1. Brankley SM, Wang KK, Harwood AR, et al. The development of a fluorescence in situ hybridization assay for the
detection of dysplasia and adenocarcinoma in Barrett’s esophagus. J Mol Diagn. 2006; 8(2):260-7.2. Fritcher EG, Brankley SM, Kipp BR, et al. A comparison of conventional cytology, DNA ploidy analysis, and fluorescence
in situ hybridization for the detection of dysplasia and adenocarcinoma in patients with Barrett?s esophagus. Hum Pathol. 2008;39(8):1128-35.
3. Zhang HY, Spechler SJ and Souza RF. Esophageal adenocarcinoma arising in Barrett esophagus. Cancer Lett. 2009;275(2):170-7.
4. Odze RD. Update on the diagnosis and treatment of Barrett esophagus and related neoplastic precursor lesions. Arch Pathol Lab Med. 2008;132(10):1577-85.
5. Pickens A and Orringer MB. Geographical distribution and racial disparity in esophageal cancer. Ann Thorac Surg. 2003;76(4):1367-9.
6. Pohl H and Welch HG. The role of overdiagnosis and reclassification in the marked increase of esophageal adenocarcinoma incidence. J Natl Cancer Inst. 2005;97(2):142-6.
7. Umar SB and Fleischer DE. Esophageal cancer: epidemiology, pathogenesis and prevention. Nat Clin Pract Gastroenterol Hepatol. 2008;5(9):517-26.
8. Vizcaino AP, Moreno V, Lambert R, Parkin DM. Time trends incidence of both major histologic types of esophageal carcinomas in selected countries, 1973-1995. Int J Cancer. 2002;99(6):860-8.
9. American Cancer Society. Global Cancer Facts and Figures, 2007. Pinkel D. Fluorescence In Situ Hybridization. In Introduction to Fluorescence In Situ Hydridization Principles and Clincal Applications. M. Andreeff and D. Pinkel Ed. Wiley-Liss. John Wiley & ons, Inc.1999; 3-32.
10. Van Stedum S and King W. Basic FISH Techniques and Troubleshooting. In: Fan YS. Molecular Cytogenetics: Protocols and Applications. Totowa, New Jersey: Humana Press Inc. 2002; 204:51-63.
11. Wiktor AE, Van Dyke DL, Stupca PJ, et al. Preclinical validation of fluorescence in situ hybridization assays for clinical practice. Genet Med 2006;8(1):16-23.
12. ACMG Standards & Guidelines, 2008 Edition Validation requirements, Sections E9.2 and E10.2.2 standards.

5-15All products, except where indicated, are Analyte Specific Reagents. Analytical and performance characteristics are not established.
Oncology – Solid Tumor Probes
EGFR abnormalities including increased copy number and amplification have been correlated with the development of many solid tumors, including non-small cell lung cancer (NSCLC)1 which is the leading cause of cancer death worldwide.2
NSCLC has a 5-year survival rate of approximately 15 %.3 There is a pressing need for improvement in identifying patients most likely to respond to specific treatments for NSCLC. Inhibition of EGFR by agents that block its tyrosine kinase domain has been demonstrated to reduce proliferation of lung cancer cells, resulting in suppression of tumor growth.1, 4
This probe set is premixed in Hybridization Buffer.
Results of HybridizationIn a cell with normal copy number of the EGFR gene and chromosome 7, two orange signals (EGFR), and two green signals (chromosome 7) will be observed. Enumeration of both the orange EGFR and green CEP 7 signals provide a mechanism for determining EGFR copy number relative to total chromosome 7 copy number.
Ordering Information Quantity Order No.
Vysis EGFR/CEP 7 FISH Probe Kit CE marked 200 µl* 1N35-20
Vysis EGFR/CEP7 FISH Probe Kit
An abnormal cell hybridized with the Vysis LSI EGFR SpectrumOrange/CEP 7 SpectrumGreen Probes. The cell contains multiple EGFR (orange) signals and chromosome 7 (green signals).
References1. Parkin MD. Lancet Oncol 2001;2:533-43.2. Jemal A, et al. CA Cancer J Clin 2002;52:23-47.3. Hirsch FR, et al. J Clin Oncol 2005;23(28):6838-45.4. Hirsch FR,et al. J Clin Oncol 2005;21(20):3798-3807.5. Cappuzzo F, et al. J Natl Cancer Inst 2005;97(9):643-55.
* Premixed in Hybridizaton Buffer
Vysis LSI EGFR SpectrumRed Probe
Ordering Information Quantity Order No.
Vysis LSI EGFR SpectrumRed Probe 20 µl 4N31-20

All products, except where indicated, are Analyte Specific Reagents. Analytical and performance characteristics are not established.5-16
Oncology – Solid Tumor Probes
The Vysis EWSR1 Break Apart FISH probe kit contains the LSI EWSR 1 (22q12) Dual Color, Break Apart Rearrangement Probe.
Chromosome rearrangements involving the EWSR1 (Ewing sarcoma breakpoint region 1) gene on chromosome 22q12 have been observed in several types of tumors1. Approximately 90% of the translocations involving the EWSR1 gene result in the t(11;22) (q24;q12), which juxtaposes the EWSR1 with the FLI1 (Friend leukemia virus integration 1) gene on chromo-some 11q24. The resulting fusion produces chimeric transcripts and proteins that consist of the N-terminus of EWSR1 and the C-terminal portion of FLI1. The next most common translocation partner of the EWSR1 gene is the ERG (v-ets erythroblastosis virus E26 oncogene like) on chromosome 21q22. While extremely rare, translocations with ETV1 (ets variant gene 1) on chromosome 7p22, FEV (FEV protein) on chromosome 2q33, and E1VF on chromosome 17q12 and several other genes have also been observed. Hybridization with the LSI EWSR1 (22q12) Break Apart Rearrangement Probe will identify t(22q12) but not the specific transloca-tion partner. The probe will also identify aneuploidy of chromosome 22.
The LSI EWSR1 Dual Color, Break Apart Rearrangement Probe consists of a mixture of two FISH DNA probes. The first probe, a ~500 kb probe labeled in SpectrumOrange, flanks the 5’ side of the EWSR1 gene, and extends inward into intron 4. The second probe, a ~1100 kb probe labeled in SpectrumGreen, flanks the 3’ side of the EWSR1 gene. The known break points within the EWSR1 gene are restricted to introns 7 through 10.
Results of HybridizationIn a normal cell that lacks a t(22q12) in the EWSR1 gene region, a two fusion signal pattern will be observed reflecting the two intact copies of EWSR1. In an abnormal cell with a simple t(22q12), a one fusion, one green, one orange signal pattern will be expected.
Ordering Information Quantity Order No.
Vysis EWSR1 Break Apart FISH Probe Kit CE marked 20 µl 3N59-20
References1. Antonescu, C., et al. Clinical Cancer Research 7 (2001): 3977-3987.2. Knight, J. C., et al. Cancer Research 55 (1995): 24-27.3. Downs-Kelly E, et al. Am J Surg Pathol 2008;32(1):8-13.4. Matsui Y, et al. Bioch Biophys Res Com 2006;348:437-440.5. Wiktor AE, et al. Genet Med 2006;8(1):16-23.
Vysis EWSR1 Break Apart FISH Probe Kit
Result of the hybridization of the LSI EWSR1 (22q12) Dual Color, Break Apart Rearrangement Probe as observed in a normal interphase cell.
An abnormal cell hybridized with the LSI EWSR1 (22q12) Dual Color, Break Apart Rearrangement Probe. The cell in this image shows the one fusion, one orange, and one green signal pattern indicative of a rearrangement of one copy of the EWSR1 region.

5-17All products, except where indicated, are Analyte Specific Reagents. Analytical and performance characteristics are not established.
Oncology – Solid Tumor Probes
13
Chromosomal rearrangements involving the FOXO1 gene on chromosome 13q14 are associated with alveolar rhabdomyosarcoma (ARMS). Identifica-tion of RMS is a diagnostic dilemma for pathologists, requiring a significant amount of rule out testing for this and other soft-tissue cancers. ARMS is characterized by two consistent chromosomal translocations, the common t(2;13)(q35.2;q14) and the variant t(1;13)(p36;q14) resulting in the formation of PAX3-FOXO1 and PAX7-FOXO1fusion genes respectively (~80% of cases of ARMS). Hybridization with the Vysis LSI FOXO1 (13q14) Dual Color, Break Apart Rearrangement Probe will identify a chromosomal rearrangement at the FOXO1 gene but not a specific gene-fusion partner.
The Vysis LSI FOXO1 (13q14) Dual Color, Break Apart Rearrangement Probe consists of a mixture of two FISH DNA probes. The first probe, a 720 kb probe labeled in SpectrumGreen lies proximal to the FOXO1 gene. The second probe labeled in SpectrumOrange extends distally from the FOXO1 gene and is approximately 650 kb in length.
Results of HybridizationIn a normal cell that lacks a t(13q14) in the FOXO1 gene region, a two fusion signal pattern will be observed.
Ordering Information Quantity Order No.
Vysis FOXO1 Break Apart FISH Probe Kit CE marked 20 µl 3N60-20
References1. Anderson, J., et al. Br J Cancer 85 (6) (2001): 831-835.2. Biegel, et al.Genes Chrom Cancer 12 (3) (1995): 186-192.3. Slominski, A., et al. Arch Pathol Lab Med. 123 (1999): 1246-1259.4. Womer, R. B., Eur J of Cancer 33 (13) (1997): 2230-2236.5. Nishio J., et al. Lab Invest 2006;86:547-556. 6. Mehra S., et al. Diagn Mol Pathol 2008;17(1):14-20.7. Matsumura T., et al. Virchows Arch 2007.8. Das k, et al. Diagn Cytoopath 2006;34(10):704-706.9. Wiktor EA., et al. Genet Med 2006;8(1):16-23.
Vysis FOXO1 Break Apart FISH Probe Kitpreviously: Vysis LSI FKHR (13q14) Dual Color, Break Apart Rearrangement Probe
Result of the hybridization of the LSI FOXO1 (13q14) Dual Color Break Apart Rearrangement Probe, showing the two fusion signal pattern as observed in normal interphase cells.
Abnormal cells hybridized with the LSI FOXO1 (13q14) Dual Color Break Apart Rearrangement Probe. The cells in this image show the one fusion, one orange and one green signal pattern indicative of a rearrangement of one copy of the FOXO1 gene region.
Abnormal cells hybridized with the LSI FOXO1 (13q14) Dual Color Break Apart Rearrangement Probe. The cells in this image show the one fusion, one orange and one green signal pattern indicative of a rearrangement of one copy of the FOXO1 gene region. In addition, there are often extra signals in the abnormal cases suggesting that perhaps they are also highly aneuploid or polyploid.

All products, except where indicated, are Analyte Specific Reagents. Analytical and performance characteristics are not established.5-18
Oncology – Solid Tumor Probes
CentromereLSI FUS Probe region 16p11Telomere
~500 kb ~270 kb~120 kbgap
GG
AA
3G05
FU
S
BC
DK
BC
L7C
RN
F40
SH
GC
-846
22
ITG
AX
16
Chromosomal rearrangements involving the FUS gene located on chromo-some 16p11 have been observed in many tumor types including several soft tissue sarcomas (STS). Different types of STS are characterized by specific chromosomal translocations including t(12;16)(q13;p11) FUS-DDIT3 (Myxoid liposarcoma), t(16;21)(p11;q22) FUS-ERG (Acute myeloid leukemia), t(12;16)(q13;p11) FUS-ATF1 (Angiomatoid-fibrous histiocytoma) and t(7;16)(q32-34;p11) FUS-CREB3L2 (Low grade fibromyxoid sarcoma). The resulting chimeric fusion proteins are mainly transactivators exerting deregulation of differentiation control on the tumor-target cell.1,2 Hybridiza-tion with the LSI FUS (16p11) Dual Color, Break Apart Rearrangement Probe will identify a chromosomal rearrangement in the FUS gene region but not a specific gene-fusion partner.
FUS FISH-probes were successfully used to confirm diagnosis of different sarcomas as demonstrated by several studies. The Vysis LSI FUS (16p11) Dual Color, Break Apart Rearrangement Probe detected rearrangement of the FUS gene in 7/10 formalin-fixed, paraffin-embedded tissues from low-grade fibromyxoid sarcomas.3 In another study the Vysis LSI FUS (16p11) Dual Color, Break Apart Rearrangement Probe was used to detect rearrangement of the FUS gene in a rare case of Ewing bone sarcoma bearing a variant chromosomal translocation t(2;16)(q35;p11) resulting in a FUS-FEV fusion gene.4
Results of HybridizationHybridization of this probe to interphase nuclei of normal cells is expected to produce a two fusion signal pattern. The anticipated signal pattern in abnormal cells having a chromosomal breakpoint within the gap between the two probe targets on one chromosome 16 is one orange, one green, and one fusion signal. Other patterns may be observed if additional genetic alterations are present.
Ordering Information Quantity Order No.
Vysis FUS Break Apart FISH Probe Kit CE marked 20 µl 3N58-20
References1. Perez-Mancera PA., et al., (2005) Seminar Cancer Biol. 2005;15: 206-14.2. Mertens F., et al., (2005) Lab Invest. 2005;85: 408-15.3. Downs-Kelly E, et al. Am J Surg Pathol 2008;32(1):8-13.4. Ng TL, et al. J Mol Diagn 2007;9(4):459-463.
Vysis FUS Break Apart FISH Probe Kit
Abnormal cell hybridization using the LSI FUS (16p11) Dual Color, Break Apart Rearrangement Probe.
Normal cell hybridization using the LSI FUS (16p11) Dual Color, Break Apart Rearrangement Probe.

5-19All products, except where indicated, are Analyte Specific Reagents. Analytical and performance characteristics are not established.
Oncology – Solid Tumor Probes
Continuation on the following page >
Vysis Melanoma FISH Probe Kit
Ordering Information Quantity Order No.
Vysis LSI LPL SpectrumOrange Probe 20 µl 4N34-20
Vysis LSI LPL SpectrumOrange Probe
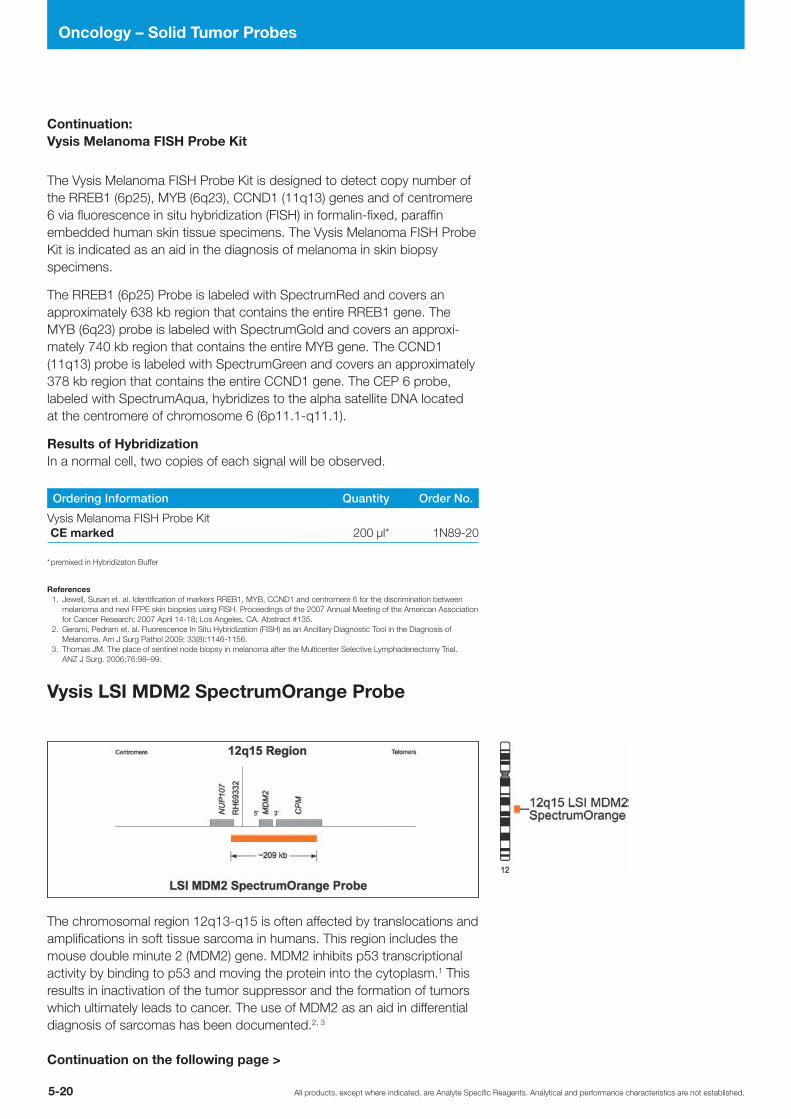
All products, except where indicated, are Analyte Specific Reagents. Analytical and performance characteristics are not established.5-20
Oncology – Solid Tumor Probes
Continuation: Vysis Melanoma FISH Probe Kit
The Vysis Melanoma FISH Probe Kit is designed to detect copy number of the RREB1 (6p25), MYB (6q23), CCND1 (11q13) genes and of centromere 6 via fluorescence in situ hybridization (FISH) in formalin-fixed, paraffin embedded human skin tissue specimens. The Vysis Melanoma FISH Probe Kit is indicated as an aid in the diagnosis of melanoma in skin biopsy specimens.
The RREB1 (6p25) Probe is labeled with SpectrumRed and covers an approximately 638 kb region that contains the entire RREB1 gene. The MYB (6q23) probe is labeled with SpectrumGold and covers an approxi-mately 740 kb region that contains the entire MYB gene. The CCND1 (11q13) probe is labeled with SpectrumGreen and covers an approximately 378 kb region that contains the entire CCND1 gene. The CEP 6 probe, labeled with SpectrumAqua, hybridizes to the alpha satellite DNA located at the centromere of chromosome 6 (6p11.1-q11.1).
Results of HybridizationIn a normal cell, two copies of each signal will be observed.
Ordering Information Quantity Order No.
Vysis Melanoma FISH Probe Kit CE marked 200 µl* 1N89-20
* premixed in Hybridizaton Buffer
References1. Jewell, Susan et. al. Identification of markers RREB1, MYB, CCND1 and centromere 6 for the discrimination between
melanoma and nevi FFPE skin biopsies using FISH. Proceedings of the 2007 Annual Meeting of the American Association for Cancer Research; 2007 April 14-18; Los Angeles, CA. Abstract #135.
2. Gerami, Pedram et. al. Fluorescence In Situ Hybridization (FISH) as an Ancillary Diagnostic Tool in the Diagnosis of Melanoma. Am J Surg Pathol 2009; 33(8):1146-1156.
3. Thomas JM. The place of sentinel node biopsy in melanoma after the Multicenter Selective Lymphadenectomy Trial. ANZ J Surg. 2006;76:98–99.
Vysis LSI MDM2 SpectrumOrange Probe
The chromosomal region 12q13-q15 is often affected by translocations and amplifications in soft tissue sarcoma in humans. This region includes the mouse double minute 2 (MDM2) gene. MDM2 inhibits p53 transcriptional activity by binding to p53 and moving the protein into the cytoplasm.1 This results in inactivation of the tumor suppressor and the formation of tumors which ultimately leads to cancer. The use of MDM2 as an aid in differential diagnosis of sarcomas has been documented.2, 3
Continuation on the following page >
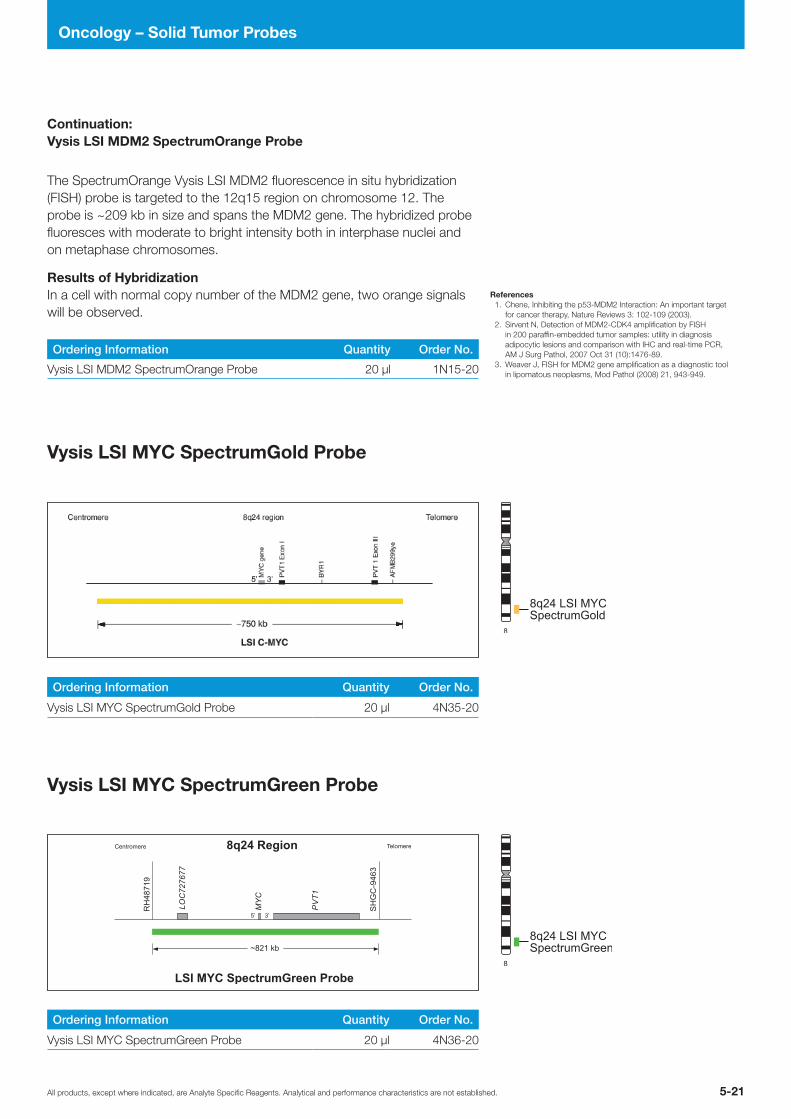
5-21All products, except where indicated, are Analyte Specific Reagents. Analytical and performance characteristics are not established.
Oncology – Solid Tumor Probes
The SpectrumOrange Vysis LSI MDM2 fluorescence in situ hybridization (FISH) probe is targeted to the 12q15 region on chromosome 12. The probe is ~209 kb in size and spans the MDM2 gene. The hybridized probe fluoresces with moderate to bright intensity both in interphase nuclei and on metaphase chromosomes.
Results of HybridizationIn a cell with normal copy number of the MDM2 gene, two orange signals will be observed.
Ordering Information Quantity Order No.
Vysis LSI MDM2 SpectrumOrange Probe 20 µl 1N15-20
References1. Chene, Inhibiting the p53-MDM2 Interaction: An important target
for cancer therapy, Nature Reviews 3: 102-109 (2003).2. Sirvent N, Detection of MDM2-CDK4 amplification by FISH
in 200 paraffin-embedded tumor samples: utility in diagnosis adipocytic lesions and comparison with IHC and real-time PCR, AM J Surg Pathol, 2007 Oct 31 (10):1476-89.
3. Weaver J, FISH for MDM2 gene amplification as a diagnostic tool in lipomatous neoplasms, Mod Pathol (2008) 21, 943-949.
Continuation: Vysis LSI MDM2 SpectrumOrange Probe
Ordering Information Quantity Order No.
Vysis LSI MYC SpectrumGreen Probe 20 µl 4N36-20
Ordering Information Quantity Order No.
Vysis LSI MYC SpectrumGold Probe 20 µl 4N35-20
Vysis LSI MYC SpectrumGreen Probe
Vysis LSI MYC SpectrumGold Probe
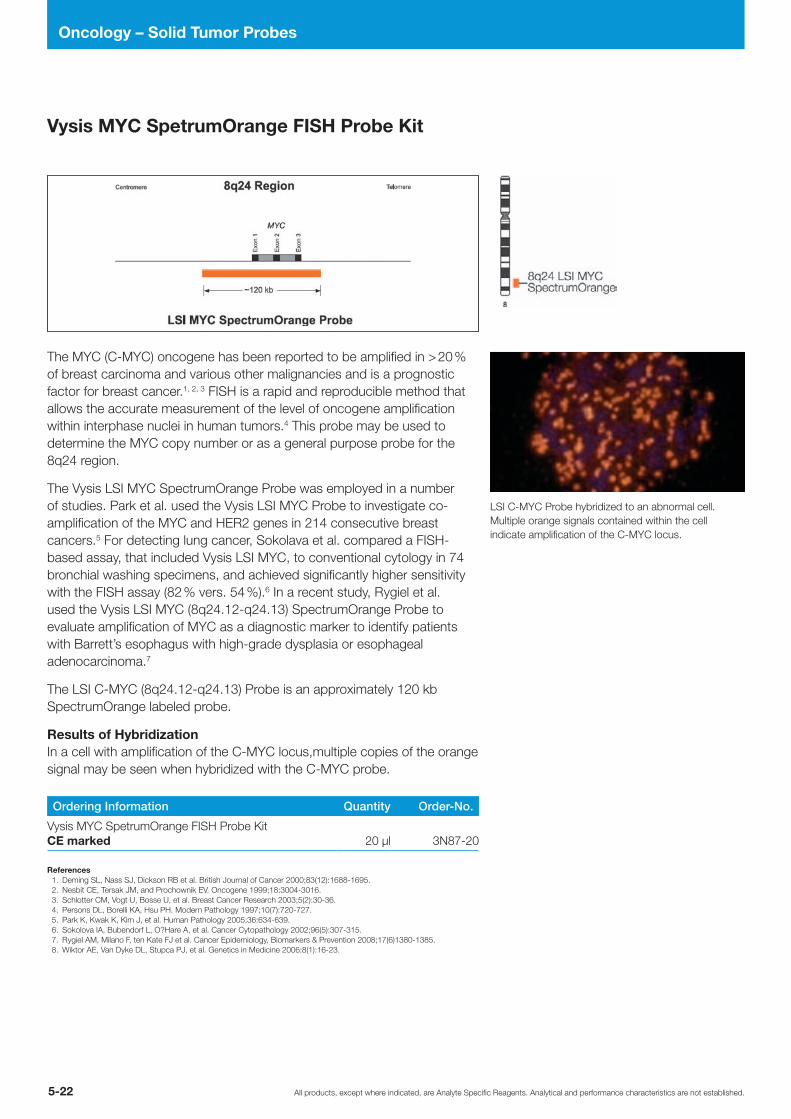
All products, except where indicated, are Analyte Specific Reagents. Analytical and performance characteristics are not established.5-22
Oncology – Solid Tumor Probes
The MYC (C-MYC) oncogene has been reported to be amplified in > 20 % of breast carcinoma and various other malignancies and is a prognostic factor for breast cancer.1, 2, 3 FISH is a rapid and reproducible method that allows the accurate measurement of the level of oncogene amplification within interphase nuclei in human tumors.4 This probe may be used to determine the MYC copy number or as a general purpose probe for the 8q24 region.
The Vysis LSI MYC SpectrumOrange Probe was employed in a number of studies. Park et al. used the Vysis LSI MYC Probe to investigate co-amplification of the MYC and HER2 genes in 214 consecutive breast cancers.5 For detecting lung cancer, Sokolava et al. compared a FISH-based assay, that included Vysis LSI MYC, to conventional cytology in 74 bronchial washing specimens, and achieved significantly higher sensitivity with the FISH assay (82 % vers. 54 %).6 In a recent study, Rygiel et al. used the Vysis LSI MYC (8q24.12-q24.13) SpectrumOrange Probe to evaluate amplification of MYC as a diagnostic marker to identify patients with Barrett’s esophagus with high-grade dysplasia or esophageal adenocarcinoma.7
The LSI C-MYC (8q24.12-q24.13) Probe is an approximately 120 kb SpectrumOrange labeled probe.
Results of HybridizationIn a cell with amplification of the C-MYC locus,multiple copies of the orange signal may be seen when hybridized with the C-MYC probe.
Ordering Information Quantity Order-No.
Vysis MYC SpetrumOrange FISH Probe Kit CE marked 20 µl 3N87-20
References1. Deming SL, Nass SJ, Dickson RB et al. British Journal of Cancer 2000;83(12):1688-1695. 2. Nesbit CE, Tersak JM, and Prochownik EV. Oncogene 1999;18:3004-3016. 3. Schlotter CM, Vogt U, Bosse U, et al. Breast Cancer Research 2003;5(2):30-36. 4. Persons DL, Borelli KA, Hsu PH. Modern Pathology 1997;10(7):720-727. 5. Park K, Kwak K, Kim J, et al. Human Pathology 2005;36:634-639. 6. Sokolova IA, Bubendorf L, O?Hare A, et al. Cancer Cytopathology 2002;96(5):307-315. 7. Rygiel AM, Milano F, ten Kate FJ et al. Cancer Epidemiology, Biomarkers & Prevention 2008;17(6)1380-1385. 8. Wiktor AE, Van Dyke DL, Stupca PJ, et al. Genetics in Medicine 2006;8(1):16-23.
LSI C-MYC Probe hybridized to an abnormal cell. Multiple orange signals contained within the cell indicate amplification of the C-MYC locus.
Vysis MYC SpetrumOrange FISH Probe Kit

5-23All products, except where indicated, are Analyte Specific Reagents. Analytical and performance characteristics are not established.
Oncology – Solid Tumor Probes
2p24 region
LSI N-MYC
~200 kb
N-MYC gene
CentromereTelomere
The LSI N-MYC (2p24) probe contains unique DNA sequences specific to the N-MYC oncogene (HUGO name MYCN) located within the 2p24 region of chromosome 2. This probe may be used to detect the MYCN oncogene copy number.
The LSI N-MYC (2p24)/CEP 2 (2p11.1-q11.1) Dual ColorProbe Set is a mixture of LSI N-MYC (2p24) labeled with SpectrumGreen and CEP 2 (2p11.1-q11.1) labeled with SpectrumOrange. The LSI N-MYC (2p24) SpectrumGreen probe is an approximately 200 kb probe that hybridizes to the 2p24 region on chromosome 2 and contains sequences that flank both 5’ and 3’ ends of the MYCN gene. The CEP 2 (2p11.1-q11.1) Spectrum Orange probe hybridizes to alpha satellite sequences specific to chromosome 2.
Results of HybridizationIn a normal cell with two intact copies of chromosome 2, two green and two orange signals will be observed. In an abnormal cell containing amplification of the MYCN oncogene, greater than two green signals will be observed.
Ordering Information Quantity Order No.
Vysis LSI N-MYC (2p24) SpectrumGreen/ CEP 2 SpectrumOrange Probe 20 µl 7J72-01
References1. Brodeur, GM (2003) Nat Rev Cancer 3: 203-216.2. Brodeur, GM et al. (1984) Science 224: 1121-1124.3. Heim, S. & Mitelman, F. (1995) Cancer Cytogenetics 2nd ed.4. Maris, J., et al. (1999) J Clin Oncol 17: 2264-2279.5. Schwab, M. (2002) Ann NY Acad Sci 963: 63-73.6. Seeger, RC et al. (1985) NEJM 313:1111-1116.
Vysis LSI N-MYC (2p24) SpectrumGreen/CEP 2 SpectrumOrange Probe
An abnormal sample hybridized with the LSI N-MYC (2p24)/CEP 2 (2p11.1-q11.1) Dual Color Probe showing a high level of amplification of the N-MYC oncogene.
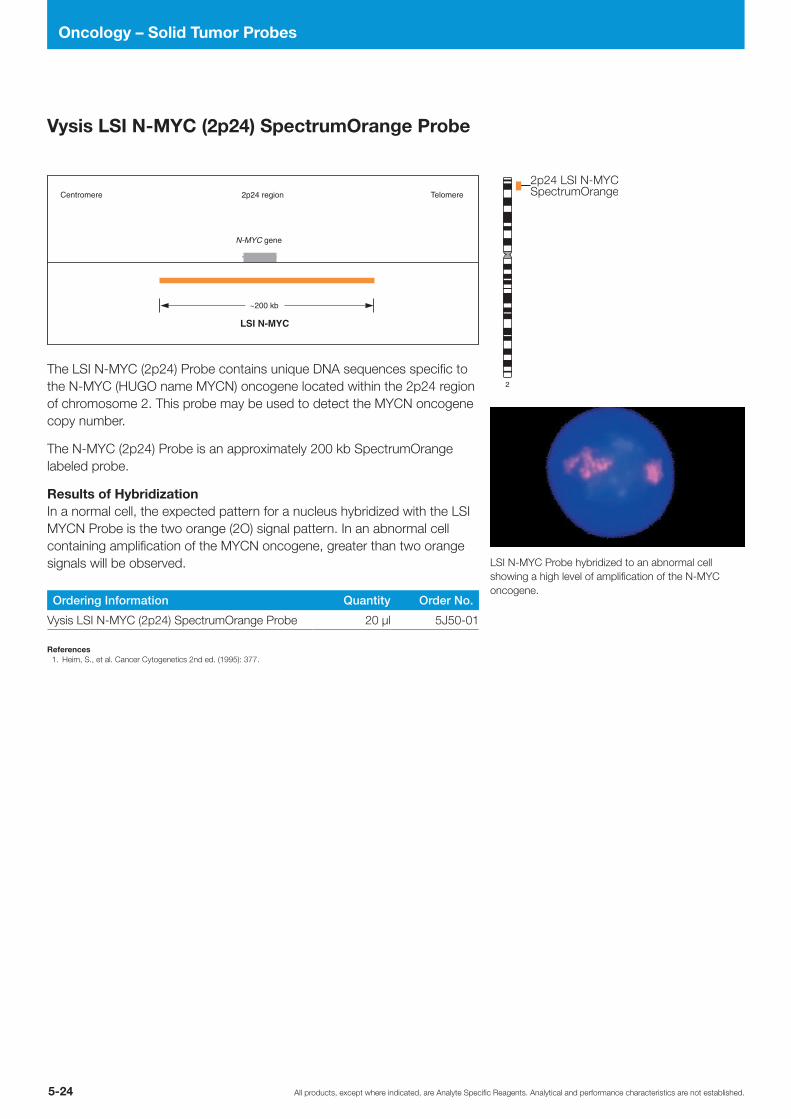
All products, except where indicated, are Analyte Specific Reagents. Analytical and performance characteristics are not established.5-24
Oncology – Solid Tumor Probes
2p24 region
LSI N-MYC
~200 kb
N-MYC gene
Centromere Telomere
2
The LSI N-MYC (2p24) Probe contains unique DNA sequences specific to the N-MYC (HUGO name MYCN) oncogene located within the 2p24 region of chromosome 2. This probe may be used to detect the MYCN oncogene copy number.
The N-MYC (2p24) Probe is an approximately 200 kb SpectrumOrange labeled probe.
Results of HybridizationIn a normal cell, the expected pattern for a nucleus hybridized with the LSI MYCN Probe is the two orange (2O) signal pattern. In an abnormal cell containing amplification of the MYCN oncogene, greater than two orange signals will be observed.
Ordering Information Quantity Order No.
Vysis LSI N-MYC (2p24) SpectrumOrange Probe 20 µl 5J50-01
References1. Heim, S., et al. Cancer Cytogenetics 2nd ed. (1995): 377.
LSI N-MYC Probe hybridized to an abnormal cell showing a high level of amplification of the N-MYC oncogene.
Vysis LSI N-MYC (2p24) SpectrumOrange Probe
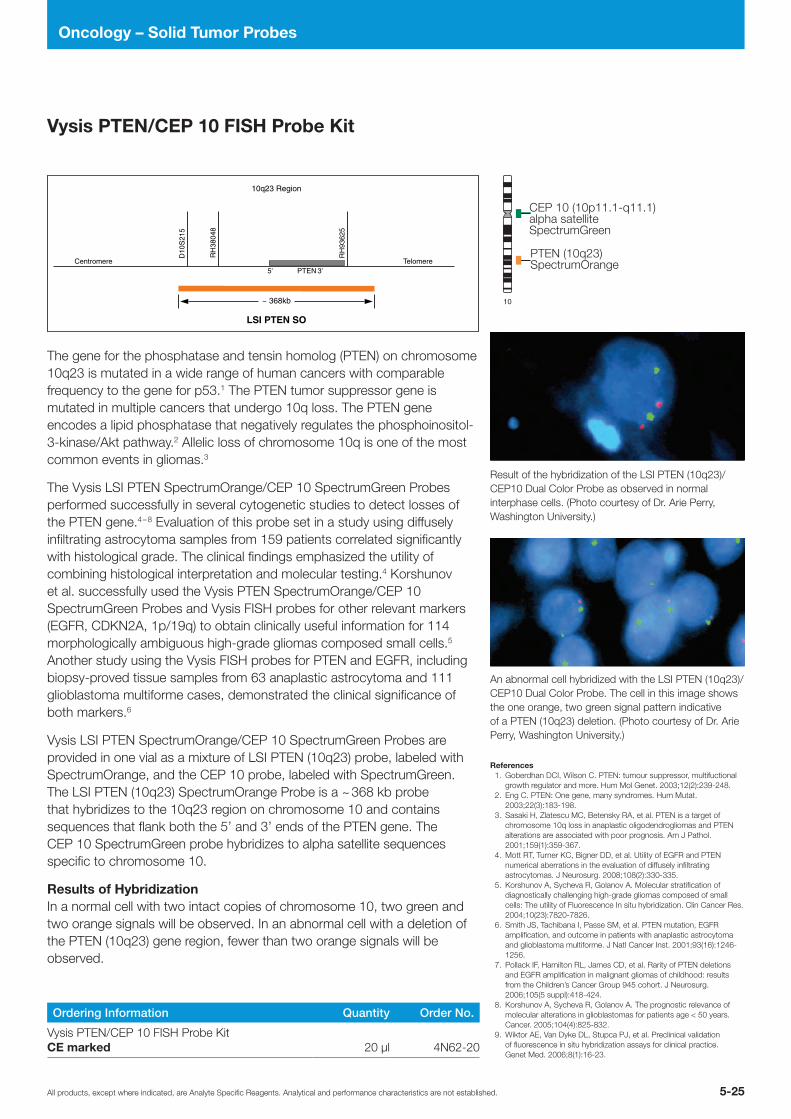
5-25All products, except where indicated, are Analyte Specific Reagents. Analytical and performance characteristics are not established.
Oncology – Solid Tumor Probes
Telomere
LSI PTEN SO
~ 368kb
10q23 RegionD
10S
215
RH
3804
8
RH
9362
5
Centromere TelomerePTEN5' 3'
10
The gene for the phosphatase and tensin homolog (PTEN) on chromosome 10q23 is mutated in a wide range of human cancers with comparable frequency to the gene for p53.1 The PTEN tumor suppressor gene is mutated in multiple cancers that undergo 10q loss. The PTEN gene encodes a lipid phosphatase that negatively regulates the phosphoinositol-3-kinase/Akt pathway.2 Allelic loss of chromosome 10q is one of the most common events in gliomas.3
The Vysis LSI PTEN SpectrumOrange/CEP 10 SpectrumGreen Probes performed successfully in several cytogenetic studies to detect losses of the PTEN gene.4 – 8 Evaluation of this probe set in a study using diffusely infiltrating astrocytoma samples from 159 patients correlated significantly with histological grade. The clinical findings emphasized the utility of combining histological interpretation and molecular testing.4 Korshunov et al. successfully used the Vysis PTEN SpectrumOrange/CEP 10 SpectrumGreen Probes and Vysis FISH probes for other relevant markers (EGFR, CDKN2A, 1p/19q) to obtain clinically useful information for 114 morphologically ambiguous high-grade gliomas composed small cells.5 Another study using the Vysis FISH probes for PTEN and EGFR, including biopsy-proved tissue samples from 63 anaplastic astrocytoma and 111 glioblastoma multiforme cases, demonstrated the clinical significance of both markers.6
Vysis LSI PTEN SpectrumOrange/CEP 10 SpectrumGreen Probes are provided in one vial as a mixture of LSI PTEN (10q23) probe, labeled with SpectrumOrange, and the CEP 10 probe, labeled with SpectrumGreen. The LSI PTEN (10q23) SpectrumOrange Probe is a ~ 368 kb probe that hybridizes to the 10q23 region on chromosome 10 and contains sequences that flank both the 5’ and 3’ ends of the PTEN gene. The CEP 10 SpectrumGreen probe hybridizes to alpha satellite sequences specific to chromosome 10.
Results of HybridizationIn a normal cell with two intact copies of chromosome 10, two green and two orange signals will be observed. In an abnormal cell with a deletion of the PTEN (10q23) gene region, fewer than two orange signals will be observed.
Ordering Information Quantity Order No.
Vysis PTEN/CEP 10 FISH Probe Kit CE marked 20 µl 4N62-20
References1. Goberdhan DCI, Wilson C. PTEN: tumour suppressor, multifuctional
growth regulator and more. Hum Mol Genet. 2003;12(2):239-248.2. Eng C. PTEN: One gene, many syndromes. Hum Mutat.
2003;22(3):183-198.3. Sasaki H, Zlatescu MC, Betensky RA, et al. PTEN is a target of
chromosome 10q loss in anaplastic oligodendrogliomas and PTEN alterations are associated with poor prognosis. Am J Pathol. 2001;159(1):359-367.
4. Mott RT, Turner KC, Bigner DD, et al. Utility of EGFR and PTEN numerical aberrations in the evaluation of diffusely infiltrating astrocytomas. J Neurosurg. 2008;108(2):330-335.
5. Korshunov A, Sycheva R, Golanov A. Molecular stratification of diagnostically challenging high-grade gliomas composed of small cells: The utility of Fluorescence In situ hybridization. Clin Cancer Res. 2004;10(23):7820-7826.
6. Smith JS, Tachibana I, Passe SM, et al. PTEN mutation, EGFR amplification, and outcome in patients with anaplastic astrocytoma and glioblastoma multiforme. J Natl Cancer Inst. 2001;93(16):1246-1256.
7. Pollack IF, Hamilton RL, James CD, et al. Rarity of PTEN deletions and EGFR amplification in malignant gliomas of childhood: results from the Children’s Cancer Group 945 cohort. J Neurosurg. 2006;105(5 suppl):418-424.
8. Korshunov A, Sycheva R, Golanov A. The prognostic relevance of molecular alterations in glioblastomas for patients age < 50 years. Cancer. 2005;104(4):825-832.
9. Wiktor AE, Van Dyke DL, Stupca PJ, et al. Preclinical validation of fluorescence in situ hybridization assays for clinical practice. Genet Med. 2006;8(1):16-23.
Result of the hybridization of the LSI PTEN (10q23)/CEP10 Dual Color Probe as observed in normal interphase cells. (Photo courtesy of Dr. Arie Perry, Washington University.)
An abnormal cell hybridized with the LSI PTEN (10q23)/CEP10 Dual Color Probe. The cell in this image shows the one orange, two green signal pattern indicative of a PTEN (10q23) deletion. (Photo courtesy of Dr. Arie Perry, Washington University.)
Vysis PTEN/CEP 10 FISH Probe Kit

All products, except where indicated, are Analyte Specific Reagents. Analytical and performance characteristics are not established.5-26
Oncology – Solid Tumor Probes
3'
Centromere Telomere
~1044 kb
SHGC
-140
887
D18S
516
D18S
517
RH79
212
UT72
51
SYT
56 kbGap
TAF 4BEHZF
18q11.2 Region
5'
~650 kb
18
Chromosomal rearrangements involving the SS18 gene located in the breakpoint region of chromosome 18q11.2 are common among synovial sarcoma soft tissue tumors.1 Several studies have indicated that the t(X;18)(p11.2;q11.2) translocation arises exclusively in synovial sarcoma (SS).2 Hybridization with the Vysis LSI SS18 (18q11.2) Dual Color, Break Apart Rearrangement probe will identify t(18q11.2) but not the specific transloca-tion partner.
The LSI SS18 Dual Color, Break Apart Rearrangement Probe consists of a mixture of two FISH DNA probes. The first probe, an ~650 kb probe labeled in SpectrumOrange, extends distally from the SS18 gene. The second probe labeled in SpectrumGreen lies 3’ or proximal to the SS18 gene and is approximately ~1040 kb in length.
Results of HybridizationIn a normal cell that lacks a t(18q11.2) in the SS18 gene region, a two fusion signal pattern will be observed, reflecting the two intact copies of SS18. In an abnormal cell with a simple t(18q11.2), a one fusion, one green and one orange signal pattern will be expected.
Ordering Information Quantity Order No.
Vysis SS18 Break Apart FISH Probe Kit CE marked 20 µl 3N61-20
References1. Sandberg A., et al. Cancer Genetics and Cytogenetics 133 (2002): 1-23.2. Dos Santos N., et al.Genes, Chromosomes and Cancer 30 (2001): 1-14. 3. Terry J., et al. Diagnostic Molecular Pathology 2005;14(2):77-82.4. Ten Heuvel SE, et al. Applied Immunohistochemistry & Molecular Morphology 2008;16(3):246-250.5. Laza A, et al. Archives of Pathology and Laboratory Medicine 2006;130:1199-1207.6. Subramaniam MM., et al. Cancer Genetics and Cytogenetics 2007;172:23-28.7. Amary MFC, et al. Modern Pathology 2007;20:482-496.
Vysis SS18 Break Apart FISH Probe Kitpreviously: Vysis LSI SYT (18q11.2) Dual Color, Break Apart Rearrangement Probe
Result of the hybridization of the LSI SS18 Break Apart FISH Probe showing the two fusion signal pattern as observed in normal interphase cells. (Photo courtesy of Arie Perrry, M.D., Washington University School of Medicine.)
Abnormal cells hybridized with the LSI SS18 Dual Color, Break Apart Rearrangement Probe. The cells in this image show the one fusion, one orange and one green signal pattern indicative of a rearrangement of one copy of the SYT gene region. (Photo courtesy of Arie Perry, M.D., Washington University School of Medicine.)
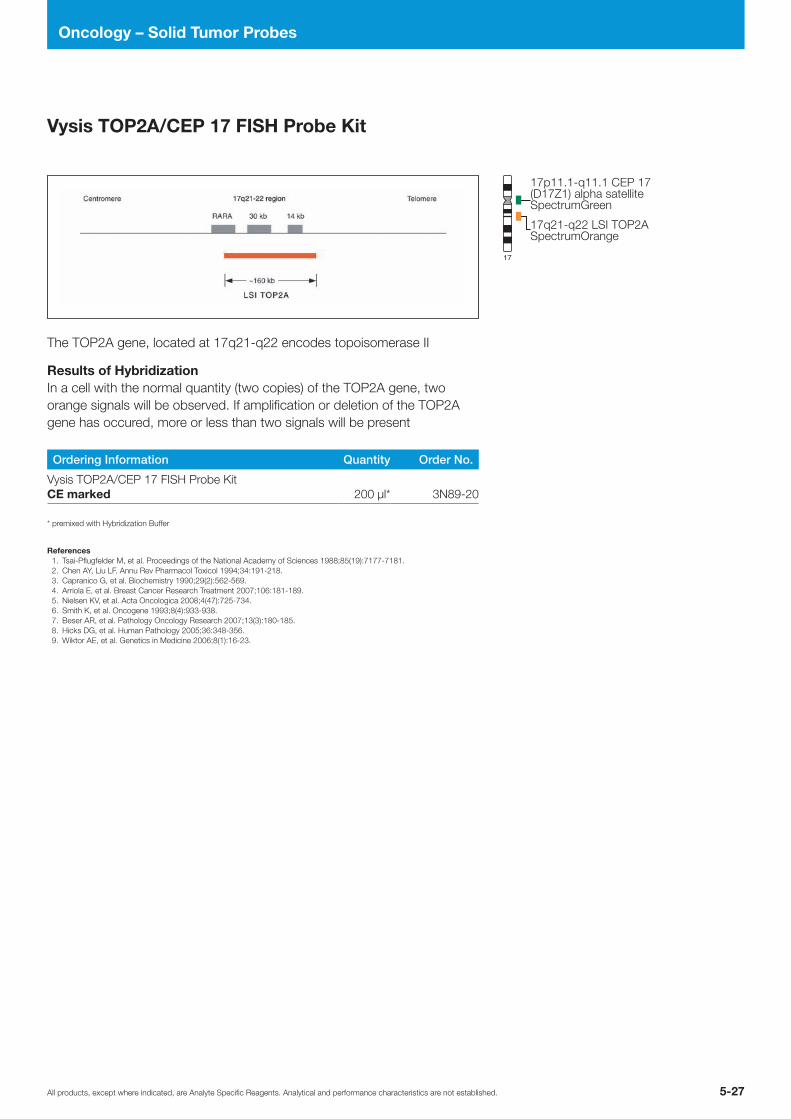
5-27All products, except where indicated, are Analyte Specific Reagents. Analytical and performance characteristics are not established.
Oncology – Solid Tumor Probes
The TOP2A gene, located at 17q21-q22 encodes topoisomerase II
Results of HybridizationIn a cell with the normal quantity (two copies) of the TOP2A gene, two orange signals will be observed. If amplification or deletion of the TOP2A gene has occured, more or less than two signals will be present
Ordering Information Quantity Order No.
Vysis TOP2A/CEP 17 FISH Probe Kit CE marked 200 µl* 3N89-20
* premixed with Hybridization Buffer
References1. Tsai-Pflugfelder M, et al. Proceedings of the National Academy of Sciences 1988;85(19):7177-7181.2. Chen AY, Liu LF. Annu Rev Pharmacol Toxicol 1994;34:191-218.3. Capranico G, et al. Biochemistry 1990;29(2):562-569.4. Arriola E, et al. Breast Cancer Research Treatment 2007;106:181-189.5. Nielsen KV, et al. Acta Oncologica 2008;4(47):725-734.6. Smith K, et al. Oncogene 1993;8(4):933-938.7. Beser AR, et al. Pathology Oncology Research 2007;13(3):180-185.8. Hicks DG, et al. Human Pathology 2005;36:348-356.9. Wiktor AE, et al. Genetics in Medicine 2006;8(1):16-23.
Vysis TOP2A/CEP 17 FISH Probe Kit
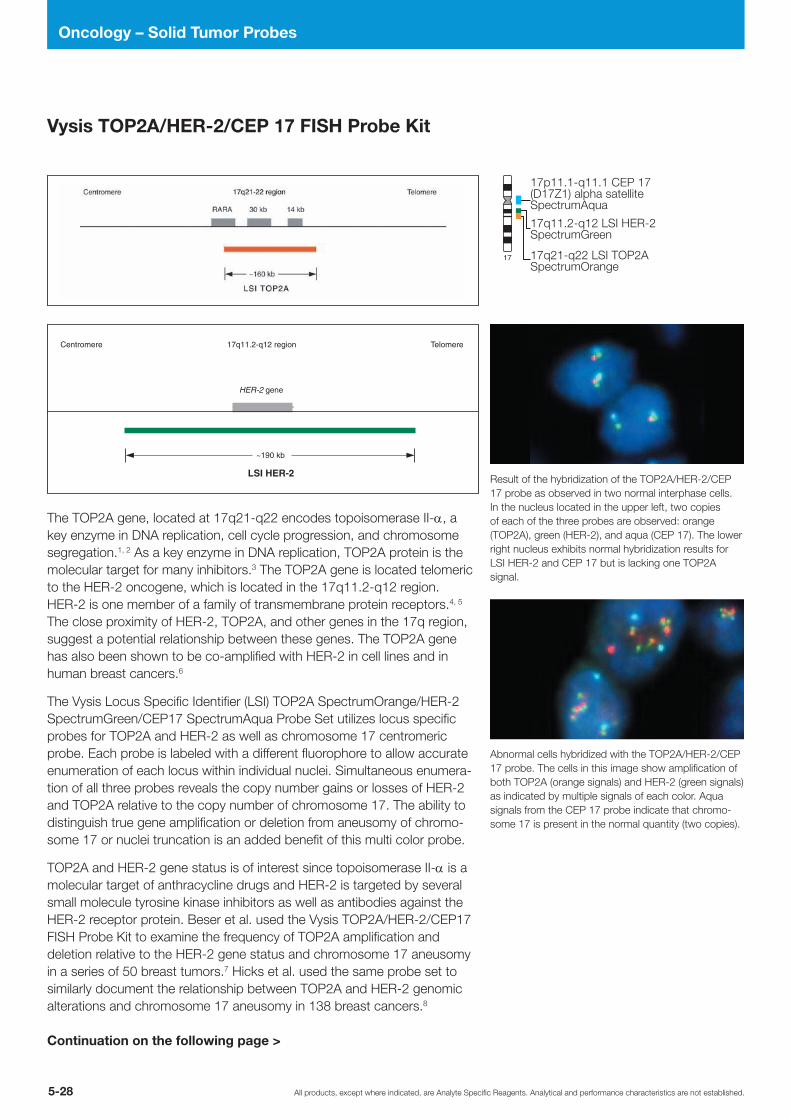
All products, except where indicated, are Analyte Specific Reagents. Analytical and performance characteristics are not established.5-28
Oncology – Solid Tumor Probes
17q11.2-q12 region
LSI HER-2
~190 kb
HER-2 gene
Centromere Telomere
The TOP2A gene, located at 17q21-q22 encodes topoisomerase II-α, a key enzyme in DNA replication, cell cycle progression, and chromosome segregation.1, 2 As a key enzyme in DNA replication, TOP2A protein is the molecular target for many inhibitors.3 The TOP2A gene is located telomeric to the HER-2 oncogene, which is located in the 17q11.2-q12 region. HER-2 is one member of a family of transmembrane protein receptors.4, 5 The close proximity of HER-2, TOP2A, and other genes in the 17q region, suggest a potential relationship between these genes. The TOP2A gene has also been shown to be co-amplified with HER-2 in cell lines and in human breast cancers.6
The Vysis Locus Specific Identifier (LSI) TOP2A SpectrumOrange/HER-2 SpectrumGreen/CEP17 SpectrumAqua Probe Set utilizes locus specific probes for TOP2A and HER-2 as well as chromosome 17 centromeric probe. Each probe is labeled with a different fluorophore to allow accurate enumeration of each locus within individual nuclei. Simultaneous enumera-tion of all three probes reveals the copy number gains or losses of HER-2 and TOP2A relative to the copy number of chromosome 17. The ability to distinguish true gene amplification or deletion from aneusomy of chromo-some 17 or nuclei truncation is an added benefit of this multi color probe.
TOP2A and HER-2 gene status is of interest since topoisomerase II-α is a molecular target of anthracycline drugs and HER-2 is targeted by several small molecule tyrosine kinase inhibitors as well as antibodies against the HER-2 receptor protein. Beser et al. used the Vysis TOP2A/HER-2/CEP17 FISH Probe Kit to examine the frequency of TOP2A amplification and deletion relative to the HER-2 gene status and chromosome 17 aneusomy in a series of 50 breast tumors.7 Hicks et al. used the same probe set to similarly document the relationship between TOP2A and HER-2 genomic alterations and chromosome 17 aneusomy in 138 breast cancers.8
Continuation on the following page >
Vysis TOP2A/HER-2/CEP 17 FISH Probe Kit
Result of the hybridization of the TOP2A/HER-2/CEP 17 probe as observed in two normal interphase cells. In the nucleus located in the upper left, two copies of each of the three probes are observed: orange (TOP2A), green (HER-2), and aqua (CEP 17). The lower right nucleus exhibits normal hybridization results for LSI HER-2 and CEP 17 but is lacking one TOP2A signal.
Abnormal cells hybridized with the TOP2A/HER-2/CEP 17 probe. The cells in this image show amplification of both TOP2A (orange signals) and HER-2 (green signals) as indicated by multiple signals of each color. Aqua signals from the CEP 17 probe indicate that chromo-some 17 is present in the normal quantity (two copies).
5-29All products, except where indicated, are Analyte Specific Reagents. Analytical and performance characteristics are not established.
Oncology – Solid Tumor Probes
LSI TOP2A is a single ~160 kb unique sequence probe that hybridizes to the 17q21-22 region containing the TOP2A gene. In both products, the probe is directly labeled with SpectrumOrange. The HER-2 probe that spans the entire HER-2 gene at 17q11.2-q12 is an an ~190 kb unique sequence probe. In the LSI TOP2A/HER-2/CEP 17 product, this probe is directly labeled with SpectrumGreen. The The CEP 17 probe, which hybridizes to alpha satellite DNA at 17p11.1-q11.1, is directly labeled with SpectrumGreen or SpectrumAqua SpectrumAqua in the LSI TOP2A/CEP 17 and LSI TOP2A/HER-2/CEP 17 products, respectively.
Results of HybridizationA nucleus with a normal quantity (two copies) of HER-2 will appear with two green signals. In a cell with the normal quantity (two copies) of the TOP2A gene, two orange signals will be observed. If amplification or deletion of the TOP2A gene has occurred, more or less than two signals will be present. Simultaneous enumeration of all three probes will reveal the copy number of each as well as the amplification or deletion status of TOP2A and HER-2 relative to chromosome 17 copy number. The ability to distinguish true gene amplification or deletion from aneusomy of chromosome 17 or nuclei truncation is an added benefit of this multi-color probe.
Ordering Information Quantity Order No.
Vysis TOP2A/HER-2/CEP 17 FISH Probe Kit CE marked 200 µl* 3N90-20
* premixed with Hybridization Buffer
References1. Sandberg A., et al. Cancer Genetics and Cytogenetics 133 (2002): 1-23.2. Dos Santos N., et al.Genes, Chromosomes and Cancer 30 (2001): 1-14. 3. Terry J., et al. Diagnostic Molecular Pathology 2005;14(2):77-82.4. Ten Heuvel SE, et al. Applied Immunohistochemistry & Molecular Morphology 2008;16(3):246-250.5. Laza A, et al. Archives of Pathology and Laboratory Medicine 2006;130:1199-1207.6. Subramaniam MM., et al. Cancer Genetics and Cytogenetics 2007;172:23-28.7. Amary MFC, et al. Modern Pathology 2007;20:482-496.
Continuation:Vysis TOP2A/HER-2/CEP 17 FISH Probe Kit
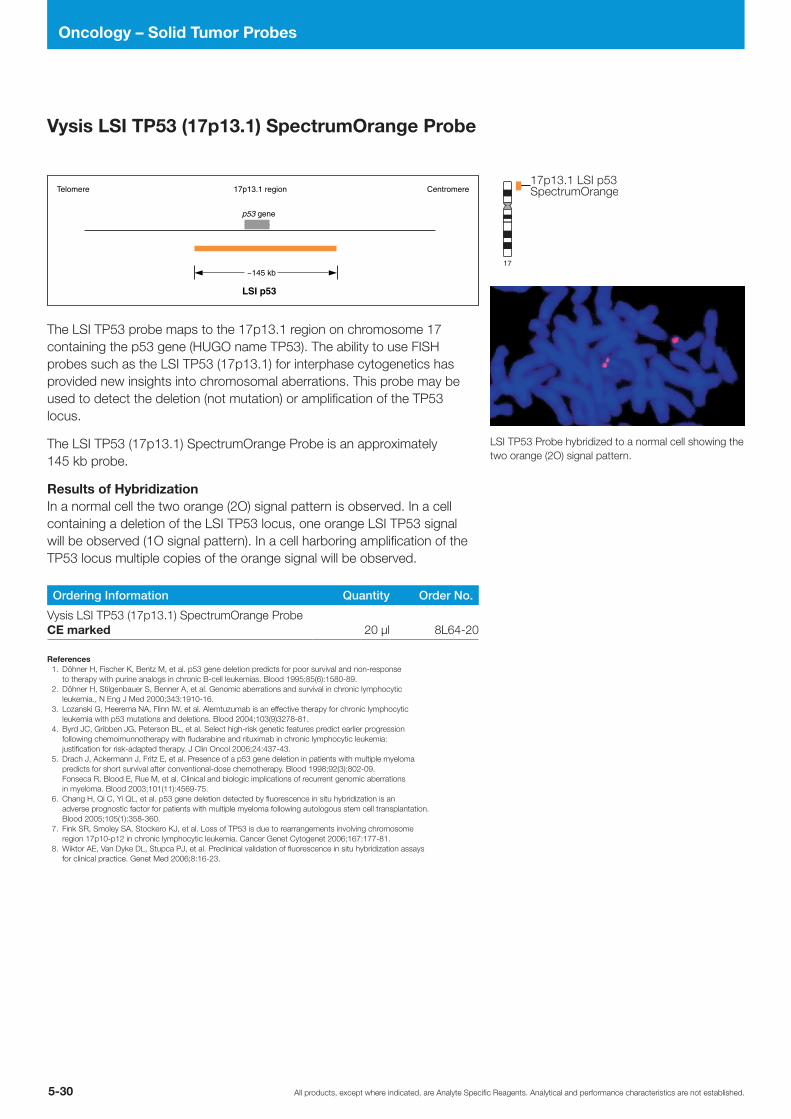
All products, except where indicated, are Analyte Specific Reagents. Analytical and performance characteristics are not established.5-30
Oncology – Solid Tumor Probes
p53 gene
LSI p53
17p13.1 regionTelomere Centromere
~145 kb17
The LSI TP53 probe maps to the 17p13.1 region on chromosome 17 containing the p53 gene (HUGO name TP53). The ability to use FISH probes such as the LSI TP53 (17p13.1) for interphase cytogenetics has provided new insights into chromosomal aberrations. This probe may be used to detect the deletion (not mutation) or amplification of the TP53 locus.
The LSI TP53 (17p13.1) SpectrumOrange Probe is an approximately 145 kb probe.
Results of HybridizationIn a normal cell the two orange (2O) signal pattern is observed. In a cell containing a deletion of the LSI TP53 locus, one orange LSI TP53 signal will be observed (1O signal pattern). In a cell harboring amplification of the TP53 locus multiple copies of the orange signal will be observed.
Ordering Information Quantity Order No.
Vysis LSI TP53 (17p13.1) SpectrumOrange Probe CE marked 20 µl 8L64-20
References1. Döhner H, Fischer K, Bentz M, et al. p53 gene deletion predicts for poor survival and non-response
to therapy with purine analogs in chronic B-cell leukemias. Blood 1995;85(6):1580-89.2. Döhner H, Stilgenbauer S, Benner A, et al. Genomic aberrations and survival in chronic lymphocytic
leukemia., N Eng J Med 2000;343:1910-16.3. Lozanski G, Heerema NA, Flinn IW, et al. Alemtuzumab is an effective therapy for chronic lymphocytic
leukemia with p53 mutations and deletions. Blood 2004;103(9)3278-81.4. Byrd JC, Gribben JG, Peterson BL, et al. Select high-risk genetic features predict earlier progression
following chemoimunnotherapy with fludarabine and rituximab in chronic lymphocytic leukemia: justification for risk-adapted therapy. J Clin Oncol 2006;24:437-43.
5. Drach J, Ackermann J, Fritz E, et al. Presence of a p53 gene deletion in patients with multiple myeloma predicts for short survival after conventional-dose chemotherapy. Blood 1998;92(3):802-09. Fonseca R, Blood E, Rue M, et al. Clinical and biologic implications of recurrent genomic aberrations in myeloma. Blood 2003;101(11):4569-75.
6. Chang H, Qi C, Yi QL, et al. p53 gene deletion detected by fluorescence in situ hybridization is an adverse prognostic factor for patients with multiple myeloma following autologous stem cell transplantation. Blood 2005;105(1):358-360.
7. Fink SR, Smoley SA, Stockero KJ, et al. Loss of TP53 is due to rearrangements involving chromosome region 17p10-p12 in chronic lymphocytic leukemia. Cancer Genet Cytogenet 2006;167:177-81.
8. Wiktor AE, Van Dyke DL, Stupca PJ, et al. Preclinical validation of fluorescence in situ hybridization assays for clinical practice. Genet Med 2006;8:16-23.
LSI TP53 Probe hybridized to a normal cell showing the two orange (2O) signal pattern.
Vysis LSI TP53 (17p13.1) SpectrumOrange Probe
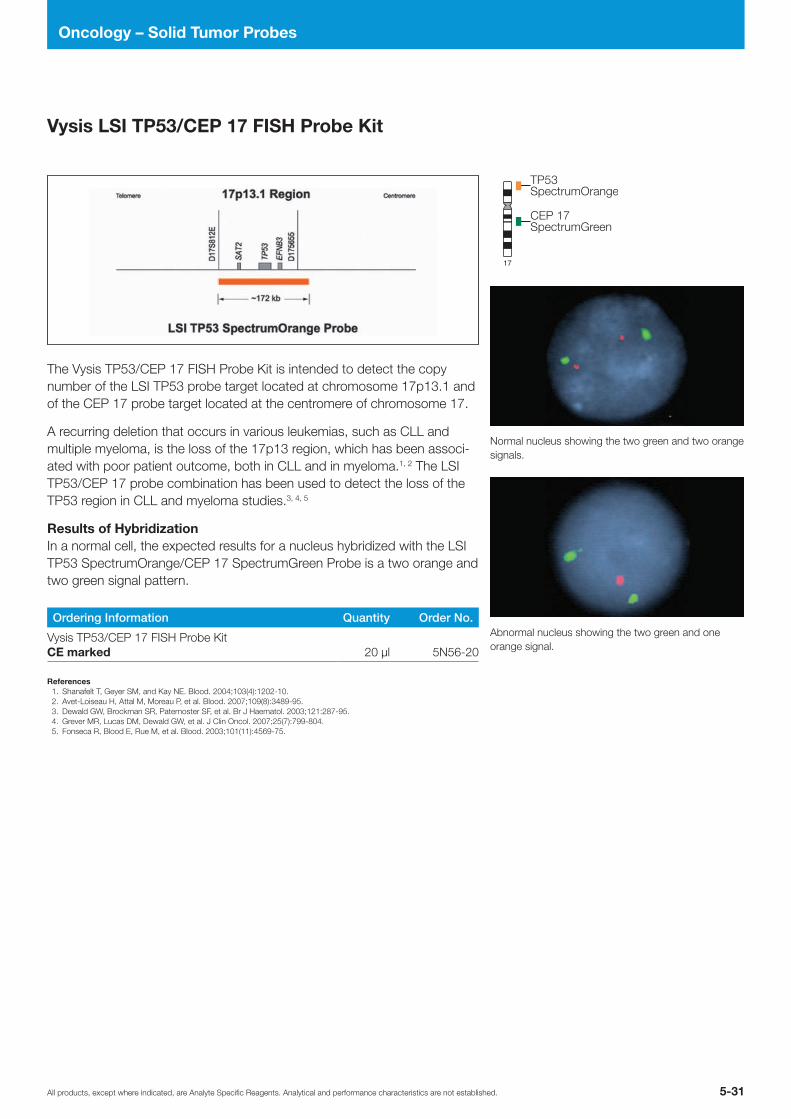
5-31All products, except where indicated, are Analyte Specific Reagents. Analytical and performance characteristics are not established.
Oncology – Solid Tumor Probes
17
The Vysis TP53/CEP 17 FISH Probe Kit is intended to detect the copy number of the LSI TP53 probe target located at chromosome 17p13.1 and of the CEP 17 probe target located at the centromere of chromosome 17.
A recurring deletion that occurs in various leukemias, such as CLL and multiple myeloma, is the loss of the 17p13 region, which has been associ-ated with poor patient outcome, both in CLL and in myeloma.1, 2 The LSI TP53/CEP 17 probe combination has been used to detect the loss of the TP53 region in CLL and myeloma studies.3, 4, 5
Results of HybridizationIn a normal cell, the expected results for a nucleus hybridized with the LSI TP53 SpectrumOrange/CEP 17 SpectrumGreen Probe is a two orange and two green signal pattern.
Ordering Information Quantity Order No.
Vysis TP53/CEP 17 FISH Probe Kit CE marked 20 µl 5N56-20
References1. Shanafelt T, Geyer SM, and Kay NE. Blood. 2004;103(4):1202-10. 2. Avet-Loiseau H, Attal M, Moreau P, et al. Blood. 2007;109(8):3489-95. 3. Dewald GW, Brockman SR, Paternoster SF, et al. Br J Haematol. 2003;121:287-95. 4. Grever MR, Lucas DM, Dewald GW, et al. J Clin Oncol. 2007;25(7):799-804. 5. Fonseca R, Blood E, Rue M, et al. Blood. 2003;101(11):4569-75.
Vysis LSI TP53/CEP 17 FISH Probe Kit
Abnormal nucleus showing the two green and one orange signal.
Normal nucleus showing the two green and two orange signals.

All products, except where indicated, are Analyte Specific Reagents. Analytical and performance characteristics are not established.5-32
Oncology – Solid Tumor Probes
20
Continuation on the following page >
Ordering Information Quantity Order No.
Vysis ZNF217 SpectrumGold FISH Probe Kit CE marked 20 µl 5N15-20
Vysis ZNF217 SpectrumGold FISH Probe Kit
LSI ZNF217 (20q13.2) SpectrumOrange hybridized to abnormal cells. Note multiple orange-pink signals contained within some cells indicate amplification of the ZNF217.
Ordering Information Quantity Order No.
Vysis ZNF217 SpectrumOrange FISH Probe Kit CE marked 20 µl 3N91-20
Vysis ZNF217 SpectrumOrange FISH Probe Kit
Ordering Information Quantity Order No.
Vysis ZNF217 SpectrumRed FISH Probe Kit CE marked 10 µl 5N16-10
Vysis ZNF217 SpectrumRed FISH Probe Kit

5-33All products, except where indicated, are Analyte Specific Reagents. Analytical and performance characteristics are not established.
Oncology – Solid Tumor Probes
The ZNF217 gene is a candidate oncogene suggested to play a key role during neoplastic transformation. ZNF217 is located at 20q13, a region that is frequently amplified in a variety of tumor types.1– 6 Amplification of ZNF217 in breast cancer is associated with aggressive tumor behaviour and poor clinical prognosis.7
The Vysis LSI ZNF217 (20q13.2) SpectrumOrange Probe was used in a study that indicated distinct differences in the role of genes known to be amplified in female breast cancer and their relevance for the pathogenesis of male breast cancer. In another study, fluorescence in situ hybridization was performed on 128 male breast tumors using the Vysis Spectrum-Orange LSI ZNF217 in addition to other Vysis probes including, LSI HER-2, LSI CCND1, LSI MYC, and the corresponding centromeric probes to evaluate the frequencey of amplification of the genes in MBC.8 A third study used the Vysis LSI ZNF217 SpectrumOrange** Probe to identify gain of ZNF217 as an important abnormality and prognostic factor in larynx tumorigenesis. For this study a tissue microarray consisting of 863 larynx carcinomas was analysed.9
The Vysis LSI ZNF217 SpectrumRed Probe is a single approximately 433 kb unique sequence probe direct labeled in SpectrumRed, that hybridizes to the 20q13.2 region of chromosome 20 and includes the 17.5 kb ZNF217 gene.
** Vysis LSI ZNF217 SpectrumOrange Probe was used in studies, which are referenced here. Vysis LSI ZNF217 SpectrumRed Probe hybridizes to the same sequence as the Vysis LSI ZNF217 SpectrumOrange Probe, but labeled with SpectrumRed Fluorophore.
Results of HybridizationWhen hybridized with the LSI ZNF217 Probe, a normal cell containing two copies of the 20q13.2 region will exhibit two signals. In a cell harboring amplification of the ZNF217 gene or 20q13.2 region, multiple copies of the gold, orange or red signal will be observed.
References1. Collins C, Rommens JM, Kowbel D, et al. Proceedings of the National Academy of Sciences USA 1998;95:8703-8708.2. Yang SH, Seo MY, Jeong HJ, et al. Clinical Cancer Research 2005;11:612-620.3. Iwabuchi H, Sakamoto M, Sakunaga H, et al. Cancer Research 1995;55(24):6172-6180.4. Zhu H, Lam DC, Han KC, et al. et al. Cancer Letters 2007;245:303-314.5. Bar-Shira A, Pinthus JH, Rozovsky U, et al. Cancer Research 2002;62(23):6803-6807.6. Lassmann S, Weis R, Markowiec F, et al. Journal of Molecular Medicine 2007;85(3):293-304.7. Tanner MM, Tirkkonen M, Kallioniemi A, et al. Clinical Cancer Research 1995;1:1455-1461.8. Bärlund M, Kuukasjärvi T, Syrjäkoski K, et al. International Journal of Cancer 2004;111:968-971.9. Koynova D, Tsenova V, Kunev K, et al. Biotechnology & Biotechnological Equipment 2006;128-131.
10. Wiktor AE, Van Dyke DL, Stupca PJ, et al. Genetics in Medicine 2006;8(1):16-23.
Continuation: Vysis ZNF217 SpectrumGold, SpectrumOrange & SpectrumRed FISH Probe Kit


6-1All products, except where indicated, are Analyte Specific Reagents. Analytical and performance characteristics are not established.
Oncology – Hematology
OncologyHematology
Abbott Molecular offers a wide range of DNA Fluorescence in situ Hybridization (FISH) products for the effective and rapid identification of genetic aberrations associated with hematopoietic disorders. Used as single probes, or in multicolor probe sets, these products are designed to identify various chromosome translocations, deletions, chromosomal gains, as well as other rearrangements associated with specific hematopoietic disorders. These probes can be applied to a variety of sample types prepared for metaphase or interphase analysis.
Vysis FISH technology for hematological disorders provides the following advantages:• Dual color, single fusion
• Useful in detecting high percentages of cells possessing a specific chromosomal translocation.
• The DNA probe hybridization targets are located on one side of each of the two genetic breakpoints.
• ES (Extra Signal)• Reduces the frequency of normal cells exhibiting an abnormal
FISH pattern due to the random colocalization of probe signals in a normal nucleus.
• One large probe spans one breakpoint, while the other probe flanks the breakpoint on the other gene.
• Dual color, break apart• Useful in cases where there may be multiple translocation partners associ
ated with a known genetic breakpoint. • This labeling scheme features two differently colored probes that hybridize to
targets on opposite sides of a breakpoint in one gene• Dual color, dual fusion
• Reduces the number of normal nuclei exhibiting abnormal signal patterns. • The probe offers advantages in detecting low levels of nuclei possessing a simple
balanced translocation. Large probes span two breakpoints on different chromosomes
The CEP 8 DNA Probe Kit is FDA cleared for use as an adjunct to standard karyotyping to identify and enumerate chromosome 8 in interphase and metaphase cells obtained from bone marrow in three hours or less. The CEP 12 DNA Probe Kit is FDA cleared as an adjunct to standard karyotyping to identify and enumerate chromosome 12 in interphase nuclei of cells obtained from peripheral blood lymphocytes in patients with Bcell chronic lymphocytic leukemia (BCLL) in 3 hours or less. The FDA Cleared CEP X/Y DNA Probe Kit may be used as an adjunct to standard karyotyping to evaluate engraftment success in recipients of sex mismatched bonemarrow transplantation by determining the proportion of XX and XY donor cells. See the respective package insert for details on the use of these products.
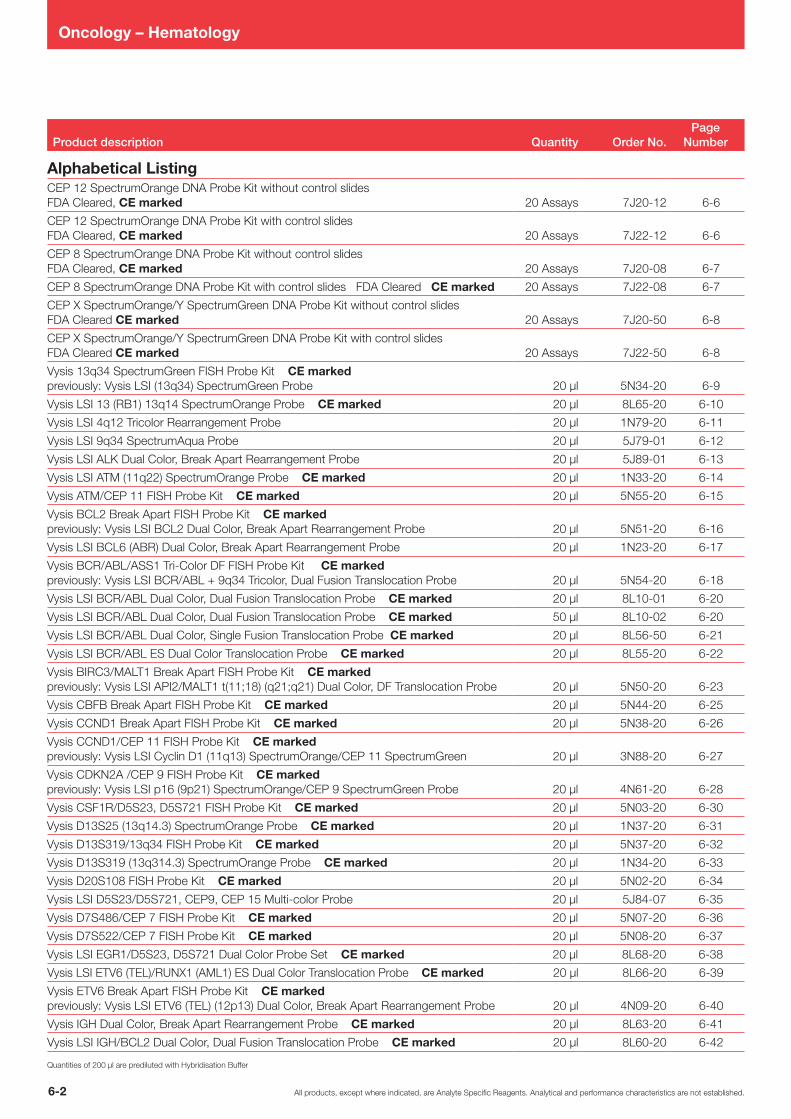
All products, except where indicated, are Analyte Specific Reagents. Analytical and performance characteristics are not established.6-2
Oncology – Hematology
Product description Quantity Order No.Page
Number
Alphabetical ListingCEP 12 SpectrumOrange DNA Probe Kit without control slides FDA Cleared, CE marked 20 Assays 7J2012 66
CEP 12 SpectrumOrange DNA Probe Kit with control slides FDA Cleared, CE marked 20 Assays 7J2212 66
CEP 8 SpectrumOrange DNA Probe Kit without control slides FDA Cleared, CE marked 20 Assays 7J2008 67
CEP 8 SpectrumOrange DNA Probe Kit with control slides FDA Cleared CE marked 20 Assays 7J2208 67
CEP X SpectrumOrange/Y SpectrumGreen DNA Probe Kit without control slides FDA Cleared CE marked 20 Assays 7J2050 68
CEP X SpectrumOrange/Y SpectrumGreen DNA Probe Kit with control slides FDA Cleared CE marked 20 Assays 7J2250 68
Vysis 13q34 SpectrumGreen FISH Probe Kit CE markedpreviously: Vysis LSI (13q34) SpectrumGreen Probe 20 µl 5N3420 69
Vysis LSI 13 (RB1) 13q14 SpectrumOrange Probe CE marked 20 µl 8L6520 610
Vysis LSI 4q12 Tricolor Rearrangement Probe 20 µl 1N7920 611
Vysis LSI 9q34 SpectrumAqua Probe 20 µl 5J7901 612
Vysis LSI ALK Dual Color, Break Apart Rearrangement Probe 20 µl 5J8901 613
Vysis LSI ATM (11q22) SpectrumOrange Probe CE marked 20 µl 1N3320 614
Vysis ATM/CEP 11 FISH Probe Kit CE marked 20 µl 5N5520 615
Vysis BCL2 Break Apart FISH Probe Kit CE marked previously: Vysis LSI BCL2 Dual Color, Break Apart Rearrangement Probe 20 µl 5N5120 616
Vysis LSI BCL6 (ABR) Dual Color, Break Apart Rearrangement Probe 20 µl 1N2320 617
Vysis BCR/ABL/ASS1 TriColor DF FISH Probe Kit CE markedpreviously: Vysis LSI BCR/ABL + 9q34 Tricolor, Dual Fusion Translocation Probe 20 µl 5N5420 618
Vysis LSI BCR/ABL Dual Color, Dual Fusion Translocation Probe CE marked 20 µl 8L1001 620
Vysis LSI BCR/ABL Dual Color, Dual Fusion Translocation Probe CE marked 50 µl 8L1002 620
Vysis LSI BCR/ABL Dual Color, Single Fusion Translocation Probe CE marked 20 µl 8L5650 621
Vysis LSI BCR/ABL ES Dual Color Translocation Probe CE marked 20 µl 8L5520 622
Vysis BIRC3/MALT1 Break Apart FISH Probe Kit CE markedpreviously: Vysis LSI API2/MALT1 t(11;18) (q21;q21) Dual Color, DF Translocation Probe 20 µl 5N5020 623
Vysis CBFB Break Apart FISH Probe Kit CE marked 20 µl 5N4420 625
Vysis CCND1 Break Apart FISH Probe Kit CE marked 20 µl 5N3820 626
Vysis CCND1/CEP 11 FISH Probe Kit CE marked previously: Vysis LSI Cyclin D1 (11q13) SpectrumOrange/CEP 11 SpectrumGreen 20 µl 3N8820 627
Vysis CDKN2A /CEP 9 FISH Probe Kit CE marked previously: Vysis LSI p16 (9p21) SpectrumOrange/CEP 9 SpectrumGreen Probe 20 µl 4N6120 628
Vysis CSF1R/D5S23, D5S721 FISH Probe Kit CE marked 20 µl 5N0320 630
Vysis D13S25 (13q14.3) SpectrumOrange Probe CE marked 20 µl 1N3720 631
Vysis D13S319/13q34 FISH Probe Kit CE marked 20 µl 5N3720 632
Vysis D13S319 (13q314.3) SpectrumOrange Probe CE marked 20 µl 1N3420 633
Vysis D20S108 FISH Probe Kit CE marked 20 µl 5N0220 634
Vysis LSI D5S23/D5S721, CEP9, CEP 15 Multicolor Probe 20 µl 5J8407 635
Vysis D7S486/CEP 7 FISH Probe Kit CE marked 20 µl 5N0720 636
Vysis D7S522/CEP 7 FISH Probe Kit CE marked 20 µl 5N0820 637
Vysis LSI EGR1/D5S23, D5S721 Dual Color Probe Set CE marked 20 µl 8L6820 638
Vysis LSI ETV6 (TEL)/RUNX1 (AML1) ES Dual Color Translocation Probe CE marked 20 µl 8L6620 639
Vysis ETV6 Break Apart FISH Probe Kit CE marked previously: Vysis LSI ETV6 (TEL) (12p13) Dual Color, Break Apart Rearrangement Probe 20 µl 4N0920 640
Vysis IGH Dual Color, Break Apart Rearrangement Probe CE marked 20 µl 8L6320 641
Vysis LSI IGH/BCL2 Dual Color, Dual Fusion Translocation Probe CE marked 20 µl 8L6020 642
Quantities of 200 µl are prediluted with Hybridisation Buffer

6-3All products, except where indicated, are Analyte Specific Reagents. Analytical and performance characteristics are not established.
Oncology – Hematology
Product description Quantity Order No.Page
Number
Alphabetical ListingVysis IGH/CCND1 DF FISH Probe Kit CE marked 20 µl 8L5820 643
Vysis IGH/CCND1 XT DF FISH Probe Kit CE marked 20 µl 5N3320 644
Vysis IGH/FGFR3 DF FISH Probe Kit CE marked 20 µl 1N6920 645
Vysis IGH/MAF DF FISH Probe Kit CE marked 20 µl 5N3220 646
Vysis IGH/MALT1 DF FISH Probe Kit CE marked 20 µl 5N4720 647
Vysis IGH/MYC/CEP 8 TriColor FISH Probe Kit CE marked 20 µl 4N1020 648
Vysis MALT1 Break Apart FISH Probe Kit CE marked 20 µl 5N4820 649
Vysis LSI MLL Dual Color, Break Apart Rearrangement Probe CE marked 20 µl 8L5720 650
Vysis MYB SpectrumAqua FISH Probe Kit CE marked 20 µl 5N4020 651
Vysis MYC Break Apart FISH Probe Kit CE marked 20 µl 1N6320 652
Vysis LSI p53/LSI ATM and LSI D13S319/LSI 13q34/CEP 12 Multicolor Probe CE marked 200 µl 8L5320 653
Vysis PML/RARA SF FISH Probe Kit CE marked 20 µl 5N4520 655
Vysis LSI PML/RARA Dual Color, Dual Fusion Translocation Probe CE marked 20 µl 1N3620 656
Vysis RARA Break Apart FISH Probe Kit CE marked 20 µl 5N4620 657
Vysis RUNX1/RUNX1T1 DF FISH Probe Kit CE markedpreviously: Vysis LSI AML1/ETO Dual Color, Dual Fusion Translocation Probe 20 µl 8L7020 658
Vysis LSI TCF3/PBX1 Dual Color, Dual Fusion Translocation Probe 20 µl 1N2420 659
Vysis TRA/D Break Apart FISH Probe Kit CE marked previously: Vysis LSI TCR alpha/delta Dual Color Break Apart Rearrangement Probe 20 µl 5N4120 660
Vysis LSI TP53 (17p13.1) SpectrumOrange Probe CE marked 20 µl 8L6420 661
Vysis TP53/CEP 17 FISH Probe Kit CE marked 20 µl 5N5620 662
Quantities of 200 µl are prediluted with Hybridisation Buffer
Listing by Disease StateACUTE LYMPHOCYTIC LEUKEMIA (ALL)
Vysis BCR/ABL/ASS1 TriColor DF FISH Probe Kit CE markedpreviously: Vysis LSI BCR/ABL + 9q34 Tricolor, Dual Fusion Translocation Probe 20 µl 5N5420 618
Vysis LSI BCR/ABL Dual Color, Dual Fusion Translocation Probe CE marked 20 µl 8L1001 620
Vysis LSI BCR/ABL Dual Color, Dual Fusion Translocation Probe CE marked 50 µl 8L1002 620
Vysis LSI BCR/ABL Dual Color, Single Fusion Translocation Probe CE marked 20 µl 8L5650 621
Vysis LSI BCR/ABL ES Dual Color Translocation Probe CE marked 20 µl 8L5520 622
Vysis CDKN2A/CEP 9 FISH Probe Kit CE marked previously: Vysis LSI p16 (9p21) SpectrumOrange/CEP 9 SpectrumGreen Probe 20 µl 4N6120 628
Vysis ETV6 Break Apart FISH Probe Kit CE marked 20 µl 4N0920 640
Vysis LSI ETV6 (TEL)/RUNX1 (AML1) ES Dual Color Translocation Probe CE marked previously: Vysis LSI TEL/AML1 ES Dual Color Translocation Probe 20 µl 8L6620 639
Vysis IGH/MYC/CEP 8 TriColor FISH Probe Kit CE marked 20 µl 4N1020 648
Vysis LSI MLL Dual Color, Break Apart Rearrangement Probe CE marked 20 µl 8L5720 650
Vysis MYB SpectrumAqua FISH Probe Kit CE marked 20 µl 5N4020 651
Vysis MYC Break Apart FISH Probe Kit CE marked 20 µl 1N6320 652
Vysis LSI TCF3/PBX1 Dual Color, Dual Fusion Translocation Probe 20 µl 1N2420 659
Vysis TRA/D Break Apart FISH Probe Kit CE marked previously: Vysis LSI TCR alpha/delta Dual Color Break Apart Rearrangement Probe 20 µl 5N4120 660
ACUTE MYELOID LEUKEMIA (AML)
CEP 8 SpectrumOrange DNA Probe Kit without control slides FDA Cleared, CE marked 20 Assays 7J2008 67
CEP 8 SpectrumOrange DNA Probe Kit with control slides FDA Cleared, CE marked 20 Assays 7J2208 67
Quantities of 200 µl are prediluted with Hybridisation Buffer
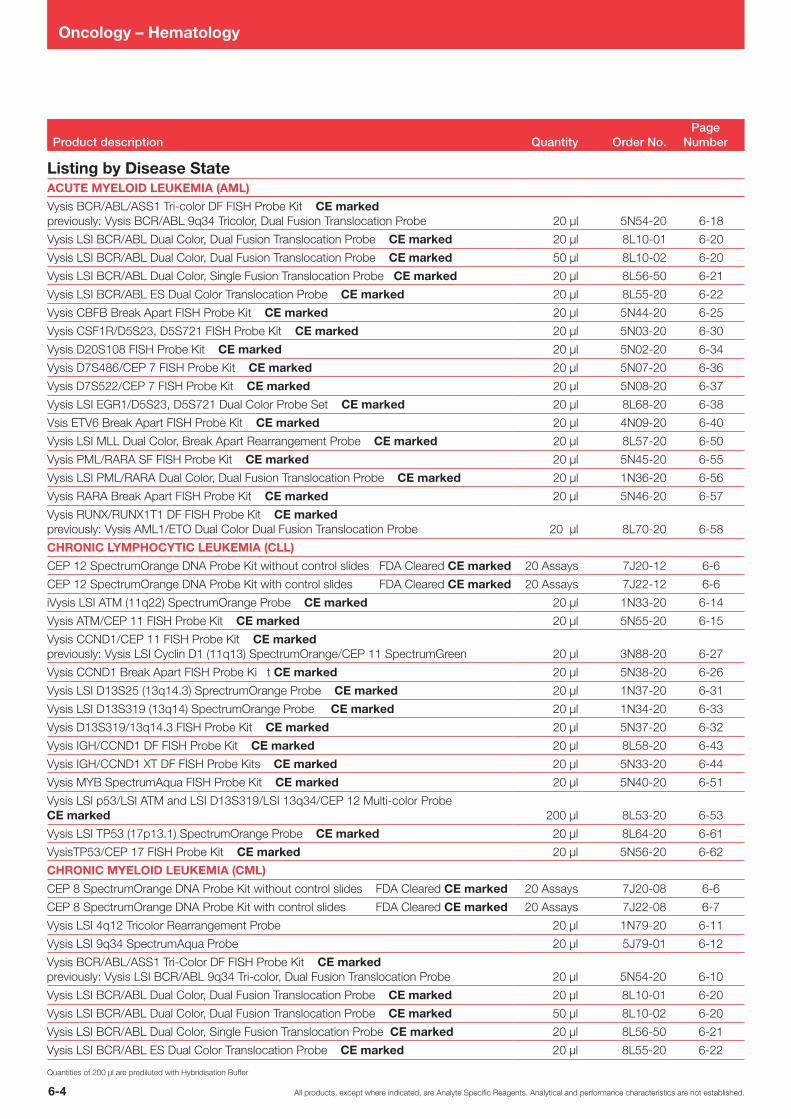
All products, except where indicated, are Analyte Specific Reagents. Analytical and performance characteristics are not established.6-4
Oncology – Hematology
Vysis BCR/ABL/ASS1 Tricolor DF FISH Probe Kit CE markedpreviously: Vysis BCR/ABL 9q34 Tricolor, Dual Fusion Translocation Probe 20 µl 5N5420 618
Vysis LSI BCR/ABL Dual Color, Dual Fusion Translocation Probe CE marked 20 µl 8L1001 620
Vysis LSI BCR/ABL Dual Color, Dual Fusion Translocation Probe CE marked 50 µl 8L1002 620
Vysis LSI BCR/ABL Dual Color, Single Fusion Translocation Probe CE marked 20 µl 8L5650 621
Vysis LSI BCR/ABL ES Dual Color Translocation Probe CE marked 20 µl 8L5520 622
Vysis CBFB Break Apart FISH Probe Kit CE marked 20 µl 5N4420 625
Vysis CSF1R/D5S23, D5S721 FISH Probe Kit CE marked 20 µl 5N0320 630
Vysis D20S108 FISH Probe Kit CE marked 20 µl 5N0220 634
Vysis D7S486/CEP 7 FISH Probe Kit CE marked 20 µl 5N0720 636
Vysis D7S522/CEP 7 FISH Probe Kit CE marked 20 µl 5N0820 637
Vysis LSI EGR1/D5S23, D5S721 Dual Color Probe Set CE marked 20 µl 8L6820 638
Vsis ETV6 Break Apart FISH Probe Kit CE marked 20 µl 4N0920 640
Vysis LSI MLL Dual Color, Break Apart Rearrangement Probe CE marked 20 µl 8L5720 650
Vysis PML/RARA SF FISH Probe Kit CE marked 20 µl 5N4520 655
Vysis LSI PML/RARA Dual Color, Dual Fusion Translocation Probe CE marked 20 µl 1N3620 656
Vysis RARA Break Apart FISH Probe Kit CE marked 20 µl 5N4620 657
Vysis RUNX/RUNX1T1 DF FISH Probe Kit CE markedpreviously: Vysis AML1/ETO Dual Color Dual Fusion Translocation Probe 20 µl 8L7020 658
CHRONIC LYMPHOCYTIC LEUKEMIA (CLL)
CEP 12 SpectrumOrange DNA Probe Kit without control slides FDA Cleared CE marked 20 Assays 7J2012 66
CEP 12 SpectrumOrange DNA Probe Kit with control slides FDA Cleared CE marked 20 Assays 7J2212 66
iVysis LSI ATM (11q22) SpectrumOrange Probe CE marked 20 µl 1N3320 614
Vysis ATM/CEP 11 FISH Probe Kit CE marked 20 µl 5N5520 615
Vysis CCND1/CEP 11 FISH Probe Kit CE marked previously: Vysis LSI Cyclin D1 (11q13) SpectrumOrange/CEP 11 SpectrumGreen 20 µl 3N8820 627
Vysis CCND1 Break Apart FISH Probe Ki t CE marked 20 µl 5N3820 626
Vysis LSI D13S25 (13q14.3) SprectrumOrange Probe CE marked 20 µl 1N3720 631
Vysis LSI D13S319 (13q14) SpectrumOrange Probe CE marked 20 µl 1N3420 633
Vysis D13S319/13q14.3 FISH Probe Kit CE marked 20 µl 5N3720 632
Vysis IGH/CCND1 DF FISH Probe Kit CE marked 20 µl 8L5820 643
Vysis IGH/CCND1 XT DF FISH Probe Kits CE marked 20 µl 5N3320 644
Vysis MYB SpectrumAqua FISH Probe Kit CE marked 20 µl 5N4020 651
Vysis LSI p53/LSI ATM and LSI D13S319/LSI 13q34/CEP 12 Multicolor Probe CE marked 200 µl 8L5320 653
Vysis LSI TP53 (17p13.1) SpectrumOrange Probe CE marked 20 µl 8L6420 661
VysisTP53/CEP 17 FISH Probe Kit CE marked 20 µl 5N5620 662
CHRONIC MYELOID LEUKEMIA (CML)
CEP 8 SpectrumOrange DNA Probe Kit without control slides FDA Cleared CE marked 20 Assays 7J2008 66
CEP 8 SpectrumOrange DNA Probe Kit with control slides FDA Cleared CE marked 20 Assays 7J2208 67
Vysis LSI 4q12 Tricolor Rearrangement Probe 20 µl 1N7920 611
Vysis LSI 9q34 SpectrumAqua Probe 20 µl 5J7901 612
Vysis BCR/ABL/ASS1 TriColor DF FISH Probe Kit CE markedpreviously: Vysis LSI BCR/ABL 9q34 Tricolor, Dual Fusion Translocation Probe 20 µl 5N5420 610
Vysis LSI BCR/ABL Dual Color, Dual Fusion Translocation Probe CE marked 20 µl 8L1001 620
Vysis LSI BCR/ABL Dual Color, Dual Fusion Translocation Probe CE marked 50 µl 8L1002 620
Vysis LSI BCR/ABL Dual Color, Single Fusion Translocation Probe CE marked 20 µl 8L5650 621
Vysis LSI BCR/ABL ES Dual Color Translocation Probe CE marked 20 µl 8L5520 622
Quantities of 200 µl are prediluted with Hybridisation Buffer
ACUTE MYELOID LEUKEMIA (AML)
Product description Quantity Order No.Page
Number
Listing by Disease State
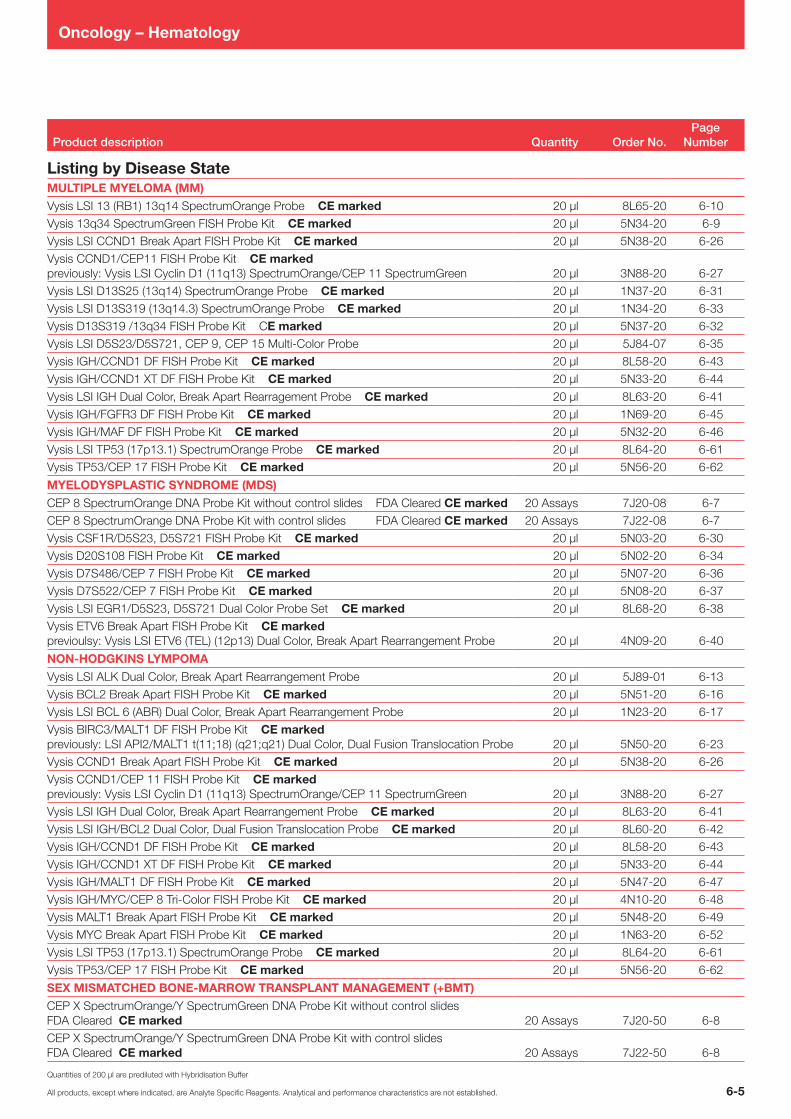
6-5All products, except where indicated, are Analyte Specific Reagents. Analytical and performance characteristics are not established.
Oncology – Hematology
MULTIPLE MYELOMA (MM)
Vysis LSI 13 (RB1) 13q14 SpectrumOrange Probe CE marked 20 µl 8L6520 610Vysis 13q34 SpectrumGreen FISH Probe Kit CE marked 20 µl 5N3420 69Vysis LSI CCND1 Break Apart FISH Probe Kit CE marked 20 µl 5N3820 626Vysis CCND1/CEP11 FISH Probe Kit CE markedpreviously: Vysis LSI Cyclin D1 (11q13) SpectrumOrange/CEP 11 SpectrumGreen 20 µl 3N8820 627Vysis LSI D13S25 (13q14) SpectrumOrange Probe CE marked 20 µl 1N3720 631Vysis LSI D13S319 (13q14.3) SpectrumOrange Probe CE marked 20 µl 1N3420 633Vysis D13S319 /13q34 FISH Probe Kit CE marked 20 µl 5N3720 632Vysis LSI D5S23/D5S721, CEP 9, CEP 15 MultiColor Probe 20 µl 5J8407 635Vysis IGH/CCND1 DF FISH Probe Kit CE marked 20 µl 8L5820 643Vysis IGH/CCND1 XT DF FISH Probe Kit CE marked 20 µl 5N3320 644
Vysis LSI IGH Dual Color, Break Apart Rearragement Probe CE marked 20 µl 8L6320 641Vysis IGH/FGFR3 DF FISH Probe Kit CE marked 20 µl 1N6920 645Vysis IGH/MAF DF FISH Probe Kit CE marked 20 µl 5N3220 646Vysis LSI TP53 (17p13.1) SpectrumOrange Probe CE marked 20 µl 8L6420 661Vysis TP53/CEP 17 FISH Probe Kit CE marked 20 µl 5N5620 662
MYELODYSPLASTIC SYNDROME (MDS)
CEP 8 SpectrumOrange DNA Probe Kit without control slides FDA Cleared CE marked 20 Assays 7J2008 67CEP 8 SpectrumOrange DNA Probe Kit with control slides FDA Cleared CE marked 20 Assays 7J2208 67Vysis CSF1R/D5S23, D5S721 FISH Probe Kit CE marked 20 µl 5N0320 630Vysis D20S108 FISH Probe Kit CE marked 20 µl 5N0220 634Vysis D7S486/CEP 7 FISH Probe Kit CE marked 20 µl 5N0720 636Vysis D7S522/CEP 7 FISH Probe Kit CE marked 20 µl 5N0820 637Vysis LSI EGR1/D5S23, D5S721 Dual Color Probe Set CE marked 20 µl 8L6820 638Vysis ETV6 Break Apart FISH Probe Kit CE markedprevioulsy: Vysis LSI ETV6 (TEL) (12p13) Dual Color, Break Apart Rearrangement Probe 20 µl 4N0920 640
NON-HODGKINS LYMPOMA
Vysis LSI ALK Dual Color, Break Apart Rearrangement Probe 20 µl 5J8901 613Vysis BCL2 Break Apart FISH Probe Kit CE marked 20 µl 5N5120 616Vysis LSI BCL 6 (ABR) Dual Color, Break Apart Rearrangement Probe 20 µl 1N2320 617Vysis BIRC3/MALT1 DF FISH Probe Kit CE markedpreviously: LSI API2/MALT1 t(11;18) (q21;q21) Dual Color, Dual Fusion Translocation Probe 20 µl 5N5020 623Vysis CCND1 Break Apart FISH Probe Kit CE marked 20 µl 5N3820 626Vysis CCND1/CEP 11 FISH Probe Kit CE marked previously: Vysis LSI Cyclin D1 (11q13) SpectrumOrange/CEP 11 SpectrumGreen 20 µl 3N8820 627Vysis LSI IGH Dual Color, Break Apart Rearrangement Probe CE marked 20 µl 8L6320 641Vysis LSI IGH/BCL2 Dual Color, Dual Fusion Translocation Probe CE marked 20 µl 8L6020 642Vysis IGH/CCND1 DF FISH Probe Kit CE marked 20 µl 8L5820 643Vysis IGH/CCND1 XT DF FISH Probe Kit CE marked 20 µl 5N3320 644Vysis IGH/MALT1 DF FISH Probe Kit CE marked 20 µl 5N4720 647Vysis IGH/MYC/CEP 8 TriColor FISH Probe Kit CE marked 20 µl 4N1020 648Vysis MALT1 Break Apart FISH Probe Kit CE marked 20 µl 5N4820 649Vysis MYC Break Apart FISH Probe Kit CE marked 20 µl 1N6320 652Vysis LSI TP53 (17p13.1) SpectrumOrange Probe CE marked 20 µl 8L6420 661Vysis TP53/CEP 17 FISH Probe Kit CE marked 20 µl 5N5620 662
SEX MISMATCHED BONE-MARROW TRANSPLANT MANAGEMENT (+BMT)
CEP X SpectrumOrange/Y SpectrumGreen DNA Probe Kit without control slides FDA Cleared CE marked 20 Assays 7J2050 68CEP X SpectrumOrange/Y SpectrumGreen DNA Probe Kit with control slides FDA Cleared CE marked 20 Assays 7J2250 68
Quantities of 200 µl are prediluted with Hybridisation Buffer
Product description Quantity Order No.Page
Number
Listing by Disease State

All products, except where indicated, are Analyte Specific Reagents. Analytical and performance characteristics are not established.6-6
Oncology – Hematology
12
CEP 12 SpectrumOrange DNA Probe Kit
CEP 12 DNA Probe is a SpectrumOrange labeled probe specific for the alpha satellite (centromeric) region, 12p11.1-q11.The CEP 12 DNA Probe Kit which is FDA cleared may be used as an adjunct to standard karotyping to identify and enumerate chromosome 12 in nuclei of cells obtained from peripheral blood lymphocytes in patients with Bcell chronic lymphocytic leukemia (BCLL). In multisite clinical trials, the CEP 12 analysis of interphase nuclei was 100 % sensitive and 91 % specific as compared to traditional cytogenetic analysis when adequate metaphase preparations could be produced. Results are available within 3 hours or less. Trisomy 12 is the most commonly reported chromosome aberration in CLL. Chromosomal aberrations, determined by cytogenetic analysis are present in up to 55 % of all BCLL cases. Trisomy 12 is present in 30 % of these cases, making it the most common cytogenetic abnormality in BCLL. Trisomy 12 has been associated with decreased overall survival and the need for earlier treatment.
Results of HybridizationIn a normal cell, the expected pattern for CEP 12 is the two orange (2O) signal pattern. In an abnormal cell containing trisomy 12, the expected pattern will be the three orange (3O) signal pattern.
Materials ProvidedMaterials provided with the CEP 12 DNA Probe Kit:
• CEP 12 DNA probe predenatured in hybridization buffer (200 µl)• NP40 (detergent for wash solution: 1000 µl)• DAPI II counterstain (300 µl)• 20X SSC (66 g)
Control slides for the CEP 12 kit are also sold separately. See Order No. 7J2101, Order No. 7J2102.
Ordering Information Quantity Order No.
CEP 12 SpectrumOrange DNA Probe Kit without control slides FDA Cleared CE marked 20 Assays 7J2012
CEP 12 SpectrumOrange DNA Probe Kit with control slides FDA Cleared CE marked 20 Assays 7J2212
References1. Byrd, J., et al. Clin. Cancer Res 4 (1998): 123541.2. Escudier, S., et al. Blood 81 (1993): 27027.3. Heim, S., et al. Cancer Cytogenetics 2nd ed. (1995): 377.4. Jenkins, R., et al. Blood 79 (1992): 330715.5. Najfeld,V., et al. Bone Marrow Trans. 19 (1997): 82934.
CEP 12 SpectrumOrange hybridized to a normal cell showing two orange signals indicating two copies of chromosome 12.

6-7All products, except where indicated, are Analyte Specific Reagents. Analytical and performance characteristics are not established.
Oncology – Hematology
8
CEP 8 SpectrumOrange DNA Probe Kit
CEP 8 is a SpectrumOrange labeled probe specific for the alpha satellite (centromeric) region, 8p11.1q11.1.
The CEP 8 DNA Probe Kit which is FDA cleared may be used as an adjunct to standard karotyping to identify and enumerate chromosome 8 in cells obtained from bone marrow. In multisite clinical trials, the CEP 8 DNA Probe Kit for interphase analysis was 96 % sensitive and 98 % specific as compared to traditional cytogenetic analysis. A close association has been made between trisomy 8 and both myeloid blast crisis and basophilia. Trisomy 8 is a prevalent genetic aberration in several specific diseases:
• Chronic Myelogenous Leukemia (CML)• Acute Myeloid Leukemia (AML)• Myeloproliferative disorders (MPD)• Myelodysplastic Syndrome (MDS)• Other hematologic disorders not specified (includes hyperproliferative
states such as polycythemia vera, leukemoid reaction, lymphoproliferative disorders or chronic lymphocytic leukemia)
Results of HybridizationIn a normal cell, the expected pattern for a nucleus hybridized with the CEP 8 probe is a two orange (2O) signal pattern. In an abnormal cell containing trisomy 8, the expected pattern will be the three orange (3O) signal pattern.
Components of the CEP 8 SpectrumOrange DNA Probe Kit include:
• CEP 8 SpectrumOrange alpha satellite DNA for centromere region 8p11.1q11.1 predenatured in hybridization buffer (200 µl)
• NP40 (detergent for wash solution: 1000 µl)• DAPI II counterstain (300 µl)• 20X SSC (66 g)
Control slides for the CEP 8 kit are also sold separately. See Order No. 7J2101 and Order No. 7J2102.
Ordering Information Quantitiy Order No.
CEP 8 SpectrumOrange DNA Probe Kit without control slides FDA Approved CE marked 20 Assays 7J2008
CEP 8 SpectrumOrange DNA Probe Kit with control slides FDA Approved CE marked 20 Assays 7J2208
References1. Byrd, J., et al. (1998) Clin Cancer Res 4, 123541.2. Escudier, S., et al. (1993) Blood 81, 27027.3. Heim, S. & Mitelman, F. (1995) Cancer Cytogenetics 2nd ed. New York City, NY, John Wiley & Sons.4. Jenkins, R., et al. (1992) Blood 79, 330715.5. Najfeld, V., et al (1997) Bone Marrow Trans 19, 82934.
CEP 8 SpectrumOrange hybridized to a normal cell showing two orange signals indicating two copies of chromosome 8.
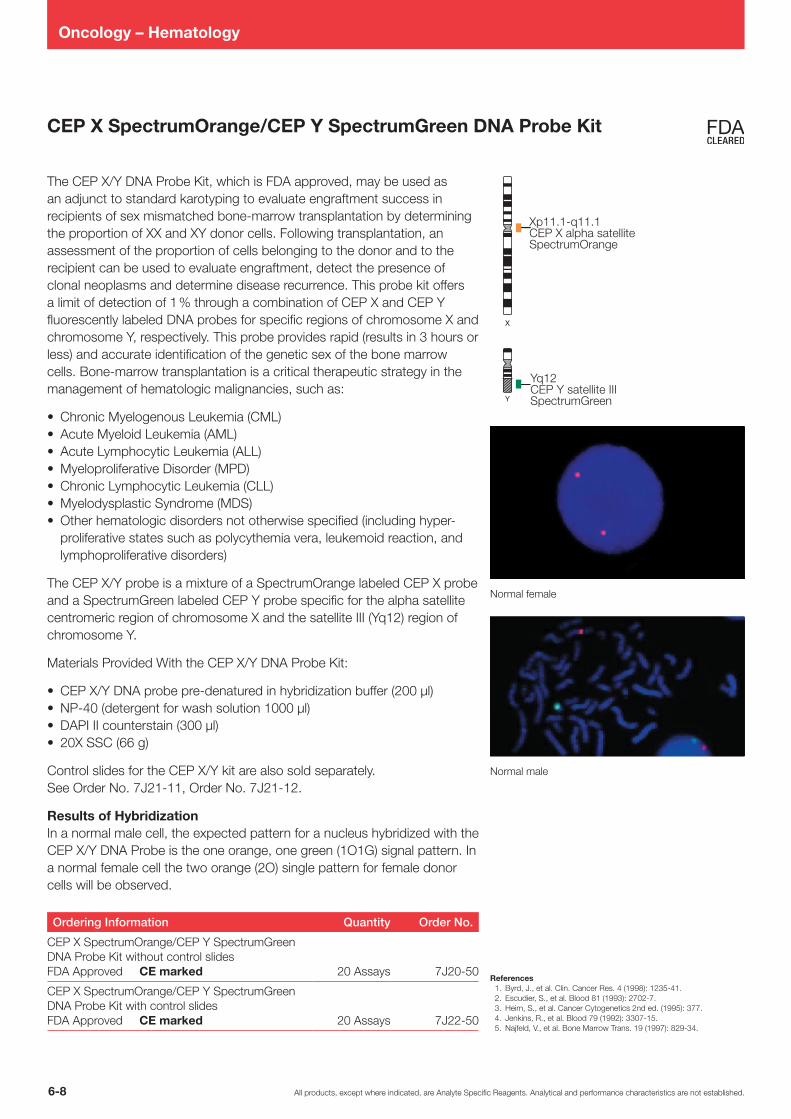
All products, except where indicated, are Analyte Specific Reagents. Analytical and performance characteristics are not established.6-8
Oncology – Hematology
X
Y
CEP X SpectrumOrange/CEP Y SpectrumGreen DNA Probe Kit
Normal female
The CEP X/Y DNA Probe Kit, which is FDA approved, may be used as an adjunct to standard karotyping to evaluate engraftment success in recipients of sex mismatched bonemarrow transplantation by determining the proportion of XX and XY donor cells. Following transplantation, an assessment of the proportion of cells belonging to the donor and to the recipient can be used to evaluate engraftment, detect the presence of clonal neoplasms and determine disease recurrence. This probe kit offers a limit of detection of 1 % through a combination of CEP X and CEP Y fluorescently labeled DNA probes for specific regions of chromosome X and chromosome Y, respectively. This probe provides rapid (results in 3 hours or less) and accurate identification of the genetic sex of the bone marrow cells. Bonemarrow transplantation is a critical therapeutic strategy in the management of hematologic malignancies, such as:
• Chronic Myelogenous Leukemia (CML)• Acute Myeloid Leukemia (AML)• Acute Lymphocytic Leukemia (ALL)• Myeloproliferative Disorder (MPD)• Chronic Lymphocytic Leukemia (CLL)• Myelodysplastic Syndrome (MDS)• Other hematologic disorders not otherwise specified (including hyper
proliferative states such as polycythemia vera, leukemoid reaction, and lymphoproliferative disorders)
The CEP X/Y probe is a mixture of a SpectrumOrange labeled CEP X probe and a SpectrumGreen labeled CEP Y probe specific for the alpha satellite centromeric region of chromosome X and the satellite III (Yq12) region of chromosome Y.
Materials Provided With the CEP X/Y DNA Probe Kit:
• CEP X/Y DNA probe predenatured in hybridization buffer (200 µl)• NP40 (detergent for wash solution 1000 µl)• DAPI II counterstain (300 µl)• 20X SSC (66 g)
Control slides for the CEP X/Y kit are also sold separately. See Order No. 7J2111, Order No. 7J2112.
Results of HybridizationIn a normal male cell, the expected pattern for a nucleus hybridized with the CEP X/Y DNA Probe is the one orange, one green (1O1G) signal pattern. In a normal female cell the two orange (2O) single pattern for female donor cells will be observed.
Ordering Information Quantity Order No.
CEP X SpectrumOrange/CEP Y SpectrumGreen DNA Probe Kit without control slides FDA Approved CE marked 20 Assays 7J2050
CEP X SpectrumOrange/CEP Y SpectrumGreen DNA Probe Kit with control slides FDA Approved CE marked 20 Assays 7J2250
Normal male
References1. Byrd, J., et al. Clin. Cancer Res. 4 (1998): 123541.2. Escudier, S., et al. Blood 81 (1993): 27027.3. Heim, S., et al. Cancer Cytogenetics 2nd ed. (1995): 377.4. Jenkins, R., et al. Blood 79 (1992): 330715.5. Najfeld, V., et al. Bone Marrow Trans. 19 (1997): 82934.

6-9All products, except where indicated, are Analyte Specific Reagents. Analytical and performance characteristics are not established.
Oncology – Hematology
Vysis 13q34 SpectrumGreen FISH Probe Kitpreviously: Vysis LSI (13q34) Spectrum Green Probe
This fluorescence in situ hybridization (FISH) probe is intended to detect the copy number of the LSI 13q34 probe target located at chromosome 13q34.
Genetic aberrations of chromosome 13, especially 13q and monosomy, are common in hematopoietic disorders. Deletions of 13q14 have been detected in 30 – 50 % of multiple myeloma patients. The differentiation of an interstitial deletion from loss of the entire q arm is made difficult for lack of a more telomeric marker. The LSI 13q34 probe is located near the telomere region of the q arm.1, 2
The Vysis LSI 13q34 SpectrumGreen Probe has been used to detect copy number abnormalities of the LSI 13q34 probe target in multiple myeloma samples.3, 4
Results of HybridizationIn a normal cell with two intact copies of chromosome 13, two green signals will be observed. In an abnormal cell that has lost the 13q34 region of chromosome 13, fewer than two green signals will be observed.
Ordering Information Quantity Order No.
Vysis 13q34 SpectrumGreen FISH Probe Kit CE marked 20 µl 5N3420
References1. Fonseca R, Oken MM, Harrington D,et al. Leukemia 2001;15:981?986.2. Fonseca R, Harrington D, Oken MM, et al. Cancer Research 2002;62:715720.3. Takimoto M, Ogawa K, Kato Y, et al. International Journal of Hematology 2008;87:260265.4. Slovak ML, Bedell V, Pagel K, et al. Cancer Genetics and Cytogenetics 2005;158:99109.
Result of the hybridization of the LSI 13q34 Probe as observed in a normal interphase cell.
Abnormal cell hybridized with the LSI 13q34 Probe. The cell in this image shows deletion of one copy of the 13q34 region of chromosome 13 as indicated by the single green signal.

All products, except where indicated, are Analyte Specific Reagents. Analytical and performance characteristics are not established.6-10
Oncology – Hematology
13q14 region
LSI 13 (RB1)
5' 3'
~220 kb
RB1 gene
Centromere Telomere
13
Vysis LSI 13 (RB1) 13q14 SpectrumOrange Probe
The LSI 13 (RB1) 13q14 SpectrumOrange Probe contains unique DNA sequences specific to the RB1 gene within the 13q14 region of chromosome 13. The presence or absence of the RB1 gene region may be detected using the LSI 13 (RB1) 13q14 Probe. This probe may be used to detect deletion (not mutation) of the RB1 gene locus.
The LSI 13 (RB1) 13q14 SpectrumOrange Probe is approximately 220 kb and contains sequences that target the entire RB1 gene
Results of HybridizationIn a normal cell, the expected result for a nucleus hybridized with the LSI 13 (RB1) probe is a two orange (2O) signal pattern. In a hybridized abnormal cell containing the deletion, a one orange (1O) signal pattern will be observed.
Ordering Information Quantity Order No.
Vysis LSI 13 (RB1) 13q14 SpectrumOrange Probe CE marked 20 µl 8L6520
References1. Amare PS, Ghule P, Jose J, et al. Constitutional genomic instability, chromosome aberrations
in tumor cells an retinoblastoma. Cancer Genet Cytogenet 2004; 150: 3343.2. Elnenaei MO, Hamoudi RA, Swansbury J, et al. Delineation of the minimal region of loss
at 13q14 in multiple myeloma. Genes Chromosomes Cancer 2003; 36: 99106.3. Fonseca R, Oken MM, Harrington D, et al. Deletions of chromosome 13 in multiple myeloma
identified by interphase FISH usually denote large deletions of the q arm or monosomy. Leukemia 2001; 15: 98186.
4. Kalachikov S, Migliazze A, Cayanis E, et al. Cloning and gene mapping of the chromosome 13q14 region deleted in chronic lymphocytic leukemia. Genomics 1997; 42: 36977
5. Stilgenbauer S, Nickolenko J, Wilhelm J, et al. Expressed sequences as candidates for a novel tumor suppressor gene at band 13q14 in Bcell chronic lymphocytic leukemia and mantle cell lymphoma. Oncogene 1998; 16: 189197.
6. Wiktor AE, Van Dyke DL, Stupca PJ, et al. Preclinical validation of fluorescence in situ hybridization assays for clinical practice. Genet Med 2006; 8: 1623.
LSI 13 (RB1) SpectrumOrange hybridized to a normal cultured amniocyte.

6-11All products, except where indicated, are Analyte Specific Reagents. Analytical and performance characteristics are not established.
Oncology – Hematology
LSI 4q12 Tricolor Rearrangement Probe
4q12 Region Centromere Telomere
~700 kb ~450 kb ~180 kb
gap
SC
FD
2
LNX
FIP
1L1
CH
IC2
SH
GC
-107
185
PD
GF
RA
SH
GC
-509
25
KIT
SH
GC
-101
431
~770 kb ~350 kb
gap
5’ 5’3’ 3’
4
Vysis LSI 4q12 Tricolor Rearrangement Probe
The Vysis LSI 4q12 TriColor Rearrangement Probe consists of three differently colored probes all located in the FIP1L1PDGFRA region of chromosome 4q12. The SpectrumGreen probe begins approximately 75 kb centromeric to the FIP1L1 gene and extends toward the centromere for approximately 700 kb. The SpectrumOrange probe starts about 25 kb telomeric of the FIP1L1 gene, extends toward the 4q telomere for about 450 kb, and contains the LNX gene. The SpectrumAqua probe begins between exons 15 and 16 of the PDGFRA gene, extends toward the 4q telomere for approximately 770 kb, and contains the KIT gene.
Results of HybridizationIn interphase nuclei of normal cells, the probe is expected to appear as two tricolor (green, orange, aqua) fusions. In these fusions,overlapping orange and green signals may be perceived as yellow fusion signals with appropriate filters. FISH signal patterns in nuclei having interstitial deletions of the orange probe target on one chromosome 4 homolog should be observed as one tricolor fusion and one green/aqua fusion lacking an orange signal. If the intervening orange probe target is not deleted, but relocated to another separate chromosomal location, the expected pattern would be one tricolor fusion, one green/aqua fusion and one lone orange signal. In instances of translocations involving the PDGFRA gene with loci on other chromosomes, the expected signal pattern would be one tricolor fusion, one orange/green fusion, and one separate aqua signal.
Ordering Information Quantity Order No.
Vysis LSI 4q12 Tricolor Rearrangement Probe 20 µl 1N7920
Figure 1. Normal nucleus showing the two tricolor green/orange/aqua fusion signals.
Figure 2. Abnormal nucleus showing the one tricolor green/orange/aqua fusion signal and one green/aqua fusion signal with the orange signal deleted.

All products, except where indicated, are Analyte Specific Reagents. Analytical and performance characteristics are not established.6-12
Oncology – Hematology
9~270 kb
ASS PRDM12 RRP4 ABL
Centromere Telomere9q34 region
LSI 9q34
Vysis LSI 9q34 SpectrumAqua Probe
The t(9;22) translocation is a characteristic molecular feature of certain types of leukemia cells. Frequently, this translocation creates the BCRABL fusion gene, which encodes a functional, chimeric tyrosine kinase. Several studies have reported the detection of large chromosomal deletions on either side of the t(9:22) breakpoint that are believed to occur at the time of the initial translocation. The deletions can span several megabases but typically include the 9q34 region around the Argininosuccinate Synthetase (ASS) gene.
The LSI 9q34 probe is a single ~270 kb unique sequence probe that hybridizes to the 9q34 region containing the ASS gene. The probe is labeled with SpectrumAqua.
Results of HybridizationThis probe is provided for those interested in assessing the deletion status of the 9q34 region of chromosome 9. In a normal cell with two intact copies of chromosome 9, two aqua signals will be observed. In an abnormal cell that has lost the 9q34 region of chromosome 9, fewer than two aqua signals will be observed.
Ordering Information Quantity Order No.
Vysis LSI 9q34 SpectrumAqua Probe 20 µl 5J7901
References1. Faderl, S., et al. N. Eng. J.Med. 341 (1999): 167172.2. Deininger, M., et al. Blood 96 (2000): 33433356.3. Sawyers, C. N. Eng. J.Med. 340 (1999): 13301340.4. Heisterkamp, N., et al. Nature 344 (1990): 251253.5. Pear, W., et al. Blood 92 (1998): 37803792.6. Honda, H., et al. Blood 91 (1998): 20672075.7. Grand, F., et al. Cancer Res. 59 (1999): 38703874.8. Dewald, G., et al. Leuk. Lymphoma 34 (1999): 481491.9. Herens, C., et al. Br. J. Haematol. 110 (2000): 214216.
10. Sinclair, P.B., et al. Blood 95 (2000): 738744.11. Huntly, B.J.P., et al. Blood 98 (2001): 17321738.
Result of the hybridization of the LSI 9q34 Probe as observed in a normal interphase cell.
Abnormal cell hybridized with the LSI 9q34 Probe. The cell in this image shows deletion of one copy of the 9q34 region of chromosome 9 as indicated by the single aqua signal.

6-13All products, except where indicated, are Analyte Specific Reagents. Analytical and performance characteristics are not established.
Oncology – Hematology
2p23 regionTelomere Centromere
LSI ALK
~250 kb ~300 kb
t(2:5) genebreakpoint region
3' 5'
2
Vysis LSI ALK Dual Color, Break Apart Rearrangement Probe
The LSI ALK (Anaplastic Lymphoma Kinase) Dual Color, Break Apart Rearrangement Probe is designed to detect the known 2p23 rearrangements that occur in t(2;5) and its variants. The t(2;5) has been shown to fuse the nucleophosmin (NPM) gene located on chromosome 5q35 with the gene on chromosome 2p232. This NPM/ALK gene fusion gives rise to a chimeric protein that is overexpressed.
The LSI ALK Dual Color, Break Apart Rearrangement Probe contains two differently labeled probes on opposite sides of the breakpoint of the ALK gene. An approximately 250 kb probe for the telomeric side of the ALK breakpoint is labeled with SpectrumOrange. The centromeric probe is approximately 300 kb and labeled with SpectrumGreen.
Results of HybridizationWhen hybridized with the LSI ALK Dual Color, Break Apart Rearrangement Probe, the 2p23 ALK region in its native state will be seen as two immediately adjacent or fused orange/green (yellow) signals (2F). However, if a t(2;5) or other chromosome rearrangement at the 2p23 ALK breakpoint region has occurred, one orange and one green signal will be seen, while the native ALK region will remain as an orange/green fusion signal (1O1G1F). The hybridization result of the LSI ALK Dual Color, Break Apart Rearrangement Probe containing the t(2;5) translocation will be the centromeric green probe remaining at 2p23, while the telomeric orange signal that covers the region is translocated to 5q35 on the derivative chromosome.
Ordering Information Quantity Order No.
Vysis LSI ALK Dual Color, Break Apart Rearrangement Probe 20 µl 5J8901
LSI ALK Dual Color, Break Apart Rearrangement Probe hybridized to normal nuclei lacking the ALK gene rearrangement showing a two orange/green fusion (2F) signal pattern.

All products, except where indicated, are Analyte Specific Reagents. Analytical and performance characteristics are not established.6-14
Oncology – Hematology
11
~500 kb
ACATCUL5 NPAT ATM
Centromere Telomere11q22.3 region
LSI ATM
D11
S34
7
D11
S18
28
D11
S38
4
WI-
1035
8
D11
S12
94
Vysis LSI ATM (11q22) SpectrumOrange Probe
This fluorescence in situ hybridization (FISH) probe is intended to detect deletion of the LSI ATM probe target sequence containing the ATM gene at chromosomal location 11q22.3.
Loss of genetic information at chromosome band 11q22q24 has been observed in a number of malignancies. Deletions in this region are commonly observed abnormalities in several types of lymphoproliferative diseases. In chronic lymphocytic leukemia (CLL), loss at 11q22.3q23.1 is one of the most common chromosomal aberrations. Utilizing FISH, a commonly deleted 23 megabase region containing the ATM, RDX, and FDX genes has been characterized.1 Loss of this region is associated with marked lymphadenopathy and unfavorable prognosis.2,3 Due to its location and the role of its protein product in the regulation of p53, ATM is a candidate gene for the clinical effec of 11q deletions in CLL.4, 5
The approximately 500 kb SpectrumOrange LSI ATM probe contains the complete ATM gene and is located at 11q22.3.
Results of Hybridization This probe set allows status assessment of the ATM gene region on chromosome 11q22.3. In a normal cell with two intact copies of the ATM gene region, a two orange signal pattern will be observed. In an abnormal cell with a deletion in the ATM gene region, fewer than two orange signals will be observed.
Ordering Information Quantity Order No.
Vysis LSI ATM (11q22.3) SpectrumOrange Probe CE marked 20 µl 1N3320
References1. Stilgenbauer S, Liebisch P, James MR, et al. Molecular cytogenetic delineation of a novel critical genomic region in
chromosome bands 11q22.3q23.1 in lymphoproliferative disorders. Proc. Natl. Acad. Sci. USA 1996;93:1183741.2. Döhner H, Stilgenbauer S, James, MR, et.al. 11q deletions identify a new subset of Bcell chronic lymphocytic eukemia
characterized by extensive nodal involvement and inferior prognosis. Blood 1997:89(7):251622.3. Döhner H, Stilgenbauer S, Benner A, et al. Genomic aberrations and survival in chronic lymphocytic leukemia.
N Eng J Med 2000;343:191016.4. Byrd JC, Gribben JG, Peterson BL, et al. Select highrisk genetic features predict earlier progression following
chemoimunnotherapy with fludarabine and rituximab in chronic lymphocytic leukemia: justification for riskadapted therapy. J Clin Oncol 2006;24:43743.
5. Dewald GW, Brockman SR, Paternoster SF, et al. Chromosome anomalies detected by interphase fluorescence in situ hybridization: correlation with significant biological features of bcell chronic lymphocytic leukaemia. Br J Haematol 2003;121:28795.
6. Wiktor AE, Van Dyke DL, Stupca PJ, et al. Preclinical validation of fluorescence in situ hybridization assays for clinical practice. Genet Med 2006;8:1623..
Result of the hybridization of the LSI ATM (11q22.3) Probe as observed in a normal interphase cell.
Abnormal cell hybridized with the LSI ATM (11q22.3) Probe. The cell in this image shows the one orange signal pattern indicative of a deletion of one copy of the ATM gene region on chromosome 11q22.3.
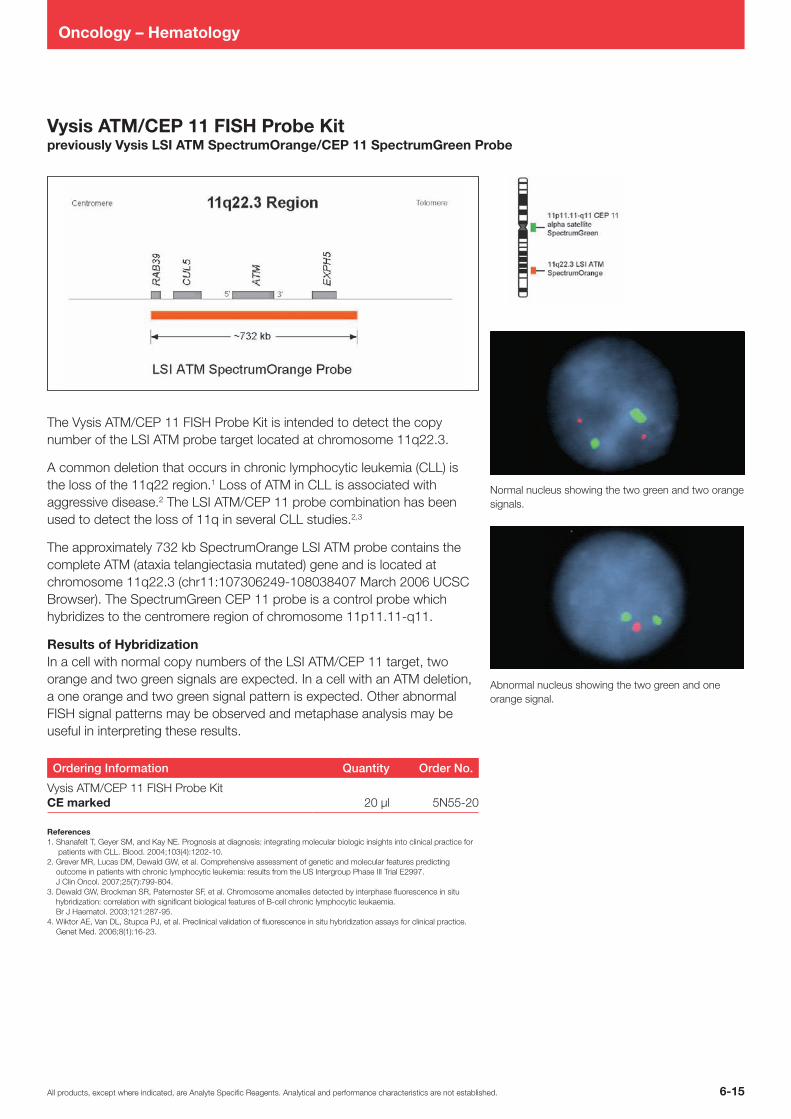
6-15All products, except where indicated, are Analyte Specific Reagents. Analytical and performance characteristics are not established.
Oncology – Hematology
Vysis ATM/CEP 11 FISH Probe Kitpreviously Vysis LSI ATM SpectrumOrange/CEP 11 SpectrumGreen Probe
The Vysis ATM/CEP 11 FISH Probe Kit is intended to detect the copy number of the LSI ATM probe target located at chromosome 11q22.3.
A common deletion that occurs in chronic lymphocytic leukemia (CLL) is the loss of the 11q22 region.1 Loss of ATM in CLL is associated with aggressive disease.2 The LSI ATM/CEP 11 probe combination has been used to detect the loss of 11q in several CLL studies.2,3
The approximately 732 kb SpectrumOrange LSI ATM probe contains the complete ATM (ataxia telangiectasia mutated) gene and is located at chromosome 11q22.3 (chr11:107306249108038407 March 2006 UCSC Browser). The SpectrumGreen CEP 11 probe is a control probe which hybridizes to the centromere region of chromosome 11p11.11q11.
Results of HybridizationIn a cell with normal copy numbers of the LSI ATM/CEP 11 target, two orange and two green signals are expected. In a cell with an ATM deletion, a one orange and two green signal pattern is expected. Other abnormal FISH signal patterns may be observed and metaphase analysis may be useful in interpreting these results.
Ordering Information Quantity Order No.
Vysis ATM/CEP 11 FISH Probe Kit CE marked 20 µl 5N5520
References1. Shanafelt T, Geyer SM, and Kay NE. Prognosis at diagnosis: integrating molecular biologic insights into clinical practice for patients with CLL. Blood. 2004;103(4):120210.2. Grever MR, Lucas DM, Dewald GW, et al. Comprehensive assessment of genetic and molecular features predicting outcome in patients with chronic lymphocytic leukemia: results from the US Intergroup Phase III Trial E2997. J Clin Oncol. 2007;25(7):799804.3. Dewald GW, Brockman SR, Paternoster SF, et al. Chromosome anomalies detected by interphase fluorescence in situ hybridization: correlation with significant biological features of Bcell chronic lymphocytic leukaemia. Br J Haematol. 2003;121:28795.4. Wiktor AE, Van DL, Stupca PJ, et al. Preclinical validation of fluorescence in situ hybridization assays for clinical practice. Genet Med. 2006;8(1):1623.
Normal nucleus showing the two green and two orange signals.
Abnormal nucleus showing the two green and one orange signal.
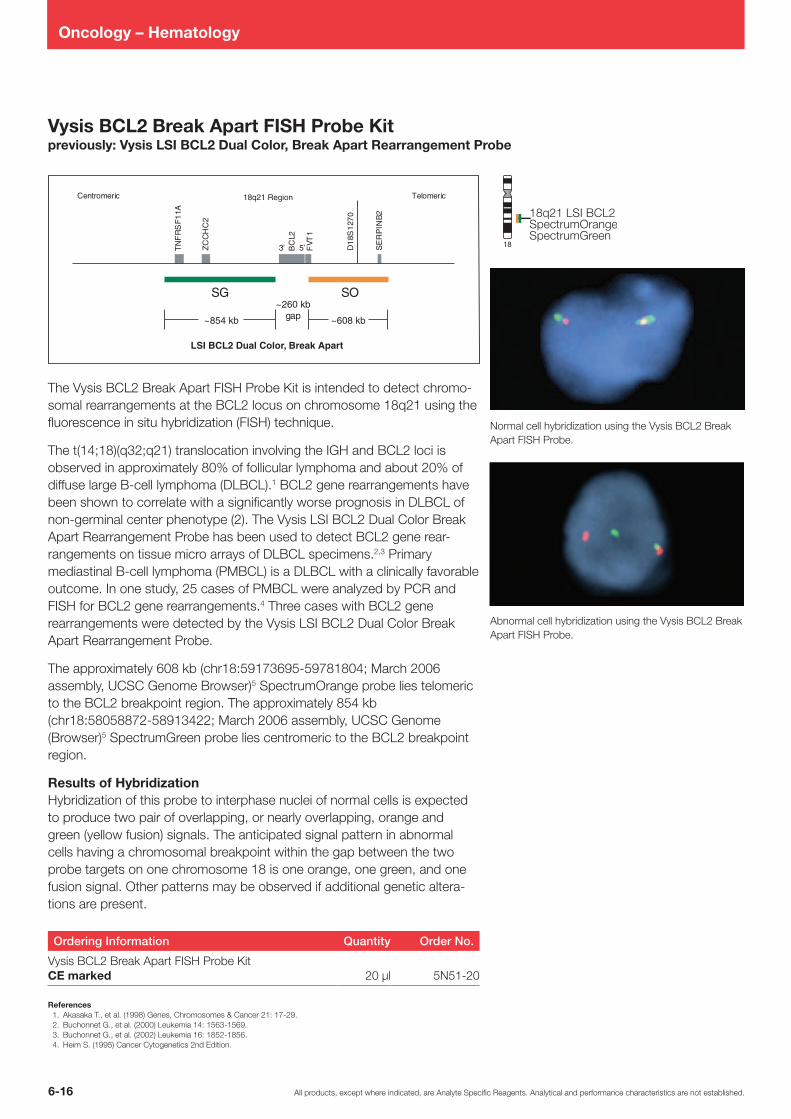
All products, except where indicated, are Analyte Specific Reagents. Analytical and performance characteristics are not established.6-16
Oncology – Hematology
18
18q21 RegionCentromeric Telomeric
SG SO~260 kb
gap~854 kb ~608 kb
BC
L2
5’3’ FVT
1
TN
FR
SF
11A
SE
RP
INB
2
ZC
CH
C2
D1
8S1
270
LSI BCL2 Dual Color, Break Apart
Vysis BCL2 Break Apart FISH Probe Kit previously: Vysis LSI BCL2 Dual Color, Break Apart Rearrangement Probe
The Vysis BCL2 Break Apart FISH Probe Kit is intended to detect chromosomal rearrangements at the BCL2 locus on chromosome 18q21 using the fluorescence in situ hybridization (FISH) technique.
The t(14;18)(q32;q21) translocation involving the IGH and BCL2 loci is observed in approximately 80% of follicular lymphoma and about 20% of diffuse large Bcell lymphoma (DLBCL).1 BCL2 gene rearrangements have been shown to correlate with a significantly worse prognosis in DLBCL of nongerminal center phenotype (2). The Vysis LSI BCL2 Dual Color Break Apart Rearrangement Probe has been used to detect BCL2 gene rearrangements on tissue micro arrays of DLBCL specimens.2,3 Primary mediastinal Bcell lymphoma (PMBCL) is a DLBCL with a clinically favorable outcome. In one study, 25 cases of PMBCL were analyzed by PCR and FISH for BCL2 gene rearrangements.4 Three cases with BCL2 gene rearrangements were detected by the Vysis LSI BCL2 Dual Color Break Apart Rearrangement Probe.
The approximately 608 kb (chr18:5917369559781804; March 2006 assembly, UCSC Genome Browser)5 SpectrumOrange probe lies telomeric to the BCL2 breakpoint region. The approximately 854 kb (chr18:5805887258913422; March 2006 assembly, UCSC Genome (Browser)5 SpectrumGreen probe lies centromeric to the BCL2 breakpoint region.
Results of HybridizationHybridization of this probe to interphase nuclei of normal cells is expected to produce two pair of overlapping, or nearly overlapping, orange and green (yellow fusion) signals. The anticipated signal pattern in abnormal cells having a chromosomal breakpoint within the gap between the two probe targets on one chromosome 18 is one orange, one green, and one fusion signal. Other patterns may be observed if additional genetic alterations are present.
Ordering Information Quantity Order No.
Vysis BCL2 Break Apart FISH Probe Kit CE marked 20 µl 5N5120
References1. Akasaka T., et al. (1998) Genes, Chromosomes & Cancer 21: 1729.2. Buchonnet G., et al. (2000) Leukemia 14: 15631569.3. Buchonnet G., et al. (2002) Leukemia 16: 18521856.4. Heim S. (1995) Cancer Cytogenetics 2nd Edition.
Normal cell hybridization using the Vysis BCL2 Break Apart FISH Probe.
Abnormal cell hybridization using the Vysis BCL2 Break Apart FISH Probe.

6-17All products, except where indicated, are Analyte Specific Reagents. Analytical and performance characteristics are not established.
Oncology – Hematology
Vysis LSI BCL6 (ABR) Dual Color, Break Apart Rearragement Probe
The LSI BCL6 (ABR)* Dual Color, Break Apart Rearrangement Probe targets chromosome breaks associated with a number of different translocations that involve the BCL6 gene located on chromosome 3.
The LSI BCL6 (ABR)* Dual Color, Break Apart Rearrangement Probe consists of a 5’ BCL6 probe and 3’ BCL6 probe. The 5’ BCL6 SpectrumOrange probe is ~ 349 kb in size and flanks the ABR of BCL6. The 3’ BCL6 Spectrum Green probe is approximately 600 kb in size and flanks the 3’ end of BCL6. There is an approximate 265 kb gap between the two probes.
Results of HybridizationIn a normal cell hybridized with the BCL6 probe, the expected signal pattern is two orange/green (2F) fusion signals.
Ordering Information Quantity Order No.
Vysis LSI BCL6 (ABR) Dual Color, Break Apart Rearrangement Probe 20 µl 1N2320
* ABR Alternate Breakpoint Region
References1. Iqbal J, et. al Leukemia. 2007 Nov;21(11):233243. Epub 2007 Jul 12.2. Tapinassi C, et al, Cancer Genet Cytogenet. 2007 Jan 1;172(1):703. 3. BosgaBouwer AG, et al Chromosomes Cancer. 2005 Nov;44(3):3014. 4. Chen W, et al; Oncogene. 1998 Oct 1;17(13):171722.
LSI BCL6 (ABR) Dual Color, Break ApartRearrangement Probe hybridized to a nucleuswith a translocation breakpoint involving the BCL6BCL6 gene showing a one orange, one green,one fusion (1O1G1F) pattern.

All products, except where indicated, are Analyte Specific Reagents. Analytical and performance characteristics are not established.6-18
Oncology – Hematology
9
22
Vysis BCR/ABL/ASS1 Tri-Color DF FISH Probe Kitpreviously: Vysis LSI BCR/ABL 9q34 Tricolor, Dual Fusion Translocation Probe
The Vysis BCR/ABL1/ASS1 TriColor DF FISH Probe Kit is intended to detect the t(9;22)(q34;q11.2) reciprocal translocation involving the BCR and ABL1 gene regions using the fluorescence in situ hybridization technique.
The t(9;22) translocation which fuses the BCR gene on chromosome 22q11.2 and the ABL1 gene on chromosome 9q34 is observed by cytogenetics in greater than 80% of patients with chronic myelogenous leukemia (CML).1 In CML cases lacking a cytogenetically detectable translocation, the BCR/ABL1 fusion can still almost always be detected by FISH or other molecular techniques. BCR/ABL1 fusions also occur in a portion of acute lymphocytic leukemia cases and more rarely in acute myeloid leukemia.2 In about 15 to 20 percent of CML cases, the t(9;22) results in the loss of genetic material flanking the BCR and/or ABL1 breakpoints on the derivative 9 chromosome.1,3 This loss can prevent the production of the highly specific twofusion signal patterns expected of dual fusion probes and balanced translocations. If both BCR and ABL1 targets are deleted on the der(9) chromosome, lowlevel random overlap of orange and green signals within normal cells (producing a 1 orange, 1 green, 1 fusion pattern) cannot be discriminated from lowlevel true BCR/ABL1 fusions producing the same pattern. The TriColor design of this test uses a probe in a third color (aqua) on the centromeric side of the ABL1 breakpoint, which colocalizes with the orange signal in a random orange/green signal fusion, but is absent from a true BCR/ABL1 molecular fusion on the der(22) chromosome. The probes in this kit have been used in published papers to detect low levels of positive cells in CML patients who were undergoing therapy and had deletions of FISH signals on the derivative chromosome 9.1,3
Continuation on the following page >
Nucleus showing the two aqua/orange and two green signal pattern.
Abnormal nucleus showing the one aqua/orange, one green, and one orange/green fusion (yellow) signal pattern.

6-19All products, except where indicated, are Analyte Specific Reagents. Analytical and performance characteristics are not established.
Oncology – Hematology
The approximately 671 kb (chr9:132255025132926107; March 2006 assembly, UCSC Genome Browser)4 SpectrumOrange LSI ABL1 probe spans the ABL1 and ASS1 genes on chromosome 9q34. The approximately 329 kb (chr9:132255025132584487; March 2006 assembly, UCSC Genome Browser)4 SpectrumAqua LSI ASS1 probe overlays with part of the area covered by the SpectrumOrange probe, spans the ASS1 gene and lies centromeric to the ABL1 gene breakpoint regions. The SpectrumGreen LSI BCR probe consists of two probes located at chromosome 22q11.2. The centromeric segment of the SpectrumGreen probe is approximately 579 kb (chr22:2138263321962088 March 2006 assembly),4 and contains the majority of the BCR gene. The telomeric segment of the SpectrumGreen probe is approximately 645 kb (chr22:2228821822932815; March 2006 assembly),4 and it lies telomeric to the BCR gene breakpoint region. There is an approximate 326 kb gap between the two green probes.
Results of HybridizationThe expected normal signal pattern of Vysis BCR/ABL1/ASS1 TriColor DF FISH Probe Kit is two orange, two aqua, and two green signals.The expected abnormal pattern of the Vysis BCR/ABL1/ASS1 TriColor DF FISH Probe Kit will depend on deletion status of probe targets flanking the breakpoints that result in the derivative chromosome 9.• In a balanced t(9;22) without any deletion of probe target on the der(9),
a 1 orange 1 green 2 fusion pattern is expected. The 1 orange signal [normal 9] and one of the two fusions [der(9)] will each have associated aqua signals.
• If the ABL1 target on the der(9) is lost, a 1 orange 2 green 1 fusion pattern is expected. The orange signal [normal 9] will have an associated aqua signal.
• If the BCR target on the der(9) is deleted, a 2 orange 1 green 1 fusion pattern is expected. Both orange signals, normal chromosome 9 and der(9), will have an associated aqua signal.
• If both ABL1 and BCR targets are deleted on the der(9), a 1 orange 1green 1 fusion pattern will be expected. Again, the 1 orange signal [normal 9] will have an associated aqua signal.
In all cases, a true BCR/ABL1 fusion signal will not have an associated aqua signal as the aqua probe lies centromeric to the ABL1 breakpoint and thus is not involved in the oncogenic gene fusion. This fact is the basis for discriminating a true 5’ BCR/ 3’ ABL1 molecular fusion from other orange/green signal fusions whether they are the result of a der(9) or to random overlap of normal chromosome signals. Other abnormal signal patterns may occur, and metaphase analysis may be helpful in characterization of such patterns. The publications by Smoley et al1 and Siu et al3 used the probes contained in this kit and demonstrate the abnormal signal patterns observed in patients with der(9) deletions.
Ordering Information Quantity Order No.
Vysis LSI BCR/ABL/ASS1 TriColor DF FISH Probe Kit CE marked 20 µl 5N5420
Continuation:Vysis BCR/ABL/ASS1 Tri-Dolor DF FISH Probe Kit
References:1. Smoley SA, Brockman SR, Paternoster SF, et al. A novel tricolor,
dualfusion fluorescence in situ hybridization method to detect BCR/ABL fusion in cells with t(9;22)(q34;q11.2) associated with deletion of DNA on the derivative chromosome 9 in chronic myelocytic leukemia. Cancer Genet Cytogenet. 2004;148(1):16.
2. Primo D, Tabernero MD, Rasillo A, et al. Patterns of BCR/ABL gene rearrangements by interphase fluorescence in situ hybridization (FISH) in BCR/ABL leukemias: incidence and underlying genetic abnormalities. Leukemia. 2003;17(6):11249
3. Siu L, Ma E, Wong WS, et al. Application of tricolour, dual fusion fluorescence in situ hybridization (FISH) system for the characterization of BCRABL1 fusion in chronic myelogenousleukaemia (CML) and residual disease monitoring. BMC Blood Disord. 2009;9:4.
4. Kent WJ, Sugnet CW, Furey TS, et al. The Human Genome Browser at UCSC. Genome Res. 2002;12(6):9961006.
5. Wiktor AE, Van Dyke DL, Stupca PJ, et al. Preclinical validation of fluorescence in situ hybridization assays for clinical practice. Genet Med. 2006;8(1):1623.

All products, except where indicated, are Analyte Specific Reagents. Analytical and performance characteristics are not established.6-20
Oncology – Hematology
Exo
n 1b
Exo
n 1a
Exo
n 2
Exo
n 11
Centromere
ASS gene ~65 kb ABL gene ~225 kb
9q34 region Telomere
~650 kb
LSI ASS-ABL
LSI BCR Dual Fusion
Centromere
IGLV segments BCR
22q11.2 region Telomere
~600 kb~600 kb ~300 kb
3'5'
3'5'
9
22
Exo
n 1b
Exo
n 1a
Exo
n 2
Exo
n 11
Centromere
ASS gene ~65 kb ABL gene ~225 kb
9q34 region Telomere
~650 kb
LSI ASS-ABL
LSI BCR Dual Fusion
Centromere
IGLV segments BCR
22q11.2 region Telomere
~600 kb~600 kb ~300 kb
3'5'
3'5'
Vysis LSI BCR/ABL Dual Color, Dual Fusion Translocation Probe
The LSI BCR/ABL Dual Color, Dual Fusion Translocation Probe is a mixture of the LSI BCR probe labeled with SpectrumGreen and the LSI ABL probe labeled with SpectrumOrange. The spanning ABL probe has a genomic target of approximately 650 kb extending from an area centromeric of the argininosuccinate synthetase gene (ASS) to well telomeric of the last ABL exon. The BCR probe target spans a genomic distance of about 1.5 Mb. The BCR probe begins within the variable segments of the immunoglobulin lambda light chain locus (IGLV), extends along chromosome 22 through the BCR gene, and ends at a point approximately 900 kb telomeric of BCR. A region of about 300 kb containing lowcopy number repeats has been eliminated from the probe which introduces a gap in the coverage of the probe target. Both probes span their respective breakpoints.
Results of HybridizationA nucleus lacking the t(9;22) translocation will exhibit the two orange, two green (2O2G) signal pattern. In a nucleus containing a simple balanced t(9;22), one orange and one green signal from the normal 9 and 22 chromosomes and two orange/green (yellow) fusion signals, one each from the derivative 9 and 22 chromosomes, will be observed (1O1G2F). In some instances, deletions may occur 3’ of the BCR breakpoint and/or 5’ of the ABL breakpoint resulting in either an ES (extra orange or green) signal pattern or a single fusion pattern.
Ordering Information Quantity Order No.
Vysis LSI BCR/ABL Dual Color, Dual Fusion Translocation Probe CE marked 20 µl 8L1001
Vysis LSI BCR/ABL Dual Color, Dual Fusion Translocation Probe CE marked 50 µl 8L1002
LSI BCR/ABL Dual Color, Dual Fusion Translocation Probe hybridized to an abnormal nucleus containing a simple balanced t(9;22). One orange, one green and two orange/green fusion signals are observed (1O1G2F).
References1. Bloomfield CD, Goldman AI, Alimena G, et al. Blood 1986;67:41520. 2. Lugo TG, Pendergast AM, Muller AJ, et al.
Science 1990; 247:107982.3. Chase A, Huntley BJ, Cross NC.
Best Prac Res Clin Haematol 2001;14(3):55371.4. Dewald GW.. In: Fan YS, ed. Methods in Molecular Biology,
Vol 204: Molecular Cytogenetics: Protocols and Applications. Totowa, NJ: Humana Press Inc.;2002:31142.
5. Primo D, Tabernero MD, Rasillo A, et al. Leukemia 2003;17:112429.6. Wiktor AE, Van Dyke DL, Stupca PJ, et al.. Genet Med 2006;8:1623.

6-21All products, except where indicated, are Analyte Specific Reagents. Analytical and performance characteristics are not established.
Oncology – Hematology
Exo
n 1b
Exo
n 1a
Exo
n 2
Exo
n 11
ASS gene ~65 kb ABL gene ~225 kb
Telomere
~650 kb
LSI ASS-ABL
Exo
n 1
Exo
n 2
Exo
n 3
Centromere
5' 3'm-bcr region
M-bcr region1 2 3 4 5
22q11.2 region
Centromere 9q34 region
Telomere
~300 kb
LSI BCR
3'5'
9
22
Exo
n 1b
Exo
n 1a
Exo
n 2
Exo
n 11
ASS gene ~65 kb ABL gene ~225 kb
Telomere
~650 kb
LSI ASS-ABLE
xon
1
Exo
n 2
Exo
n 3
Centromere
5' 3'm-bcr region
M-bcr region1 2 3 4 5
22q11.2 region
Centromere 9q34 region
Telomere
~300 kb
LSI BCR
3'5'
Vysis LSI BCR/ABL Dual Color, Single Fusion Translocation Probe
The LSI BCR/ABL Dual Color, Single Fusion Translocation Probe is a mixture of the LSI ABL probe labeled with SpectrumOrange and the LSI BCR probe labeled with SpectrumGreen. The ABL probe begins between exons 4 and 5 and continues for about 300 kb toward the telomere of chromosome 9. The LSI BCR probe begins between BCR exons 13 and 14 (Mbcr exons 2 and 3) and extends toward the centromere on chromosome 22 for approximately 300 kb, extending well beyond the mbcr region.
Results of HybridizationA nucleus lacking the t(9;22) will exhibit the two orange, two green (2O2G) signal pattern. In a cell harboring the t(9;22), one orange, one green, and one orange/green (yellow) fusion signal pattern (1O1G1F) will be observed. This simple probe design detects the 5’ BCR/3’ ABL gene fusion and is useful for detecting samples with a high percentage of cells possessing this translocation.
Ordering Information Quantity Order No.
Vysis LSI BCR/ABL Dual Color, Single Fusion Translocation Probe CE marked 20 µl 8L5650
References1. Bloomfield CD, Goldman AI, Alimena G, et al. Blood 1986;67:41520. 2. Lugo TG, Pendergast AM, Muller AJ, et al. Science 1990; 247:107982.3. Chase A, Huntley BJ, Cross NC. Best Prac Res Clin Haematol 2001;14(3):55371.4. Wiktor AE, Van Dyke DL, Stupca PJ, et al. Genet Med 2006;8:1623.
LSI BCR/ABL Dual Color, Single Fusion Translocation Probe hybridized to an abnormal nucleus containing the t(9;22). One orange, one green and one fusion (IOIGIF) signal pattern is observed.
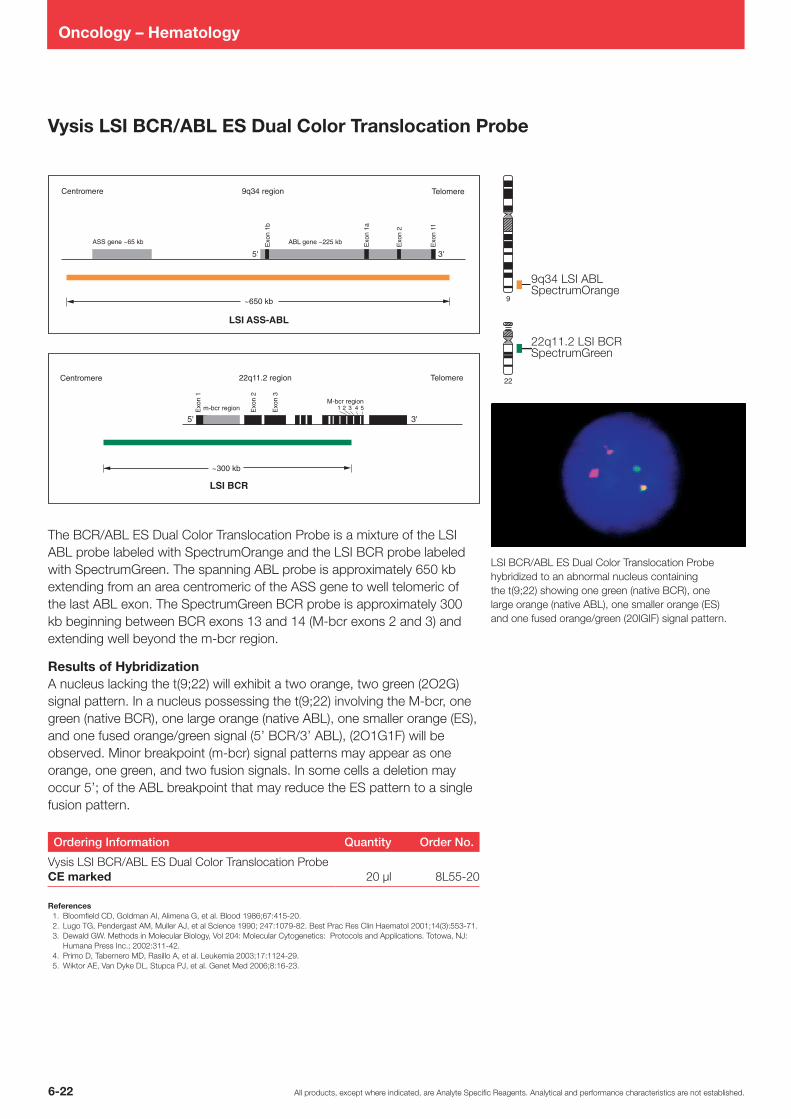
All products, except where indicated, are Analyte Specific Reagents. Analytical and performance characteristics are not established.6-22
Oncology – Hematology
Exo
n 1b
Exo
n 1a
Exo
n 2
Exo
n 11
ASS gene ~65 kb ABL gene ~225 kb
Telomere
~650 kb
LSI ASS-ABL
Exo
n 1
Exo
n 2
Exo
n 3
Centromere
5' 3'm-bcr region
M-bcr region1 2 3 4 5
22q11.2 region
Centromere 9q34 region
Telomere
~300 kb
LSI BCR
3'5'
9
22
Exo
n 1b
Exo
n 1a
Exo
n 2
Exo
n 11
ASS gene ~65 kb ABL gene ~225 kb
Telomere
~650 kb
LSI ASS-ABLE
xon
1
Exo
n 2
Exo
n 3
Centromere
5' 3'm-bcr region
M-bcr region1 2 3 4 5
22q11.2 region
Centromere 9q34 region
Telomere
~300 kb
LSI BCR
3'5'Vysis LSI BCR/ABL ES Dual Color Translocation Probe
The BCR/ABL ES Dual Color Translocation Probe is a mixture of the LSI ABL probe labeled with SpectrumOrange and the LSI BCR probe labeled with SpectrumGreen. The spanning ABL probe is approximately 650 kb extending from an area centromeric of the ASS gene to well telomeric of the last ABL exon. The SpectrumGreen BCR probe is approximately 300 kb beginning between BCR exons 13 and 14 (Mbcr exons 2 and 3) and extending well beyond the mbcr region.
Results of HybridizationA nucleus lacking the t(9;22) will exhibit a two orange, two green (2O2G) signal pattern. In a nucleus possessing the t(9;22) involving the Mbcr, one green (native BCR), one large orange (native ABL), one smaller orange (ES), and one fused orange/green signal (5’ BCR/3’ ABL), (2O1G1F) will be observed. Minor breakpoint (mbcr) signal patterns may appear as one orange, one green, and two fusion signals. In some cells a deletion may occur 5’; of the ABL breakpoint that may reduce the ES pattern to a single fusion pattern.
Ordering Information Quantity Order No.
Vysis LSI BCR/ABL ES Dual Color Translocation Probe CE marked 20 µl 8L5520
References1. Bloomfield CD, Goldman AI, Alimena G, et al. Blood 1986;67:41520.2. Lugo TG, Pendergast AM, Muller AJ, et al Science 1990; 247:107982. Best Prac Res Clin Haematol 2001;14(3):55371.3. Dewald GW. Methods in Molecular Biology, Vol 204: Molecular Cytogenetics: Protocols and Applications. Totowa, NJ:
Humana Press Inc.; 2002:31142.4. Primo D, Tabernero MD, Rasillo A, et al. Leukemia 2003;17:112429.5. Wiktor AE, Van Dyke DL, Stupca PJ, et al. Genet Med 2006;8:1623.
LSI BCR/ABL ES Dual Color Translocation Probe hybridized to an abnormal nucleus containing the t(9;22) showing one green (native BCR), one large orange (native ABL), one smaller orange (ES) and one fused orange/green (20IGIF) signal pattern.
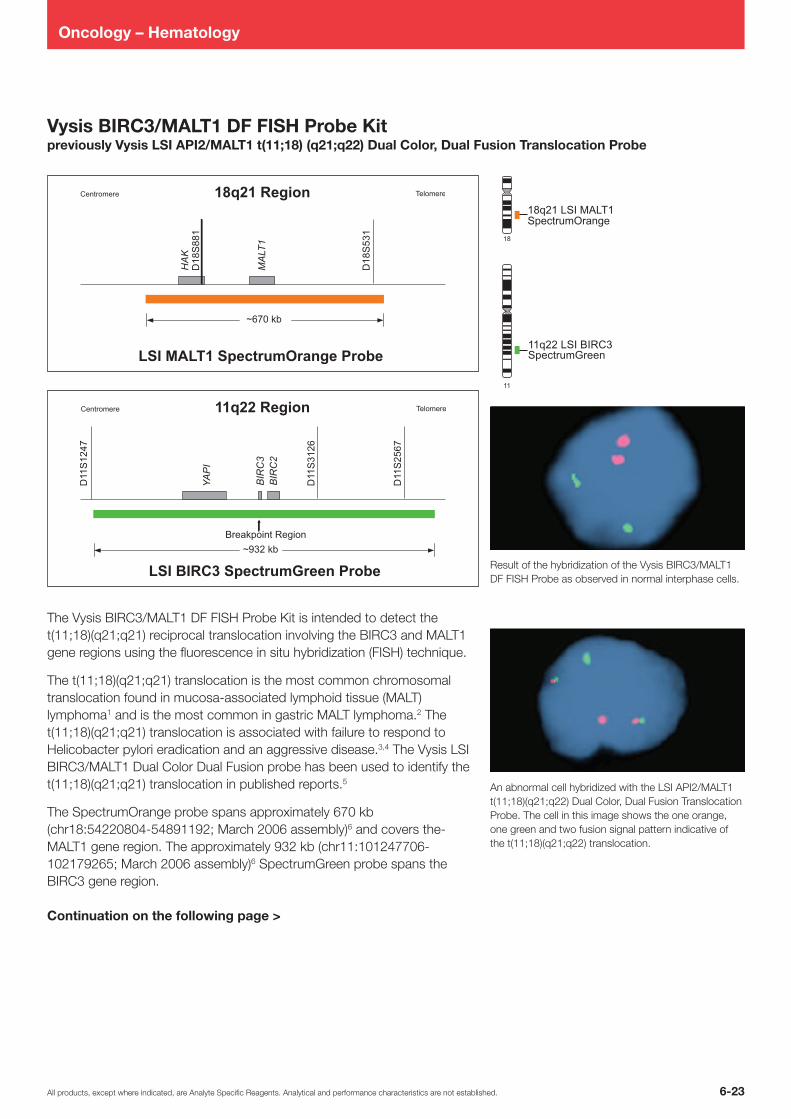
6-23All products, except where indicated, are Analyte Specific Reagents. Analytical and performance characteristics are not established.
Oncology – Hematology
Vysis BIRC3/MALT1 DF FISH Probe Kitpreviously Vysis LSI API2/MALT1 t(11;18) (q21;q22) Dual Color, Dual Fusion Translocation Probe
The Vysis BIRC3/MALT1 DF FISH Probe Kit is intended to detect the t(11;18)(q21;q21) reciprocal translocation involving the BIRC3 and MALT1 gene regions using the fluorescence in situ hybridization (FISH) technique.
The t(11;18)(q21;q21) translocation is the most common chromosomal translocation found in mucosaassociated lymphoid tissue (MALT) lymphoma1 and is the most common in gastric MALT lymphoma.2 The t(11;18)(q21;q21) translocation is associated with failure to respond to Helicobacter pylori eradication and an aggressive disease.3,4 The Vysis LSI BIRC3/MALT1 Dual Color Dual Fusion probe has been used to identify the t(11;18)(q21;q21) translocation in published reports.5
The SpectrumOrange probe spans approximately 670 kb (chr18:5422080454891192; March 2006 assembly)6 and covers theMALT1 gene region. The approximately 932 kb (chr11:101247706102179265; March 2006 assembly)6 SpectrumGreen probe spans the BIRC3 gene region.
Continuation on the following page >
Result of the hybridization of the Vysis BIRC3/MALT1 DF FISH Probe as observed in normal interphase cells.
An abnormal cell hybridized with the LSI API2/MALT1 t(11;18)(q21;q22) Dual Color, Dual Fusion Translocation Probe. The cell in this image shows the one orange, one green and two fusion signal pattern indicative of the t(11;18)(q21;q22) translocation.

All products, except where indicated, are Analyte Specific Reagents. Analytical and performance characteristics are not established.6-24
Oncology – Hematology
Results of HybridizationThe expected normal signal pattern of the Vysis LSI BIRC3/MALT1 DualColor Dual Fusion Probes is two orange and two green signals. The expected abnormal pattern of the Vysis LSI BIRC3/MALT1 Dual Color Dual Fusion Probes is one orange, one green and two fusions. Other abnormal signal patterns may occur and metaphase analysis may be helpful in characterization of such patterns.
Ordering Information Quantity Order No.
Vysis BIRC3/MALT1 DF FISH Probe Kit CE marked 20 µl 5N5020
References1. Auer IA, Gascoyne RD, Connors JM, et al. Ann Oncol. 1997;8(10):97985.2. Raderer M, Wöhrer S, Streubel B, et al. J Clin Oncol. 2006;24(19):313641.3. Ye H, Liu H, Raderer M, et al. Blood. 2003;101(7):254750.4. Liu H, Ye H, RuskoneFourmestraux A, et al. Gastroenterology. 2002;122(5):128694.5. Nakamura S, Ye H, Bacon CM, et al. Gut. 2007;56(10):135863.6. Kent WJ, Sugnet CW, Furey TS, et al. Genome Res. 2002;12(6):9961006.7. Wiktor AE, Van Dyke DL, Stupka PJ, et al. Genet Med. 2006;8(1):1623.
Continuation: Vysis BIRC3/MALT1 DF FISH Probe Kit

6-25All products, except where indicated, are Analyte Specific Reagents. Analytical and performance characteristics are not established.
Oncology – Hematology
Vysis CBFB Break Apart FISH Probe Kitpreviously Vysis LSI CBFB Dual Color, Break Apart Rearrangement Probe
The Vysis CBFB Break Apart FISH Probe is intended to detect chromosomal rearrangements at the CBFB locus on chromosome 16q22.
Aberrations of chromosome 16q22 have been found to be associated with acute myeloid leukemia (AML).1 A favorable outcome in AML has been associated with inv(16) and t(16;16).2,3 The Vysis CBFB Break Apart FISH Probe has been used to detect inv(16)/t(16;16) in a study of 237 diagnostic specimens from AML patients enrolled in a clinical trial.4
The SpectrumRed probe is approximately 130 kb (chr16:6552567465655811; March 2006 assembly)5 and hybridizes centromeric to the inv(16) and t(16;16) breakpoint region. The SpectrumGreen probe is approximately 204 kb (chr16:6567761965881775; March 2006 assembly)5 and hybridizes telomeric to the breakpoint.
Results of HybridizationThe expected pattern in a nucleus lacking inv(16) will be two fused red/green (yellow) signals (2F). The pattern in a nucleus containing an inv(16) results in separate red and green signals appearing on opposite arms of the inverted 16 chromosome. The pattern of t(16;16)(p13;q22) results in an adjacent or fused red/green signal on the q arm of one of the 16 chromosomes and a green signal on the other arm of 16, while the 16 chromosome homolog will only contain the red signal on one arm.
Ordering Information Quantity Order No.
Vysis CBFB Break Apart FISH Probe Kit CE marked 20 µl 5N4420
References1. Le Beau MM, Larson RA, Bitter MA, et al. Association of an inversion of chromosome 16 with abnormal marrow
eosinophils in acute myelomonocytic leukemia. A unique cytogenetic clinicopathological association. N Engl J Med. 1983;309(11):6306.
2. Larson RA, Williams SF, Le Beau MM, et al. Acute myelomonocytic leukemia with abnormal eosinophils and inv(16) or t(16;16) has a favorable prognosis. Blood. 1986;68(6):12429.
3. Grimwade D, Walker H, Oliver F, et al. The importance of diagnostic cytogenetics on outcome in AML: analysis of 1,612 patients entered into the MRC AML 10 trial. The Medical Research Council Adult and Children’s Leukaemia Working Parties. Blood. 1998;92(7):232233.
4. Vance GH, Kim H, Hicks GA, et al. Utility of interphase FISH to stratify patients into cytogenetic risk categories at diagnosis of AML in an Eastern Cooperative Oncology Group (ECOG) clinical trial (E1900). Leuk Res. 2007;31(5):6059.
5. Kent WJ, Sugnet CW, Furey TS, et al. The Human Genome Browser at UCSC. Genome Res. 2002:12(6):9961006.
LSI CBFB Dual Color Break Apart Rearrangement Probe hybridized to a cell exhibiting one red and one green signal. On the metaphase cell, contains the red signal on one arm and the green signal on the other arm
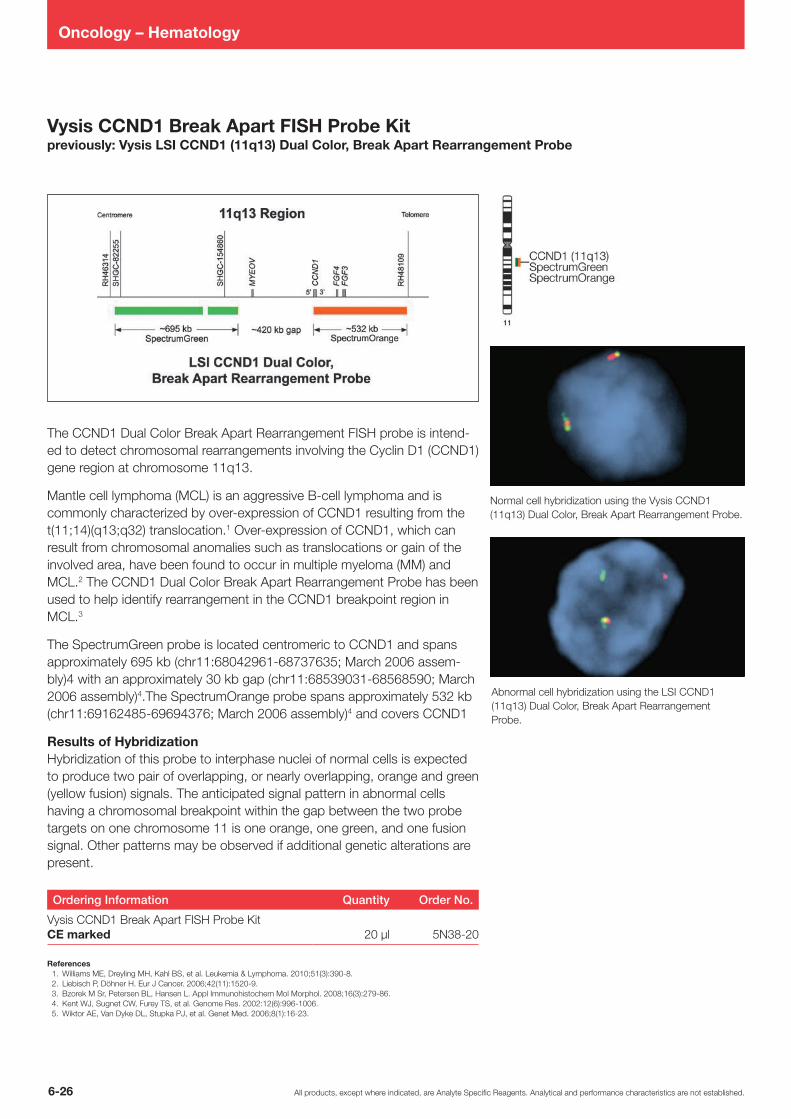
All products, except where indicated, are Analyte Specific Reagents. Analytical and performance characteristics are not established.6-26
Oncology – Hematology
Vysis CCND1 Break Apart FISH Probe Kitpreviously: Vysis LSI CCND1 (11q13) Dual Color, Break Apart Rearrangement Probe
The CCND1 Dual Color Break Apart Rearrangement FISH probe is intended to detect chromosomal rearrangements involving the Cyclin D1 (CCND1) gene region at chromosome 11q13.
Mantle cell lymphoma (MCL) is an aggressive Bcell lymphoma and is commonly characterized by overexpression of CCND1 resulting from the t(11;14)(q13;q32) translocation.1 Overexpression of CCND1, which can result from chromosomal anomalies such as translocations or gain of the involved area, have been found to occur in multiple myeloma (MM) and MCL.2 The CCND1 Dual Color Break Apart Rearrangement Probe has been used to help identify rearrangement in the CCND1 breakpoint region in MCL.3
The SpectrumGreen probe is located centromeric to CCND1 and spans approximately 695 kb (chr11:6804296168737635; March 2006 assembly)4 with an approximately 30 kb gap (chr11:6853903168568590; March 2006 assembly)4.The SpectrumOrange probe spans approximately 532 kb (chr11:6916248569694376; March 2006 assembly)4 and covers CCND1
Results of HybridizationHybridization of this probe to interphase nuclei of normal cells is expected to produce two pair of overlapping, or nearly overlapping, orange and green (yellow fusion) signals. The anticipated signal pattern in abnormal cells having a chromosomal breakpoint within the gap between the two probe targets on one chromosome 11 is one orange, one green, and one fusion signal. Other patterns may be observed if additional genetic alterations are present.
Ordering Information Quantity Order No.
Vysis CCND1 Break Apart FISH Probe Kit CE marked 20 µl 5N3820
References1. Williams ME, Dreyling MH, Kahl BS, et al. Leukemia & Lymphoma. 2010;51(3):3908.2. Liebisch P, Döhner H. Eur J Cancer. 2006;42(11):15209.3. Bzorek M Sr, Petersen BL, Hansen L. Appl Immunohistochem Mol Morphol. 2008;16(3):27986.4. Kent WJ, Sugnet CW, Furey TS, et al. Genome Res. 2002:12(6):9961006.5. Wiktor AE, Van Dyke DL, Stupka PJ, et al. Genet Med. 2006;8(1):1623.
Normal cell hybridization using the Vysis CCND1 (11q13) Dual Color, Break Apart Rearrangement Probe.
Abnormal cell hybridization using the LSI CCND1 (11q13) Dual Color, Break Apart Rearrangement Probe.
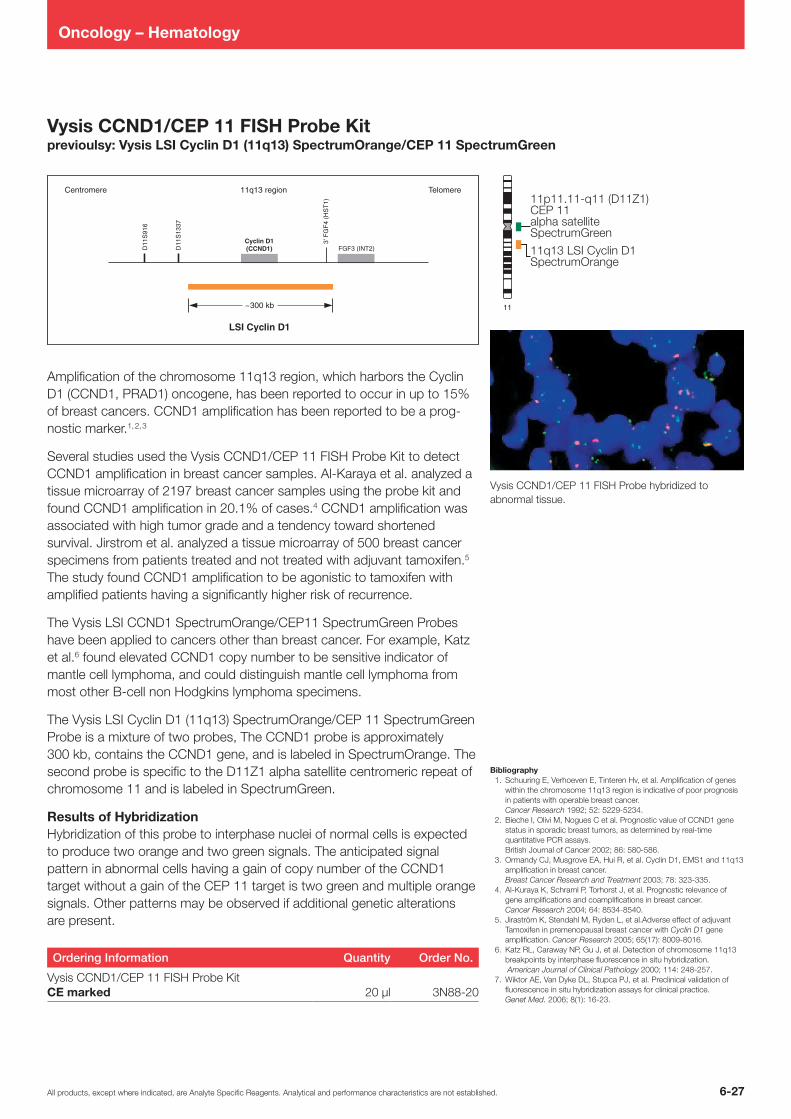
6-27All products, except where indicated, are Analyte Specific Reagents. Analytical and performance characteristics are not established.
Oncology – Hematology
11
Vysis CCND1/CEP 11 FISH Probe Kit previoulsy: Vysis LSI Cyclin D1 (11q13) SpectrumOrange/CEP 11 SpectrumGreen
Amplification of the chromosome 11q13 region, which harbors the Cyclin D1 (CCND1, PRAD1) oncogene, has been reported to occur in up to 15% of breast cancers. CCND1 amplification has been reported to be a prognostic marker.1, 2, 3
Several studies used the Vysis CCND1/CEP 11 FISH Probe Kit to detect CCND1 amplification in breast cancer samples. AlKaraya et al. analyzed a tissue microarray of 2197 breast cancer samples using the probe kit and found CCND1 amplification in 20.1% of cases.4 CCND1 amplification was associated with high tumor grade and a tendency toward shortened survival. Jirstrom et al. analyzed a tissue microarray of 500 breast cancer specimens from patients treated and not treated with adjuvant tamoxifen.5 The study found CCND1 amplification to be agonistic to tamoxifen with amplified patients having a significantly higher risk of recurrence.
The Vysis LSI CCND1 SpectrumOrange/CEP11 SpectrumGreen Probes have been applied to cancers other than breast cancer. For example, Katz et al.6 found elevated CCND1 copy number to be sensitive indicator of mantle cell lymphoma, and could distinguish mantle cell lymphoma from most other Bcell non Hodgkins lymphoma specimens.
The Vysis LSI Cyclin D1 (11q13) SpectrumOrange/CEP 11 SpectrumGreen Probe is a mixture of two probes, The CCND1 probe is approximately 300 kb, contains the CCND1 gene, and is labeled in SpectrumOrange. The second probe is specific to the D11Z1 alpha satellite centromeric repeat of chromosome 11 and is labeled in SpectrumGreen.
Results of HybridizationHybridization of this probe to interphase nuclei of normal cells is expected to produce two orange and two green signals. The anticipated signal pattern in abnormal cells having a gain of copy number of the CCND1 target without a gain of the CEP 11 target is two green and multiple orange signals. Other patterns may be observed if additional genetic alterations are present.
Ordering Information Quantity Order No.
Vysis CCND1/CEP 11 FISH Probe Kit CE marked 20 µl 3N8820
Vysis CCND1/CEP 11 FISH Probe hybridized to abnormal tissue.
Bibliography1. Schuuring E, Verhoeven E, Tinteren Hv, et al. Amplification of genes
within the chromosome 11q13 region is indicative of poor prognosis in patients with operable breast cancer. Cancer Research 1992; 52: 52295234.
2. Bieche I, Olivi M, Nogues C et al. Prognostic value of CCND1 gene status in sporadic breast tumors, as determined by realtime quantitative PCR assays. British Journal of Cancer 2002; 86: 580586.
3. Ormandy CJ, Musgrove EA, Hui R, et al. Cyclin D1, EMS1 and 11q13 amplification in breast cancer. Breast Cancer Research and Treatment 2003; 78: 323335.
4. AlKuraya K, Schraml P, Torhorst J, et al. Prognostic relevance of gene amplifications and coamplifications in breast cancer. Cancer Research 2004; 64: 85348540.
5. Jiraström K, Stendahl M, Ryden L, et al.Adverse effect of adjuvant Tamoxifen in premenopausal breast cancer with Cyclin D1 gene amplification. Cancer Research 2005; 65(17): 80098016.
6. Katz RL, Caraway NP, Gu J, et al. Detection of chromosome 11q13 breakpoints by interphase fluorescence in situ hybridization. American Journal of Clinical Pathology 2000; 114: 248257.
7. Wiktor AE, Van Dyke DL, Stupca PJ, et al. Preclinical validation of fluorescence in situ hybridization assays for clinical practice. Genet Med. 2006; 8(1): 1623.

All products, except where indicated, are Analyte Specific Reagents. Analytical and performance characteristics are not established.6-28
Oncology – Hematology
Vysis CDKN2A/CEP 9 FISH Probe Kitpreviously: Vysis LSI p16 (9p21) SpectrumOrange/CEP 9 SpectrumGreen Probe
Alterations of the 9p21 locus including the tumor suppressor gene CDKN2A( p16) are implicated in different Meningiomas and Gliomas1– 4. Studies support the association of CDKN2A homozygous deletion with malignant progression and suggest that is is a marker of worse prognosis in anaplastic oligodendroglimas.5 – 6
The Vysis LSI CDKN2A SpectrumOrange/CEP 9 SpectrumGreen Probes have been used in serval cytogenetic studies to detect losses of the CDKN2A gene.2, 7 – 9 Using this probe set as well as other relevant markers (e. g. p53, RB1, 1p36, 19q13, all Vysis FISH probes), Kramar et al. investigated 82 samples from 81 patients with histologically confirmed glial tumors.7 In a study using the Vysis LSI CDKN2A SpectrumOrange/CEP 9 SpectrumGreen Probes on 189 confirmed glioblastoma patients less than 50 years old, Korshunov et al. found 9p21 deletion to be correlated with an unfavorable prognosis.9
Vysis LSI CDKN2A/CEP 9 Probes are provided in one vial as a mixture of the LSI CDKN 2A probe labeled with SpectrumOrange and the CEP 9 probe labeled with SpectrumGreen. The LSI CDKN2A probe spans approximately 222 kb and contains a number of genetic loci including D9S1749, D9S1747, p16 (INK4B), p14 (ARF), D9S1748, p15 (INK4B), and D9S1752. The CEP 9 SpectrumGreen probe hybridizes to alpha satellite sequences specific to chromosome 9.
Continuation on the following page >
Vysis LSI CDKN2A/CEP 9 Dual Color Probe hybridizedto a nucleus exhibiting the one orange and two greensignal (1O2G) pattern. One p16 gene locus is deletedand both chromosome 9 homologs are present asindicated by one orange and two green signals,respectively.

6-29All products, except where indicated, are Analyte Specific Reagents. Analytical and performance characteristics are not established.
Oncology – Hematology
Continuation: Vysis CDKN2A /CEP 9 FISH Probe Kit
Results of HybridizationIn a normal sample, the expected pattern for a nucleus hybridized with the Vysis LSI CDKN2A / CEP 9 Probe is the two orange, two green (2O2G) signal pattern. If a deletion at the 190 kb region covered by the LSI p16 probe occurs on one chromosome 9 homolog and both centromeres from chromosome 9 are retained, the one orange, two green (1O2G) signal pattern is expected.Very small deletions may occur that do not delete the entire LSI p16 probe target and therefore will not be detected.
Ordering Information Quantity Order No.
Vysis CDKN2A/CEP 9 FISH Probe Kit CE marked 20 µl 4N6120
References1. Ruas M, Peters G. Biochimic Biophys Acta. 1998;1378(2):F115F177. 2. Perry A, Banerjee R, Lohse CM, et al. A. Brain Pathol. 2002;12(2):183190. 3. Boström J, MeyerPuttlitz B, Wolter M, et al. Am J Pathol. 2001;159(2):661669. 4. Smith JS, Jenkins RB. Front in Biosci. 2000;5:D213D231. 5. Cairncross JG, Ueki K, Zlatescu MC, et al. J Natl Cancer Inst. 1998;90(19):14731479. 6. Bortolotto S, ChiadóPiat L, Cavalla P, et al. Int J Cancer. 2000;88(4):554557. 7. Kramar F, Zemanova Z, Michalova K, et al. J Neurooncol. 2007;84(2):201211. 8. Rajaram V, Leuthardt EC, Singh PK, et al. Mod Pathol. 2004;17(1):914. 9. Korshunov A, Sycheva R, Golanov A. Cancer. 2005;104(4):825832.

All products, except where indicated, are Analyte Specific Reagents. Analytical and performance characteristics are not established.6-30
Oncology – Hematology
5p15.2 regionTelomere Centromere
~450 kb
D5S
23
D5S
2064
D5S
630
D5S
721
D5S
1514
E
D5S
1518
E
Centromere Telomere5q33–q34 region
~160 kb
Intr
on 6
CSF1R PDGFRBDTDST5' 3' 5'3' 5'3'
5
5p15.2 regionTelomere Centromere
~450 kb
D5S
23
D5S
2064
D5S
630
D5S
721
D5S
1514
E
D5S
1518
ECentromere Telomere5q33–q34 region
~160 kbIn
tron
6
CSF1R PDGFRBDTDST5' 3' 5'3' 5'3'
Vysis CSF1R/D5S23, D5S721 FISH Probe Kitpreviously: Vysis LSI CSF1R (5q33-q34) SpectrumOrange/D5S23, D5S721 SpectrumGreen Probe
The LSI CSF1R/D5S23, D5S721 FISH Probe may be used to identify deletions of the region 5q33q34. The CSF1R gene is located in the 5q33q34 region on chromosome 5 and is telomeric to the EGR1 locus. The D5S23, D5S721 probe aids in determining if the deletion is of the whole chromosome 5 (5) versus 5q.
The LSI CSF1R/D5S23, D5S721 FISH Probe is a mixture of the approximately 160 kb SpectrumOrange labeled LSI CSF1R probe and the approximately 450 kb SpectrumGreen labeled D5S23, D5S721 probe.
Results of HybridizationIn a normal cell, the expected pattern for FISH Probe LSI CSF1R/D5S23, D5S721 probe is the two orange, two green (2O2G) signal pattern. In a hybridized abnormal cell containing the 5q33q34 deletion, the one orange, two green (1O2G) signal pattern will be observed.
Ordering Information Quantity Order No.
Vysis CSF1R/D5S23, D5S721 FISH Probe KitCE marked 20 µl 5N0320
References1. Kelaidi C, Eclache V, Fenaux P. The role of lenalidomide in the management of myelodysplasia with del 5q.
Br J Haematol. 2008; 140(3): 267278.2. Boultwood J, Fidler C, Strickson AJ, et al. Narrowing and genomic annotation of the commonly deleted region
of the 5qsyndrome. Blood. 2002; 99(12): 46384641.3. Bram S, Swolin B, Rödjer S, et al. Is monosomy 5 an uncommon aberration?
Cancer Genet Cytogenet. 2003; 142(2): 107114.4. Herry A, DouetGuilbert N, Morel F, et al. Redefining monosomy 5 by molecular cytogenetics in 23 patients
with MDS/AML. Eur J Haematol. 2007; 78(6): 457467.5. Wiktor AE, Van Dyke DL, Stupca PJ, et al. Preclinical validation of fluorescence in situ hybridization assays
for clinical practice. Genet Med. 2006; 8(1): 1623.
LSI CSF1R/D5S23, D5S721 Dual Color Probe hybridized to a normal metaphase cell showing the two orange, two green (2O2G) signal pattern.

6-31All products, except where indicated, are Analyte Specific Reagents. Analytical and performance characteristics are not established.
Oncology – Hematology
13
13q14 LSI D13S25SpectrumOrange
D13
S31
9
RB–1 D13
S25
LSI D13S25
13q14.3 regionCentromere Telomere
~160 kb
Vysis LSI D13S25 (13q14.3) SpectrumOrange Probe
The LSI D13S25 Probe may be used to identify deletions in the 13q14.3 region. A candidate tumor suppressor gene may reside telomeric of the RB1 gene at 13q14. Deletion of the locus D13S25 at 13q14.3 occurs in a substantial number of cases without deletion of the RB1 gene.
The LSI D13S25 Probe is an approximately 160 kb SpectrumOrange labeled probe.
Results of HybridizationIn a normal cell, the expected pattern for a nucleus hybridized with the LSI D13S25 probe is the two orange (2O) signal pattern. In a hybridized abnormal cell containing the deletion, the one orange (1O) signal pattern will be observed.
Ordering Information Quantity Order No.
Vysis LSI D13S25 (13q14.3) SpectrumOrange Probe CE marked 20 µl 1N3720
References1. Corcoran MM, Hammersund M, Zhu C, et al. DLEU2 Encodes an Antisense RNA for the Putative Bicistronic
RFP2/LEU5 Gene in Humans and Mouse. Genes Chromosomes Cancer 2004; 40: 28597.2. Calin GA, Dumitru CD, Shimizu M, et al. Frequent deletions and downregulation of microRNA genes miR15
and miR16 at 13q14 in chronic lymphocytic leukemia. Proc Natl Acad Sci USA 2002; 99(24): 1552429.3. Mertens D, Wolf S, Tschuch C, et al. Allelic silencing at the tumorsuppressor locus 13q14.3 suggests
an epigenetic tumorsuppressor mechanism. Proc Natl Acad Sci USA 2006; 103(20): 774146.4. Navarro B, GarciaMarco JA, Jones D, et al. Association and clonal distribution of trisomy 12 and 13q14 deletions
in chronic lymphotic leukaemia. Br J Haematol 1998; 102: 133034.5. Königsberg R, Ackermann J, Kaufmann H, et al. Deletions of chromosome 13q in monoclonal gammopathy
of undetermined significance. Leukemia 2000; 14: 197579.6. Wiktor AE, Van Dyke DL, Stupca PJ, et al. Preclinical validation of fluorescence in situ hybridization assays
for clinical practice. Genet Med. 2006; 8(1): 1623.
LSI D13S25 Single Color Probe hybridized to a normal metaphase showing the two orange (2O) signal pattern.

All products, except where indicated, are Analyte Specific Reagents. Analytical and performance characteristics are not established.6-32
Oncology – Hematology
13q14 Region13q34 Region
135 kb
13
13q14 Region13q34 Region
135 kb
Vysis D13S319/13q34 FISH Probe Kit previously Vysis LSI D13S319 (13q14.3) SpectrumOrange/Vysis LSI 13q34 SpectrumGreen Probe
The Vysis D13S319/LSI13q34 FISH Probe Kit is intended to detect the copy number of the LSI D13S319 probe target located at chromosome 13q14 and the copy number of the LSI13q34 probe target located at chromosome 13q34.
Loss 13q or all of chromosome 13 occurs commonly in multiple myeloma.1 AvetLoiseau et al2 utilized the Vysis D13S319 probe in alarge study to demonstrate the negative effects of the loss of 13q on eventfree survival and overall survival in myeloma patients.
The approximately 135 kb SpectrumOrange D13S319 probe contains the D13S319 marker and is located at chromosome 13q14 (chr13:49500369 49635302 March 2006 UCSC Browser).
Results of Hybridization:In a cell with normal copy numbers of the LSI D13S319/LSI13q34 Probetargets, two orange signals and two green signals will be expected.The expected abnormal pattern is one orange and two green signals(deletion pattern) or one orange and one green signal (monosomypattern). Other abnormal FISH signal patterns may be observed andmetaphase analysis may be useful in interpreting these results.
Ordering Information Quantity Order No.
Vysis D13S319/13q34 FISH Probe Kit CE marked 20 µl 5N3720
References1. Fonseca R, Blood E, Rue M, et al. Clinical and biologic implications of recurrent genomic aberrations in myeloma.
Blood. 2003;101(11):456975.2. AvetLoiseau H, Attal M, Moreau P, et al. Genetic abnormalities and survival in multiple myeloma: the experience of the
Intergroup Francophone du Myélome. Blood. 2007;109(8):348995.3. Wiktor AE, Van DL, Stupca PJ, et al. Preclinical validation of fluorescence in situ hybridization assays for clinical practice.
Genet Med. 2006;8(1):1623.
Normal nucleus showing the two green and two orange signals.
Abnormal nucleus showing the two green and one orange signal.
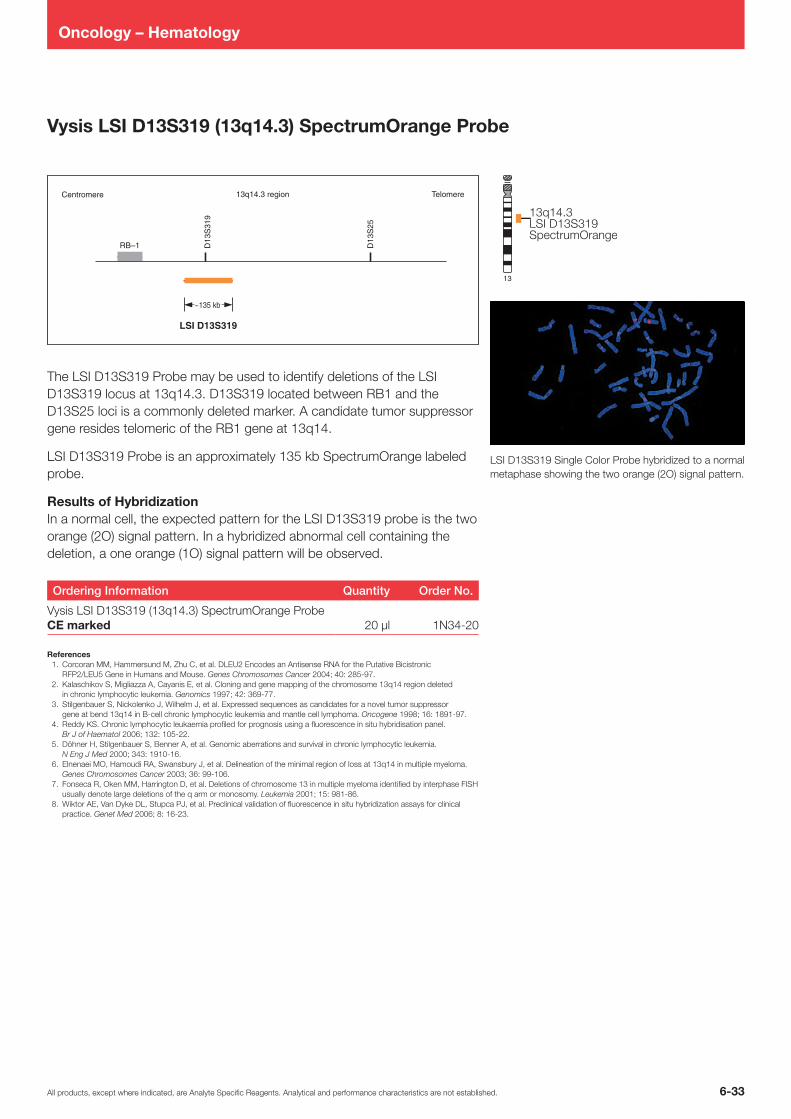
6-33All products, except where indicated, are Analyte Specific Reagents. Analytical and performance characteristics are not established.
Oncology – Hematology
~135 kb
13q14.3 regionD
13S
319
RB–1 D13
S25
LSI D13S319
Centromere Telomere
13
Vysis LSI D13S319 (13q14.3) SpectrumOrange Probe
The LSI D13S319 Probe may be used to identify deletions of the LSI D13S319 locus at 13q14.3. D13S319 located between RB1 and the D13S25 loci is a commonly deleted marker. A candidate tumor suppressor gene resides telomeric of the RB1 gene at 13q14.
LSI D13S319 Probe is an approximately 135 kb SpectrumOrange labeled probe.
Results of HybridizationIn a normal cell, the expected pattern for the LSI D13S319 probe is the two orange (2O) signal pattern. In a hybridized abnormal cell containing the deletion, a one orange (1O) signal pattern will be observed.
Ordering Information Quantity Order No.
Vysis LSI D13S319 (13q14.3) SpectrumOrange Probe CE marked 20 µl 1N3420
References1. Corcoran MM, Hammersund M, Zhu C, et al. DLEU2 Encodes an Antisense RNA for the Putative Bicistronic
RFP2/LEU5 Gene in Humans and Mouse. Genes Chromosomes Cancer 2004; 40: 28597.2. Kalaschikov S, Migliazza A, Cayanis E, et al. Cloning and gene mapping of the chromosome 13q14 region deleted
in chronic lymphocytic leukemia. Genomics 1997; 42: 36977.3. Stilgenbauer S, Nickolenko J, Wilhelm J, et al. Expressed sequences as candidates for a novel tumor suppressor
gene at bend 13q14 in Bcell chronic lymphocytic leukemia and mantle cell lymphoma. Oncogene 1998; 16: 189197.4. Reddy KS. Chronic lymphocytic leukaemia profiled for prognosis using a fluorescence in situ hybridisation panel.
Br J of Haematol 2006; 132: 10522.5. Döhner H, Stilgenbauer S, Benner A, et al. Genomic aberrations and survival in chronic lymphocytic leukemia.
N Eng J Med 2000; 343: 191016.6. Elnenaei MO, Hamoudi RA, Swansbury J, et al. Delineation of the minimal region of loss at 13q14 in multiple myeloma.
Genes Chromosomes Cancer 2003; 36: 99106.7. Fonseca R, Oken MM, Harrington D, et al. Deletions of chromosome 13 in multiple myeloma identified by interphase FISH
usually denote large deletions of the q arm or monosomy. Leukemia 2001; 15: 98186.8. Wiktor AE, Van Dyke DL, Stupca PJ, et al. Preclinical validation of fluorescence in situ hybridization assays for clinical
practice. Genet Med 2006; 8: 1623.
LSI D13S319 Single Color Probe hybridized to a normal metaphase showing the two orange (2O) signal pattern.

All products, except where indicated, are Analyte Specific Reagents. Analytical and performance characteristics are not established.6-34
Oncology – Hematology
D20
S10
8
LSI D20S108
20q12 regionCentromere Telomere
~170 kb
20
Vysis D20S108 FISH Probe Kit previously: Vysis LSI D20S108 (20q12) SpectrumOrange Probe
The Vysis LSI D20S108 fluorescence in situ hybridization (FISH) probe is intended to detect deletions of Vysis LSI D20S108 probe target locus on 20q12.
Acquired deletions of the long arm of chromosome 20 are found in ~4 % of patients with a myelodysplastic syndrome (MDS) and in 1 to 2% of patients with acute myeloid leukemia (AML) and myeloproliferative disorders (MPD).1 Cytogenetic analysis of del(20q) revealed that the deletion is variable in size, with a commonly deleted region (CDR) spanning 20q11.2 to q12. Within the commonly deleted segment lies the SRC oncogene and possibly other tumor suppressor genes.2, 3 The CDR is defined as a 2.7 Mb segment in MPD and a 2.6 Mb segment in AML/MDS, with an overlapping region of 1.7 Mb.3, 4 In a study of 36 MPD, MDS, and AML patients with del(20q), statistical analyses showed that patients with del(20q) as a sole cytogenetic aberration (favorable subgroup) live longer than patients with del(20q) and other chromosomal changes (poor prognosis subgroup).1 Among patients from MDS, MPD and MDS/MPD groups, DouetGuilbert et al4 identified one commonly deleted region in all 38 investigated samples using FISH, including the Vysis LSI D20S108 FISH Probe.
The Vysis LSI D20S108 Probe is an approximately 201 kb SpectrumOrange labeled probe and contains the D20S108 locus located on chromosome 20q12.
Results of HybridizationIn a normal cell hybridized with the LSI D20S108 probe, the expected pattern is the two orange (2O) signal pattern. In an abnormal cell containing the deletion, the one orange (1O) signal pattern will be observed.
Ordering Information Quantity Order No.
Vysis D20S108 FISH Probe Kit CE marked 20 µl 5N0220
References1. Bfezinová J, Zemanová Z, Ransdorfová Š, et al. Prognostic significance of del(20q) in patients with hematological
malignancies. Cancer Genet Cytogenet. 2005;160(2):188192.2. Roulston D, Espinosa R 3rd, Stoffel M, et al 1993. Molecular genetics of myeloid leukemia: identification of the commonly
deleted segment of chromosome 20. Blood. 1993;82(11):34243429.3. Bench AJ, Nacheva EP, Hood TL, et al. Chromosome 20 deletions in myeloid malignancies: reduction of the common
deleted region, generation of a PAC/BAC contig and identification of candidate genes. UK Cancer Cytogenetics Group (UKCCG) Oncogene. 2000; 19(34):39023913.
4. DouetGuilbert N, Basinko F, Morel F, et al. Chromosome 20 deletions in myelodysplastic syndromes and Philadelphiachromosomenegative myeloproliferative disorders: characterization by molecular cytogenetics of commonly deleted and retained regions. Ann Hematol. 2008;87(7):537544.
5. Wiktor AE, Van Dyke DL, Stupca PJ, et al. Preclinical validation of fluorescence in situ hybridization assays for clinical practice. Genet Med. 2006;8(1):1623.
LSI D20S108 Single Color Probe hybridized to normal cells showing the two orange (2O) signal pattern.

6-35All products, except where indicated, are Analyte Specific Reagents. Analytical and performance characteristics are not established.
Oncology – Hematology
Vysis LSI D5S23/D5S721, CEP9, CEP 15 Multi-Color Probe
The LSI D5S23/D5S721, CEP 9, CEP 15 Multicolor Probe Set is comprised of a mixture of an approximately 450 kb SpectrumGreen labeled D5S23/D5S721 probe, a SpectrumAqua labeled CEP 9 probe and a SpectrumOrange labeled CEP 15 probe. The LSI D5S23/D5S721 probe is specific for the 5p15.2 region. The CEP 9 probe is specific for the alpha satellite (centromeric) region, 9p11q11. The CEP 15 probe is specific for the alpha satellite (D15Z4 centromeric) region, 15p11.1q11.1.
Results of HybridizationIn a normal cell that lacks hyperdiploidy of chromosome 5, chromosome 9 and chromosome 15, a two green, two aqua and two orange signal pattern will be observed reflecting the two copies of each chromosome. In an abnormal cell containing hyperdiploidy of either chromosome 5, chromosome 9 or chromosome 15, greater than two signals will be observed for the respective chromosomes.
Ordering Information Quantity Order No.
Vysis LSI D5S23/D5S721, CEP 9, CEP 15 MultiColor Probe 20 µl 5J8407
References1. Fonseca, R., et al. Cancer Research 64 (2004): 15461558.2. Fonseca, R., et al. Blood 102 (7) (2003): 25622567.3. DebesMarun, C., et al. Leukemia 17 (2003): 427436.4. Fonseca, R., et al. Blood 101 (11) (2003): 45694575.5. PerezSimon, J., et al. Blood 91 (1998): 33663371.
An interphase cell hybridized with the LSI D5S23/D5S721, CEP 9, CEP 15 Probe. The cell shows the two green (LSI D5S23/D5S721), two aqua (CEP 9) and two orange (CEP 15) signal patterns.
An interphase cell hybridized with the LSI D5S23/D5S721, CEP 9, CEP 15 Probe. The cell in this image shows a two green (LSI D5S23/D5S721), three aqua (CEP 9) and three orange (CEP 15) signal patterns.

All products, except where indicated, are Analyte Specific Reagents. Analytical and performance characteristics are not established.6-36
Oncology – Hematology
7q31 region
D7S
486
LSI D7S486
~200 kb
Centromere Telomere
Vysis D7S486/CEP 7 FISH Probe Kitpreviously: Vysis LSI D7S486 (7q31) SpectrumOrange/CEP 7 SpectrumGreen Probe
The Vysis D7S486/CEP7 FISH Probe Kit is intended to detect the copy number of the LSI D7S486 and CEP 7 probe targets located at chromosome 7q31 and 7p11.1q11.1, respectively.
Monosomy 7 and loss of chromosome 7q are observed in a variety of myeloid malignancies such as myelodysplastic syndromes (MDS) and acute myeloid leukemia (AML). In some instances, these abnormalities are associated with patient outcome.1,2 The Vysis LSI D7S486 SpectrumOrange/CEP 7 SpectrumGreen Probes have been used to detect copy number abnormalities of the LSI D7S486 and CEP7 probe targets in both AML and MDS.3,4
The Vysis LSI D7S486 SpectrumOrange/CEP 7 SpectrumGreen Probes are a mixture of a SpectrumOrange D7S486 probe (7q31) and a SpectrumGreen CEP 7 probe (7p11.1q11.1). The LSI D7S486 probe target is approximately 308 kb in length.The CEP 7 probe targets the D7Z1 alpha satellite sequence at the centromere of chromosome 7.
Results of HybridizationIn a normal cell, the expected pattern when hybridized with the LSI D7S486/CEP 7 probe is the two orange, two green (2O2G) signal pattern. In a hybridized abnormal cell containing the deletion, the one orange, two green (1O2G) signal pattern will be observed.
Ordering Information Quantity Order No.
Vysis D7S486/CEP 7 FISH Probe Kit CE marked 20 µl 5N0720
References1. Bernasconi P, Klersy C, Boni M, et al. Br J Haematol. 2007;137(3):193205.2. Byrd JC, Mrózek K, Dodge RK, et al. Blood. 2002;100(13):43254336.3. Cherry AM, Brockman SR, Paternoster SF, et al. Leuk Res. 2003;27(12):10851090.4. Vance GH, Kim H, Hicks GA, et al. Leuk Res. 2007;31(5):605609.5. Wiktor AE, Van Dyke DL, Stupca PJ, et al.Genet Med. 2006;8(1):1623.
LSI D7S486/CEP 7 Dual Color Probe hybridized to a normal nucleus showing the two orange, two green (2O2G) signal pattern.

6-37All products, except where indicated, are Analyte Specific Reagents. Analytical and performance characteristics are not established.
Oncology – Hematology
Vysis D7S522 / CEP 7 FISH Probe Kit previously: Vysis LSI D7S522 (7q31) SpectrumOrange/CEP 7 SpectrumGreen Probe
The Vysis D7S522/CEP7 FISH Probe Kit is intended to detect the copy number of the LSI D7S522 and CEP 7 probe targets located at chromosome 7q31 and 7p11.1q11.1, respectively. Monosomy 7 and loss of chromosome 7q are observed in a variety of myeloid malignancies such as myelodysplastic syndromes (MDS) and acute myeloid leukemia (AML). In some instances, these abnormalities are associated with patient outcome.1,2 The Vysis LSI D7S522 SpectrumOrange/CEP 7 SpectrumGreen Probes have been used to detect copy number abnormalities of the LSI D7522 and CEP7 probe targets in both AML and MDS.3,4 The Vysis LSI D7S522 SpectrumOrange/CEP 7 SpectrumGreen Probes are a mixture of a SpectrumOrange D7S522 probe (7q31) and a SpectrumGreen CEP 7 probe (7p11.1q11.1). The LSI D7S522 probe target is approximately 224 Kb in length. The CEP 7 probe targets the D7Z1 alpha satellite sequence at the centromere of chromosome 7.
Results of HybridizationIn a normal cell hybridized with the LSI D7S522/CEP 7 Probe, the expected pattern is the two orange, two green (2O2G) signal pattern. In an abnormal cell containing the deletion, the one orange, two green (1O2G) signal pattern will be observed.
Ordering Information Quantity Order No.
Vysis D7S522/CEP 7 FISH Probe Kit CE marked 20 µl 5N0820
References1. Bernasconi P, Klersy C, Boni M, et al. World Health Organization classification in combination with cytogenetic markers
improves the prognostic stratification of patients with de novo primary myelodysplastic syndromes. Br J Haematol. 2007;137(3):193205.
2. Byrd JC, Mrózek K, Dodge RK, et al. Pretreatment cytogenetic abnormalities are predictive of induction success, cumulative incidence of relapse, and overall survival in adult patients with de novo acute myeloid leukemia: results from Cancer and Leukemia Group B (CALGB 8461). Blood. 2002;100(13):43254336.
3. Li X, Wu L, Ying S, et al. Differentiation and hematopoieticsupport of clonal cells in myelodysplastic syndromes Leuk Lymphoma. 2007; 48(7):13531371.
4. Abdelrazik HN, Farawila HM, Sherif MA, et al. Molecular characterization of chromosome 7 in AML and MDS patients. Afr J Health Sci. 2006;13(34):3342.
5. Wiktor AE, Van Dyke DL, Stupca PJ, et al. Preclinical validation of fluorescence in situ hybridization assays for clinical practice. Genet Med. 2006;8(1):1623.
LSI D7S522/CEP 7 Dual Color Probe hybridized to a normal metaphase cell showing the two orange, two green (2O2G) signal pattern.

All products, except where indicated, are Analyte Specific Reagents. Analytical and performance characteristics are not established.6-38
Oncology – Hematology
LSI D5S23, D5S721
5p15.2 regionTelomere Centromere
~450 kb
LSI EGR1
5q31 regionCentromere Telomere
~200 kb
EG
R1
Exo
n 3
D5S
23
D5S
2064
D5S
630
D5S
721
D5S
1514
E
D5S
1518
E
5
5p15.2 LSI D5S23, D5S721SpectrumGreen
LSI D5S23, D5S721
5p15.2 regionTelomere Centromere
~450 kb
LSI EGR1
5q31 regionCentromere Telomere
~200 kb
EG
R1
Exo
n 3
D5S
23
D5S
2064
D5S
630
D5S
721
D5S
1514
E
D5S
1518
E
Vysis LSI EGR1/D5S23, D5S721 Dual Color Probe Set
The LSI EGR1/D5S23, D5S721 Dual Color Probe may be used to detect deletions of 5q31 containing the EGR1 locus. The LSI D5S23, D5S721 probe aids in determining if the deletion is of the whole chromosome 5 (5) versus 5q.
The LSI EGR1/D5S23, D5S721 Probe is a mixture of the approximately 200 kb SpectrumOrange labeled LSI EGR1 probe and the approximately 450 kb SpectrumGreen labeled LSI D5S23, D5S721 probe.
Results of HybridizationIn a normal cell, the expected pattern for a nucleus hybridized with the LSI EGR1/D5S23, D5S721 probe is the two orange, two green (2O2G) signal pattern. In a hybridized abnormal cell containing the deletion, the one orange, two green (1O2G) signal pattern will be observed.
Ordering Information Quantity Order No.
Vysis LSI EGR1/D5S23, D5S721 Dual Color Probe Set CE marked 20 µl 8L6820
References1. Lai F, Godley LA, Joslin J, et al. Genomics 2001; 71: 23545.2. Joslin JM, Femald AA, Tennant TR, et al. Blood 2007; 110(2): 719726.3. Zou YS, Fink SR, Stockero KJ, et al. Leuk Res 2007; 31: 118589.4. Vance GH, Kim H, Hicks GA, et al. Leuk Res 2007; 31: 60509.5. Wiktor AE, Van Dyke DL, Stupca PJ, et al. Genet Med 2006; 8: 1623.
LSI EGR1/D5S721, D5S23 Dual Color Probe hybridized to normal cells showing the two orange, two green (2O2G) signal pattern.
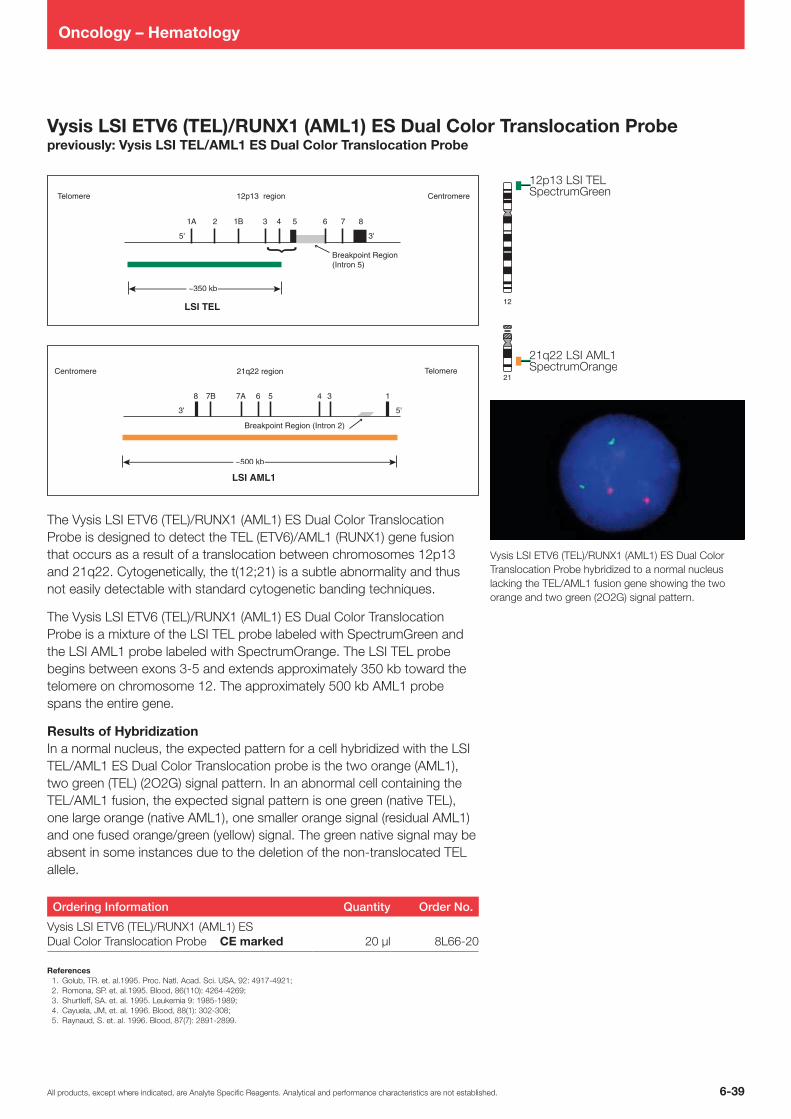
6-39All products, except where indicated, are Analyte Specific Reagents. Analytical and performance characteristics are not established.
Oncology – Hematology
LSI AML1
LSI TEL
~500 kb
134
Breakpoint Region (Intron 2)
567A7B8
3' 5'
~350 kb
5' 3'
Breakpoint Region (Intron 5)
32 4 5 6 71B1A 8
Centromere Telomere
12p13 region
21q22 region
Telomere Centromere
12
21
LSI AML1
LSI TEL
~500 kb
134
Breakpoint Region (Intron 2)
567A7B8
3' 5'
~350 kb
5' 3'
Breakpoint Region (Intron 5)
32 4 5 6 71B1A 8
Centromere Telomere
12p13 region
21q22 region
Telomere CentromereVysis LSI ETV6 (TEL)/RUNX1 (AML1) ES Dual Color Translocation Probepreviously: Vysis LSI TEL/AML1 ES Dual Color Translocation Probe
The Vysis LSI ETV6 (TEL)/RUNX1 (AML1) ES Dual Color Translocation Probe is designed to detect the TEL (ETV6)/AML1 (RUNX1) gene fusion that occurs as a result of a translocation between chromosomes 12p13 and 21q22. Cytogenetically, the t(12;21) is a subtle abnormality and thus not easily detectable with standard cytogenetic banding techniques.
The Vysis LSI ETV6 (TEL)/RUNX1 (AML1) ES Dual Color Translocation Probe is a mixture of the LSI TEL probe labeled with SpectrumGreen and the LSI AML1 probe labeled with SpectrumOrange. The LSI TEL probe begins between exons 35 and extends approximately 350 kb toward the telomere on chromosome 12. The approximately 500 kb AML1 probe spans the entire gene.
Results of HybridizationIn a normal nucleus, the expected pattern for a cell hybridized with the LSI TEL/AML1 ES Dual Color Translocation probe is the two orange (AML1), two green (TEL) (2O2G) signal pattern. In an abnormal cell containing the TEL/AML1 fusion, the expected signal pattern is one green (native TEL), one large orange (native AML1), one smaller orange signal (residual AML1) and one fused orange/green (yellow) signal. The green native signal may be absent in some instances due to the deletion of the nontranslocated TEL allele.
Ordering Information Quantity Order No.
Vysis LSI ETV6 (TEL)/RUNX1 (AML1) ES Dual Color Translocation Probe CE marked 20 µl 8L6620
References1. Golub, TR. et. al.1995. Proc. Natl. Acad. Sci. USA, 92: 49174921; 2. Romona, SP. et. al.1995. Blood, 86(110): 42644269; 3. Shurtleff, SA. et. al. 1995. Leukemia 9: 19851989; 4. Cayuela, JM, et. al. 1996. Blood, 88(1): 302308; 5. Raynaud, S. et. al. 1996. Blood, 87(7): 28912899.
Vysis LSI ETV6 (TEL)/RUNX1 (AML1) ES Dual Color Translocation Probe hybridized to a normal nucleus lacking the TEL/AML1 fusion gene showing the two orange and two green (2O2G) signal pattern.

All products, except where indicated, are Analyte Specific Reagents. Analytical and performance characteristics are not established.6-40
Oncology – Hematology
LSI ETV6 (TEL) Dual Color, Break Apart
12p13 RegionTelomere Centromere
~490 kb ~630 kb~140 kb
gap
RH
7140
1
ET
V6
BC
L2L1
4
DU
SP
16
CD
KN
1B
5‘ 3‘
12
12p13LSI ETV6SpectrumOrangeSpectrumGreen
Vysis ETV6 Break Apart FISH Probe Kitpreviously Vysis LSI ETV6 (TEL) (12p13) Dual Color, Break Apart Rearrangement Probe
Hybridization with the Vysis ETV6 Break Apart FISH Probe Kit will identify rearrangements at the ETV6 gene region, regardless of what other chromosomal regions are involved. For example, this will allow detection of a chromosomal break caused by a translocation in the ETV6 gene region even when the translocation partner is unknown.
The Vysis ETV6 Break Apart FISH Probe Kit is a mixture of two probes. The first probe, a 630 kb probe labeled in SpectrumGreen begins about 6 kb proximal to the ETV6 (TEL) gene and extends to toward the centromere. The second probe, labeled in SpectrumOrange, begins within ETV6 intron 2 and extends toward the 12p telomere for approximately 490 kb. There is a gap between the two probes of about 140 kb.
Results of HybridizationHybridization of this probe to interphase nuclei of normal cells is expected to produce two pair of overlapping, or nearly overlapping, orange and green (yellow fusion) signals. The anticipated signal pattern in abnormal cells having a chromosomal breakpoint within the gap between the two probe targets on one chromosome 12 is one orange, one green, and one fusion signal. Other patterns may be observed if additional genetic alterations are present.
Ordering Information Quantity Order No.
Vysis ETV6 Break Apart FISH Probe Kit CE marked 20 µl 4N0920
References1. Bohlander SK. Semin Cancer Biol. 2005;15(3):162174. 2. Odero MD, Carlson K, Calasanz MJ, et al. Genes Chromosomes Cancer. 2001;31(2):134142.3. Schwindt H, Vater I, Kreuz M, et al. Leukemia. 2009. [Epub ahead of print]4. Park J, Kim M, Lim J, et al. Cancer Genet Cytogenet. 2009;191(2):102105.5. Wiktor AE, Van Dyke DL, Stupca PJ, et al. Genet Med. 2006;8(1):1623.
Normal cell hybridization using the Vysis ETV6 Break Apart FISH Probe Kit.
Abnormal cell hybridization using the Vysis ETV6 Break Apart FISH Probe Kit.

6-41All products, except where indicated, are Analyte Specific Reagents. Analytical and performance characteristics are not established.
Oncology – Hematology
14
LSI IGH Dual Color, Break Apart
~900 kb
Centromere
Constant gene segments
J se
gmen
tsD
seg
men
ts
Variable gene segments
LSI IGHV ProbeLSI IGH 3' Flanking Probe
3' 5'
14q32 region Telomere
~250 kb
Immunoglobulin Heavy Chain Locus
Vysis LSI IGH Dual Color, Break Apart Rearrangement Probe
The LSI IGH Dual Color, Break Apart Rearrangement Probe is designed to detect chromosomal breakage of the immunoglobulin heavy chain (IGH) locus that is associated with 14q32 translocations involving a variety of other loci. Breakpoints within the IGH locus may occur at either the J segments [e.g., breakpoints commonly observed with t(14;18)] or within switch sequences located within the constant gene segments.
The LSI IGH Dual Color, Break Apart Rearrangement Probe is a mixture of two probes that hybridize to opposite sides of the J through constant regions of the IGH locus. The approximately 900 kb SpectrumGreen labeled LSI IGHV probe covers essentially the entire IGH variable region. The hybridization target of the approximately 250 kb SpectrumOrange labeled LSI IGH 3’ flanking probe lies completely 3’ to the IGH locus. As a result of this probe design, any translocation with a breakpoint at the J segments or within switch sequences should produce separate orange and green signals.
Results of HybridizationWhen hybridized to a normal nucleus, the LSI IGH Dual Color, Break Apart Rearrangement Probe produces a two orange/green (yellow) fusion (2F) signal pattern. As there is no probe targeted to the J or constant regions, a slight gap between the two differently colored probe signals may sometimes be observed in nuclei from normal cells. When the IGH Dual Color, Break Apart Translocation Probe is hybridized to a nucleus containing an IGH translocation, one orange, one green, and one orange/green fusion signal pattern is observed (1O1G1F). This signal pattern indicates that the genomic targets for the LSI IGHV and LSI IGH 3’ flanking probes have been physically separated as a result of the translocation. As V(D)J rearrangements may occur on either, or both, of the translocated and nontranslocated IGH alleles, the green LSI IGHV probe signal intensity on either, or both, of the alleles may be diminished as a result of probe target deletion in some samples.
Ordering Information Quantity Order No.
Vysis LSI IGH Dual Color, Break Apart Rearrangement Probe CE marked 20 µl 8L6320
LSI IGH Dual Color, Break Apart Rearrangement Probe hybridized to normal nuclei exhibiting the expected two fusion (2F) signal pattern.
References1.Chesi, M., et al. Ann. Oncol. 11 (2000): S1315. 2.DeVita,V.T. Cancer: Principles Practices of Oncology 5th ed. (1997).

All products, except where indicated, are Analyte Specific Reagents. Analytical and performance characteristics are not established.6-42
Oncology – Hematology
LSI IGH
~1.5 Mb
Centromere
Constant gene segments
J se
gmen
tsD
seg
men
tsVariable gene segments
Immunoglobulin Heavy Chain Locus
~750 kb
LSI BCL2
14q32 region Telomere
Centromere Telomere
Exo
n 2
D18
S91
Exo
n 3
MB
R
MC
R
Exo
n 1
FV
T1
D18
S87
18q21 region
3' 5'
3' 5'
14
18
LSI IGH
~1.5 Mb
Centromere
Constant gene segments
J se
gmen
tsD
seg
men
ts
Variable gene segments
Immunoglobulin Heavy Chain Locus
~750 kb
LSI BCL2
14q32 region Telomere
Centromere Telomere
Exo
n 2
D18
S91
Exo
n 3
MB
R
MC
R
Exo
n 1
FV
T1
D18
S87
18q21 region
3' 5'
3' 5'
Vysis LSI IGH/BCL2 Dual Color, Dual Fusion Translocation Probe
The LSI IGH/BCL2 Dual Color, Dual Fusion Translocation Probe is designed to detect the juxtaposition of immunoglobulin heavy chain (IGH) locus and BCL2 gene sequences. The translocation involving IGH at 14q32 and BCL2 at 18q21, t(14;18)(q32;q21) is common. Relocation of an IGH transcriptional enhancer next to the BCL2 gene as a result of the t(14;18) translocation is thought to cause constitutive overexpression of the antiapoptotic BCL2 protein. The breakpoints at 14q32 occur at the IGH J segments and about 75% of the breaks at 18q21 occur in either the 2.8 kb major breakpoint region (MBR) 3’ of BCL2 exon 3 or in the minor cluster region (MCR) located about 30 kb 3’ to the MBR. The remaining BCL2 breakpoints are thought to lie between the MBR and MCR regions, or 5’ of the BCL2 gene.
The LSI IGH/BCL2 Dual Color, Dual Fusion Translocation Probe is a mixture of the LSI IGH probe labeled with SpectrumGreen spanning approximately 1.5 Mb and containing sequences homologous to essentially the entire IGH locus, as well as sequences extending about 300 kb beyond the 3’ end of the IGH locus. The LSI BCL2 probe labeled with SpectrumOrange covers an approximate 750 kb region, including the entire BCL2 gene with additional sequences extending approximately 250 kb both distal and proximal to the gene.
Results of HybridizationThe expected pattern in a normal nucleus hybridized with the LSI IGH/BCL2 probe is the two orange, two green signal pattern (2O2G). In a nucleus harboring a t(14;18), the most common pattern is one orange signal, one green signal (representing the normal homolog) and two orange/green (yellow) fusion signals representing the two derivative chromosomes resulting from the reciprocal translocation (1O1G2F pattern). Patterns other than 1O1G2F may be observed in some abnormal cells including instances of nuclei containing more than two fusion signals.
Ordering Information Quantity Order No.
Vysis LSI IGH/BCL2 Dual Color, Dual Fusion Translocation Probe CE marked 20 µl 8L6020
LSI IGH/BCL2 Dual Color, Dual Fusion Translocation Probe hybridized to an abnormal nucleus containing the t(14;18) (q32;q21) showing the 1O1G2F signal pattern.
References1. Rowely J. J Clin Oncol 1988;6:919925.2. Horsman D, Gascoyne R, Coupland R, et al.
AM J Clin Pathol 1995;103:472478.3. Jacobson J, Wilkes B, Kwiatkowski D, et al. Cancer 1993;72:2316.4. Weiss L, Warnke R, Sklar J, et al.
N Engl J Med 1987;317(19):118589.5. Nowakowski GS, Dewald GW, Hoyer JD, et al.
Br J Haematol 2005;130:3642.6. Streubel B, Scheucher B, Valencak J, et al.
AM J Surg Pathol 2006;20(4):52936.7. Paternoster SF, Brockman SR, McClure RF, et al.
Am J Pathol 2002;160(6):196772.8. Einerson RR, Kurtin PJ, Dayharsh GA, et al.
Am J Clin Pathol 2005;124:42129.9. Barrans SL, Evans P, O’Connor S, et al.
J Mol Diagn 2003;5:16875.10. Wiktor AE, Van Dyke DL, Stupca PJ, et al.
Genet Med 2006;8:1623.

6-43All products, except where indicated, are Analyte Specific Reagents. Analytical and performance characteristics are not established.
Oncology – Hematology
LSI IGH
~450 kb ~450 kb ~450 kb
Constant gene segments
J s
eg
me
nts
D s
eg
me
nts
Variable gene segments
LSI IGH (constant probe) LSI IGH (variable probe)
14q32 regionCentromere Telomere
Centromere Telomere
LSI CCND1
~350 kb
5' 3'
MTC
11q13 region
3' 5'
Immunoglobulin Heavy Chain Locus
11
14
LSI IGH
~450 kb ~450 kb ~450 kb
Constant gene segments
J s
eg
me
nts
D s
eg
me
nts
Variable gene segments
LSI IGH (constant probe) LSI IGH (variable probe)
14q32 regionCentromere Telomere
Centromere Telomere
LSI CCND1
~350 kb
5' 3'
MTC
11q13 region
3' 5'
Immunoglobulin Heavy Chain Locus
Vysis IGH/CCND1 DF FISH Probe Kit previously Vysis LSI IGH/CCND1 Dual Color, Dual Fusion Translocation Probe
These fluorescence in situ hybridization (FISH) probes are intended to detect the t(11;14)(q13;q32) reciprocal translocation involving the IGH and CCND1 gene regions.Mantle cell lymphoma is commonly associated with the balanced translocation t(11;14)(q13;q32).1 Mantle cell lymphoma has the most aggressive clinical course among the small cell lymphomas. FISH has emerged as an important aid in the diagnosis of mantle cell lymphoma.1, 2, 3 The Vysis LSI IGH/CCND1 Dual Color Dual Fusion Probes have been used in publications to detect t(11;14) in Mantle Cell Lymphoma.3, 4
Results of HybridizationLSI IGH/CCND1 hybridized to a cell containing t(11;14) with breakpoints at the MTC on 11q13 and at the IGH J region on 14q32 is expected to result in a signal pattern of two orange/green (yellow) fusions, one on each of the abnormal chromosomes 11 and 14 and single orange and green signals from the normal chromosomes.
Due to the gap between the two probes in the IGH probe set, the normal IGH loci may sometimes appear as two slightly separated green signals. This gap may also cause a slight separation of the orange and green signals on the der(11) chromosome, in some instances. Analysis of t(11;14) samples suggests that due to variation in breakpoint location on 11q13 and loss of V segments within the LSI IGH probe target, some samples containing t(11;14) might display signal patterns different than 1O1G2F.
Ordering Information Quantity Order No.
Vysis IGH/CCND1 DF FISH Probe KitCE marked 20 µl 8L5820
References1. Cook JR. Diagn Mol Pathol. 2004;13(4):197206. 2. Zelenetz AD, Abramson JS, Advani RH, et al. National Comprehensive Cancer Network. 2009;3:1156.
Available at: http://www.nccn.org/professionals/physician_gls/PDF/nhl.pdf. Accessed November 16, 2009. 3. Sun T, Nordberg ML, Cotelingam JD, et al. Am J Hematol. 2003;74(1):7884. 4. Remstein ED, Kurtin PJ, Buño I, et al. Br J Haematol. 2000;110(4):85662.
Vysis IGH/CCND1 DF FISH Probe hybridized to an abnormal nucleus showing the common 1O1G2F signal pattern.

All products, except where indicated, are Analyte Specific Reagents. Analytical and performance characteristics are not established.6-44
Oncology – Hematology
Vysis IGH/CCND1 XT DF FISH Probe Kitpreviously Vysis LSI IGH/CCND1 XT Dual Color, Dual Fusion Translocation Probe
These fluorescence in situ hybridization (FISH) probes are intended to detect t(11;14)(q13;q32) reciprocal translocation involving the IGH and CCND1 gene regions.
The t(11;14)(q13;q32) is the most common translocation detected in myeloma.1,2,3 Patients with t(11;14) have been reported to have a better survival and response to treatment particularly high dose therapy and stem cell support.1,4 The Vysis LSI IGH/CCND1 XT Dual Color Dual Fusion Probes have been used in publications to detect t(11;14).5
The approximately 942 kb SpectrumOrange probe spans the CCND1 breakpoint region with gaps of 30 kb and 62 kb. the contig is composed of three segments of approximately 176 kb (chr11:6836347568539031; UCSC March 2006), 219 kb (chr11:6856859168787877; UCSC March 2006) and 455 kb (chr11:6885008869305335; UCSC March 2006). Th approximately 1.6 Mb SpectrumGreen probe spans the IGH region. (chr14:104736507106339460; UCSC March 2006).
Results of HybridizationThe expected normal signal pattern of the Vysis LSI IGH / CCND1 XT Dual Color Dual Fusion Probes are two orange signals and two green signals. The expected abnormal pattern of the Vysis LSI IGH/CCND1 XT Dual Color Dual Fusion Probes are one orange, one green, and two fusions. Other abnormal signal patterns may occur and metaphase analysis may be helpful in characterization of such patterns.
Ordering Information Quantity Order No.
Vysis IGH/CCND1 XT DF FISH Probe Kit CE marked 20 µl 5N3320
A normal interphase cell hybridized with the Vysis IGH/CCND1 XT DF FISH Probe. The cell shows the expected two orange (CCND1 XT), two green (IGH) signal pattern.
An abnormal interphase cell hybridized with the Vysis IGH/CCND1 XT DF FISH Probe. The cell in this image shows the one orange (CCND1 XT), one green (IGH), two fusion (der (11) and der (14)) signal pattern indicative of a t(11;14).
References1. Gertz MA, Lacy MQ, Dispenzieri A, et al. Clinical implications of
t(11;14)(q13;q32), t(4;14)(p16.3;q32), and 17p13 in myeloma patients treated with highdose therapy. Blood. 2005;106(8):283740.
2. Zelenetz AD, Abramson JS, Advani RH, et al. NCCN clinical practice guidelines in oncology: nonHodgkin’s lymphomas. J Natl Compr Canc Netw.2009;3:1156. Available at: http://www.nccn.org/professionals/physician_gls/PDF/nhl.pdf. Accessed 2009.
3. Soverini S, Cavo M, Cellini C, et al. Cyclin D1 overexpression is a favorable prognostic variable for newly diagnosed multiple myeloma patients treated with highdose chemotherapy and single or double autologous transplantation. Blood. 2003;102(5):158894.
4. Moreau P, Facon T, Leleu X, et al. Recurrent 14q32 translocations determine the prognosis of multiple myeloma, especially in patients receiving intensive chemotherapy. Blood. 2002;100(5):157983.
5. Bang SM, Kim YR, Cho HI, et al. Cancer Genet Cytogenet. 2006;168(2):12432.
6. Wiktor AE, Van Dyke DL, Stupka PJ, et al. Preclinical validation of fluorescence in situ hybridization assays for clinical practice. Genet Med. 2006;8(1):1623.
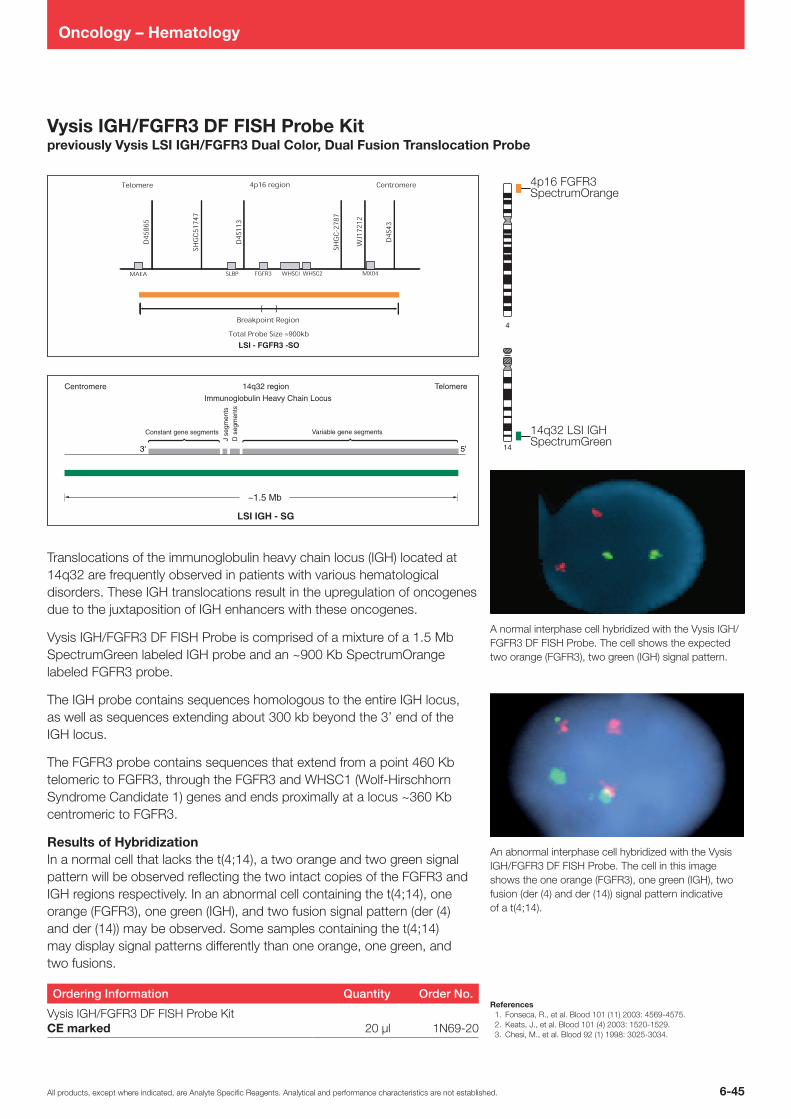
6-45All products, except where indicated, are Analyte Specific Reagents. Analytical and performance characteristics are not established.
Oncology – Hematology
LSI - FGFR3 -SO
4
4p16 FGFR3SpectrumOrange
14
LSI IGH - SG
Vysis IGH/FGFR3 DF FISH Probe Kitpreviously Vysis LSI IGH/FGFR3 Dual Color, Dual Fusion Translocation Probe
Translocations of the immunoglobulin heavy chain locus (IGH) located at 14q32 are frequently observed in patients with various hematological disorders. These IGH translocations result in the upregulation of oncogenes due to the juxtaposition of IGH enhancers with these oncogenes.
Vysis IGH/FGFR3 DF FISH Probe is comprised of a mixture of a 1.5 Mb SpectrumGreen labeled IGH probe and an ~900 Kb SpectrumOrange labeled FGFR3 probe.
The IGH probe contains sequences homologous to the entire IGH locus, as well as sequences extending about 300 kb beyond the 3’ end of the IGH locus.
The FGFR3 probe contains sequences that extend from a point 460 Kb telomeric to FGFR3, through the FGFR3 and WHSC1 (WolfHirschhorn Syndrome Candidate 1) genes and ends proximally at a locus ~360 Kb centromeric to FGFR3.
Results of HybridizationIn a normal cell that lacks the t(4;14), a two orange and two green signal pattern will be observed reflecting the two intact copies of the FGFR3 and IGH regions respectively. In an abnormal cell containing the t(4;14), one orange (FGFR3), one green (IGH), and two fusion signal pattern (der (4) and der (14)) may be observed. Some samples containing the t(4;14) may display signal patterns differently than one orange, one green, and two fusions.
Ordering Information Quantity Order No.
Vysis IGH/FGFR3 DF FISH Probe Kit CE marked 20 µl 1N6920
A normal interphase cell hybridized with the Vysis IGH/FGFR3 DF FISH Probe. The cell shows the expected two orange (FGFR3), two green (IGH) signal pattern.
An abnormal interphase cell hybridized with the Vysis IGH/FGFR3 DF FISH Probe. The cell in this image shows the one orange (FGFR3), one green (IGH), two fusion (der (4) and der (14)) signal pattern indicative of a t(4;14).
References1. Fonseca, R., et al. Blood 101 (11) 2003: 45694575.2. Keats, J., et al. Blood 101 (4) 2003: 15201529.3. Chesi, M., et al. Blood 92 (1) 1998: 30253034.

All products, except where indicated, are Analyte Specific Reagents. Analytical and performance characteristics are not established.6-46
Oncology – Hematology
Vysis IGH/MAF DF FISH Probe Kitpreviously Vysis LSI IGH/MAF Dual Color, Dual Fusion Probe
The Vysis IGH/MAF DF FISH Probe Kit is intended to detect the t(14;16)(q32;q23) reciprocal translocation involving the IGH and MAF gene regions.
MAF is an oncogene that has been found to be overexpressed in multiple myeloma (MM).1 Recent studies have analyzed the effect of del(16q), perhaps due to loss of the WWOX gene, on prognosis in newly diagnosed MM and found an association with worse overall survival.2 Both MAF and WWOX genes are found in tandem on chromosome 16q23. t(14;16)(q32;q23) has been associated with more aggressive forms of MM.3 Thus, FISH testing for t(14;16)(q32;q23) has been indicated as one of the minimum clinical tests during MM diagnosis and treatment determination.4, 5
Results of HybridizationIn a normal cell that lacks the t(14;16), a two green and two orange signal pattern will be observed reflecting the two intact copies of IGH and the MAF region respectively. Due to the presence of the ~2.2 Mb gap between the two SpectrumOrange labeled MAF probes, signal splitting of the orange probe may be observed in both normal and abnormal cells. In an abnormal cell containing the t(14;16), one green (IGH), one orange (MAF) and two fusion signal pattern (der (14) and der (16)) may be observed. Some samples containing the t(14;16) may display signal patterns different than one orange, one green and two fusions.
Ordering Information Quantity Order No.
Vysis IGH/MAF DF FISH Probe Kit CE marked 20 µl 5N3220
A normal interphase cell hybridized with the Vysis IGH/MAF DF FISH Probe. The cell shows the expected two green (IGH), two orange (MAF) signal pattern.
An abnormal interphase cell hybridized with the Vysis IGH/MAF DF FISH Probe. The cell in this image shows the one green (IGH), one orange (MAF), two fusion (der (14) and der (16)) signal pattern indicative of a t(14;16).
References1. Chesi M, Bersagel PL, Shonukan O, et al.
Blood. 1998;91(12):445763. 2. Jenner MW, Leone PE, Walker BA, et al.
Blood. 2007;110(9):3291300. 3. Fonseca R, Blood E, Rue M, et al. Blood. 2003;101(11):456975. 4. Fonseca R, Bergsagel PL, Drach J, et al.
Leukemia. 2009;23(12):221021. 5. Anderson KC, Alsina M, Bensinger W, et al. NCCN clinical practice
guidelines in oncology: multiple myeloma. Natl Compr Canc Netw. 2009;7(9):90842.

6-47All products, except where indicated, are Analyte Specific Reagents. Analytical and performance characteristics are not established.
Oncology – Hematology
An abnormal cell hybridized with the LSI IGH/MALT1 t(14;18)(q32;q21) Dual Color, Dual Fusion Translocation Probe. The cell in this image shows the one orange, one green and two fusion signal pattern indicative of the t(14;18)(q32;q21) translocation.
Result of the hybridization of the LSI IGH/MALT1 t(14;18)(q32;q21) Dual Color, Dual Fusion Translocation Probe as observed in normal interphase cells.
Vysis IGH/MALT1 DF FISH Probe Kit
The Vysis IGH/MALT1 DF FISH Probe Kit is intended to detect the t(14;18)(q32;q21) reciprocal translocation involving the IGH and MALT1 gene regions using the fluorescence in situ hybridization (FISH) technique. The t(14;18)(q32;q21) translocation is the second most common chromosomal translocation found in mucosaassociated lymphoid tissue (MALT) lymphoma1 and is the most common in nongastric MALT lymphoma.1,2 The t(14;18)(q32;q21) translocation has been used to aid in the diagnosis of MALT lymphomas.3,4 The Vysis LSI IGH/MALT1 Dual Color Dual Fusion Probes have been used to identify the t(14;18) (q32;q21) translocation in published reports.5
The SpectrumOrange probe spans approximately 670 kb (chr18:54220804 54891192; March 2006 assembly)6 and covers theMALT1 gene region. The approximately 1.6 Mb SpectrumGreen probe spans the IGH region (chr14:104736507106339460; March 2006 assembly).6
Results of HybridizationThe expected normal signal pattern of the Vysis LSI IGH/MALT1 Dual Color Dual Fusion Probes is two orange and two green signals. The expected abnormal pattern of the Vysis LSI IGH/MALT1 Dual Color Dual Fusion Probes is one orange, one green and two fusions. Other abnormal signal patterns may occur and metaphase analysis may be helpful in characterization of such patterns.
Ordering Information Quantity Order No.
Vysis IGH/MALT1 DF FISH Probe KitCE marked 20 µl 5N4720
References1. Streubel B, SimonitschKlupp I, Müllauer L, et al Leukemia
2004;18(10):17226.2. Streubel B, Lamprecht A, Dierlamm J, et al Blood 2003;101(6):23359.3. Gomyo H, Kajimoto K, Maeda A, et al. Hematology 2007;12(4):3158.4. Zelenetz AD, Abramson JS, Advani RH, et al. J Natl Compr Canc
Netw. 2010;(8)3:288334.5. Bhagavathi S, Greiner TC, Kazmi SA, et al. J Hematopathol
2008;1(2):1317.6. Kent WJ, Sugnet CW, Furey TS, et al. Genome Research
2002;12(6):9961006.7. Wiktor AE, Van Dyke DL, Stupka PJ, et al. Genet Med 2006;8(1):1623.
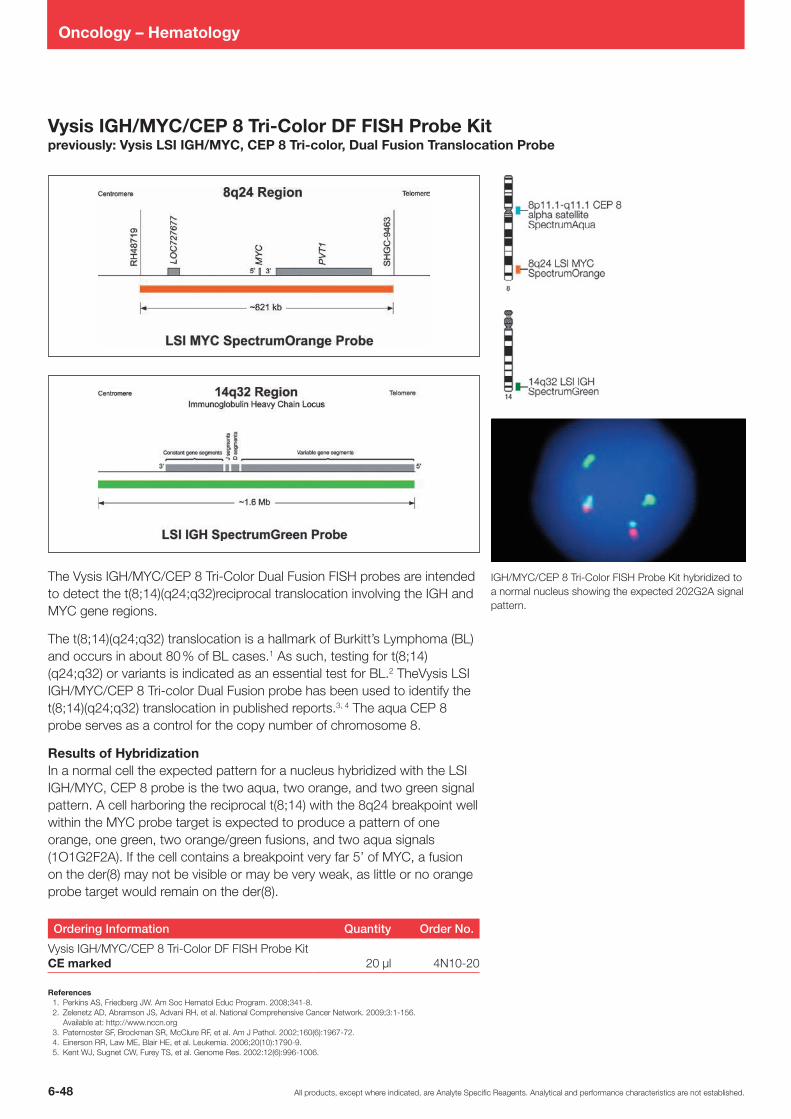
All products, except where indicated, are Analyte Specific Reagents. Analytical and performance characteristics are not established.6-48
Oncology – Hematology
Vysis IGH/MYC/CEP 8 Tri-Color DF FISH Probe Kitpreviously: Vysis LSI IGH/MYC, CEP 8 Tri-color, Dual Fusion Translocation Probe
The Vysis IGH/MYC/CEP 8 TriColor Dual Fusion FISH probes are intended to detect the t(8;14)(q24;q32)reciprocal translocation involving the IGH and MYC gene regions.
The t(8;14)(q24;q32) translocation is a hallmark of Burkitt’s Lymphoma (BL) and occurs in about 80 % of BL cases.1 As such, testing for t(8;14)(q24;q32) or variants is indicated as an essential test for BL.2 TheVysis LSI IGH/MYC/CEP 8 Tricolor Dual Fusion probe has been used to identify the t(8;14)(q24;q32) translocation in published reports.3, 4 The aqua CEP 8 probe serves as a control for the copy number of chromosome 8.
Results of HybridizationIn a normal cell the expected pattern for a nucleus hybridized with the LSI IGH/MYC, CEP 8 probe is the two aqua, two orange, and two green signal pattern. A cell harboring the reciprocal t(8;14) with the 8q24 breakpoint well within the MYC probe target is expected to produce a pattern of one orange, one green, two orange/green fusions, and two aqua signals (1O1G2F2A). If the cell contains a breakpoint very far 5’ of MYC, a fusion on the der(8) may not be visible or may be very weak, as little or no orange probe target would remain on the der(8).
Ordering Information Quantity Order No.
Vysis IGH/MYC/CEP 8 TriColor DF FISH Probe Kit CE marked 20 µl 4N1020
References1. Perkins AS, Friedberg JW. Am Soc Hematol Educ Program. 2008;3418. 2. Zelenetz AD, Abramson JS, Advani RH, et al. National Comprehensive Cancer Network. 2009;3:1156.
Available at: http://www.nccn.org 3. Paternoster SF, Brockman SR, McClure RF, et al. Am J Pathol. 2002;160(6):196772. 4. Einerson RR, Law ME, Blair HE, et al. Leukemia. 2006;20(10):17909. 5. Kent WJ, Sugnet CW, Furey TS, et al. Genome Res. 2002:12(6):9961006.
IGH/MYC/CEP 8 TriColor FISH Probe Kit hybridized to a normal nucleus showing the expected 202G2A signal pattern.
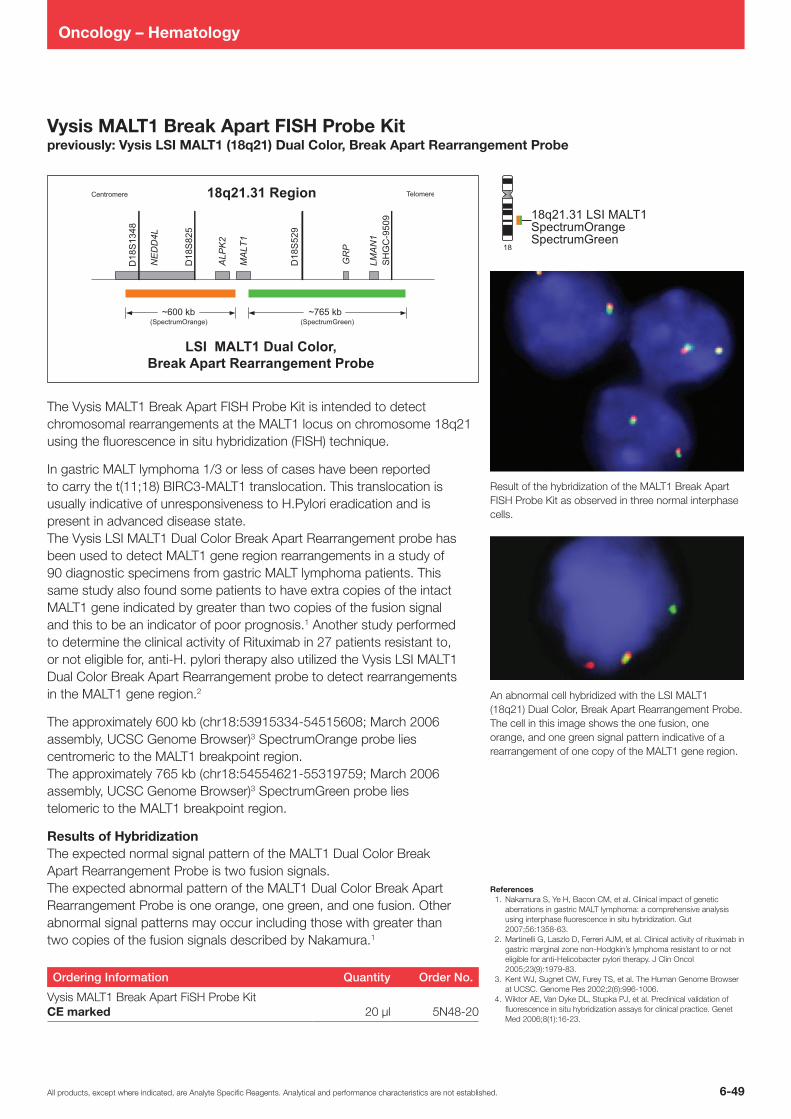
6-49All products, except where indicated, are Analyte Specific Reagents. Analytical and performance characteristics are not established.
Oncology – Hematology
Vysis MALT1 Break Apart FISH Probe Kitpreviously: Vysis LSI MALT1 (18q21) Dual Color, Break Apart Rearrangement Probe
The Vysis MALT1 Break Apart FISH Probe Kit is intended to detectchromosomal rearrangements at the MALT1 locus on chromosome 18q21using the fluorescence in situ hybridization (FISH) technique.
In gastric MALT lymphoma 1/3 or less of cases have been reportedto carry the t(11;18) BIRC3MALT1 translocation. This translocation isusually indicative of unresponsiveness to H.Pylori eradication and ispresent in advanced disease state.The Vysis LSI MALT1 Dual Color Break Apart Rearrangement probe hasbeen used to detect MALT1 gene region rearrangements in a study of90 diagnostic specimens from gastric MALT lymphoma patients. Thissame study also found some patients to have extra copies of the intactMALT1 gene indicated by greater than two copies of the fusion signaland this to be an indicator of poor prognosis.1 Another study performedto determine the clinical activity of Rituximab in 27 patients resistant to,or not eligible for, antiH. pylori therapy also utilized the Vysis LSI MALT1Dual Color Break Apart Rearrangement probe to detect rearrangementsin the MALT1 gene region.2
The approximately 600 kb (chr18:5391533454515608; March 2006assembly, UCSC Genome Browser)3 SpectrumOrange probe liescentromeric to the MALT1 breakpoint region.The approximately 765 kb (chr18:5455462155319759; March 2006assembly, UCSC Genome Browser)3 SpectrumGreen probe liestelomeric to the MALT1 breakpoint region.
Results of HybridizationThe expected normal signal pattern of the MALT1 Dual Color BreakApart Rearrangement Probe is two fusion signals.The expected abnormal pattern of the MALT1 Dual Color Break ApartRearrangement Probe is one orange, one green, and one fusion. Otherabnormal signal patterns may occur including those with greater thantwo copies of the fusion signals described by Nakamura.1
Ordering Information Quantity Order No.
Vysis MALT1 Break Apart FiSH Probe Kit CE marked 20 µl 5N4820
Result of the hybridization of the MALT1 Break Apart FISH Probe Kit as observed in three normal interphase cells.
An abnormal cell hybridized with the LSI MALT1 (18q21) Dual Color, Break Apart Rearrangement Probe. The cell in this image shows the one fusion, one orange, and one green signal pattern indicative of a rearrangement of one copy of the MALT1 gene region.
References1. Nakamura S, Ye H, Bacon CM, et al. Clinical impact of genetic
aberrations in gastric MALT lymphoma: a comprehensive analysis using interphase fluorescence in situ hybridization. Gut 2007;56:135863.
2. Martinelli G, Laszlo D, Ferreri AJM, et al. Clinical activity of rituximab in gastric marginal zone nonHodgkin’s lymphoma resistant to or not eligible for antiHelicobacter pylori therapy. J Clin Oncol 2005;23(9):197983.
3. Kent WJ, Sugnet CW, Furey TS, et al. The Human Genome Browser at UCSC. Genome Res 2002;2(6):9961006.
4. Wiktor AE, Van Dyke DL, Stupka PJ, et al. Preclinical validation of fluorescence in situ hybridization assays for clinical practice. Genet Med 2006;8(1):1623.
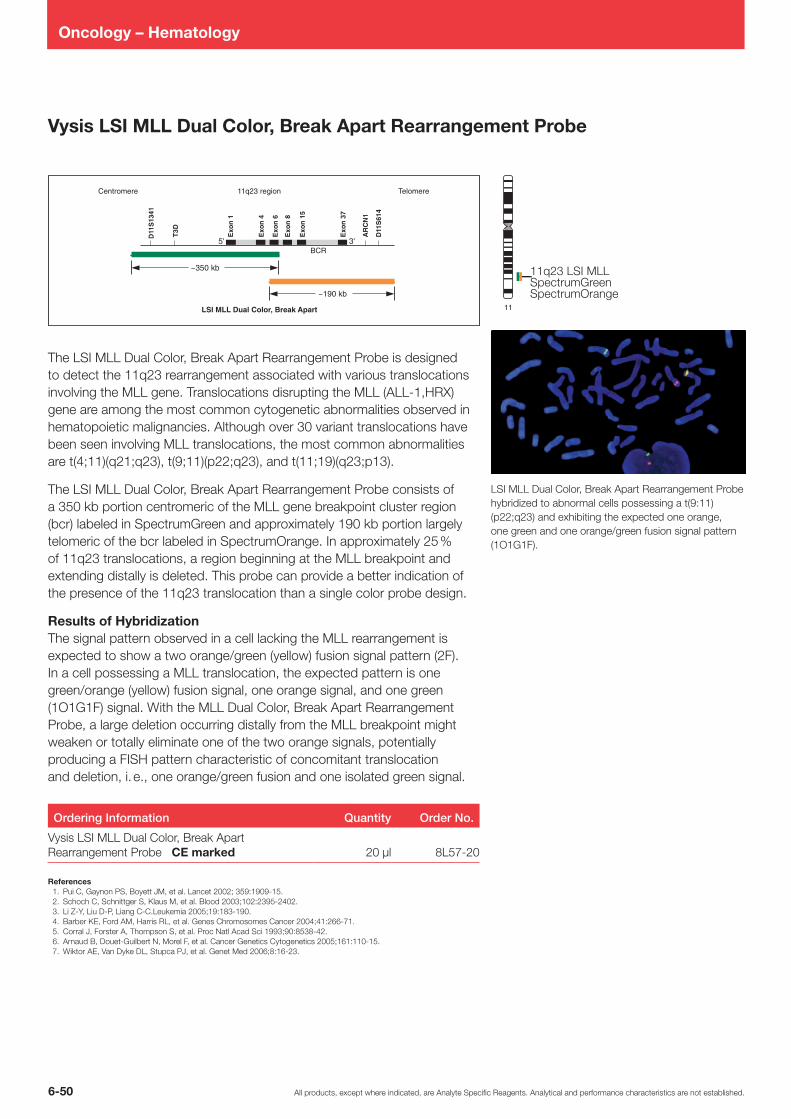
All products, except where indicated, are Analyte Specific Reagents. Analytical and performance characteristics are not established.6-50
Oncology – Hematology
LSI MLL Dual Color, Break Apart
Exo
n 1
T3D
D11
S13
41
Exo
n 4
Exo
n 6
Exo
n 8
Exo
n 1
5
Exo
n 3
7
AR
CN
1
D11
S61
4
Centromere 11q23 region
BCR
Telomere
3'5'
~350 kb
~190 kb
11
Vysis LSI MLL Dual Color, Break Apart Rearrangement Probe
The LSI MLL Dual Color, Break Apart Rearrangement Probe is designed to detect the 11q23 rearrangement associated with various translocations involving the MLL gene. Translocations disrupting the MLL (ALL1,HRX) gene are among the most common cytogenetic abnormalities observed in hematopoietic malignancies. Although over 30 variant translocations have been seen involving MLL translocations, the most common abnormalities are t(4;11)(q21;q23), t(9;11)(p22;q23), and t(11;19)(q23;p13).
The LSI MLL Dual Color, Break Apart Rearrangement Probe consists of a 350 kb portion centromeric of the MLL gene breakpoint cluster region (bcr) labeled in SpectrumGreen and approximately 190 kb portion largely telomeric of the bcr labeled in SpectrumOrange. In approximately 25 % of 11q23 translocations, a region beginning at the MLL breakpoint and extending distally is deleted. This probe can provide a better indication of the presence of the 11q23 translocation than a single color probe design.
Results of HybridizationThe signal pattern observed in a cell lacking the MLL rearrangement is expected to show a two orange/green (yellow) fusion signal pattern (2F). In a cell possessing a MLL translocation, the expected pattern is one green/orange (yellow) fusion signal, one orange signal, and one green (1O1G1F) signal. With the MLL Dual Color, Break Apart Rearrangement Probe, a large deletion occurring distally from the MLL breakpoint might weaken or totally eliminate one of the two orange signals, potentially producing a FISH pattern characteristic of concomitant translocation and deletion, i. e., one orange/green fusion and one isolated green signal.
Ordering Information Quantity Order No.
Vysis LSI MLL Dual Color, Break Apart Rearrangement Probe CE marked 20 µl 8L5720
References1. Pui C, Gaynon PS, Boyett JM, et al. Lancet 2002; 359:190915.2. Schoch C, Schnittger S, Klaus M, et al. Blood 2003;102:23952402.3. Li ZY, Liu DP, Liang CC.Leukemia 2005;19:183190.4. Barber KE, Ford AM, Harris RL, et al. Genes Chromosomes Cancer 2004;41:26671.5. Corral J, Forster A, Thompson S, et al. Proc Natl Acad Sci 1993;90:853842.6. Arnaud B, DouetGuilbert N, Morel F, et al. Cancer Genetics Cytogenetics 2005;161:11015.7. Wiktor AE, Van Dyke DL, Stupca PJ, et al. Genet Med 2006;8:1623.
LSI MLL Dual Color, Break Apart Rearrangement Probe hybridized to abnormal cells possessing a t(9:11)(p22;q23) and exhibiting the expected one orange, one green and one orange/green fusion signal pattern (1O1G1F).

6-51All products, except where indicated, are Analyte Specific Reagents. Analytical and performance characteristics are not established.
Oncology – Hematology
6
LSI MYB Probe
6q23 RegionCentromere Telomere
~740 kb
Title 10pt for Region 6 point for centomere/telomere
Gene (color #808080) with black border Stroke = 0.383 weight Main line lies right below stroke=0.449
Gene Sizes (Line Stroke = 0.396 weight)and Gap Size 6pt
Probe Name 10pt
Probe SO/SG no border
Name of STS or Gene Helvetica Neue 6pt
Length of the STS line Stroke = 0.431
blank
blank
blank
blank
ALD
H8A
1
MY
B
SH
GC
-827
82
SH
GC
-101
003
5’ 3’
Vysis MYB SpectrumAqua FISH Probe Kitpreviously Vysis LSI MYB (6q23) SpectrumAqua Probe
This Vysis MYB SpectrumAqua FISH Probe is intended to detect the copy number of the LSI MYB probe target located at chromosome 6q23.
The Vysis LSI MYB SpectrumAqua Probe was used to detect deletion of its target at 6q23 in a study of 143 chronic lymphocytic leukemia patients.1 In this study, approximately 5% of patients were found to have this deletion.
Results of HybridizationHybridization of this probe to interphase and metaphase nuclei of normal cells is expected to be seen as two aqua signals. The anticipated signal pattern in individuals with a deletion of the 6q23 region would be seen as a single aqua signal. Other patterns may be observed if additional genetic alterations are present.
Ordering Information Quantity Order No.
Vysis MYB SpectrumAqua FISH Probe KitCE marked 20 µl 5N4020
References1. Qiu H, Xu W, Cao X, et al. Leukemia & Lymphoma. 2008;49(10):18871892.2. Kent WJ, Sugnet CW, Furey TS, et al. Genome Res. 2002;2(6):9961006.
Normal cell hybridization using the Vysis LSI MYB (6q23) Probe.
Abnormal cell hybridization using the Vysis MYB Probe.
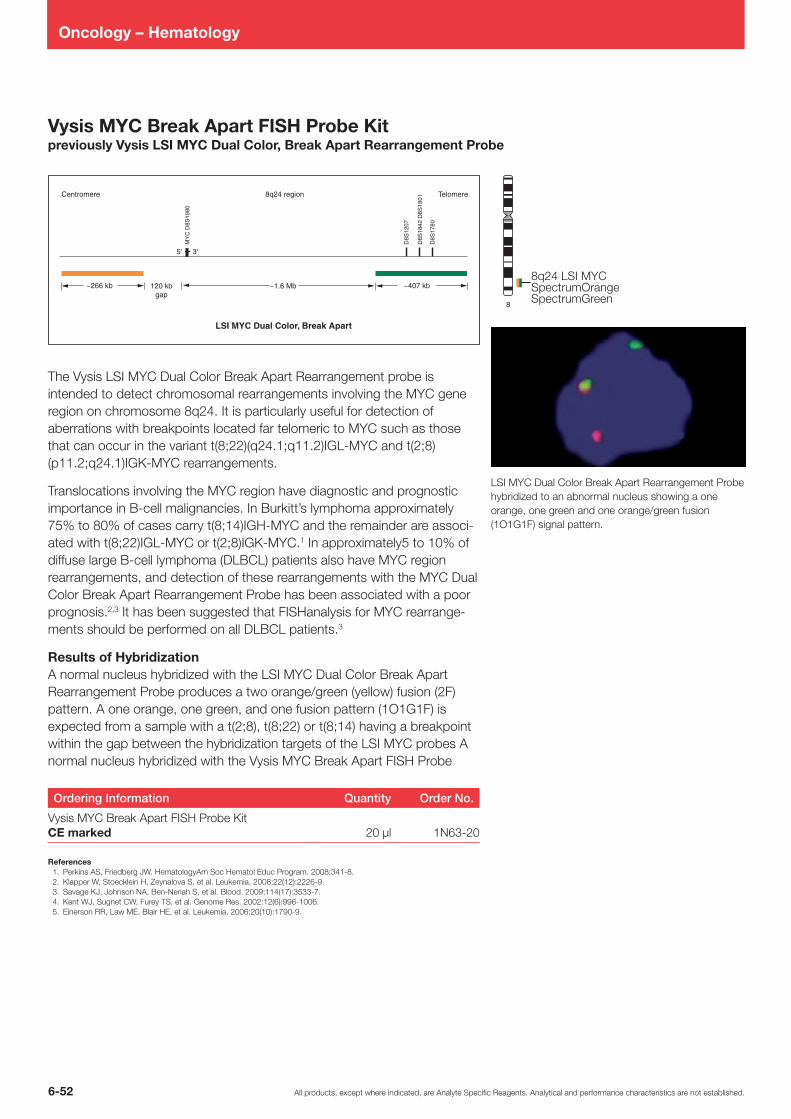
All products, except where indicated, are Analyte Specific Reagents. Analytical and performance characteristics are not established.6-52
Oncology – Hematology
Centromere 8q24 region Telomere
~1.6 Mb120 kbgap
LSI MYC Dual Color, Break Apart
~266 kb ~407 kb
MY
C D
8S19
80
D8S
1207
D8S
1842
D8S
1801
D8S
1780
5' 3'
8
Vysis MYC Break Apart FISH Probe Kitpreviously Vysis LSI MYC Dual Color, Break Apart Rearrangement Probe
The Vysis LSI MYC Dual Color Break Apart Rearrangement probe is intended to detect chromosomal rearrangements involving the MYC gene region on chromosome 8q24. It is particularly useful for detection of aberrations with breakpoints located far telomeric to MYC such as those that can occur in the variant t(8;22)(q24.1;q11.2)IGLMYC and t(2;8)(p11.2;q24.1)IGKMYC rearrangements.
Translocations involving the MYC region have diagnostic and prognostic importance in Bcell malignancies. In Burkitt’s lymphoma approximately 75% to 80% of cases carry t(8;14)IGHMYC and the remainder are associated with t(8;22)IGLMYC or t(2;8)IGKMYC.1 In approximately5 to 10% of diffuse large Bcell lymphoma (DLBCL) patients also have MYC region rearrangements, and detection of these rearrangements with the MYC Dual Color Break Apart Rearrangement Probe has been associated with a poor prognosis.2,3 It has been suggested that FISHanalysis for MYC rearrangements should be performed on all DLBCL patients.3
Results of HybridizationA normal nucleus hybridized with the LSI MYC Dual Color Break Apart Rearrangement Probe produces a two orange/green (yellow) fusion (2F) pattern. A one orange, one green, and one fusion pattern (1O1G1F) is expected from a sample with a t(2;8), t(8;22) or t(8;14) having a breakpoint within the gap between the hybridization targets of the LSI MYC probes A normal nucleus hybridized with the Vysis MYC Break Apart FISH Probe
Ordering Information Quantity Order No.
Vysis MYC Break Apart FISH Probe Kit CE marked 20 µl 1N6320
References1. Perkins AS, Friedberg JW. HematologyAm Soc Hematol Educ Program. 2008;3418.2. Klapper W, Stoecklein H, Zeynalova S, et al. Leukemia. 2008;22(12):22269.3. Savage KJ, Johnson NA, BenNeriah S, et al. Blood. 2009;114(17):35337.4. Kent WJ, Sugnet CW, Furey TS, et al. Genome Res. 2002:12(6):9961006.5. Einerson RR, Law ME, Blair HE, et al. Leukemia. 2006;20(10):17909.
LSI MYC Dual Color Break Apart Rearrangement Probe hybridized to an abnormal nucleus showing a one orange, one green and one orange/green fusion (1O1G1F) signal pattern.
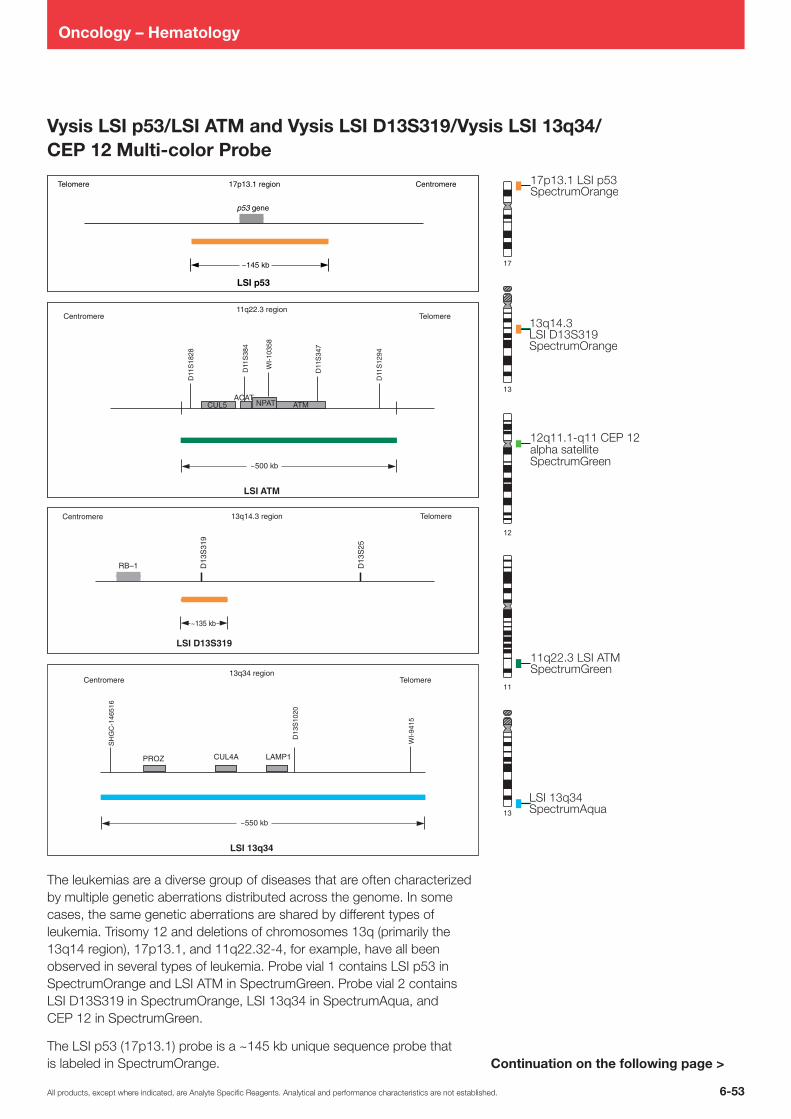
6-53All products, except where indicated, are Analyte Specific Reagents. Analytical and performance characteristics are not established.
Oncology – Hematology
13
11
13
17
~500 kb
ACATCUL5 NPAT ATM
Centromere Telomere11q22.3 region
LSI ATM
D11
S34
7
D11
S18
28
D11
S38
4
WI-
1035
8
D11
S12
94
p53 gene
LSI p53
17p13.1 regionTelomere Centromere
~145 kb
~135 kb
13q14.3 region
D13
S31
9
RB–1 D13
S25
LSI D13S319
Centromere Telomere
~550 kb
PROZ CUL4A LAMP1
Centromere Telomere13q34 region
LSI 13q34
D13
S10
20
SH
GC
-146
516
WI-
9415
Continuation on the following page >
Vysis LSI p53/LSI ATM and Vysis LSI D13S319/Vysis LSI 13q34/ CEP 12 Multi-color Probe
The leukemias are a diverse group of diseases that are often characterized by multiple genetic aberrations distributed across the genome. In some cases, the same genetic aberrations are shared by different types of leukemia. Trisomy 12 and deletions of chromosomes 13q (primarily the 13q14 region), 17p13.1, and 11q22.324, for example, have all been observed in several types of leukemia. Probe vial 1 contains LSI p53 in SpectrumOrange and LSI ATM in SpectrumGreen. Probe vial 2 contains LSI D13S319 in SpectrumOrange, LSI 13q34 in SpectrumAqua, and CEP 12 in SpectrumGreen.
The LSI p53 (17p13.1) probe is a ~145 kb unique sequence probe that is labeled in SpectrumOrange.

All products, except where indicated, are Analyte Specific Reagents. Analytical and performance characteristics are not established.6-54
Oncology – Hematology
An abnormal cell hybridized with Probe Set 1. One copy of the p53 region has been deleted as indicated by the single orange signal. Both copies of the ATM gene region are present as indicated by the two green signals.
An abnormal cell hybridized with Probe Set 1. One copy of the ATM gene region has been deleted as indicated by the single green signal. Both copies of the p53 gene region are present as indicated by the two orange signals.
An abnormal cell hybridized with Probe Set 2. Both copies of chromosome thirteen and its q arm are intact as indicated by the two orange (LSI D13S319) and two aqua (LSI 13q34) signals. One extra copy of chromosome 12 (trisomy 12) is present as indicated by the three green signals.
An abnormal cell hybridized with Probe Set 2. One copy of chromosome 13 is deleted for the D13S319 region as indicated by the single orange signal (LSI D13S319) and the two aqua signals (LSI 13q34). One extra copy of chromosome 12 (trisomy 12) is present as indicated by the three green signals.
The LSI ATM probe is a ~500 kb unique sequence probe that hybridizes to the 11q22.3 region of chromosome 11. This probe spans the entire ~184 kb Ataxia telangiectasia mutated (ATM) gene and several others. The probe is labeled in SpectrumGreen.
The LSI D13S319 probe is a ~130 kb unique sequence probe that is labeled in SpectrumOrange.
The LSI 13q34 probe is a ~550 kb unique sequence probe that hybridizes to the 13q34 region containing the Lysosomalassociate Membrane Protein (LAMP1) gene and several others. The probe is labeled in SpectrumAqua.
The CEP 12 DNA probe hybridizes to the alpha satellite (centromeric) region (12p11.1q11) of chromosome 12. The probe is labeled in Spectrum Green.
Results of HybridizationThis multicolor probe set is provided in a twomixture format. A description of the hybridization results expected with each mixture follows:
Probe 1:This probe allows status assessment of the following two chromosome regions: 17p13.1 (p53) and 11q22.3 (ATM). In a normal cell with two intact copies of chromosomes 17 and 11, two orange, and two green signals will be observed. In an abnormal cell with a deletion in the p53 region, fewer than two orange signals will be observed. In an abnormal cell with a deletion in the ATM region on chromosome 11, one will observe fewer than two green signals.
Probe 2:This probe allows status assessment of the following three chromosome regions: 13q14.3 (D13S319), 13q34, and 12p11.1q11. In a normal cell with two intact copies of chromosome 13 and chromosome 12, a two orange, two aqua, and two green signal pattern will be observed. In an abnormal cell with chromosome 13 aberrations only, more complex signal patterns may be expected depending upon the nature of the aberration. Monosomy 13 or 13q will both appear as a one orange, one aqua, two green signal pattern. An interstitial deletion of the 13q14.3 region will appear as either a one orange, two aqua, two green signal pattern (hemizygous deletion) or a two aqua, two green signal pattern (homozygous deletion) (data not shown). In an abnormal cell with chromosome 12 copy number changes, one will observe greater or less than two green signals.
Ordering Information Quantity Order No.
Vysis LSI p53/LSI ATM and LSI D13S319/ LSI 13q34/CEP 12 Multicolor Probe CE marked 200 µl 8L5320
premixed with Hybridization Buffer
References1. Anastasi, J., et al. Blood 79 (1992): 17961801.2. Dohner, H., et al. New Eng Jour Med. 343 (2000): 19101916.3. Bennarji, R., Byrd, J.C. Curr. Opin Oncol 12 (2000): 2229.4. Stilgenbauer, S., et al. Leukemia 16 (6) (2002): 9931007.5. Pettitt, A.R., et al. Blood 98 (3) (2001): 814822.6. Stankovic, T., et al. Blood 99 (1) (2001): 300309.
Continuation:Vysis LSI p53/LSI ATM and Vysis LSI D13S319/Vysis LSI 13q34/CEP 12 Multi-color Probe
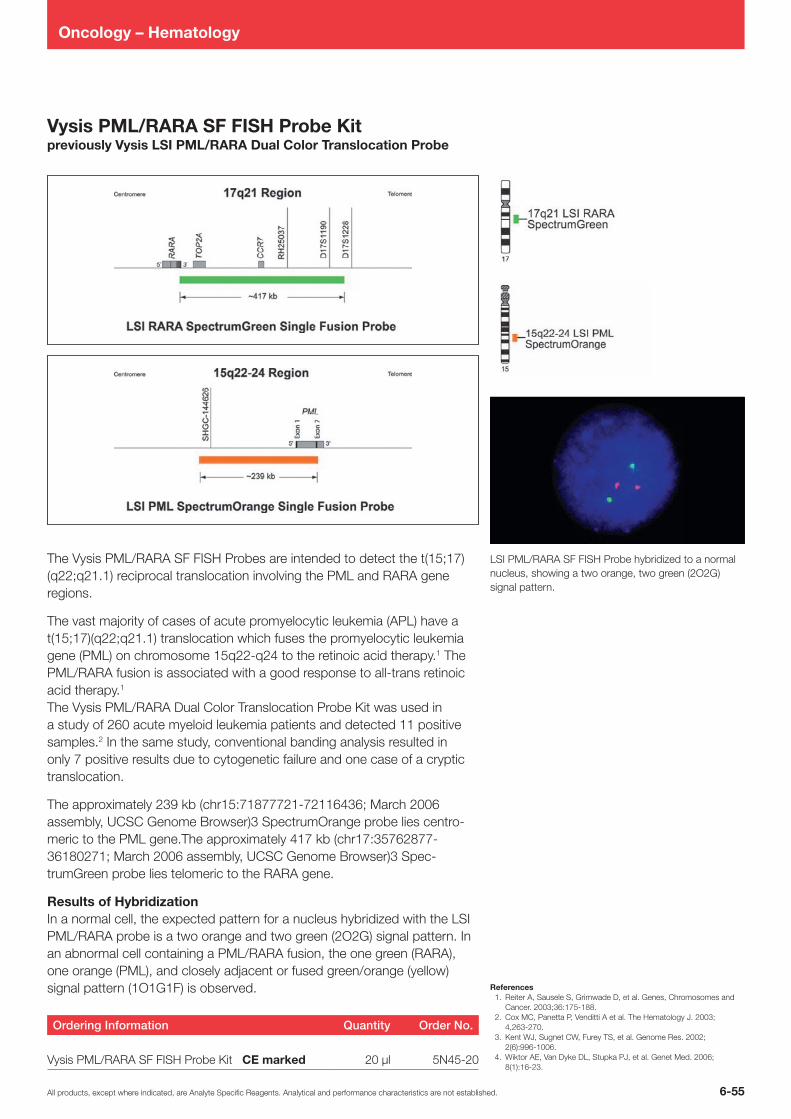
6-55All products, except where indicated, are Analyte Specific Reagents. Analytical and performance characteristics are not established.
Oncology – Hematology
Vysis PML/RARA SF FISH Probe Kit previously Vysis LSI PML/RARA Dual Color Translocation Probe
The Vysis PML/RARA SF FISH Probes are intended to detect the t(15;17)(q22;q21.1) reciprocal translocation involving the PML and RARA gene regions.
The vast majority of cases of acute promyelocytic leukemia (APL) have a t(15;17)(q22;q21.1) translocation which fuses the promyelocytic leukemia gene (PML) on chromosome 15q22q24 to the retinoic acid therapy.1 The PML/RARA fusion is associated with a good response to alltrans retinoic acid therapy.1 The Vysis PML/RARA Dual Color Translocation Probe Kit was used in a study of 260 acute myeloid leukemia patients and detected 11 positive samples.2 In the same study, conventional banding analysis resulted in only 7 positive results due to cytogenetic failure and one case of a cryptic translocation.
The approximately 239 kb (chr15:7187772172116436; March 2006 assembly, UCSC Genome Browser)3 SpectrumOrange probe lies centromeric to the PML gene.The approximately 417 kb (chr17:3576287736180271; March 2006 assembly, UCSC Genome Browser)3 SpectrumGreen probe lies telomeric to the RARA gene.
Results of HybridizationIn a normal cell, the expected pattern for a nucleus hybridized with the LSI PML/RARA probe is a two orange and two green (2O2G) signal pattern. In an abnormal cell containing a PML/RARA fusion, the one green (RARA), one orange (PML), and closely adjacent or fused green/orange (yellow) signal pattern (1O1G1F) is observed.
Ordering Information Quantity Order No.
Vysis PML/RARA SF FISH Probe Kit CE marked 20 µl 5N4520
LSI PML/RARA SF FISH Probe hybridized to a normal nucleus, showing a two orange, two green (2O2G) signal pattern.
References1. Reiter A, Sausele S, Grimwade D, et al. Genes, Chromosomes and
Cancer. 2003;36:175188. 2. Cox MC, Panetta P, Venditti A et al. The Hematology J. 2003;
4,263270.3. Kent WJ, Sugnet CW, Furey TS, et al. Genome Res. 2002;
2(6):9961006.4. Wiktor AE, Van Dyke DL, Stupka PJ, et al. Genet Med. 2006;
8(1):1623.

All products, except where indicated, are Analyte Specific Reagents. Analytical and performance characteristics are not established.6-56
Oncology – Hematology
~500 kb
~700 kb
Breakpoint
Region
5'
Exon
2
Exon
5
Exon
6
Exon
3
Exon
4
3'
5' PML
PML
Centromere Telomere
~180 kb
3'5'
Exon
3
Exon
4
Exon
5
GATA
85D0
2
LOXL1 GLP AFM
248Y
H1
ISLR
D15S
520
Exon
8
Exon
6
Exon
7
Exon
9
bcr 3 bcr 2 bcr 1
15q22-24 region
Centromere Telomere17q21.1 region
3' PML
~335 kb
GRB7
MLN
51
THRA
SHGC
146
999
RARA
15
17
17q21 LSI RARASpectrumGreen
~500 kb
~700 kb
BreakpointRegion
5'
Exon
2
Exon
5
Exon
6
Exon
3
Exon
4
3'
5' PML
PML
Centromere Telomere
~180 kb
3'5'
Exon
3
Exon
4
Exon
5
GA
TA85
D02
LOXL1 GLP AFM
248Y
H1
ISLR
D15
S520
Exon
8
Exon
6
Exon
7
Exon
9
bcr 3 bcr 2 bcr 1
15q22 region
Centromere Telomere17q21.1 region
3' PML
~335 kb
GRB
7
MLN
51
THRA
SHG
C 14
6999
RARA
Vysis LSI PML/RARA Dual Color, Dual Fusion Translocation Probe
The reciprocal and balanced t(15;17), involving the PML (promyelocytic leukemia) gene on chromosome 15q2224 and the RARA (retinoic acid receptor alpha) gene on chromosome 17q21.1 is a characteristic molecular feature of certain types of leukemia. Two gene fusion products result from this translocation, each of which encodes a functional chimeric protein: PML/RARA and RARA/PML.
The breakpoints in the 15q2224 region of chromosome 15 occur within a 13 kb region of the PML gene that contains three breakpoint cluster regions (bcr): bcr 3 extends from intron 3 through the 5’ end of intron 4, bcr 2 extends from exon 5 to exon 6, and bcr 1 extends from intron 6 into exon 7. Break frequency is highest in bcr 1, followed by bcr 3 and bcr 2. The breakpoints on chromosome 17 occur within the approximately 17 kb intron 2 of the RARA gene.
The LSI PML/RARA Dual Color, Dual Fusion Translocation Probe is a mixture of two FISH DNA Probes. The first, LSI PML, is an ~500 kb unique sequence probe that hybridizes to the 15q2224 region containing the PML gene and is labeled in SpectrumOrange. The second, LSI RARA, is an ~700 kb unique sequence probe that hybridizes to the 17q21 region containing the RARA gene and is labeled in SpectrumGreen.
Results of HybridizationThis probe is provided for those interested in identifying the t(15;17). In a normal cell that lacks the t(15;17), a two orange and two green signal pattern will be observed reflecting the two intact copies of RARA and PML, respectively. In an abnormal cell containing the t(15;17), one orange (PML), a one green (RARA), and two fusion (PML/RARA and RARA/PML) signal pattern is observed.
Ordering Information Quantity Order No.
Vysis LSI PML/RARA Dual Color, Dual Fusion Translocation Probe CE marked 20 µl 1N3620
Result of the hybridization of the LSI PML/RARA Dual Color, Dual Fusion Translocation Probe as observed in a normal interphase cell.
Abnormal cell hybridized with the LSI PML/RARA Dual Color, Dual Fusion Translocation Probe. The cell in this image shows the one orange (PML), one green (RARA), two fusion (PML/RARA and RARA/PML) signal pattern indicative of the t(15;17).
References1. Rowley, J.D., et al. Lancet 1 (1977): 549550.2. Harris, N.L., et al. J. Clin. Oncol. 12 (1999): 38353849.3. He, L.Z., et al. Nat. Genet. 18 (1998): 126135.4. Pandolfi, P.P. Oncogene 20. (2001): 57265735.5. Piazza, F., et al. Oncogene 20 (2001): 72167222.6. Benoit, G., et al. Oncogene 20 (2001): 71617177.
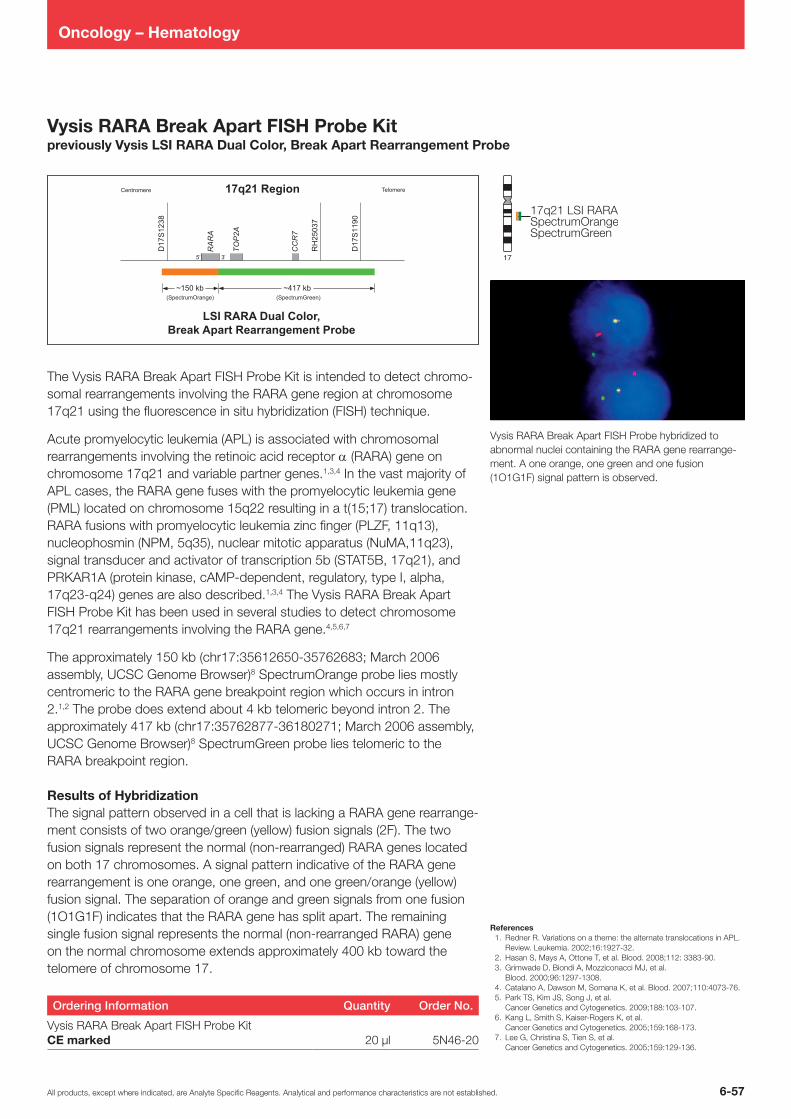
6-57All products, except where indicated, are Analyte Specific Reagents. Analytical and performance characteristics are not established.
Oncology – Hematology
17
References1. Redner R. Variations on a theme: the alternate translocations in APL.
Review. Leukemia. 2002;16:192732.2. Hasan S, Mays A, Ottone T, et al. Blood. 2008;112: 338390.3. Grimwade D, Biondi A, Mozziconacci MJ, et al.
Blood. 2000;96:12971308.4. Catalano A, Dawson M, Somana K, et al. Blood. 2007;110:407376.5. Park TS, Kim JS, Song J, et al.
Cancer Genetics and Cytogenetics. 2009;188:103107.6. Kang L, Smith S, KaiserRogers K, et al.
Cancer Genetics and Cytogenetics. 2005;159:168173.7. Lee G, Christina S, Tien S, et al.
Cancer Genetics and Cytogenetics. 2005;159:129136.
Vysis RARA Break Apart FISH Probe Kitpreviously Vysis LSI RARA Dual Color, Break Apart Rearrangement Probe
The Vysis RARA Break Apart FISH Probe Kit is intended to detect chromosomal rearrangements involving the RARA gene region at chromosome 17q21 using the fluorescence in situ hybridization (FISH) technique.
Acute promyelocytic leukemia (APL) is associated with chromosomal rearrangements involving the retinoic acid receptor α (RARA) gene on chromosome 17q21 and variable partner genes.1,3,4 In the vast majority of APL cases, the RARA gene fuses with the promyelocytic leukemia gene (PML) located on chromosome 15q22 resulting in a t(15;17) translocation. RARA fusions with promyelocytic leukemia zinc finger (PLZF, 11q13), nucleophosmin (NPM, 5q35), nuclear mitotic apparatus (NuMA,11q23), signal transducer and activator of transcription 5b (STAT5B, 17q21), and PRKAR1A (protein kinase, cAMPdependent, regulatory, type I, alpha, 17q23q24) genes are also described.1,3,4 The Vysis RARA Break Apart FISH Probe Kit has been used in several studies to detect chromosome 17q21 rearrangements involving the RARA gene.4,5,6,7
The approximately 150 kb (chr17:3561265035762683; March 2006 assembly, UCSC Genome Browser)8 SpectrumOrange probe lies mostly centromeric to the RARA gene breakpoint region which occurs in intron 2.1,2 The probe does extend about 4 kb telomeric beyond intron 2. The approximately 417 kb (chr17:3576287736180271; March 2006 assembly, UCSC Genome Browser)8 SpectrumGreen probe lies telomeric to the RARA breakpoint region.
Results of HybridizationThe signal pattern observed in a cell that is lacking a RARA gene rearrangement consists of two orange/green (yellow) fusion signals (2F). The two fusion signals represent the normal (nonrearranged) RARA genes located on both 17 chromosomes. A signal pattern indicative of the RARA gene rearrangement is one orange, one green, and one green/orange (yellow) fusion signal. The separation of orange and green signals from one fusion (1O1G1F) indicates that the RARA gene has split apart. The remaining single fusion signal represents the normal (nonrearranged RARA) gene on the normal chromosome extends approximately 400 kb toward the telomere of chromosome 17.
Ordering Information Quantity Order No.
Vysis RARA Break Apart FISH Probe KitCE marked 20 µl 5N4620
Vysis RARA Break Apart FISH Probe hybridized to abnormal nuclei containing the RARA gene rearrangement. A one orange, one green and one fusion (1O1G1F) signal pattern is observed.
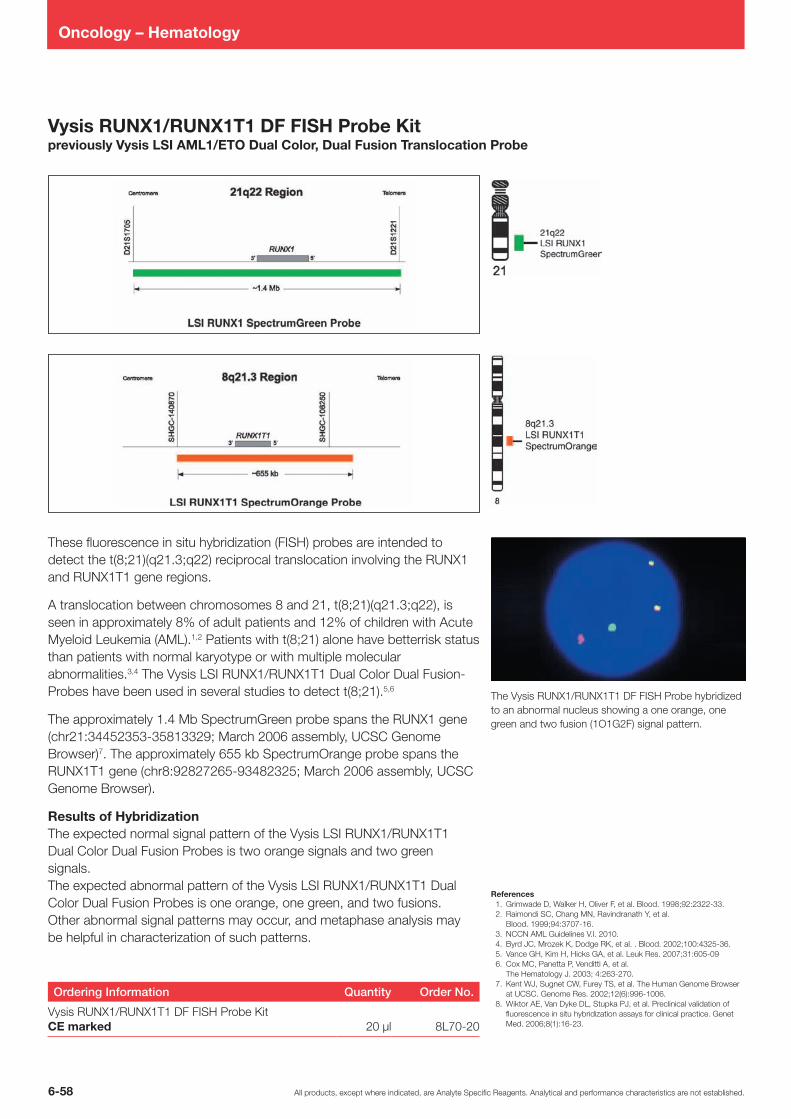
All products, except where indicated, are Analyte Specific Reagents. Analytical and performance characteristics are not established.6-58
Oncology – Hematology
Vysis RUNX1/RUNX1T1 DF FISH Probe Kitpreviously Vysis LSI AML1/ETO Dual Color, Dual Fusion Translocation Probe
These fluorescence in situ hybridization (FISH) probes are intended to detect the t(8;21)(q21.3;q22) reciprocal translocation involving the RUNX1 and RUNX1T1 gene regions.
A translocation between chromosomes 8 and 21, t(8;21)(q21.3;q22), is seen in approximately 8% of adult patients and 12% of children with Acute Myeloid Leukemia (AML).1,2 Patients with t(8;21) alone have betterrisk status than patients with normal karyotype or with multiple molecular abnormalities.3,4 The Vysis LSI RUNX1/RUNX1T1 Dual Color Dual FusionProbes have been used in several studies to detect t(8;21).5,6
The approximately 1.4 Mb SpectrumGreen probe spans the RUNX1 gene (chr21:3445235335813329; March 2006 assembly, UCSC Genome Browser)7. The approximately 655 kb SpectrumOrange probe spans the RUNX1T1 gene (chr8:9282726593482325; March 2006 assembly, UCSC Genome Browser).
Results of HybridizationThe expected normal signal pattern of the Vysis LSI RUNX1/RUNX1T1Dual Color Dual Fusion Probes is two orange signals and two greensignals.The expected abnormal pattern of the Vysis LSI RUNX1/RUNX1T1 DualColor Dual Fusion Probes is one orange, one green, and two fusions.Other abnormal signal patterns may occur, and metaphase analysis maybe helpful in characterization of such patterns.
Ordering Information Quantity Order No.
Vysis RUNX1/RUNX1T1 DF FISH Probe Kit CE marked 20 µl 8L7020
The Vysis RUNX1/RUNX1T1 DF FISH Probe hybridized to an abnormal nucleus showing a one orange, one green and two fusion (1O1G2F) signal pattern.
References1. Grimwade D, Walker H, Oliver F, et al. Blood. 1998;92:232233.2. Raimondi SC, Chang MN, Ravindranath Y, et al.
Blood. 1999;94:370716.3. NCCN AML Guidelines V.I. 2010.4. Byrd JC, Mrozek K, Dodge RK, et al. . Blood. 2002;100:432536.5. Vance GH, Kim H, Hicks GA, et al. Leuk Res. 2007;31:605096. Cox MC, Panetta P, Venditti A, et al.
The Hematology J. 2003; 4:263270.7. Kent WJ, Sugnet CW, Furey TS, et al. The Human Genome Browser
at UCSC. Genome Res. 2002;12(6):9961006.8. Wiktor AE, Van Dyke DL, Stupka PJ, et al. Preclinical validation of
fluorescence in situ hybridization assays for clinical practice. Genet Med. 2006;8(1):1623.

6-59All products, except where indicated, are Analyte Specific Reagents. Analytical and performance characteristics are not established.
Oncology – Hematology
LSI TCF3
19p13.3 RegionTelomere Centromere
TC
F3
5’3’GA
MT
RE
XO
1
DA
ZA
P1
RH
4826
6
~730 kb
RH
5565
7
LSI PBX1
1q23 RegionCentromere Telomere
PB
X1
3’5’ SH
GC
-147
938
~635 kb
SH
GC
-811
64
19
LSI TCF3
19p13.3 RegionTelomere Centromere
TC
F3
5’3’GA
MT
RE
XO
1
DA
ZA
P1
RH
4826
6
~730 kb
RH
5565
7
LSI PBX1
1q23 RegionCentromere Telomere
PB
X1
3’5’ SH
GC
-147
938
~635 kb
SH
GC
-811
64
1
Vysis LSI TCF3/PBX1 Dual Color, Dual Fusion Translocation Probe
Translocations occur between the TCF3 locus at chromosome 19p13.3 and the PBX1 locus at chromosome 1q23. The translocation event t(1;19)(q23;p13) produces a fusion of two genes on the derivative 19 chromosome that results in a novel chimeric gene, TCF3/PBX1.
The TCF3 SpectrumGreen probe is 730 kb in size and extends beyond the TCF3 gene to cover a larger region on chromosome 19p13.3. The PBX1 SpectrumOrange probe is 635 kb in size and covers the entire PBX1 gene on chromosome 1q23.
Ordering Information Quantity Order No.
LSI TCF3/PBX1 Dual Color, Dual Fusion Translocation Probe 20 µl 1N2420
Figure 1. Normal hybridization showing two orange and two green signals.
Figure 2. Example abnormal hybridization of an unbalanced (t(1;19) showing two orange, one green and one fusion signals.

All products, except where indicated, are Analyte Specific Reagents. Analytical and performance characteristics are not established.6-60
Oncology – Hematology
Vysis TRA/D Break Apart FISH Probe Kit previously Vysis LSI TCR alpha/delta Dual Color Break Apart Rearrangement Probe
The Vysis TRA/D Break Apart FISH Probe Kit is intended to detect chromosomal rearrangements involving the Tcell receptor alpha/delta locus at chromosome 14q11.2 using the fluorescence in situ hybridization (FISH) technique.
Acute Lymphoblastic Leukemia (ALL) accounts for 25 % of all pediatric cancer and 15 % of pediatric ALL is of TCell lineage (TALL).1 TALL and TCell Lymphoblastic Lymphoma (TLBL) are described by the World Health Organization classification as similar entities that are discerned by the relative percentage of bone marrow infiltration.2 The Vysis TRA/D Dual Color Break Apart Rearrangement Probe was used in a study to detect TCR alpha/delta rearrangements in 22 randomly selected patients for the Children’s Oncolgy Group.3
The SpectrumOrange probe spans approximately 659 kb (chr14:2043343021092293; March 2006 assembly)4 centromeric of the Tcell receptor alpha/delta locus. The SpectrumGreen probe spans approximately 714 kb (chr14:2206993122784042; March 2006 assembly)4 telomeric of the Tcell receptor alpha/delta locus.
Ordering Information Quantity Order No.
Vysis TRA/D Break Apart FISH Probe KitCE marked 20 µl 5N4120
References1. Heim S, Mitelman F. Cancer Cytogenetics. 3rd ed. Hoboken, New Jersey: John Wiley & Sons, Inc; 2009.2. Swerdlow SH, Campo E, Harris NL, et al. Lyon, France: IARC Press; 2008:2656.3. Smock KJ, Nelson M, Tripp SR, et al. Characterization of childhood. Pediatr Blood Cancer. 2008;51(4):48994.4. Kent WJ, Sugnet CW, Furey TS, et al. Genome Res. 2002:12(6):9961006.
Normal nucleus showing the two green/orange fusion signals. Note the gap that can occur between the green and orange signals in some normal samples.
Abnormal nucleus showing the one green/orange fusion, one green and one orange signal pattern.
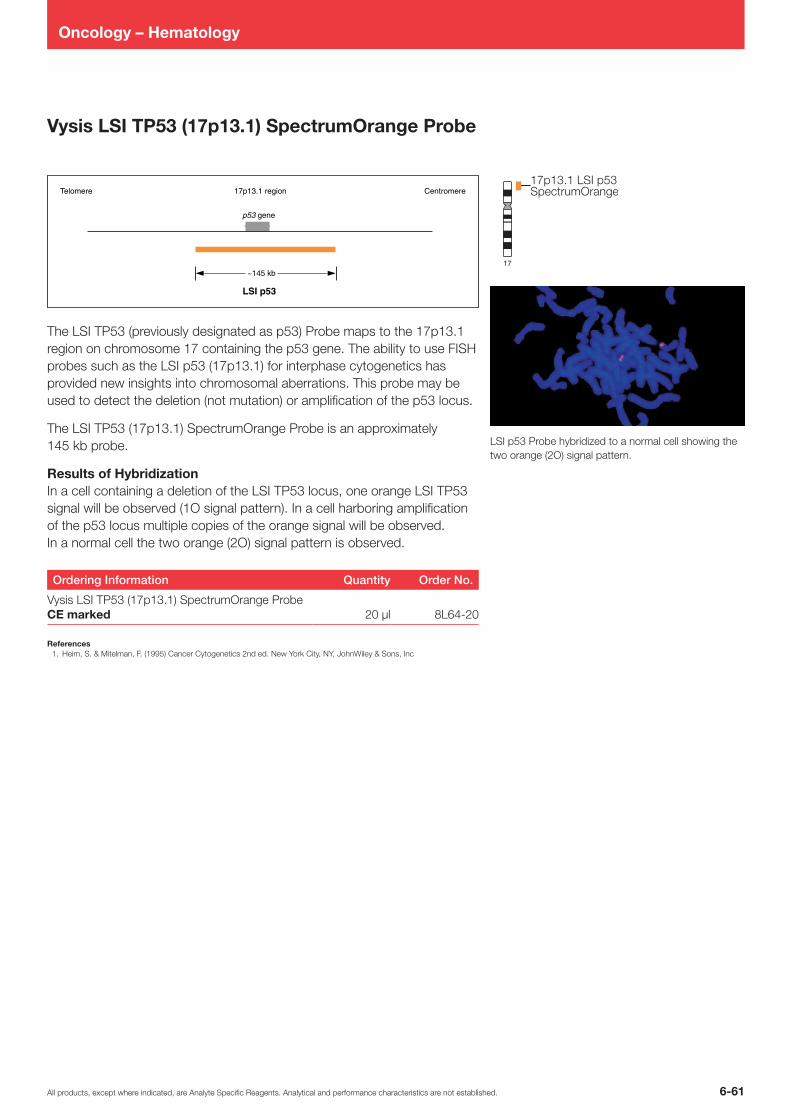
6-61All products, except where indicated, are Analyte Specific Reagents. Analytical and performance characteristics are not established.
Oncology – Hematology
17
p53 gene
LSI p53
17p13.1 regionTelomere Centromere
~145 kb
Vysis LSI TP53 (17p13.1) SpectrumOrange Probe
The LSI TP53 (previously designated as p53) Probe maps to the 17p13.1 region on chromosome 17 containing the p53 gene. The ability to use FISH probes such as the LSI p53 (17p13.1) for interphase cytogenetics has provided new insights into chromosomal aberrations. This probe may be used to detect the deletion (not mutation) or amplification of the p53 locus.
The LSI TP53 (17p13.1) SpectrumOrange Probe is an approximately 145 kb probe.
Results of HybridizationIn a cell containing a deletion of the LSI TP53 locus, one orange LSI TP53 signal will be observed (1O signal pattern). In a cell harboring amplification of the p53 locus multiple copies of the orange signal will be observed. In a normal cell the two orange (2O) signal pattern is observed.
Ordering Information Quantity Order No.
Vysis LSI TP53 (17p13.1) SpectrumOrange Probe CE marked 20 µl 8L6420
References1. Heim, S. & Mitelman, F. (1995) Cancer Cytogenetics 2nd ed. New York City, NY, JohnWiley & Sons, Inc
LSI p53 Probe hybridized to a normal cell showing the two orange (2O) signal pattern.

All products, except where indicated, are Analyte Specific Reagents. Analytical and performance characteristics are not established.6-62
Oncology – Hematology
Vysis TP53/CEP 17 FISH Probe Kitpreviously Vysis LSI TP53 SpectrumOrange/CEP 17 SpectrumGreen Probe
The Vysis TP53/CEP 17 FISH Probe Kit is intended to detect the copy number of the LSI TP53 probe target located at chromosome 17p13.1 and of the CEP 17 probe target located at the centromere of chromosome 17.
A recurring deletion that occurs in various leukemias, such as CLL and multiple myeloma, is the loss of the 17p13 region, which has been associated with poor patient outcome, both in CLL and in myeloma.1,2 The LSI TP53/CEP 17 probe combination has been used to detect the loss of the TP53 region in CLL and myeloma studies.3,4,5
Approximately 172 kb SpectrumOrange TP53 probe contains the complete TP53 gene and is located at chromosome 17p13.1. The SpectrumGreen CEP 17 probe is a control probe which hybridizes to the centromere region of chromosome 17p11.1q11.1.
Ordering Information Quantity Order No.
Vysis TP53/CEP 17 FISH Probe Kit CE marked 20 µl 5N5620
References1. Shanafelt T, Geyer SM, and Kay NE. Blood. 2004;103(4):120210. 2. AvetLoiseau H, Attal M, Moreau P, et al. Blood. 2007;109(8):348995. 3. Dewald GW, Brockman SR, Paternoster SF, et al. Br J Haematol. 2003;121:28795. 4. Grever MR, Lucas DM, Dewald GW, et al. J Clin Oncol. 2007;25(7):799804. 5. Fonseca R, Blood E, Rue M, et al. Blood. 2003;101(11):456975.
Normal nucleus showing the two green and two orange signals.
Abnormal nucleus showing the two green and one orange signal.
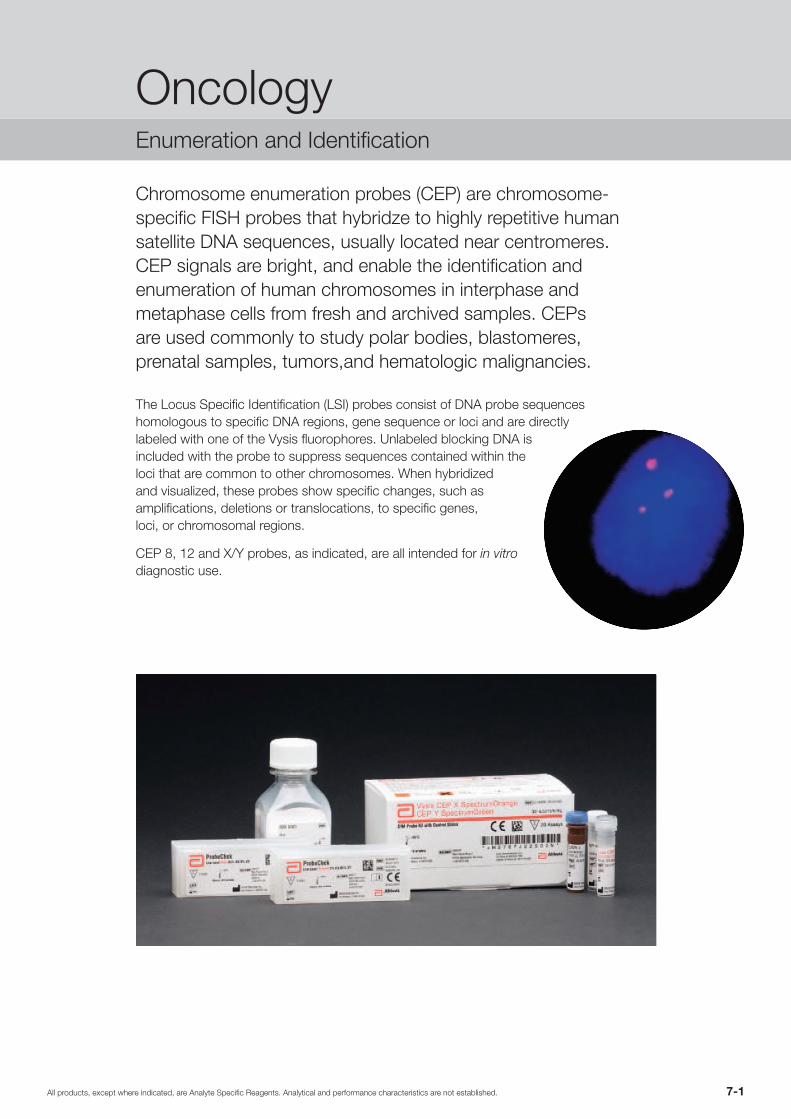
7-1All products, except where indicated, are Analyte Specific Reagents. Analytical and performance characteristics are not established.
Oncology – Enumeration and Identification
OncologyEnumeration and Identification
Chromosome enumeration probes (CEP) are chromosome-specific FISH probes that hybridze to highly repetitive human satellite DNA sequences, usually located near centromeres. CEP signals are bright, and enable the identification and enumeration of human chromosomes in interphase and metaphase cells from fresh and archived samples. CEPs are used commonly to study polar bodies, blastomeres, prenatal samples, tumors,and hematologic malignancies.
The Locus Specific Identification (LSI) probes consist of DNA probe sequences homologous to specific DNA regions, gene sequence or loci and are directly labeled with one of the Vysis fluorophores. Unlabeled blocking DNA is included with the probe to suppress sequences contained within the loci that are common to other chromosomes. When hybridized and visualized, these probes show specific changes, such as amplifications, deletions or translocations, to specific genes, loci, or chromosomal regions.
CEP 8, 12 and X/Y probes, as indicated, are all intended for in vitro diagnostic use.
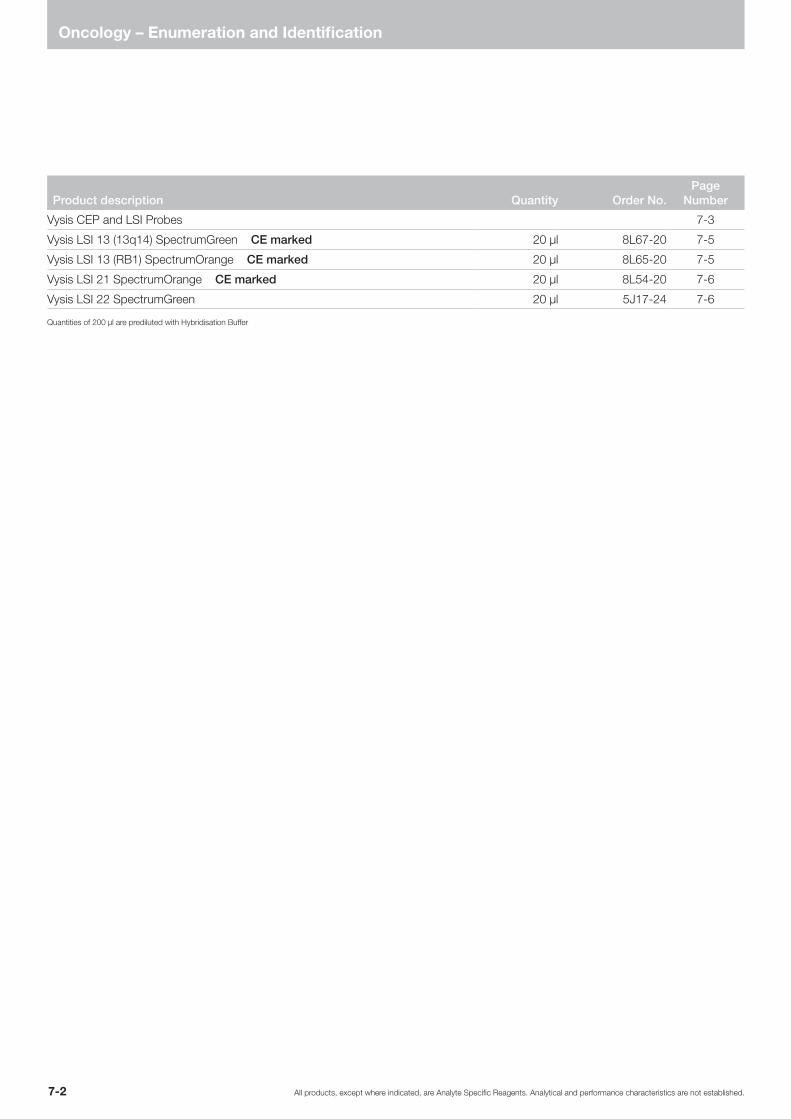
All products, except where indicated, are Analyte Specific Reagents. Analytical and performance characteristics are not established.7-2
Oncology – Enumeration and Identification
Product description Quantity Order No.Page
Number
Vysis CEP and LSI Probes 7-3
Vysis LSI 13 (13q14) SpectrumGreen CE marked 20 µl 8L67-20 7-5
Vysis LSI 13 (RB1) SpectrumOrange CE marked 20 µl 8L65-20 7-5
Vysis LSI 21 SpectrumOrange CE marked 20 µl 8L54-20 7-6
Vysis LSI 22 SpectrumGreen 20 µl 5J17-24 7-6
Quantities of 200 µl are prediluted with Hybridisation Buffer
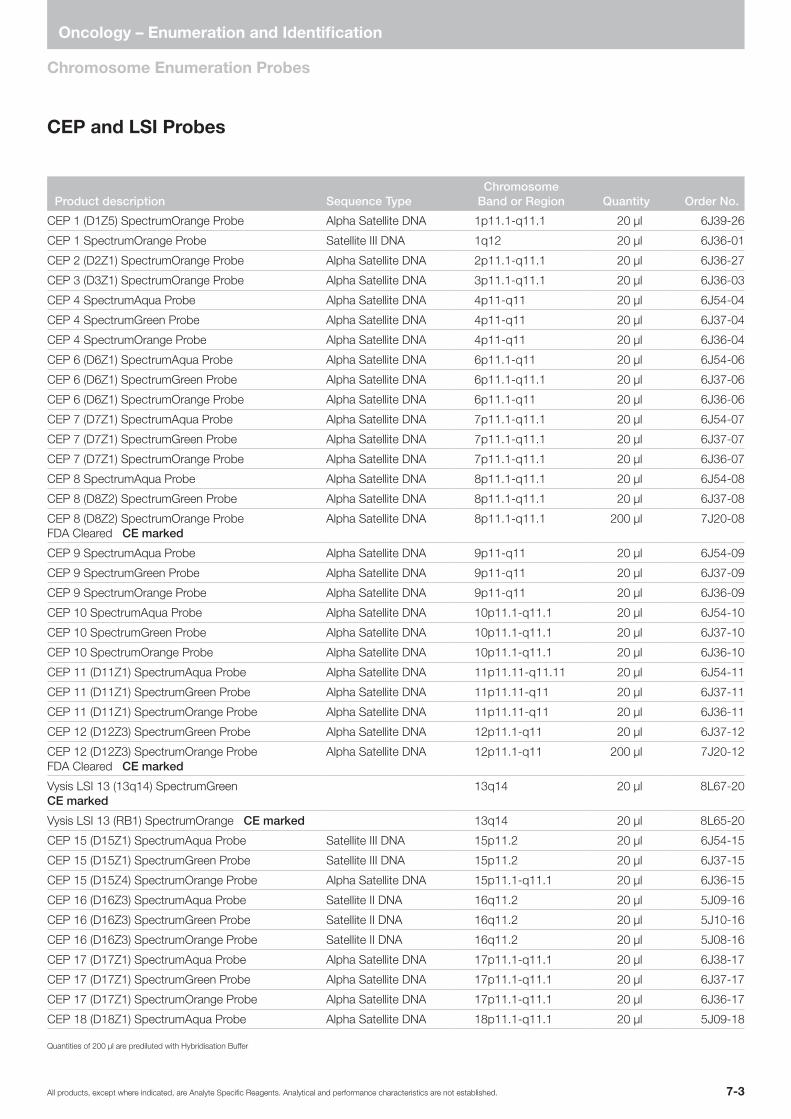
7-3All products, except where indicated, are Analyte Specific Reagents. Analytical and performance characteristics are not established.
Oncology – Enumeration and Identification
Chromosome Enumeration Probes
Product description Sequence TypeChromosome
Band or Region Quantity Order No.
CEP 1 (D1Z5) SpectrumOrange Probe Alpha Satellite DNA 1p11.1-q11.1 20 µl 6J39-26
CEP 1 SpectrumOrange Probe Satellite III DNA 1q12 20 µl 6J36-01
CEP 2 (D2Z1) SpectrumOrange Probe Alpha Satellite DNA 2p11.1-q11.1 20 µl 6J36-27
CEP 3 (D3Z1) SpectrumOrange Probe Alpha Satellite DNA 3p11.1-q11.1 20 µl 6J36-03
CEP 4 SpectrumAqua Probe Alpha Satellite DNA 4p11-q11 20 µl 6J54-04
CEP 4 SpectrumGreen Probe Alpha Satellite DNA 4p11-q11 20 µl 6J37-04
CEP 4 SpectrumOrange Probe Alpha Satellite DNA 4p11-q11 20 µl 6J36-04
CEP 6 (D6Z1) SpectrumAqua Probe Alpha Satellite DNA 6p11.1-q11 20 µl 6J54-06
CEP 6 (D6Z1) SpectrumGreen Probe Alpha Satellite DNA 6p11.1-q11.1 20 µl 6J37-06
CEP 6 (D6Z1) SpectrumOrange Probe Alpha Satellite DNA 6p11.1-q11 20 µl 6J36-06
CEP 7 (D7Z1) SpectrumAqua Probe Alpha Satellite DNA 7p11.1-q11.1 20 µl 6J54-07
CEP 7 (D7Z1) SpectrumGreen Probe Alpha Satellite DNA 7p11.1-q11.1 20 µl 6J37-07
CEP 7 (D7Z1) SpectrumOrange Probe Alpha Satellite DNA 7p11.1-q11.1 20 µl 6J36-07
CEP 8 SpectrumAqua Probe Alpha Satellite DNA 8p11.1-q11.1 20 µl 6J54-08
CEP 8 (D8Z2) SpectrumGreen Probe Alpha Satellite DNA 8p11.1-q11.1 20 µl 6J37-08
CEP 8 (D8Z2) SpectrumOrange Probe FDA Cleared CE marked
Alpha Satellite DNA 8p11.1-q11.1 200 µl 7J20-08
CEP 9 SpectrumAqua Probe Alpha Satellite DNA 9p11-q11 20 µl 6J54-09
CEP 9 SpectrumGreen Probe Alpha Satellite DNA 9p11-q11 20 µl 6J37-09
CEP 9 SpectrumOrange Probe Alpha Satellite DNA 9p11-q11 20 µl 6J36-09
CEP 10 SpectrumAqua Probe Alpha Satellite DNA 10p11.1-q11.1 20 µl 6J54-10
CEP 10 SpectrumGreen Probe Alpha Satellite DNA 10p11.1-q11.1 20 µl 6J37-10
CEP 10 SpectrumOrange Probe Alpha Satellite DNA 10p11.1-q11.1 20 µl 6J36-10
CEP 11 (D11Z1) SpectrumAqua Probe Alpha Satellite DNA 11p11.11-q11.11 20 µl 6J54-11
CEP 11 (D11Z1) SpectrumGreen Probe Alpha Satellite DNA 11p11.11-q11 20 µl 6J37-11
CEP 11 (D11Z1) SpectrumOrange Probe Alpha Satellite DNA 11p11.11-q11 20 µl 6J36-11
CEP 12 (D12Z3) SpectrumGreen Probe Alpha Satellite DNA 12p11.1-q11 20 µl 6J37-12
CEP 12 (D12Z3) SpectrumOrange Probe FDA Cleared CE marked
Alpha Satellite DNA 12p11.1-q11 200 µl 7J20-12
Vysis LSI 13 (13q14) SpectrumGreen CE marked
13q14 20 µl 8L67-20
Vysis LSI 13 (RB1) SpectrumOrange CE marked 13q14 20 µl 8L65-20
CEP 15 (D15Z1) SpectrumAqua Probe Satellite III DNA 15p11.2 20 µl 6J54-15
CEP 15 (D15Z1) SpectrumGreen Probe Satellite III DNA 15p11.2 20 µl 6J37-15
CEP 15 (D15Z4) SpectrumOrange Probe Alpha Satellite DNA 15p11.1-q11.1 20 µl 6J36-15
CEP 16 (D16Z3) SpectrumAqua Probe Satellite II DNA 16q11.2 20 µl 5J09-16
CEP 16 (D16Z3) SpectrumGreen Probe Satellite II DNA 16q11.2 20 µl 5J10-16
CEP 16 (D16Z3) SpectrumOrange Probe Satellite II DNA 16q11.2 20 µl 5J08-16
CEP 17 (D17Z1) SpectrumAqua Probe Alpha Satellite DNA 17p11.1-q11.1 20 µl 6J38-17
CEP 17 (D17Z1) SpectrumGreen Probe Alpha Satellite DNA 17p11.1-q11.1 20 µl 6J37-17
CEP 17 (D17Z1) SpectrumOrange Probe Alpha Satellite DNA 17p11.1-q11.1 20 µl 6J36-17
CEP 18 (D18Z1) SpectrumAqua Probe Alpha Satellite DNA 18p11.1-q11.1 20 µl 5J09-18
Quantities of 200 µl are prediluted with Hybridisation Buffer
CEP and LSI Probes
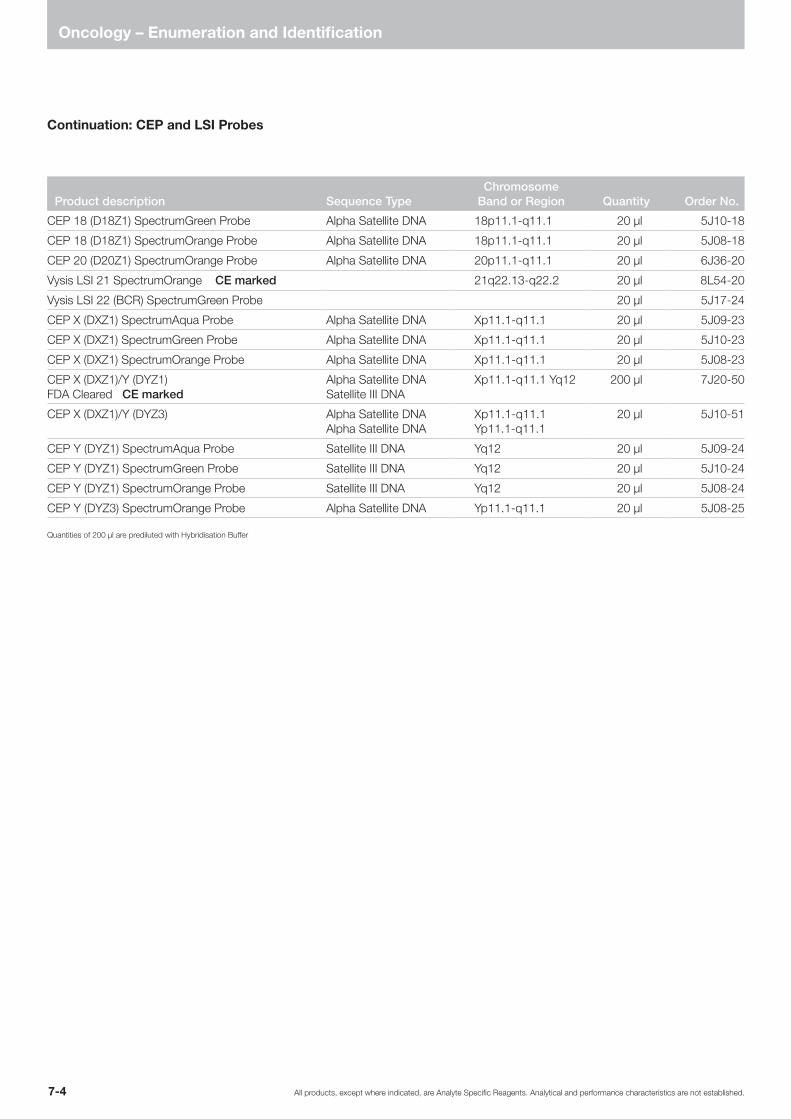
All products, except where indicated, are Analyte Specific Reagents. Analytical and performance characteristics are not established.7-4
Oncology – Enumeration and Identification
Product description Sequence TypeChromosome
Band or Region Quantity Order No.
CEP 18 (D18Z1) SpectrumGreen Probe Alpha Satellite DNA 18p11.1-q11.1 20 µl 5J10-18
CEP 18 (D18Z1) SpectrumOrange Probe Alpha Satellite DNA 18p11.1-q11.1 20 µl 5J08-18
CEP 20 (D20Z1) SpectrumOrange Probe Alpha Satellite DNA 20p11.1-q11.1 20 µl 6J36-20
Vysis LSI 21 SpectrumOrange CE marked 21q22.13-q22.2 20 µl 8L54-20
Vysis LSI 22 (BCR) SpectrumGreen Probe 20 µl 5J17-24
CEP X (DXZ1) SpectrumAqua Probe Alpha Satellite DNA Xp11.1-q11.1 20 µl 5J09-23
CEP X (DXZ1) SpectrumGreen Probe Alpha Satellite DNA Xp11.1-q11.1 20 µl 5J10-23
CEP X (DXZ1) SpectrumOrange Probe Alpha Satellite DNA Xp11.1-q11.1 20 µl 5J08-23
CEP X (DXZ1)/Y (DYZ1) FDA Cleared CE marked
Alpha Satellite DNA Satellite III DNA
Xp11.1-q11.1 Yq12 200 µl 7J20-50
CEP X (DXZ1)/Y (DYZ3) Alpha Satellite DNA Alpha Satellite DNA
Xp11.1-q11.1 Yp11.1-q11.1
20 µl 5J10-51
CEP Y (DYZ1) SpectrumAqua Probe Satellite III DNA Yq12 20 µl 5J09-24
CEP Y (DYZ1) SpectrumGreen Probe Satellite III DNA Yq12 20 µl 5J10-24
CEP Y (DYZ1) SpectrumOrange Probe Satellite III DNA Yq12 20 µl 5J08-24
CEP Y (DYZ3) SpectrumOrange Probe Alpha Satellite DNA Yp11.1-q11.1 20 µl 5J08-25
Quantities of 200 µl are prediluted with Hybridisation Buffer
Continuation: CEP and LSI Probes

7-5All products, except where indicated, are Analyte Specific Reagents. Analytical and performance characteristics are not established.
Oncology – Enumeration and Identification
Locus Specific Identification Probes
13q14 region
LSI 13
~440 kb
RB1
180 kb5' 3'
13
13q14 region
LSI 13 (RB1)
5' 3'
~220 kb
RB1 gene
Centromere Telomere
13
Vysis LSI 13 (13q14) SpectrumGreen
LSI 13 (13q14) consists of a set of overlapping clones that contain the RB1 gene and flanking regions. The RB1 gene is 180 kb. The probe extends beyond the gene for 110-170 kb in the 5’ direction and approximately 120 kb in the 3’ direction. The entire probe is approximately 440 kb in size.
Ordering Information Quantity Order No.
Vysis LSI 13 (13q14) SpectrumGreen CE marked 20 µl 8L67-20
References1. Tepperberg J, Pettenati MJ, Rao PN, et al. Prenat Diagn 2001;21:293-301.2. Fonseca R, Oken MM, Harrington D, et al. Leukemia 2001;15:981-86.3. Elnenaei MO, Hamoudi RA, Swansbury J, et al. Genes Chromosomes Cancer 2003;36:99-106.4. Kalachikov S, Migliazza A, Cayanis E, et al Genomics 1997;42:369-77.5. Stilgenbauer S, Nickolenko J, Wilhelm J, et al. Oncogene 1998;16:1891-97.6. Wiktor AE, Van Dyke DL, Stupca PJ, et al. Genet Med 2006;8:16-23.
LSI 13 (13q14) SpectrumGreen hybridized to an amniocyte. Three green signals indicate three copies of chromosome 13.
Vysis LSI 13 (RB1) SpectrumOrange
The LSI 13 (RB1) SpectrumOrange Probe is approximately 220 kb and contains the entire RB1 gene.
Ordering Information Quantity Order No.
Vysis LSI 13 (RB1) SpectrumOrange CE marked 20 µl 8L65-20
References1. Amare PS, Ghule P, Jose J, et al. Cancer Genet Cytogenet 2004;150:33-43.2. Elnenaei MO, Hamoudi RA, Swansbury J, et al. Genes Chromosomes Cancer 2003;36:99-106.3. Fonseca R, Oken MM, Harrington D, et al. Leukemia 2001;15:981-86.4. Kalachikov S, Migliazza A, Cayanis E, et al. Genomics 1997;42:369-77.5. Stilgenbauer S, Nickolenko J, Wilhelm J, et al. Oncogene 1998;16:1891-97.6. Wiktor AE, Van Dyke DL, Stupca PJ, et al. Genet Med 2006;8:16-23.
LSI 13 (RB1) SpectrumOrange hybridized to a cultured amniocyte.

All products, except where indicated, are Analyte Specific Reagents. Analytical and performance characteristics are not established.7-6
Oncology – Enumeration and Identification
21q22.13–q22.2 region
LSI 21
~200 kb
D21
S34
2
D21
S34
1
D21
S25
9
21
Exo
n 1
Exo
n 2
Exo
n 3
Centromere
3'5'
m-bcr regionM-bcr region
1 2 3 4 5
22q11.2 region Telomere
~300 kb
LSI 22q
Vysis LSI 21 SpectrumOrange
LSI 21 is approximately 200 kb and contains unique DNA sequences complementary to the loci D21S259, D21S341, and D21S342 (21q22.13-q22.2).
Ordering Information Quantity Order No.
Vysis LSI 21 SpectrumOrange CE marked 20 µl 8L54-20
References1. Delabar J, Theophile D, Rahmani Z, et al. Eur J Hum Genet1993;1:114-24.2. Korenberg JR, Chen XN, Schipper R, et al. Proc Natl Acad Sci 1994;91:4997-5001.3. Ohira M, Ichikawa H, Suzuki E, et al. Genomics 1996;33:65-74.4. Dahmane N, Ghezala GA, Gosset P, et al. Genomics 1998:48(1):12-23.5. Toyoda A, Noguchi H, Taylor T, et al. Genome Research 2002;12:1323-32.
Available at: http://www.genome.org. Accessed February 23, 2006.6. Mitelman Database of Chromosome Aberrations in Cancer (2006).
Mitelman F, Johansson B and Mertens F (Eds.) http://cgap.nci.nih.gov/Chromosomes/Mitelman.7. Mitelman S, Heim F. Cancer Cytogenetics. 2nd ed. New York: Wiley-Liss,1995:209-10.8. Mitelman F, Heim S, Mandahl N. Trisomy 21 in neoplastic cells. Am J Med Genet Suppl 1990;7:262-6.9. Wiktor AE, Van Dyke DL, Stupca PJ, et al. Genet Med 2006;8:16-23.
LSI 21 SpectrumOrange hybridized to a cultured amniocyte.
Vysis LSI 22 SpectrumGreen
The LSI 22 (BCR) Probe is an approximately 300 kb SpectrumGreen probe corresponding to 22q11.2.
Ordering Information Quantity Order No.
Vysis LSI 22 SpectrumGreen 20 µl 5J17-24
References1. Heim, S. & Mitelman, F. (1995) Cancer Cytogenetics 2nd ed. New York City, NY, JohnWiley & Sons, Inc.
LSI 22 (BCR) SpectrumGreen hybridized to an interphase cell.

8-1All products, except where indicated, are Analyte Specific Reagents. Analytical and performance characteristics are not established.
Accessories/General Reagents
FISH Accessories
Abbott Molecular delivers best in class products and services to meet the diverse needs of your laboratory. In addition to FISH automation, Abbott Molecular provides quality instrumentation and reagents that optimize laboratory effectiveness when processing FISH probes.
The following section highlights FISH Accessories by product category:
• FISH Pretreatment Reagent Kits include ready-to-use reagents used to prepare specimens for hybridization
• In Situ Hybridization Reagents offer an a la carte menu of reagents essential to FISH processing
• Fluorescence Labeling Reagents used in nick translation protocols to incorporate individual fluorophore-conjugated dUTPs into DNA
• FISH Assay Control Slides serve as controls and training tools to ensure high quality specimen processing and accurate enumeration
• VP 2000 Reagents are specifically designed for automated deparaffinization and pre-treatment protocols for Vysis FISH assays
• Filter Sets are custom-manufactured to meet the exact specifications of Abbott Molecular FISH products and your microscope
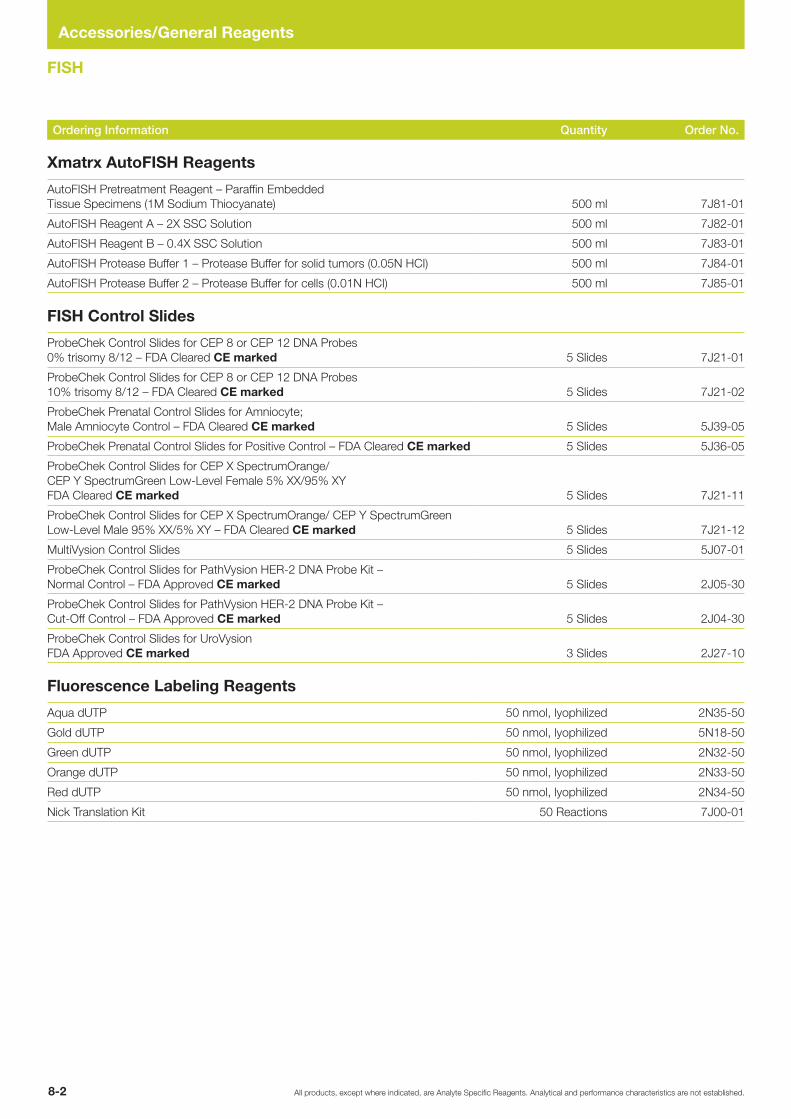
All products, except where indicated, are Analyte Specific Reagents. Analytical and performance characteristics are not established.8-2
Accessories/General Reagents
FISH
Ordering Information Quantity Order No.
Xmatrx AutoFISH Reagents
AutoFISH Pretreatment Reagent – Paraffin Embedded Tissue Specimens (1M Sodium Thiocyanate) 500 ml 7J81-01
AutoFISH Reagent A – 2X SSC Solution 500 ml 7J82-01
AutoFISH Reagent B – 0.4X SSC Solution 500 ml 7J83-01
AutoFISH Protease Buffer 1 – Protease Buffer for solid tumors (0.05N HCI) 500 ml 7J84-01
AutoFISH Protease Buffer 2 – Protease Buffer for cells (0.01N HCI) 500 ml 7J85-01
FISH Control Slides
ProbeChek Control Slides for CEP 8 or CEP 12 DNA Probes 0% trisomy 8/12 – FDA Cleared CE marked 5 Slides 7J21-01
ProbeChek Control Slides for CEP 8 or CEP 12 DNA Probes 10% trisomy 8/12 – FDA Cleared CE marked 5 Slides 7J21-02
ProbeChek Prenatal Control Slides for Amniocyte; Male Amniocyte Control – FDA Cleared CE marked 5 Slides 5J39-05
ProbeChek Prenatal Control Slides for Positive Control – FDA Cleared CE marked 5 Slides 5J36-05
ProbeChek Control Slides for CEP X SpectrumOrange/ CEP Y SpectrumGreen Low-Level Female 5% XX/95% XY FDA Cleared CE marked 5 Slides 7J21-11
ProbeChek Control Slides for CEP X SpectrumOrange/ CEP Y SpectrumGreen Low-Level Male 95% XX/5% XY – FDA Cleared CE marked 5 Slides 7J21-12
MultiVysion Control Slides 5 Slides 5J07-01
ProbeChek Control Slides for PathVysion HER-2 DNA Probe Kit – Normal Control – FDA Approved CE marked 5 Slides 2J05-30
ProbeChek Control Slides for PathVysion HER-2 DNA Probe Kit – Cut-Off Control – FDA Approved CE marked 5 Slides 2J04-30
ProbeChek Control Slides for UroVysion FDA Approved CE marked 3 Slides 2J27-10
Fluorescence Labeling Reagents
Aqua dUTP 50 nmol, lyophilized 2N35-50
Gold dUTP 50 nmol, lyophilized 5N18-50
Green dUTP 50 nmol, lyophilized 2N32-50
Orange dUTP 50 nmol, lyophilized 2N33-50
Red dUTP 50 nmol, lyophilized 2N34-50
Nick Translation Kit 50 Reactions 7J00-01
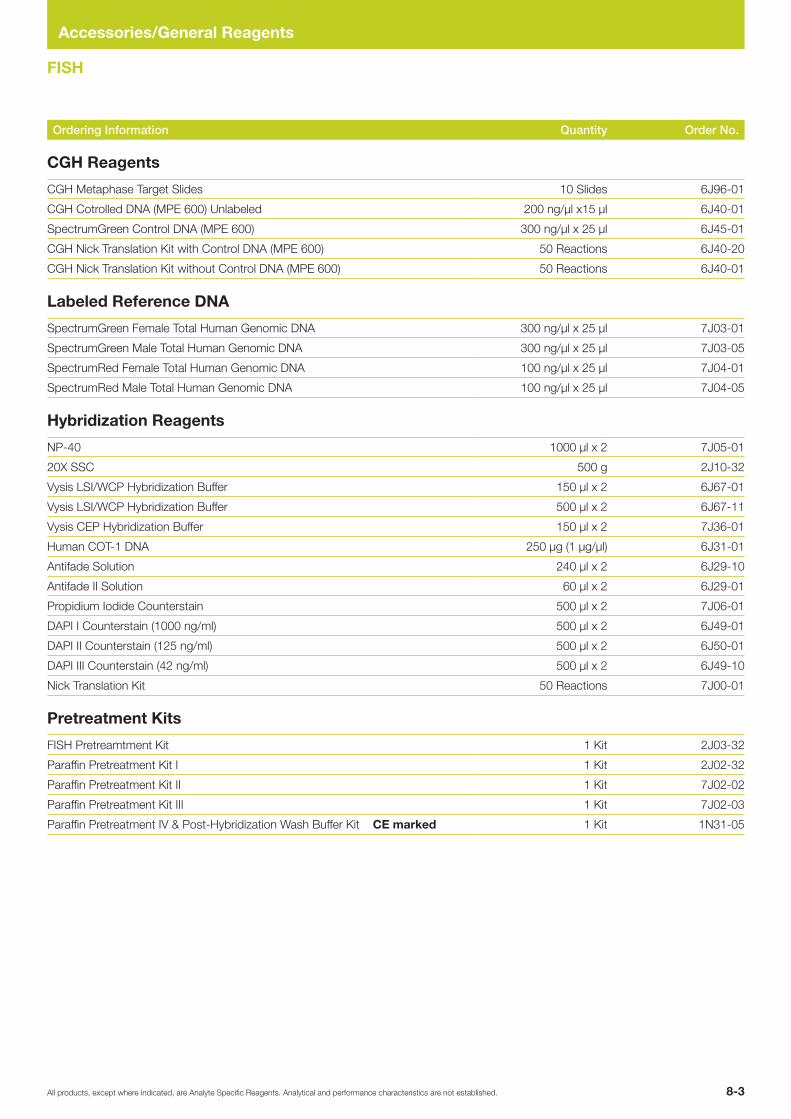
8-3All products, except where indicated, are Analyte Specific Reagents. Analytical and performance characteristics are not established.
Accessories/General Reagents
FISH
Ordering Information Quantity Order No.
CGH Reagents
CGH Metaphase Target Slides 10 Slides 6J96-01
CGH Cotrolled DNA (MPE 600) Unlabeled 200 ng/µl x15 µl 6J40-01
SpectrumGreen Control DNA (MPE 600) 300 ng/µl x 25 µl 6J45-01
CGH Nick Translation Kit with Control DNA (MPE 600) 50 Reactions 6J40-20
CGH Nick Translation Kit without Control DNA (MPE 600) 50 Reactions 6J40-01
Labeled Reference DNA
SpectrumGreen Female Total Human Genomic DNA 300 ng/µl x 25 µl 7J03-01
SpectrumGreen Male Total Human Genomic DNA 300 ng/µl x 25 µl 7J03-05
SpectrumRed Female Total Human Genomic DNA 100 ng/µl x 25 µl 7J04-01
SpectrumRed Male Total Human Genomic DNA 100 ng/µl x 25 µl 7J04-05
Hybridization Reagents
NP-40 1000 µl x 2 7J05-01
20X SSC 500 g 2J10-32
Vysis LSI/WCP Hybridization Buffer 150 µl x 2 6J67-01
Vysis LSI/WCP Hybridization Buffer 500 µl x 2 6J67-11
Vysis CEP Hybridization Buffer 150 µl x 2 7J36-01
Human COT-1 DNA 250 µg (1 µg/µl) 6J31-01
Antifade Solution 240 µl x 2 6J29-10
Antifade II Solution 60 µl x 2 6J29-01
Propidium Iodide Counterstain 500 µl x 2 7J06-01
DAPI I Counterstain (1000 ng/ml) 500 µl x 2 6J49-01
DAPI II Counterstain (125 ng/ml) 500 µl x 2 6J50-01
DAPI III Counterstain (42 ng/ml) 500 µl x 2 6J49-10
Nick Translation Kit 50 Reactions 7J00-01
Pretreatment Kits
FISH Pretreamtment Kit 1 Kit 2J03-32
Paraffin Pretreatment Kit I 1 Kit 2J02-32
Paraffin Pretreatment Kit II 1 Kit 7J02-02
Paraffin Pretreatment Kit III 1 Kit 7J02-03
Paraffin Pretreatment IV & Post-Hybridization Wash Buffer Kit CE marked 1 Kit 1N31-05

All products, except where indicated, are Analyte Specific Reagents. Analytical and performance characteristics are not established.8-4
Accessories/General Reagents
FISH
Ordering Information Quantity Order No.
VP 2000 Accessories
VP 2000 Accessories – Slide Basket (50 Slide Capacity) 1 Slide Basket 2J11-07
VP 2000 Accessories – Standard Reagent Basin 6 pk 2J11-10
VP 2000 Accessories – Heated Reagent Basin Each 2J11-13
VP 2000 Accessories – Straight Adapter Vent Tube Kit Each 2J11-16
VP 2000 Accessories – Charcoal Filter Replacement Cassette Each 2J11-22
VP 2000 Accessories – 12 Standard Reagent Basins with Carrier and Lid Each 2J11-75
VP 2000 Accessories – Heated Basin Lid Each 2J11-34
VP 2000 Accessories – Printer Each 2J11-25
VP 2000 Reagents (General Purpose Reagents)
VP 2000 Reagents – Pretreatment Reagent 500 ml 2J06-30
VP 2000 Reagents – Protease Buffer 500 ml 2J07-30
VP 2000 Reagents – Protease I 250 mg x 2 2J08-32
VP 2000 Reagents – Protease II 750 mg 6J93-01
VP 2000 Reagents – 2M MgCl 2 120 ml 2J09-30
VP 2000 Reagents – 20X SSC 500 g 2J10-32
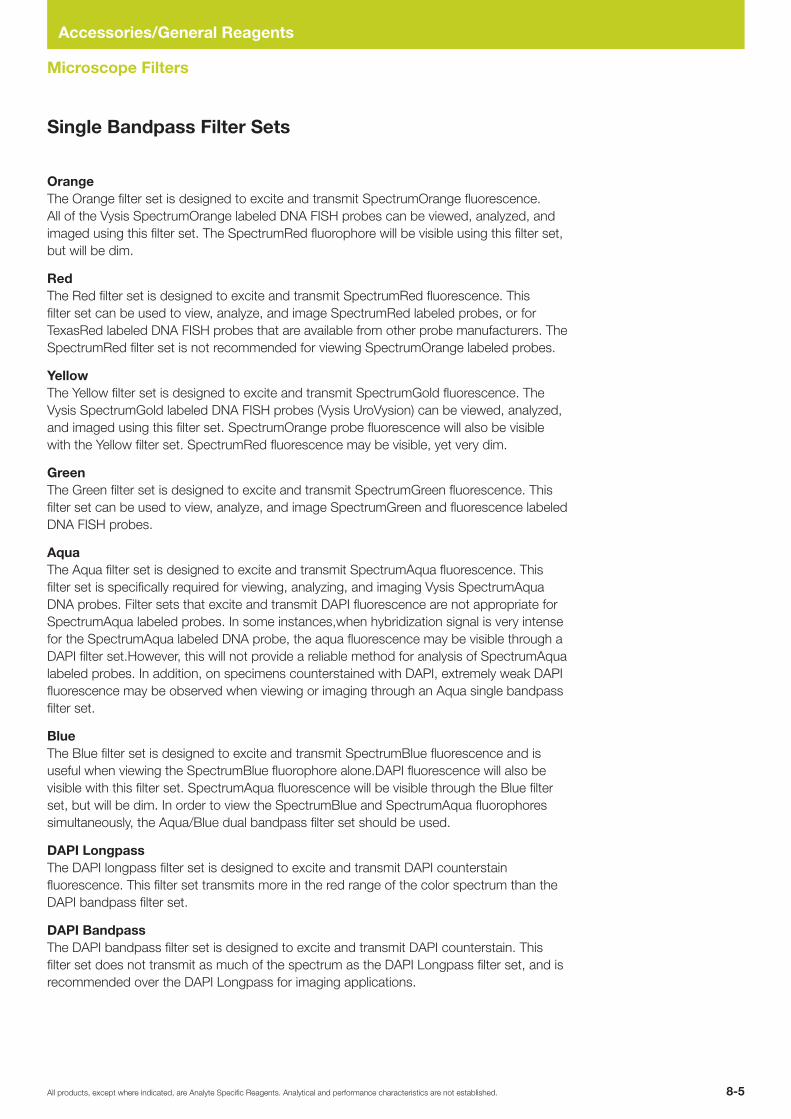
8-5All products, except where indicated, are Analyte Specific Reagents. Analytical and performance characteristics are not established.
Accessories/General Reagents
Microscope Filters
Single Bandpass Filter Sets
OrangeThe Orange filter set is designed to excite and transmit SpectrumOrange fluorescence. All of the Vysis SpectrumOrange labeled DNA FISH probes can be viewed, analyzed, and imaged using this filter set. The SpectrumRed fluorophore will be visible using this filter set, but will be dim.
RedThe Red filter set is designed to excite and transmit SpectrumRed fluorescence. This filter set can be used to view, analyze, and image SpectrumRed labeled probes, or for TexasRed labeled DNA FISH probes that are available from other probe manufacturers. The SpectrumRed filter set is not recommended for viewing SpectrumOrange labeled probes.
YellowThe Yellow filter set is designed to excite and transmit SpectrumGold fluorescence. The Vysis SpectrumGold labeled DNA FISH probes (Vysis UroVysion) can be viewed, analyzed, and imaged using this filter set. SpectrumOrange probe fluorescence will also be visible with the Yellow filter set. SpectrumRed fluorescence may be visible, yet very dim.
GreenThe Green filter set is designed to excite and transmit SpectrumGreen fluorescence. This filter set can be used to view, analyze, and image SpectrumGreen and fluorescence labeled DNA FISH probes.
AquaThe Aqua filter set is designed to excite and transmit SpectrumAqua fluorescence. This filter set is specifically required for viewing, analyzing, and imaging Vysis SpectrumAqua DNA probes. Filter sets that excite and transmit DAPI fluorescence are not appropriate for SpectrumAqua labeled probes. In some instances,when hybridization signal is very intense for the SpectrumAqua labeled DNA probe, the aqua fluorescence may be visible through a DAPI filter set.However, this will not provide a reliable method for analysis of SpectrumAqua labeled probes. In addition, on specimens counterstained with DAPI, extremely weak DAPI fluorescence may be observed when viewing or imaging through an Aqua single bandpass filter set.
BlueThe Blue filter set is designed to excite and transmit SpectrumBlue fluorescence and is useful when viewing the SpectrumBlue fluorophore alone.DAPI fluorescence will also be visible with this filter set. SpectrumAqua fluorescence will be visible through the Blue filter set, but will be dim. In order to view the SpectrumBlue and SpectrumAqua fluorophores simultaneously, the Aqua/Blue dual bandpass filter set should be used.
DAPI LongpassThe DAPI longpass filter set is designed to excite and transmit DAPI counterstain fluorescence. This filter set transmits more in the red range of the color spectrum than the DAPI bandpass filter set.
DAPI BandpassThe DAPI bandpass filter set is designed to excite and transmit DAPI counterstain. This filter set does not transmit as much of the spectrum as the DAPI Longpass filter set, and is recommended over the DAPI Longpass for imaging applications.

All products, except where indicated, are Analyte Specific Reagents. Analytical and performance characteristics are not established.8-6
Accessories/General Reagents
Microscope Filters
DAPI/OrangeThe DAPI/Orange filter set is designed to excite and transmit SpectrumOrange and DAPI counterstain fluorescence simultaneously. This filter is useful when the nuclear and chromosomal DNA, counterstained with DAPI, and the SpectrumOrange fluorophore must be viewed concurrently. This filter set is recommended for many of the Vysis SpectrumOrange labeled DNA FISH probes that can be analyzed simultaneously while viewing the DAPI counterstain.
DAPI/9-Orange (NB)The DAPI/9-Orange (NB) filter set is designed to excite and transmit SpectrumOrange and the DAPI counterstain fluorescence simultaneously. This filter set is designed to minimize autofluorescence from paraffin-embedded specimens and is recommended for the PathVysion HER-2 DNA Assay. This filter is useful when the nuclear and chromosomal DNA, counterstained with DAPI, and the SpectrumOrange fluorophore must be viewed concurrently.
DAPI/GreenThe DAPI/Green filter set is designed to excite and transmit SpectrumGreen and DAPI fluorescence simultaneously and is recommended for the PathVysion DNA Assay. This filter is useful when the nuclear and chromosomal DNA, counterstained with DAPI, and the SpectrumGreen fluorophore must be viewed concurrently. This filter set is recommended for many of the Vysis SpectrumGreen labeled DNA FISH probes that can be analyzed simultaneously while viewing the DAPI counterstain.
Blue/AquaThe Blue/Aqua filter set is designed to excite and transmit SpectrumBlue and SpectrumAqua fluorophores simultaneously.
Dual Bandpass Filter Sets

8-7All products, except where indicated, are Analyte Specific Reagents. Analytical and performance characteristics are not established.
Accessories/General Reagents
Microscope Filters
DAPI/Green/OrangeThe DAPI/Green/Orange filter set is designed to excite and transmit SpectrumGreen, SpectrumOrange, and DAPI counterstain fluorescence simultaneously. This filter is useful when the nuclear and chromosomal DNA, counterstained with DAPI, and the two fluorophores SpectrumGreen and SpectrumOrange must be viewed concurrently. This filter set is recommended for most of the Vysis dual color probe mixtures when hybridized to specimens that are not imbedded in paraffin. Products such as CEP X/Y should be viewed using this filter set.
DAPI/Green/Orange (V.2)The DAPI/Green/Orange (V.2) filter set is designed to excite and transmit SpectrumGreen, SpectrumOrange and the DAPI counterstain fluorescence simultaneously. This filter is useful when the nuclear and chromosomal DNA, counterstained with DAPI, and the SpectrumGreen and SpectrumOrange fluorophores must be viewed simultaneously.
The DAPI/Green/Orange (V.2) filter design may provide better color distinction and brightness of the SpectrumOrange and SpectrumGreen fluorophores when viewing paraffin-embedded specimens. This filter set is not optimized for viewing dual-color translocation probes where a blending of the SpectrumGreen and SpectrumOrange fluorophores creates a yellow color. This is the recommended triple bandpass filter set for viewing and analyzing the PathVysion HER-2 DNA Assay.
DAPI/Green/RedThe DAPI/Green/Red filter set is designed to excite and transmit SpectrumGreen, SpectrumRed, and the DAPI counterstain fluorescence simultaneously. This filter is optimal for viewing probes labeled with SpectrumRed fluorophore while concurrently viewing SpectrumGreen and DAPI.
DAPI/Aqua/Green/OrangeThe quad bandpass filter set is designed to excite and transmit DAPI, SpectrumAqua, SpectrumOrange and SpectrumGreen fluorophores simultaneously. This filter set is optimal for viewing all three probe labels simultaneously, plus the DAPI counterstain. This filter set is not recommended for viewing the AneuVysion Assay on uncultured amniocytes.
Triple Bandpass Filter Sets
Quad Bandpass Filter Set
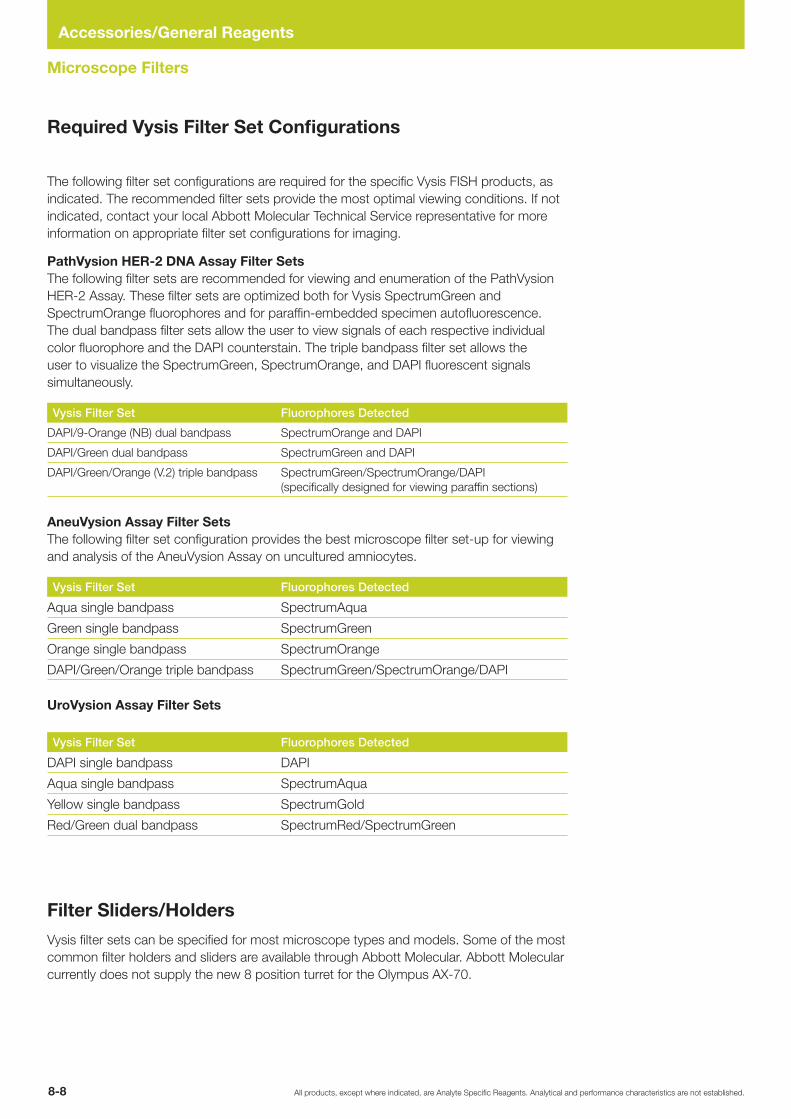
All products, except where indicated, are Analyte Specific Reagents. Analytical and performance characteristics are not established.8-8
Accessories/General Reagents
Microscope Filters
The following filter set configurations are required for the specific Vysis FISH products, as indicated. The recommended filter sets provide the most optimal viewing conditions. If not indicated, contact your local Abbott Molecular Technical Service representative for more information on appropriate filter set configurations for imaging.
PathVysion HER-2 DNA Assay Filter Sets The following filter sets are recommended for viewing and enumeration of the PathVysion HER-2 Assay. These filter sets are optimized both for Vysis SpectrumGreen and SpectrumOrange fluorophores and for paraffin-embedded specimen autofluorescence. The dual bandpass filter sets allow the user to view signals of each respective individual color fluorophore and the DAPI counterstain. The triple bandpass filter set allows the user to visualize the SpectrumGreen, SpectrumOrange, and DAPI fluorescent signals simultaneously.
Vysis Filter Set Fluorophores Detected
DAPI/9-Orange (NB) dual bandpass SpectrumOrange and DAPI
DAPI/Green dual bandpass SpectrumGreen and DAPI
DAPI/Green/Orange (V.2) triple bandpass SpectrumGreen/SpectrumOrange/DAPI (specifically designed for viewing paraffin sections)
AneuVysion Assay Filter SetsThe following filter set configuration provides the best microscope filter set-up for viewing and analysis of the AneuVysion Assay on uncultured amniocytes.
Vysis Filter Set Fluorophores Detected
Aqua single bandpass SpectrumAqua
Green single bandpass SpectrumGreen
Orange single bandpass SpectrumOrange
DAPI/Green/Orange triple bandpass SpectrumGreen/SpectrumOrange/DAPI
UroVysion Assay Filter Sets Vysis Filter Set Fluorophores Detected
DAPI single bandpass DAPI
Aqua single bandpass SpectrumAqua
Yellow single bandpass SpectrumGold
Red/Green dual bandpass SpectrumRed/SpectrumGreen
Required Vysis Filter Set Configurations
Filter Sliders/Holders
Vysis filter sets can be specified for most microscope types and models. Some of the most common filter holders and sliders are available through Abbott Molecular. Abbott Molecular currently does not supply the new 8 position turret for the Olympus AX-70.

8-9All products, except where indicated, are Analyte Specific Reagents. Analytical and performance characteristics are not established.
Accessories/General Reagents
Microscope Filters
The critical components of the fluorescence microscope optical train are depicted in the diagram below.
Microscope filter sets are custom manufactured to fit the dimensions required by each type of microscope and filter wheel. Filters are manufactured as matched sets consisting of the excitation filter, dichroic filter, and emission filter. As such, it is necessary to provide all of the required information, as requested below,when ordering filter sets. Without the appropriate information, the correct microscope filter cannot be manufactured. In addition, delays in order processing due to inaccurate or incomplete information will delay the fulfillment of the filter set order. Contact Vysis Technical Service for more information on microscope filter sets and the appropriate configuration for your laboratory’s specific needs.
Order Information
Please contact your Abbott representative or Order/Entry.
Diagram of the Fluorescence Microscope
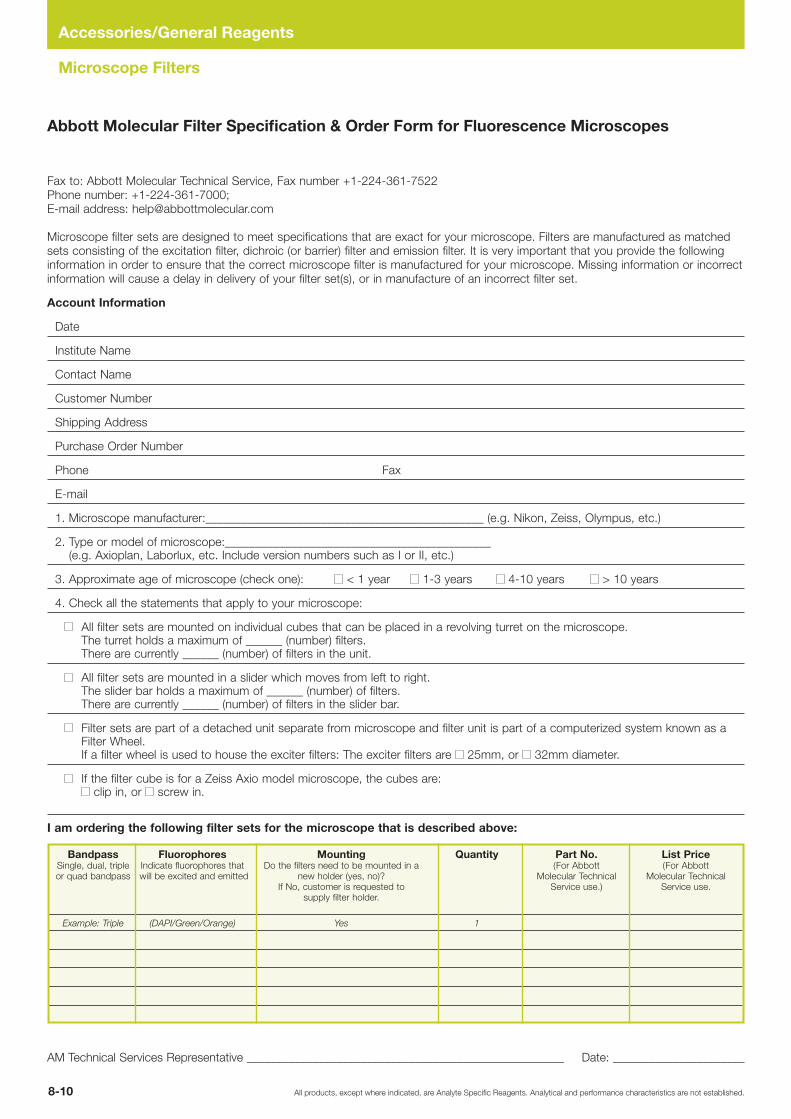
All products, except where indicated, are Analyte Specific Reagents. Analytical and performance characteristics are not established.8-10
Accessories/General Reagents
Microscope Filters
Abbott Molecular Filter Specification & Order Form for Fluorescence Microscopes
Fax to: Abbott Molecular Technical Service, Fax number +1-224-361-7522Phone number: +1-224-361-7000; E-mail address: [email protected]
Microscope filter sets are designed to meet specifications that are exact for your microscope. Filters are manufactured as matched sets consisting of the excitation filter, dichroic (or barrier) filter and emission filter. It is very important that you provide the following information in order to ensure that the correct microscope filter is manufactured for your microscope. Missing information or incorrect information will cause a delay in delivery of your filter set(s), or in manufacture of an incorrect filter set.
Account Information
Date
Institute Name
Contact Name
Customer Number
Shipping Address
Purchase Order Number
Phone Fax
1. Microscope manufacturer:______________________________________________ (e.g. Nikon, Zeiss, Olympus, etc.)
2. Type or model of microscope:____________________________________________ (e.g. Axioplan, Laborlux, etc. Include version numbers such as I or II, etc.)
3. Approximate age of microscope (check one): < 1 year 1-3 years 4-10 years > 10 years
4. Check all the statements that apply to your microscope:
All filter sets are mounted on individual cubes that can be placed in a revolving turret on the microscope. The turret holds a maximum of ______ (number) filters. There are currently ______ (number) of filters in the unit.
All filter sets are mounted in a slider which moves from left to right. The slider bar holds a maximum of ______ (number) of filters. There are currently ______ (number) of filters in the slider bar.
Filter sets are part of a detached unit separate from microscope and filter unit is part of a computerized system known as a Filter Wheel. If a filter wheel is used to house the exciter filters: The exciter filters are 25mm, or 32mm diameter.
If the filter cube is for a Zeiss Axio model microscope, the cubes are: clip in, or screw in.
I am ordering the following filter sets for the microscope that is described above:
Bandpass Fluorophores Mounting Quantity Part No. List Price Single, dual, triple Indicate fluorophores that Do the filters need to be mounted in a (For Abbott (For Abbott or quad bandpass will be excited and emitted new holder (yes, no)? Molecular Technical Molecular Technical If No, customer is requested to Service use.) Service use. supply filter holder.
Example:Triple (DAPI/Green/Orange) Yes 1
AM Technical Services Representative _____________________________________________________ Date: ______________________

9-1All products, except where indicated, are Analyte Specific Reagents. Analytical and performance characteristics are not established.
Index
Product description Quantity Order No.Page
Number
Vysis 13q34 SpectrumGreen FISH Probe Kit CE markedpreviously: Vysis LSI (13q34) SpectrumGreen Probe 20 µl 5N34-20 6-9
Vysis 1p36/1q25 and 19q13/19p13 FISH Probe Kit CE marked 2 x 200 µl 4N60-20 5-5
Vysis 1p36 Microdeletion Region Probe – LSI p58 (1p36) SpectrumOrange/TelVysion 1p SpectrumGreen/LSI 1q25 (SA) 20 µl 5J21-20 2-11
20X SSC 500 g 2J10-32 8-3
A
AneuVysion Multicolor DNA Probe Kit - FDA Cleared CE marked 10 Assays 5J38-10 2-3
AneuVysion Multicolor DNA Probe Kit - FDA Cleared CE marked 30 Assays 5J38-30 2-3
AneuVysion Multicolor DNA Probe Kit - FDA Cleared CE marked 50 Assays 5J38-50 2-3
Antifade Solution 240 µl x 2 6J29-10 8-3
Antifade II Solution 60 µl x 2 6J29-01 8-3
Aqua dUTP 50 nmol, lyophilized 2N35-50 8-2
Vysis ATM/CEP 11 FISH Probe Kit CE marked 20 µl 5N55-20 6-15
AutoFISH Pretreatment Reagent – Paraffin Embedded Tissue Specimens (1M Sodium Thiocyanate) 500 ml 7J81-01 8-2
AutoFISH Protease Buffer 1 – Protease Buffer for solid tumors (0.05N HCI) 500 ml 7J84-01 8-2
AutoFISH Protease Buffer 2 – Protease Buffer for cells (0.01N HCI) 500 ml 7J85-01 8-2
AutoFISH Reagent A – 2X SSC Solution 500 ml 7J82-01 8-2
AutoFISH Reagent B – 0.4X SSC Solution 500 ml 7J83-01 8-2
B
Vysis BCL2 Break Apart FISH Probe Kit CE marked previously: Vysis LSI BCL2 Dual Color, Break Apart Rearrangement Probe 20 µl 5N51-20 6-16
Vysis BIRC3/MALT1 Break Apart FISH Probe Kit CE markedpreviously: Vysis LSI API2/MALT1 t(11;18) (q21;q21) Dual Color, DF Translocation Probe 20 µl 5N50-20 6-23
Breast Aneusomy Multi-Color Probe 200 µl 5J59-01 4-5
C
Vysis CBFB Break Apart FISH Probe Kit CE marked 20 µl 5N44-20 6-25
Vysis CCND1/CEP11 FISH Probe Kit CE marked previously: Vysis LSI Cyclin D1 (11q13) SpectrumOrange/CEP 11 SpectrumGreen 20 µl 3N88-20 5-8, 4-6, 6-27
Vysis CCND1 Break Apart FISH Probe Kit CE marked 20 µl 5N38-20 6-26
Vysis CDKN2A/CEP 9 FISH Probe Kit CE markedpreviously: Vysis LSI p16 (9p21) SpectrumOrange/CEP 9 SpectrumGreen Probe 20 µl 4N61-20 5-9, 3-6, 6-28
CEP 1 (D1Z5) SpectrumOrange Probe 20 µl 6J39-26 7-3
CEP 1 SpectrumOrange Probe 20 µl 6J36-01 7-3
CEP 2 (D2Z1) SpectrumOrange Probe 20 µl 6J36-27 7-3
CEP 3 (D3Z1) SpectrumOrange Probe 20 µl 6J36-03 7-3
CEP 4 SpectrumAqua Probe 20 µl 6J54-04 7-3
CEP 4 SpectrumGreen Probe 20 µl 6J37-04 7-3
CEP 4 SpectrumOrange Probe 20 µl 6J36-04 7-3
CEP 6 (D6Z1) SpectrumAqua Probe 20 µl 6J54-06 7-3
CEP 6 (D6Z1) SpectrumGreen Probe 20 µl 6J37-06 7-3
CEP 6 (D6Z1) SpectrumOrange Probe 20 µl 6J36-06 7-3
CEP 7 (D7Z1) SpectrumAqua Probe 20 µl 6J54-07 7-3
CEP 7 (D7Z1) SpectrumGreen Probe 20 µl 6J37-07 7-3
CEP 7 (D7Z1) SpectrumOrange Probe 20 µl 6J36-07 7-3

All products, except where indicated, are Analyte Specific Reagents. Analytical and performance characteristics are not established.9-2
Index
Product description Quantity Order No.Page
Number
CEP 8 (D8Z2) SpectrumGreen Probe 20 µl 6J37-08 7-3
CEP 8 (D8Z2) SpectrumOrange Probe FDA Cleared CE marked 200 µl 7J20-08 7-3
CEP 8 SpectrumAqua Probe 20 µl 6J54-08 7-3
CEP 8 SpectrumOrange DNA Probe Kit with control slides FDA Cleared CE marked 20 Assays 7J22-08 6-7
CEP 8 SpectrumOrange DNA Probe Kit without control slides FDA Cleared CE marked 20 Assays 7J20-08 6-7
CEP 9 SpectrumAqua Probe 20 µl 6J54-09 7-3
CEP 9 SpectrumGreen Probe 20 µl 6J37-09 7-3
CEP 9 SpectrumOrange Probe 20 µl 6J36-09 7-3
CEP 10 SpectrumAqua Probe 20 µl 6J54-10 7-3
CEP 10 SpectrumGreen Probe 20 µl 6J37-10 7-3
CEP 10 SpectrumOrange Probe 20 µl 6J36-10 7-3
CEP 11 (D11Z1) SpectrumAqua Probe 20 µl 6J54-11 7-3
CEP 11 (D11Z1) SpectrumGreen Probe 20 µl 6J37-11 7-3
CEP 11 (D11Z1) SpectrumOrange Probe 20 µl 6J36-11 7-3
CEP 12 (D12Z3) SpectrumGreen Probe 20 µl 6J37-12 7-3
CEP 12 (D12Z3) SpectrumOrange Probe FDA Cleared CE marked 200 µl 7J20-12 7-3
CEP 12 SpectrumOrange DNA Probe Kit with control slides FDA Cleared CE marked 20 Assays 7J22-12 6-6
CEP 12 SpectrumOrange DNA Probe Kit without control slides FDA Cleared CE marked 20 Assays 7J20-12 6-6
CEP 15 (D15Z1) SpectrumAqua Probe 20 µl 6J54-15 7-3
CEP 15 (D15Z1) SpectrumGreen Probe 20 µl 6J37-15 7-3
CEP 15 (D15Z4) SpectrumOrange Probe 20 µl 6J36-15 7-3
CEP 16 (D16Z3) SpectrumAqua Probe 20 µl 5J09-16 7-3
CEP 16 (D16Z3) SpectrumGreen Probe 20 µl 5J10-16 7-3
CEP 16 (D16Z3) SpectrumOrange Probe 20 µl 5J08-16 7-3
CEP 17 (D17Z1) SpectrumAqua Probe 20 µl 6J38-17 7-3
CEP 17 (D17Z1) SpectrumGreen Probe 20 µl 6J37-17 7-3
CEP 17 (D17Z1) SpectrumOrange Probe 20 µl 6J36-17 7-3
CEP 18 (D18Z1) SpectrumAqua Probe 20 µl 5J09-18 7-3
CEP 18 (D18Z1) SpectrumGreen Probe 20 µl 5J10-18 7-4
CEP 18 (D18Z1) SpectrumOrange Probe 20 µl 5J08-18 7-4
CEP 20 (D20Z1) SpectrumOrange Probe 20 µl 6J36-20 7-4
Vysis CEP and LSI Probes 7-3
Vysis CEP Hybridization Buffer 150 µl x 2 7J36-01 8-3
CEP X (DXZ1)/Y (DYZ1) FDA Cleared CE marked 200 µl 7J20-50 7-4
CEP X (DXZ1)/Y (DYZ3) 20 µl 5J10-51 7-4
CEP X (DXZ1) SpectrumAqua Probe 20 µl 5J09-23 7-4
CEP X (DXZ1) SpectrumGreen Probe 20 µl 5J10-23 7-4
CEP X (DXZ1) SpectrumOrange Probe 20 µl 5J08-23 7-4

9-3All products, except where indicated, are Analyte Specific Reagents. Analytical and performance characteristics are not established.
Index
Product description Quantity Order No.Page
Number
CEP X SpectrumOrange/Y SpectrumGreen DNA Probe Kit with control slides FDA Cleared CE marked 20 Assays 7J22-50 6-8
CEP X SpectrumOrange/Y SpectrumGreen DNA Probe Kit without control slides FDA Cleared CE marked 20 Assays 7J20-50 6-8
CEP Y (DYZ1) SpectrumAqua Probe 20 µl 5J09-24 7-4
CEP Y (DYZ1) SpectrumGreen Probe 20 µl 5J10-24 7-4
CEP Y (DYZ1) SpectrumOrange Probe 20 µl 5J08-24 7-4
CEP Y (DYZ3) SpectrumOrange Probe 20 µl 5J08-25 7-4
Vysis Cervical FISH Probe Kit CE marked 200 µl 1N29-20 5-10
CGH Cotrolled DNA (MPE 600) Unlabeled 200 ng/µl x15 µl 6J40-01 8-3
CGH Metaphase Target Slides 10 Slides 6J96-01 8-3
CGH Nick Translation Kit with Control DNA (MPE 600) 50 Reactions 6J40-20 8-3
Vysis Cri-du-Chat Region Probe – LSI D5S23, D5S721 SpectrumGreen 20 µl 5J20-25 2-5
Vysis CSF1R/D5S23, D5S721 FISH Probe Kit CE marked 20 µl 5N03-20 6-30
D
Vysis D13S25 (13q34) SpectrumOrange Probe CE marked 20 µl 1N37-20 6-31
Vysis D13S319 (13q34) SpectrumOrange Probe CE marked 20 µl 1N34-20 6-33
Vysis D13S319/13q34 FISH Probe Kit CE marked 20 µl 5N37-20 6-32
Vysis D20S108 FISH Probe Kit CE marked 20 µl 5N02-20 6-34
Vysis D7S486/CEP 7 FISH Probe Kit CE marked 20 µl 5N07-20 6-36
Vysis D7S522/CEP 7 FISH Probe Kit CE marked 20 µl 5N08-20 6-37
DAPI I Counterstain (1000 ng/ml) 500 µl x 2 6J49-01 8-3
DAPI II Counterstain (125 ng/ml) 500 µl x 2 6J50-01 8-3
DAPI III Counterstain (42 ng/ml) 500 µl x 2 6J49-10 8-3
Vysis DDIT3 Break Apart FISH Probe Kit CE marked previously: Vysis LSI CHOP (12q13) Dual Color, Break Apart Rearrangement Probe 20 µl 3N57-20 5-12
Vysis DiGeorge Region Probe – LSI TUPLE 1 SpectrumOrange/LSI ARSA SpectrumGreen CE marked 20 µl 8L59-20 2-7
Vysis DiGeorge Region Probe – LSI TUPLE1 SpectrumOrange/TelVysion 22q SpectrumGreen 10 µl 1N14-10 2-8
E
Vysis EGFR/CEP 7 FISH Probe Kit CE marked 200 µl 1N35-20 4-7, 5-15
Vysis Esophageal FISH Probe Kit CE marked 20 µl 4N19-20 5-13
Vysis ETV6 Break Apart FISH Probe Kit CE marked previously: Vysis LSI ETV6 (TEL) (12p13) Dual Color, Break Apart Rearrangement Probe 20 µl 4N09-20 6-40
Vysis EWSR1 Break Apart FISH Probe Kit CE marked 20 µl 3N59-20 5-16
F
FISH Pretreamtment Kit 1 Kit 2J03-32 8-3
Vysis FOXO1 Break Apart FISH Probe Kit CE markedpreviously: Vysis LSI FKHR (13q14) Dual Color, Break Apart Rearrangement Probe 20 µl 3N60-20 5-17
Vysis FUS Break Apart FISH Probe Kit CE marked 20 µl 3N58-20 5-18
G
Gold dUTP 50 nmol, lyophilized 5N18-50 8-2
Green dUTP 50 nmol, lyophilized 2N32-50 8-2
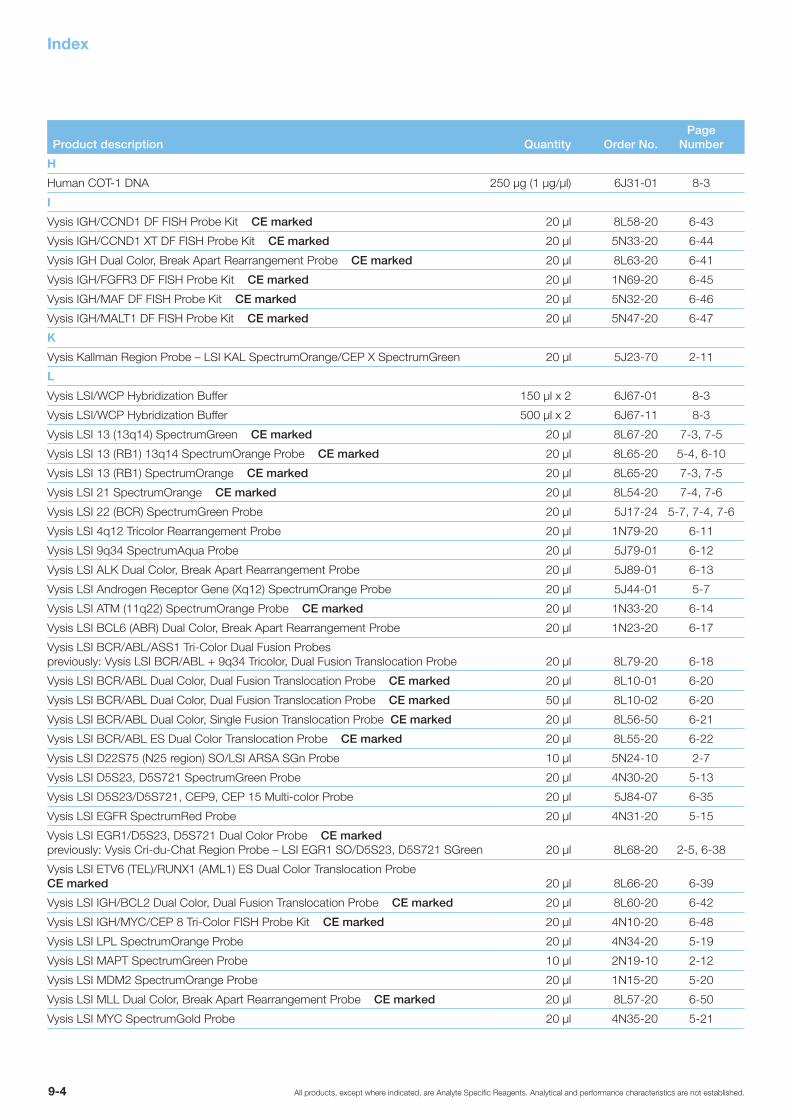
All products, except where indicated, are Analyte Specific Reagents. Analytical and performance characteristics are not established.9-4
Index
Product description Quantity Order No.Page
Number
H
Human COT-1 DNA 250 µg (1 µg/µl) 6J31-01 8-3
I
Vysis IGH/CCND1 DF FISH Probe Kit CE marked 20 µl 8L58-20 6-43
Vysis IGH/CCND1 XT DF FISH Probe Kit CE marked 20 µl 5N33-20 6-44
Vysis IGH Dual Color, Break Apart Rearrangement Probe CE marked 20 µl 8L63-20 6-41
Vysis IGH/FGFR3 DF FISH Probe Kit CE marked 20 µl 1N69-20 6-45
Vysis IGH/MAF DF FISH Probe Kit CE marked 20 µl 5N32-20 6-46
Vysis IGH/MALT1 DF FISH Probe Kit CE marked 20 µl 5N47-20 6-47
K
Vysis Kallman Region Probe – LSI KAL SpectrumOrange/CEP X SpectrumGreen 20 µl 5J23-70 2-11
L
Vysis LSI/WCP Hybridization Buffer 150 µl x 2 6J67-01 8-3
Vysis LSI/WCP Hybridization Buffer 500 µl x 2 6J67-11 8-3
Vysis LSI 13 (13q14) SpectrumGreen CE marked 20 µl 8L67-20 7-3, 7-5
Vysis LSI 13 (RB1) 13q14 SpectrumOrange Probe CE marked 20 µl 8L65-20 5-4, 6-10
Vysis LSI 13 (RB1) SpectrumOrange CE marked 20 µl 8L65-20 7-3, 7-5
Vysis LSI 21 SpectrumOrange CE marked 20 µl 8L54-20 7-4, 7-6
Vysis LSI 22 (BCR) SpectrumGreen Probe 20 µl 5J17-24 5-7, 7-4, 7-6
Vysis LSI 4q12 Tricolor Rearrangement Probe 20 µl 1N79-20 6-11
Vysis LSI 9q34 SpectrumAqua Probe 20 µl 5J79-01 6-12
Vysis LSI ALK Dual Color, Break Apart Rearrangement Probe 20 µl 5J89-01 6-13
Vysis LSI Androgen Receptor Gene (Xq12) SpectrumOrange Probe 20 µl 5J44-01 5-7
Vysis LSI ATM (11q22) SpectrumOrange Probe CE marked 20 µl 1N33-20 6-14
Vysis LSI BCL6 (ABR) Dual Color, Break Apart Rearrangement Probe 20 µl 1N23-20 6-17
Vysis LSI BCR/ABL/ASS1 Tri-Color Dual Fusion Probes previously: Vysis LSI BCR/ABL + 9q34 Tricolor, Dual Fusion Translocation Probe 20 µl 8L79-20 6-18
Vysis LSI BCR/ABL Dual Color, Dual Fusion Translocation Probe CE marked 20 µl 8L10-01 6-20
Vysis LSI BCR/ABL Dual Color, Dual Fusion Translocation Probe CE marked 50 µl 8L10-02 6-20
Vysis LSI BCR/ABL Dual Color, Single Fusion Translocation Probe CE marked 20 µl 8L56-50 6-21
Vysis LSI BCR/ABL ES Dual Color Translocation Probe CE marked 20 µl 8L55-20 6-22
Vysis LSI D22S75 (N25 region) SO/LSI ARSA SGn Probe 10 µl 5N24-10 2-7
Vysis LSI D5S23, D5S721 SpectrumGreen Probe 20 µl 4N30-20 5-13
Vysis LSI D5S23/D5S721, CEP9, CEP 15 Multi-color Probe 20 µl 5J84-07 6-35
Vysis LSI EGFR SpectrumRed Probe 20 µl 4N31-20 5-15
Vysis LSI EGR1/D5S23, D5S721 Dual Color Probe CE markedpreviously: Vysis Cri-du-Chat Region Probe – LSI EGR1 SO/D5S23, D5S721 SGreen 20 µl 8L68-20 2-5, 6-38
Vysis LSI ETV6 (TEL)/RUNX1 (AML1) ES Dual Color Translocation Probe CE marked 20 µl 8L66-20 6-39
Vysis LSI IGH/BCL2 Dual Color, Dual Fusion Translocation Probe CE marked 20 µl 8L60-20 6-42
Vysis LSI IGH/MYC/CEP 8 Tri-Color FISH Probe Kit CE marked 20 µl 4N10-20 6-48
Vysis LSI LPL SpectrumOrange Probe 20 µl 4N34-20 5-19
Vysis LSI MAPT SpectrumGreen Probe 10 µl 2N19-10 2-12
Vysis LSI MDM2 SpectrumOrange Probe 20 µl 1N15-20 5-20
Vysis LSI MLL Dual Color, Break Apart Rearrangement Probe CE marked 20 µl 8L57-20 6-50
Vysis LSI MYC SpectrumGold Probe 20 µl 4N35-20 5-21
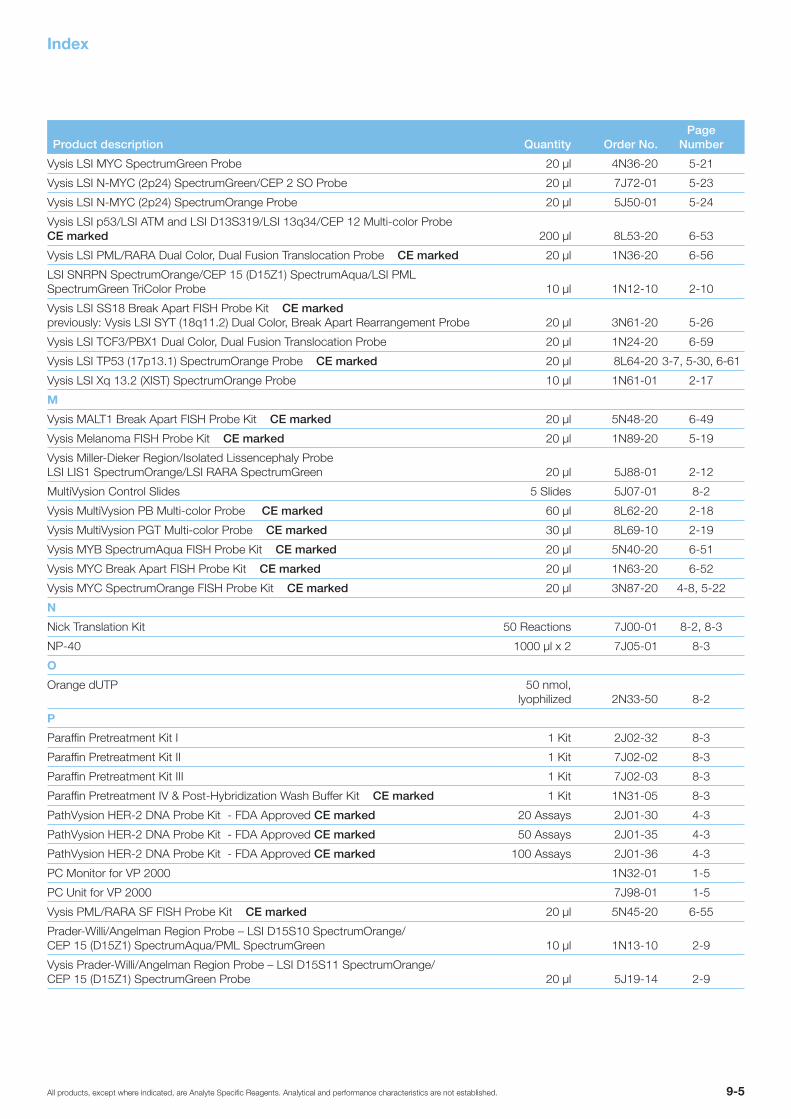
9-5All products, except where indicated, are Analyte Specific Reagents. Analytical and performance characteristics are not established.
Index
Product description Quantity Order No.Page
Number
Vysis LSI MYC SpectrumGreen Probe 20 µl 4N36-20 5-21
Vysis LSI N-MYC (2p24) SpectrumGreen/CEP 2 SO Probe 20 µl 7J72-01 5-23
Vysis LSI N-MYC (2p24) SpectrumOrange Probe 20 µl 5J50-01 5-24
Vysis LSI p53/LSI ATM and LSI D13S319/LSI 13q34/CEP 12 Multi-color Probe CE marked 200 µl 8L53-20 6-53
Vysis LSI PML/RARA Dual Color, Dual Fusion Translocation Probe CE marked 20 µl 1N36-20 6-56
LSI SNRPN SpectrumOrange/CEP 15 (D15Z1) SpectrumAqua/LSI PML SpectrumGreen TriColor Probe 10 µl 1N12-10 2-10
Vysis LSI SS18 Break Apart FISH Probe Kit CE markedpreviously: Vysis LSI SYT (18q11.2) Dual Color, Break Apart Rearrangement Probe 20 µl 3N61-20 5-26
Vysis LSI TCF3/PBX1 Dual Color, Dual Fusion Translocation Probe 20 µl 1N24-20 6-59
Vysis LSI TP53 (17p13.1) SpectrumOrange Probe CE marked 20 µl 8L64-20 3-7, 5-30, 6-61
Vysis LSI Xq 13.2 (XIST) SpectrumOrange Probe 10 µl 1N61-01 2-17
M
Vysis MALT1 Break Apart FISH Probe Kit CE marked 20 µl 5N48-20 6-49
Vysis Melanoma FISH Probe Kit CE marked 20 µl 1N89-20 5-19
Vysis Miller-Dieker Region/Isolated Lissencephaly Probe LSI LIS1 SpectrumOrange/LSI RARA SpectrumGreen 20 µl 5J88-01 2-12
MultiVysion Control Slides 5 Slides 5J07-01 8-2
Vysis MultiVysion PB Multi-color Probe CE marked 60 µl 8L62-20 2-18
Vysis MultiVysion PGT Multi-color Probe CE marked 30 µl 8L69-10 2-19
Vysis MYB SpectrumAqua FISH Probe Kit CE marked 20 µl 5N40-20 6-51
Vysis MYC Break Apart FISH Probe Kit CE marked 20 µl 1N63-20 6-52
Vysis MYC SpectrumOrange FISH Probe Kit CE marked 20 µl 3N87-20 4-8, 5-22
N
Nick Translation Kit 50 Reactions 7J00-01 8-2, 8-3
NP-40 1000 µl x 2 7J05-01 8-3
O
Orange dUTP 50 nmol, lyophilized 2N33-50 8-2
P
Paraffin Pretreatment Kit I 1 Kit 2J02-32 8-3
Paraffin Pretreatment Kit II 1 Kit 7J02-02 8-3
Paraffin Pretreatment Kit III 1 Kit 7J02-03 8-3
Paraffin Pretreatment IV & Post-Hybridization Wash Buffer Kit CE marked 1 Kit 1N31-05 8-3
PathVysion HER-2 DNA Probe Kit - FDA Approved CE marked 20 Assays 2J01-30 4-3
PathVysion HER-2 DNA Probe Kit - FDA Approved CE marked 50 Assays 2J01-35 4-3
PathVysion HER-2 DNA Probe Kit - FDA Approved CE marked 100 Assays 2J01-36 4-3
PC Monitor for VP 2000 1N32-01 1-5
PC Unit for VP 2000 7J98-01 1-5
Vysis PML/RARA SF FISH Probe Kit CE marked 20 µl 5N45-20 6-55
Prader-Willi/Angelman Region Probe – LSI D15S10 SpectrumOrange/ CEP 15 (D15Z1) SpectrumAqua/PML SpectrumGreen 10 µl 1N13-10 2-9
Vysis Prader-Willi/Angelman Region Probe – LSI D15S11 SpectrumOrange/ CEP 15 (D15Z1) SpectrumGreen Probe 20 µl 5J19-14 2-9
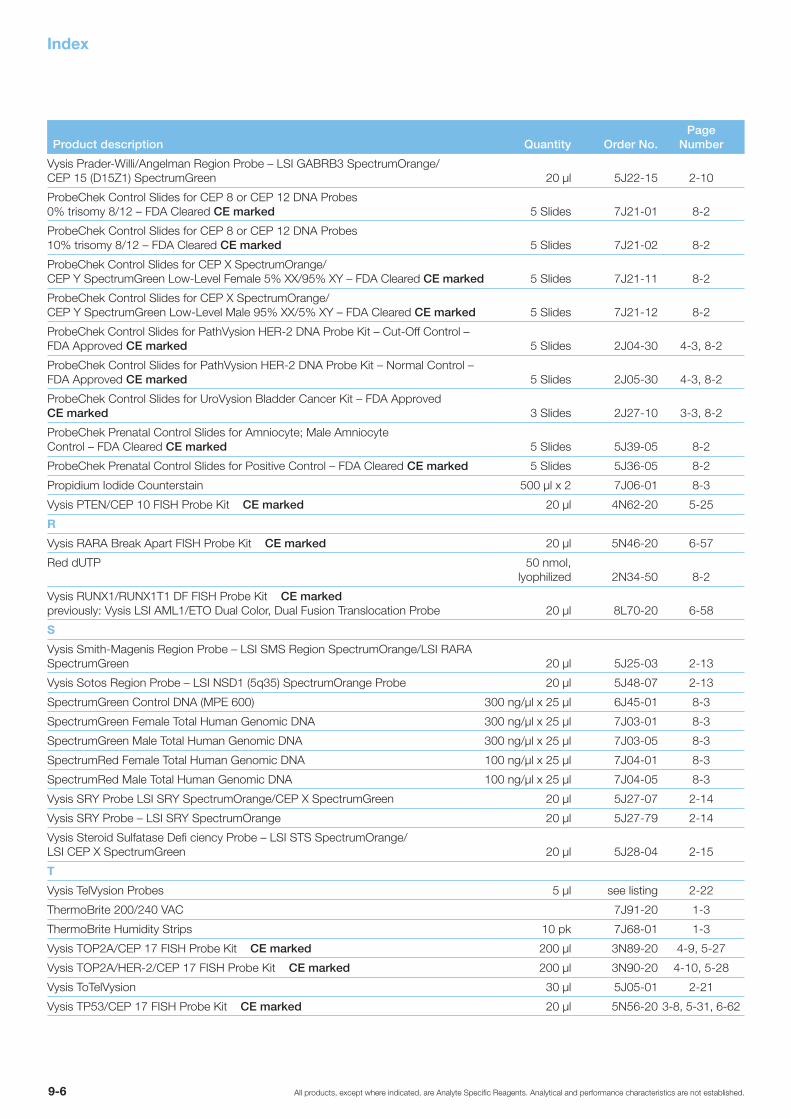
All products, except where indicated, are Analyte Specific Reagents. Analytical and performance characteristics are not established.9-6
Index
Product description Quantity Order No.Page
Number
Vysis Prader-Willi/Angelman Region Probe – LSI GABRB3 SpectrumOrange/ CEP 15 (D15Z1) SpectrumGreen 20 µl 5J22-15 2-10
ProbeChek Control Slides for CEP 8 or CEP 12 DNA Probes 0% trisomy 8/12 – FDA Cleared CE marked 5 Slides 7J21-01 8-2
ProbeChek Control Slides for CEP 8 or CEP 12 DNA Probes 10% trisomy 8/12 – FDA Cleared CE marked 5 Slides 7J21-02 8-2
ProbeChek Control Slides for CEP X SpectrumOrange/ CEP Y SpectrumGreen Low-Level Female 5% XX/95% XY – FDA Cleared CE marked 5 Slides 7J21-11 8-2
ProbeChek Control Slides for CEP X SpectrumOrange/ CEP Y SpectrumGreen Low-Level Male 95% XX/5% XY – FDA Cleared CE marked 5 Slides 7J21-12 8-2
ProbeChek Control Slides for PathVysion HER-2 DNA Probe Kit – Cut-Off Control – FDA Approved CE marked 5 Slides 2J04-30 4-3, 8-2
ProbeChek Control Slides for PathVysion HER-2 DNA Probe Kit – Normal Control – FDA Approved CE marked 5 Slides 2J05-30 4-3, 8-2
ProbeChek Control Slides for UroVysion Bladder Cancer Kit – FDA Approved CE marked 3 Slides 2J27-10 3-3, 8-2
ProbeChek Prenatal Control Slides for Amniocyte; Male Amniocyte Control – FDA Cleared CE marked 5 Slides 5J39-05 8-2
ProbeChek Prenatal Control Slides for Positive Control – FDA Cleared CE marked 5 Slides 5J36-05 8-2
Propidium Iodide Counterstain 500 µl x 2 7J06-01 8-3
Vysis PTEN/CEP 10 FISH Probe Kit CE marked 20 µl 4N62-20 5-25
R
Vysis RARA Break Apart FISH Probe Kit CE marked 20 µl 5N46-20 6-57
Red dUTP 50 nmol, lyophilized 2N34-50 8-2
Vysis RUNX1/RUNX1T1 DF FISH Probe Kit CE markedpreviously: Vysis LSI AML1/ETO Dual Color, Dual Fusion Translocation Probe 20 µl 8L70-20 6-58
S
Vysis Smith-Magenis Region Probe – LSI SMS Region SpectrumOrange/LSI RARA SpectrumGreen 20 µl 5J25-03 2-13
Vysis Sotos Region Probe – LSI NSD1 (5q35) SpectrumOrange Probe 20 µl 5J48-07 2-13
SpectrumGreen Control DNA (MPE 600) 300 ng/µl x 25 µl 6J45-01 8-3
SpectrumGreen Female Total Human Genomic DNA 300 ng/µl x 25 µl 7J03-01 8-3
SpectrumGreen Male Total Human Genomic DNA 300 ng/µl x 25 µl 7J03-05 8-3
SpectrumRed Female Total Human Genomic DNA 100 ng/µl x 25 µl 7J04-01 8-3
SpectrumRed Male Total Human Genomic DNA 100 ng/µl x 25 µl 7J04-05 8-3
Vysis SRY Probe LSI SRY SpectrumOrange/CEP X SpectrumGreen 20 µl 5J27-07 2-14
Vysis SRY Probe – LSI SRY SpectrumOrange 20 µl 5J27-79 2-14
Vysis Steroid Sulfatase Defi ciency Probe – LSI STS SpectrumOrange/ LSI CEP X SpectrumGreen 20 µl 5J28-04 2-15
T
Vysis TelVysion Probes 5 µl see listing 2-22
ThermoBrite 200/240 VAC 7J91-20 1-3
ThermoBrite Humidity Strips 10 pk 7J68-01 1-3
Vysis TOP2A/CEP 17 FISH Probe Kit CE marked 200 µl 3N89-20 4-9, 5-27
Vysis TOP2A/HER-2/CEP 17 FISH Probe Kit CE marked 200 µl 3N90-20 4-10, 5-28
Vysis ToTelVysion 30 µl 5J05-01 2-21
Vysis TP53/CEP 17 FISH Probe Kit CE marked 20 µl 5N56-20 3-8, 5-31, 6-62
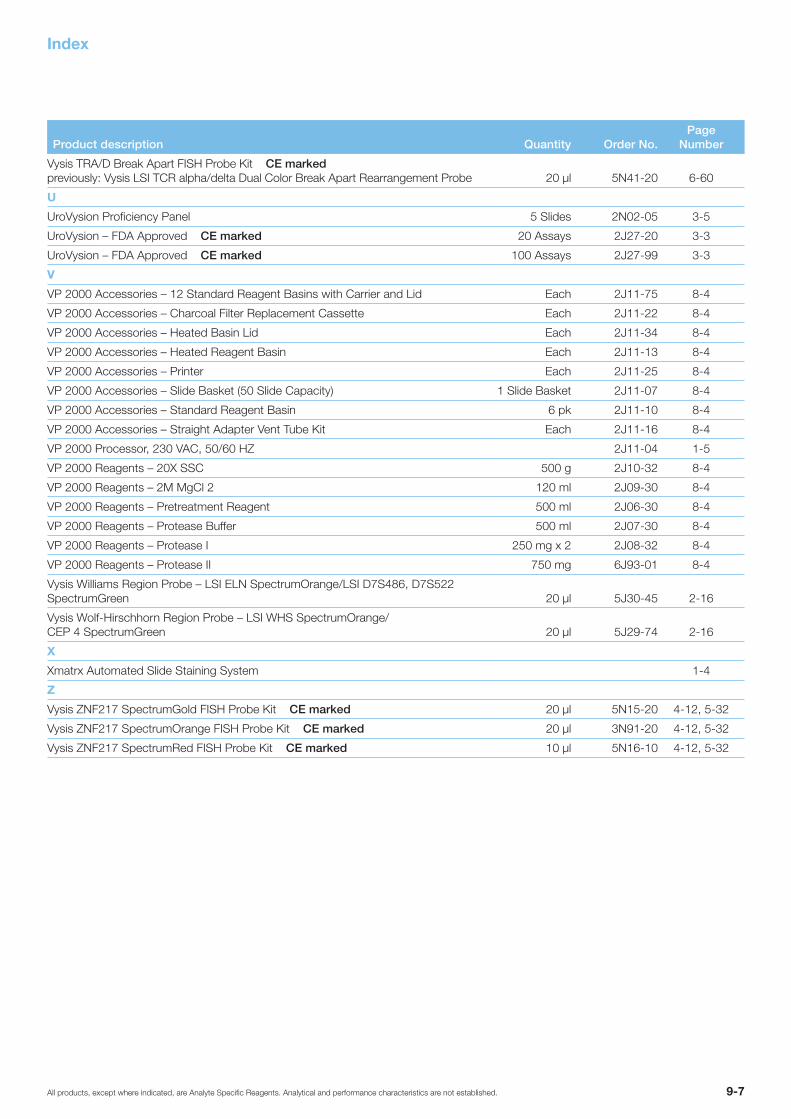
9-7All products, except where indicated, are Analyte Specific Reagents. Analytical and performance characteristics are not established.
Index
Product description Quantity Order No.Page
Number
Vysis TRA/D Break Apart FISH Probe Kit CE marked previously: Vysis LSI TCR alpha/delta Dual Color Break Apart Rearrangement Probe 20 µl 5N41-20 6-60
U
UroVysion Proficiency Panel 5 Slides 2N02-05 3-5
UroVysion – FDA Approved CE marked 20 Assays 2J27-20 3-3
UroVysion – FDA Approved CE marked 100 Assays 2J27-99 3-3
V
VP 2000 Accessories – 12 Standard Reagent Basins with Carrier and Lid Each 2J11-75 8-4
VP 2000 Accessories – Charcoal Filter Replacement Cassette Each 2J11-22 8-4
VP 2000 Accessories – Heated Basin Lid Each 2J11-34 8-4
VP 2000 Accessories – Heated Reagent Basin Each 2J11-13 8-4
VP 2000 Accessories – Printer Each 2J11-25 8-4
VP 2000 Accessories – Slide Basket (50 Slide Capacity) 1 Slide Basket 2J11-07 8-4
VP 2000 Accessories – Standard Reagent Basin 6 pk 2J11-10 8-4
VP 2000 Accessories – Straight Adapter Vent Tube Kit Each 2J11-16 8-4
VP 2000 Processor, 230 VAC, 50/60 HZ 2J11-04 1-5
VP 2000 Reagents – 20X SSC 500 g 2J10-32 8-4
VP 2000 Reagents – 2M MgCl 2 120 ml 2J09-30 8-4
VP 2000 Reagents – Pretreatment Reagent 500 ml 2J06-30 8-4
VP 2000 Reagents – Protease Buffer 500 ml 2J07-30 8-4
VP 2000 Reagents – Protease I 250 mg x 2 2J08-32 8-4
VP 2000 Reagents – Protease II 750 mg 6J93-01 8-4
Vysis Williams Region Probe – LSI ELN SpectrumOrange/LSI D7S486, D7S522 SpectrumGreen 20 µl 5J30-45 2-16
Vysis Wolf-Hirschhorn Region Probe – LSI WHS SpectrumOrange/ CEP 4 SpectrumGreen 20 µl 5J29-74 2-16
X
Xmatrx Automated Slide Staining System 1-4
Z
Vysis ZNF217 SpectrumGold FISH Probe Kit CE marked 20 µl 5N15-20 4-12, 5-32
Vysis ZNF217 SpectrumOrange FISH Probe Kit CE marked 20 µl 3N91-20 4-12, 5-32
Vysis ZNF217 SpectrumRed FISH Probe Kit CE marked 10 µl 5N16-10 4-12, 5-32


10-1All products, except where indicated, are Analyte Specific Reagents. Analytical and performance characteristics are not established.
Ordering Information
Ordering Information
What to Specify When Placing an Order • Your account number (required)• Your name and phone number• Complete billing address• Complete shipping address• Purchase order number• Product Order number and description of product• Quantity needed• Preferred delivery date
Methods of Payment When placing an order, Abbott Molecular requires that all customers provide a purchase order number.
For more information please contact your local sales representative.
Terms and Conditions of Sale Terms of sales are shown on the invoice. Prices are subject to change without notice. Minimum order charges may apply. Please check with your local sales representative.
The Abbott Molecular Customer Satisfaction Policy If you are not completely satisfied with the performance of any DNA probe or reagent, Abbott Molecular will, at your option, either credit your account or send a replacement product to you at our expense. The only requirements are that the product has not expired, that it has been stored and processed according to Abbott Molecular product literature and that the user followed all appropriate Abbott Molecular protocols when using the product. We strongly advise that users retain and refer to all protocols and all literature contained in product shipments.
Returned Goods Policy No returns will be approved without the authorization of the Abbott Molecular Technical Services Department. Unauthorized returns will not be accepted and will be returned at the sender’s expense. Complete documentation must accompany all authorized returned goods. If errors in ordering goods are made by Abbott Molecular, Abbott Molecular will exchange goods at Abbott Molecular’s expense. If errors in ordering goods are made by the customer, a 25 percent returned goods fee will be applied to the exchange.
All products, except where indicated, are Analyte Specific Reagents. Analytical and performance characteristics are not established.10-2
Ordering Information
Product UseAll products manufactured and/or distributed by Vysis or Abbott Molecular should be used in accordance with the products’ labeled intended use. Products labeled “Research Use Only” should be used for research applications, not for use in diagnostic procedures.
TrademarksCEP, LSI, AneuVysion, AutoFISH, MultiVysion, PathVysion and Vysis are registered trademarks of Vysis, Inc., AutoVysion, ProbeChek, SpectrumAqua, SpectrumBlue, SpectrumGreen, SpectrumGold, SpectrumOrange, SpectrumRed, TelVysion, ToTelVysion, UroVysion and VP 2000 are trademarks of the Abbott Group of Companies in various jurisdictions. All other trademarks are the property of their respective owners.

10-3All products, except where indicated, are Analyte Specific Reagents. Analytical and performance characteristics are not established.
Ordering Information
How to Contact Abbott Molecular in Europe, the Middle East, Africa and India
Austria Abbott Ges.mbH Tel: +43-1-89122 254 Fax: +43-1-89124 42
BahrainWael Pharmacy Tel: +973-175-377-07 Fax: +973-175-335-56
Belgium/Luxembourg Abbott S.A./ N.V. Tel: +32-10-475311 Fax: +32-10-475334
Croatia Planinska bb Tel: +385-1-2350560 Fax: +385-1-2441331
Cyprus C&V Kriticos Suppliers LTD Tel: +357-22-338234 Fax: +357-22-338232
Czech Republic Abbott Laboratories s.r.o. Tel: +420-267-292 204 Fax: +420-800 100 960
Denmark Abbott Laboratories A/S Tel: +45-39770000 Fax: +45-39770199
Egypt Al Kamal Tel: +202-639-9845 Fax: +202-2637-9514
Estonia ISIS Medical OÜ Tel: +372 677 5759 Fax: +372 657 9029
Finland Abbott Oy/Molecular Tel: +358-9-75184121 Fax: +358-9-75184150
France Abbott France S.A.S. Tel: +33-1-45602541 Fax: +33-1-45602618
Germany Abbott GmbH & Co. KGTel: +49-6122-58-0 Fax: +49-6122-581244
Greece BioAnalytica S.A. Tel: +30 2106400318 Fax: +30 210-6462748
Hungary Abbott Kft. Tel: +36-1-4652100 Fax: +36-1-4652105
Hungary Csertex KFT. Tel: +36-1-250-4763 +36-1-388-1076Fax: +36-1-250-1257
Ireland Abbott Laboratories Ltd. Tel: +353-1-4691560 Fax: +353-1-4691565
India DSS Imagetech Pvt. Ltd. Tel: +91-11-30886717 Fax: +91-11-26959382
Iraq Medical Supplies & Services (MSS) Tel: +962-6-55 62 910 (ext.18) Fax: +962-6-55 62 915
Italy Abbott S.r.l. Tel: +39-06-529911 Fax: +39-06-52991436
Israel Ilex Medical Ltd Tel: +972(0)3 938 5501 Fax: +972(0) 3 938 5500
Jordan Advanced Scientific Consulting Group Co. Tel: +962 6 5812210 Fax: +962 6 5812214
Kuwait Technical Services Supplies Tel: +965-2411541 Fax: +965-2411476
Latvia DS Tehnologijas Tel: +371 67 554 548 Fax: +371 67 553 25
Lebanon Numelab Tel: +961-1-39-66-77 Fax: +961-1-39-66-88
Libya Raya Medical & Scientific Laboratories Tel: +218-21-477-1665 Fax: +218-21-478-0596
Lithuania UAB Diagnostin˙es sistemos Tel: +370 5 274 04 94 Fax: +370 5 277 76 20
Netherlands Abbott B.V. Tel: +31 88 82 22 540 Fax: +31 88 82 22 640
Norway Abbott Norge AS Tel: +47-81559920 Fax: +47-67113110
Oman Waleed Pharmacy Tel: +968 24494766 Fax: +968 24494765
Poland Abbott Laboratories Poland Sp. z.o.o. Tel: +48-22-6061050 Fax: +48-22-6061080
Portugal Izasa Distribuiciones Técnicas S.A Tel: +34-902-203090 Fax: +34-902-203071
Romania Abbott Laboratories – Representative Office Romania Tel: +40-21-52930 10 Fax: +40-21-52930 11
Russian Federation Abbott Laboratories S.A. Tel: +7-495 258 4270 Fax: +7-495 258 4271
Saudi Arabia Mediserv Tel: +966-1-4612226 Fax: +966-1-4613339
Slovak Republic Abbott Laboratories s.r.o. Tel: +420-267 292 111 Fax: +420-800 100 960
South Africa The Scientific Group Tel: +27-11-635 0000 www. scientificgroup.com
Spain Izasa Distribuiciones Técnicas S.A.Tel: +34-902-203090 Fax: +34-902-203071
Sweden Abbott Scandinavia AB Tel: +46-08-54656700 Fax: +46-08-54656800
Switzerland Abbott AG Diagnostics Tel: +41-41-7684444 Fax: +41-41-7684450
Syria Laboratory Service Center Tel: +963-11-4455-147 Fax: +963-11-4466-432
Turkey Abbott Laboratuarlari Tel: +90-216-5387400 Fax: +90-216-4250978
Ukraine LLC “ALT Ukraine Ltd” Tel: +38 044 4927270 Fax: +38 044 4927271
United Arab Emirates Arab Emirates Gulf & World, Traders LLS Tel: +971-4-282-1717 Fax: +971-4-282-2899
United Kingdom Abbott Molecular Tel: +44-1628 636136 Fax: +44-1628 644 15
West Bank Medical Supplies & Services Tel: +97022959373/4 Fax: +97022959375
Yemen Griffin-Ltd.com Tel: +967-1440-625 Fax: +967-1441-905

All products, except where indicated, are Analyte Specific Reagents. Analytical and performance characteristics are not established.10-4
Abbott Molecular on the Internetwww.abbottmolecular.com
Abbott Molecular educational Web sites for specific in vitro diagnostic productswww.pathvysion.com PathVysion HER-2 DNA Probe Kit (FDA approved/cleared products)www.urovysion.com UroVysion Bladder Cancer Kit (FDA approved/cleared products)www.aneuvysion.com AneuVysion Assay Kit FDA approved/cleared products)

The information provided is accurate as of January 2011 based on the current information available. Our business is dynamic and we are continuously updating our catalog and websites adding new products, content, and information to service our customers better. As such, the information may have slight variations and may include typographical errors or inaccuracies due to these changes to our business. Please contact your customer service or sales person for the latest information.

AS2506/uk Abbott Molecular Catalog 03/11
Abbott GmbH & Co. KGAbbott Molecular EuropeMax-Planck-Ring 265205 WiesbadenTel. (+49) 61 22 58 0Fax (+49) 61 22 58 12 44www.abbottmolecular.com
All information in this document is given without engagement