. . . . . . . . . . . . . . . . . . . . . . . . . . . . . . . Embryonic fatty acid metabolism in diabetic pregnancy: the difference between embryoblasts and trophoblasts Maria Schindler 1, *, Dirk Dannenberger 2 , Gerd Nuernberg 2,3 , Mareike Pendzialek 1 , Katarzyna Grybel 1 , Tom Seeling 1 , and Anne Navarrete Santos 1 1 Institute of Anatomy and Cell Biology, Martin Luther University, Faculty of Medicine, Halle (Saale), Germany; 2 Lipid Metabolism and Muscular Adaptation Workgroup, Institute of Muscle Biology and Growth and Institute of Genetics and Biometry, Leibniz Institute for Farm Animal Biology (FBN), Dummerstorf, Germany; 3 Institute of Genetics and Biometry, Leibniz Institute for Farm Animal Biology (FBN), Dummerstorf, Germany *Correspondence address. Institute of Anatomy and Cell Biology, Martin Luther University Faculty of Medicine, Grosse Steinstrasse 52, D-06097 Halle (Saale), Germany. Tel: þ49-345-557-1725-01; Fax: þ49-345-5571700; E-mail: [email protected] 000-0002-2151-767x Submitted on November 21, 2019; resubmitted on August 21, 2020; editorial decision on September 03, 2020 ABSTRACT: During the first days of development the preimplantation embryo is supplied with nutrients from the surrounding milieu. Maternal diabetes mellitus affects the uterine microenvironment, leading to a metabolic adaptation processes in the embryo. We analysed embryonic fatty acid (FA) profiles and expression of processing genes in rabbit blastocysts, separately in embryoblasts (EBs) and tropho- blasts (TBs), to determine the potential consequences of maternal diabetes mellitus on intracellular FA metabolism. Insulin-dependent dia- betes was induced by alloxan in female rabbits. On Day 6 post coitum, FA profiles in blastocysts (EB, TB and blastocoel fluid) and maternal blood were analysed by gas chromatography. The expression levels of molecules involved in FA elongation (fatty acid elongases, ELOVLs) and desaturation (fatty acid desaturases, FADSs) were measured in EB and TB. Maternal diabetes mellitus influenced the FA profile in maternal plasma and blastocysts. Independent from metabolic changes, rabbit blastocysts contained a higher level of saturated fatty acids (SFAs) and a lower level of polyunsaturated fatty acids (PUFAs) compared to the FA profile of the maternal plasma. Furthermore, the FA profile was altered in the EB and TB, differently. While SFAs (palmitic and stearic acid) were elevated in EB of diabetic rabbits, PUFAs, such as docosahexaenoic acid, were decreased. In contrast, in the TB, lower levels of SFAs and higher levels of oleic acid were observed. EB and TB specific alterations in gene expression were found for ELOVLs and FADSs, key enzymes for FA elongation and desaturation. In conclusion, maternal diabetes mellitus alters embryonic FA metabolism differently in EB and TB, indicating a lineage-specific metabolic adaptive response. Key words: embryoblast / trophoblast / fatty acid metabolism / FADS1 / ELOVL Introduction Preimplantation embryo development is a complex, well-orchestrated process, combining dynamic and structural changes during the first days of development. The embryo undergoes important metabolic and structural adaptation processes to ensure the establishment of pregnancy. The nutritional environment in utero can have a tremen- dous effect on embryonic metabolism and it can perturb subsequent development (Leese, 2012). Besides the traditional nutrients, such as glucose, pyruvate and amino acids, also lipids, such as fatty acids (FAs), play a pivotal role in embryonic metabolism (Dunning et al., 2014; Ribeiro et al., 2016). FAs are chemically classified as saturated fatty acids (SFAs), monoun- saturated fatty acids (MUFAs) and polyunsaturated fatty acids (PUFAs), whereby PUFAs can be further divided in omega-6 (n-6) and omega-3 (n-3) PUFAs. In animal and human oocytes and embryos, the most common FAs are palmitic acid (PA), stearic acid (SA), oleic acid (OA) and linoleic acid (LA) (Leroy et al. , 2005; Haggarty et al., 2006; Dunning et al. , 2014). SFAs are preferentially accumulated by the follicle-enclosed oocyte and the early embryo up to the eight-cell stage, V C The Author(s) 2020. Published by Oxford University Press on behalf of European Society of Human Reproduction and Embryology. This is an Open Access article distributed under the terms of the Creative Commons Attribution Non-Commercial License (http://creativecommons.org/licenses/by-nc/4.0/), which permits non-commercial re-use, distribution, and reproduction in any medium, provided the original work is properly cited. For commercial re-use, please contact [email protected] Molecular Human Reproduction, Vol.26, No.11, pp. 837–849, 2020 Advance Access Publication on September 26, 2020 doi:10.1093/molehr/gaaa063 ORIGINAL RESEARCH Downloaded from https://academic.oup.com/molehr/article/26/11/837/5912022 by guest on 30 July 2022

Welcome message from author
This document is posted to help you gain knowledge. Please leave a comment to let me know what you think about it! Share it to your friends and learn new things together.
Transcript

..
..
..
..
..
..
..
..
..
..
..
..
..
..
..
.
Embryonic fatty acid metabolism indiabetic pregnancy: the differencebetween embryoblasts andtrophoblastsMaria Schindler 1,*, Dirk Dannenberger2, Gerd Nuernberg2,3,Mareike Pendzialek1, Katarzyna Grybel1, Tom Seeling1, andAnne Navarrete Santos1
1Institute of Anatomy and Cell Biology, Martin Luther University, Faculty of Medicine, Halle (Saale), Germany; 2Lipid Metabolism andMuscular Adaptation Workgroup, Institute of Muscle Biology and Growth and Institute of Genetics and Biometry, Leibniz Institute forFarm Animal Biology (FBN), Dummerstorf, Germany; 3Institute of Genetics and Biometry, Leibniz Institute for Farm Animal Biology(FBN), Dummerstorf, Germany
*Correspondence address. Institute of Anatomy and Cell Biology, Martin Luther University Faculty of Medicine, Grosse Steinstrasse 52,D-06097 Halle (Saale), Germany. Tel: þ49-345-557-1725-01; Fax: þ49-345-5571700; E-mail: [email protected]
000-0002-2151-767x
Submitted on November 21, 2019; resubmitted on August 21, 2020; editorial decision on September 03, 2020
ABSTRACT: During the first days of development the preimplantation embryo is supplied with nutrients from the surrounding milieu.Maternal diabetes mellitus affects the uterine microenvironment, leading to a metabolic adaptation processes in the embryo. We analysedembryonic fatty acid (FA) profiles and expression of processing genes in rabbit blastocysts, separately in embryoblasts (EBs) and tropho-blasts (TBs), to determine the potential consequences of maternal diabetes mellitus on intracellular FA metabolism. Insulin-dependent dia-betes was induced by alloxan in female rabbits. On Day 6 post coitum, FA profiles in blastocysts (EB, TB and blastocoel fluid) and maternalblood were analysed by gas chromatography. The expression levels of molecules involved in FA elongation (fatty acid elongases, ELOVLs)and desaturation (fatty acid desaturases, FADSs) were measured in EB and TB. Maternal diabetes mellitus influenced the FA profile inmaternal plasma and blastocysts. Independent from metabolic changes, rabbit blastocysts contained a higher level of saturated fatty acids(SFAs) and a lower level of polyunsaturated fatty acids (PUFAs) compared to the FA profile of the maternal plasma. Furthermore, the FAprofile was altered in the EB and TB, differently. While SFAs (palmitic and stearic acid) were elevated in EB of diabetic rabbits, PUFAs,such as docosahexaenoic acid, were decreased. In contrast, in the TB, lower levels of SFAs and higher levels of oleic acid were observed.EB and TB specific alterations in gene expression were found for ELOVLs and FADSs, key enzymes for FA elongation and desaturation.In conclusion, maternal diabetes mellitus alters embryonic FA metabolism differently in EB and TB, indicating a lineage-specific metabolicadaptive response.
Key words: embryoblast / trophoblast / fatty acid metabolism / FADS1 / ELOVL
IntroductionPreimplantation embryo development is a complex, well-orchestratedprocess, combining dynamic and structural changes during the firstdays of development. The embryo undergoes important metabolicand structural adaptation processes to ensure the establishment ofpregnancy. The nutritional environment in utero can have a tremen-dous effect on embryonic metabolism and it can perturb subsequentdevelopment (Leese, 2012). Besides the traditional nutrients, such asglucose, pyruvate and amino acids, also lipids, such as fatty acids (FAs),
play a pivotal role in embryonic metabolism (Dunning et al., 2014;Ribeiro et al., 2016).
FAs are chemically classified as saturated fatty acids (SFAs), monoun-saturated fatty acids (MUFAs) and polyunsaturated fatty acids (PUFAs),whereby PUFAs can be further divided in omega-6 (n-6) and omega-3(n-3) PUFAs. In animal and human oocytes and embryos, the mostcommon FAs are palmitic acid (PA), stearic acid (SA), oleic acid (OA)and linoleic acid (LA) (Leroy et al., 2005; Haggarty et al., 2006;Dunning et al., 2014). SFAs are preferentially accumulated by thefollicle-enclosed oocyte and the early embryo up to the eight-cell stage,
VC The Author(s) 2020. Published by Oxford University Press on behalf of European Society of Human Reproduction and Embryology.This is an Open Access article distributed under the terms of the Creative Commons Attribution Non-Commercial License (http://creativecommons.org/licenses/by-nc/4.0/), whichpermits non-commercial re-use, distribution, and reproduction in any medium, provided the original work is properly cited. For commercial re-use, please [email protected]
Molecular Human Reproduction, Vol.26, No.11, pp. 837–849, 2020Advance Access Publication on September 26, 2020 doi:10.1093/molehr/gaaa063
ORIGINAL RESEARCH
Dow
nloaded from https://academ
ic.oup.com/m
olehr/article/26/11/837/5912022 by guest on 30 July 2022

..
..
..
..
..
..
..
..
..
..
..
..
..
..
..
..
..
..
..
..
..
..
..
..
..
..
..
..
..
..
..
..
..
..
..
..
..
..
..
..
..
..
..
..
..
..
..
..
..
..
..
..
..
..
..
..
..
..
..
..
..
..
..
..
..
..
..
..
..
..
..
..
..
..
..
..
..
..
..
..
..
..
..
..
..
..
.suggesting a selective uptake mechanism or de novo synthesis, which fa-vour this class of FAs (Adamiak et al., 2006; Haggarty et al., 2006).PUFAs, such as LA, are predominantly accumulated from the eight-cellstage to the blastocyst stage and onward (Haggarty et al., 2006).
FAs play an important role in fertilization, oocyte maturation andembryo development (Revelli et al., 2009; Dunning et al., 2014;Zarezadeh et al., 2019). While SFAs, PA and SA, have negative effectson fertilization and preimplantation embryo development, the MUFAsOA exerts positive effects (Aardema et al., 2011; McKeegan andSturmey, 2011; Yang et al., 2017). Controversy exists regarding therole of LA in preimplantation embryo development, with positiveeffects in humans (Shaaker et al., 2012) and negative effects in ovineand bovine models (Renaville et al., 2010; Amini et al., 2016; Rouraet al., 2018). The PUFA a-linolenic acids (ALAs) exerts damagingeffects on the reproductive system and it decreases the chance ofpregnancy after IVF in humans (Jungheim et al., 2011).
In mammals, FAs have to be provided through the diet or they canbe synthesized, up to 16 carbons, via de novo lipogenesis. Furthermore,FA desaturation and elongation are two key metabolic routes for thesynthesis of long and very long-chain SFAs, MUFAs and PUFAs(reviewed by Zhang et al., 2016). They can be regulated by a widerange of external factors, such as nutrients and hormones. Theseenzymes have to be well-regulated because they play an important rolein cellular lipid composition (Ntambi and Miyazaki, 2004; Jakobssonet al., 2006). D5-Desaturase (encoded by FADS1) and D6-desaturase(encoded by FADS2) introduce double bonds into PUFAs. FADS2-nullmice are sterile (Lattka et al., 2010) and FADS1-ablated mice fail tothrive beyond the 12 weeks of age (Fan et al., 2012). FA elongases canbe divided in two major groups: (i) enzymes that are involved in theelongation of SFAs and MUFAs (ELOVL1, ELOVL3 and ELOVL6) and(ii) enzymes which elongate PUFAs (ELOVL2, ELOVL4 and ELOVL5)(Jakobsson et al., 2006). While ELOVL2 and ELOVL5 are predomi-nantly expressed in reproductive organs (Jakobsson et al., 2006;Guillou et al., 2010; Ohno et al., 2010; Zhang et al., 2016), ELOVL1and ELVOL6 are ubiquitously expressed (Moon et al., 2001; Ohnoet al., 2010).
Both desaturation and elongation enzymes are affected in metabolicdisorders, such as obesity and diabetes mellitus (Wang et al., 2006). Inepidemiological studies, strong associations between D5- and D6-desa-turase activity and a risk of diabetes have been found (Kroger andSchulze, 2012). We recently reported that maternal diabetes mellitusled to maternal hyperlipidaemia accompanied by an elevated intracellu-lar lipid accumulation and altered lipid metabolism in rabbit blastocysts(Schindler et al., 2014). In the current study, we examined how mater-nal diabetes mellitus influences FA profiles of 6-day-old blastocysts,separately in embryoblast (EB), trophoblast (TB) and blastocysts fluid(BF), compared to maternal serum levels. Furthermore, the expressionof genes involved in FA desaturation and elongation was quantified inthe rabbit blastocysts to understand how metabolic pathways are reg-ulated. For this purpose, a chemically-induced insulin-dependent dia-betic rabbit model was used. Rabbits have been used as animalmodels for early embryo development (Fischer et al., 2012) and lipidmetabolism for a long time. Rabbit lipid metabolism is more closely re-lated to human metabolism than mice or rat metabolism (Paigen,1995). Data from human and rabbit blastocysts indicate a very similarproportion of SFAs, MUFAs and PUFAs (Khandoker et al., 1998;Haggarty et al., 2006), further supporting the fact that rabbit
preimplantation embryo development is an excellent model for analy-sing embryonic FA metabolism in detail. Overall, this study further sup-ports the findings that maternal diabetes mellitus affects embryoniclipid metabolism, leading to altered adaptation processes during preim-plantation development.
Methods
Alloxan treatmentExperimental insulin-dependent diabetes (DT1) was induced in mature18- to 20-week-old female non-pregnant rabbits (outbred ZIKA-hybrid New Zealand White) by alloxan treatment (Sigma-Aldrich,Germany) as described by Ramin et al. (2010). Rabbits were main-tained under diabetic conditions (blood glucose levels 15–25 mmol/l,daily insulin supplementation) as described by Schindler et al. (2017)for at least 10 days before mating. All animal experiments were per-formed in accordance with the principles of laboratory animal careand the experimental protocol had been approved by the localethics committee (Landesverwaltungsamt Dessau; reference number:42502-2-812).
Embryo recoveryEmbryos were collected from diabetic (DT1) and non-diabetic (NI)rabbits at Day 6 post coitum (p.c.). Mating and embryo recovery wereperformed as described by Schindler et al. (2013). Six-day-old (d6)blastocysts were characterized morphologically and grouped bygastrulation stages. For analysis, gastrulation stages 1 and 2 were used(summarized by Fischer et al., 2012).
For FA analysis, flushed blastocysts were washed three times withice cold phosphate buffered saline (PBS). The blastocyst stage and sizewere determined. Blastocysts were then placed on a dry watch glass.Extracellular coverings were removed mechanically, blastocysts werepunctured and the effluent BF was collected. Blastocysts were thenmechanically dissected with surgical forceps and scissors into TB andEB (working scheme: Supplementary Fig. S1). Individual samples of EB,TB and BF were stored separately at �80�C for further FA analysis, asdescribed below. For RNA analyses, samples of EB and TB werestored in PBS at �80�C until RNA isolation for quantitative polymer-ase chain reaction (RT-qPCR). For western blot analyses, embryoswere handled in 0.05% polyvinyl alcohol (PVA)/PBS containing prote-ase and phosphatase inhibitors. For one protein sample, a minimum ofeight EB or TB from three different rabbits were pooled in one tube.Samples were stored in radio immunoprecipitation assay buffer withprotease and phosphatase inhibitors at �80�C until further processing.
Lipid extraction and FA analysisLipid extraction was performed in single embryos (BF, EB and TB; perexperimental group (NI vs. DT1) samples from 20 embryos have beenused) and maternal plasma by adding up to 8 ml of chloroform/metha-nol (2:1, v/v) dropwise at room temperature. The solution containedC19:0 (22.5mg) as an internal standard. The detailed sample prepara-tion procedure was previously described by Dannenberger et al.(2017). In this procedure, the extraction mixtures were stirred twicefor 15 min, stored at 5�C for 18 h in the dark and subsequently
838 Schindler et al.
Dow
nloaded from https://academ
ic.oup.com/m
olehr/article/26/11/837/5912022 by guest on 30 July 2022
..
..
..
..
..
..
..
..
..
..
..
..
..
..
..
..
..
..
..
..
..
..
..
..
..
..
..
..
..
..
..
..
..
..
..
..
..
..
..
..
..
..
..
..
..
..
..
..
..
..
..
..
..
..
..
..
..
..
..
..
..
..
..
..
..
..
..
..
..
..
..
..
..
..
..
..
..
..
..
..
..
..
..
..
..
..
.washed with 0.02% CaCl2 solution. Finally, the solvent was removedunder a gentle nitrogen stream at room temperature. The lipidextracts were re-dissolved in 150ml of toluene for methyl ester prepa-ration. Next, 1 ml of 0.5 M sodium methoxide in methanol was addedto the samples, which were shaken in a 60�C water bath for 10 min.Subsequently, 0.5 ml of 14% boron trifluoride (BF3) in methanol wasadded to the mixture, which was then shaken for an additional 10 minat 60�C. The FA methyl esters (FAMEs) were extracted three times in2 ml of n-hexane. The FAMEs were resuspended in 100ml of n-hexaneand stored at �18�C until gas chromatography (GC) analysis.
FA analysis of the different cell compartments (EB, TB and BF) wasperformed using capillary GC with a CP-Sil 88 CB column(100 m� 0.25 mm, Chrompack-Varian, Lake Forest, CA, USA) thatwas installed in a PerkinElmer gas chromatograph (CLARUS 680) witha flame ionisation detector and split injection (PerkinElmer Instruments,Shelton, USA). The detailed GC conditions were recently described byDannenberger et al. (2017). The FA profiling was done with the use ofC19:0 as an internal standard. For the calibration procedure, the refer-ence standard mixture ‘Sigma FAME’ (Sigma-Aldrich, Deisenhofen,Germany) and the methyl esters of C18:1cis-11, C22:5n-3, C18:2cis-9,trans-11 (Matreya, PA, USA), C22:4n-6 (Sigma-Aldrich, Deisenhofen,Germany) and C18:4n-3 (Larodan, Limhamn, Sweden) were used. Theresults are expressed as relative amounts (%) of all measured FAs inthe embryonic samples (EB, TB, and BF) and the maternal plasma.
RNA isolation and cDNA synthesisMessenger RNA (mRNA) of single blastocysts, separated in EB andTB, was extracted with DynabeadsVR Oligo (dT)25 (Invitrogen,Germany) and used for cDNA synthesis. All protocol procedureswere carried out according to the manufacturer’s instructions, usingthe modifications previously described (Schindler et al., 2013). The finalvolume of the cDNA reaction was adjusted with water to 80ml.
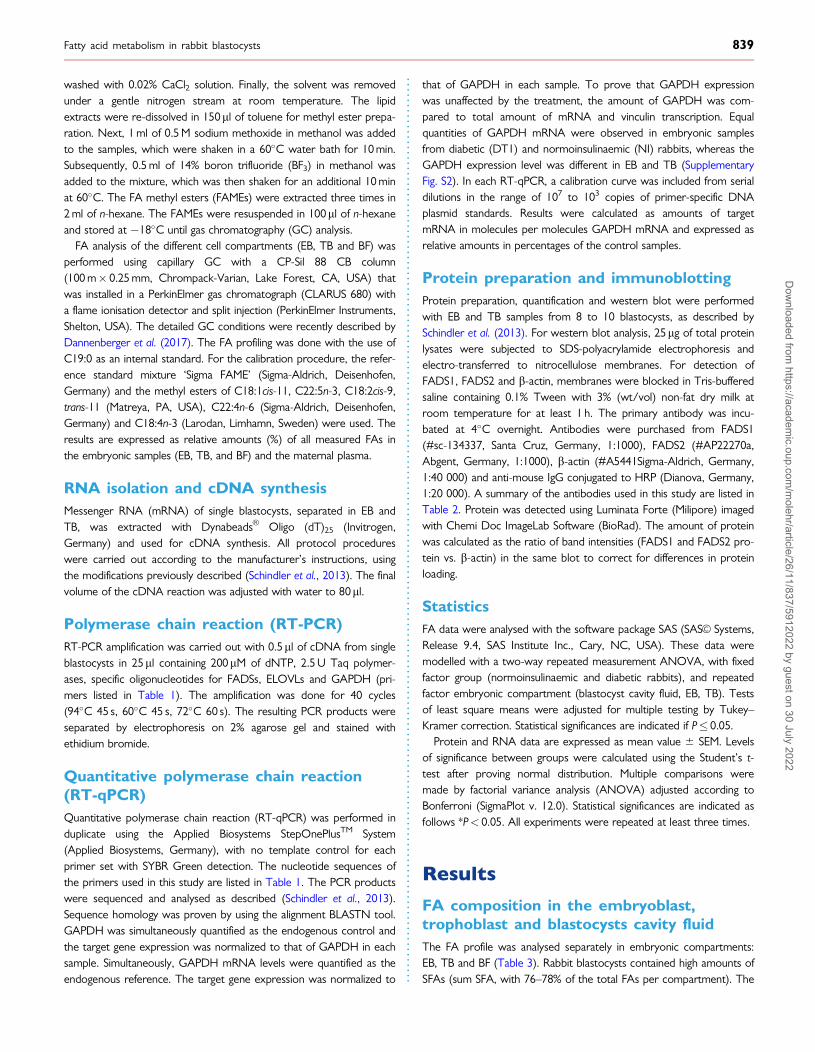
Polymerase chain reaction (RT-PCR)RT-PCR amplification was carried out with 0.5ml of cDNA from singleblastocysts in 25ml containing 200mM of dNTP, 2.5 U Taq polymer-ases, specific oligonucleotides for FADSs, ELOVLs and GAPDH (pri-mers listed in Table 1). The amplification was done for 40 cycles(94�C 45 s, 60�C 45 s, 72�C 60 s). The resulting PCR products wereseparated by electrophoresis on 2% agarose gel and stained withethidium bromide.
Quantitative polymerase chain reaction(RT-qPCR)Quantitative polymerase chain reaction (RT-qPCR) was performed induplicate using the Applied Biosystems StepOnePlusTM System(Applied Biosystems, Germany), with no template control for eachprimer set with SYBR Green detection. The nucleotide sequences ofthe primers used in this study are listed in Table 1. The PCR productswere sequenced and analysed as described (Schindler et al., 2013).Sequence homology was proven by using the alignment BLASTN tool.GAPDH was simultaneously quantified as the endogenous control andthe target gene expression was normalized to that of GAPDH in eachsample. Simultaneously, GAPDH mRNA levels were quantified as theendogenous reference. The target gene expression was normalized to
that of GAPDH in each sample. To prove that GAPDH expressionwas unaffected by the treatment, the amount of GAPDH was com-pared to total amount of mRNA and vinculin transcription. Equalquantities of GAPDH mRNA were observed in embryonic samplesfrom diabetic (DT1) and normoinsulinaemic (NI) rabbits, whereas theGAPDH expression level was different in EB and TB (SupplementaryFig. S2). In each RT-qPCR, a calibration curve was included from serialdilutions in the range of 107 to 103 copies of primer-specific DNAplasmid standards. Results were calculated as amounts of targetmRNA in molecules per molecules GAPDH mRNA and expressed asrelative amounts in percentages of the control samples.
Protein preparation and immunoblottingProtein preparation, quantification and western blot were performedwith EB and TB samples from 8 to 10 blastocysts, as described bySchindler et al. (2013). For western blot analysis, 25mg of total proteinlysates were subjected to SDS-polyacrylamide electrophoresis andelectro-transferred to nitrocellulose membranes. For detection ofFADS1, FADS2 and b-actin, membranes were blocked in Tris-bufferedsaline containing 0.1% Tween with 3% (wt/vol) non-fat dry milk atroom temperature for at least 1 h. The primary antibody was incu-bated at 4�C overnight. Antibodies were purchased from FADS1(#sc-134337, Santa Cruz, Germany, 1:1000), FADS2 (#AP22270a,Abgent, Germany, 1:1000), b-actin (#A5441Sigma-Aldrich, Germany,1:40 000) and anti-mouse IgG conjugated to HRP (Dianova, Germany,1:20 000). A summary of the antibodies used in this study are listed inTable 2. Protein was detected using Luminata Forte (Milipore) imagedwith Chemi Doc ImageLab Software (BioRad). The amount of proteinwas calculated as the ratio of band intensities (FADS1 and FADS2 pro-tein vs. b-actin) in the same blot to correct for differences in proteinloading.
StatisticsFA data were analysed with the software package SAS (SASVC Systems,Release 9.4, SAS Institute Inc., Cary, NC, USA). These data weremodelled with a two-way repeated measurement ANOVA, with fixedfactor group (normoinsulinaemic and diabetic rabbits), and repeatedfactor embryonic compartment (blastocyst cavity fluid, EB, TB). Testsof least square means were adjusted for multiple testing by Tukey–Kramer correction. Statistical significances are indicated if P� 0.05.
Protein and RNA data are expressed as mean value 6 SEM. Levelsof significance between groups were calculated using the Student’s t-test after proving normal distribution. Multiple comparisons weremade by factorial variance analysis (ANOVA) adjusted according toBonferroni (SigmaPlot v. 12.0). Statistical significances are indicated asfollows *P< 0.05. All experiments were repeated at least three times.
Results
FA composition in the embryoblast,trophoblast and blastocysts cavity fluidThe FA profile was analysed separately in embryonic compartments:EB, TB and BF (Table 3). Rabbit blastocysts contained high amounts ofSFAs (sum SFA, with 76–78% of the total FAs per compartment). The
Fatty acid metabolism in rabbit blastocysts 839
Dow
nloaded from https://academ
ic.oup.com/m
olehr/article/26/11/837/5912022 by guest on 30 July 2022
..
..
..
..
..
..
..
..
..
..
..
..
..
..
..
..
..
..
..
..
..
..
..
..
..
..
..
..
..
..most abundant FA was PA (16:0), followed by SA (18:0) and OA(18:1cis-9). Compared to EB and BF, TB cells had the highest PA andSA level with around 40% and 21% of the total FAs, respectively. Therelative OA (18:1cis-9) level was slightly lower in TB, compared to EBand BF. Furthermore, TB cells contained a 4-fold and 10-fold higheramount of LA (18:2n-6) and arachidonic acid (AA) (20:4n-6) com-pared to EB and BF, respectively. The amount of both n-3 FAs, doco-sapentaenic acid (DPA, 22:5n-3) and docosahexaenoic acid (DHA,22:6n-3) was significantly lower (5- to 7-fold) in the TB compared toEB and BF. In summary, the FA profile in the BF was similar to the FAcomposition in EB cells, but it differed from the TB.
FA composition in the preimplantationembryo from diabetic rabbitsThe amounts of FAs in EB, TB, and BF from diabetic rabbits and nor-moinsulinaemic control rabbits are compared in Table 3. The amountsof all SFAs measured in our study (sum SFA in Table 3) were not af-fected in the EB and BF. However, the relative amounts of individualSFAs, PA (16:0) and SA (18:0) were increased in the EB cells and BF
due to maternal diabetes mellitus. Other SFAs were either not af-fected or decreased in BF and EB.
In the TB from diabetic rabbits, a significant lower amount of SFAwas observed. In TB samples from normoinsulinaemic rabbits (NI),76.32% of all FA were SFA, and in diabetic (DT1) TB samples, only60.64% of all FA belonged to the SFA. This decrease was mainly aconsequence of lower levels of PA and SA (PA: NI: 40.17% and DT1:30.00%; SA: NI: 21.36% and DT1: 17.95%). Other medium-chain orlong-chain FAs were also decreased, while very long-chain FAs (21 car-bon atoms and longer) were increased in TB cells from diabetic rabbits.
The amount of MUFAs (sum MUFA, Table 3) was elevated in TBcells (1.6-fold increase) from diabetic rabbits, which was mainly due toa higher amount of OA (18:1cis-9).
In blastocyst from diabetic rabbits, the total amount of PUFAs (sumPUFA, Table 3) was not changed in EB and BF samples due to a diabe-tes mellitus, but in TB cells, it was increased by a 1.7-fold. To bemore precise, n-3 and n-6 FAs were examined individually. Totalamounts of n-6 FAs (sum n-6 FA, Table 3) were increased in all inves-tigated blastocysts compartments, while the sums of n-3 (sum n-3 FA,Table 3) FAs were greatly decreased in EB and TB (by 85% and 80%,
............................................................................................................................................................................................................................
Table 1 Primers used for RT-PCR and RT-qPCR.
Gene name Genbank number T (�C) Fragment (bp) Sequence 50fi30
FADS1 XM_008274405.2 60 101 fw: AGGAAGGACACGAGTTCAGG
rev: CAATCGTCTCCAAGCCACTG
FADS2 NM_001329067.1 60 185 fw: AGCACCACCTCTTTCCTACC
rev: TCATTTGTGGAGGTAGGCGT
ELOVL1 XM_008265411.2 60 151 fw: ACTTTGTCCTCTCACTGGGG
rev: GTATAAGTGCTCAGCCAGCCA
ELOVL2 XM_002714176 60 100 fw: GGATACCGTGCGGACAGAG
rev: TGCATGGACGGAAACACAGA
ELOVL5 XM_002714509 60 110 fw: CTCCCGAAGGAAAGACCACC
rev: GCTTCCGTGGCTTCACATTG
ELOVL6 XM_002717122.3 60 147 fw: GCTCTGGTCTCTGACCCTTG
rev: GCCCAGAATTTGCTGACTGG
GAPDH L23961 60 144 fw: GCCGCTTCTTCTCGTGCAG
rev: ATGGATCATTGATGGCGACAACAT
............................................................................................................................................................................................................................
Table II List of primary and secondary antibodies used in western blotting.
Antigen Name of antibody Manufacturer/company# catalogue
Type Dilution
FADS1 FADS1 antibody (7-RY13) Santa cruz, #sc-134337 MM 1:1000
FADS2 FADS2 antibody Abgent, #AP22270a MM 1:1000
b-actin Anti-b-actin antibody cloneAC-15
Sigma, #A5441 MM 1:40 000
Mouse IgG Goat anti-mouse IgG (HþL)-HRPO
Dianova, #115-036-003 GP 1:20 000
GP, goat polyclonal; MM, mouse monoclonal.
840 Schindler et al.
Dow
nloaded from https://academ
ic.oup.com/m
olehr/article/26/11/837/5912022 by guest on 30 July 2022

............................................................................................................................................................................................................................
Table III Relative amounts of saturated fatty acids (SFA), monounsaturated fatty acids (MUFA) and polyunsaturated fattyacids (PUFA) investigated in rabbit blastocysts.
Fatty acids Relative amount (% of total amount) Overall effects
Blastocyst cavity fluid Embryoblast Trophoblast
NI DT1 NI DT1 NI DT1 Diabetes Cellcompartment
n 5 19 n 5 20 n 5 20 n 5 20 n 5 20 n 5 20 P-value P-value
SFA
12:0 (Lauric acid) 1:83a0:16 1:30a
0:16 2:29b:a0:16 1:25a
0:16 1:60a0:16 0:68b
0:16 0.0017 <0.0001
13:0 (Tridecyclic acid) 0:27a0:02 0:28a
0:02 0.230.02 0:28a0:03 0.110.10 0:17b
0:02 0.3386 0.0366
14:0 (Myristic acid) 5:63a0:16 3:06b:a
0:16 4:57b0:16 3:59b:a
0:16 3:70b:a0:16 2:23b
0:16 <0.0001 <0.0001
15:0 (Pentadecylic acid) 3:22a0:10 1:45b:a
0:10 2:33b0:10 1:96b
0:10 1:72b0:10 1:16b:a
0:10 <0.0001 <0.0001
16:0 (Palmitic acid) 36:05a0:65 40:54b:a
0:64 33:51b0:64 41:02b:a
0:64 40:17b:a0:64 30:00b
0:64 0.4091 <0.0001
17:0 (Margaric acid) 1.650.20 1.910.20 1.550.20 2:42a0:20 2:10a
0:20 1:21b0:20 0.6251 0.2437
18:0 (Stearic acid) 13:86a0:68 25:17b:a
0:66 15:09a0:66 21:96b:a
0:66 21:36b:a0:66 17:95b
0:66 <0.0001 0.1165
20:0 (Arachidic acid) 2:15a0:04 1:10b
0:04 2:08a0:04 0:89b:a
0:04 1:07b:a0:04 0:94b:a
0:04 <0.0001 <0.0001
21:0 (Heneicosylic acid) 1:21a0:03 0:27b
0:03 1:20a0:03 0:22b
0:03 0:26b0:03 0:46b:a
0:03 <0.0001 <0.0001
22:0 (Behenic acid) 4:34a0:11 1:38b
0:11 4:40a0:11 1:43b
0:11 1:59b0:11 1:85b:a
0:11 <0.0001 <0.0001
23:0 (Tricosylic acid) 1:74a0:09 0:42b
0:09 1:77a0:09 0:62b
0:13 0:53b0:09 0:75b
0:09 <0.0001 <0.0001
24:0 (Lignoceric acid) 6:02a0:13 1:26b:a
0:13 5:78a0:13 0:90b:a
0:13 1:23b:a0:13 2:67b
0:13 <0.0001 <0.0001
Sum SFA 78:14a1:03 78:80a
1:01 75:21a1:01 77:19a
1:01 76:32a1:01 60:64b
1:01 0.0015 <0.0001
MUFA
16:1c-9 (Palmitoleic acid) 0:57a0:25 0:99a
0:21 0:55a0:23 3:02b
0:21 1:04a0:23 2:38b
0:21 0.0425 <0.0001
17:1c-10 (cis-10-Heptadecenoic acid) 0.250.26 0.260.08 n.d. n.d. 0.270.10 0.210.05 0.8922 0.4908
18:1c-9 (Oleic acid) 10:49a0:73 9:47a
0:72 12:20a0:72 11:46a
0:71 9:63b:a0:72 20:64b
0:71 0.0023 <0.0001
18:1c-11 (cis-Vaccenic) 0:46a0:07 0:73a
0:07 0:57a0:07 0:88b
0:07 0:82b0:07 1:70b:a
0:07 <0.0001 <0.0001
18:1t-9 (Elaidic acid) 0:46a0:05 0:11b
0:07 0:60a0:05 0:30b
0:06 n.d. n.d. <0.0001 0.0215
20:1c-11 (Gondoic acid) 0:15a0:03 0:31b:a
0:03 0:18a0:03 0:32b:a
0:03 0:24b:a0:03 0:55b
0:03 0.0002 <0.0001
22:1c-13 (Erucic acid) 0:08a0:02 0:11a
0:01 0:02b0:02 n.d. n.d. 0:07b
0:01 0.1389 0.0049
24:1c-15 (Nervonic acid) 0:84a0:14 1:63b
0:15 1:36b0:14 0:44a
0:18 4:23b0:14 0:25a
0:15 <0.0001 <0.0001
Sum MUFA 13:02a0:83 13:06a
0:81 15:46b:a0:81 16:34b:a
0:81 16:00b;a0:81 26:09b
0:81 0.0013 <0.0001
PUFA
18:2n-6 (Linoleic acid) 0:52a0:26 2:73b;a
0:25 0:54a0:25 2:40b:a
0:25 2:05b;a0:26 6:60b
0:25 <0.0001 <0.0001
18:2t-9,t-11(t9,t11-Octadecadienoicacid)
0:22a0:22 0:19a
0:21 0:21a0:21 2:00b
0:25 1:02b;a0:21 0:29a
0:22 0.1794 <0.0001
18:3n-3 (a-Linolenic acid) 0:19a0:05 0:34a
0:04 0:20a0:14 0:42b:a
0:05 0:31a0:05 0:64b
0:03 0.0003 <0.0001
18:3n-6 (c-Linolenic acid) 0:11a0:11 0:39a;b
0:10 0:09a0:12 0:46b
0:12 0:10a0:15 0:07a
0:11 0.0487 0.2951
20:2n-6 (Eicosadienoic acid) 0:44a0:03 0:17b
0:04 0:46a0:03 0:17b
0:06 0:22b0:04 0:38a
0:03 0.0050 0.9501
20:3n-6 (Dihomo-c-linolenic acid) 0:10a0:13 0:87b
0:10 0:15a0:11 0:85b
0:17 0:41b:a0:11 0:48b:a
0:09 0.0015 0.8714
20:3n-3 (Eicosatrienoic acid) 0:11a0:03 0:11a
0:02 0:09a0:03 0:43b
0:07 n.d. 0:13a0:02 0.0005 0.0012
20:4n-6 (Arachidonic acid) 0:23a0:39 2:25b
0:28 0:16a0:38 0:72a
0:46 1:96b0:27 1:59b
0:27 0.0674 <0.0001
20:5n-3 (Eicosapentaenoic acid) 0:05a0:10 0:16a
0:07 n.d. 0:19a0:06 n.d. 0:09a
0:03 0.3646 0.3975
22:2n-6 (Docosadienoic acid) 0:25a0:09 0:41a;b
0:09 0:18a0:09 0:68b;a
0:11 0:41a;b0:09 0:41a;b
0:09 0.0179 0.5484
22:5n-3 (Docosapentaenoic acid) 4:46a0:12 0:56b
0:12 4:43a0:12 0:37b
0:13 0:63b0:12 1:98b:a
0:12 <0.0001 <0.0001
22:6n-3 (Docosahexaenoic acid) 2:46a0:10 0:54b
0:10 3:00b:a0:10 0:55b
0:11 0:58b0:10 0:43b
0:10 <0.0001 <0.0001
Sum PUFA 8:95a0:56 8:09a
0:54 9:34a0:54 6:47b
0:54 7:73a0:54 13:27b
0:54 0.0007 <0.0001
Sum n-3 FA 7:02a0:19 1:44b;a
0:19 7:46a0:19 1:11b;a
0:19 1:35b;a0:19 3:26b;a
0:19 <0.0001 <0.0001
Sum n-6 FA 1:60a0:35 6:48b
0:34 1:65a0:34 4:04b:a
0:34 5:30b;a0:34 9:74b:a
0:34 <0.0001 <0.0001
Ratio n-6/n-3 0:24a0:35 4:80b;a
0:35 0:24a0:35 4:34b;a
0:35 4:39b0:35 3:12b
0:35 0.0001 <0.0001
Different letters denote significant effect of group (a, b) (P� 0.05).The amount was calculated as mean 6 SEM (MeanSEM) in percent of the total fatty acid content in the embryonic compartments.DT1, experimental insulin-dependent diabetic; n, number of embryos pooled from 3 to 4 animals per experimental group; n.d., not detectable; NI, normoinsulinaemic rabbits.
Fatty acid metabolism in rabbit blastocysts 841
Dow
nloaded from https://academ
ic.oup.com/m
olehr/article/26/11/837/5912022 by guest on 30 July 2022

..
..
..
..
..
..
..
..
..
..
..
..
..
..
..
..
..
..
..
..
..
..
..
..
..
..
..
..
..
..
..
..
..
..
..
..
..
..
..
..
..
..
..
..
..
..
..
..
..
..
..
..
..
..
..
..
..
..
..
..
..
..
..
..
..
..
..
..
..
..
..
..
..
..
..
..
..
..
..
..
..
..
..
..
..
..
.respectively) from diabetic rabbits. No changes were observed in theTB. The ratio of n-6 to n-3 FAs (line ratio n-6/n-3, Table 3) was highlyelevated in BF and EB samples from diabetic rabbits with an almost a20-fold increase and this ratio was found to be slightly decreased inTB samples. DHA (22:6n-3) and DPA (22:5n-3) were the n-3 PUFAswith the highest occurrence in EB and BF in a healthy control rabbit.Due to maternal diabetes mellitus, the amount of DHA and DPA de-creased by 78% to 92%, respectively (Table 3). Furthermore, therewas 2-fold increase in ALA (18:3n-3) in EB and TB compartment. Then-6 FAs LA (18:2n-6) was highly increased (3.3-fold in TB, 4.4-fold inEB and 5.3-fold in BF) in the rabbit blastocyst. The n-6 FA AA (20:4n-6) was increased 10-fold in BF, while no significant changes were ob-served in the EB and TB (Table 3).
FA profile in the maternal plasma ofrabbitsIn addition to embryonic FA levels, we measured FA levels in maternalplasma samples from diabetic and non-diabetic pregnant rabbits. Theratio of SFAs, MUFAs and PUFAs in the plasma of the mother(Table 4) was clearly different compared to the blastocysts (Table 3).The amount of SFAs (sum SFA, maternal plasma: Table 4, blastocysts:Table 3) was lower in comparison to the relative amounts in embry-onic tissues, which was due to a lower level of PA (16:0) and verylong-chain FAs (21 carbon atoms and longer). The total amounts ofMUFAs and PUFAs (sum MUFA and PUFA, blastocysts: Table 3 andmaternal plasma: Table 4) were higher in maternal plasma samplesthan in the rabbit blastocysts, in particular, the amount of LA (18:2n-6) increased 10- to 40-fold.
In diabetic rabbits, the total amount of SFAs decreased in maternalplasma. Analysis of the different SFAs revealed that some of themwere either not affected or decreased (e.g. PA, 16:0 and SA, 18:0, de-creased by 25%). The total amount of MUFAs was lower in theplasma from diabetic rabbits, whereby the most prominent monoun-saturated fatty OA (18:1cis-9) acid did not change.
The sum of the PUFAs increased in plasma from diabetic rabbitswith marked differences found between the individual PUFAs. Whilethe relative amounts of LA (18:2n-6) and ALA (18:3n-3) increased(20% and 220%, respectively), other PUFAs, such as AA (20:4n-6),eicosapentaenoic acid (20:5n-3) and DHA (22:6n-3), decreased.Furthermore, the ratio of n-6 vs. n-3 PUFAs was lower in rabbitplasma with experimentally-induced diabetes mellitus.
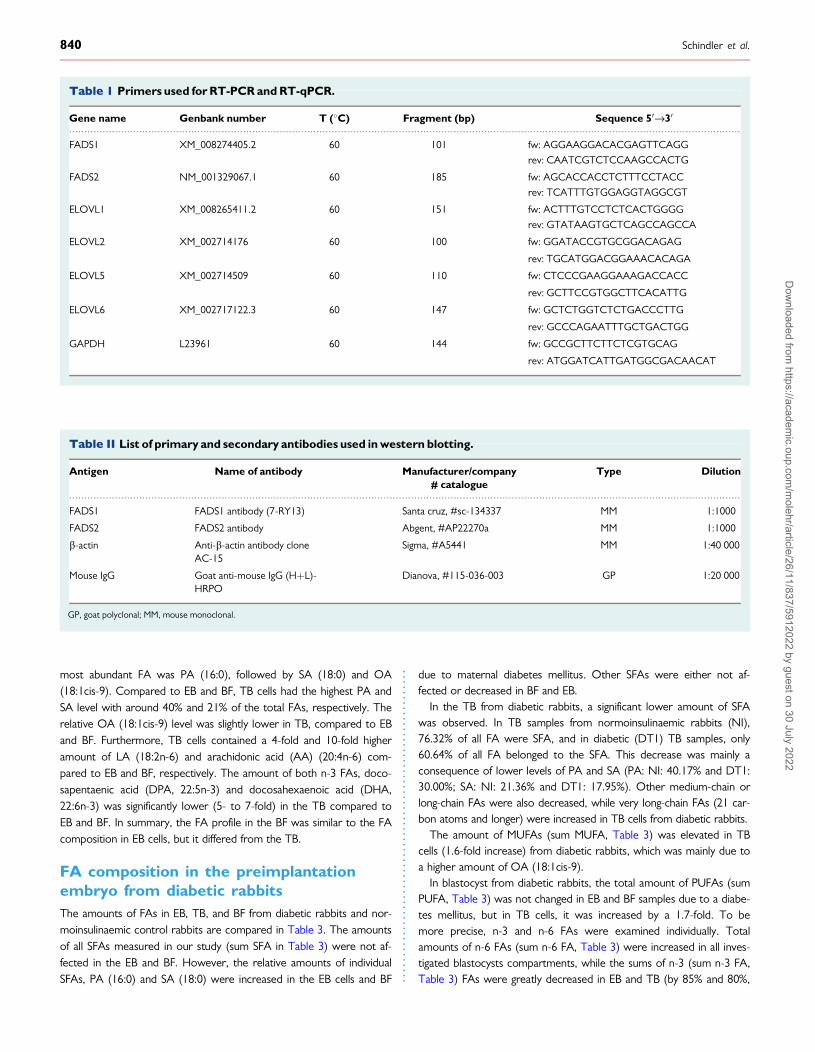
Expression of enzymes for FA desaturationand elongation in the rabbitpreimplantation embryoIn the next step, we evaluated whether or not metabolic changes dueto maternal diabetes could affect key enzymes for FA synthesis andprocessing in the blastocysts. Therefore, the expression of the genesinvolved in FA elongation and desaturation was verified by RT-PCR inthe rabbit preimplantation embryo (Fig. 1). FA desaturases (FADS1and FADS2) and elongases (ELOVL1, ELOVL2, ELOVL5 andELOVL6), were expressed from morulae stages (Day 3 p.c.) till thelate blastocysts stage (Day 8 p.c.) (Fig. 1). We observed transcriptionof all investigated genes during preimplantation development and inboth blastocysts compartments, EB and TB (Fig. 1).
In blastocysts from diabetic rabbits, mRNA and protein amount ofFADS1 were increased in the TB, whereas no changes were observedin the EB (Fig. 2A and B). In contrast, mRNA and protein of FADS2was increased only in the EB and not affected in the TB from diabeticrabbits (Fig. 2C and D).
To estimate the enzyme activity, the desaturase index was calcu-lated as the ratio of FA product to precursor (Kroger and Schulze,2012). D5-Desaturases activity was expressed as the ratio of AA(20:4n-6) to dihomo-c-linolenic acid (20:3n-6), while D6-desaturasesactivity was estimated as the ratio of c-linolenic acid (18:3n-6) to LA(18:2n-6) (Table 5). The calculated D5-desaturases activity was higherin TB than in EB. Furthermore, the D5-desaturases activity was lowerin TB from diabetic rabbits. The D6-desaturases activity was not af-fected in EB and TB by maternal diabetes.
ELOVLs activity is known to be controlled by transcriptional regula-tion (Jakobsson et al., 2006). Therefore, the expression of ELOVL1,ELOVL2, ELVOL5 and ELOVL6 was quantified by RT-qPCR (Fig. 3).The mRNA amounts of ELOVL1 and ELOVL2 increased in EB and TBfrom diabetic rabbits (Fig. 3A and B), while no significant differenceswere observed for ELOVL5 and 6 (Fig. 3C and D).
DiscussionFAs are key nutrients critical for growth and development, serving assubstrates for signalling molecules and acting as direct modulators ofgene expression (Turner et al., 2014). Previous research has revealedthe importance of FAs for the early mammalian embryo (Hillman andFlynn, 1980). On the one hand, FAs serve as energy sources duringpreimplantation development. Rabbit embryos oxidize PA at thesingle-cell stage, with a subsequent increase during further embryo de-velopment. The highest rate of PA oxidation has been measured atthe blastocyst stage. On the other hand, in rabbit zygotes, FAs takenup from the surrounding milieu can also be incorporated in triacylgly-cerols and phospholipids for energy storage (Waterman and Wall,1988). In the current study, we observed that the FA compositionwas different in EB and TB compartments and that the FA composi-tion of BF was closer to EB than to TB. Since EB and TB develop inthe same surrounding milieu, it is likely that EB and TB take up differ-ent FAs to cover their needs.
Compared to the maternal plasma FA profile, rabbit preimplantationembryos contain higher amounts of SFAs and lower amounts ofPUFAs, especially n-6 PUFAs. The reason for difference in FA compo-sition between embryo and the mother is not fully understood. It hasbeen reported that changes in serum FAs are reflected in the FA com-position of the follicular environment (Childs et al., 2008; Fouladi-Nashta et al., 2009). A recent study in humans showed a positive cor-relation between the follicular fluid and the blood serum concentrationof PUFAs, such as ALA and LA. No correlation has been observed forSFAs, such as PA and SA (Lash and Armstrong, 2009; Mirabi et al.,2017). Data concerning the microenvironment within the uterus areless well established. Haggerty and co-workers showed that humanembryos favour SFA accumulation in the early preimplantation phaseup to the eight-cell stage. From the eight-cell stage to the blastocystsstage and onward, PUFAs are predominately accumulated (Haggartyet al., 2006). Also, a study in rabbits has shown that the fatty acidcomposition change in embryos from one-cell to blastocysts stage and
842 Schindler et al.
Dow
nloaded from https://academ
ic.oup.com/m
olehr/article/26/11/837/5912022 by guest on 30 July 2022

............................................................................................................................................................................................................................
Table IV Relative amounts of saturated fatty acids (SFA), monounsaturated fatty acids (MUFA) and polyunsaturated fattyacids (PUFA) in blood plasma of normoinsulinaemic and diabetic rabbits at Day 6 p.c. (MeanSEM).
Fatty acids Relative amount (% of total amount)
Normoinsulinaemic Diabetes type 1n 5 19 n 5 20
SFA
12:0 (Lauric acid) 0:63a0:04 0:38b
0:04
13:0 (Tridecyclic acid) 0.080.01 0.060.01
14:0 (Myristic acid) 1:50a0:06 1:26b
0:05
15:0 (Pentadecylic acid) 0.760.02 0.730.02
16:0 (Palmitic acid) 23.150.23 23.120.23
17:0 (Margaric acid) 0.850.02 0.780.02
18:0 (Stearic acid) 12:62a0:22 9:60b
0:22
20:0 (Arachidic acid) 0.410.06 0.350.06
21:0 (Heneicosylic acid) 0:18a0:02 0:11b
0:02
22:0 (Behenic acid) 0:75a0:06 0:39b
0:06
23:0 (Tricosylic acid) 0.290.04 0.270.04
24:0 (Lignoceric acid) 0:93a0:10 0:51b
0:10
Sum SFA 42:36a0:43 37:61b
0:42
MUFA
16:1cis-9 (Palmitoleic acid) 1:29a0:08 1:71b
0:08
17:1cis-10 (cis-10-Heptadecenoic acid) 0:39a0:05 0:26b
0:04
18:1cis-9 (Oleic acid) 17.880.30 17.340.30
18:1cis-11 (cis-Vaccenic) 1:24a0:04 1:06b
0:04
18:1trans-9 (Elaidic acid) 0:16a0:01 0:08b
0:01
18:1trans-11 (trans-vaccenic acid) 0:08a0:001 0:10b
0:01
20:1c-11 (Gondoic acid) 0:25a0:01 0:17b
0:01
22:1c-13 (Erucic acid) 0:03a0:001 0:02b
0:001
24:1c-15 (Nervonic acid) 0:49a0:03 0:04b
0:04
Sum MUFA 21:86a0:39 20:78b
0:38
PUFA
18:2n-6 (Linoleic acid) 26:60a0:40 31:79b
0:39
18:2t-9,t-11(t9, t11-Octadecadienoic acid) 0:23a0:02 0:14b
0:02
18:3n-3 (a-Linolenic acid) 2:11a0:14 4:72b
0:14
18:3n-6 (c-Linolenic acid) 0:05a0:03 0:14b
0:03
18:4n-3 (Stearidonic acid) 0.0050.005 0.010.002
20:2n-6 (Eicosadienoic acid) 0:40a0:03 0:23b
0:03
20:3n-6 (Dihomo-c-linolenic acid) 0:42a0:01 0:12b
0:01
20:3n-3 (Eicosatrienoic acid) 0.060.02 0.080.02
20:4n-6 (Arachidonic acid) 4:09a0:13 3:30b
0:12
20:5n-3 (Eicosapentaenoic acid) 0:15a0:01 0:10b
0:01
22:2n-6 (Docosadienoic acid) 0.070.01 0.060.01
22:5n-3 (Docosapentaenoic Acid) 0:79a0:07 0:45b
0:07
22:6n-3 (Docosahexaenoic acid) 0:43a0:04 0:14b
0:04
Sum PUFA 35:74a0:50 41:56b
0:49
Sum n-3 PUFA 3:54a0:16 5:49b
0:15
Sum n-6 PUFA 31:97a0:44 35:96b
0:43
Ratio n-6/n-3 PUFA 9:63a0:33 6:74b
0:32
Different letters denote significant effect of group (a, b) (P� 0.05).
Fatty acid metabolism in rabbit blastocysts 843
Dow
nloaded from https://academ
ic.oup.com/m
olehr/article/26/11/837/5912022 by guest on 30 July 2022
..
..
..
..
..
..
..
..
..
..
..
..
..
..
..
..
..
..
..
..
..
..
..
..
..
..
..
..
..
..
..
..
..
..
..these changes are not in accordance with the composition in oviductaland uterine fluid (Khandoker et al., 1998). Taking this together withthe observations in our study, we propose that the embryo has a spe-cific preference to take up individual FAs, thus modulating their ownfatty acid composition independently from the maternal supply.
We have shown that the lipid content and metabolism of rabbitblastocysts changes in a diabetic environment (Schindler et al., 2014).In this study, we demonstrated that the FA composition in EB and TBare affected differently by maternal insulin-dependent diabetes mellitus,with an increase in SFAs and a decrease in n-3 PUFAs, especially inthe EB. In eukaryotic cells and even in embryos, FAs are highly diversein terms of their metabolic and functional properties. The relationshipbetween FA metabolism and embryo differentiation and implantationwas summarized by Revelli et al. (2009) and Dunning et al. (2014). It isknown that changes in the FA composition affect embryonic metabo-lism and further development in a cell lineage-specific manner. PA andSA decrease rates of fertilisation, cleavage and blastocyst formation byregulating the genes responsible for stress and apoptosis (Jungheimet al., 2011; McKeegan and Sturmey, 2011; Valckx et al., 2014). OAcompensates the negative effects of PA and moreover, elevated levelsof OAs can even improve post-fertilisation developmental competenceand implantation (Aardema et al., 2011, Valckx et al., 2014; Yanget al., 2017). We observed increased levels of OA and decreased
levels of PA and SA in the TB, while in the EB, PA and SA were foundto be increased and OA levels were not affected. These results indi-cate that the EB could be affected by oxidative stress and apoptosis. Ina previous study, we described embryo development capacities andshowed that apoptosis increases in the EB from diabetic rabbits(Ramin et al., 2010). Controversy exists regarding the role of LA forpreimplantation embryo development. A positive impact of LA on thefertility rate was documented in humans (Shaaker et al., 2012).However, studies in ovine and bovine models have argued that highlevels of LA negatively affect oocyte maturation and developmentalcompetence (Renaville et al., 2010; Amini et al., 2016; Roura et al.,2018). In humans, ALA exerts damaging effects on the reproductivesystem, decreasing the chance of pregnancy after IVF (Jungheim et al.,2011). Both LA and ALA were found to be increased in all compart-ments of the rabbit blastocysts due to maternal diabetes mellitus. Thismay contribute to the adverse effect of a diabetic pregnancy. Haggertyand co-workers found higher levels of DHA in later stages of preim-plantation embryo development (Haggarty et al., 2006), indicating thatthis FA is important for the later phase of preimplantation develop-ment. We observed an excessive reduction in DHA in EB and BFfrom diabetic rabbits. This correlates with studies in humans, where adiabetic pregnancy led to lower DHA in embryonic and foetal tissues(reviewed by Leveille et al. (2018) and Judge et al. (2016)). In a bovine
Figure 1. Transcription of key genes in fatty acid metabolism in rabbit preimplantation embryos. RT-PCR was performed with spe-cific primers for FADS1, FADS2, ELOVL1, ELOVL2, ELOVL5 and ELVOL6 on rabbit morulae at Day (d) 3, blastocysts at Days 4, 5, 6 and 8 post coi-tum; and d6 blastocysts at gastrulation stages (st.) 0, 1, 2 and 3. Gastrulating blastocysts were separated in embryoblast (EB) and trophoblast (TB).Transcripts of FADS1, FADS2, ELOVL1, ELOVL2, ELOVL5 and ELOVL6 were detected in all analysed developmental stages. A probe withoutcDNA was used as the negative control (ntc). A rabbit liver cDNA sample was used as the positive control (þ). The internal control was the expres-sion of GAPDH in all probes. bp, basepairs.
844 Schindler et al.
Dow
nloaded from https://academ
ic.oup.com/m
olehr/article/26/11/837/5912022 by guest on 30 July 2022

..
..
..
..
..
..
..
..
..
..
..
..
..
..
..
..
.model, DHA affects oocyte developmental competence by regulatinglipid metabolism gene expression (Oseikria et al., 2016). Therefore,we believe that changes in DHA due to maternal diabetes mellitusmay contribute to early diabetic embryopathy.
Based on the work from Childs et al. (2008), it is known that exter-nal factors such as diet can affect the FA composition of the genitaltract. In the present study, we showed that experimentally-induced di-abetes mellitus led to reduced total amount of SFAs and MUFAs inmaternal plasma, while the total amount of PUFAs increased. In detail,no changes were observed for PA and OA, whereas SA, DPA andDHA decreased and LA and ALA increased. Changes in the plasma
FA profile are known from humans, with special attention to the re-duction in DHA level (Taschereau-Charron et al., 2018).
The degree of unsaturation and the length of the FAs are modulatedby desaturation and elongation enzymes (Fig. 4). All of the enzymesthat we analysed were expressed in the rabbit preimplantation embryofrom Day 3 p.c. and onward and in both blastocysts compartments,EB and TB. The expression of FA desaturases and elongases has beendescribed in other species, too. In sheep d7 blastocysts, FADS1,FADS2 and ELOVL5 were expressed (Hughes et al., 2011), and duringbovine preimplantation embryo development ELOVL5 and ELOVL6were expressed, with the most prominent expression during the
Figure 2. FADS1 and FADS2 expression by RT-qPCR and western blot in blastocysts from diabetic rabbits. Transcription levels(RT-qPCR) of FADS1 (A) and FADS2 (B) in blastocysts from normoinsulinaemic (NI, black bars) and diabetic rabbits (DT1, white bars) are given.FADS1 and FADS2 mRNA levels were elevated in EB and TB, respectively (*P < 0.05). The protein expression (western blot) of FADS1 (C) andFADS2 (D) was quantified in 6-day-old blastocysts from DT1 (white bars) and NI (black bars). For western blot quantification, samples from at leastthree independent experiments with eight or more blastocysts per samples were analysed (n � 3, n � 8). A representative western blot is shown (Cand D). Protein was detected using Luminata Forte (Milipore) imaged with Chemi Doc ImageLab Software. The data presented in the submitted man-uscript are the mean 6 SEM of two separate blots. The relative amounts of FADS1 and FADS2 are shown in diagrams after normalization for the lev-els of b-actin. All values are expressed as relative amounts (mean þ SEM) in % of non-diabetic controls (n � 8,*P < 0.05).
Fatty acid metabolism in rabbit blastocysts 845
Dow
nloaded from https://academ
ic.oup.com/m
olehr/article/26/11/837/5912022 by guest on 30 July 2022

..
..
..
..
.morulae stage (Sudano et al., 2016). Mainly in vitro studies have shownhow the expression of desaturases and elongases can be affected bythe surrounding milieu. In sheep and bovine embryos, FA
supplementation affects embryonic of FADS2 expression (Darwichet al., 2010; Hughes et al., 2011). FADS1, FADS2 and ELOVL6 activityand expression is regulated by a wide range of external factors which
............................................................................................................................................................................................................................
Table V Relative desaturases activity index in embryoblast (EB) and trophoblast (TB) cells of normoinsulinaemic (NI) andexperimental insulin-dependent diabetic (DT1) rabbits.
Embryoblast (EB) Trophoblast (TB)
Index of enzyme activity NI DT1 P-value NI DT1 P-value
D5-desaturaseactivity
Relative activity
(ratio 20:4n-6/20:3n-6)
1.1460.824 0.7560.361 0.627 4.8860.502 3.7660.330 0.062
D6-desaturaseactivity
Relative activity
(ratio 18:3n-6/18:2n-6)
0.1960.024 0.2460.033 0.190 0.0560.007 0.0160.001 <0.001*
Activity was calculated as ratio of AA (20:4n-6) to dihomo-c-linolenic acid (20:3n-6) and c-linolenic acid (18:3n-6) to linoleic acid (18:2n-6) for D5 and D6 desaturase, respectively.Results are expressed as Mean6SEM (from n ¼ 20 individual samples). Statistical significances are indicated as follows * p < 0.05.
Figure 3. ELOVL1, ELOVL2, ELOVL5 and ELOVL6 expression by RT-qPCR in blastocysts from diabetic rabbits. Transcriptionanalyses (RT-qPCR) of ELOVL1 (A), ELOVL2 (B), ELOVL5 (C) and ELVOL6 (D) in blastocysts from normoinsulinaemic (NI, black bars) and diabeticrabbits (DT1, white bars) are given. The results are shown as mean þ SEM and transcription in normoinsulinaemic blastocysts was set 100%. Thetranscription of ELOVL1 and ELVOL2 was increased in embryoblast and trophoblast, while ELOVL5 and ELOVL6 was not changed by maternal dia-betes (*P < 0.05).
846 Schindler et al.
Dow
nloaded from https://academ
ic.oup.com/m
olehr/article/26/11/837/5912022 by guest on 30 July 2022
..
..
..
..
..
..
..
..
..
..
..
..
..
..
..
..
..
..
..
..
..
..
..
..
..
..
..
..
..
..
..
..
..
..
..
..
..
..
..
..
..
..
..
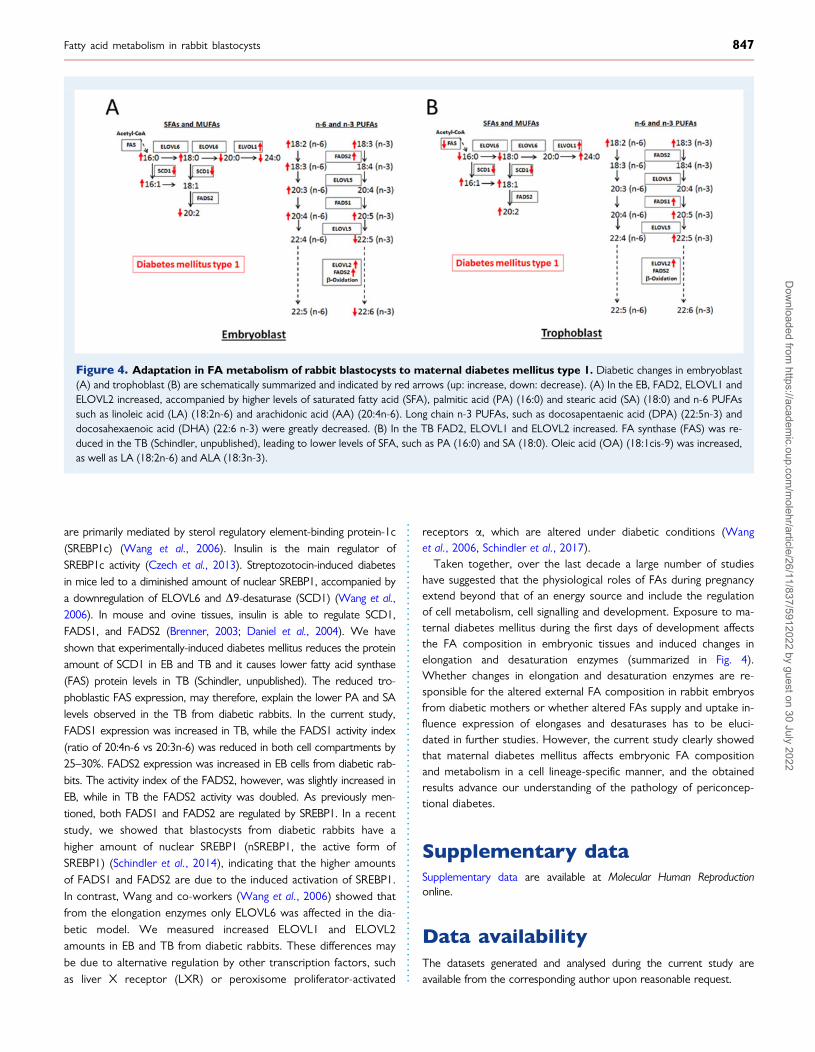
..are primarily mediated by sterol regulatory element-binding protein-1c(SREBP1c) (Wang et al., 2006). Insulin is the main regulator ofSREBP1c activity (Czech et al., 2013). Streptozotocin-induced diabetesin mice led to a diminished amount of nuclear SREBP1, accompanied bya downregulation of ELOVL6 and D9-desaturase (SCD1) (Wang et al.,2006). In mouse and ovine tissues, insulin is able to regulate SCD1,FADS1, and FADS2 (Brenner, 2003; Daniel et al., 2004). We haveshown that experimentally-induced diabetes mellitus reduces the proteinamount of SCD1 in EB and TB and it causes lower fatty acid synthase(FAS) protein levels in TB (Schindler, unpublished). The reduced tro-phoblastic FAS expression, may therefore, explain the lower PA and SAlevels observed in the TB from diabetic rabbits. In the current study,FADS1 expression was increased in TB, while the FADS1 activity index(ratio of 20:4n-6 vs 20:3n-6) was reduced in both cell compartments by25–30%. FADS2 expression was increased in EB cells from diabetic rab-bits. The activity index of the FADS2, however, was slightly increased inEB, while in TB the FADS2 activity was doubled. As previously men-tioned, both FADS1 and FADS2 are regulated by SREBP1. In a recentstudy, we showed that blastocysts from diabetic rabbits have ahigher amount of nuclear SREBP1 (nSREBP1, the active form ofSREBP1) (Schindler et al., 2014), indicating that the higher amountsof FADS1 and FADS2 are due to the induced activation of SREBP1.In contrast, Wang and co-workers (Wang et al., 2006) showed thatfrom the elongation enzymes only ELOVL6 was affected in the dia-betic model. We measured increased ELOVL1 and ELOVL2amounts in EB and TB from diabetic rabbits. These differences maybe due to alternative regulation by other transcription factors, suchas liver X receptor (LXR) or peroxisome proliferator-activated
receptors a, which are altered under diabetic conditions (Wanget al., 2006, Schindler et al., 2017).
Taken together, over the last decade a large number of studieshave suggested that the physiological roles of FAs during pregnancyextend beyond that of an energy source and include the regulationof cell metabolism, cell signalling and development. Exposure to ma-ternal diabetes mellitus during the first days of development affectsthe FA composition in embryonic tissues and induced changes inelongation and desaturation enzymes (summarized in Fig. 4).Whether changes in elongation and desaturation enzymes are re-sponsible for the altered external FA composition in rabbit embryosfrom diabetic mothers or whether altered FAs supply and uptake in-fluence expression of elongases and desaturases has to be eluci-dated in further studies. However, the current study clearly showedthat maternal diabetes mellitus affects embryonic FA compositionand metabolism in a cell lineage-specific manner, and the obtainedresults advance our understanding of the pathology of periconcep-tional diabetes.
Supplementary dataSupplementary data are available at Molecular Human Reproductiononline.
Data availabilityThe datasets generated and analysed during the current study areavailable from the corresponding author upon reasonable request.
Figure 4. Adaptation in FA metabolism of rabbit blastocysts to maternal diabetes mellitus type 1. Diabetic changes in embryoblast(A) and trophoblast (B) are schematically summarized and indicated by red arrows (up: increase, down: decrease). (A) In the EB, FAD2, ELOVL1 andELOVL2 increased, accompanied by higher levels of saturated fatty acid (SFA), palmitic acid (PA) (16:0) and stearic acid (SA) (18:0) and n-6 PUFAssuch as linoleic acid (LA) (18:2n-6) and arachidonic acid (AA) (20:4n-6). Long chain n-3 PUFAs, such as docosapentaenic acid (DPA) (22:5n-3) anddocosahexaenoic acid (DHA) (22:6 n-3) were greatly decreased. (B) In the TB FAD2, ELOVL1 and ELOVL2 increased. FA synthase (FAS) was re-duced in the TB (Schindler, unpublished), leading to lower levels of SFA, such as PA (16:0) and SA (18:0). Oleic acid (OA) (18:1cis-9) was increased,as well as LA (18:2n-6) and ALA (18:3n-3).
Fatty acid metabolism in rabbit blastocysts 847
Dow
nloaded from https://academ
ic.oup.com/m
olehr/article/26/11/837/5912022 by guest on 30 July 2022

..
..
..
..
..
..
..
..
..
..
..
..
..
..
..
..
..
..
..
..
..
..
..
..
..
..
..
..
..
..
..
..
..
..
..
..
..
..
..
..
..
..
..
..
..
..
..
..
..
..
..
..
..
..
..
..
..
..
..
..
..
..
..
..
..
..
..
..
..
..
..
..
..
..
..
..
..
..
..
..
..
..
..
..
..
..
..AcknowledgementsWe thank Sabine Schrotter and Michaela Kirstein for their excellenttechnical assistance. The authors wish to thank Birgit Jentz and MariaDahm of the Leibniz Institute for Farm Animal Biology for performingsample preparation and fatty acid analysis.
Authors’ rolesAll authors have read and agree to the published version of the manu-script. The authors contributed to the manuscript as follow: conceptu-alization, M.S. and A.N.S.; methodology, M.S., D.D., M.P., K.G. andT.S.; formal analysis, D.D., G.N. and M.S.; investigation, M.S.; datacuration, M.S.; original draft preparation, M.S.; review and editing,D.D., T.S. and A.NS.; visualization, M.S.; supervision, D.D. and M.S.;project administration, M.S.; funding acquisition, M.S., D.D. and A.N.S.
FundingThis work was supported by the Deutsche Diabetes Stiftung (DDS)371/05/15, German Research Council (DFG ProMoAge, GRK 2155)and the EU (Epihealth, EpihealthNET FP-7 N�278418).
Conflict of interestThe authors have no conflicts of interest to disclose.
ReferencesAardema H, Vos PLAM, Lolicato F, Roelen BAJ, Knijn HM,
Vaandrager AB, Helms JB, Gadella BM. Oleic acid prevents detri-mental effects of saturated fatty acids on bovine oocyte develop-mental competence. Biol Reprod 2011;85:62–69.
Adamiak SJ, Powell K, Rooke JA, Webb R, Sinclair KD. Body compo-sition, dietary carbohydrates and fatty acids determine post-fertilisation development of bovine oocytes in vitro. Reproduction2006;131:247–258.
Amini E, Asadpour R, Roshangar L, Jafari-Joozani R. Effect of linoleicacid supplementation on in vitro maturation, embryo developmentand apoptotic related gene expression in ovine. Int J Reprod Biomed2016;14:255–262.
Brenner RR. Hormonal modulation of D6 and D5 desaturases: caseof diabetes. Prostaglandins Leukot Essent Fatty Acids 2003;68:151–162.
Childs S, Hennessy AA, Sreenan JM, Wathes DC, Cheng Z, StantonC, Diskin MG, Kenny DA. Effect of level of dietary n-3 polyunsatu-rated fatty acid supplementation on systemic and tissue fatty acidconcentrations and on selected reproductive variables in cattle.Theriogenology 2008;70:595–611.
Czech MP, Tencerova M, Pedersen DJ, Aouadi M. Insulin signallingmechanisms for triacylglycerol storage. Diabetologia 2013;56:949–964.
Daniel ZCTR, Richards SE, Salter AM, Buttery PJ. Insulin and dexa-methasone regulate stearoyl-CoA desaturase mRNA levels and
fatty acid synthesis in ovine adipose tissue explants. J Anim Sci2004;82:231–237.
Dannenberger D, D Nurnberg G, Nurnberg K, Will K,Schauer N, Schmicke M. Effects of diets supplemented with n-3 or n-6 PUFA on pig muscle lipid metabolites measured bynon-targeted LC-MS lipidomic profiling. J Food Compos Anal2017;56: 47–54.
Darwich A. A, Perreau C, Petit MH, Papillier P, Dupont J, GuillaumeD, Mermillod P, Guignot F. Effect of PUFA on embryo cryoresist-ance, gene expression and AMPKalpha phosphorylation in IVF-derived bovine embryos. Prostaglandins Other Lipid Mediat 2010;93:30–36.
Dunning KR, Russell DL, Robker RL. Lipids and oocyte developmen-tal competence: the role of fatty acids and b-oxidation.Reproduction 2014;148:R15–R27.
Fan Y-Y, Monk JM, Hou TY, Callway E, Vincent L, Weeks B, Yang P,Chapkin RS. Characterization of an arachidonic acid-deficient(Fads1 knockout) mouse model. J Lipid Res 2012;53:1287–1295.
Fischer B, Chavatte-Palmer P, Viebahn C, Navarrete Santos A,Duranthon V. Rabbit as a reproductive model for human health.Reproduction 2012;144:1–10.
Fouladi-Nashta AA, Wonnacott KE, Gutierrez CG, Gong JG, SinclairKD, Garnsworthy PC, Webb R. Oocyte quality in lactating dairycows fed on high levels of n-3 and n-6 fatty acids. Reproduction2009;138:771–781.
Guillou H, Zadravec D, Martin PGP, Jacobsson A. The key roles ofelongases and desaturases in mammalian fatty acid metabolism:Insights from transgenic mice. Prog Lipid Res 2010;49:186–199.
Haggarty P, Wood M, Ferguson E, Hoad G, Srikantharajah A, MilneE, Hamilton M, Bhattacharya S. Fatty acid metabolism in humanpreimplantation embryos. Hum Reprod 2006;21:766–773.
Hillman N, Flynn TJ. The metabolism of exogenous fatty acids bypreimplantation mouse embryos developing in vitro. J Embryol ExpMorphol 1980;56:157–168.
Hughes J, Kwong WY, Li D, Salter AM, Lea RG, Sinclair KD. Effectsof omega-3 and -6 polyunsaturated fatty acids on ovine follicularcell steroidogenesis, embryo development and molecular markersof fatty acid metabolism. Reproduction 2011;141:105–118.
Jakobsson A, Westerberg R, Jacobsson A. Fatty acid elongases inmammals: their regulation and roles in metabolism. Prog Lipid Res2006;45:237–249.
Judge MP, Casavant SG, Dias JAM, McGrath JM. Reduced DHAtransfer in diabetic pregnancies: mechanistic basis and long-termneurodevelopmental implications. Nutr Rev 2016;74:411–420.
Jungheim ES, Macones GA, Odem RR, Patterson BW, Moley KH.Elevated serum a-linolenic acid levels are associated with de-creased chance of pregnancy after in vitro fertilization. Fertil Steril2011;96:880–883.
Khandoker M, Tsujii H, Karasawa D. A kinetics study of fatty acidcomposition of embryos, oviductal and uterine fluids in the rabbit.Asian Australas J Anim Sci 1998;11:60–64.
Kroger J, Schulze MB. Recent insights into the relation of D5 desatur-ase and D6 desaturase activity to the development of type 2 dia-betes. Curr Opin Lipidol 2012;23:4–10.
Lash MM, Armstrong A. Impact of obesity on women’s health. FertilSteril 2009;91:1712–1716.
848 Schindler et al.
Dow
nloaded from https://academ
ic.oup.com/m
olehr/article/26/11/837/5912022 by guest on 30 July 2022
..
..
..
..
..
..
..
..
..
..
..
..
..
..
..
..
..
..
..
..
..
..
..
..
..
..
..
..
..
..
..
..
..
..
..
..
..
..
..
..
..
..
..
..
..
..
..
..
..
..
..
..
..
..
..
..
..
..
..
..
..
..
..
..
..
..
..
..
..
..
..
..
..
..
..
..Lattka E, Illig T, Heinrich J, Koletzko B. Do FADS genotypes enhanceour knowledge about fatty acid related phenotypes? Clin Nutr2010;29:277–287.
Leese HJ. Metabolism of the preimplantation embryo: 40 years on.Reproduction 2012;143:417–427.
Leroy JLMR, Vanholder T, Mateusen B, Christophe A, Opsomer G,de Kruif A, Genicot G, van Soom A. Non-esterified fatty acids infollicular fluid of dairy cows and their effect on developmental ca-pacity of bovine oocytes in vitro. Reproduction 2005;130:485–495.
Leveille P, Rouxel C, Plourde M. Diabetic pregnancy, maternal andfetal docosahexaenoic acid: a review of existing evidence. J MaternFetal Neonatal Med 2018;31:1358–1363.
McKeegan PJ, Sturmey RG. The role of fatty acids in oocyte and earlyembryo development. Reprod Fertil Dev 2011;24:59–67.
Mirabi P, Chaichi MJ, Esmaeilzadeh S, Ali Jorsaraei SG, Bijani A, EhsaniM, Hashemi Karooee SF. The role of fatty acids on ICSI outcomes: aprospective cohort study. Lipids Health Dis 2017;16:18.
Moon YA, Shah NA, Mohapatra S, Warrington JA, Horton JD.Identification of a mammalian long chain fatty acyl elongase regu-lated by sterol regulatory element-binding proteins. J Biol Chem2001;276:45358–45366.
Ntambi JM, Miyazaki M. Regulation of stearoyl-CoA desaturases androle in metabolism. Prog Lipid Res 2004;43:91–104.
Ohno Y, Suto S, Yamanaka M, Mizutani Y, Mitsutake S, Igarashi Y,Sassa T, Kihara A. ELOVL1 production of C24 acyl-CoAs is linkedto C24 sphingolipid synthesis. Proc Natl Acad Sci USA 2010;107:18439–18444.
Oseikria M, Elis S, Maillard V, Corbin E, Uzbekova S. N-3 polyunsat-urated fatty acid DHA during IVM affected oocyte developmentalcompetence in cattle. Theriogenology 2016;85:1625–1634.e2.
Paigen B. Genetics of responsiveness to high-fat and high-cholesteroldiets in the mouse. Am J Clin Nutr 1995;62:458S–462S.
Ramin N, Thieme R, Fischer S, Schindler M, Schmidt T, Fischer B,Navarrete Santos A. Maternal diabetes impairs gastrulation and in-sulin and IGF-I receptor expression in rabbit blastocysts.Endocrinology 2010;151:4158–4167.
Renaville B, Bacciu N, Comin A, Motta M, Poli I, Vanini G, Prandi A.Plasma and follicular fluid fatty acid profiles in dairy cows. ReprodDomest Anim 2010;45:118–121.
Revelli A, Delle Piane L, Casano S, Molinari E, Massobrio M, RinaudoP. Follicular fluid content and oocyte quality: from single biochemi-cal markers to metabolomics. Reprod Biol Endocrinol 2009;7:40.
Ribeiro ES, Santos JEP, Thatcher WW. Role of lipids on elongationof the preimplantation conceptus in ruminants. Reproduction 2016;152:R115–R126.
Roura M, Catala MG, Soto-Heras S, Hammami S, Izquierdo D,Fouladi-Nashta A, Paramio M-T. Linoleic (LA) and linolenic (ALA)acid concentrations in follicular fluid of prepubertal goats and theireffect on oocyte in vitro maturation and embryo development.Reprod Fertil Dev 2018;30:286–296.
Schindler M, Fischer S, Thieme R, Fischer B, Santos AN. cAMP-re-sponsive element binding protein: a vital link in embryonic hor-monal adaptation. Endocrinology 2013;154:2208–2221.
Schindler M, Pendzialek M, Grybel KJ, Seeling T, Gurke J, FischerB, Navarrete Santos A. Adiponectin stimulates lipid metabo-lism via AMPK in rabbit blastocysts. Hum Reprod 2017;32:1382–1392.
Schindler M, Pendzialek M, Navarrete Santos A, Plosch T, Seyring S,Gurke J, Haucke E, Knelangen JM, Fischer B, Santos AN. Maternaldiabetes leads to unphysiological high lipid accumulation in rabbitpreimplantation embryos. Endocrinology 2014;155:1498–1509.
Shaaker M, Rahimipour A, Nouri M, Khanaki K, Darabi M, Farzadi L,Shahnazi V, Mehdizadeh A. Fatty acid composition of human follic-ular fluid phospholipids and fertilization rate in assisted reproduc-tive techniques. Iran Biomed J 2012;16:162–168.
Sudano MJ, Rascado TDS, Tata A, Belaz KRA, Santos VG, ValenteRS, Mesquita FS, Ferreira CR, Araujo JP, Eberlin MN et al.Lipidome signatures in early bovine embryo development.Theriogenology 2016;86:472–484.e1.
Taschereau-Charron A, Bilodeau J-F, Larose J, Greffard K,Berthiaume L, Audibert F, Fraser WD, Julien P, Rudkowska I. F2-isoprostanes and fatty acids profile in early pregnancy complicatedby pre-existing diabetes. Prostaglandins Leukot Essent Fatty Acids2018;135:115–120.
Turner N, Cooney GJ, Kraegen EW, Bruce CR. Fatty acid metabo-lism, energy expenditure and insulin resistance in muscle.J Endocrinol 2014;220:T61–79.
Valckx SDM, van Hoeck V, Arias-Alvarez M, Maillo V, Lopez-Cardona AP, Gutierrez-Adan A, Berth M, Cortvrindt R, Bols PEJ,Leroy JLMR. Elevated non-esterified fatty acid concentrations dur-ing in vitro murine follicle growth alter follicular physiology and re-duce oocyte developmental competence. Fertil Steril 2014;102:1769–1776.e1.
Wang Y, Botolin D, Xu J, Christian B, Mitchell E, Jayaprakasam B,Nair MG, Nair M, Peters JM, Peters JM et al. Regulation of hepaticfatty acid elongase and desaturase expression in diabetes and obe-sity. J Lipid Res 2006;47:2028–2041.
Waterman RA, Wall RJ. Lipid interactions with in vitro developmentof mammalian zygotes. Gamete Res 1988;21:243–254.
Yang C, Lim W, Bazer FW, Song G. Oleic acid stimulation of motilityof human extravillous trophoblast cells is mediated by stearoyl-CoA desaturase-1 activity. Mol Hum Reprod 2017;23:755–770.
Zarezadeh R, Mehdizadeh A, Leroy JLMR, Nouri M, Fayezi S, DarabiM. Action mechanisms of n-3 polyunsaturated fatty acids on theoocyte maturation and developmental competence: Potentialadvantages and disadvantages. J Cell Physiol 2019;234:1016–1029.
Zhang JY, Kothapalli KSD, Brenna JT. Desaturase and elongase-limiting endogenous long-chain polyunsaturated fatty acid biosyn-thesis. Curr Opin Clin Nutr Metab Care 2016;19:103–110.
Fatty acid metabolism in rabbit blastocysts 849
Dow
nloaded from https://academ
ic.oup.com/m
olehr/article/26/11/837/5912022 by guest on 30 July 2022
Related Documents