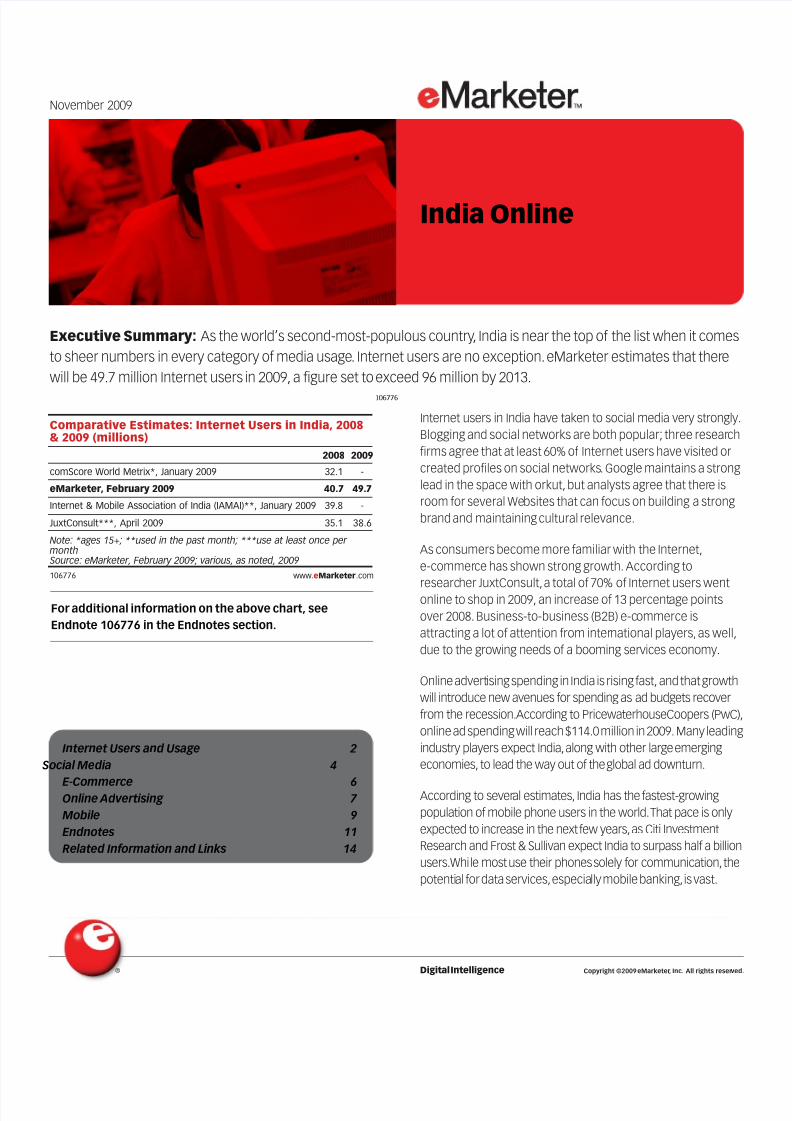
Executive Summary: As the world’s second-most-populous country , India is near the top of the list when it comes to sheer numbers in every category of media usage . Internet users are no exception. eMarketer estimates that ther e will be 49.7 million Internet users in 2009, a figure set to exceed 96 million by 2013. 106776 Internet users in India have taken to social media very strongly. Blogging and social networks are both popular; three resear ch firms agree that at least 60% of Internet users have visited or created profiles on social networks . Google maintains a strong lead in the space with orkut, but analysts agree that ther e is room for several We bsites that can focus on building a strong brand and maintaining cultural relevance. As consumers become more familiar with the Internet, e-commer ce has shown strong growth. According to researcher JuxtConsult,a total of 70% of Internet users went online to shop in 2009, an increase of 13 percent age points over 2008. Business-to-business (B2B) e-c ommerce is attracting a lot of attention from inter national players, as well, due to the growing needs of a booming services economy. Online advert ising spending in India is rising fast, and that growth will introduce new avenues for spending as ad budgets recover from the recession.According to PricewaterhouseCoopers (PwC), online ad spending will reach $114.0 million in 2009. Many leading industry players expect India, along with other large emerging economies, to lead the way out of the global ad downturn. According to sever al estimates, India has the fastest-growing population of mobile phone users in the world. That pace is only expected to increase in the next few years, as Citi Investment Research and Frost & Sullivan expect India to surpass half a billion users.Whi le most use their phones solely for communication, the potenti al for data services, especia lly mobile banking, is vast. India Online November 2009 ® Digital Intelligence Copyright ©2009 eMarketer , Inc. All rights reser ved. Internet Users and Usage 2 Social Media 4 E-Commerce 6 Online Advertising 7 Mobile 9 Endnotes 11 Related Information and Links 14 Comparative Estimates: Internet Users in India, 2008 & 2009 (millions) comScore World Metrix*, January 2009 eMarketer, February 2009 Internet & Mobile Association of India (IAMAI)**, January 2009 JuxtConsult***, April 2009 2008 32.1 40.7 39.8 35.1 2009 - 49.7 - 38.6 Note: *ages 15+; **used in the past month; ***use at least once per month Source: eMarketer, February 2009; various, as noted, 2009 106776 www.eMarketer.com For additional information on the above chart, see Endnote 106776 in the Endnotes section.

Welcome message from author
This document is posted to help you gain knowledge. Please leave a comment to let me know what you think about it! Share it to your friends and learn new things together.
Transcript
8/3/2019 eMarketer India Online
http://slidepdf.com/reader/full/emarketer-india-online 1/15
Executive Summary: As the world’s second-most-populous country, India is near the top of the list when it comes
to sheer numbers in every category of media usage. Internet users are no exception.eMarketer estimates that there
will be 49.7 million Internet users in 2009, a figure set to exceed 96 million by 2013.
106776
Internet users in India have taken to social media very strongly.
Blogging and social networks are both popular; three research
firms agree that at least 60% of Internet users have visited or
created profiles on social networks. Google maintains a strong
lead in the space with orkut, but analysts agree that there is
room for several Websites that can focus on building a strong
brand and maintaining cultural relevance.
As consumers become more familiar with the Internet,
e-commerce has shown strong growth. According to
researcher JuxtConsult,a total of 70% of Internet users went
online to shop in 2009, an increase of 13 percentage points
over 2008. Business-to-business (B2B) e-commerce is
attracting a lot of attention from international players,as well,
due to the growing needs of a booming services economy.
Online advertising spending in India is rising fast, and that growth
will introduce new avenues for spending as ad budgets recover
from the recession.According to PricewaterhouseCoopers (PwC)
online ad spending will reach $114.0 million in 2009.Many leading
industry players expect India,along with other large emerging
economies, to lead the way out of the global ad downturn.
According to several estimates, India has the fastest-growing
population of mobile phone users in the world.That pace is only
expected to increase in the next few years,as Citi Investment
Research and Frost & Sullivan expect India to surpass half a billion
users.While most use their phones solely for communication,the
potential for data services,especially mobile banking,is vast.
India Online
November 2009
® Digital Intelligence Copyright ©2009 eMarketer, Inc. All rights reserved
Internet Users and Usage 2
Social Media 4
E-Commerce 6Online Advertising 7
Mobile 9
Endnotes 11
Related Information and Links 14
Comparative Estimates: Internet Users in India, 2008& 2009 (millions)
comScore World Metrix*, January 2009
eMarketer, February 2009
Internet & Mobile Association of India (IAMAI)**, January 2009
JuxtConsult***, April 2009
2008
32.1
40.7
39.8
35.1
2009
-
49.7
-
38.6
Note: *ages 15+; **used in the past month; ***use at least once per month Source: eMarketer, February 2009; various, as noted, 2009
106776 www.eMarketer.com
For additional information on the above chart, see
Endnote 106776 in the Endnotes section.
8/3/2019 eMarketer India Online
http://slidepdf.com/reader/full/emarketer-india-online 2/15
2India Online®
Internet Users and Usage
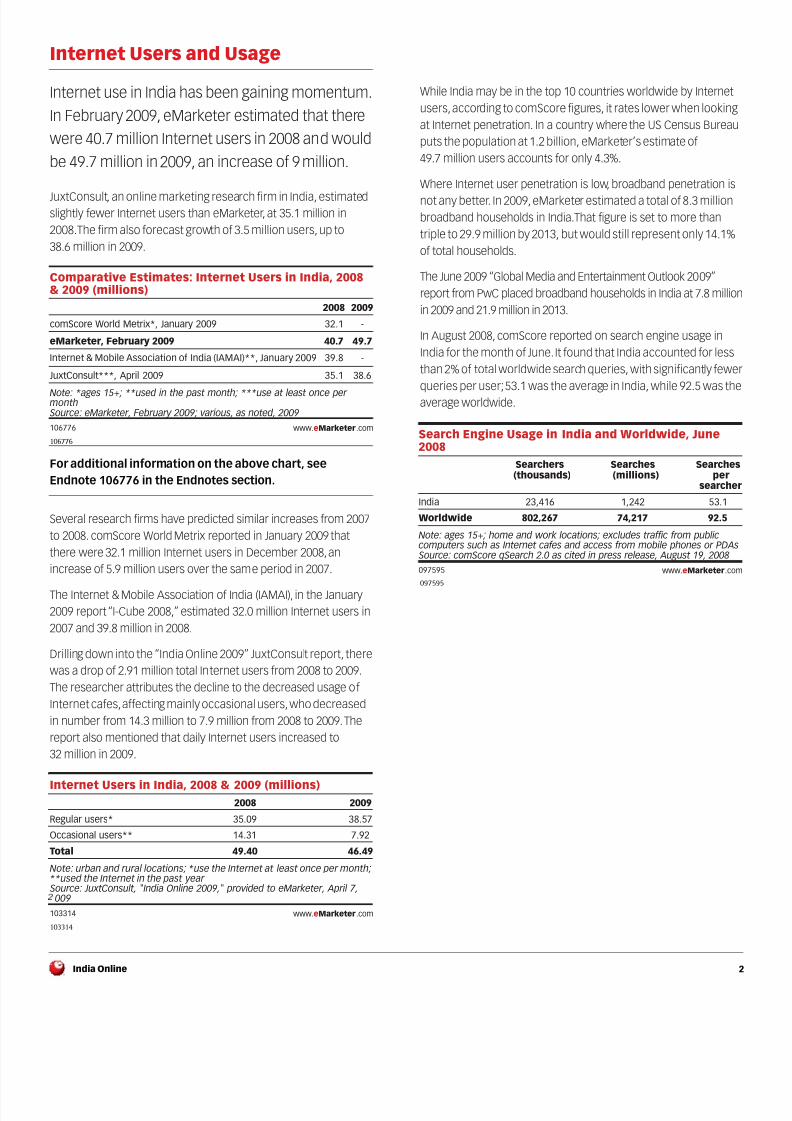
Internet use in India has been gaining momentum.
In February 2009, eMarketer estimated that there
were 40.7 million Internet users in 2008 and would
be 49.7 million in 2009, an increase of 9 million.
JuxtConsult, an online marketing research firm in India, estimatedslightly fewer Internet users than eMarketer, at 35.1 million in
2008.The firm also forecast growth of 3.5 million users,up to
38.6 million in 2009.
106776
For additional information on the above chart, see
Endnote 106776 in the Endnotes section.
Several research firms have predicted similar increases from 2007
to 2008. comScore World Metrix reported in January 2009 that
there were 32.1 million Internet users in December 2008,an
increase of 5.9 million users over the same period in 2007.
The Internet & Mobile Association of India (IAMAI), in the January
2009 report “I-Cube 2008,” estimated 32.0 million Internet users in
2007 and 39.8 million in 2008.
Drilling down into the “India Online 2009” JuxtConsult report, there
was a drop of 2.91 million total Internet users from 2008 to 2009.
The researcher attributes the decline to the decreased usage of
Internet cafes,affecting mainly occasional users,who decreased
in number from 14.3 million to 7.9 million from 2008 to 2009.The
report also mentioned that daily Internet users increased to
32 million in 2009.
103314
While India may be in the top 10 countries worldwide by Internet
users,according to comScore figures, it rates lower when looking
at Internet penetration. In a country where the US Census Bureau
puts the population at 1.2 billion, eMarketer’s estimate of
49.7 million users accounts for only 4.3%.
Where Internet user penetration is low, broadband penetration is
not any better. In 2009,eMarketer estimated a total of 8.3 million
broadband households in India.That figure is set to more than
triple to 29.9 million by 2013, but would still represent only 14.1%
of total households.
The June 2009 “Global Media and Entertainment Outlook 2009”
report from PwC placed broadband households in India at 7.8 million
in 2009 and 21.9 million in 2013.
In August 2008,comScore reported on search engine usage in
India for the month of June.It found that India accounted for less
than 2% of total worldwide search queries, with significantly fewer
queries per user;53.1 was the average in India, while 92.5 was the
average worldwide.
097595
Comparative Estimates: Internet Users in India, 2008& 2009 (millions)
comScore World Metrix*, January 2009
eMarketer, February 2009
Internet & Mobile Association of India (IAMAI)**, January 2009
JuxtConsult***, April 2009
2008
32.1
40.7
39.8
35.1
2009
-
49.7
-
38.6
Note: *ages 15+; **used in the past month; ***use at least once per month Source: eMarketer, February 2009; various, as noted, 2009
106776 www.eMarketer.com
Internet Users in India, 2008 & 2009 (millions)2008 2009
Regular users* 35.09 38.57
Occasional users** 14.31 7.92
Total 49.40 46.49
Note: urban and rural locations; *use the Internet at least once per month;**used the Internet in the past year Source: JuxtConsult, "India Online 2009," provided to eMarketer, April 7,
009
103314 www.eMarketer.com
Search Engine Usage in India and Worldwide, June2008
Searchers(thousands)
Searches(millions)
Searchesper
searcher
India 23,416 1,242 53.1
Worldwide 802,267 74,217 92.5
Note: ages 15+; home and work locations; excludes traffic from publiccomputers such as Internet cafes and access from mobile phones or PDAs Source: comScore qSearch 2.0 as cited in press release, August 19, 2008
097595 www.eMarketer.com
8/3/2019 eMarketer India Online
http://slidepdf.com/reader/full/emarketer-india-online 3/15
India Online®
3
Internet Users and Usage
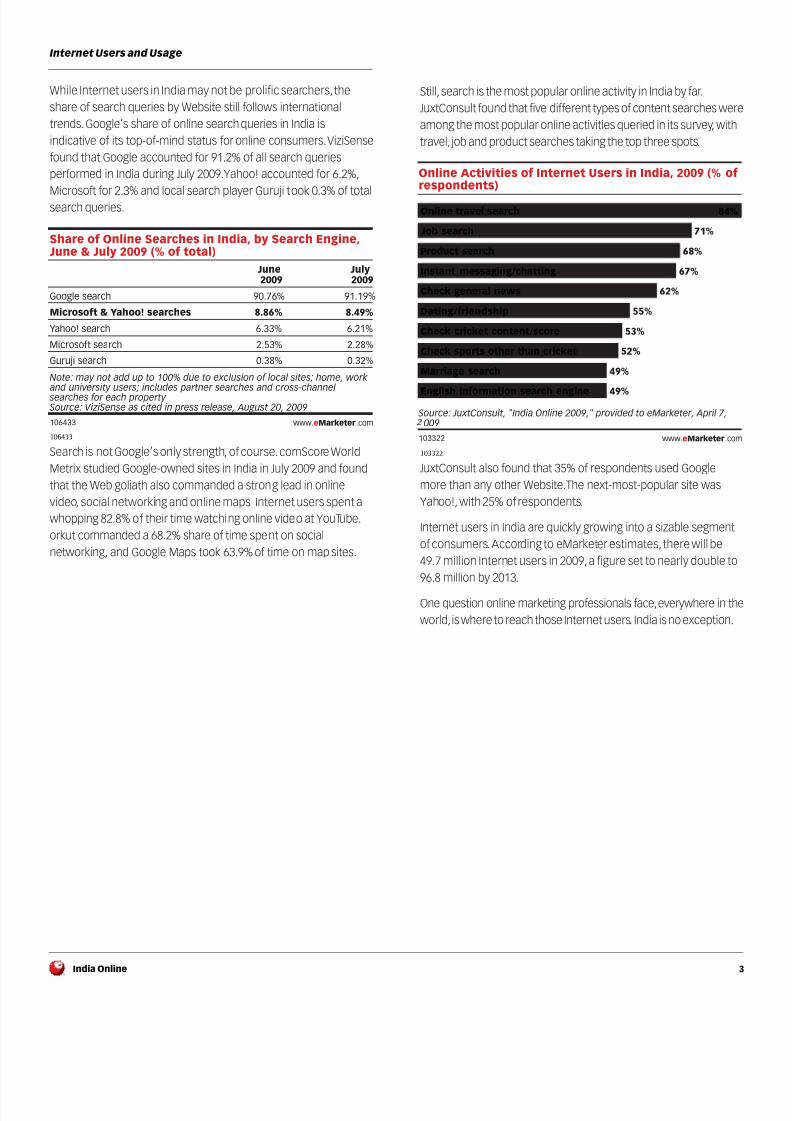
While Internet users in India may not be prolific searchers,the
share of search queries by Website still follows international
trends.Google’s share of online search queries in India is
indicative of its top-of-mind status for online consumers.ViziSense
found that Google accounted for 91.2% of all search queries
performed in India during July 2009.Yahoo! accounted for 6.2%,
Microsoft for 2.3% and local search player Guruji took 0.3% of totalsearch queries.
106433
Search is not Google’s only strength, of course.comScore World
Metrix studied Google-owned sites in India in July 2009 and found
that the Web goliath also commanded a strong lead in online
video, social networking and online maps. Internet users spent a
whopping 82.8% of their time watching online video at YouTube.
orkut commanded a 68.2% share of time spent on social
networking, and Google Maps took 63.9% of time on map sites.
Still, search is the most popular online activity in India by far.
JuxtConsult found that five different types of content searches were
among the most popular online activities queried in its survey, with
travel, job and product searches taking the top three spots.
103322
JuxtConsult also found that 35% of respondents used Google
more than any other Website.The next-most-popular site was
Yahoo!,with 25% of respondents.
Internet users in India are quickly growing into a sizable segment
of consumers.According to eMarketer estimates, there will be
49.7 million Internet users in 2009,a figure set to nearly double to
96.8 million by 2013.
One question online marketing professionals face,everywhere in the
world,is where to reach those Internet users. India is no exception.
Share of Online Searches in India, by Search Engine, June & July 2009 (% of total)
June2009
July2009
Google search 90.76% 91.19%
Microsoft & Yahoo! searches 8.86% 8.49%
Yahoo! search 6.33% 6.21%
Microsoft search 2.53% 2.28%
Guruji search 0.38% 0.32%
Note: may not add up to 100% due to exclusion of local sites; home, work and university users; includes partner searches and cross-channel searches for each property Source: ViziSense as cited in press release, August 20, 2009
106433 www.eMarketer.com
Online Activities of Internet Users in India, 2009 (% of respondents)
Online travel search 84%
Job search 71%
Product search 68%
Instant messaging/chatting 67%
Check general news 62%
Dating/friendship 55%
Check cricket content/score 53%
Check sports other than cricket 52%
Marriage search 49%
English information search engine 49%
Source: JuxtConsult, "India Online 2009," provided to eMarketer, April 7,009
103322 www.eMarketer.com

8/3/2019 eMarketer India Online
http://slidepdf.com/reader/full/emarketer-india-online 4/15
India Online®
4
Social Media
Looking at several research firms’ figures, one
online activity in particular seems widespread:
social media. In the March 2009 “Norton Online
Living Report 2009”Symantec Corp. found that
71% of Internet users surveyed in India had a
profile on a social network.
Universal McCann found that among Internet users who used the
Internet daily or every other day in 2008,66% of respondents in
India had created a social networking profile. In the 2009 follow-up,
the same question yielded an increase to 78%.
107095
For additional information on the above chart, see
Endnote 107095 in the Endnotes section.
comScore found that only 60.3% of Internet users had visited a
social network during December 2008.While lower than the other
researchers’ survey results, it is important to note that there was a51% jump in unique visitors to the category over the same period
in the prior year, outpacing the estimated total Internet user
growth in India by 29 percentage points.
comScore also ranks the most popular social networks in India.
In December 2008,orkut was the leading site with 12.9 million
unique visitors,followed by Facebook (4.0 million) and
BharatStudent.com (3.3 million).
101714
In the associated press release,Will Hodgman,executive vice
president at comScore, stated that several global brands were
taking advantage of the popularity of social networking in India
and increasing their local user base throughout 2008.The top
three social networks in growth were hi5,Facebook and MySpace
which saw increases of 182%,150% and 110%,respectively, over
the previous year.
“While there is certainly room for severalplayers in the social networking space in
India, the sites that have the right blend of having both a strong brand and culturalrelevance will be best positioned for futuregrowth.” —Will Hodgman, executive VP, comScore, in a
statement, February 17, 2009
Comparative Estimates: Online Social Network Usersin India, 2008 (% of Internet users)
Symantec Corp., March 2009Universal McCann, July 2009
comScore World Metrix, February2009
% of Internet
users
71.0%66.0%
60.3%
Age
18+16-54
15+
Usage
Currently have a profileCreated a profile
Active reach ofInternet users
Source: various, as noted, 2009
107095 www.eMarketer.com
Leading Social Networking Sites in India, December2007 & December 2008 (thousands of unique visitors
and % change)
orkut
BharatStudent.com
hi5
ibibo
MySpace sites
PerfSpot.com
BIGADDA
Fropper.com
Total social networking audience inIndia
Total Internet audience in India
December2007
7,123
1,619
1,736
714
1,970
352
293
2,106
515
256
12,795
26,240
December2008
12,869
4,044
3,269
2,012
990
741
513
433
385
248
19,369
32,099
%change
81%
150%
88%
182%
-50%
110%
75%
-79%
-25%
-3%
51%
22%
Note: ages 15+; home and work locations; excludes visits from publiccomputers such as Internet cafes and access from mobile phones andPDAs Source: comScore World Metrix as cited in press release, February 17,
009
101714 www.eMarketer.com

8/3/2019 eMarketer India Online
http://slidepdf.com/reader/full/emarketer-india-online 5/15
India Online®
5
Social Media
JuxtConsult found that from February to March 2009 Google’s
orkut was the fourth-most-used Website in India, adding weight to
the findings from comScore.
103323
JuxtConsult’s findings are based on an active online panel of
50,000 opt-in Internet users in India that were tracked from
February to March 2009.
Google is the dominant portal across several channels of online
entertainment and activities in India.In social networking,orkut takes
the majority with a 68.2% share of time spent on social networks.
107282
Google also has a strong foothold in another Web 2.0 activity in
India,blogging. Blogger grabbed a 47.6% share of time spent on
blogs by Internet users in the country.
In January 2009,Windchimes Communications released
“Research on Social Media in India” and found that reading and
commenting on blogs were the fourth- and sixth-most-popular
activities of Internet users in India.
Research from IndiBlogger, a popular blogging platform in India,
noted that 8% of bloggers on its site posted to their blogs daily,and
47% posted at least weekly.
105158
Most Used Websites According to Internet Users inIndia, 2009 (% of respondents)
Google 35.0%
Yahoo! 25.0%
Gmail 11.0%
orkut 7.0%
Rediff 4.0%
Indiatimes 1.0%
Moneycontrol 0.7%
Hotmail 0.6%
YouTube 0.5%
Sify 0.5%
Source: JuxtConsult, "India Online 2009," provided to eMarketer, April 7,009
103323 www.eMarketer.com
Share of Time Spent on Google-Owned Sites Among
Internet Users in India, by Category, July 2009Google
site% share
of total timespent in
site category
Search* Google sites 88.4%
Multimedia YouTube 82.8%
Social networking orkut 68.2%
Maps Google Maps 63.9%
Blogs Blogger 47.6%
E-mail Gmail 46.8%
Photos Picasa Network 16.2%
Note: ages 15+; home and work locations; *based on share of searchesconducted
Source: comScore World Metrix and comScore qSearch as cited in pressrelease, September 14, 2009
107282 www.eMarketer.com
Blogs in India, by Frequency of Posting, May 2009 (%of bloggers)
Daily 8%
At least every other day 16%
At least every three days 24%
At least weekly 47%
At least monthly 88%
Note: n=7,895 self-registered blogs on IndiBlogger Source: IndiBlogger, "State of the Indian Blogosphere," May 19, 2009
105158 www.eMarketer.com
8/3/2019 eMarketer India Online
http://slidepdf.com/reader/full/emarketer-india-online 6/15
India Online®
6
E-Commerce
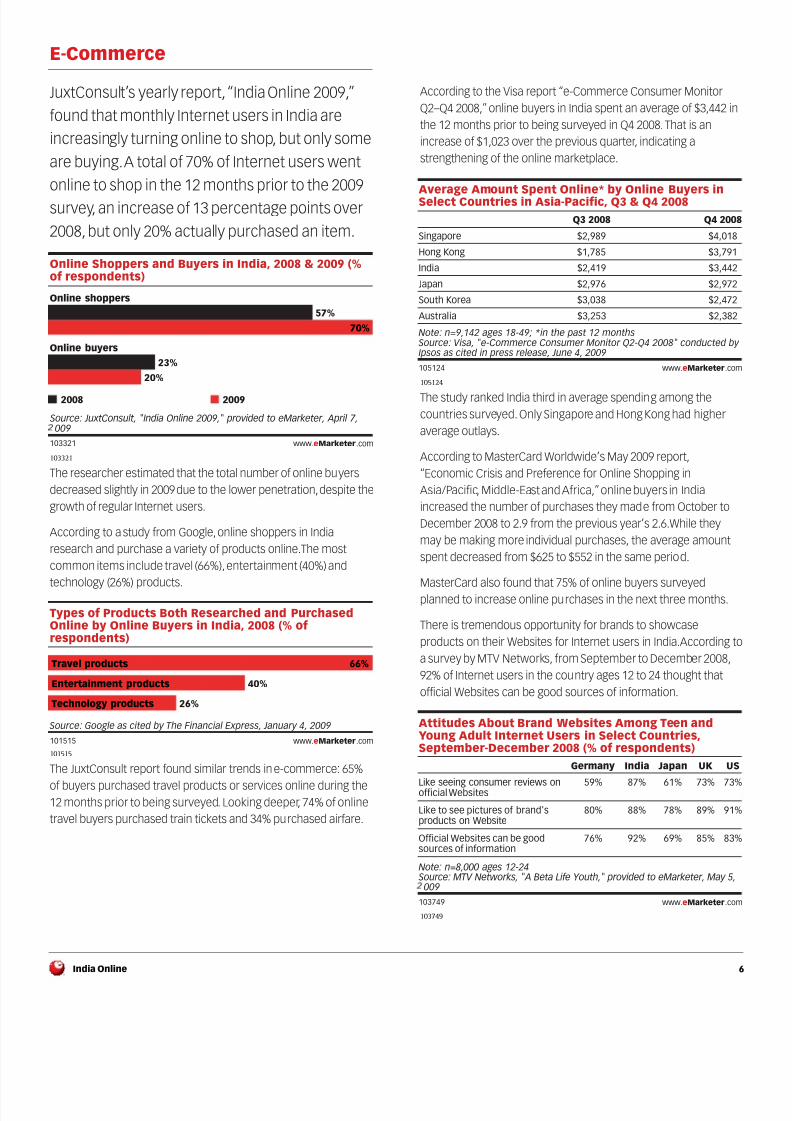
JuxtConsult’s yearly report,“India Online 2009,”
found that monthly Internet users in India are
increasingly turning online to shop, but only some
are buying.A total of 70% of Internet users went
online to shop in the 12 months prior to the 2009
survey, an increase of 13 percentage points over
2008, but only 20% actually purchased an item.
103321
The researcher estimated that the total number of online buyers
decreased slightly in 2009 due to the lower penetration,despite the
growth of regular Internet users.
According to a study from Google,online shoppers in India
research and purchase a variety of products online.The most
common items include travel (66%),entertainment (40%) and
technology (26%) products.
101515
The JuxtConsult report found similar trends in e-commerce: 65%
of buyers purchased travel products or services online during the12 months prior to being surveyed. Looking deeper, 74% of online
travel buyers purchased train tickets and 34% purchased airfare.
According to the Visa report “e-Commerce Consumer Monitor
Q2–Q4 2008,”online buyers in India spent an average of $3,442 in
the 12 months prior to being surveyed in Q4 2008.That is an
increase of $1,023 over the previous quarter, indicating a
strengthening of the online marketplace.
105124
The study ranked India third in average spending among the
countries surveyed.Only Singapore and Hong Kong had higher
average outlays.
According to MasterCard Worldwide’s May 2009 report,
“Economic Crisis and Preference for Online Shopping in
Asia/Pacific, Middle-East and Africa,”online buyers in India
increased the number of purchases they made from October to
December 2008 to 2.9 from the previous year’s 2.6.While they
may be making more individual purchases, the average amount
spent decreased from $625 to $552 in the same period.
MasterCard also found that 75% of online buyers surveyed
planned to increase online purchases in the next three months.
There is tremendous opportunity for brands to showcase
products on their Websites for Internet users in India.According to
a survey by MTV Networks, from September to December 2008,
92% of Internet users in the country ages 12 to 24 thought that
official Websites can be good sources of information.
103749
Online Shoppers and Buyers in India, 2008 & 2009 (%of respondents)
Online shoppers
57%
70%
Online buyers
23%
20%
2008 2009
Source: JuxtConsult, "India Online 2009," provided to eMarketer, April 7,009
103321 www.eMarketer.com
Types of Products Both Researched and PurchasedOnline by Online Buyers in India, 2008 (% of respondents)
Travel products 66%
Entertainment products 40%
Technology products 26%
Source: Google as cited by The Financial Express, January 4, 2009
101515 www.eMarketer.com
Average Amount Spent Online* by Online Buyers inSelect Countries in Asia-Pacific, Q3 & Q4 2008
Q3 2008 Q4 2008
Singapore $2,989 $4,018
Hong Kong $1,785 $3,791
India $2,419 $3,442
Japan $2,976 $2,972
South Korea $3,038 $2,472
Australia $3,253 $2,382
Note: n=9,142 ages 18-49; *in the past 12 months Source: Visa, "e-Commerce Consumer Monitor Q2-Q4 2008" conducted by Ipsos as cited in press release, June 4, 2009
105124 www.eMarketer.com
Attitudes About Brand Websites Among Teen andYoung Adult Internet Users in Select Countries,September-December 2008 (% of respondents)
Like seeing consumer reviews onofficial Websites
Like to see pictures of brand'sproducts on Website
Official Websites can be goodsources of information
Germany
59%
80%
76%
India
87%
88%
92%
Japan
61%
78%
69%
UK
73%
89%
85%
US
73%
91%
83%
Note: n=8,000 ages 12-24 Source: MTV Networks, "A Beta Life Youth," provided to eMarketer, May 5,
009
103749 www.eMarketer.com
8/3/2019 eMarketer India Online
http://slidepdf.com/reader/full/emarketer-india-online 7/15
India Online®
7
E-Commerce
Out of all the countries surveyed, Internet users in India were the
most receptive toward consumer reviews and pictures of brand’s
products on their Websites, as well.
Online shoppers in India are also well-informed,especially when it
comes to big-ticket purchases.J.D. Power Asia Pacific reported in
late September 2009 that online buyers were researching
automobiles online before visiting a dealership.The survey found
that in 2009,34% of new-vehicle shoppers researched their
purchases online and 74% knew the exact model that they wanted
to buy.All that research paid off, as 80% of prospective buyers who
visited a dealership walked out with a new car.
While automobile sales cannot be applied to all categories of
online retail, these findings are telling. Providing information to an
engaged, well-informed population increases a brand’s chances
of persuading shoppers to choose it over potential rivals.
B2B e-commerce also has a strong foothold in India.The IAMAI’s
report,“Online B2B Marketplaces,” found that total spending on
B2B e-commerce would reach $89 billion by December 2009.The
report found that the top three online B2B marketplaces were
IndiaMART,Tradeindia and Alibaba.com.
Demonstrating the importance of this growing market,
Alibaba.com, the world’s largest B2B e-commerce company, has
increased its attention on India. In an interview with The Hindu
Business Line on September 16,2009,David Wei,CEO and
executive director at Alibaba Ltd., indicated that Alibaba.com was
currently looking for a local partner to grow its business in India
through a joint venture. Mr.Wei considers India,China, the US and
Japan to be the four countries that his company cannot ignore,
and hypothesizes that India will overtake the US in sheer market
size in the next three years.
He also confirmed that the biggest challenge to e-commerce in
India is the absence of widespread broadband connections. Even
with a lack of broadband access,Alibaba.com reached the
milestone of 1 million members in June 2009.
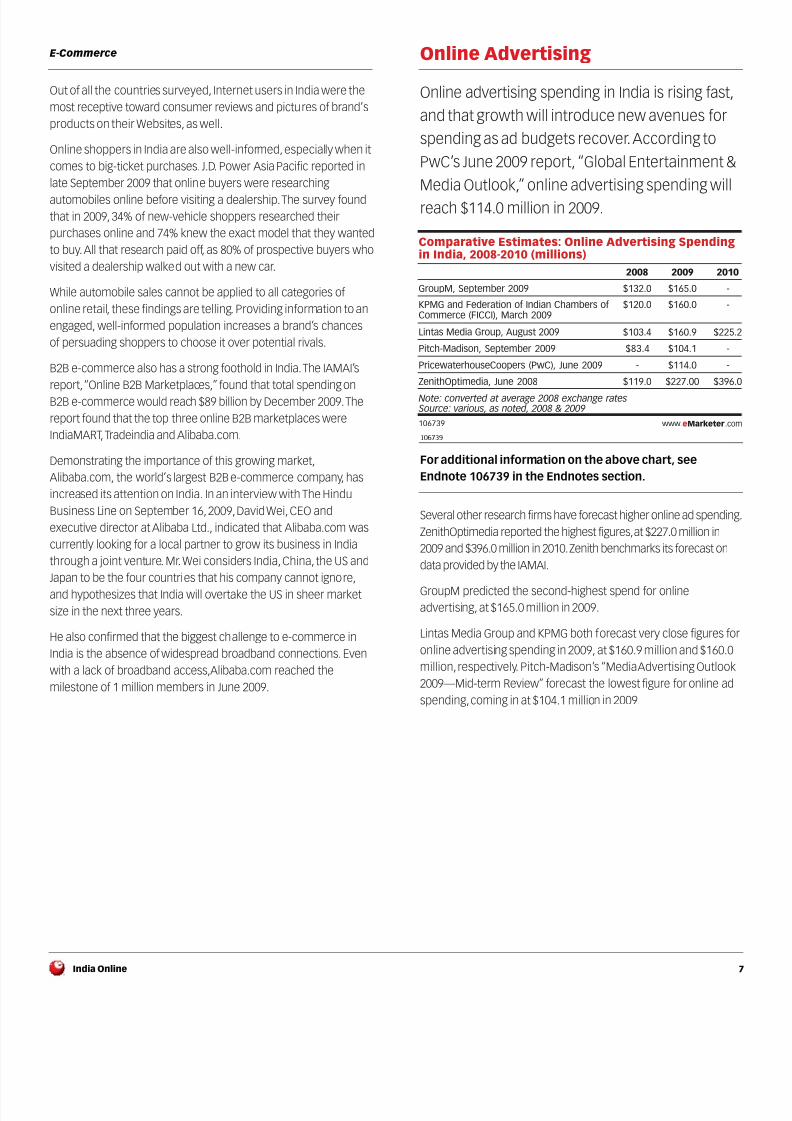
Online Advertising
Online advertising spending in India is rising fast,
and that growth will introduce new avenues for
spending as ad budgets recover.According to
PwC’s June 2009 report, “Global Entertainment &
Media Outlook,” online advertising spending will
reach $114.0 million in 2009.
106739
For additional information on the above chart, see
Endnote 106739 in the Endnotes section.
Several other research firms have forecast higher online ad spending
ZenithOptimedia reported the highest figures,at $227.0 million in
2009 and $396.0 million in 2010.Zenith benchmarks its forecast on
data provided by the IAMAI.
GroupM predicted the second-highest spend for onlineadvertising, at $165.0 million in 2009.
Lintas Media Group and KPMG both forecast very close figures for
online advertising spending in 2009, at $160.9 million and $160.0
million,respectively. Pitch-Madison’s “Media Advertising Outlook
2009—Mid-term Review” forecast the lowest figure for online ad
spending,coming in at $104.1 million in 2009.
Comparative Estimates: Online Advertising Spendingin India, 2008-2010 (millions)
GroupM, September 2009
KPMG and Federation of Indian Chambers ofCommerce (FICCI), March 2009
Lintas Media Group, August 2009
Pitch-Madison, September 2009
PricewaterhouseCoopers (PwC), June 2009
ZenithOptimedia, June 2008
2008
$132.0
$120.0
$103.4
$83.4
-
$119.0
2009
$165.0
$160.0
$160.9
$104.1
$114.0
$227.00
2010
-
-
$225.2
-
-
$396.0
Note: converted at average 2008 exchange rates Source: various, as noted, 2008 & 2009
106739 www.eMarketer.com
8/3/2019 eMarketer India Online
http://slidepdf.com/reader/full/emarketer-india-online 8/15
India Online®
8
Online Advertising
By far the largest growth area in advertising is found on the
Internet.All the researchers noted above have forecast
double-digit growth in both 2009 and 2010,with ZenithOptimedia
predicting a whopping 72.4% climb in 2009.
106775
For additional information on the above chart, see
Endnote 106775 in the Endnotes section.
Online advertising growth rates for 2009 vary greatly, with the
next-highest rate predicted by Lintas Media Group (56%), followed
by KPMG and the Federation of Indian Chambers of Commerce
(FICCI) (35.5%).
GroupM and Pitch-Madison agree on the lowest rate (25.0%) for
2009.Of the five,only three have published growth rates for 2010.
Again,Zenith leads the pack (70%),followed by Lintas (40.0%) and
GroupM (35.1%).
In September 2009,The Wall Street Journal interviewed Sir Martin
Sorrell, CEO of the WPP Group, which includes GroupM.Askedwhich markets will be the first to see an ad recovery,Sir Martin
said he expects China and India to lead the way.
“I would expect to see a recovery first inChina and India. In India, they are arguing
whether it will be 6% or 7% growth, and wewould give our eye to be flat.Flat in the U.S.and Western Europe is the new up.” —Sir Martin Sorrell,CEO,WPP Group, in an interview with
The Wall Street Journal,September 22, 2009
GroupM’s growth rate projections support their Sir Martin’s
prediction, as they are the only firm that forecast stronger growth
in 2010 than 2009. In addition,the firm’s September report,
“Interaction 2009,”projects that online advertising will play an
important part in the global ad recovery for all media, with search,
mobile and display all showing strong signs of growth.
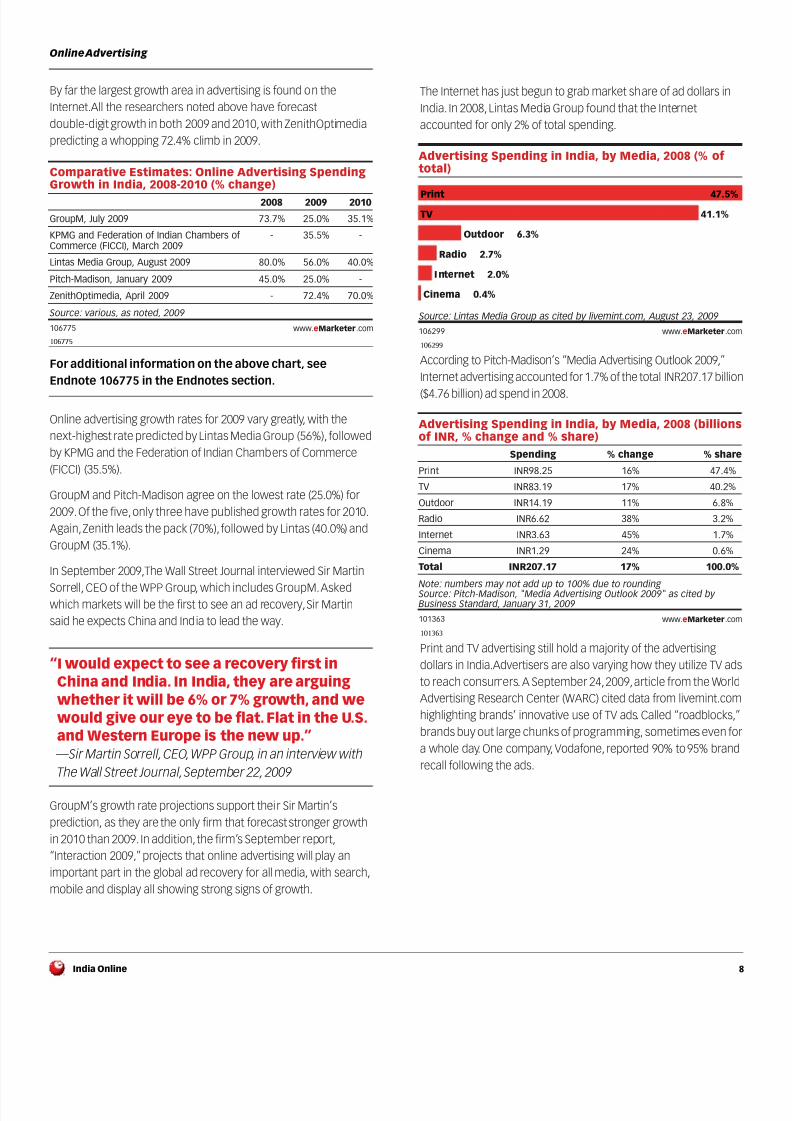
The Internet has just begun to grab market share of ad dollars in
India. In 2008,Lintas Media Group found that the Internet
accounted for only 2% of total spending.
106299
According to Pitch-Madison’s “Media Advertising Outlook 2009,”
Internet advertising accounted for 1.7% of the total INR207.17 billion
($4.76 billion) ad spend in 2008.
101363
Print and TV advertising still hold a majority of the advertising
dollars in India.Advertisers are also varying how they utilize TV ads
to reach consumers.A September 24,2009,article from the World
Advertising Research Center (WARC) cited data from livemint.com
highlighting brands’ innovative use of TV ads. Called “roadblocks,”
brands buy out large chunks of programming, sometimes even for
a whole day. One company,Vodafone, reported 90% to 95% brand
recall following the ads.
Comparative Estimates: Online Advertising SpendingGrowth in India, 2008-2010 (% change)
GroupM, July 2009
KPMG and Federation of Indian Chambers ofCommerce (FICCI), March 2009
Lintas Media Group, August 2009
Pitch-Madison, January 2009
ZenithOptimedia, April 2009
2008
73.7%
-
80.0%
45.0%
-
2009
25.0%
35.5%
56.0%
25.0%
72.4%
2010
35.1%
-
40.0%
-
70.0%
Source: various, as noted, 2009
106775 www.eMarketer.com
Advertising Spending in India, by Media, 2008 (% of total)
Print 47.5%
TV 41.1%
Outdoor 6.3%
Radio 2.7%
Internet 2.0%
Cinema 0.4%
Source: Lintas Media Group as cited by livemint.com, August 23, 2009
106299 www.eMarketer.com
Advertising Spending in India, by Media, 2008 (billionsof INR, % change and % share)
Spending % change % share
Print INR98.25 16% 47.4%
TV INR83.19 17% 40.2%
Outdoor INR14.19 11% 6.8%
Radio INR6.62 38% 3.2%
Internet INR3.63 45% 1.7%
Cinema INR1.29 24% 0.6%
Total INR207.17 17% 100.0%
Note: numbers may not add up to 100% due to rounding Source: Pitch-Madison, "Media Advertising Outlook 2009" as cited by Business Standard, January 31, 2009
101363 www.eMarketer.com

8/3/2019 eMarketer India Online
http://slidepdf.com/reader/full/emarketer-india-online 9/15
India Online®
9
Online Advertising
TV and print advertising may grab the majority of the market,but
online content still has the power to influence Internet users in
India.The Nielsen Company’s July 2009 “Online Global Consumer
Study” found that online advertising has a profound impact on
Internet users.Three of the top 10 most trusted types of advertising
were brand Websites (78% trusted), consumer opinions posted
online (74% trusted),and permission-based e-mails (65% trusted).
106384
As Internet penetration and online access continue to expand in
India,online advertising will become an important component of
any marketing initiative.
Mobile
At least one-third of the total population of India is
forecast to have a mobile phone by the end of
2009, according to three different research firms.
eMarketer’s own estimate for 2008 was a bit
more conservative at 290 million active SIM cards
107097
For additional information on the above chart, see
Endnote 107097 in the Endnotes section.
Frost & Sullivan’s estimate of 493 million was the highest for
mobile subscribers in 2009, and the firm forecast growth of
190 million to 683 million in 2010. Gartner’s June 2009 figure was
the second-highest, at 452 million,and the researcher projected a
total of 771 million for 2013. Citi Investment Research pegged the
number of subscribers at 448 million, and Informa Telecoms &
Media came in with a figure of 433 million.
In a press release from January 2009, Informa analyst Nick
Jotischky described the growth of mobile subscriptions in India.He
stated that India added more subscribers during 2008 than any
other country, including China.
“India became the world’s largest market interms of net additions in 2008 for the firsttime with 102 million new mobilesubscriptions over the 12-month period,ahead of China.” —Nick Jotiskchy, principal analyst
for emerging markets, Informa Telecoms & Media, in a
statement, January 27, 2009
Types of Advertising Trusted by Internet Users inIndia, March-April 2009 (% of respondents)
Recommendations from people known 93%
Editorial content 87%
Brand Websites 78%
Newspaper 77%
TV 76%
Consumer opinions posted online 74%
Magazines 73%
Brand sponsorships 72%
Radio 66%
E-mails I signed up for 65%
Billboards/outdoor 62%
Ads before movies 61%
Search engine result ads 50%
Online video ads 50%
Banner ads 48%
Text ads on mobile phones 43%
Source: The Nielsen Company, "Online Global Consumer Study" as cited inress release, July 27, 2009
106384 www.eMarketer.com
Comparative Estimates: Mobile Phone Subscribers inIndia, 2007-2010 (millions)
Citi Investment Research, December 2008
eMarketer*, June 2008
Frost & Sullivan, September 2009
Gartner, June 2009
Informa Telecoms & Media, January 2009
International TelecommunicationUnion (ITU), June 2009
iSuppli Corporation, November 2008
Research on Asia Group, Inc. (ROA),August 2009
Telecom Regulatory Authority of India(TRAI)**, January 2009
2007
228.0
-
-
-
218.7
233.6
233.6
-
-
2008
339.0
290.0
-
-
321.3
346.9
319.9
341.3
346.9
2009
448.0
-
493.0
452.0
433.0
-
-
-
-
2010
545.0
-
683.0
-
-
-
-
-
-
Note: *active SIM cards; **data is for Q4 Source: eMarketer, June 2008; various, as noted, 2008 & 2009
107097 www.eMarketer.com
8/3/2019 eMarketer India Online
http://slidepdf.com/reader/full/emarketer-india-online 10/15
India Online®
10
Mobile
eMarketer predicted in June 2008 that mobile subscribers in India
would reach a total of 560.0 million in 2012,a compound annual
growth rate (CAGR) of 17.9% over the period.Both Citi and Informa
showed a CAGR of over 25% in mobile phone subscribers from 2007
to 2009,while Gartner predicted a CAGR of 14.3% from 2009 to 2013.
Madhusudan Gupta,senior research analyst at Gartner,attributed
the double-digit growth rates to the fact that operators are focusing
on expanding into the rural areas of India.He added that another
factor contributing to growth across both rural and urban areas is
the increasing availability of value-added and mobile-data-based
services,as users start to diversify their mobile content activities
past voice calling.
There are nearly 10 times as many mobile phone users in India as
there are Internet users.eMarketer estimated in June 2008 that
25.3% of the entire population in India had a mobile phone,a figure
that would increase to 45.9% by 2012.Gartner’s June 2009 report
also found relatively high penetration,at 38.7% in 2009 and 63.5% in
2013.The International Telecommunication Union (ITU) reported inJune 2009,based on operator and local regulator data, that 29.2% of
the population in India had a mobile phone by the end of 2008.
095365
Growth of mobile Internet users is far surpassing that of fixed
Internet users. eMarketer estimated that in 2008 there were more
than twice as many mobile Internet users (106 million) as fixed
Internet users (40.7 million).By 2012,mobile users (298 million) are
expected to triple fixed users (85.8 million).
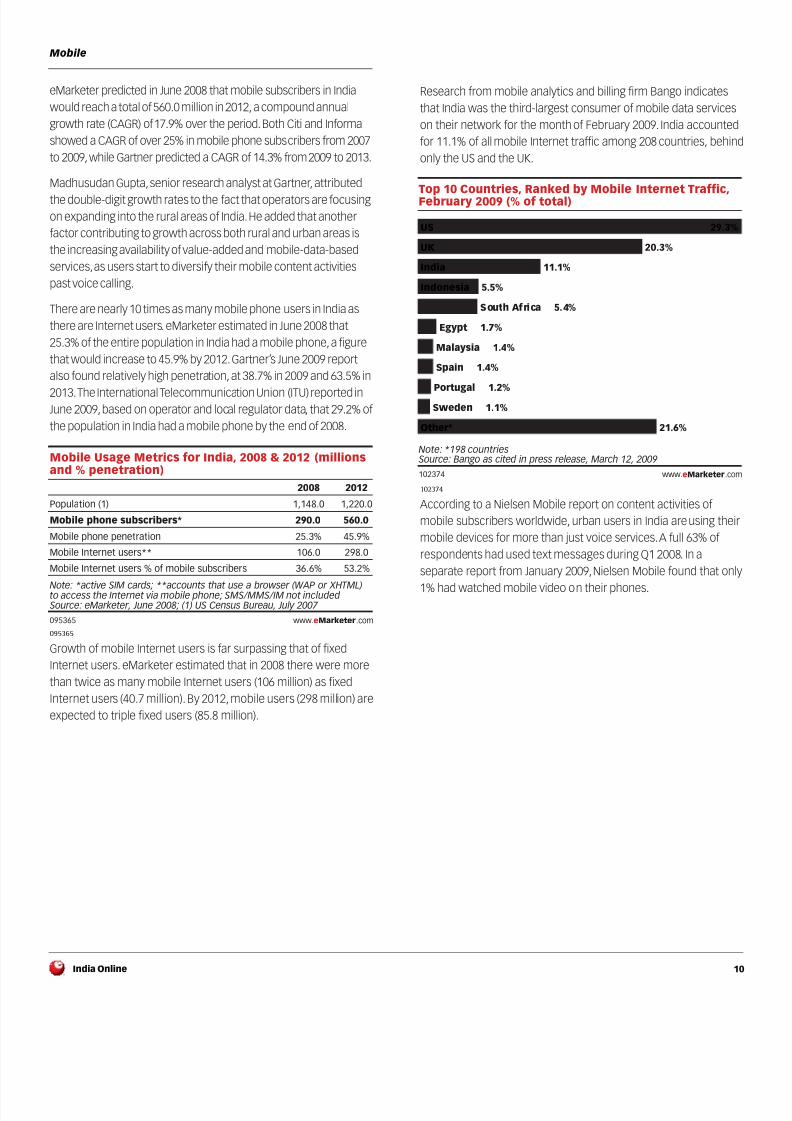
Research from mobile analytics and billing firm Bango indicates
that India was the third-largest consumer of mobile data services
on their network for the month of February 2009. India accounted
for 11.1% of all mobile Internet traffic among 208 countries, behind
only the US and the UK.
102374
According to a Nielsen Mobile report on content activities of
mobile subscribers worldwide, urban users in India are using their
mobile devices for more than just voice services.A full 63% of
respondents had used text messages during Q1 2008. In a
separate report from January 2009,Nielsen Mobile found that only
1% had watched mobile video on their phones.
Mobile Usage Metrics for India, 2008 & 2012 (millionsand % penetration)
2008 2012
Population (1) 1,148.0 1,220.0
Mobile phone subscribers* 290.0 560.0
Mobile phone penetration 25.3% 45.9%
Mobile Internet users** 106.0 298.0
Mobile Internet users % of mobile subscribers 36.6% 53.2%
Note: *active SIM cards; **accounts that use a browser (WAP or XHTML)to access the Internet via mobile phone; SMS/MMS/IM not included Source: eMarketer, June 2008; (1) US Census Bureau, July 2007
095365 www.eMarketer.com
Top 10 Countries, Ranked by Mobile Internet Traffic,February 2009 (% of total)
US 29.3%
UK 20.3%
India 11.1%
Indonesia 5.5%
South Africa 5.4%
Egypt 1.7%
Malaysia 1.4%
Spain 1.4%
Portugal 1.2%
Sweden 1.1%
Other* 21.6%
Note: *198 countries Source: Bango as cited in press release, March 12, 2009
102374 www.eMarketer.com

8/3/2019 eMarketer India Online
http://slidepdf.com/reader/full/emarketer-india-online 11/15
India Online®
11
Mobile
While many in India may not view their phones as an entertainment
device,they are finding other, more practical uses.According to
Juniper Research,mobile users on the Indian subcontinent
accounted for 7% of mobile banking users worldwide.
100943
Mobile consumers are also viewing plenty of ads.According to
AdMob’s monthly “Mobile Metrics Report,” India accounted for
6.1% of all banner and text ads served by the AdMob network in
June 2009.That was over half a billion ads served in just one month.
According to PwC, mobile advertising spending in India was below
$500,000 in 2009.This is expected to increase,however, as mobile
TV subscriptions and 3G access spread. By 2013,PwC has forecast
that mobile ad spending will reach $29 million.
Endnotes
Endnote numbers correspond to the unique
six-digit identifier in the lower left-hand corner
of each chart.The charts from the report are
repeated before their respective endnotes.
106739
106739
Extended Note: GroupM measurement includes display, paid
search and mobile data. ZenithOptimedia includes classified,
display and search data.
Citation: GroupM,September, 2009;KPMG and Federation of
Indian Chambers of Commerce (FICCI),"Media and Entertainment
Industry Report 2009" as cited by The Indusview Advisors,March
2009;Lintas Media Group as cited by livemint.com,August 23,
2009;Pitch-Madison,"Media Advertising Outlook 2009--Mid-term
Review" as cited by livemint.com, September 2, 2009;PricewaterhouseCoopers (PwC) and Wilkofsky Gruen Associates,
"Global Entertainment and Media Outlook: 2009-2013," June 16,
2009;ZenithOptimedia as cited by agencyfaqs!,June 18,2008;
eMarketer calculations,June 2008
Mobile Banking Users* Worldwide, by Region, 2011 (%of total)
Far East and China 41%
Western Europe 22%
North America 12%
Middle East and Africa 8%
Indian subcontinent 7%
Asia-Pacific** 5%
Eastern Europe 3%
Latin America 2%
Note: *transactional users who also have traditional branch-based services, excluding users who cannot be reached with traditional services;
**excludes Far East and China Source: Juniper Research, "Mobile Banking: Strategies, Applications andMarkets 2008-2013" as cited in "Banking on the Mobile," January 14, 2009
100943 www.eMarketer.com
Comparative Estimates: Online Advertising Spendingin India, 2008-2010 (millions)
GroupM, September 2009
KPMG and Federation of Indian Chambers ofCommerce (FICCI), March 2009
Lintas Media Group, August 2009
Pitch-Madison, September 2009
PricewaterhouseCoopers (PwC), June 2009
ZenithOptimedia, June 2008
2008
$132.0
$120.0
$103.4
$83.4
-
$119.0
2009
$165.0
$160.0
$160.9
$104.1
$114.0
$227.00
2010
-
-
$225.2
-
-
$396.0
Note: converted at average 2008 exchange rates Source: various, as noted, 2008 & 2009
106739 www.eMarketer.com

8/3/2019 eMarketer India Online
http://slidepdf.com/reader/full/emarketer-india-online 12/15
India Online®
12
Endnotes
106775
106775
Citation: GroupM,July 2009;KPMG and Federation of Indian
Chambers of Commerce (FICCI),"Media and Entertainment
Industry Report 2009" as cited by The Indusview Advisors,March
2009;Lintas Media Group as cited by livemint.com,August 23,
2009;Pitch-Madison, "Media Advertising Outlook 2009," January
2009;ZenithOptimedia,December 2008 as cited by JPMorgan,"Advertising & Marketing Services - Advertising 101:A Primer with
a Focus on Macro" as cited by Adweek,April 2, 2009
106776
106776
Extended Note: comScore includes home and work locations;
excludes traffic from public locations such as Internet cafes and
access from mobile phones and PDAs. eMarketer defines an
Internet user is a person of any age who uses the Internet from
any location at least once per month
Citation: comScore World Metrix as cited in press release,January
23, 2009; International Telecommunication Union, September 2009;
Internet & Mobile Association of India (IAMAI) and Indian Market
Research Bureau (IMRB) International, "Internet in India (I-Cube)
2008" as cited in press release, January 12, 2009;JuxtConsult,"India
Online 2009," provided to eMarketer,April 7,2009
107095
107095
Extended Note: comScore includes home and work locations;
excludes traffic from public locations such as Internet cafes and
access from mobile phones and PDAs. Universal McCann
measure users with daily or every other day Internet access.
Citation: comScore World Metrix as cited in press release, January
23, 2009; International Telecommunication Union, September 2009
Internet & Mobile Association of India (IAMAI) and Indian Market
Research Bureau (IMRB) International, "Internet in India (I-Cube)
2008" as cited in press release, January 12, 2009;JuxtConsult,"India
Online 2009," provided to eMarketer,April 7,2009
Comparative Estimates: Online Advertising SpendingGrowth in India, 2008-2010 (% change)
GroupM, July 2009
KPMG and Federation of Indian Chambers of
Commerce (FICCI), March 2009Lintas Media Group, August 2009
Pitch-Madison, January 2009
ZenithOptimedia, April 2009
2008
73.7%
-
80.0%
45.0%
-
2009
25.0%
35.5%
56.0%
25.0%
72.4%
2010
35.1%
-
40.0%
-
70.0%
Source: various, as noted, 2009
106775 www.eMarketer.com
Comparative Estimates: Internet Users in India, 2008& 2009 (millions)
comScore World Metrix*, January 2009
eMarketer, February 2009
Internet & Mobile Association of India (IAMAI)**, January 2009
JuxtConsult***, April 2009
2008
32.1
40.7
39.8
35.1
2009
-
49.7
-
38.6Note: *ages 15+; **used in the past month; ***use at least once per month Source: eMarketer, February 2009; various, as noted, 2009
106776 www.eMarketer.com
Comparative Estimates: Online Social Network Usersin India, 2008 (% of Internet users)
Symantec Corp., March 2009
Universal McCann, July 2009
comScore World Metrix, February2009
% of Internet
users
71.0%
66.0%
60.3%
Age
18+
16-54
15+
Usage
Currently have a profile
Created a profile
Active reach ofInternet users
Source: various, as noted, 2009
107095 www.eMarketer.com

8/3/2019 eMarketer India Online
http://slidepdf.com/reader/full/emarketer-india-online 13/15
India Online®
13
Endnotes
107097
107097
Citation: Citi Investment Research,"Deteriorating '09 Handset
Industry Outlook," provided to eMarketer, December 16, 2008;
Frost & Sullivan as cited in press release, September 21, 2009;
Gartner, "Forecast:Mobile Services,Asia/Pacific, 2004-2013" as
cited in press release, June 18, 2009; Informa Telecoms & Media,
"World Cellular Information Service" as cited in press release,
January 27, 2009; International Telecommunication Union (ITU),
"World Telecommunication Indicators Database," June 2009;
iSuppli Corporation, "CE and Mobile Telecom Driving India's
Electronics Industry" as cited in press release, November 17,2008;
Research on Asia Group, Inc. (ROA), "Indian Mobile Market
Dynamics and Forecast" as cited in press release,August 31, 2009;Telecom Regulatory Authority of India (TRAI) as cited in press
releases,February 2008-April 2009
Comparative Estimates: Mobile Phone Subscribers inIndia, 2007-2010 (millions)
Citi Investment Research, December 2008
eMarketer*, June 2008
Frost & Sullivan, September 2009
Gartner, June 2009
Informa Telecoms & Media, January 2009
International TelecommunicationUnion (ITU), June 2009
iSuppli Corporation, November 2008
Research on Asia Group, Inc. (ROA),August 2009
Telecom Regulatory Authority of India(TRAI)**, January 2009
2007
228.0
-
-
-
218.7
233.6
233.6
-
-
2008
339.0
290.0
-
-
321.3
346.9
319.9
341.3
346.9
2009
448.0
-
493.0
452.0
433.0
-
-
-
-
2010
545.0
-
683.0
-
-
-
-
-
-
Note: *active SIM cards; **data is for Q4 Source: eMarketer, June 2008; various, as noted, 2008 & 2009
107097 www.eMarketer.com
8/3/2019 eMarketer India Online
http://slidepdf.com/reader/full/emarketer-india-online 14/15
India Online®
14
Related Information and Links
Related Links
Citi Investment Research
https://www.citigroupcib.com/invest_research
comScore Inc.
http://www.comscore.com
Gartnerhttp://www.gartner.com
http://www.google.com
GroupM
http://www.groupm.com
Federation of Indian Chambers of Commerce (FICCI)
http://www.ficci.com
Informa Telecoms & Media
http://www.informa.com
International Telecommunication Union (ITU)
http://www.itu.int
The Internet & Mobile Association of India (IAMAI)
http://www.iamai.com
JuxtConsult
http://www.juxtconsult.com
KPMG
http://www.kpmg.com
Lintas Media Group
http://www.lintasmedia.in
The Nielsen Company
http://www.nielsen.com
PricewaterhouseCoopers (PwC)
http://www.pwc.com
Symantec Corp.
http://www.symantec.com
Universal McCann
http://www.universalmccann.com
Visahttp://www.corporate.visa.com
ViziSense
http://www.vizisense.com
The Wall Street Journal
http://www.wsj.com
ZenithOptimedia
http://www.zenithoptimedia.com
Contact
eMarketer, Inc. Toll-Free: 800-405-0844
75 Broad Street Outside the US: 212-763-6010
32nd floor Fax:212-763-6020
New York,NY 10004 [email protected]
Report ContributorsSusan Reiter Managing Editor
Joanne DiCamillo Production Artist
Mike Froggatt Researcher and Writer
Dana Hill Production Artist
Jared Jenks Numbers Editor
James Ku Data Entry Associateand Production Artist
Nicole Perrin Senior Editor
Hilary Rengert Senior Researcher
Allison Smith Director of Charts

8/3/2019 eMarketer India Online
http://slidepdf.com/reader/full/emarketer-india-online 15/15
India Online®
15
About eMarketer
eMarketer is a business service unlike any
other.eMarketer does not conduct research. It
aggregates and analyzes all the available
research, surveys and data on a given topic. So
you see far more than a single source could everprovide.eMarketer doesn’t deliver one point of
view, it gives you thousands. Providing overviews
and insights available nowhere else,eMarketer
reports on the reports,analyzes the analysts and
dissects the data.
A Trusted Resource
eMarketer serves as a trusted, third-party resource,cutting
through the clutter and hype–helping businesses make sense of
the numbers and trends. eMarketer's products and services help
companies make better, more informed business decisions by:
■ Streamlining research sources and reducing costs
■ Eliminating critical data gaps
■Providing an objective, bird’s eye view of the entire landscape
■Better deploying and sharing information across the company
■Building solid business cases backed up by hard data
■Reducing business risk
■ Saving valuable time
To learn more about subscriptions to eMarketer ,
call 800-405-0844 (outside the U.S. and Canada,
call 001-212-763-6010), or e-mail [email protected].
Related Documents