• t l US Army Corps of Engineers ENGINEERING AND DESIGN Design of Beach Fills ENGINEER MANUAL I I EM 1110-2-3301 31 May 1995

Welcome message from author
This document is posted to help you gain knowledge. Please leave a comment to let me know what you think about it! Share it to your friends and learn new things together.
Transcript

•
t
l
US Army Corps of Engineers
ENGINEERING AND DESIGN
Design of Beach Fills
ENGINEER MANUAL
I I
EM 1110-2-3301 31 May 1995

CECW-EH-D
Manual No. 1110-2-3301
DEPARTMENT OF THE ARMY U.S. Army Corps of Engineers. Washington, DC 20314-1000
Engineering and Design DESIGN OF BEACH FILLS
EM 1110-2-3301
31 May 1995
1. Purpose. This manual provides guidance for the design of beach fill projects intended to protect coastal development from coastal stonn waves and erosion.
2. Appllcabllty. This manual applies to HQUSACE elements, major subordinate commands, districts, laboratories, and field operating activities having responsibility for design, construction, and operation of civil works projects within the nearshore coastal region.
3. General. This manual discusses the data needed, identifies data sources, and discusses parameters and methods applicable to beach fill design procedures. The importance of borrow material characteristics and procedures for adjusting the fill quantity to account for differences between natural beach material and borrow material are presented. Monitoring needs prior to, during, and following construction are also discussed.
FOR THE COMMANDER:
~~ D. CRAI Corps of gineers
Chief of Staff

DEPARTMENT OF THE ARMY U.S. Army Corps of Engineers Washington, DC 20314-1000
EM 1110-2-3301
CECW-EH-D
Manual No. 1110-2-3301 31 May 1995
Engineering and Design DESIGN OF BEACH FILLS
Table of Contents
Subject Paragraph Page Subject Paragraph Page
Chapter 1 Introduction Purpose and Scope . . . . . . . . . . . . . . . . . 1-1 Applicability ..................... 1-2 Definition ....................... 1-3 References . . . . . . . . . . . . . . . . . . . . . . 1-4 Bibliography ..................... 1-5 Background . . . . . . . . . . . . . . . . . . . . . . 1-6
Chapter 2 Site Characterization Site Characterization Requirements . . . . . 2-1 Geomorphology ................... 2-2 Historical Shoreline Change .......... 2-3 Sediment Characteristics . . . . . . . . . . . . . 2-4 Hydrodynamics . . . . . . . . . . . . . . . . . . . 2-5 Coastal Processes . . . . . . . . . . . . . . . . . . 2-6 Sediment Budget . . . . . . . . . . . . . . . . . . 2-7 Existing Structures . . . . . . . . . . . . . . . . . 2-8
Chapter 3 Borrow Site Characteristics Borrow Source Types . . . . . . . . . . . . . . . 3-1 Exploration and Identification
of Borrow Sources . . . . . . . . . . . . . . 3-2 Site Characterization Requirements . . . . . 3-3 Comparative Evaluation of Fill
Sources . . . . . . . . . . . . . . . . . . . . . . 3-4
Chapter 4. Fiii Design Purpose of Project . . . . . . . . . . . . . . . . . 4-1
1-1 1-1 1-1 1-1 1-1 1-1
2-1 2-1 2-9
2-10 2-13 2-21 2-23 2-25
3-1
3-2 3-9
3-14
4-1
Project Design .................... 4-2 Design Considerations .............. 4-3 Design Elements . . . . . . . . . . . . . . . . . . 4-4
Chapter 5 Fiii Stablllzatlon Structures . . . . . . . . . . . . . . . . . . . . . . . 5-1 Dune Stabilization ................. 5-2
Chapter 6 Plans and Specifications Schedule . . . . . . . . . . . . . . . . . . . . . . . . 6-1 Specifications .................... 6-2
Chapter 7 Project Performance Monitoring Purpose of Performance Monitoring . . . . . 7-1 Fill Placement Monitoring ............ 7-2 Borrow Area Monitoring ............ 7-3 Shoreline Change . . . . . . . . . . . . . . . . . . 7-4 Littoral Environmental Monitoring ...... 7-5 Biological Monitoring . . . . . . . . . . . . . . 7-6
Chapter 8 Operations and Maintenance (O&M) Manual Purpose . . . . . . . . . . . . . . . . . . . . . . . . 8-1 Scope ......................... 8-2 Background ...............•...... 8-3 Operation and Maintenance . . . . . . . . . . . 8-4 Periodic Nourishment ............... 8-5 Responsibilities . . . . . . . . . . . . . . . . . . . 8-6
4-1 4-11 4-14
5-1 5-3
6-1 6-1
7-1 7-1 7-4 7-4 7-6 7-6
8-1 8-1 8-1 8-1 8-2 8-3

EM 1110-2·3301 31 May 95
Subject
Appendix A Bibliography
Appendix B Notation
. II
Paragraph Page Sublect
Appendix C Glossary
Appendix D
Paragraph Page
Operations and Maintenance Manual

Chapter 1 Introduction
1·1. Purpose and Scope
This manual provides guidance on the fonnulation, design and perfonnance of beach fill projects. Such projects are undertaken to protect backshore development from flood and storm waves. Sand bypassing operations are not covered since these procedures are covered in Engineer Manual (EM) 1110-2-1616.
1 ·2. Appllcablllty
This manual is applicable to Headquarters, U.S. Army Corps of Engineers (HQUSACE) elements and USACE Commands having civil works engineering and design responsibility.
1·3. Definition
The tenn beach fill commonly refers to both a process and a substance. The beach fill process is an operation involving placement of suitable sand, transported from an outside source, on a specific shore area. Beach fill also refers to the borrow material that is placed on the beach. In this manual the tenns beach fill operation and beach fill project will refer to the process, and beach fill material will refer to the substance.
1 ·4. References
a. ER 1110-2-1407, Hydraulic Design of Shore Protection Projects.
b. ER 1110-2-2902, Prescribed Procedures for the Maintenance and Operation of Shore Protection Works.
c. EP 415-1-4, Network Analysis System Guide.
d. EM 1110-1-1000, Photogrammetric Mapping.
e. EM 1110-1-1802, Geophysical Exploration.
f EM 1110-1-1804, Geotechnical Investigations.
g. EM 1110-2-1003, Hydrographic Surveying.
h. EM 1110-2-1004, Coastal Project Monitoring.
i. EM 1110-2-1412, Storm Surge Analysis and Design Water Level Detenninations.
EM 1110-2·3301 31 May 95
j. EM 1110-2-1414, Water Levels and Wave Heights for Coastal Engineering Design.
k. EM 1110-2-1502, Coastal Littoral Transport.
1. EM 1110-2-1614, Design of Coastal Revetments, Seawalls, and Bulkheads.
m. EM 1110-2-1616, Sand By-passing Operations.
n. EM 1110-2-1617, Coastal Groins and Nearshore Breakwaters.
o. EM 1110-2-1618, Coastal Inlets Hydraulics and Sedimentation.
p. EM 1110-2-1810, Coastal Geology.
q. EM 1110-2-1906, Laboratory Soils Testing.
r. EM 1110-2-1907, Soil Sampling.
s. EM 1110-2-2904, Design of Breakwaters and Jetties.
t. EM 1110-2-3300, Beach Erosion Control and Shore Protection Studies.
1·5. Blbllography
Technical and Scientific Literature. Appendix A contains a selected bibliography of technical and scientific literature pertaining to beach fill planning and design. Publications of particular value and comprehension are the 1984 edition of the Coastal Engineering Research Center (CERC) Shore Protection Manual, "Guidelines for Beach Restoration Projects" and the Manual on Artificial Beach Nourishment (Delft (Netherlands) Hydraulics Laboratory 1986). Appendix A also contains references to each publication cited in this manual.
1·6. Background
Beach fill projects involve the placement of sand along beaches to replace material lost by erosion or to increase beach width and dune elevations to provide protection of inland areas against storm flooding and waves. Many fill projects are initiated because the project beach has eroded and no longer acts as an effective buffer between land and sea. Initial fill is usually directed at increasing the width and height of the beach and foredunes to restore their protective function, and, as an added incidental benefit, create increased area for recreational use. Beach fills are
1·1
EM 1110-2·3301 31 May 95
commonly placed on naturally eroding shorelines which have deficit sediment supplies. Therefore, intermittent additional fill will be necessary over the long term. Despite these periodic nourishment costs, beach fills are considered an option to the initial construction of hard structures such as groins, revetments, bulkheads, or seawalls, which ideally would reduce long-term erosion along the shorelines. It is for this reason that renourishment operations are cost-shared with non-Federal sponsors in the same proportion as the initial construction hard structures. Renourishment is evaluated for cost-effectiveness versus the construction costs of structures. Depending on the economics of a particular project, a beach fill combined with a hard structure may prove to be the most cost-effective solution to the problem. Fill that is lost to the project is most often transported downdrift. However, periodic reversals of longshore transport processes also cause fill material to be carried updrift from the nourished area. Either way, the fill material acts as nourishment for adjacent beaches, having beneficial effects on both downdrift and updrift beach areas.
a. Design parameters. A large number of factors must be taken into account for economic analysis, planning, and design of beach fills. Each beach is unique in terms of its environmental situation, configuration, and composition. Consequently, selection of design parameters should be made on the basis of accurate up-to-date information on the project beach, and environmental factors such as wave climate and littoral currents. The principal design parameters of a beach fill project are tidal characteristics; wind and wave climate; storm characteristics; shoreline change history; sediment characteristics; sediment budget; borrow material availability and suitability; and environmental considerations. These parameters are used to evaluate the "without project" conditions and alternative "with project" parameters such as: the berm elevation and width, dune elevation and volume, project boundaries and termination of fill, required frequency of refilling, and fill material properties. Berm and dune elevations are selected to reduce the occurrence of overtopping during storms. Combinations of all fill dimensions should be considered
1·2
by optimization design procedures to evaluate various combinations of fill dimensions to determine the protective value that produces the maximum net benefit. Advanced nourishment is designed to counter long-term erosion effects for a number of years before refilling becomes necessary. Project boundaries and termination of the fill influence project impact on adjacent beaches and project life.
b. Materials selection. A number of important considerations are involved in selecting a fill material source for a beach fill project. The most important factors are the grain size distribution of the fill material as compared to the native beach material, and accessibility of the borrow source. It has been found that, in general, material with grain size characteristics equal to or somewhat coarser than the native beach material is most satisfactory for beach fill. However, the ideal fill material often cannot be located within an economical hauling or pumping distance, or is otherwise unavailable because of environmental constraints, excessive overburden.. legal or political constraints, or difficulty of access. In these cases the design process may be able to adapt less than ideal borrow material for project use by increasing the quantity of fill material placed, or by incorporating shore protection structures into the design.
c. Economics. Overall project economics will control the most cost-effective level of protection supplied by a beach fill project. Generally in a beach fill project the object of the economic analysis will be to maximize net benefits; i.e., the difference in damages to a project area between without-project and with-project conditions. A variety of beach widths and dune geometries are analyzed to determine the optimum level of protection, as measured by estimated average annual project benefits, and project cost. The design providing the maximum net estimated average annual benefits will be selected for construction. The reader is referred to USACE (1991) IWR Report 91-R-6, "National Economic Development Procedures Manual -Coastal Storm Damage and Erosion," for detailed guidance on the economic evaluation of beach fill projects.
Chapter 2 Site Characterization
2·1. Site Characterization Requirements
Planning, design, and execution of a beach fill project require the collection of a large amount of data on the project area and surroundings. These project area characteristics must then be incorporated into formulation and design studies. This will form the basis for project design and should contain all the information necessary for design purposes. Some of the information required includes a description of the important geomorphological characteristics of the area, sediment characteristics of the project beach and potential borrow areas, hydrodynamics and coastal processes of the site, and existing conditions of the project site, including extent and rate of erosion, and existing shore protection structures. Some of the needed data and information on the project area will probably be available in existing publications, maps, charts, and aerial photography; however, a field data collection effort will normally be required to supplement the available data.
2·2. Geomorphology
Many beach, dune, and nearshore characteristics are related to regional and local geomorphic patterns and processes. A study of these factors is an important part of the design process so that the important elements which influence the behavior .or. the ~ch fill are understood. Regional geomorph1c mformat1on can usually be obtained by analyses of maps, charts, and literature sources. In most cases, much of the information needed to adequately describe the local geomorphology, including the project area, must be based on field reconnaissance and survey. Knowledge of longshore transport and deposition of sediment is important in the design of nourishment projects. Along coasts with complex circulation and sediment transport, the use of relatively simple techniques utilizing morphological information can be employed to interpret such information. The relative magnitude and variability of these parameters can also be determined via morphological indicators.
a. Regional geomorphology. Information on the regio11al geomorphic setting of a project site gives insight into the nature and evolution of the shore zone, sediment supply, hydrodynamic environment, and location of borrow sources. For example, the long straight dune-backed barrier islands and spits typical of coastal plains are quite different from the comparatively short beaches flanked by headlands frequently encountered in hilly or mountainous terrain. Sediment supply on coastal plain shores is likely to be dominated by littoral drift processes and onshore-off shore
EM 1110-2·3301 31 May 95
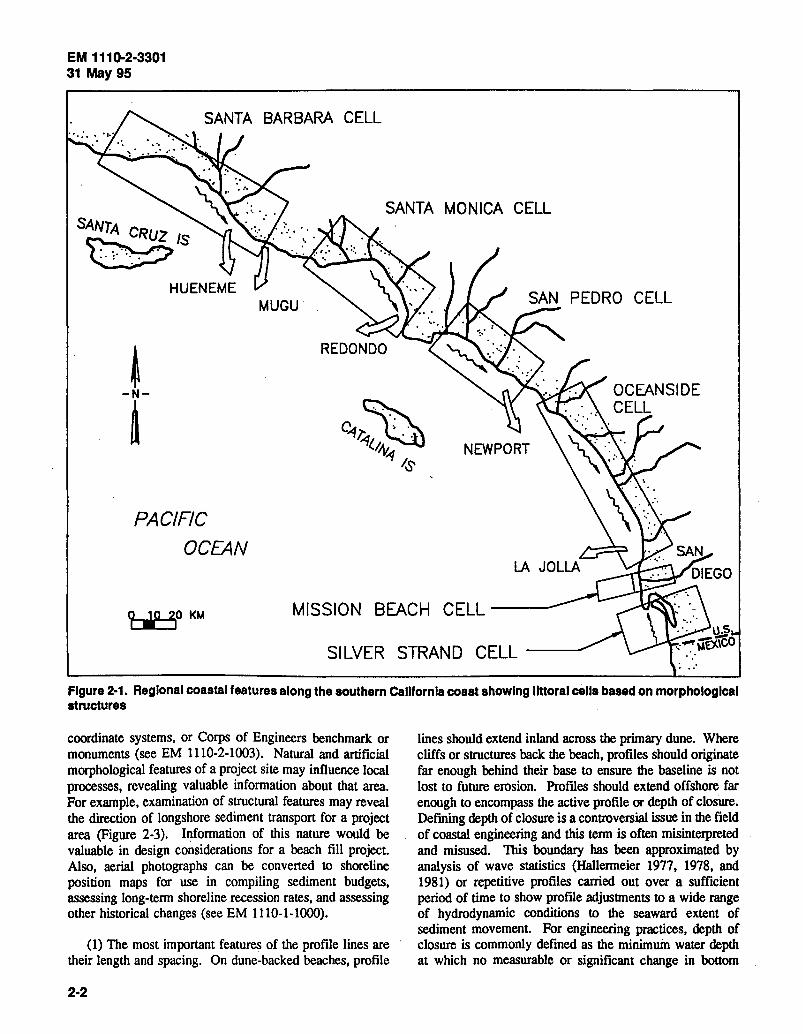
movement while little sand is contributed by streams because their lower courses are drowned. In contrast, beaches in hilly or mountainous regions are most often supplied by erosion of nearby headlands and cliffs and by sediment-laden streams. An example of using regional morphology in the determination of littoral transport direction is presented in Figure 2-1. The southern California coast is broken into several cells based on the location of inlets, offshore bathymetry, and wave refraction patterns, which have a large influence on the direction of longshore sediment transport within the region. These differences are extremely important when analyzing sediment budgets for a project (see EM 1110-2-1502).
(1) Regional scale geomorphology of the continental shelf is important because of its influence on wave dynamics, and because it is often a source or sink of littoral sediment. Furthermore, the continental shelf often contains deposits of suitable beach fill material. Continental shelf morphology usually shows a similarity to the morphology of the adjacent land mass but may have been altered to some degree by marine processes. Shelves bordering coastal plain regions are likely to be wide, gently sloping platforms having a relatively low relief. They often contain shoals composed of unconsolidated sand-size material that are potentially useful for beach fill. Shelves bordering hilly or mountainous coasts tend to be comparatively narrow, more steeply sloping, and have an irregular relief.
(2) Regional terrestrial geomorphology site characterization studies should include descriptions of landform relief and configuration, drainage patterns, and coastal features. This information can be obtained from pertinent texts and journal papers giving descriptions of specific regions, and by analysis of topographic maps and small-scale aerial photographs. The regional geomorphology of continental shelves is less well known than for terrestrial areas. The main basic source of information is the bathymetric charts produced by the National Ocean Survey of the National Oceanographic and Atmospheric Agency. Sand deposits can be identified by the Minerals Management Service of the Department of the Interior.
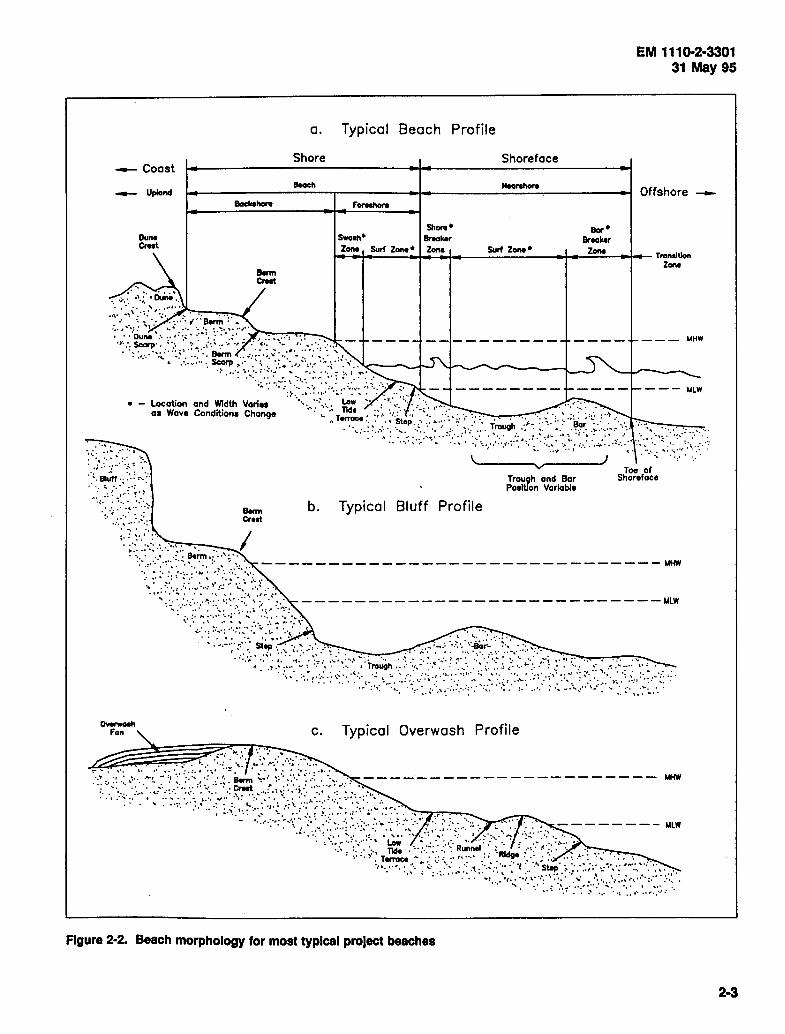
b. Project site morphology. A consideration of project beach morphology should include a detailed survey of the dune, beach, and nearshore areas from the dunes, cliff, or other features (e.g. shore protection structures) backing the beach to an offshore depth that will encompass the approximate zone of significant sediment movement Figure 2-2 illustrates and defines the beach morphology that is typical of most project beaches. Customarily, morphology is delineated by survey of data points along shoreperpendicular profile lines referenced to a shore-parallel baseline that is, in tum, referenced to the state survey
2-1
EM 1110-2·3301 31May95
SANTA MONICA CELL
~ -N-
~
PACIFIC
OCEAN
MISSION BEACH CELL ----
SILVER STRAND CELL
Figure 2·1. Regional coastal features along the southern California coast showing llttoral cells based on morphological structures
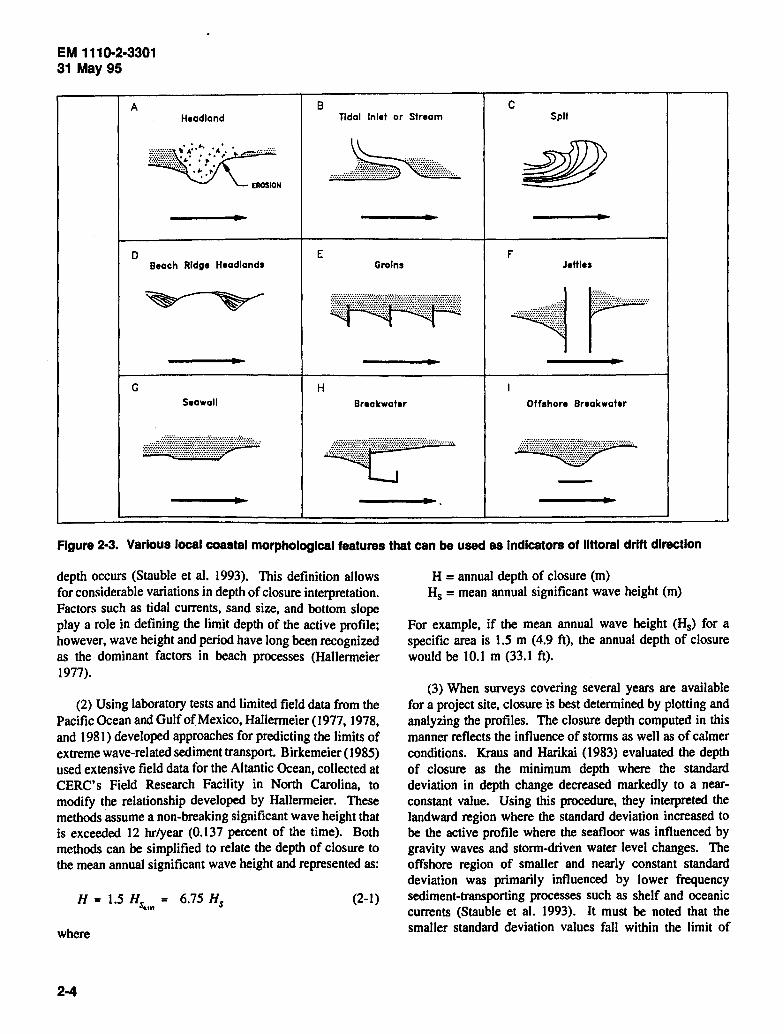
coordinate systems, or Corps of Engineers benchmark or monuments (see EM 1110-2-1003). Natural and artificial morphological features of a project site may influence local processes, revealing valuable information about that area. For example, examination of structural features may reveal the direction of longshore sediment transport for a project area (Figure 2-3). Information of this nature would be valuable in design considerations for a beach fill project. Also, aerial photographs can be converted to shoreline position maps for use in compiling sediment budgets, assessing long-term shoreline recession rates, and assessing other historical changes (see EM 1110-1-1000).
(1) The most important features of the profile lines are their length and spacing. On dune-backed beaches, profile
2·2
lines should extend inland across the primary dune. Where cliffs or structures back the beach, profiles should originate far enough behind their base to ensure the baseline is not lost to future erosion. Profiles should extend offshore far enough to encompass the active profile or depth of closure. Defining depth of closure is a controversial issue in the field of coastal engineering and this term is often misinterpreted and misused. This boundary has been approximated by analysis of wave statistics (Hallenneier 1977, 1978, and 1981) or repetitive profiles carried out over a sufficient period of time to show profile adjusunents to a wide range of hydrodynamic conditions to the seaward extent of sediment movement. For engineering practices, depth of closure is commonly defined as the minimum water depth at which no measurable or significant change in bottom
-- Coast
-- Upland
Dune Crut
a. Typical Beach Profile
Shore Shore face
Neorahore
roreahore
~ore• 11or• Swaim• llraaker Breaker
EM 1110-2·3301 31May95
Offshore --
Zone Surf Zone • Zone Surf Zone • Zone l"",_.--t-,._---~"""'......,.~ ... ---------e_,.. _____ _.,_,.. ___ Tran~tlon
. -
o...rwoeh ra11
Locotion and Width Vorlea 01 Wove Conditions Change
Berm Crnt
b.
c.
Typical Bluff Profile
Trough and Bar Poaltlon Variable
Typical Overwash Profile
Figure 2-2. Beach morphology for most typlcal project beaches
Zone
--- MHW
--- MLW
Toa of Shoreface
2-3
EM 1110-2-3301 31May95
A B c Headland Tldal Inlet or Stream Spit
D E F Beach Ridge Headlands Groins Jetties
G H Seawall Breakwater Offshore Breakwater
Figure 2-3. Various local coastal morphological features that can be used as Indicators of littoral drift direction
depth occurs (Stauble et al. I 993). This definition allows for considerable variations in depth of closure interpretation. Factors such as tidal currents, sand size, and bottom slope play a role in defining the limit depth of the active profile; however, wave height and period have long been recognized as the dominant factors in beach processes (Hallermeier 1977).
(2) Using laboratory tests and limited field data from the Pacific Ocean and Gulf of Mexico, Hallermeier (1977, 1978, and I 981) developed approaches for predicting the limits of extreme wave-related sediment transport. Birkemeier ( 1985) used extensive field data for the Altantic Ocean, collected at CERC's Field Research Facility in North Carolina, to modify the relationship developed by Hallermeier. These methods assume a non-breaking significant wave height that is exceeded 12 hr/year (0.137 percent of the time). Both methods can be simplified to relate the depth of closure to the mean annual significant wave height and represented as:
H = 1.5 HS = 6.75 HS •tn
(2-1)
where
2-4
H = annual depth of closure (m) H5 = mean annual significant wave height (m)
For example, if the mean annual wave height (H5) for a specific area is 1.5 m (4.9 ft), the annual depth of closure would be IO. I m (33.l ft).
(3) When surveys covering several years are available for a project site, closure is best determined by plotting and analyzing the profiles. The closure depth computed in this manner reflects the influence of storms as well as of calmer conditions. Kraus and Harikai (1983) evaluated the depth of closure as the minimum depth where the standard deviation in depth change decreased markedly to a nearconstant value. Using this procedure, they interpreted the landward region where the standard deviation increased to be the active profile where the seafloor was influenced by gravity waves and storm-driven water level changes. The offshore region of smaller and nearly constant standard deviation was primarily influenced by lower frequency sediment-transporting processes such as shelf and oceanic currents (Stauble et al. 1993). It must be noted that the smaller standard deviation values fall within the limit of

measurement accuracy. This suggests that it is not possible to specify a closure depth unambiguously because of operational limits of present offshore profiling hardware and procedures.
(a) An example of how closure was determined empirically at Ocean City, MD, is shown in Figure 2-4. A clear reduction in standard deviation occurs at a depth of about 5 to 7 m (18 to 20 ft). Above the -6-m (-18-ft) depth, the profile exhibits large variability, indicating active wave erosion, deposition, and littoral transport. Deeper (and seaward) of this zone, the lower and relatively constant deviation of about 7 to 10 cm (3 to 4 in.) is within the measurement error of the sled surveys. Nevertheless, despite the inability to precisely measure seafloor changes in this offshore region, it is apparent that less energetic erosion and sedimentation take place here than in water shallower than -6 m (-18 ft). For the 5.6 km (3.5 miles) of shore surveyed at Ocean City, the depth of closure ranged between 5 and 8 m (18 and 25 ft). Scatter plots indicated that the average closure depth was 6 m (20 ft).
(4) In many studies on the east coast of the United States, profiles have been extended offshore to the 9-m (30-ft) depth contour. This is based on a generally held view that sediment movement of beach fill engineering significance generally takes place in water depths less than this. On the exposed west coast of the United States this limit is deeper, while for Great Lakes and Gulf of Mexico beaches the depth of significant sediment movement has been reported to be approximately 6 m (20 ft) (Shore Protection Manual 1984). CERC 1P-78-4 (Everts 1978) is a study of shoreface and continental shelf geometry, which suggests that the transition zone between the shoreface and ramp (i.e., the relatively gentler sloping shelf floor) is possibly related to a long-term depth limit of significant sediment movement In a series of 49 profiles from the Atlantic and Gulf regions, a large majority had a shoreface/ ramp transition depth of more than 9 m (30 ft). In general, the most conservative depth limit for nearshore profiles would be the shoreface/ramp transition depth. Determination of the depth and distance from shore to the shoreface/ramp boundary requires detecting the often subtle grade change from one slope to another. An approximation can be obtained by examination of profiles on which the ramp slope is projected under the shoreface and selecting the point of divergence between the two ..
(5) Horizontal spacing of profile lines depends largely on the variability of the beach and nearshore morphology. The degree of variability can be established by reconnaissance and analysis of available maps, hydrographic charts, and aerial photographs. The spacing need not be the same throughout the project area; closer than average spacing may
EM 1110-2·3301 31 May 95
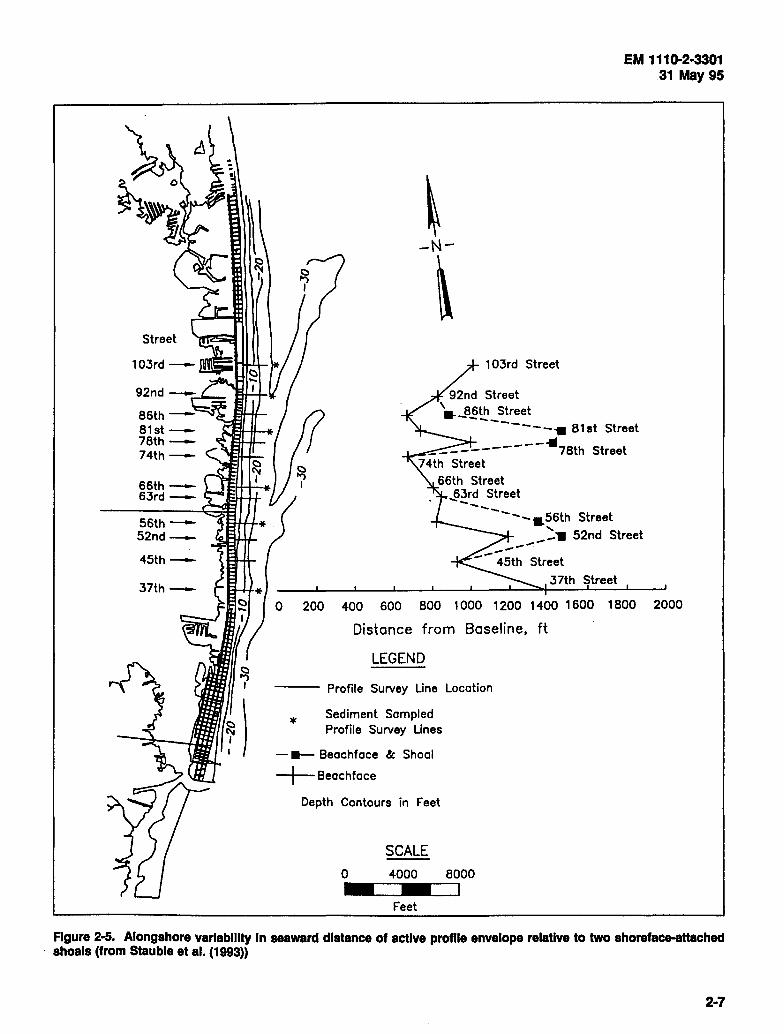
be needed on more complex sections. Profile spacing on long uniform beaches often ranges from 300 to 600 m (1,000 to 2,000 ft). Stauble et al. (1993) (Figure 2-5) describe alongshore variability in seaward distance of active profiles relative to shoreface-attached shoals at the beach fill site in Ocean City, MD. In general, the spacing of profile lines should be close enough so that major beach features such as nearshore shoals, major cusps, spits, headlands, fillets around structures, and profile changes can be delineated by the survey data.
(6) Subaerial parts of the profile are usually surveyed by transit, rod and tape, or electronic ranging devices using standard survey techniques. Enough data points along each profile are needed to clearly show the beach morphology, often at 6-m (20-ft) intervals and at all changes in beach slopes or elevations. The submerged parts of the profiles can be surveyed by any. of several methods. One consists of a vessel equipped with a fathometer and a positioning system to establish horizontal control. A second, more accurate method, makes use of a sea sled on which is mounted a stadia rod or electronic distance measuring device reflector mirror on a tall mast The sled is towed along the bottom by a boat or an amphibious vehicle following the profile line, while elevations and horizontal position are determined by a surveying instrument located on shore. The sea sled method has the advantage of being more accurate in establishing elevations because it is independent of the sea state and tidal or other variations in water level. In addition, sea sleds are particularly useful close inshore where a survey vessel cannot safely venture and where fathometer records tend to deteriorate. In many cases, a combination of sea sled inshore and fathometer survey offshore can be advantageously used, especially where profile lines are quite long and extend to relatively deep water. On a smooth bottom, data points are taken at least once for each 30-cm (1-ft) change in bottom elevation. On more irregular bottoms, readings should be taken at a minimum of every 6 m (20 ft).
(7) Beach morphology tends to vary seasonally and substantial differences may occur between winter and summer profiles. In addition, longer term changes can occur as a result of shoreline erosion, major storm events, or interruption of sediment supply. Although long-term profile data are preferred, analysis of historical aerial photographs and bathymetric charts can provide valuable information on long-term changes. It is necessary to obtain at least one set of profiles for both winter and summer conditions for use in design. Figure 2-6 presents a scenario of beach profile responding to storm conditions causing long-term changes. Figure 2-7 shows seasonal beach profile response, illustrating the transformation between summer and winter profile shapes.
2·5

EM 1110-2·3301 31 May 95
20
10
0 > (.!) 0 z
-4-
-10 c 0 ·--0 -20 > Q)
w
-30
8 7 4th Street
7
6
Mean 5
·---------· Envelope 4
Std. Dev. 3
2
-40-+-------r-------,....-------.----====::;:::==---===::::;::::::::i_----.._.------4-0 0 500 1000 1500 2000 2500 3000 3500
Distance Offshore1 ft
20 8
52nd Street 7
10
Cl • 6 > (!) 0 z 5
-- -10 4 c 0
:;:::: 3 0 -20 > Q)
w 2
-30
-40-t--------.-------.--------r------~-------,---..,..----.---'------+-O 0 500 1000 1500 2000 2500 3000 3500
Distance Off shore, ft
-4-
c 0 -0 ·-> Q)
0
"'O I.. 0
"'O c 0 -(/)
--c 0 -0 > Q)
Cl
"O I.. 0
"O c 0 -Vl
Figure 2-4. Profile sunieys from Ocean City, MD, showing the seaward extent of sediment movement or depth of closure (from Stauble (1993))
2-6
Street
45th--
37th--
~ -N-
\ 103rd Street
Street
EM 1110-2·3301 31May95
Street
37th Street
200 400 600 800 1000 1200 1400 1 600 1800 2000
Distance from Baseline, ft
LEGEND
--- Profile Survey Line Location
* Sediment Sampled Profile Survey Lines
- II- Beachface & Shoal
-f--Beachface
Depth Contours in Feet
0
SCALE
4000
Feet
8000
Figure 2·5. Alongshore variability In seaward distance of active profile envelope relative to two shoreface-attached shoals (from Stauble et al. (1993))
2·7

EM 1110-2-3301 31May95
/Berm
.; : .:\·;;< ::·.'.<> ·'·.,. MHW
Profile A - Normal Wave Actio~·~·.".· , ;,. : .. :·., ·. .
··•···
Profile A
Profile C - Storm
.. ~· ·· ....... :. . ... ·. ':•~\ :'\ ... · -~ .
.. . . . :. :. •:.~
MHW
~ Erosion
~ Accretion
Figure 2-6. Beach response to storm conditions. This type of response typically causes long-term damage to the profile
2-8
SEASONAL PROFILE CHANGE 15
10
5 \ ? ACCRETIONAL BERM PROFILE (SUMMER)
1 -----------------------------0
- - 20 IMR 84
-- 6 SEP 85
ID -s f EROSIONAL BAR PROFILE (WINTER)
· \ PROFILE LINE 62 ~ ~ -10
~ -15 "::::,.,..
-20
-25
-~'---'--'--'---'--..__.....__.__.___..__.__.....__..___.___.
150 550 950 1350 1750 2150 2550 2950
DISTANCE. FEET
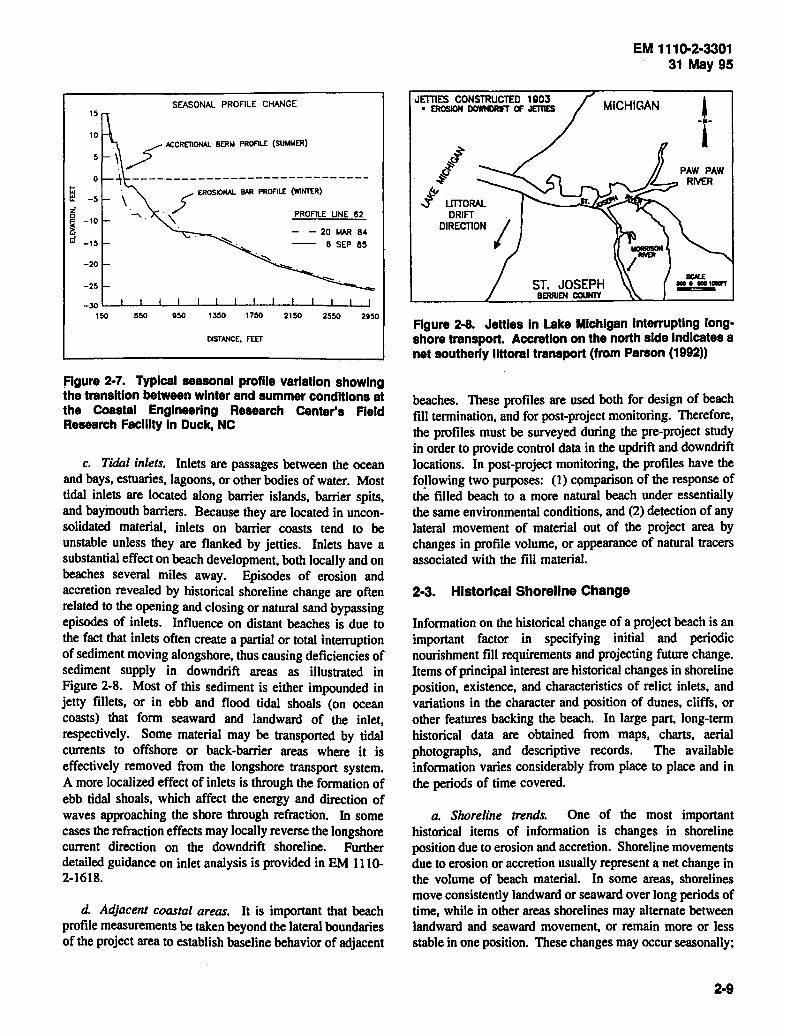
Figure 2-7. Typical seasonal profile variation showing the transition between winter and summer conditions at the Coastal Engineering Research Center's Fleld Research Faclllty In Duck, NC
c. Tidal inlets. Inlets are passages between the ocean and bays, estuaries, lagoons, or other bodies of water. Most tidal inlets are located along barrier islands, barrier spits, and baymouth barriers. Because they are located in unconsolidated material, inlets on barrier coasts tend to be unstable unless they are flanked by jetties. Inlets have a substantial effect on beach development, both locally and on beaches several miles away. Episodes of erosion and accretion revealed by historical shoreline change are often related to the opening and closing or natural sand bypassing episodes of inlets. Influence on distant beaches is due to the fact that inlets often create a partial or total interruption of sediment moving alongshore, thus causing deficiencies of sediment supply in downdrift areas as illustrated in Figure 2-8. Most of this sediment is either impounded in jetty fillets, or in ebb and flood tidal shoals (on ocean coasts) that form seaward and landward of the inlet, respectively. Some material may be transported by tidal currents to offshore or back-barrier areas where it is effectively removed from the longshore transport system. A more localized effect of inlets is through the formation of ebb tidal shoals, which affect the energy and direction of waves approaching the shore through refraction. In some cases the refraction effects may locally reverse the longshore current direction on the downdrift shoreline. Further detailed guidance on inlet analysis is provided in EM 1110-2-1618.
d. Adjacent coastal areas. It is important that beach profile measurements be taken beyond the lateral boundaries of the project area to establish baseline behavior of adjacent
EM 1110-2·3301 31May95
JETTIES CONSTRUCTED 1903 • EROSION DOWNDRIFT OF JETTIES MICHIGAN J
I ~cl ~
j' LITTORAL DRIFT
DIRECTION I ST. JOSEPH
BERRIEN COUN1Y
SCALI -· •1-..t -==-
Figure 2-8. Jetties In Lake Michigan Interrupting longshore transport. Accretion on the north side Indicates a net southerly littoral transport (from Parson (1992))
beaches. These profiles are used both for design of beach fill termination, and for post-project monitoring. Therefore, the profiles must be surveyed during the pre-project study in order to provide control data in the updrift and downdrift locations. In post-project monitoring, the profiles have the following two purposes: (1) C()mparison of the response of the filled beach to a more natural beach under essentially the same environmental conditions, and (2) detection of any lateral movement of material out of the project area by changes in profile volume, or appearance of natural tracers associated with the fill material.
2-3. Hlstorlcal Shoreline Change
Information on the historical change of a project beach is an important factor in specifying initial and periodic nourishment fill requirements and projecting future change. Items of principal interest are historical changes in shoreline position, existence, and characteristics of relict inlets, and variations in the character and position of dunes, cliffs, or other features backing the beach. In large part, long-term historical data are obtained from maps, charts, aerial photographs, and descriptive records. The available information varies considerably from place to place and in the periods of time covered.
a. Shoreline trends. One of the most important historical items of information is changes in shoreline position due to erosion and accretion. Shoreline movements due to erosion or accretion usually represent a net change in the volume of beach material. In some areas, shorelines move consistently landward or seaward over long periods of time, while in other areas shorelines may alternate between landward and seaward movement, or remain more or less stable in one position. These changes may occur seasonally;
2-9

EM 1110-2·3301 31May95
however, it is important to know an area's storm history relative to shoreline position data such as aerial photos and surveys.
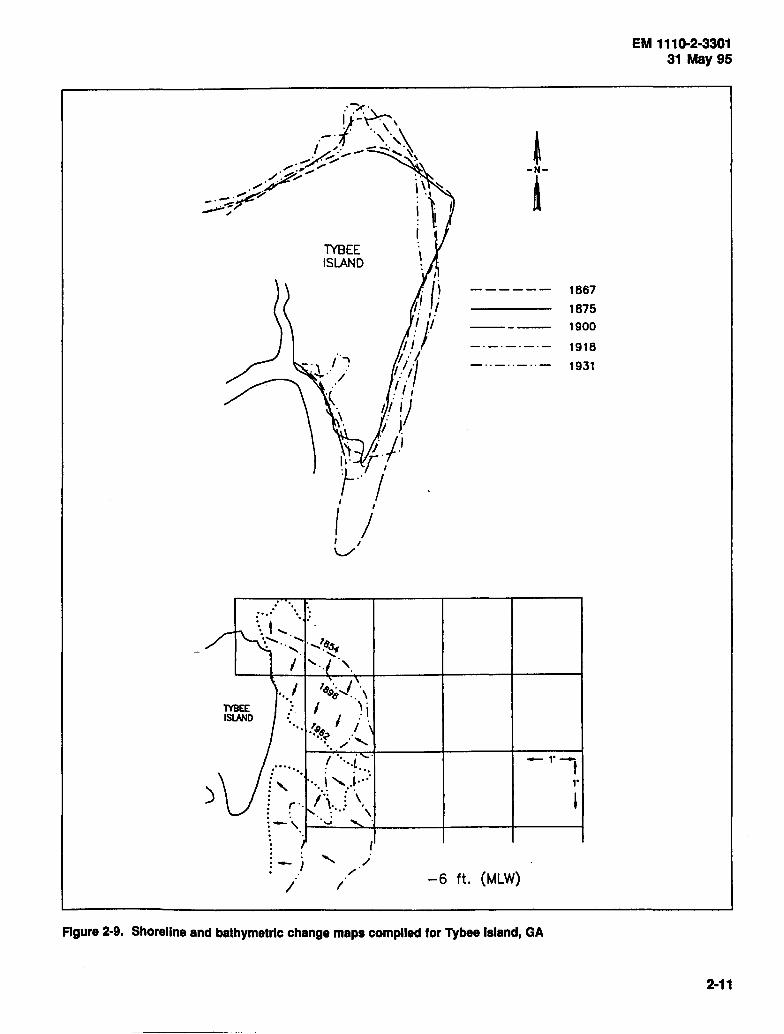
(1) The principal method of analyzing shoreline and volume change through time is by compiling shoreline and bathymetric change maps. These are large-scale maps containing superimposed shorelines and depth contours for each of the historical surveys available. From these maps, measurements can be made of the difference in contour line position between any two survey dates. These measurements can be used to compute annual change rates for specific periods of time. Figure 2-9 presents an example of a shoreline and bathymetric change map compiled for Tybee Island, Georgia (Oertel, Fowler, and Pope 1985). Data for maps are usually obtained from topographic and bathymetric maps produced by the National Ocean Survey (NOS) of the National Oceanic and Atmospheric Administration (NOAA), the U.S. Geological Survey (USGS), and from aerial photography. In many cases, the published maps and charts are too small in scale to accurately indicate shoreline changes; however, larger scale plots used in the original compilation of the published charts are usually available from the mapping agency files. Both NOAA and the USGS are good sources of aerial photographs. For purposes of analyzing shoreline changes, the largest scale photography available should be used. Care should be taken to compare shorelines surveyed during the same time of year to remove seasonal change bias from the analysis.
(2) There are a number of computer-based techniques available which can improve the accuracy of shoreline change mapping, and reduce the need for manual data plotting and measurement. These include computer digitizers to enter the data into a common database and scale; Geographic Information Systems to archive historical data and perform data manipulation; civil engineering volume calculation programs for calculating historical volume changes, and custom computer programs.
(3) Differences in the degree of accuracy in the original survey and compilation techniques of source maps may create a margin of error large enough to account for small differences in shoreline position between given dates. This is especially true of older sources that were based on survey instruments and techniques less precise than those of modern times. For this reason, small changes in shoreline position should be carefully evaluated as to their validity.
(4) Shoreline change maps of many areas of the United States coasts have been made in the past by Government agencies and can be updated to include more recent survey data. These maps are usually available in Corps District and Division files. In a recent cooperative program between CERC and NOAA, shoreline change maps have been
2·10
compiled on two regions of the Atlantic Coast The first covers the Atlantic Coast from Cape Henry, Virginia, to Cape Hatteras, North Carolina (Everts, Battley, and Gibson 1983) and the second extends between Tybee Island, Georgia, and Cape Fear, North Carolina (Anders, Reed, and Meisburger 1990).
c. Dune accretion and erosion. Coastal dunes are an important element in beach fill design, because of their role in protecting inland areas from storm flooding and wave attack. Where they are not well-stabilized, dunes are mobile features continuously being reshaped by winds and periodically being eroded by storm waves. Historical trends in dune accretion, erosion, and displacement are important factors in determining the expected effects of dune filling and stabilization for flood protection. Historical records of dune behavior can be obtained from old topographic maps, photographs, and land use records.
2-4. Sediment Characteristics
A detailed study of the native beach material is a vital element in the design of beach fill projects. Suitability of the fill. material selected for the project is based on comparative analysis of the native beach and potential fill material characteristics. This section discusses the methods of collection and analysis of dune, beach, and nearshore samples from the project area. Applicable computer software can be found in the Automated Coastal Engineering System (ACES) Version 1.07 (Leenknecht et al. 1990).
a. Sample collection. An accurate determination of the composition and grain size characteristics of the native dune, beach, and nearshore sediments in the project area is of vital importance in selecting suitable fill material. In order to do this, a sediment sampling program must be devised and carried out. The number and location of samples collected should be such that the samples fully represent the variations in sediment characteristics within the project area. Determination of these factors can best be accomplished by a reconnaissance of the project area using a sediment size comparison chart to estimate the degree and pattern of sediment variability. A suitable size comparison card can be made by gluing sieve fractions of sand on a piece of medium or heavy weight illustration board. During the reconnaissance a small number of representative samples should be secured for laboratory analysis to compare with field estimates and to determine composition.
(1) Normally, sediment samples are collected along the profile lines established to survey site morphology. In most cases, this provides satisfactory results. In some cases, however, it may be necessary to survey additional sampling
)
lYBEE ISLAND
.. :···: ·· .. ::
TYBEE ISLAND
I " ... i . f' ·. ·· ... ~ '-):::· : /" : ' . r" '· . ,
1867
1875
1900
1918
1931
~ ,. __.,.. t ,.
. .... \
:- ' t--· . .;;;;...; _ _;;::o...4-----+----t-------1
; - .I I I
/ / -6 ft. (MLW)
Figure 2-9. Shoreline and bathymetrlc change maps complied for Tybee Island, GA
EM 1110-2·3301 31May95
2·11

EM 1110·2·3301 31 May 95
stations between existing profile lines to characterize the sediment distribution pattern. In general, well-sorted sediments, i.e., those having a narrow range of grain sizes, can be characterized by fewer samples than poorly sorted material, i.e., those having a wide range of grain sizes.
(2) Samples obtained for beach fill studies should be taken at prescribed locations along the profile lines. These locations usually correspond to natural shore-parallel zones, specified elevation increments, or tidal data, e.g. mean high water (mhw), mean low water (mlw). Sampling in the hydrodynamic zone (Figure 2-10) usually provides the most useful information: thus samples should include, but are not limited to, the following beach zones:
Figure 2·10. Sediment sampling locations across the beach profile based on hydrodynamic zonatlons
(a) Dune base. Located just seaward of the frontal dune or, in absence of a dune, a seawall, cliff, or vegetation margin marking the inland border of the beach. Samples should be obtained from a 30-cm (12-in.) deep hole to lessen or eliminate aeolian effects.
(b) Mid-backshore. Taken from the backshore zone midway between the berm crest and the dune base or inland border.
(c) Berm crest. At the point of inflection between the normally flat backshore and the steeper foreshore slope. Where no berm is evident, samples are obtained at the approximate high-water line, which is often marked by a line of debris and many times coincides with the upper limits of the swash.
(d) High-tide mark. At the limit of wave uprush as it exists at the time samples are taken. If the beach is visited at the time of high tide, sample should be taken from a mids wash position.
(e) Mid-tide mark. The location approximately midway
2-12
between the low-tide line and the high-tide mark.
(f) Low-tide mark. At the limit of wave backrush, which is usually marked by a small declivity in the profile. This feature, known as the step, may not always be evident.
(g) Bar trough. The deepest point between the low-tide mark and the bar crest.
(h) Bar crest. The shoalest point on the bar.
(i) Seaward. At predetermined intervals seaward of the bar crest until the approximate depth of closure is reached.
Samples should be collected at low-water stages when the foreshore samples can be easily obtained at the low-tide mark. The sample stations adopted for a particular project should be consistently used for all project and post-project sampling. If the beach is backed by dunes, samples of the windward and leeward sides and the dune crest should be obtained on each selected profile line. If a cliff backs the beach and the cliff face material appears homogenous, two representative samples are sufficient; if it is stratified, samples of e~ch bed should be obtained.
(3) Since beach deposits commonly vary in depth below the surface, frequent inspection of underlying material to determine the thickness and characteristics of beach deposits and to obtain samples of any subsurface beds extensive enough to affect the composite size distribution of the beach material should be made. Krumbein and James (1974) recommend that at least the uppermost 30 cm (12 in.) should be examined.
(4) Coarse detritus consists of discrete particles 1 cm (0.4 in.) or larger in size. Common types of coarse detrital particles are mollusk shells, rock fragments, clay balls, peat fragments, and various man-made objects. Representative samples of this material should be collected from a few stations for its possible value in sediment source and littoral drift studies.
(5) Bottom sediment samples in the nearshore zone are generally obtained by grab samples, pipe dredges, or short gravity corers. Depending on the uniformity of the bottom sediments, all or only selected profile lines are sampled. Sample intervals along the line should be taken at specific morphologic features (i.e. bar trough, bar crest, etc.) and in the absence of such features at specified depths, for instance at -5, -10, etc. out to the depth of closure. Because the nearshore area cannot be directly observed, the spacing of samplei; should be flexible so that, as sampling progresses, spacing can be altered if necessary to provide adequate coverage.
b. Grain size determination. The grain size distribution of samples collected for the study can be determined by sieve analysis or by a rapid sediment analyzer. Care should be taken if these two methods are used on the same project, because there are differences between the two techniques. Sieves measure the actual diameter of individual grains; the rapid sediment analyzer measures the fall velocity of particles in water and relates it to the actual diameter of a quartz sphere having the same fall velocity. The diameter determined by the rapid sediment analyzer is an effective hydraulic diameter rather than actual diameter and more nearly represents how grains will respond to flow. In actual practice, the differences between the two methods will probably be less than the uncertainties due to sampling variability. Nonetheless, the same method used for determining native beach characteristics for a nourishment site should be used to analyze the fill material. From the size frequency distribution of samples, the standard statistical measures used in sedimentology, including median, mean, sorting, skewness, and kurtosis, can be computed by the method of moments or derived by the Polle graphic method from a plot of the size distribution data.
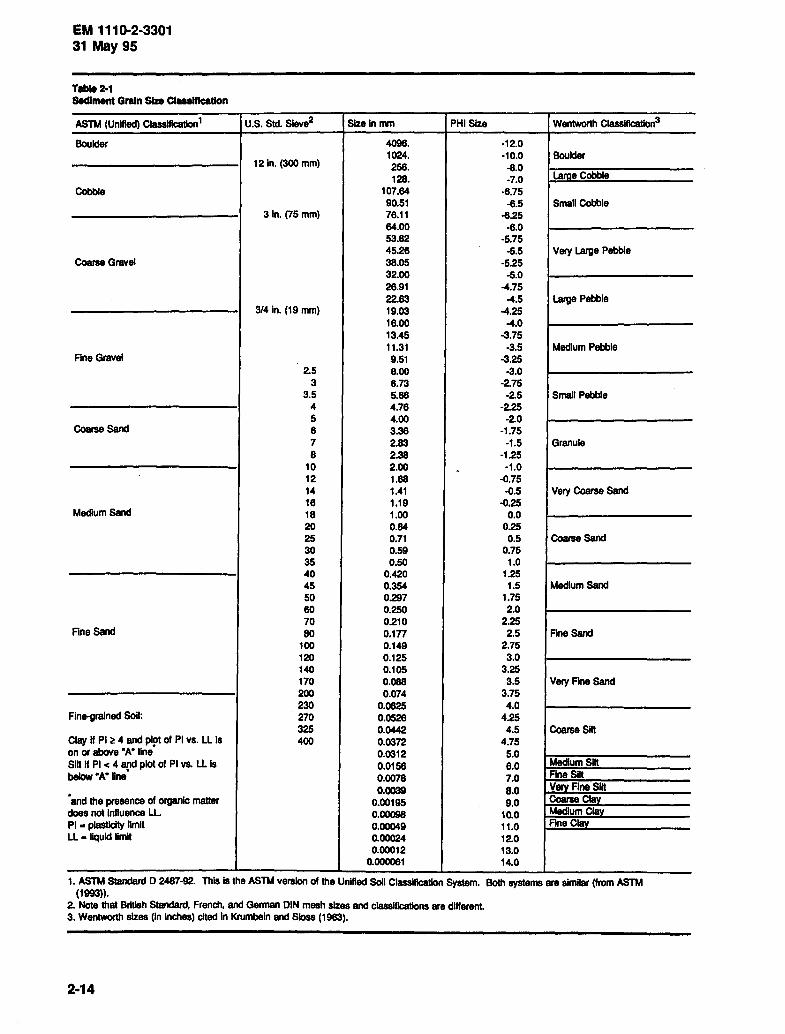
c. Sediment composition. The main compositional elements of the sediment samples can be determined by examination of the washed sand size fraction under a binocular microscope. It is helpful if the material is subdivided for examination into the Wentworth size classes for sand-size material (Table 2-1). Most beach, dune, and nearshore sediments are composed predominantly of quartz particles. Accessory components of organically produced (biogenic) calcium carbonate and other minerals are usually present. In some areas, biogenic calcium carbonate is the dominant element. The frequency of occurrence of important sediment components can be estimated by their apparent density when viewed under a microscope, preferably, or by frequency counts. Counts can be made in terms of the number of particles of a given element to total particles or per unit weight of sample. In most cases, the accessory elements are present in such small quantities that a count per total particles is impractical in all but the largest particle sizes.
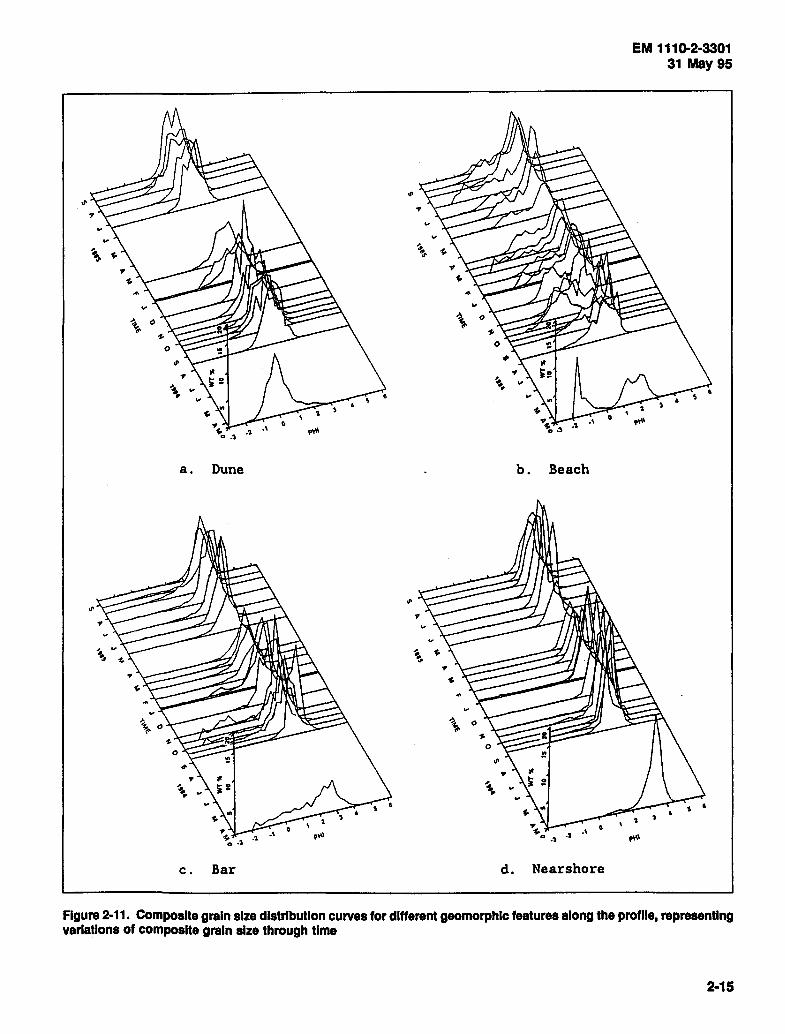
d. Composite grain size. Selection of a suitable fill sand is based largely on comparison of composite grain-size statistics of the project area with that of potential fill sources. Methods of determining composite grain size distribution have been described in Hobson (1977); Stauble, Hansen, and Blake (1984); Stauble and Hoel (1986); Hansen and Scheffner (1990); and Anders and Hansen (1990). Their accuracy depends on how representative the available samples are of the dune, beach, and nearshore areas. One method uses the percentage of sediment in each size interval
EM 1110-2·3301 31May95
for all of the samples which are summed. The total value is divided by the number of samples to obtain an average value. The resulting composite average size distribution can be plotted on probability paper and composite sediment statistics determined graphically. A second method mixes equal weight sub-samples ·or each sample and the grain size distribution of the composite sample is determined by sieve analysis. Figure 2-11 presents examples of composite distribution curves showing variations in composite grain sizes through time for different zones within the profile. Samples representing all geomorphic zones can also be combined to determine the composite grain size for the entire profile. ACES (Leenknecht et al. 1990) provides computer program capabilities for determining composite grain size analysis.
2·5. Hydrodynamics
A detailed knowledge of hydrodynamic forces acting on a coastal area is important in beach fill design since those forces determine both the ultimate long-term beach configuration during typical conditions and the protective quality of the beach during storm conditions. Every project area exhibits a definable range of water levels, waves, and currents. These hydrodynamic forces have historically affected the project area and will act upon any new material placed along the shoreline. Therefore, statistics of both long-term and storm hydrodynamic forces are important in the design of a beach fill project. This section discusses the hydrodynamic information needed for beach fill design and the reader is ref erred to more detailed discussions about each aspect in EM 1110-2-1414, EM 1110-2-1412, and EM 1110-2-1502.
a. Waves. Wave characteristics of a given area will affect the following aspects of a beach fill project:
(1) Shape of the beach profile.
(2) Offshore limit of sediment motion (depth of closure).
(3) Degree to which the profile recedes during storms.
( 4) Direction and rate of longshore transport.
(5) Effect of structures located in the project area.
(6) Extent of wave runup.
(7) Amount of overtopping.
(8) Forces on structures.
2·13
EM 1110-2·3301 31May95
Table 2·1 Sediment Grain Size ClllUlflcatlon
ASTM (Unified) Classlflcatlon 1
Boulder
Cobble
Coarse Gravel
Ane Gravel
Coarse Sand
Medium Sand
AneSand
Fine-grained SoU:
Clay H Pl ~ 4 and p1!>1 of Pl vs. LL Is on or above "A" line Slit H Pl < 4 9!1d plot of Pl vs. LL Is below •A• line
"and the presence of organic matter does not Influence LL Pl • plasticity llmlt LL • llquld limit
U.S. Std. Sleve2
12 In. (300 mm)
3 In. (75 mm)
314 In. (19 mm)
2.5 3
3.5 4 5 8 7 8
10 12 14 16 18 20 25 30 35 40 45 50 80 70 80
100 120 140 170 200 230 270 325 400
Size In mm
4096. 1024. 256. 128.
107.84 90.51 78.11 84.00 53.82 45.26 38.05 32.00 26.91 22.83 19.03 16.00 13.45 11.31 9.51 8.00 6.73 5.68 4.76 4.00 3.38 2.83 2.38 2.00 1.88 1.41 1.19 1.00 0.84 0.71 0.59 0.50
0.420 0.354 0.297 0.250 0.210 o.1n 0.149 0.125 0.105 0.088 0.074
0.0825 0.0526 0.0442 0.0372 0.0312 0.0156 0.0078 0.0039
0.00195 0.00098 0.00049 0.00024 0.00012
0.000081
PHI Size Wentworth Classlflcatlon3
·12.0 -10.0 Boulder
-8.0 -7.0 Larae Cobble
-6.75 -6.5 Small Cobble
-6.25 -6.0
-5.75 -5.5 Very Large Pebble
-5.25 -5.0
-4.75 -4~5 Large Pebble
-4.25 -4.0
-3.75 -3.5 Medium Pebble
-3.25 -3.0
-2.75 -2.5 Small Pebble
-2.25 -2.0
-1.75 -1.5 Granule
-1.25
- -1.0 -0.75 -0.5 Very Coarse Sand
-0.25 0.0
0.25 0.5 Coarse Sand
0.75 1.0
1.25 1.5 Medium Sand
1.75 2.0
2.25 2.5 Fine Sand
2.75 3.0
3.25 3.5 Very Fine Sand
3.75 4.0
4.25 4.5 Coarse Slit
4.75 5.0 8.0 Medium Slit
7.0 Fine Slit
8.0 Very Fine Slit
9.0 CoarseGUIV
10.0 Medium Clay
11.0 Fine CISY
12.0 13.0 14.0
1. ASTM Standan:I D 2487-92. This Is the ASTM version of the Unified Soll Classlllcatlon System. Both systems are similar (from ASTM (1993)).
2. Note that British Standard, French, and German DIN mesh sizes and classiflcallons are different. 3. Wentworth sizes (In Inches) cited In Krumbein and Sloss (1983).
2·14
a. Dune
c. Bar
b. Beach
d. Nearshore
EM 1110-2·3301 31May95
Figure 2-11. Composite grain size distribution curves for different geomorphlc features along the profile, representing variations of composite grain size through time
2·15
EM 1110-2·3301 31May95
From this list, it is obvious that accurate estimates of design waves are imperative in the proper design of a beach fill project. Wave characteristics for a beach fill design are determined by first estimating offshore wave statistics, i.e. in deep water or at a location of known water depth such as 30 or 60 m (100 or 200 ft). Offshore wave conditions are then used to formulate local wave statistics by accounting for appropriate transformation processes between the offshore location and project site.
(1) Wind data. Waves are generated as a result of local and far-field winds. Each project will have a different requirement because off shore fetches and exposures will vary. Therefore, good information about winds is required for accurate determination of wave statistics. Wind data, often in analyzed form, are available from several Federal agencies, such as the National Climatic Center and the National Weather Service, and many local government agencies. These local wind data are used to develop wind roses and other graphic descriptions of wind statistics that can be readily applied to the calculation of wave climate in areas where fetches are relatively short. Wind data are also important in assessing the importance of aeolian sand transport, which is described in a later section. The Shore Protection Manual and EM 1110-2-1502 provide detailed descriptions of the proper treatment of wind data for use in generating wave data.
(2) Wave statistics for beach fill design. Wave statistics should be determined at the project site to the best level of detail possible. These statistics are normally summarized as a probability distribution of wave heights and wave periods for each increment of compass direction. Most beach profile evolution models require that waves be specified just offshore of the project location in a water depth considered to be the depth of effective motion. The depth of effective motion is the offshore limit of beach profile adjustment and depends upon the time scale of interest (design-level storm). Hallermeier ( 1977) suggests that the annual depth of effective sand motion is approximately equal to twice the significant wave height, which is exceeded 12 hr per year. The distribution of wave heights and periods will include both typical and extreme values, and will indicate the direction from which these values impact the project site.
(3) Wave time series for beach fill design. As described later in this manual, most rigorous methods used for the design and evaluation of potential beach fill performance, i.e. shoreline evolution models, will require time series of storm waves. These data can be obtained from storm hindcasts using numerical wave models, or synthesized from a combination of local wave measurements and known meteorological information.
2·16
( 4) Methods for determining design wave data. The method chosen to determine wave information for beach fill design will depend upon the magnitude of the project, characteristics of the fetch and surrounding shoreline areas, availability of data, and tools available for calculating wave characteristics. Details concerning methods for determining design wave data are presented in EM 1110-2-1414. For small projects or sites with limited fetches, simplified methods for wind and wave estimation should be used, such as those described in the Shore Protection Manual and in the ACES Manual (Leenknecht et al. 1990). For larger projects and those with complex wave generation mechanisms, e.g. open coast areas, the U.S. Army Corps of Engineers Wave Information Study (WIS) has developed off shore, and in some cases nearshore, wave statistics for Atlantic, Gulf of Mexico, Pacific, and Great Lakes coastlines. These types of wave data are also available for extreme storm conditions. WIS wave data can serve as a basis for developing design information at the local project site. WIS data can also provide long-term time series of wave conditions that can be directly used as input to shoreline evolution models. In areas where offshore wave information is not available, such data needs to be developed based on wind statistics for the area of interest and _deepwater wave modeling. Such data should be developed by first hindcasting offshore wind conditions (both individual storms and long-term day-to-day conditions) which would then drive offshore and nearshore wave models to determine the wave conditions near the site of interest.
(a) Local design wave statistics are determined by transforming offshore wave conditions to a nearshore location adjacent to the project site. Wave refraction, shoaling, diffraction, and other relevant shallow-water processes must be considered. EM 1110-2-1414 describes the proper methods to perform these calculations. For small projects simplified methods are available in computerized form in the ACES Manual (Leenknecht et al. 1990). For large projects meriting more detailed wave information, such as areas where the offshore bathymetry and shoreline geometry are complex, or where coastal structures are present, shallow-water wave computer models should be used to generate nearshore design wave data from wind input or to transform offshore wave data to the project site. The Coastal Modeling System (Cialone 1991), provides details of a number of nearshore water wave models applicable to this situation.
(b) As mentioned earlier, rigorous techniques for designing and evaluating beach fills require time series of wave conditions. A hindcast of wave conditions during historic storms, verified by local measurements, is desirable to evaluate the ability of a beach fill design to withstand
short-tenn extreme events. A longer time series of wave conditions spanning several years, if available, can be used to assess the long-tenn evolution of a project Important variables include the time series of wave height, wave period, wave direction, and wave spectra. Coincident coastal wind speed and direction are also important. If the project length is appreciable, or if the shoreline/off shore characteristics vary along the beach, wave hindcast model results should resolve the variations in wave conditions across the project shoreline.
b. Currents. Various types of nearshore currents can affect the potential success of a beach fill project Currents can mobilize sediment and keep material in suspension. There are many documented types of currents that exist in the nearshore region; however, this·section will only outline those currents that have been found to be instrumental in the mobilization and movement of sediment The beach fill design process should include an assessment of the range of possible currents present in the project area and the potential for these currents to impact the stability of the fill material. Extreme currents in the longshore direction may redistribute the fill material in the downdrift direction and eventually carry the sediment out of the project area. Appropriate containment measures within the project area and at the project boundaries should be evaluated and designed in conjunction with beach fills if the potential for transport by currents is excessive.
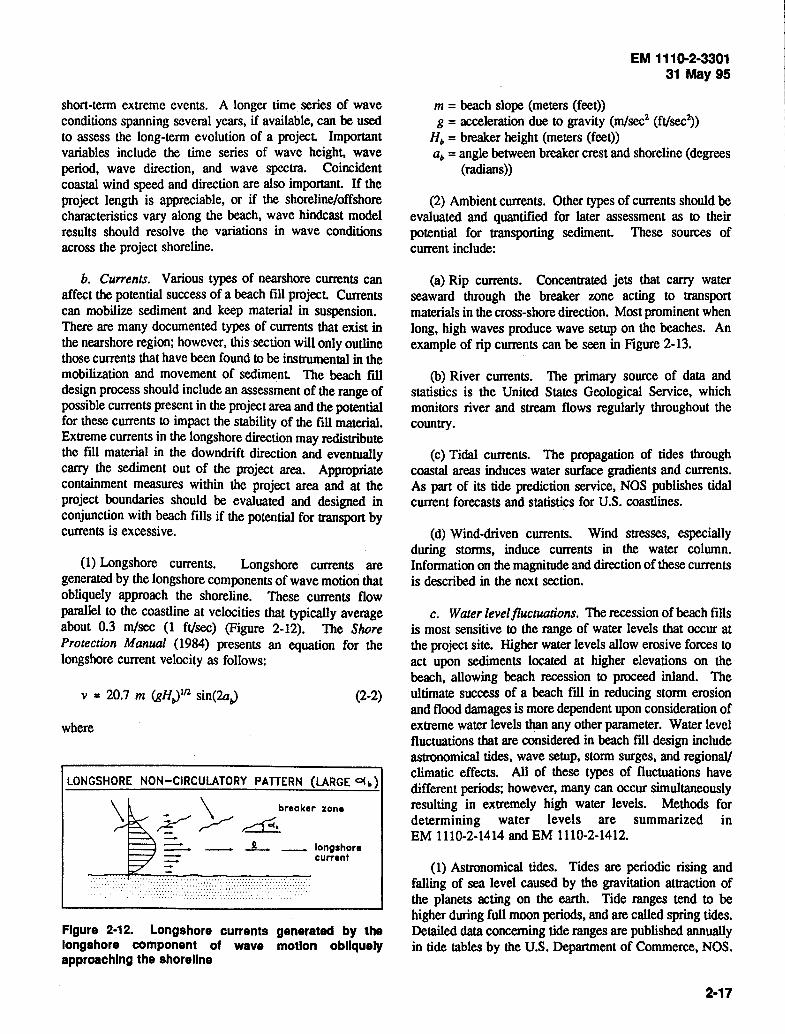
(1) Longshore currents. Longshore currents are generated by the longshore components of wave motion that obliquely approach the shoreline. These currents flow parallel to the coastline at velocities that typically average about 0.3 m/sec (1 ft/sec) (Figure 2-12). The Shore Protection Manual (1984) presents an equation for the longshore current velocity as follows:
v = 20.7 m (gH,) 112 sin(2a,) (2-2)
where
LONGSHORE NON-CIRCULATORY PATTERN (LARGE o<b)
\ breaker zone
~~~ ...!_ langshara
currant
Figure 2·12. Longshore currents generated by the longshore component of wave motion obliquely approaching the shoreline
EM 1110-2·3301 31May95
m =beach slope (meters (feet)) g = acceleration due to gravity (m/sec2 (ft/sec2))
H6 = breaker height (meters (feet)) a6 =angle between breaker crest and shoreline (degrees
(radians))
(2) Ambient currents. Other types of currents should be evaluated and quantified for later assessment as to their potential for transporting sediment. These sources of current include:
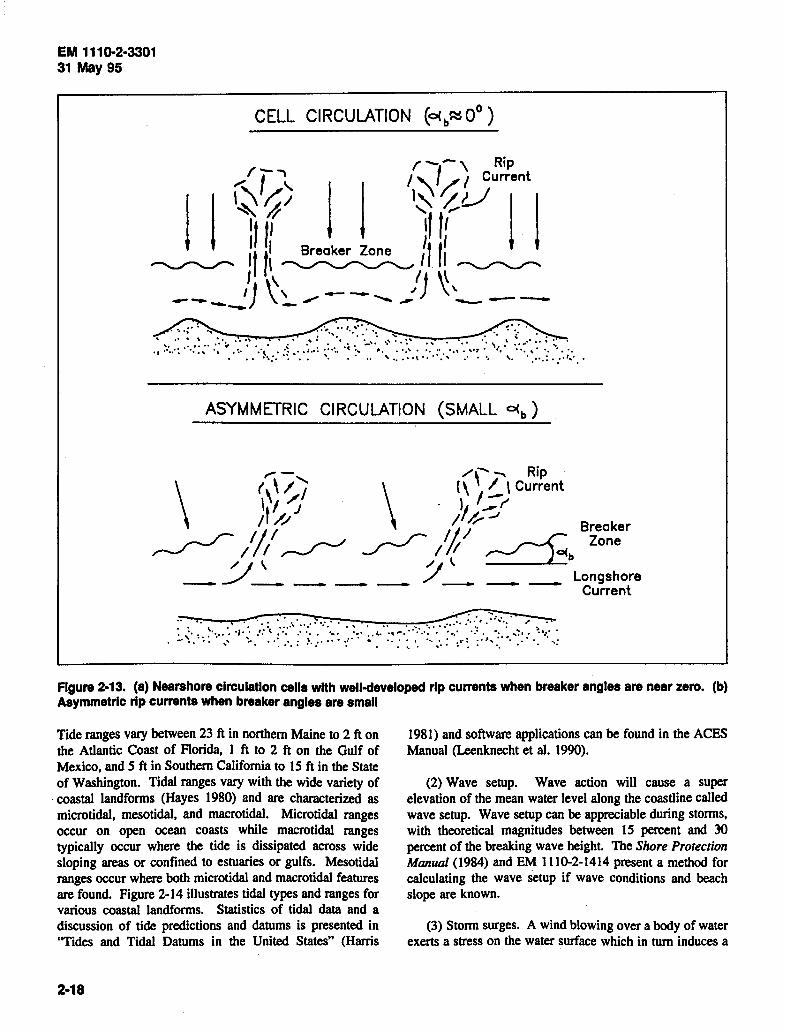
(a) Rip currents. Concentrated jets that carry water seaward through the breaker zone acting to transport . materials in the cross-shore direction. Most prominent when long, high waves produce wave setup on the beaches. An example of rip currents can be seen in Figure 2-13.
(b) River currents. The primary source of data and statistics is the United States Geological Service, which monitors river and stream flows regularly throughout the country.
(c) Tidal currents. The propagation of tides through coastal areas induces water surface gradients and currents. As part of its tide prediction service, NOS publishes tidal current forecasts and statistics for U.S. coastlines.
(d) Wind-driven currents. Wind stresses, especially during storms, induce currents in the water column. Infonnation on the magnitude and direction of these currents is described in the next section.
c. Water level fluctuations. The recession of beach fills is most sensitive to the range of water levels that occur at the project site. Higher water levels allow erosive forces to act upon sediments located at higher elevations on the beach, allowing beach recession to proceed inland. The ultimate success of a beach fill in reducing stonn erosion and flood damages is more dependent upon co1,1sideration of extreme water levels than any other parameter. Water level fluctuations that are considered in beach fill design include astronomical tides, wave setup, stonn surges, and regional/ climatic effects. All of these types of fluctuations have different periods; however, many can occur simultaneously resulting in extremely high water levels. Methods for determining water levels are summarized in EM 1110-2-1414 and EM 1110-2-1412 .
(1) Astronomical tides. Tides are periodic rising and falling of sea level caused by the gravitation attraction of the planets acting on the earth. Tide ranges tend to be higher during full moon periods, and are called spring tides. Detailed data concerning tide ranges are published annually in tide tables by the U.S. Department of Commerce, NOS.
2·17
EM 1110·2·3301 31May95
CELL CIRCULATION (oeb~ 0°)
ASYMMETRIC CIRCULATION (SMALL o<b)
\
(~\ ~/ \ l\\~\ c~:rent \I j . l I~ t /~~~ I // r,,.- Breaker
~ 1!(1 ~ ~ 1'JI ~b Zone /j~ /j\. -
_./ _ / Longshore - --- - -- Current
Figure 2·13. (a) Nearshore circulation cells with well-developed rip currents when breaker angles are near zero. (b) Asymmetric rip currents when breaker angles are small
Tide ranges vary between 23 ft in northern Maine to 2 ft on the Atlantic Coast of Florida, 1 ft to 2 ft on the Gulf of Mexico, and 5 ft in Southern California to 15 ft in the State of Washington. Tidal ranges vary with the wide variety of
· coastal Iandfonns (Hayes 1980) and are characterized as microtidal, mesotidal, and macrotidal. Microtidal ranges occur on open ocean coasts while macrotidal ranges typically occur where the tide is dissipated across wide sloping areas or confined to estuaries or gulfs. Mesotidal ranges occur where both microtidal and macrotidal features are found. Figure 2-14 illustrates tidal types and ranges for various coastal landforms. Statistics of tidal data and a discussion of tide predictions and datums is presented in ''Tides and Tidal Datums in the United States" (Harris
2·18
1981) and software applications can be found in the ACES Manual (Leenknecht et al. 1990).
(2) Wave setup. Wave action will cause a super elevation of the mean water level along the coastline called wave setup. Wave setup can be appreciable during stonns, with theoretical magnitudes between 15 percent and )() percent of the breaking wave height. The Shore Protection Manual (1984) and EM 1110-2-1414 present a method for calculating the wave setup if wave conditions and beach slope are known.
(3) Stonn surges. A wind blowing over a body of water exerts a stress on the water surface which in turn induces a

RIVER DELTAS
IN..ETS
TIDAL DELTAS
TmAL SAND RDXiES
HICRDTIDAL HESCTIDAL
...... . . . . . . . .
HACRDTIDAL
TJllAL. Fl.ATS
EM 1110-2·3301 31 May 95
TIDAL fLATS : :.: : : : ~ : ~ : ~ : ~ : ~ : ·: : ~ : : : : : : : ~
i::i CJ
:-:-:-:-:-:·:-:-:-:· Cl :i:: . . . . . . . . . . . . . .............. ....
SALT HARSH
. . . . . ·. . . . . . . . . ·. . . ·.·.·.·. ·.·.· ... ·.·.·.· . ............. . . . . . . . . . . . . . . ~ .... ..J -:·:-:-:-:·:-:·:-:·:·:·:::: .............. . . . . . . . . . . . . . . . . . . . . . . . . . . .
ESTUARY . . . . . . . . . . . . . . . . . . . . . . . . . . . . . . . . . . . . . . . . . . . . . . . . . . . . . . . . . . . . . . . . . . . . . . . . . . . . . . . . . . . . . . . . . . . . . . . . . . . . . . . . . .............. . . . . . . . . . . . . . . . . . . . . . . . . . . . . . . . . . . . . . . . . . . . . . . . . . . . . . . ............. . . . . . . . . . . . . . . :-:-:-:-:·:-:-:-:·:·:·:-:-:
o -MICRDTIDAL- 2-MESOTIDAL- 4-MACRDTIDAL- 6
TIDAL RANGE <M>
Figure 2·14. Macroscale morphology of mlcrotldal, mesotldal, and macrotldal coastlines (modified from Hayes (1980))
surf ace current in the general direction of the wind. These horizontal currents are impeded in shallow-water areas causing a rise in water level. The storm surge is the departure from the normal water level due to this process and the variations in atmospheric pressure. The severest of storms may produce surges in excess of 8 m (26 ft). Elevation and duration of stonn surge are dependent upon a number of factors: wind velocity, stonn barometric pressure, storm translation speed, latitude, and other effects. Stonn surge statistics have been developed for most coastlines by the National Oceanic and Atmospheric Admin-
istration, are provided in the fonn of storm-induced water level as a function of storm return period, and can be found in EM 1110-2-1412.
(a) More rigorous approaches to beach fill design and evaluation require the availability of stonn time series of water levels. Gauge data are available for some locations and for some isolated events; however, gauge measurements are generally inadequate for providing a complete set of water level data. A storm surge numerical model, calibrated against available local water level gauge data, is the best
2·19

EM 1110-2·3301 31May95
tool available for predicting storm surge. Such a model can simulate all of the complex processes throughout the entire duration of the storm. A complete set of extreme storms can be simulated, providing time series of water levels for use in beach response models if a good statistical base for the determination of design water level elevations is available. Details related to the implementation of such a model can be found in EM 1110-2-1412.
( 4) RegionaVclimatic factors. Coastal areas such as those on the Great Lakes are subject to seasonal and annual changes in water level caused by hydrologic and regulatory control works {dams). In the Great Lakes areas water levels peak during summer and fall to their lowest levels in winter, primarily due to runoff which begins during the spring thaw. Longer term variations in Great Lakes water levels are due to long-term variations in average annual precipitation levels. The maximum difference between the peak water level and the lowest water level observed on the Great Lakes during the period 1900 - 1977 is about 2 m (6 ft). It is recommended that gauge data and statistical analyses of available data be reviewed to determine the importance of these factors in the beach fill design water level.
(5) Sea level rise. An often-ignored component of the design water level at a coastal beach fill site is the longterm rise in sea level. At a beach fill site, this global (eustatic) sea level rise information should be combined with information about coastal shelf sinking rates, plans for local regrading, and other local processes that will determine long-term relative changes in sea level. Using this information, the gradual changes in sea level can be incorporated into the beach fill design and the requirements for long-term renourishment. Historical shoreline change information, which is used as a basis for determining renourishment requirements, includes the effects of past sea level changes. When estimating nourishment requirements for rates of sea level rise different from the historical rate, only the incremental increase in shoreline response due to the incremental difference in projected rate of sea level rise needs to be added to the nourishment requirement.
d. Selection of design conditions. Fills for storm and flood protection will generally be designed for severe storm events and their performance evaluated over a range of storm events with surge elevations up to a 0.02 average annual exceedance frequency event. Storm parameters such as surge elevation and wave height and duration of the storm event, should be delineated for events used to identify the optimum protection.
(1) Average conditions. Average wave, current, and water level values determined for the beach fill site
2·20
should be used to determine the most probable beach profile and planform condition during various seasons. Long-term average wave conditions should be used to estimate longshore transport rates, which will govern the long-term performance of the fill. The GENEralized model for Simulating ~horeline change (GENESIS) described by Hanson and Kraus (1989) is a PC-based program that can be used for estimating long-term longshore transport rates over beach lengths of 1 to 200 km (1 to 125 miles). This program is discussed in greater detail in Section 4-2.
(2) Short-term variability. It must be recognized that wave, current, and water level conditions vary considerably from year to year, season to season, and even day to day at every coastal site. The variation (standard deviation of average wave heights, for instance) of average annual and seasonal records from year to year can be calculated.
(3) Extreme events. Storm conditions will normally result in the most severe design constraints. Design storm events must be developed through an analysis of the entire population of important historical storms that have impacted the area. In the northern Atlantic, northeasters are most prevalent, whereas in the southern United States, hurricanes are most prevalent. The mid-Atlantic states experience a mix of both northeasters and hurricanes, both of which can be extremely severe. As large a population of storms as possible should be examined and preferably hindcast to accurately determine the design level criteria. It should also be recognized that at every design level, there is a risk that more severe storms will impact the area and the implications of such an occurrence must be evaluated. Besides the peak storm parameters such as water level, wave height, period, and direction, the duration of extreme waves, currents, and water levels also determines the recession of beach fills. Along with stage frequency, a shoreline recession frequency will be needed to evaluate the beach fill design.
(4) Long-term variability. As discussed above, certain design parameters will exhibit long-term variability. As an example, seasonal/climatic effects produce pronounced changes in water levels on the Great Lakes. Weather patterns exhibit long-term cycles in temperatures and storm conditions. Such variabilities can be incorporated into the development of design criteria by examining historical data over as long a period as possible, preferably much greater in length than the desired life of the project Larger storm protection and flood control projects often include reviews of data collected over 50 to 100 years of record. Analyzing data over these long time periods will average out the shortterm variability. Short records of design conditions may be biased by both the statistically incomplete record and longterm environmental cycles.

2-6. Coastal Processes
The action of winds, waves, and currents in the coastal zone is constantly occurring and changing. These forces transport beach material in the onshore/off shore direction and along the coast. The design of a beach fill project will account for the range of possible nearshore processes.
a. Nearshore wave transformation. As waves travel into shallow water, they undergo transformations, altering the wave height, length, and direction. This effect begins at a water depth that is approximately one half the deepwater wave length and becomes significant at one fourth the deepwater wave length. Important processes include wave shoaling, breaking, refraction, diffraction, and generation by nearshore winds. The proper treatment of these effects is described in EM 1110-2-1414. Recent developments in numerical computer models have automated the calculations and improved their accuracy. The resulting nearshore wave conditions just offshore of the beach fill site should include wave statistics and time series of the significant wave height, wave period, root mean square (RMS) wave height, and mean wave direction.
b. Runup and overtopping. After propagating through shallow water and breaking through the surf zone, waves encounter the beach and run up the beach face. The ultimate elevation of wave runup is determined by the beach slope and roughness, wave characteristics, and sediment characteristics. If the purpose of a beach fill project is storm and flood protection, the ultimate configuration of the beach fill should be designed to minimize the occurrence of waves overtopping the beach and subsequently flooding inland areas. It should be noted that a selected design will not prevent all damages and will generally result in a certain level of residual damages which cannot be economically eliminated. Runup and overtopping are described in greater detail in Section 4-3.
c. Sediment transport processes. Littoral transport is the movement of coastal sediment in the onshore/offshore direction (perpendicular to the shoreline) and the longshore direction (parallel to the shoreline). In the surf zone, water velocities and eddies beneath breaking waves bring sediment into suspension. Average nearshore current velocities determine the net direction and rate at which sediment is transported.
(1) Onshore/offshore transport. Any location on a beach can be viewed as a profile in the onshore/offshore direction. This two-dimensional representation at a given location along the beach is termed a "beach profile." The beach is an effective mechanism which causes waves to break and dissipate their energy. It is a buffer between the ocean and
EM 1110-2·3301 31May95
the coastal property. The beach profile must maintain its material in order to provide protection to inland areas. Material moves between the beach face and the surf zone as wave and water level conditions change. Various theories exist to describe such movement, which have been put into use through empirical and numerical models. This section describes the phenomenon of onshore/offshore transport; Section 4-2 describes the theories that attempt to simulate the transport phenomenon.
(a) Mild (or summer) beach profiles in general exhibit a wide upper beach or berm, and a smooth monotonic offshore profile with no bars. The wave climate corresponding to such a condition is also mild and water level variations are usually only due to astronomical tides.
(b) Storm (or winter) beach profiles typically have a narrower upper beach or benn and a series of bars through the surf zone. Higher water levels during winter conditions bring wave energy higher up on the beach, carrying the beach benn material out to off shore bars.
(c) The volume of sand in the summer and winter profiles at a given beach location will be essentially constant; however, extreme events may cause a net loss from the area by carrying sediment to offshore locations where it cannot be recovered in less severe conditions. In addition, longshore transport may remove material from the system by carrying sediment to neighboring beach areas.
(d) The concept of "equilibrium profile" is used extensively in the analysis of the response of a beach to long-term or extreme wave conditions. Based on long-term measurements of beach profiles, it has been found that a given profile will tend to maintain a generally consistent shape as long as the beach sediment size and long-tenn wave climate remain constant. The seasonal variations in profile shape discussed above are considered short-term perturbations to the long-term equilibrium profile. The overall equilibrium profile shape has been found to be governed primarily by sediment size characteristics (Dean 1991). Based on studies of beaches in many environments, Bruun (1954) and Dean {1976, 1977) have shown that many ocean beach profiles exhibit a concave shape such that the depth varies as the two thirds power of distance offshore along the submerged portions as defined by:
h(x) = Axm (2-3)
where
h = water depth at distance x from the shoreline (meters (feet))
x = distance from shore (meters (feet))
2·21

EM 1110-2·3301 31 May 95
A = a scale parameter which depends mainly on sediment characteristics (meters113 (feet113
))
This surprisingly simple expression asserts, in effect, that beach profile shape can be calculated from sediment characteristics (particle sii.e or fall velocity) alone. Moore (1982) graphically related the parameter A, sometimes called the profile shape parameter, to the median grain size d50
(Figure 2-15). Dean ( 1987) related the parameter A to the sediment fall velocity (w ). On a log-log plot, the relationship was almost linear and could be expressed as:
A = 0.067wo.44 (2-4)
Hallermeier (1981) developed fall velocity equations for a wide range of beach conditions expressed as:
w = 14 D 1•1 (2-5)
where w is the fall velocity (cm/sec) and D is the mean sediment diameter (mm). A fall velocity based on Equation 2-5 assumes common beach sand with diameters ranging from 0.15 mm to 0.85 mm, water temperatures ranging from 15 to 25 °C, and fresh or salt water.
(2) Longshore transport. Waves breaking at oblique angles to the shoreline generate currents which transport
DISTANCE OFFSHORE (m) 100 200
1-z LL1 :::::t 0 w en
-E -~ w c
5 o-o.6 mm ? : . : .. :·
Equilibrium Beach Profiles for Sand Sizes of 0.2 mm and 0.6 mm A(D•0.2 mm)•0.1 m 1/3, A(D•0.6 mm)=0.20 m1/3.
h=Ax2/3
.... z From Swart's Laboratory Results
0.1 1.0 10.0 100.0
SEDIMENT SIZE, D (mm)
Figure 2·15. Beach proflle factor A versus sediment diameter D In the relatlonshlp h =Ar" (modified from Moore (1982))
2·22
sediment in the longshore direction. Most of this transport occurs within the surf zone. Material is placed in suspension by turbulence generated by breaking waves, and the suspended material is then carried downdrift by the longshore current. Sediment movement also occurs along the bed in areas where wave-induced velocities are appreciable. Over extended periods of time, waves will approach the beach from a wide range of directions causing longshore transport in both directions along the beach as previously shown in Figure 2-9. The total annual amount of transported material is termed the gross transport rate and the difference between the annual amount of material transported in each direction is called the net transport rate. Note that the instantaneous traitsport rate can be extremely variable and much higher or lower than the annual rates. Estimates of longshore transport rates can be made in a number of ways. A combination of the approaches will provide the best estimate of the transport rates and the variability associated with the estimate.
(a) If transport rates have been determined for nearby coastal sites with similar conditions and exposures using one of the methods listed below, that rate can be adapted with modifications based upon local conditions. Care must be taken when adapting rates from other areas because longshore transport rates are very sensitive to wave angle, which is governed by the local orientation of the shoreline, and sediment size, which can vary from beach to beach.
(b) Sediment traps along the coastline can be monitored or reviewed via aerial photos to determine the amount of accumulated material nearby. Traps might be headlands, spits, groins, or surface outfalls. The location of the accumulation can indicate the net direction of movement as previously shown in Figure 2-3. Volumes can be obtained by assuming a constant beach profile over time or by surveys taken prior to and after accumulation.
(c) Commonly accepted formulae for calculating transport rates based upon wave characteristics at the breaker line are given in EM 1110-2-1502 and Chapter 4, Section V-3 of the Shore Protection Manual (1984). Longshore transport rates will indicate how rapidly a beach fill will be carried along the coastline and possibly out of the project area. They will also indicate whether any containment structures might be required to maintain a stable beach fill and if the beach fill will impact neighboring areas.
(3) Overwash. Extreme storm activity often generates high waves and storm surges that flood coastal areas. The incoming flood waters overwash low-lying land, carrying a high concentration of sediment which moves across the beach. The sediment eventually drops from the flood
EM 1110-2·3301 31May95
waters, leaving what is called overwash deposits. The amount of sediment carried and deposited during such events can only be estimated based on historic data, if at all. Beach fill projects can aid in raising coastal land elevations, thus inhibiting overwash.
(4) Aeolian transport. Large volumes of sand can be transported from the beach face and backshore by wind. On oceanfront coastlines, onshore wind transport rates can be as high as 7.5 m3/m (10 yd3/ft) of material per year. Sediment carried into an area by longshore transport or onshore transport can be carried inland by onshore winds, which carry the sand into the backshore area and, in some cases, out of the beach area. Wind velocities required for transport of sand will vary with the sediment size distribution on the beach, wind profile, beach slope, presence of vegetation and fences, and other minor effects. Knowledge of the aeolian transport rate in a given area will indicate the possible fate of a portion of the water-borne sediment and the potential accretion rates in foredune systems.
2·7. Sediment Budget
A sediment budget is a summation of the amount of sediinent in a given period of time that is transported into or out of a designated area. Sediment budget studies of the project area and closely adjacent areas are an important element of beach fill design data because they indicate the amount of erosion or accretion occurring in a designated area due to ongoing natural processes and provide a means of estimating the magnitude of longshore transport. From this data, the initial and periodic maintenance fill volumes needed to meet project requirements can be estimated as shown by EM 1110-2-1502. The principal method of a sediment budget study is to determine the amount of sediment being added to the study area by sediment sources and the amount being lost to sediment sinks. In the context of sediment budget studies, a source is any process or feature contributing sediment to the area as, for example, erosion of a cliff behind the beach or stream discharge. A sink is any process or feature that decreases the amount of sediment in the study as, for example, a submarine canyon or inlet.
a. Cross-shore transport. In common with fluvial features, the movement of sediment peipendicular to the beach can constitute either a source or a sink. In general, it is thought that most movements of this kind occur primarily in the littoral zone which would normally be well within the boundaries established for the sediment budget calculations, and thus would not involve net gain or loss of sediment. However, several sources recently reviewed by Williams and Meisburger (1987) have reported indications of onshore transport from the continental shelf in places. In
2·23

EM 1110·2·3301 31 May 95
some studies evidence of onshore transport from the continental shelf was derived from natural tracers or other indicators that did not provide data on the amount of material involved. In others, however, the evidence was based on sediment budget analyses showing that some sediment reaching the study area probably could not have come from sources other than the inner shelf. The amount of sediment assumed to be shelf-derived in these studies was a significant part of the total sediment supply.
(I) Landward transport of sediment can also act as a sink where storm overwash carries material from the beach beyond the normal inland boundary. These washover features may impound sizable amounts of sand outside the reach of direct marine processes; however, on retreating barrier islands, it may be recycled into the beach deposits at some future date.
(2) Offshore transport of sediment beyond the closure depth may be a significant sink in many places but has not been widely documented. This is probably due more to the expense of obtaining the field data necessary to trace offshore movement than rarity of its occurrence. One way of obtaining information about offshore transport is to account for the losses to other known sinks such as overwash and littoral transport and assume that the difference between total input and known losses represents offshore transport
b. Longshore drift. Frequently the largest volume of sediment moving in a study area is transported by the littoral drift system which moves material alongshore.
(1) Littoral drift acts as both a source and a sink for littoral material within a given segment of shore. If no obstructions to littoral movement exist in the area to retain sediment and the wave angle and height remain constant along the reach, any gains of material from updrift sources may be balanced· by equivalent losses across the downdrift boundary. It is often the case, however, that some of the material is trapped by updrift headlands, inlets, or coastal structures and the loss of material across the downdrift boundary is greater than the input, resulting in a net decrease of sediment volume. In some instances, the input of sediment from all sources is greater than the losses and there is a net increase in volume. However, this additional material may be concentrated in a small area, for example, inlet-associated shoals, so that a deficiency exists for most of the study area.
(2) The movement of littoral material in a shore-parallel direction is called longshore transport. The rate of longshore transport is expressed as the volume of material moving past a fixed point during a given period of time.
2·24
The movement can be either to the right or left of an observer looking seaward from the fixed reference point. The gross longshore transport rate Q, is the sum of the material moving both to the right Q" and left Q,, of the observer. Thus,
Q, = Qrl + Qlt (2-6)
The net longshore transport rate QM is an expression of the difference in the rate of movement to the right and left of the observer. Thus, longshore transport rates can be estimated by a number of different methods (see EM 1110-2-1502).
c. Aeolian processes. Wind can act as both a source and sink of beach and dune sediment. Wind is usually a sink for beach sediment which is picked up from the dry backshore area and carried inland or out to sea. On dunebacked coasts, windblown sand from the dry beach backshore area is the most important source of the dune sediments. Unless well stabilized, however, dunes can also lose large amounts of sand by wind deflation. In making quantitative evaluations of aeolian influence, it is difficult to discriminate between wind and wave effects on the beach and frontal dunes. Estimates of transport volumes can be made by using sand traps to intercept windbome sediment coupled with frequent measurements of wind velocity and direction. Changes in dune topography depicted on sequential maps or aerial photographs over specific time intervals can also be used to calculate losses of dune sediment; however, dune fields are often so complex that calculating overall losses or gains requires a large amount of detailed data and frequent surveys. In most cases, evaluation of gains or losses can be limited to the frontal dunes which are the most significant in terms of shore protection. .
d. Organic production. Almost all beaches contain some material composed of the skeletal hard parts of marine flora and fauna living in the beach and nearshore areas. Mollusks are the chief contributors in most places, but a number of other organisms also add material.
(1) Organically produced (biogenic) particles in beach sediments may have been produced locally or have been transported from other areas. Some biogenic particles such as echinoid fragments and some calcareous algae are delicate and probably survive only a short time in the turbulent beach environment. In addition, some organic material is so easily transported that it seldom accumulates on the beach but moves to deeper water offshore where it is more stable.
(2) In general, on the coasts of the United States,

biogenic contributions to beach sediment are relatively small in most places; however, locally, where detrital sediment supply is low, organic-production is relatively high, or fossil shell material is being uncovered, the biogenic contribution can be significant
(3) Since the skeletal fragments found in beach deposits are nearly all composed of calcium carbonate, the approximate weight percentage of biogenic material can be detennined by an acid digestion test of representative sub-samples.
(4) Because calcium carbonate particles are not as hard as quartz and other inorganic minerals in beach deposits, they are abraded at a faster rate. Although shell fragments in beach deposits often have rounded edges and a polished surface due to abrasion, little is known about the time needed to abrade the particles until they are too small to be retained on the beach and move offshore.
e. Tidal inlets. Tidal inlets may at times be sources of sediment derived from estuaries or back-barrier deposits but for the most part, these sediments are too fine to persist in the littoral zone and are transported offshore. By far, the main effect of tidal inlets is as sediment sinks which trap or deflect material moving in the littoral stream as previously illustrated. in Figure 2-6. The exception is a beach on the downdrift side of a tidal inlet which may receive a significant percentage of its sand supply by inlet bypassing processes.
(1) Much of the material trapped by inlets is deposited in ebb, flood, and mid-channel (middle ground) shoals in the immediate vicinity of the inlet. Where tidal currents are strong, some of the littoral material may be carried seaward by the ebb current to be deposited in offshore areas.
(2) Tidal inlets can influence the sediment budget for shore areas a considerable distance downdrift of the inlet itself. For this reason, inlets updrift of the project boundaries should be considered in an analysis of sediment gain or loss in the project area.
(3) Estimates of the amount of sediment from the longshore drift trapped at inlets can be made by comparative analysis of sequential maps, charts, and aerial photography documenting the growth of inlet-associated shoals and dredging records of the inlet channel.
f. Submarine canyons. Submarine canyons are prominent features incised in the continental shelf and the slope bordering coastal areas. Where these features approach the shore they become effective traps for littoral and nearshore sediments moving in an alongshore direction.
EM 1110-2·3301 31May95
Once trapped in the canyon, the material progressively moves seaward into deep water and is permanently lost.
2·8. Existing Structures
Since beach fill operations are often undertaken to restore eroding beaches, they may contain hard structures that have been previously constructed in an attempt to stabilize the beach and protect inland areas. In some cases, it may be desirable to remove the structures prior to the fill operation to restore more natmal conditions and enhance recreational and environmental quality. In other cases, the structures may be retained to retard loss of fill material or provide continued protection to inland areas. In order to make decisions on the disposition of structures and evaluate their function on the postfill beach, an inventory of existing hard structures should be a part of the site characterization study. The inventory should include inf onnation on the location, type, condition, and effectiveness of existing structures and their probable function on the beach after project completion. If possible, the original design data for the structures should be obtained for basic information and comparis0n with current conditions.
a . . Location and dimensions. The location of each coastal structure in the project area should be detennined and plotted on large-scale maps or identified on aerial photographs. Major dimensions should be obtained from original design drawings, if available, or measured onsite.
b. Structure types and materials. There are several types of hard structures built in coastal areas to retard shore erosion, trap sand in the littoral stream, and protect inland areas against flood and wave damage. The most common types of these coastal structures are seawalls, revetments, bulkheads, groins, and breakwaters. Detailed examples and discussion of these structures can be found in EM 1110-2-1614, EM 1110-2-1617, EM 1110-2-2904, and the Shore Protection Manual (SPM) (1984).
(1) Seawalls are usually massive structures used to protect inland areas against floods and large storm waves. Revetments serve the same purpose but are of lighter construction and suited to withstand relatively low-energy waves. Bulkheads are used to retain fill and prevent collapse of cliff faces. Although designed to withstand outward forces, they are often erected in places exposed to wave attack and must be designed to withstand expected wave forces (see EM 1110-2-1614).
(2) Groins are low-wall-type structures sited perpendicular to the shoreline that are erected to trap and hold sand moving in the littoral stream. Offshore breakwaters have been used as beach erosion control structures as well as for
2·25

EM 1110·2·3301 31 May 95
harbor protection. They are usually located in relatively shallow water and are often segmented to allow some of the wave energy to reach the shore and maintain longshore processes (see EM 1110-2-1617). Jetties, although primarily intended to stabilize and protect navigation channels, may have a pronounced effect on the adjacent shore areas and should be included in the inventory (see EM 1110-2-2904).
(3) The useful life of hard structures is partly determined by the materials from which they are constructed. The most common materials found in coastal structures are concrete, asphalt, stone, steel, and timber. Descriptions of coastal structures for the site characterization study should include information on the materials used for their construction and the form in which used, e.g., cast concrete, concrete rubble, concrete sheet piling.
c. Condition. In time, all coastal structures deteriorate. Their longevity as effective structures depends on their design, materials from which they are constructed, severity of the environment, and maintenance. Some structures may be severely damaged or destroyed during the course of a single storm while others survive intact for long periods of time. The condition of all coastal structures in the project area should be determined by thorough onsite inspection for any signs of damage or deterioration that render them less functional or increase vulnerability to damage by environmental forces.
d. Effectiveness. An important consideration in regard to existing coastal structures is how well they have fulfilled their design function. In many instances, coastal structures do not fully meet their purpose because of rapid deterioration or damage, inadequate design, or poor construction. In addition, some structures function adequately but create environmental problems that outweigh any benefits they
2·26
produce, for example, a groin field that creates serious sediment deficiencies in downdrift areas. Evaluation of structure effectiveness is based on knowledge of its original purpose and past construction history. Valuable sources for this knowledge are the original design data, post-project monitoring reports, sequential aerial and ground photography, and recollection of local residents. Historical records of wave and water level fluctuations are also valuable in assessing the causes of structural damage.
e. Effects on project. Where coastal structures already exist in a project area, an evaluation should be made of whether or not they will have an adverse, neutral, or beneficial effect on the projecL The analysis techniques and numerical models discussed in Chapter 4 of this report may be used in this evaluation.
(1) In cases where pre-existing structures have been damaged, have produced no beneficial effect, or have negative effects on the environment or recreation, it may be desirable to remove them prior to project construction.
(2) Structures that are functional and are expected to have a continued beneficial effect are best left in place unless environmental or aesthetic values should dictate otherwise.
(3) Of the structures that may be present in a project area, groins, jetties, and detached offshore breakwaters have the most direct effect on beach fill operations because they tend to retard losses of fill material. In evaluating these structures, it is desirable to obtain as much information as possible on their past performance in order to make a reasonable prediction of their performance before (withoutproject condition) and after the fill operation (with-project condition).
Chapter 3 Borrow Site Characteristics
3-1. Borrow Source Types
Borrow sources for beach fill can be divided into four general categories: terrestrial, back-barrier, offshore, and navigation channels. Each category has favorable and unfavorable aspects; however, selection of an optimum borrow source depends more on individual site characteristics relative to project requirements than type of source.
a. Terrestrial sources. Terrestrial sources of material suitable for beach fill can be found in many coastal areas. Ancient fluvial and marine terrace and channel deposits, and certain glacial features such as eskers and outwash plains often contain usable material. Because of their potential economic value, information on sand and gravel deposits is often collected by state geological surveys. With this information, field investigations can be focused on a few likely sources, thus eliminating the need for more general exploration. In some places, existing commercial sand and gravel mining operations may provide suitable material for direct purchase. In their absence, it would be necessary to loca~e a suitable deposit and set up a borrow operation specifically for the project. Use of terrestrial borrow sites usually involves lower costs for mobilization-demobilization operations and plant rental, and less weather downtime than the use of a submerged borrow source. However, the productio.n capacity of terrestrial borrow operations is comparatively low, and haul distances may be relatively long. Thus, costs per unit volume of placed material may exceed those from alternate submerged sites. In general, terrestrial borrow sources are most advantageous for .projects where exploration and mobilization-demobilization costs are a relatively large part of overall expenses for the fill operation.
b. Back-barrier sources. Sediment deposits in the backbarrier marsh, tidal creek, and lagoon environments behind barrier island~ and spits have been used for beach fill. They are an attractive source of fill because they are protected from ocean waves and are often close enough to the project beach to allow direct transfer of the material by pipeline. This eliminates the need for separate transport and transfer operations. However, most back-barrier sediments are too fine-grained to use as beach fill. In addition, some backbarrier areas are highly important elements in the coastal ecosystem and are sensitive to disturbance and alteration by dredging (EM 1110-2-1204).
( 1) The occurrence of material in back-barrier sediments
EM 1110-2·3301 31 May 95
that is coarse enough for consideration as beach fill is generally confined to overwash deposits and flood tidal shoals associated with active or relict inlets. Overwash deposits occur on the landward margin of the barrier where storm waves have carried beach and dune sediments across the island or spit. Flood tidal shoals occur inshore of tidal inlets and consist of sediment transported by tidal currents flowing in and out of the inlet. These sediments are usually transported into the inlet-influenced area by tidal current processes and can be derived from littoral drift from adjacent beaches.
(2) Overwash deposits and relict flood tidal shoals may be ecologically important because they may provide suitable substrate for marsh growth. In addition, on retreating barriers, they comprise a reserve of sand that will be recycled into the active beach deposits as retreat progresses. Flood tidal shoals associated with an active inlet are more suitable for borrow sites because the material removed is likely to be replaced by ongoing inlet processes. However, dredging material from active flood tidal shoals can adversely alter the hydraulic conditions in the inlet area. A study of the hydraulic effects should be made prior to altering the flood tidal shoals by dredging. For further detailed information on the hydraulic effects of dredging see EM 1110-2-1618.
c. Navigation channels. Creation of navigation channels and deepening or maintenance dredging of existing channels often involve the excavation and disposal of large volumes of sediment. In some cases where the dredged sediment is of suitable quality, it can be used as fill on nearby beaches rather than placing it in offshore, upland, or contained disposal sites. Operations of this type are economically attractive because dual benefits are realized at considerably less cost than possible if both operations were carried out separately. Details concerning the use of dredged material for beach fill are discussed in EM 1110-2-1616.
( 1) Maintenance dredging of channel fill in low-energy environments such as estuaries or protected bays is least likely to produce suitable fill material. In such areas, channel fill often consists of material in the clay, silt, and very fine sand size range. However, in dredging of new channels or deepening of existing channels in low-energy areas, the dredge may cut into relict material of suitable characteristics.
(2) Channel fill from higher energy areas such as rivers above tidewater and open coast inlet shoals is often more acceptable for beach fill. On barrier coasts, inlet fill usually consists of beach material that has been carried to the inlet by littoral drift. It needs to be determined if the borrow
3-1
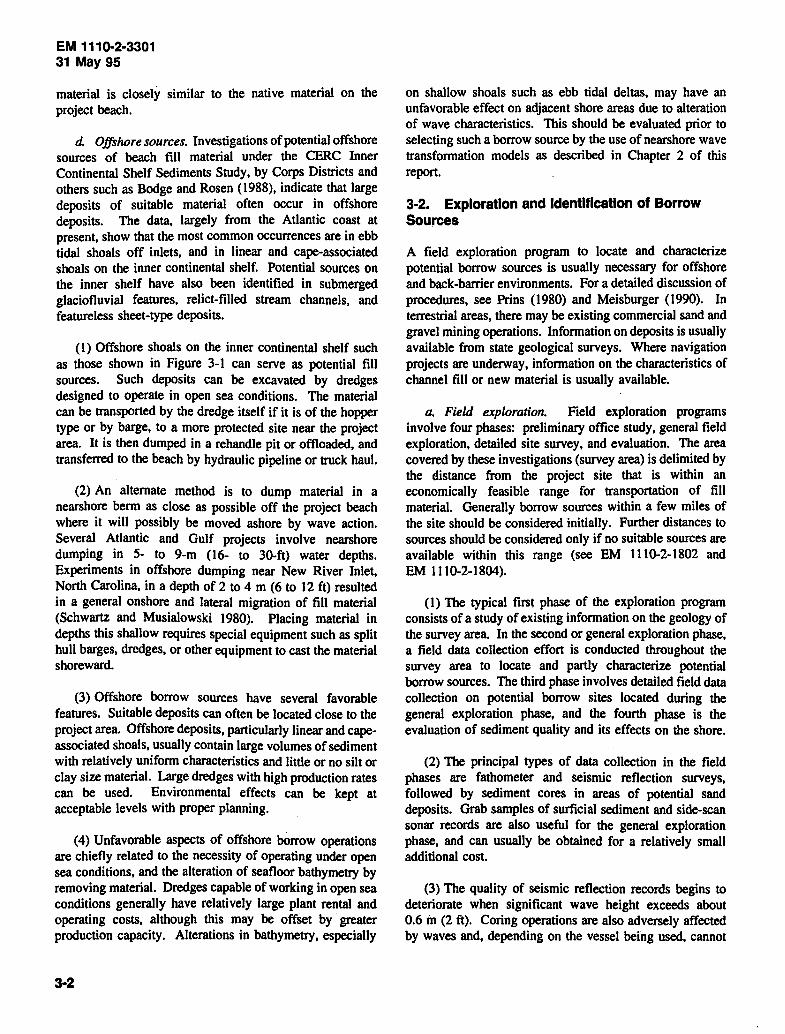
EM 1110-2·3301 31 May 95
material is closely similar to the native material on the project beach.
d. Offshore sources. Investigations of potential offshore sources of beach fill material under the CERC Inner Continental Shelf Sediments Study, by Corps Districts and others such as Bodge and Rosen ( 1988), indicate that large deposits of suitable material often occur in offshore deposits. The data, largely from the Atlantic coast at present, show that the most common occurrences are in ebb tidal shoals off inlets, and in linear and cape-associated shoals on the inner continental shelf. Potential sources on the inner shelf have also been identified in submerged glaciofluvial features, relict-filled stream channels, and featureless sheet-type deposits.
( 1) Offshore shoals on the inner continental shelf such as those shown in Figure 3-1 can serve as potential fill sources. Such deposits can be excavated by dredges designed to operate in open sea conditions. The material can be transported by the dredge itself if it is of the hopper type or by barge, to a more protected site near the project area. It is then dumped in a rehandle pit or offloaded, and transferred to the beach by hydraulic pipeline or truck haul.
(2) An alternate method is to dump material in a nearshore berm as close as possible off the project beach where it will possibly be moved ashore by wave action. Several Atlantic and Gulf projects involve nearshore dumping in 5- to 9-m (16- to 30..ft) water depths. Experiments in offshore dumping near New River Inlet, North Carolina. in a depth of 2 to 4 m (6 to 12 ft) resulted in a general onshore and lateral migration of fill material (Schwartz and Musialowski 1980). Placing material in depths this shallow requires special equipment such as split hull barges, dredges, or other equipment to cast the material shoreward.
(3) Offshore borrow sources have several favorable features. Suitable deposits can often be located close to the project area. Offshore deposits, particularly linear and capeassociated shoals, usually contain large volumes of sediment with relatively uniform characteristics and little or no silt or clay size material. Large dredges with high production rates can be used. Environmental effects can be kept at acceptable levels with proper planning.
(4) Unfavorable aspects of offshore bOn'ow operations are chiefly related to the necessity of operating under open sea conditions, and the alteration of seafloor bathymetry by removing material. Dredges capable of working in open sea conditions generally have relatively large plant rental and operating costs, although this may be offset by greater production capacity. Alterations in bathymetry, especially
3-2
on shallow shoals such as ebb tidal deltas, may have an unfavorable effect on adjacent shore areas due to alteration of wave characteristics. This should be evaluated prior to selecting such a borrow source by the use of nearshore wave transformation models as described in Chapter 2 of this report.
3·2. Exploration and Identification of Borrow Sources
A field exploration program to locate and characterize potential borrow sources is usually necessary for offshore and back-barrier environments. For a detailed discussion of procedures, see Prins (1980) and Meisburger (1990). In terrestrial areas, there may be existing commercial sand and gravel mining operations. Information on deposits is usually available from state geological surveys. Where navigation projects are underway, information on the characteristics of channel fill or new material is usually available.
a. Field exploration. Field exploration programs involve four phases: preliminary office study, general field exploration, detailed site survey, and evaluation. The area covered by these investigations (survey area) is delimited by the distance from the project site that is within an economically feasible range for transportation of fill material. Generally borrow sources within a few miles of the site should be considered initially. Further distances to sources should be considered only if no suitable sources are available within this range (see EM 1110-2-1802 and EM 1110-2-1804).
( 1) The typical first phase of the exploration program consists of a study of existing information on the geology of the survey area. In the second or general exploration phase, a field data collection effort is conducted throughout the survey area to locate and partly characterize potential borrow sources. The third phase involves detailed field data collection on potential borrow sites located during the general exploration phase, and the fourth phase is the evaluation of sediment quality and its effects on the shore.
(2) The principal types of data collection in the field phases are fathometer and seismic reflection surveys, followed by sediment cores in areas of potential sand deposits. Grab samples of surficial sediment and side-scan sonar records are also useful for the general exploration phase, and can usually be obtained for a relatively small additional cost.
(3) The quality of seismic reflection records begins to deteriorate when significant wave height exceeds about 0.6 in (2 ft). Coring operations are also adversely affected by waves and, depending on the vessel being used, cannot
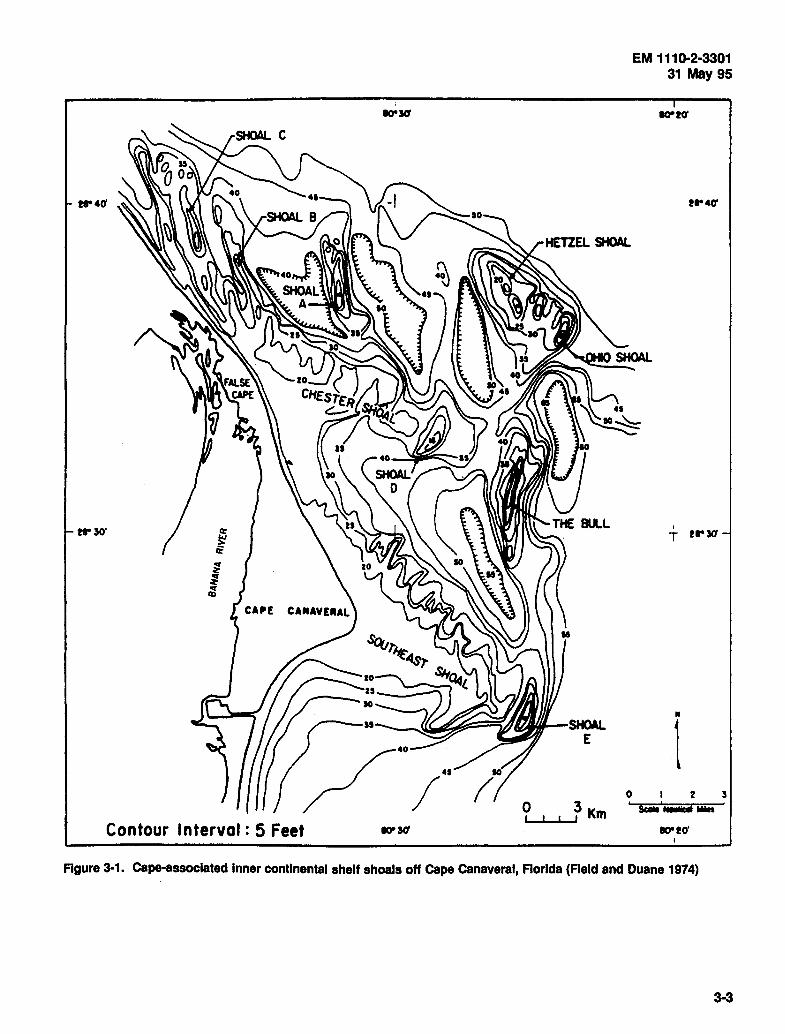
!1"40'
!I" 30' ct: ~ ~
; ; ~
SHOAL E
0 ~Km Contour Interval: 5 Feet
0 '
EM 1110-2·3301 31 May 95
IO'"IO'
' T !r!O'
•
1 I 2 3
SCiili0
iiiliiiti11e1
IO"!O' I
Figure 3-1. Cape-associated Inner continental shelf shoals off cape Canaveral, Florida (Reid and Duane 1974)
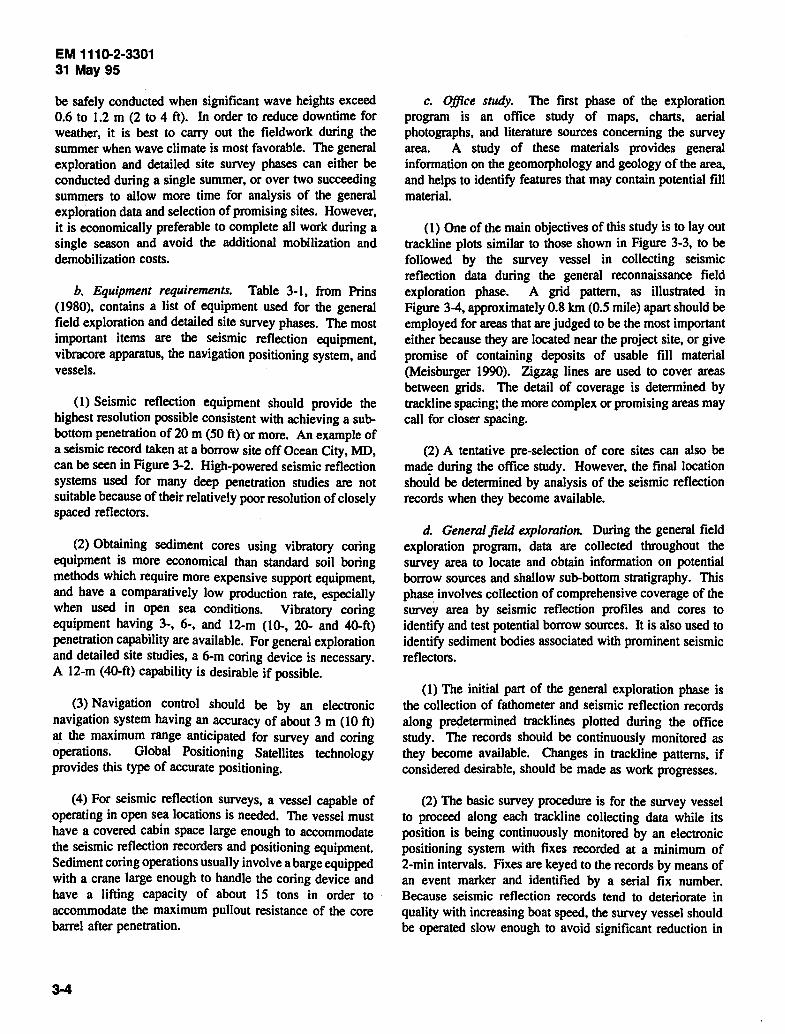
EM 1110-2·3301 31 May 95
be safely conducted when significant wave heights exceed 0.6 to 1.2 m (2 to 4 ft). In order to reduce downtime for weather, it is best to cany out the fieldwork during the summer when wave climate is most favorable. The general exploration and detailed site survey phases can either be conducted during a single summer, or over two succeeding summers to allow more time for analysis of the general exploration data and selection of promising sites. However, it is economically preferable to complete all work during a single season and avoid the additional mobilization and demobilization costs.
b. Equipment requirements. Table 3-1, from Prins ( 1980), contains a list of equipment used for the general field exploration and detailed site survey phases. The most important items are the seismic reflection equipment, vibracore apparatus, the nawigation positioning system, and vessels.
( 1) Seismic reflection equipment should provide the highest resolution possible consistent with achieving a subbottom penetration of 20 m (50 ft) or more. An example of a seismic record taken at a borrow site off Ocean City, MD, can be seen in Figure 3-2. High-powered seismic reflection systems used for many deep penetration studies are not suitable because of their relatively poor resolution of closely spaced reflectors.
(2) Obtaining sediment cores using vibratory coring equipment is more economical than standard soil boring methods which require more expensive support equipment, and have a comparatively low production rate, especially when used in open sea conditions. Vibratory coring equipment having 3-, 6-, and 12-m (10-, 20- and 40-ft) penetration capability are available. For general exploration and detailed site studies, a 6-m coring device is necessary. A 12-m (40-ft) capability is desirable if possible.
(3) Navigation control should be by an electronic navigation system having an accuracy of about 3 m (10 ft) at the maximum range anticipated for survey and coring operations. Global Positioning Satellites technology provides this type of accurate positioning.
( 4) For seismic reflection surveys, a vessel capable of operating in open sea locations is needed. The vessel must have a covered cabin space large enough to accommodate the seismic reflection recorders and positioning equipment. Sediment coring operations usually involve a barge equipped with a crane large enough to handle the coring device and have a lifting capacity of about 15 tons in order to accommodate the maximum pullout resistance of the core barrel after penetration.
c. Office study. The first phase of the exploration program is an office study of maps, charts, aerial photographs, and literature sources concerning the survey area. A study of these materials provides general information on the geomorphology and geology of the area, and helps to identify features that may contain potential fill material.
(1) One of the main objectives of this study is to lay out trackline plots similar to those shown in Figure 3-3, to be followed by the survey vessel in collecting seismic reflection data during the general reconnaissance field exploration phase. A grid pattern, as illustrated in Figure 3-4, approximately 0.8 km (0.5 mile) apart should be employed for areas that are judged to be the most important either because they are located near the project site, or give promise of containing deposits of usable fill material (Meisburger 1990). Zigzag lines are used to cover areas between grids. The detail of coverage is determined by trackline spacing; the more complex or promising areas may call for closer spacing.
(2) A tentative pre-selection of core sites can also be made during the office study. However, the final location shouid be determined by analysis of the seismic reflection records when they become available.
d. General field exploration. During the general field exploration program, data are collected throughout the survey area to locate and obtain information on potential borrow sources and shallow sub-bottom stratigraphy. This phase involves collection of comprehensive coverage of the survey area by seismic reflection profiles and cores to identify and test potential borrow sources. It is also used to identify sediment bodies associated with prominent seismic reflectors.
(1) The initial part of the general exploration phase is the collection of fathometer and seismic reflection records along predetermined tracklines plotted during the office study. The records should be continuously monitored as they become available. Changes in trackline patterns, if considered desirable, should be made as work progresses.
(2) The basic survey procedure is for the survey vessel to proceed along each trackline collecting data while its position is being continuously monitored by an electronic positioning system with fixes recorded at a minimum of 2-min intervals. Fixes are keyed to the records by means of an event marker and identified by a serial fix number. Because seismic reflection records tend to deteriorate in quality with increasing boat speed, the survey vessel should be operated slow enough to avoid significant reduction in

Table 3-1 Equipment Used for General Fleld Exploratlon
Seismic Operations (1) Research vessel:
11.6-m (38-ft) minimum length 3.7-m2 (40-sq-ft) minimum table space 40-sq-ft minimum deck space 11 O-volt a.c. power Compass (gyrocompass desirable) Marine radio Cruising range: 160.9-km (100-mile) minimum Cruising speed: 10-knot minimum
(2) Sub-bottom profiling system: (a) Medium resolution, medium penetration
Penetration capability: 15.2 to 61.0 m (50 to 200 ft)
Power output: 300 to 1,000 J Frequency range: 400 Hz to .14 KHz
(b) High resolution, low penetration Penetration capability: 9.1 m (30 ft) Power output: 10 Kw Frequency range: 3.5 to 7 KHz
(3) Side-scan sonar system: Frequency range: 95 to 100 KHz Port and starboard scanning capability 142.4-m (500-ft) range in either direction
(4) Geographic positioning system: Range: 32.2-km (20-mile) minimum Accuracy: 1 O ft
(5) Microprocessor: Interfacing capabilities with positioning system
(6) Radios: (a) Marine-band radio (b) Two-way radio
(7) Vehicles: Three minimum for shore personnel
record quality. In general, a suitable boat speed is likely to be less than 2 or 3 mis (4 or 5 knots).
(3) Sediment core sites are usually selected after the seismic reflection survey to allow time for preliminary analysis of the records to determine the most effective core locations. Cores should be examined as they are taken and changes made in the coring locations if it is desirable. Core inspection is often hampered by silt and scratching of the . acrylic core liners. However, the top and bottom sediments can be directly viewed before the core is capped.
(4) The coring platform, usually a barge, should be equipped with spud legs or suitable anchors for mooring the platform securely. With vibratory coring equipment that is
Coring Operations (1) Coring platform:
(a) Tug and barge
EM 1110-2·3301 31May95
Tug: capable of 14.6-km (8-knot) minimum with barge in tow
Barge: Sufficient deck space to accommodate coring device, crane, compressor, and core storage; or
(b) Ship: Requirements same as barge
(2) Reconnaissance boat: 9.8-m (32-ft) minimum length 0.9-m2 (1 O-sq-ft) minimum table space 110-volt a.c. power Compass Cruising range: 100-mile minimum Cruising speed: 10-knot minimum
(3) Geographic positioning system: Range: 32.2-km (20-mile) minimum Accuracy: 1 O ft
(4) Coring device, vibrating: Capable of 20· to 40-ft cores
• (5) Compressor: 8.4 kglm2 (120 psi) at 7.1 m3 (250 tt3) per minute
(6) Crane: 10-metric-ton (11-short-ton) minimum 30-ft minimum boom length
(7) Bottom grab sampler: Various types available
(8) Miscellaneous: Floats, cord, and anchor weights Logbooks and office supplies Batteries Sample bags and waterproof markers Tools, cables, clamps, and other hardware
bottom-mounted and connected with the platform only by a retrieving cable and air hoses, small excursions in position are acceptable.
e. Detailed site survey. The third phase of borrow site exploration and investigation consists of a detailed study of potential sites selected on the basis of data collected during the general exploration survey. In most prior studies conducted by CERC the general and detailed surveys were made in succeeding years so that ample time was available to study results of the seismic reflection survey before coring was undertaken. However, it is possible to complete the operation entirely in one season. This can be done by mobilizing both geophysical and coring equipment early in the most favorable season and using a sufficient lag time
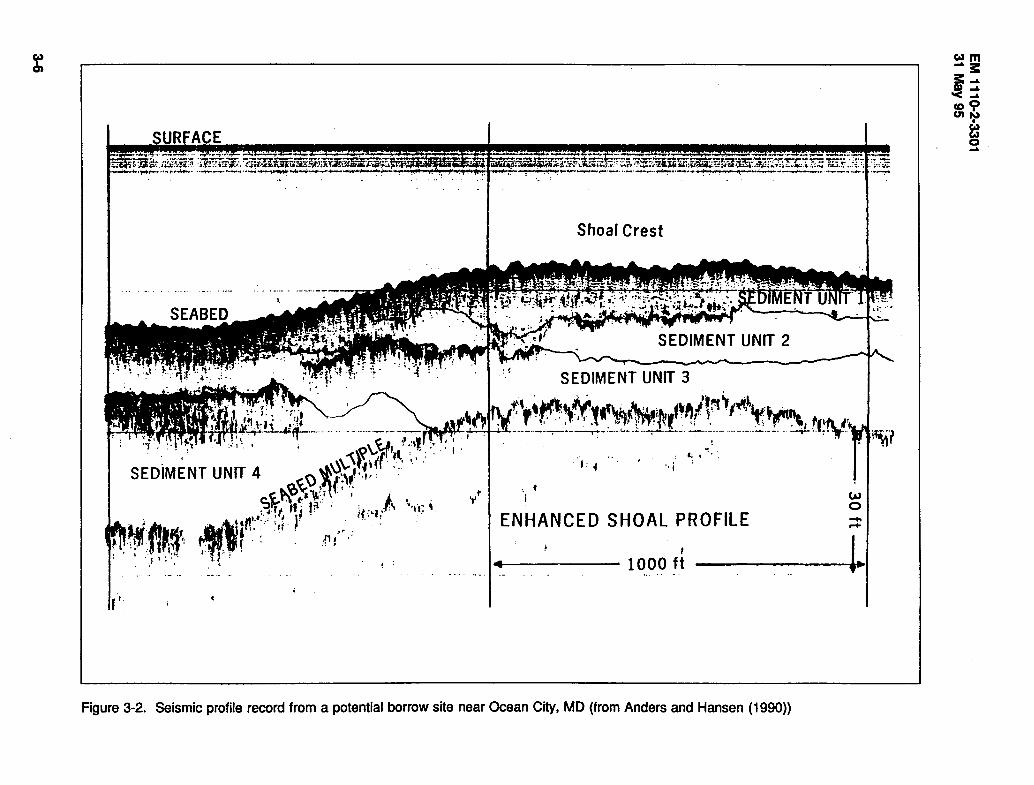
G t\~~'\t: 1 (, ·; . , . 't/ ~II:", ,, . fit . : .;... '·~1-, ' "~ . t ' . 1# :•t ,"
'~:in' ... ': .. ' ·,:J- ... ·= ..
r · · . .'fl i •,, .
·1.:r·:
f'
' t i
Shoaf Crest
SEDIMENT UNIT 3
~
I;.'
ENHANCED SHOAL PROFILE
' ------1000 ft
Figure 3-2. Seismic profile record from a potential borrow site near Ocean City, MD (from Anders and Hansen (1990))
w 0 -......
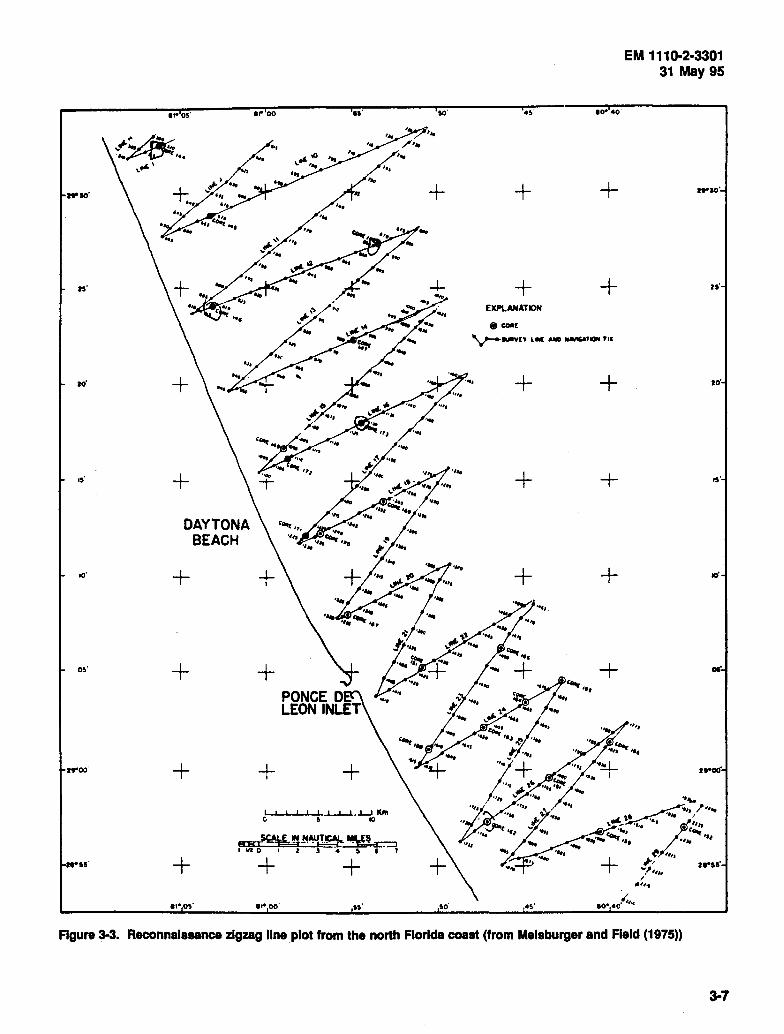
u·
to'
10'
~·
... 05'
+ DAYTONA
BEACH
+
+
+
,,. 00 as·
+
+ + 1 , , , , 1 -1..-L.-L • .LJ Krn c 5 ~
~ALE !!t~~Tft~ 1&110 I 2 J 4 I 6 1
+ + + a1•0!' ... 00.
+ + +
-4- + + EXPLANATION
@) COii[
V-.-vt• LM AICI -llGll ~11
+ +
+ +
+ +
+
so·
EM 1110-2·3301 31May95
H'
ao'
os'
,..
Figure 3-3. Reconnaissance zigzag line plot from the north Florida coast (from Melsburger and Fleld (1975))
3-7

EM 1110-2·3301 31May95
Vero Beach
,,.
lndrio
51. LUCll
I IO"IO"
Fort Pierce
ll'lt' +
.,.
-- . 10·
-·
JO'
.. ,,
.. EXPLANATION
• c .. L s .. ..., LIM- ........ fil
~c••,.,.. - - -IO"OI'
Figure 3-4. Grid lines covering a detailed survey area off Fort Pierce, Florida {from Melsburger and Duane (1971))
between the seismic and coring work so that time is available for record analyses and core site selection to be made. For this purpose one member of the field crew will devote full time to analysis of records on a day-to-day basis to pick core sites for the ongoing coring phase.
( 1) If sufficient seismic reflection data were collected on potential sites during the general exploration phase, the detailed site study may involve only collection of additional core data. However, it is important to have adequate data for reliably defining the borrow site. Additional seismic reflection data, if needed, should be collected at this time.
(2) A sufficient number of cores of potential borrow sites should be obtained to thoroughly define the stratigraphy and sediment characteristics. Since core sites will be relatively close in the selected areas, a larger number of cores can be obtained at less cost in the general exploration phase. The bulk of the available time is spent moving between coring stations rather than on the coring process itself. The number of cores and spacing between cores should be determined by a review of survey and seismic data as well as other geological studies of the area. These values will vary across and between borrow sites.
3-3. Site Characterization Requirements
Any beach erosion or shore protection study in which beach fill is considered should contain information on potential borrow sources and a comparative evaluation of their suitability. The characteristics of potential borrow sources that are most important in evaluating suitability are location, accessibility, volume of material available, site morphology, stratigraphy, sediment characteristics, geological history, environmental factors, and economic factors ..
a. Location. The location of a borrow site with respect to the project area is an important consideration in evaluating suitability. The distance that material must be moved and feasible means of transport have a large influence on project costs and may be decisive in selecting the most suitable source. Location is also important in terms of the surroundings. Terrestrial sources located in built-up areas may have a direct impact on the population by creating undesirable noise and traffic congestion. Offshore sources may involve questions of jurisdiction and be situated in areas where dredging and transport activities impede or endanger navigation.
b. Accessibility. In order to be usable, a borrow source must be accessible to or made accessible for the equipment needed to excavate and transport the material. Access to terrestrial deposits may involve road construction or
EM 1110-2·3301 31May95
improvement of existing routes. Onsite reconnaissance is the best method of finding out the adequacy of access and any necessary improvements. A cost estimate of needed work should be prepared and included in the economic analysis.
(1) In evaluating subaqueous deposits, one of the principal factors is water depth. To be accessible, the deposit must lie in the depth range between the maximum depth to which the dredge can excavate material, and the minimum depth to keep the dredge afloat.
(2) Another aspect of accessibility is presence of overburden above the usable material. The composition, areal extent, and thickness of any overburden should be determined and considered in the economic analysis.
c. Volume available. Most beach fill projects require large volumes of suitable fill material. The volume of material in each potential source must be calculated to determine if a sufficient amount is available to construct and maintain the project for its entire economic life of 50 years. In order to do this, it is necessary to delineate the lateral extent and thickness of the deposit. Boundaries may be defined by physical criteria or, in large deposits, arbitrarily set to encompass ample material for the projected fill operation. Thickness of the usable material can be determined by core or boring data supplemented in subaqueous environments by seismic reflection profiles.
(1) If deposits have a relatively uniform thickness throughout, the available volume can be calculated by multiplying their area times the thickness. Many deposits such as shoals and filled stream channels have sloping boundaries and variable thickness values. To determine the volume of these deposits, an isopach map of the deposit is made and measurements from the map are used to calculate the volume. An isopach map is a contour map showing the thickness of a deposit between two physical or arbitrary boundaries. Figure 3-5 shows an isopach map of a borrow area used at Ocean City, Maryland. In this case, the upper boundary of the deposit is defined by the surface of the shoal and can be delineated by bathymetric data. The lower boundary was fixed at a level horizontal seismic reflection horizon passing beneath the shoal. Contours at 1.5-m (5-ft) intervals were drawn for all the shoal area above the base reflector.
(2) To compute the volume of material within a similar deposit with sloping boundaries, a mid-level contour between each pair of contours, i.e. at half the contour interval, is first delineated. The area enclosed by each of the primary and mid-level contours is measured with a
3-9

EM 1110-2·3301 31May95
5
3 0
1-1 A
10 15
15
9
FEET 0
ATlANTIC COAST. MARYV.NO OCEAN CITY BORROW NO. 1
lJSOPACH MAP( NOi/EMBER 1990
400 800 1200 1600
6 0
0 7 15 U.S. ARI.ff ENGINEERS, COASTAL ENGINEERING RESEAACH CENTER
+ o7
5
6.5 0
5
10
0
13 0
15
18 0
20 +
0 a 0
20
~: 26
18 ° 1R o25.5 26 :b21 0
· A CORE LOCATIONS + THICKNESS GREAT!R THAN o THICKNESS TO WITHIN J FT.
10
Figure 3-5. lsopach map of sand thickness In shoal of potential borrow site (from Anders and Hansen (1990))
planimeter. The volume of material in each layer between primary contours is then calculated using the prismoidal (ormula:
(3-1)
where
V =volume H = primary contour interval
S0 and S2 = area enclosed by upper and lower primary contours
S1 =area enclosed by mid-level contour
Total volume is determined by adding the values of each layer.
d Site morphology. Information on borrow site morphology is valuable in defining and evaluating site characteristics. In many cases, the source deposit creates surface morphological features that can be used to delineate boundaries and to assist in interpolating between seismic and coring data points. In addition, site morphology may
3-10
provide indications of the origin and history of the deposit. Subsurface deposits such as filled stream channels are more difficult to delineate because the only sources of data are seismic reflection records, cores, and borings.
( 1) Description of borrow site morphology should contain information on dimensions, relief, configuration, and boundaries, and be illustrated by large-scale maps or charts. Information for compiling the reports can usually be found in large-scale hydrographic smooth sheets available from NOAA for submerged deposits, and in published USGS topographic maps for terrestrial sources. Fathometer · records, which should be made concurrently with the seismic reflection profiles, are valuable for supplementing and updating other sources.
(2) In some cases, existing information may be inadequate because of the relatively low density of data points for the site area or because the original surveys are outdated. In this event, a special detailed fathometer survey of the site should be made before the main field collection effort is undertaken.

e. Site stratigraphy. Stratigraphic relationships within and peripheral to the site deposits should be developed from the existing sources and the seismic and coring records to define the following:
(1) Limits of the deposit.
(2) Thickness of usable material.
(3) Thickness of any overburden.
(4) Sedimentary structures.
(5) Sediment characteristics of each definable bed.
The detail and reliability of the stratigraphic analysis depend on the complexity of the deposit, the number of outcrops, cores or borings available, and the degree to which stratigraphic features are revealed by seismic reflection profiles.
( 1) In terrestrial areas, outcrops of potentially useful materials may or may not be present. In many cases, such deposits have no topographic expression and must be defined solely on the basis of borings. Seismic refraction surveys in such situations are valuable in defining the areas between data points. Seismic refraction techniques for subsurface exploration are covered in detail in EM 1110-1-1802.
(2) In submerged areas, site characteristics must be determined by a combination of bathymetric survey, seismic reflection profiling, and sediment coring. Seismic reflection profiles have some advantages over refraction surveys, but can only be used in water-covered areas. Reflectors appearing on seismic reflection profiles record boundaries between sediment layers having different acoustic properties. Although these boundaries are usually stratigraphically significant, this is not always the case. On the other hand, significant boundaries may not have enough acoustic contrast to produce a definite reflection, or reflectors of importance may be undetected because of insufficient penetration of the acoustic pulses into the sub-bottom sediments. It is important, therefore, in both reflection and refraction surveys, to collect enough cores or boring samples to identify and correlate the reflectors with reliable data on sediment properties, and to show significant boundaries that may not have been recorded by the seismic systems.
f. Sediment composition. The physical properties of a sediment sample that are most important for determination of suitability for fill on a project beach are composition and grain size distribution. The desirable physical properties
EM 1110-2·3301 31May95
are mechanical strength, resistance to abrasion, and chemical stability.
( 1) In most places, sand size sediment is predominantly composed of quartz particles with lesser amounts of other minerals such as feldspar. Quartz has properties of good mechanical strength, resistance to abrasion, and chemical stability. In some deposits, particularly those of marine origin, there is a large and sometimes dominant amount of calcium carbonate that is in most cases of organic origin (biogenic). Calcium carbonate is more susceptible than quartz to breakage, abrasion, and chemical dissolution. But, if it is not highly porous or hollow, it will make serviceable beach fill.
(2) Sediment composition can be determined by examination of representative samples under a binocular microscope. Samples should be prepared by thorough washing to remove fines and clean the surface of the particles. If the material is not well-sorted, it should be subdivided into sieve fractions for analysis. A subdivision into the Wentworth classes (Table 2-1) for sand size and coarser material is convenient for this purpose.
g. Sediment size characteristics. The size frequency distribution of potential borrow material must be obtained in order to evaluate its suitability for fill on the project beach. Generally, suitable material will have grain sizes predominantly in the fine to very coarse size range. The presence of very fine sand, silt, and clay in small amounts is acceptable, but sources having a substantial amount of fines should be avoided because of the large amount of material that must be handled to obtain the usable portion. Also, the creation of turbidity incident to excavation and placement on the beach is environmentally undesirable.
(1) Since few large sand bodies have uniform size characteristics throughout, it is important to obtain a sufficient number of cores and borings to accurately reflect the variations in size characteristics. This is often difficult because of a lack of direct information on the interior of the deposit. In most cases, all that will be available is seismic reflection data and cores or borings obtained during the initial exploratory survey. Because of this, it is valuable to have a flexible program of core or boring site selection during a detailed site study so that their number and position can be modified on the basis of onsite inspection of the cores or borings as they are obtained.
(2) In certain environments of the inner continental shelf or estuarine and back-barrier areas that are characterized by low wave and current energy, deposits of fine-grained, easily transportable sediment particles may accumulate.
3-11

EM 1110-2·3301 31 May 95
Many of the particles in these deposits have relatively large sieve diameters, but are highly porous, hollow, or have a flattened shape. Characteristic particles or low-energy deposits are mica, minute shells, and fragments of small or immature mollusks, bone fragments, vegetation, and the skeletal parts of various types of bryozoa, foraminifera, ostracods, calcareous algae, and echinoids. In general, material from low energy deposits, regardless of sieve size, is unsuitable for beach fill.
h. Composite sediment statistics. One of the main considerations in selecting a borrow source is the comparative relationship between the grain size distributions of the native beach and the borrow material. For making this comparison, it is necessary to determine, for both native beach and potential borrow source, a composite grain size distribution that is representative of overall textural properties. Methods for composite grain size analysis are discussed in Section 2-4.
(1) Native beach composite sediment statistics should consist of a cross-shore composite representing the entire active profile. Sediment samples should be collected from the intertidal and nearshore zones across the profile from mean high water to the nearshore bar as described in Section 2-4. Composite grain size statistics calculated from such a sampling scheme will account for most of the active variability on the profile. If cross-shore composites exhibit a wide range of mean and sorting values, an alongshore composite should be calculated to reduce the variability.
(2) Borrow area composite statistics should be determined using core sediment data from the fill area. Several cores should be taken within the potential borrow site to characterize the extent of useable material. Core samples should be collected from the top, middle, and bottom of useable sand within the core. Composites from both the native beach and borrow area can be compared to aid in the determination of fill suitability. The same method of determining grain size characteristics should be used for both the fill and borrow sites. Figure 3-6 shows a comparison between the native beach and coarse-grained borrow material used for nourishment at Ocean City, MD. The shaded area represents common characteristics between the native beach and fill material.
i. Sand suitability analysis. Fill material, in reality, does not exactly match the native beach material in a project area. Krumbein ( 1957), Krumbein and James ( 1965), James (1974), Dean (1974b), and James (1975) have developed similar approaches for indicating the behavior of fill material having different characteristics than that of the native material. These approaches develop a ratio indicating how much fill material is required as a result of the different
3-12
30 -7/88 ---a/as
25
PRE-FILL (NATIVE BEACH) 20
15
10
5
0 -3 -2 -1 0 2
8.000 2.000 0.5000
5 10 20 40 60
Grain Size (PHI)
POST-FILL (BORROW PLACED
,, ON BEACH)
'\3 \ \ \
3 ' ....
4
0.1250
100 200
5 (phi)
(mm) 3.125E-2
ASTM Molh
Figure 3·6. Comparison of composite grain size analysis between the native beach and the borrow material used at Ocean City, MD
sediment characteristics between the fill and native materials. Their approaches make the following assumptions: (1) that the native sediment is considered most stable for the environment in which it occurs, (2) sorting of borrow ·material by coastal processes will achieve a similar grain size distribution as the native beach, given enough time, (3) sorting of borrow material will winnow out a minimum amount of original fill, and (4) that both native and borrow material exhibit normal grain size distributions. These assumptions should be considered with caution. Each grain size class responds to wave transport at different energy levels. The finer grain sizes will likely be winnowed out first, leaving the more stable coarser material. Often, the coarser material is comprised of carbonate shell fragments that break up with time, altering the original grain size distribution. Based on the above assumptions two approaches were developed to determine borrow material suitability for use as beach fill material. These approaches estimate the amount of borrow material needed to produce a certain amount of stable, native-like material (overfill ratio) and how often renourishment will be required (renourishment factor), and are discussed in detail in the Shore Protection Manual (1984).
(1) Overfill ratio. Using the assumptions discussed above, James ( 1975) developed a method for estimating required fill volumes considering the differences between the borrow and native materials. The overfill ratio (RA) is the volume of borrow material required to produce a stable unit of usable fill material with the same grain size characteristics as the native material. RA is determined by comparing phi (cl>) mean sediment diameter and sorting values of the native beach and borrow sediments. The cl> scale of sediment diameter is defined as:
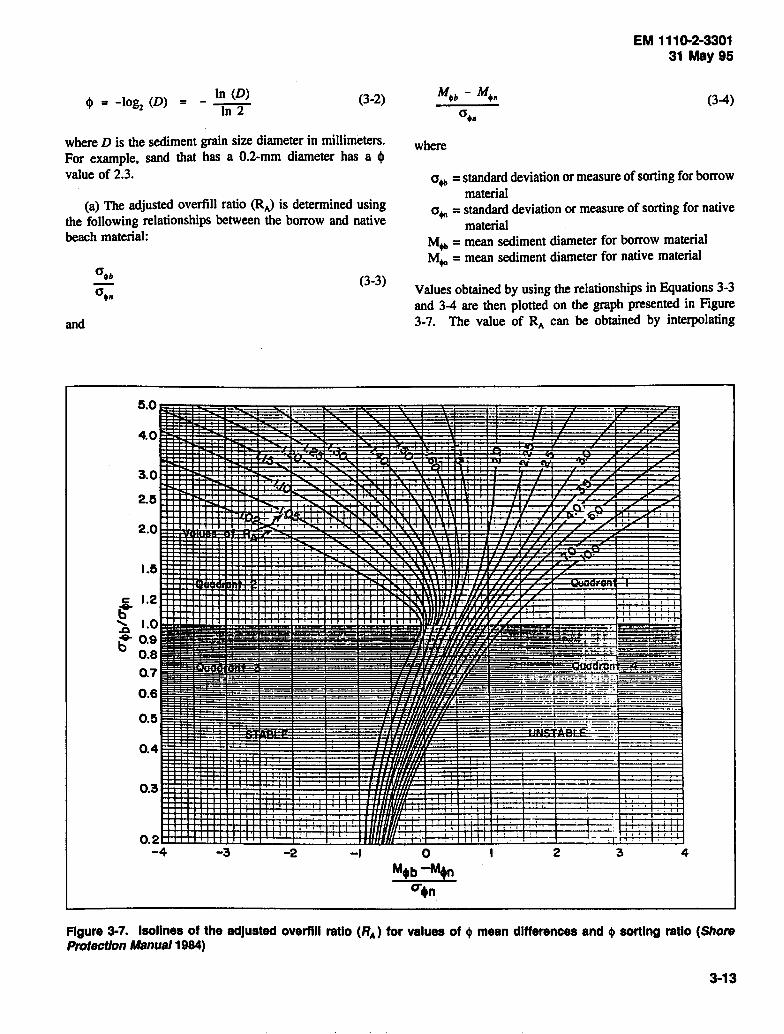
In (D) lj> = -log2 (D) = - -
In 2 (3-2)
where D is the sediment grain size diameter in millimeters. For example, sand that has a 0.2-mm diameter has a II> value of 2.3.
(a) The adjusted overfill ratio (RA) is determined using the following relationships between the borrow and native beach material:
and
4.0
3.0
2.5
2.0
1.5
(3-3)
EM 1110-2·3301 31May95
(3-4)
where
a.., = standard deviation or measure of sorting for borrow material
a.,. = standard deviation or measure of sorting for native material
M+b = mean sediment diameter for borrow material M.., = mean sediment diameter for native material
Values obtained by using the relationships in Equations 3-3 and 3-4 are then plotted on the graph presented in Figure 3-7. The value of RA can be obtained by interpolating
~ 1.2 -:o 1.oH1-tt-ttt++-t+t+HH++HH++Ht-tt+Ht-tttt-trttH
b 0.9 0.8 0.7
0.5
0.2 -4 -3
'I
-2 _, 2 4
Figure 3-7. lsollnes of the adjusted overflll ratio (RA) for values of ' mean differences and ' sorting ratio (Shore Protection Manual 1984)
3-13

EM 1110-2·3301 31 May 95
between the values represented by the isolines. For example, if the native and borrow composite grain size characteristics were:
(J.b = 0.87 a..,= 0.53
M.,. = 1.94 M~ = 2.54
the values from the relationships using Equations 3-3 and 3-4 would be
0.87 I 0.53 = 1.6 and (2.54 - 1.94) I 0.53 = 1.1
indicating that approximately 2.4 units of borrow material would be required to create 1.0 unit of stable native beachlike material. Software applications automating this process are available in the Littoral Processes module of ACES and would provide greater accuracy in determining RA, as graphical methods have some degree of human error.
(2) Renourishment factor. Another approach developed by James (1975) relates to the long-term maintenance of a project. The renourishment factor (Rs) provides a technique to predict how often renourishment will be needed using the selected borrow material. Rs makes the same assumptions and requires the same numerical inputs as the overfill ratio and is defined as:
where A = winnowing function (recommended value is 1.0). The A parameter is dimensionless and represents the scaled difference between the 41> mean non-eroding and actively eroding native beach sediments (Shore Protection Manual 1984). James (1975) recommends A= 1.0 for the common situation where the textual properties of non-eroding native sediments are not known. Using the same values for the overfill ratio example presented above, the Rs value would be:
Rs = exp [(0.60 I 0.53) - 0.50 { (0.76/0.28) - 1}] =exp {(1.13) - 0.50(1.7)} =exp (0.28) = 1.32
An Rs value of 1.3 would indicate that periodic renourishment using the same borrow material must be provided 1.3 times as often as using original native-like sediments in order to maintain project dimensions. R1 can also be determined graphically by using the same relationships in Equations 3-3 and 3-4 for the mean
3-14
difference and sorting ratios. Plotting the same values used in the above example and interpolating between the isolines using the graph in Figure 3-8, an Rs value of 1.3 is determined, closely matching that from Equation 3-5. This parameter should be reevaluated with each renourishment for the life of the project. As with RA> software applications automating this process are available in the Littoral Processes module of ACES. It should be noted that both the overfill ratio and renourishment factor models are based on grain size statistical parameters only and engineering judgement and experience should accompany design applications.
3-4. Comparative Evaluation of Fiii Sources
In many, if not most, cases, more than one potential borrow site will be identified during the general field exploration and further investigated by a detailed site survey. A comparative evaluation of these sites is then made to select the primary borrow source for the project. This evaluation requires consideration of a number of items that in general relate to suitability of material and costs of excavation, transport, and placement. These include sediment characteristics, fill factors, renourishment factors, distance from project area, and accessibility, as discussed in previous paragraphs. The total life cycle cost of the project using each potential source should be estimated and compared in order to select the most desirable fill source.
a. Feasible means of production. In comparing potential borrow sites, it is necessary to consider the types of equipment and methods that are suitable for excavating the fill material under the environmental conditions existing at that location.
(1) In terrestrial sources, use of most types of mechanical earth excavating equipment is feasible, provided they can gain access to the site. Equipment and methods selection can be based primarily on economic and environmental factors.
(2) In submerged borrow sources, environmental conditions are more likely to impose restrictions on feasible means of production. One important factor is minimum water depth. The dredging plant used must be capable of operating in the water depths at the site without danger of grounding. In addition, it must be capable of dredging material at a depth equal to the water depth plus the anticipated pit depth.
(3) Another factor of importance is wave conditions. The dredging plants used for offshore borrow sources require ability to safely operate in open sea conditions. In more protected places such as back-barrier sources, less seaworthy plants can be used.

I.IS
c 1.2
~ ...... 1.0 .J:l .. b
0.8
0.7
0.6
0.5
0.4
0.3 .. . . . . '
0.2 -4.0 -3.0 -2.0 1.0
'' ''
1.0
I .
2.0
' . '
3.0
EM 1110-2-3301 31May95
4.0
Figure 3-8. lsollnes of the renourlshment factor (RJ) for values of cl> mean differences and cl> sorting ratio (Shore Protection Manual 1984)
b. Environmental/actors. Both biological and physical aspects of the borrow area must be considered in comparative evaluation of borrow sites. In general, environmental effects of borrow operations can be made acceptable by careful site selection, and choice of equipment, technique, and scheduling of operations. Restoration of flora and fauna often takes place in a relatively short time after operations (Stauble and Nelson 1984 ). Alterations in physical features may, in some circumstances, be restored by natural processes.
(1) One effect of borrow operations is direct mortality of organisms due to the operation itself, and destruction or modification of the natµral habitat characteristics. Direct mortality of motile fauna such as fish is usually not great
because they move to other areas during the disturbances of the borrow operation. Sessile flora and fauna cannot vacate the area; mortality of these organisms is therefore higher. However, they usually are replaced by the reproduction of survivors or stocks in unaffected peripheral areas (Stauble et al. 1982).
(2) Another serious consideration is the destruction or modification of the habitat conditions needed for survival of native species. A common alteration is the exposure of a substrate that differs from the natural substrate as a result of excavating overlying material. Many marine benthic and some pelagic organisms are adapted to specific substrate conditions. Even though larvae of the native species reach the affected area, they may not survive.
3-15
EM 1110·2·3301 31May95
(3) In comparing borrow sites, it is necessary to consider whether or not natural substrate conditions will be modified by the planned operation. This depends on the thickness of the surficial layer and the depth of excavation needed to produce sufficient fill material. In many instances where the layer of suitable fill material is thin, an increase in the areal extent of the borrow area will allow excavation of sufficient material without altering substrate conditions. While this alternative increases direct mortality, it will preserve favorable conditions for repopulation of native organisms.
(4) In subaqueous areas, detrimental effects on native organisms, both within and peripheral to the borrow site, may occur due to the generation of suspended silt and clay size material in the water column as a result of the dredging operation. Deposits containing more than a small amount of silt and clay are thus less desirable sources of fill from an
3·16
environmental standpoint. In addition, the fine fraction will be unstable in the beach environment.
(5) All borrow operations alter the local relief. In terrestrial sites, the effects of modification are usually confined to the immediate borrow area. In subaqueous deposits, the effects can be more widespread due to alteration of wave energy and refraction patterns consequent to modification of borrow relief features. To evaluate the possible adverse effects on nearby shore areas, studies for each site should be made of the alterations in wave characteristics resulting from expected changes in bottom relief features, using the procedures and tools described in Section 2-4. In some cases, the original relief can be restored by natural processes. This is more likely to occur in active features such as inlet shoals than in features that are relict, or become active only during intense storm events.

Chapter 4 Fill Design
4-1. Purpose of Project
Prior to planning and conducting the design of a beach fill project, it should be understood that beach fills are typically constructed for storm and flood protection, erosion mitigation, and enhanced recreation.
a. Storm and flood protection. Designing a beach fill project for storm and flood protection requires a rigorous design approach due to the severe consequences if the project does not perform as required. Some important considerations for storm and flood protection projects are as follows:
(1) Existing and desired level of storm and flood protection. The optimum level of storm and flood protection will be determined based on maximizing the net benefits of the project. Net average annual benefits equal the average annual damages estimated over the future evaluation period (in the absence of a Federal project) minus average annual damages estimated to occur over the same period with the Federal project, minus average annual costs.
(2) Data on historical storm occurrences and effects on the area (including dune breaching, beach erosion, structural dam~ge, and !nterior floodinV are required to develop ero.s1on. excursion damage frequency relations and provide calibration and verification data for shoreline and profile chanf8 models.
(~) ya1ue of development, type of construction, prox1m1ty to the shoreline, and first floor elevations are required t~ provide the damage functions for the project area. Typically, dense high-rise development will have a much higher property value than a residential or vacation ~ome development, but the overall risk of damage to a highnse structure due to foundation undercutting or wave attack will be confined to the lower one or two floors.
b. Mitigation of erosion. Frequently, beach fill projects are located adjacent to an inlet or entrance channel. Occasionally, investigations have identified the need and justification to mitigate erosion attributed to the adjacent Federal navigation project. Such erosion is seldom 100 percent of the total erosion of the adjacent shoreline. Other factors also contribute to the problem such as natural inlet or entrance effects, relative sea level rise, natural wave focusing, other close-by structures, etc. In the interest of providing a comprehensive and complete solution for the total erosion problem, the mitigation effort is incorporated
into the beach fill project.
EM 1110-2·3301 31 May 95
c. Enlargement of recreational area. Due to long-term average erosion and/or storm erosion, the area of beach available for recreational purposes will generally not be sufficient to satisfy the existing or projected future demand. In areas where recreational beach use and its support activities are important to the local economy of the coastal community, a storm protection beach fill project will provide additional recreational beach area incidental to its construction. Recreational benefits based on increased public use or enhanced values of a recreational day incidental to the beach fill can be used in project justification. Present policy limits the extent to which some benefits may be used in optimizin& project design.
4-2. Project Design
a. Design selection. In 1985, more than 95 beach fill projects had been constructed by the Corps, protecting over 210 km (130 miles) of U.S. coastline. Unfortunately, few of these projects were monitored to any significant degree to provide guidance for the design of other projects. Due to the geographical and climatological differences between areas along the coast, extrapolating the design of one project to another location may or may not be successful. However, based on the limited monitoring that has been conducted and analysis of some of the projects, certain general guidelines have been developed for the selection and evaluation of project design. According to experience, the design of a beach fill project should include the following considerations:
(1) Level of protection. The primary function of beach nourishment projects is to maintain a beach at a specific location to provide protection to upland areas against storm flooding and waves. A variety of design parameters can be selected to provide an optimum level of protection for each fill site. Consequently, selection of design parameters should be made on the basis of accurate up-to-date information on the project beach, and environmental factors such as wave climate and littoral currents. The principal design parameters of a beach fill project are tidal characteristics; wind and wave climate; storm characteristics and frequency of occurrence; shoreline change history; sediment characteristics; sediment budget; borrow material availability and suitability; and environmental considerations.
(2) Placement techniques. The placement of fill material on a project area is conpucted by two primary methods; land-hauling material from a nearby upland source; or direct pumping of sand theugh a pipeline from subaqueous sources using a dredge (Shore Protection Manual 1984).
4-1

EM 1110-2·3301 31May95
Two basic types of dredging techniques used are hydraulic pipeline dredges and hopper dredges (with and without pump-out capabilities). The choice of placement method depends upon the location of suitable borrow sources and availability of equipment. Each method differs in its capabilities for the area of fill placement. Fill material brought to the site by truck is limited in its placement to dry beach or water's edge. Pumping and barging materials provides the ability to place materials in the nearshore zones. Design requirements should consider available placement methods.
(3) Placement position. The placement of fill material within the beach system should be determined by the protection requirements and method of placement. Figure 4-1 illustrates the various cross-shore placement locations most widely used within the profile and includes (Smith and Jackson 1990):
(a) Dune only - reinforcement of existing dune or creation of a new dune in the back-beach areas. This technique is intended to provide the beach system with a reserve of sand against erosive storm events and to prevent wave energy from reaching upland property.
(b) Dune and berm - intended to reinforce the dune and widen the berm to withstand erosion due to the storm of record plus an additional width to prevent waves from overtopping and reaching upland property.
(c) Berm only - designed to add volume and widen the beach by translating the wave-breaking zone seaward. Berm height is usually retained at the same height as the natural berm height. For recreational purposes, the increased width of the beach will provide additional area for recreational use.
(d) Profile fill - method is designed to increase the volume of sand throughout the entire profile. Placement usually occurs at an active zone in the profile and relies on natural processes to distribute the fill over the entire profile. Theoretically, this method should produce a profile shape already in equilibrium with the energy environment.
(e) Nearshore berm - intended to simulate natural storm bar formation by creating an artificial shore-parallel storm bar to dissipate storm wave energy before impacting the inshore beach. During prolonged low-energy conditions, much of the artificial bar material may be moved onshore, nourishing the berm and nearshore.
Longshore placement considerations include the creation of a feeder beach. This is performed by stockpiling fill material at the updrift end of the areas intended to receive
4-2
Beach Fill Placement Options
MLW
Dune Only
MLW
Dune and Berm
MLW
Berm Only
MLW
Profile Fill
MLW
Neorshore Berm
Figure 4-1. Various flll placement zones within the beach profile system

the fill, allowing longshore transport processes to distribute the fill into the fill site. Feeder beaches generally work well in areas that are presently serving as a source of sediment for the downdrift beach or in areas that presently experience a deficit in the supply of littoral material. Examples would be those areas that are downdrift from inlets or other manmade structures that form a littoral barrier. Benefits from a feeder beach are generally limited to the shorelines immediately adjacent to the stockpile. As the stockpiled material spreads under the influence of oblique waves, the orientation of the feeder beach shoreline approaches that of the adjacent beach, resulting in longshore transport out of the feeder area equal to the transport along the adjacent area. Eventually, the shoreline orientation in the feeder beach area will return to its original configuration, at which time the transport out of the feeder beach will be less than that of the adjacent area. Therefore, depending upon the length of the project. feeder beaches should not be expected to satisfy the nourishment requirements for the entire project as these needs may best be satisfied through direct placement.
(4) Combined placement. The profiles illustrated in Figure 4-1 are intended to present ideal fill placement and, in reality, would hardly ever be achieved. In most cases it may be beneficial to use a combined method of placing fill in both the upper and lower portions of the beach profile. Such operations could provide the advantage of limiting shoreline protrusion by the fill since some of it would be placed in the offshore part of the profile. This could reduce initial losses typically experienced during most fill projects by reducing longshore transport out of the project area. A disadvantage of this method is that two placement operations must be used to perform placement in both onshore and offshore portions of the profile.
(5) Construction template. The construction template defines the shape of the fill profile at the time of fill placement. The construction profile of the offshore slope should be on the order of 1 :20 to 1 :30 from the low water datum to intersection with the existing bottom. Construction profiles are out of equilibrium with the prevailing coastal processes and are expected to reshape themselves, starting almost immediately after placement, as they are influenced by the existing energy conditions. As the reshaping process occurs, much of the material placed on the constructed berm and foreshore will be moved by waves and currents into the nearshore zone: The volume of fill material must allow for this offshore readjustment toward a more natural shaped profile. However, during placement, the fill should be continually monitored to determine actual foreshore slopes. Attempts should not be made to strictly adhere to the construction template foreshore slope in the nearshore region. Adjustments should be made to the construction
EM 1110-2-3301 31May95
berm width to allow for differences that occur between assumed and actual slopes. This will prevent unnecessary time expended while attempting to mold the profile in a dynamic region of the profile affected by waves.
(a) If possible, construction berm elevations should be designed to be the same or slightly less than the natural berm crest elevation. The intent is for the construction berm to erode, distributing the material throughout the entire profile, resulting in a naturally shaped profile. Restricting the construction berm height to the natural berm height will prevent scarping of the fill material as it undergoes readjustment. Scarps can pose a threat to humans and also present a problem for nesting sea turtles.
(6) Design template. The design profile is the shape the fill material is expected to achieve after being worked by waves over the first few months to a year after fill placement. The design profile may be based on the pre-fill profile shape if the fill material is similar to the original native beach material. In such cases, the beach profile after nourishment should be the same as before nourishment. except translated seaward. The seaward translation forms a parallelogram similar to that illustrated in Figure 4-2 and can be shown to have an area with the base equal to the berm height (B) plus the depth of closure (H) and a length (Y) represented by the distance that the beach is extended seaward. Using the profile translation dimensions, an equation presented in the Shore Protection Manual (1984) to determine the fill volume per unit length of shoreline (assuming 1 m) required to achieve a profile configuration with a specific berm height out to some distance can be utilized and defined as:
V = (B + H) Y
where
B =desired berm height (m) H = depth of closure (m) Y = desired distance of seaward translation (m)
(4-1)
For example, the volume of borrow material with the same sediment characteristics as the native beach to build a beach with a berm height of 1.5 m (5 ft) to a width of 50 m (164 ft), in an area where the depth of closure is approximately 9 m (30 ft) would be 525 m3/m (5,650 ft3/ft) of shoreline. This method of determining fill volumes required to achieve the design profile can be used only if the fill material is similar to that of native beach sediments.
(a) The profile translation method assumes that the profile will be reshaped by the prevailing coastal processes and form the fill material into the existing equilibrium
4-3

EM 1110-2·3301 31May95
Profile Translation Project Profiles
o·
o·
20' · Closure Depth for Active Beach · · · · · · · · · · · · · ·
B=height of design berm y=length of coast build out H=closure depth
Figure 4-2. Native beach proflle versus minimum design beach proflle using flll slmllar to native flll. Design proflle Is same shape translated seaward
profile shape out to depth of closure with conservation of volume. As the fill profile readjusts, a large percentage of material from the visible beach is relocated to the nearshore portion of the profile. Casual observers may conclude that most of the material is lost from the system. In reality, what appears to be lost from the visible beach is in the nearshore area, within the project's limits.
(b) Figure 4-3 presents the various profiles used for determining fill volume requirements. A design profile based on the "equilibrium profile" concept is generally used for computing fill requirements. The initial slope of the foreshore of a beach design profile is typically on the order of 1:10 to 1:15 above the high-water datum. Existing and historic profile slopes will guide the estimation of these naturally shaped slopes. The depth of closure, which is the depth to which the beach fill material or native beach material can be mobilized under design storm conditions, should be determined and considered in the calculation of the beach fill quantity. Guidance for determining the depth of closure is presented in Section 2-2.
(7) Overfill addition to construction template. The beach fill material must be analyzed sufficiently to evaluate its performance as compared to the native beach material. This
is done by determining the overfill ratio (R.J as presented in Section 3-3. Beach fill material that is similar in grain size distribution to the native beach material can be expected to evolve to a profile slope similar to the native beach profile slope. Beach fill material which contains significant quantities of material finer than the native beach material will lose a significant percentage of the material to winnowing and sorting as the fill material grain size distribution adjusts to be closer to the native material grain size distribution. Therefore larger amounts of fine material will have to be placed on a beach to achieve the desired design profile. Introduction of finer than native material will result in flatter slopes, and coarser material will result in steeper slopes. Consider the example from the overfill ratio, presented in Section 3-2, where the borrow material was finer than the native beach sediments. It was determined that 2.40 units of borrow material would be required to produce 1.0 unit of stable native-like material. Using the profile translation method (Equation 4-1 ), the volume of borrow material required to achieve the dimensions used in the example above would be (2.40 x 525) 1,260 m3/m (13,560 ft3/ft) of shoreline.
(8) Advanced fill addition to construction template. Background erosion rates due to longshore transport, aeolian
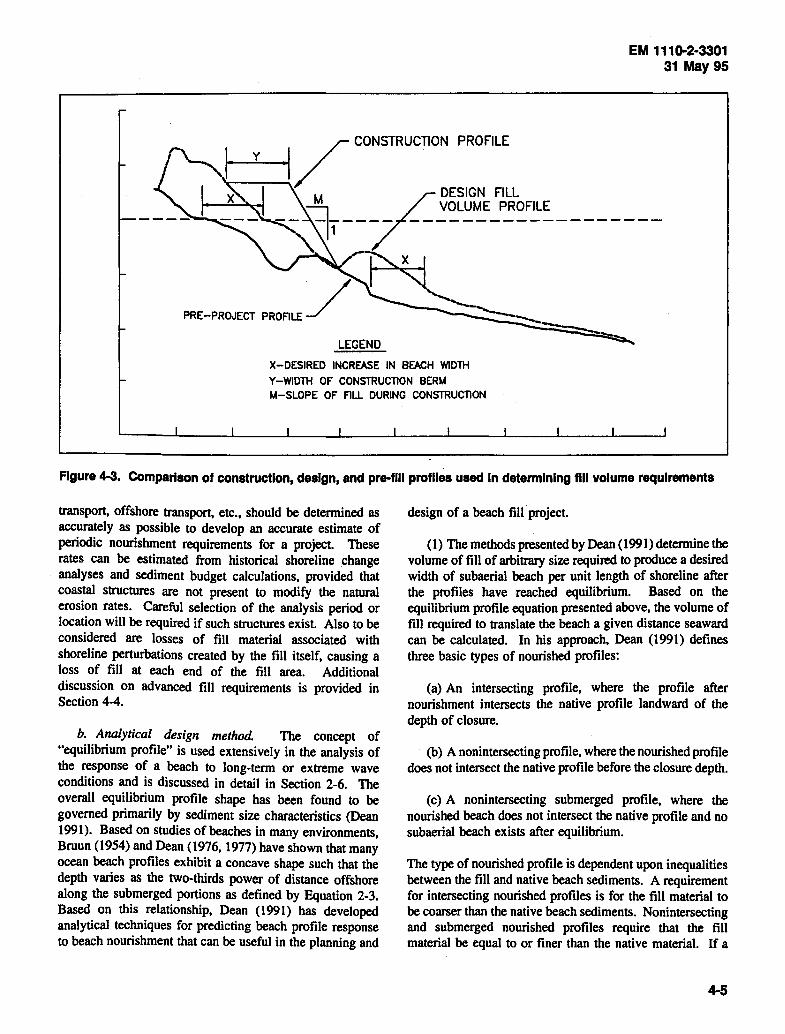
PRE-PROJECT PROFll.E /
LEGEND
EM 1110-2·3301 31 May 95
X-DESIRED INCREASE IN BEACH WIDTH Y-WIDTH or CONSTRUCTION BERM M-SLOPE or f'ILL DURING CONSTRUCTION
Figure 4-3. Comparison of construction, design, and pre-flll profiles used In determining flll volume requirements
transport, offshore transport, etc., should be determined as accurately as possible to develop an accurate estimate of periodic nourishment requirements for a project. These rates can be estimated from historical shoreline change analyses and sediment budget calculations, provided that coastal structures are not present to modify the natural erosion rates. Careful selection of the analysis period or location will be required if such structures exist. Also to be considered are losses of fill material associated with shoreline perturbations created by the fill itself, causing a loss of fill at each end of the fill area. Additional discussion on advanced fill requirements is provided in Section 4-4.
b. Analytical design method. The concept of "equilibrium profile" is used extensively in the analysis of the response of a beach to long-term or extreme wave conditions and is discussed in detail in Section 2-6. The overall equilibrium profile shape has been found to be governed primarily by sediment size characteristics (Dean 1991). Based on studies of beaches in many environments, Bruun (1954) and Dean (1976, 1977) have shown that many ocean beach profiles exhibit a concave shape such that the depth varies as the two-thirds power of distance offshore along the submerged portions as defined by Equation 2-3. Based on this relationship, Dean (1991) has developed analytical techniques for predicting beach profile response to beach nourishment that can be useful in the planning and
design of a beach fill project.
( 1) The methods presented by Dean ( 1991) determine the volume of fill of arbitrary size required to produce a desired width of subaerial beach per unit length of shoreline after the profiles have reached equilibrium. Based on the equilibrium profile equation presented above, the volume of fill required to translate the beach a given distance seaward can be calculated. In his approach, Dean (1991) defines three basic types of nourished profiles:
(a) An intersecting profile, where the profile after nourishment intersects the native profile landward of the depth of closure.
(b) A nonintersecting profile, where the nourished profile does not intersect the native profile before the closure depth.
(c) A nonintersecting submerged profile, where the nourished beach does not intersect the native profile and no subaerial beach exists after equilibrium.
The type of nourished profile is dependent upon inequalities between the fill and native beach sediments. A requirement for intersecting nourished profiles is for the fill material to be coarser than the native beach sediments. Nonintersecting and submerged nourished profiles require that the fill material be equal to or finer than the native material. If a
4-5
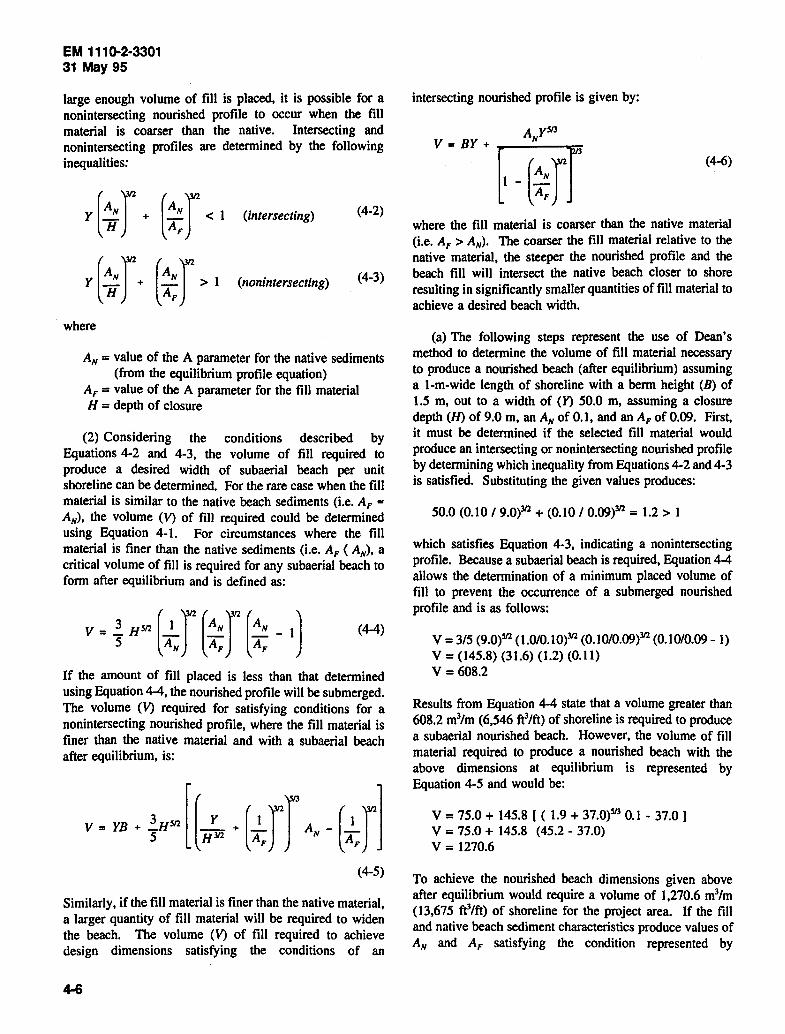
EM 1110-2·3301 31May95
large enough volume of fill is placed, it is possible for a nonintersecting nourished profile to occur when the fill material is coarser than the native. Intersecting and nonintersecting profiles are determined by the following inequalities:
Y [-; r + (~: r < I (Intersecting) (4-2)
Y [-; r + (~: r > I (nonlntersectlng) (4-3)
where
AN = value of the A parameter for the native sediments (from the equilibrium profile equation)
AF = value of the A parameter for the fill material H = depth of closure
(2) Considering the conditions described by Equations 4-2 and 4-3, the volume of fill required to produce a desired width of subaerial beach per unit shoreline can be determined. For the rare case when the fill material is similar to the native beach sediments (i.e. AF -AN), the volume (V) of fill required could be determined using Equation 4-1. For circumstances where the fill material is finer than the native sediments (i.e. AF ( AN)• a critical volume of fill is required for any subaerial beach to form after equilibrium and is defined as:
V • ~ H" (;J (~:f (~: -I) (44)
If the amount of fill placed is less than that determined using Equation 4-4, the nourished profile will be submerged. The volume (V) required for satisfying conditions for a nonintersecting nourished profile, where the fill material is finer than the native material and with a subaerial beach after equilibrium, is:
(4-5)
Similarly, if the fill material is finer than the native material, a larger quantity of fill material will be required to widen the beach. The volume (V) of fill required to achieve design dimensions satisfying the conditions of an
intersecting nourished profile is given by:
A y513
V = BY + [I -(~:r r (4-6)
where the fill material is coarser than the native material (i.e. AF> AN). The coarser the fill material relative to the native material, the steeper the nourished profile and the beach fill will intersect the native beach closer to shore resulting in significantly smaller quantities of fill material to achieve a desired beach width.
(a) The following steps represent the use of Dean's method to determine the volume of fill material necessary to produce a nourished beach (after equilibrium) assuming a 1-m-wide length of shoreline with a berm height (B) of 1.5 m, out to a width of (Y) 50.0 m, assuming a closure depth (H) of 9.0 m, an AN of 0.1, and an AF of 0.09. First, it must be determined if the selected fill material would produce an intersecting or nonintersecting nourished profile by dete~ning which inequality from Equations 4-2 and 4-3 is satisfied. Substituting the given values produces:
50.0 (0.10 / 9.0)312 + (0.10 I 0.09)312 = 1.2 > 1
which satisfies Equation 4-3, indicating a nonintersecting profile. Because a subaerial beach is required, Equation 4-4 allows the determination of a minimum placed volume of fill to prevent the occurrence of a submerged nourished profile and is as follows:
V = 3/5 (9.0)512 (1.0/0.10)312 (0.10/0.09)312 (0.10/0.09 - 1) v = (145.8) (31.6) (1.2) (0.11) v = 608.2
Results from Equation 4-4 state that a volume greater than 608.2 m3/m (6,546 ft3/ft) of shoreline is required to produce a subaerial nourished beach. However, the volume of fill material required to produce a nourished beach with the above dimensions at equilibrium is represented by Equation 4-5 and would be:
v = 75.0 + 145.8 [ ( 1.9 + 37.0)S/3 0.1 - 37.0 ] v = 75.0 + 145.8 (45.2 - 37.0) v = 1270.6
To achieve the nourished beach dimensions given above after equilibrium would require a volume of 1,270.6 m3/m (13,675 ft3/ft) of shoreline for the project area. If the fill and native beach sediment characteristics produce values of AN and AF satisfying the condition represented by
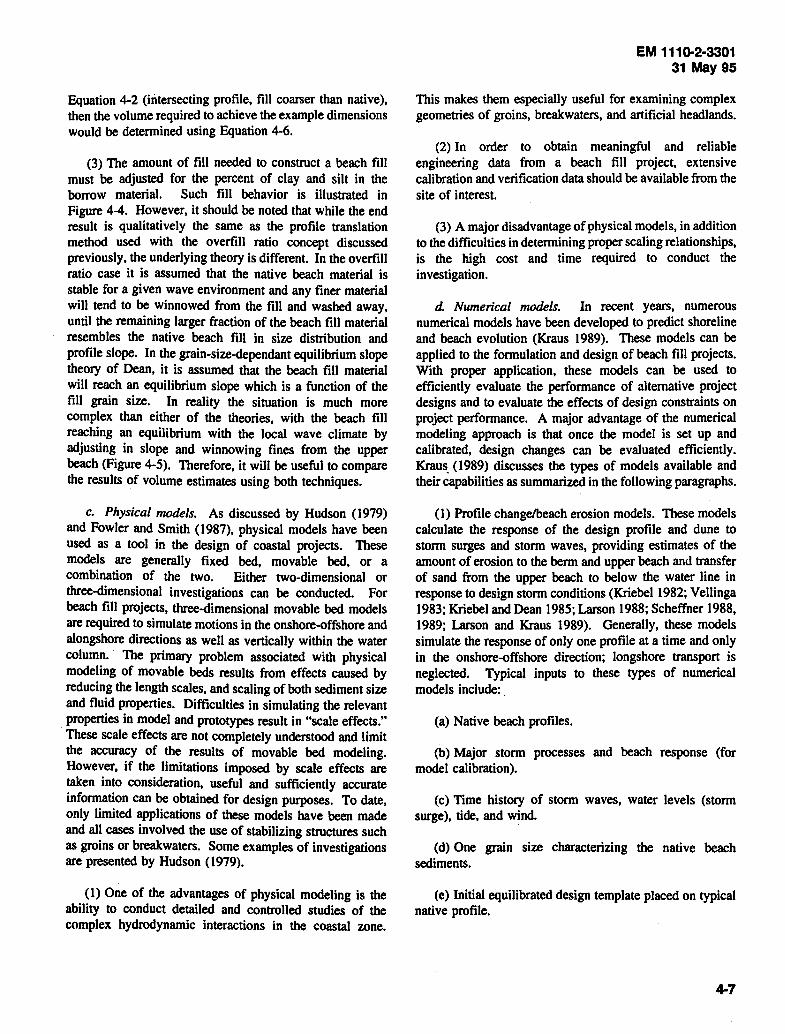
Equation 4-2 (intersecting profile, fill coarser than native}, then the volume required to achieve the example dimensions would be determined using Equation 4-6.
(3) The amount of fill needed to construct a beach fill must be adjusted for the percent of clay and silt in the borrow material. Such fill behavior is illustrated in Figure 4-4. However, it should be noted that while the end result is qualitatively the same as the profile translation method used with the overfill ratio concept discussed previously, the underlying theory is different. In the overfill ratio case it is assumed that the native beach material is stable for a given wave environment and any finer material will tend to be winnowed from the fill and washed away, until the remaining larger fraction of the beach fill material resembles the native beach fill in size distribution and profile slope. In the grain-size-dependant equilibrium slope theory of Dean, it is assumed that the beach fill material will reach an equilibrium slope which is a function of the fill grain size. In reality the situation is much more complex than either of the theories, with the beach fill reaching an equilibrium with the local wave climate by adjusting in slope and winnowing fines from the upper beach (Figure 4-5). Therefore, it will be useful to compare the results of volume estimates using both techniques.
c. Physical models. As discussed by Hudson (1979) and Fowler and Smith (1987), physical models have been used as a tool in the design of coastal projects. These models are generally fixed bed, movable bed, or a combination of the two. Either two-dimensional or three-dimensional investigations can be conducted. For beach fill projects, three-dimensional movable bed models are required to simulate motions in the onshore-offshore and alongshore directions as well as vertically within the water column. The primary problem associated with physical modeling of movable beds results from effects caused by reducing the length scales, and scaling of both sediment size and fluid properties. Difficulties in simulating the relevant properties in model and prototypes result in "scale effects." These scale effects are not completely understood and limit the accuracy of the results of movable bed modeling. However, if the limitations imposed by scale effects are taken into consideration, useful and sufficiently accurate information can be obtained for design purposes. To date, only limited applications of these models have been made and all cases involved the use of stabilizing structures such as groins or breakwaters. Some examples of investigations are presented by Hudson ( 1979).
(1) One of the advantages of physical modeling is the ability to conduct detailed and controlled studies of the complex hydrodynamic interactions in the coastal zone.
EM 1110-2-3301 31May95
This makes them especially useful for examining complex geometries of groins, breakwaters, and artificial headlands.
(2) In order to obtain meaningful and reliable engineering data from a beach fill project, extensive calibration and verification data should be available from the site of interest.
(3) A major disadvantage of physical models, in addition to the difficulties in determining proper scaling relationships, is the high cost and time required to conduct the investigation.
d. Numerical models. In recent years, numerous numerical models have been developed to predict shoreline and beach evolution (Kraus 1989). These models can be applied to the formulation and design of beach fill projects. With proper application, these models can be used to efficiently evaluate the performance of alternative project designs and to evaluate the effects of design constraints on project performance. A major advantage of the numerical modeling approach is that once the model is set up and calibrated, design changes can be evaluated efficiently. Kraus_ (1989) discusses the types of models available and their capabilities as summarized in the following paragraphs.
( 1) Profile change/beach erosion models. These models calculate the response of the design profile and dune to storm surges and storm waves, providing estimates of the amount of erosion to the berm and upper beach and transfer of sand from the upper beach to below the water line in response to design storm conditions (Kriebel 1982; Vellinga 1983; Kriebel and Dean 1985; Larson 1988; Scheffner 1988, 1989; Larson and Kraus 1989). Generally, these models simulate the response of only one profile at a time and only in the onshore-offshore direction; longshore transport is neglected. Typical inputs to these types of numerical models include:
(a) Native beach profiles.
(b) Major storm processes and beach response (for model calibration).
(c) Time history of storm waves, water levels (storm surge}, tide, and wind.
(d) One grain size characterizing the native beach sediments.
(e) Initial equilibrated design template placed on typical native profile.
4-7
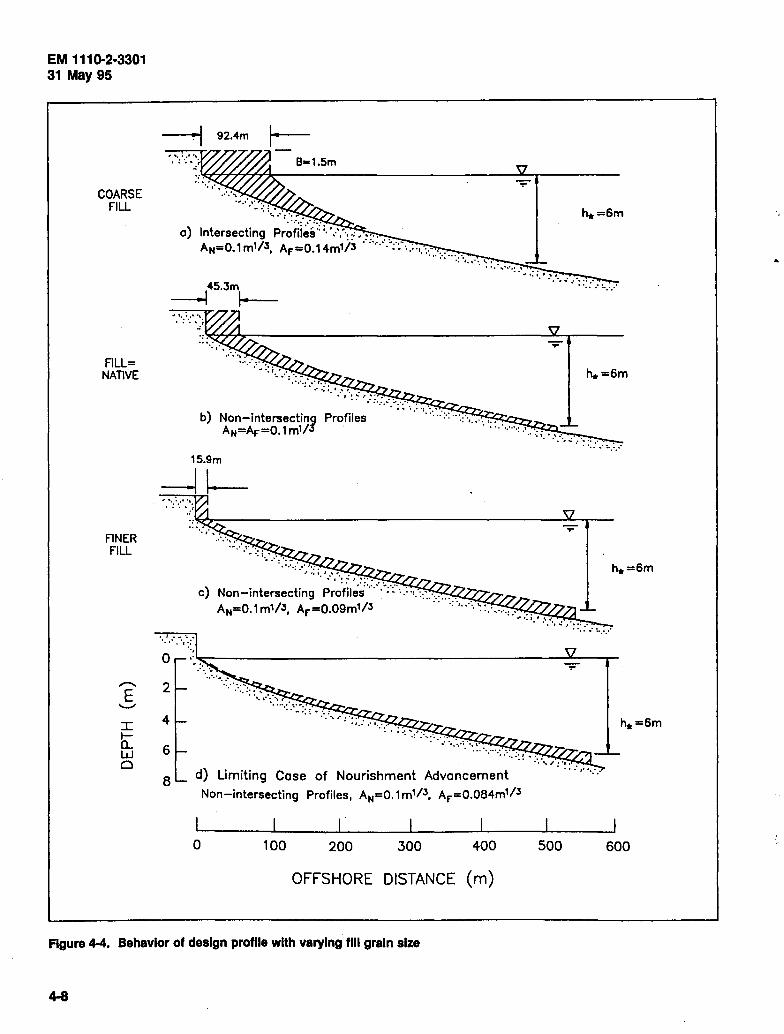
EM 1110-2·3301 31May95
COARSE FILL
FILL= NATIVE
FINER FILL
I
5= w 0
, '" ·.·· .,, .. '".:' B•1.5m
a) Intersecting Pr~fil~~::·;"···:· .. :, •... AN=0.1 m1/3, AF =0.14m1i3 .· '····'.~:·: ..... : "· ::-.::.; .... ·.
45.Jm --1 1--, '·. ·.·· .,, ... ".:'
, '·.·.·· ·· . . . . ".:'
·····:.•''"'· "···.'·''· .
" I : ~ •' : :· • •'
·. '·'"·'"'
c) Non-intersecting Profil~s ... ·.· .-;·: .. , .: -=. ::>.· ....
........ · .• ··-=· ·.,
AN=0.1 m1/J, AF =0.09m1/3 . . .: "· .. · .. ' '
h.=6m
. " ... · ~-. · .. · 0 .. ...,....~~~~~~~~~~~~~~~~~~~~~ ........ ~'-T-
2
4
6
8
.. ·.· ...... ··:· ·.···.
'•,•:! .... •,i':'\I,
.... -: :·:'"::'?~·~ •. ~. ,~.,_,_ ·.· .. ,·:···
d) Limiting Case of Nourishment Advancement Non-intersecting Profiles, AN=0.1 m1/3, Ar=0.084m1/3
0 100 200 300 400
OFFSHORE DISTANCE (m)
h.=6m
500 600
Figure 4-4. Behavior of design profile with varying fill grain size
..
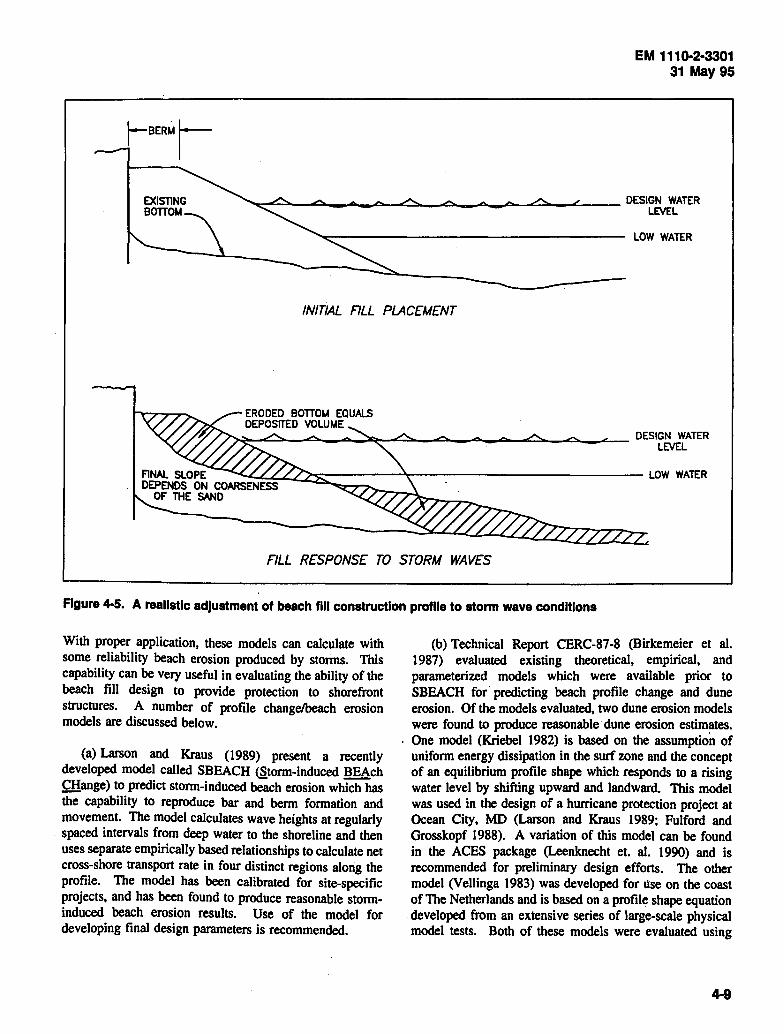
reERMI
EM 1110-2·3301 31May95
EXISTING BOTTOM
-.......~;...::...-.0._..A.._..:.........:::.;::.._-o.._-.,_,1._~""---':;._-- DESIGN WATER LEVEL
LOW WATER
INITIAL FILL PLAC£M£NT
FILL R£SPONS£ TO STORM WAVES
Figure 4-5. A reallstlc adjustment of beach flll construction profile to storm wave conditions
With proper application, these models can calculate with some reliability beach erosion produced by storms. This capability can be very useful in evaluating the ability of the beach fill design to provide protection to shorefront structures. A number of profile change/beach erosion models are discussed below.
(a) Larson and Kraus (1989) present a recently developed model called SBEACH @.torm-induced BEAch CHange) to predict storm-induced beach erosion which has the capability to reproduce bar and berm formation and movement. The model calculates wave heights at regularly spaced intervals from deep water to the shoreline and then uses separate empirically based relationships to calculate net cross-shore transport rate in four distinct regions along the profile. The model has been calibrated for site-specific projects, and has been found to produce reasonable storminduced beach erosion results. Use of the model for developing final design parameters is recommended.
(b) Technical Report CERC-87-8 (Birkemeier et al. 1987) evaluated existing theoretical, empirical, and parameterized models which were available prior to SBEACH for predicting beach profile change and dune erosion. Of the models evaluated, two dune erosion models were found to produce reasonable ·dune erosion estimates.
. One model (Kriebel 1982) is based on the assumption of uniform energy dissipation in the surf zone and the concept of an equilibrium profile shape which responds to a rising water level by shifting upward and landward. This model was used in the design of a hurricane protection project at Ocean City, MD (Larson and Kraus 1989; Fulford and Grosskopf 1988). A variation of this model can be found in the ACES package (Leenknecht et. al. 1990) and is recommended for preliminary design efforts. The other model (Vellinga 1983) was developed for use on the coast of The Netherlands and is based on a profile shape equation developed from an extensive series of large-scale physical model tests. Both of these models were evaluated using
4-9

EM 1110·2·3301 31 May 95
14 profiles from four different storm events and found to produce comparable results. Of the two, the Kriebel model was found to be less demanding in terms of required input information and therefore easier to consistently apply.
(c) A systematic means of predicting time-dependent erosion of dunes as a function of storm events of known frequency of occurrence is presented in Scheffner (1989). The dune erosion model used in that study is a modified version of the model developed by Kriebel (1982). The technique presented produces dune recession-frequency relationships which can be used for estimating the design life of structures protected by the presence of a berm and dune.
(d) All of the above models require the same basic input data, and provide the same general type of information, although the specific requirements vary from model to model. Basic data required for profile change/beach erosion models include: time series of wave height, period, and direction; time series of water level (combined storm surge and tide); pre-storm profile geometry; and a representative median grain size for the profile. Output includes the poststorm profile geometry from which various contour locations and volume changes can be calculated. Prior to using a model for design it is necessary to calibrate and verify the model using pre- and post-storm profiles bracketing storms of known conditions. A typical application of a model of this type will entail running the model to generate nearshore stage frequency curves and shoreline retreat frequency curves for the without-project profile. In some cases, a damaging wave penetration distance relation will be required for wave damage estimates. A range and number of storm events are run which reflect realistic combinations of various storm parameters descriptive of historic storm events which have impacted in or near the area of interest. An array of beach fill design alternatives is developed and placed on the profile, and the same storm events run through the model for each alternative. For beach fill projects, design alternatives can include variations of berm width, dune height, and addition of a seawall. In some cases, berm height variations may also be of interest if no predominant natural berm elevation is evident or a second storm berm is to be considered. Frequency curves similar to the without-project curves are developed for each alternative. Benefit analyses are then conducted comparing the damages derived from the without-project frequency curves less those derived from the with-project alternative frequency curves, and the project costs over a future SO-year period of analysis expressed in terms of average annual net benefits. The project alternative producing the maximum annual net damage reduction benefits is generally selected as the project plan unless circumstances dictate selection of another alternative.
4-10
(2) Shoreline change models. These models are typically one-dimensional in the longshore direction, and calculate the shoreline response to wave action under a wide range of beach, coastal structure, wave, and initial and boundary conditions (Kraus 1983; Kraus and Harikai 1983; Kraus, Hanson, and Harikai 1984; Hanson and Kraus 1986; Hanson 1987; Hansen and Kraus 1989; Gravens and Kraus 1989). The models assume that the profile shape remains constant and the representative shoreline is generally taken to be the mean water line. This type of model is particularly useful in evaluating the effects of structures such as groins or offshore breakwaters on an existing shoreline or beach fill project, the spreading response of a short beach fill beyond project boundaries, and the effectiveness of project fill transition. Shoreline change models include the following:
(a) GENESIS (Hanson and Kraus 1989) is a PC-based program which is capable of simulating long-term (I to 100 months) spatial changes in longshore transport over beach lengths of I to 200 km (<I to 125 miles). Based on the net volume of sand transported into each computational longshore grid, the program calculates the response of the shoreline to time-varying wave conditions. A wide variety of structures including groins, jetties, and detached breakwaters can be accommodated by the model. Required input parameters for the model include time and spatially varying wave conditions at the seaward boundary, shoreline geometry, structure geometry, and representative median grain size for the beach. Model output includes shoreline position and longshore transport rates for each computational grid. Use of the GENESIS model or the Shoreline Modeling System (SMS) is recommended for developing the final design. The SMS is the GENESIS model combined with a wave transformation model RCPWAVE.
(b) Dean and Yoo (1992) present a shoreline evolution model which is applicable to a range of applications where large perturbations, such as beach fill projects, are placed on a natural beach system. The model can be used to analyze the response of a variety of beach fill geometries to waves. For instance, the model is useful for estimating: the percentage of beach fill material which will remain within a limited beach fill project boundary, with no end structures on a relatively straight coastline at various years in the future; the effects of shore-perpendicular structures placed at the ends of the project; and the effects of nourishing with material more and less transportable than the native. This model is simpler to run than the GENESIS program, and should be useful for conducting planning analyses of beach fill life for a range of geometries. It will not handle the range of geometries of shorelines or structures as GENESIS, and cannot take into account variations in local wave

patterns (except by the recommended use of an ad hoc straightening of shoreline contours, explained in the model documentation). Required model input data include an effective average wave height, depth of closure, effective median grain sizes, berm height, background erosion rates, and initial shoreline and structure geometry. Output includes shoreline geometry as a function of time.
· (3) Multi-contour line/schematic three-dimensional mOdels. These models differ from the profile and shoreline change models above in that the assumptions of constant profile shape and constant longshore transport are relaxed. Simplifying assumptions are made to produce schematic 3-D models; for example, to restrict the shape of the profile. Perlin and Dean (1978) extended a version of the "2-contour line model" of Bakker ( 1968) to an n-contour line model in which depths were restricted to monotonically increase with distance offshore. Due to their complexities, these models are limited in their capabilities and require extensive computational resources. As a result, they are not widely applied in the design of coastal projects.
(4) Fully three-dimensional models. These models calculate waves, currents, sediment transport, and bottom elevation changes point by point in either finite difference or finite element grids placed over the area of interest. However, special expertise, powerful computers, extensive field data collection and extensive verification are required to effectively use these models (Vemulakonda et al. 1988). For these reasons and the high expense involved, applications of these models for prototype design have been limited.
d. Selection of the design tools and procedures. The selection of appropriate methodologies for beach fill planning, analysis, and design will be guided by a number of factors, which include the level of the study effort (Reconnaissance, Feasibility or Design), purpose of the project, and the existing conditions along the study area shoreline. Generally, during the reconnaissance phase of a study, the design tools and procedures are limited to experience, empirical guidance, and analytical methods; particularly since this phase of the study is limited to using available data for the area. However, as numerical models are made more efficient and easy to use, their use is recommended more frequently in this phase of a project study. During the feasibility phase of a project, more advanced tools and procedures such as numerical models are used in addition to experience, empirical guidance, and analytical methods. During the design phase of a project, the final design of the project recommended in the feasibility phase is conducted, which generally warrants the use of the most sophisticated and accurate numerical models, and in specialized cases involving complex
EM 1110-2·3301 31 May 95
structures and wave patterns, physical models.
4-3. Design Considerations
a. Storm surges. Reliable estimates of water level changes under storm conditions are essential for the planning and design of a beach fill project. Previous investigations (Brunn 1962; Edelman 1968, 1972; Dean 1977; Vellinga 1983) have indicated that storm surge is the single most important process in determining the response of a beach to a storm (see EM 1110-2-1414 and EM 1110-2-1412).
(1) A number of factors are responsible for changing water levels during the passage of a storm. These factors include astronomical tides, direct winds, atmospheric pressure differences, earth's rotation, rainfall, surface waves and associated wave setup, and storm motion. Figure 4-6 illustrates the various components of storm surges.
(2) The most significant effect of the storm surge is that the raised water level exposes the upper parts of the beach to erosion by direct wave attack. The storm surge allows the large waves to pass over offshore bar formations without breaking. When the waves finally break, the remaining width of the surf zone is not sufficient to dissipate the increased energy contained in the storm waves. The remaining energy is spent in erosion of the beach, berm, and dunes. The eroded material is transported offshore where it is deposited on the nearshore bottom to form an offshore bar as previously shown by Figure 2-6. This bar eventually grows large enough to break the incoming waves farther offshore, forcing the waves to spend their energy in the surf zone.
(3) Detailed descriptions of the process of storm surge generation and methods to predict the storm surge are presented in EM 1110-2-1412, Chapter 3, EM 1110-2-1414, and Chapter 3 of the Shore Protection Manual (1984).
b. Runup. Vertical height of wave runup above the still-water or storm surge level is important to beach fill design because of the consequences of this runup on the dune and structures behind the beach. Runup during extreme storm events has been observed to overtop and lower the crest height of sand dunes, thereby decreasing the protection provided by the dunes. In situations where the dune crest has been lowered and in areas without dunes, runup can result in direct impact forces on buildings, piers, and boardwalks. These forces can result in significant damage to these structures.
(1) Runup depends on the profile shape and slope, berm height, berm width, and wave number. Modifications of the
4-11

EM 1110-2·3301 31May95
••• "! .••. · .• ,.. . • .•
Plunging Breaker
Bulldln9 Lowest
Supporting Structural Member
Peaking Wave
'· . : ... Rnished Grade
Elevation
Cross-section of the littoral zone showing the three categories of hurricane generated forces and the vertical extent of. influence.
22
20
18
16
14
12
10
8
6
4
2
0
1i 100 if .e 200
:[ 300 u c 40()
r\ I\
LJ I\
\
\ '
400 200 0 Distance in Yards
.....
1- Runup
1- Wave Setup ~--storm SUrve _
Still Water Level
Setup from wind .v ... 1- perpendicular to the coalt
Setup form wind .tren 1- parallel to the coalt
- Atmoepherfc prenure eetup
- Aatronomlcal tide
1- lnltlal water level ,
-- 1~ttnental Slope ....
10 20 30 40 Distance from Coast
in Nautical Miles
""" I 50 60
Components Producing the Storm Surge Still
Water Level
Mean Sea Level
Components of the storm surge still water level.
Figure 4-6. Storm surge components and associated water level magnitudes
4-12

beach profile, including the berm and dune, during a storm event must be considered. An estimate of the response of the design profile is necessary and determination of runup on this modified profile should be made. Various combinations of these parameters should be evaluated to determine the optimum combination that will limit the runup during storm events to an acceptable level. Determination of the acceptable level will require an evaluation to be made of the proximity of buildings and other structures to the wave runup zone.
(2) In some situations, it may not be possible, for economic or environmental reasons, to design the beach fill to limit the runup as required. The construction of bulkheads or seawalls on the landward side of the beach fill may then be considered.
(3) The procedure for estimating run up will depend upon the beach profile cross section and the wave conditions being considered. Breaking wave conditions are assumed in evaluating runup. Runup can be estimated by the methods described in the ACES Manual (Leenknecht et al. 1990). Holman (1986) examined wave runup maxima on natural beaches. Runup was found to be a function of lrribarren number. Resio (1987) presented a method for estimating maximum runup elevation on a natural sand beach during a storm.
c. Overtopping. A determination of the volume of water that will overtop the proposed height of the beach berm and dune, bulkheads, or seawalls is necessary to determine the interior flooding to be expected. This calculation will determine the amount of protection that will be provided by a proposed plan.
( 1) Evaluations of overtopping must consider the overall volume and rate of water contributed to interior flooding during the course of the storm. During the initial stages of a storm, overtopping may be insignificant or nonexistent until the storm surge and wave conditions reach critical heights and the beach and dune profile is eroded. As the storm progresses and the beach is eroded, wave overtopping can be significant. The time-dependent nature of this process must be taken into account in order to evaluate the protection provided by a proposed beach fill plan. In some situations, it may not be possible to design a beach fill plan, even with bulkheads or seawalls included, that will eliminate interior flooding due to wave overtopping (Hanson and Kraus 1989).
(2) As discussed above, overtopping is a time-dependent process. Numerical or physical modeling may be required for an accurate evaluation such as that presented in Hanson and Kraus ( 1989) and Technical Report CERC-88-1
EM 1110-2·3301 31May95
(Lillycrop, Pope, and Abel 1988). In cases where beach fills are backed by seawalls, Goda (1970) presented a procedure for estimating wave overtopping rates. ACES uses the method developed by Wegge) (1976) for calculating wave overtopping rates for monochromatic waves. Ahrens (1977) developed a method for extending Weggel's procedure to irregular waves. Battjes (1974) and Owen ( 1980) proposed a method for calculating wave overtopping rates over smooth sloped structures. Douglass (1984) evaluated many of these methods and the SPM methods result in lower overtopping rates than the Battjes and Owen methods.
d. Potential dune breaching. The purpose of artificial sand dunes in a beach fill project is to provide a reservoir of sand for nourishing the beach during severe storms and to prevent high water and wave runup and overtopping from damaging backshore areas. During extreme events with storm parameters exceeding the design parameters, breaching of a dune system is possible. During hurricanes, the disappearance of sections of 18- to 30-m-wide dunes has been reported (Shore Protection Manual 1984). This can result in extensive coastal flooding, and beach and dune sediments can be swept landward by the water and lost to the dynamic beach system. In some cases, flooding from ocean-side storm surges and waves and return flow will erode enough sand to cut a new tidal inlet through a barrier island.
(1) The potential for dune breaching should be evaluated if dunes are included as part of a storm protection project. Methods for evaluating the potential for dune breaching are presented in Technical Report CERC-87-8 (Birkemeier et al. 1987).
(2) Dunes can be made much more resistant to erosion and breaching if suitable vegetation can be established on the dunes for an adequate length of time to establish an extensive root system. It generally takes 2 to S years for beach grass to establish a healthy root system, and up to 1 O years before the maximum resistance to erosion and breaching is obtained. An active grass fertilization and maintenance program can greatly enhance the survival and effectiveness of beach grass (Chapter 6, Shore Protection Manual (1984)).
e. Longshore transport. A relatively accurate computation of the rate of longshore sediment transport is important in predicting the performance of a beach fill project and in predicting the frequency and quantity of periodic nourishment required. Along a shoreline area where more material is transported from the area than is transported into the area from adjacent shorelines, the frequency and quantities of nourishment will be high. An
4-13

EM 1110-2·3301 31May95
example would be a beach section bordered by a jettied inlet on one end and some man-made littoral barrier on the other end. Depending on the wave climate at such a site, longshore losses may result in nourishment costs.
(I) There are a variety of methods available for estimating long-term average transport rates. It is recommended that a number of independent methods be compared to ensure that the estimates are reasonable. One way to predict longshore transport at a site is to adopt the best known rate from a nearby site, with modifications based on local conditions. This should only be done if the wave climate, beach orientation, and sand sizes are very similar, since longshore transport is very sensitive to these factors. Another way to predict longshore transport rates is to compute them from data showing historical changes in the shoreline location. This is especially suitable for beach fill projects, since it is the long-term average shoreline erosion which is of interest. A number of empirical and analytical methods for the calculation of longshore transport based on sediment characteristics and long-term wave data are presented in Chapter 4 of the Shore Protection Manual (1984).
f. Seaward limit of significant sediment transport. One of the factors required for fill quantity calculations and a number of analytical and numerical models is the closure depth, or depth of maximum sediment motion during a design level storm. This quantity varies based on wave climate and sediment characteristics. The most accurate method of determining the depth of closure is to examine historical profile measurements that bracket storms approaching design level intensity, which is discussed in Section 2-2. The depth at which no changes in the profile took place can be assumed to be the depth of closure, as previously discussed and illustrated by Figure 2-4. A number of profiles should be examined and the results averaged to obtain an accurate result.
(I) A limited field study may be warranted to sample variations in nearshore sediment characteristics, with interpretations as described in Chapter 4 of the Shore Protection Manual (1984). This method uses distinct. variations in sediment characteristics (grain size, color, carbonate content) as one proceeds seaward to delineate the normal seaward limit of motion.
g. Design constraints. During the planning and design of a beach fill project, a number of design constraints may be encountered, including, but not limited to, the following:
(1) Line-of-sight interference due to dune or bulkhead construction. A tradeoff may have to be made between the heights that are acceptable to local interests and those
4-14
required for storm and flood protection. Design analysis should clearly identify the consequences of such a decision.
(2) Availability of borrow material within an economical distance from the project area that is suitable from an engineering standpoint and is acceptable to local interests from an aesthetic point of view. The primary local concerns will include grain size being too large for comfortable beach recreation, stones mixed into beach fill, and fine silt and clay deposits which are periodically uncovered by wave action. Importation of sand material may have to be considered as well as means of extending the residence time of the fill material.
(3) Provision of adequate public beach access that does not compromise the protection provided by the project. This is especially important when the project incorporates vegetated dunes as part of the protection, since the vegetation must be protected from foot traffic while allowing public access. Design of dune walkovers and vehicle accesses may be required.
(4) Objections from local interests to disruptions in recreational activities and public safety concerns during initial construction and periodic nourishment activities.
(5) Objections to wind-blown sand from the beach and dune on shore-front property.
(6) Objections from environmental groups or agencies. Dredging windows will likely be dictated by environmental concerns, and frequently project design must accommodate the preservation of critical habitat areas.
4-4. Design Elements
a. Berm elevation and width. Natural beach berms are formed by the deposit of material by wave action. The height of a berm is related to water level fluctuations, normal foreshore and nearshore slopes, and wave climate. Some beaches have a lower berm, which is formed by the uprush of normal wave action during the ordinary range of water level fluctuations. A higher berm, or storm berm, may also exist, which is formed by wave action during higher water levels.
( 1) The degree of protection to the backshore depends greatly on the width and height of the berm. If a beach fill is placed to a height lower than the natural berm crest, a ridge will form along the crest of the berm and high water may overtop the berm crest causing ponding and temporary flooding of the backshore area. To prevent this flooding, the berm elevation should be designed to equal the elevation of the natural berm. If additional protection is required to
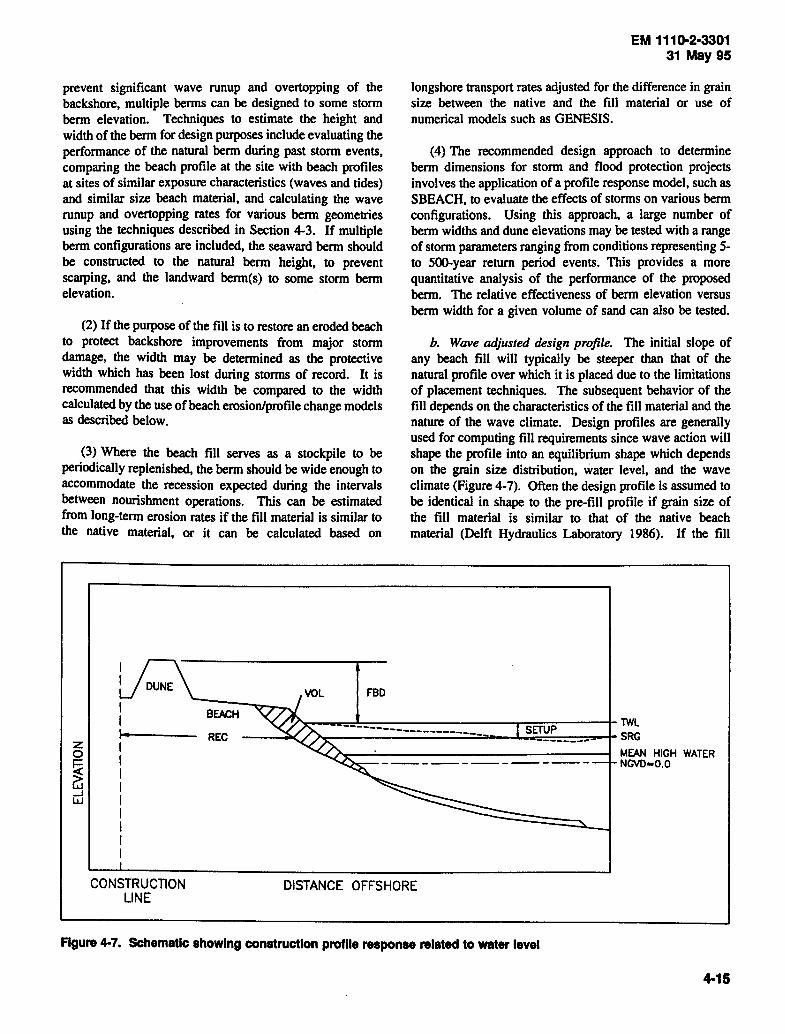
prevent significant wave runup and overtopping of the backshore, multiple benns can be designed to some stonn benn elevation. Techniques to estimate the height and width of the benn for design purposes include evaluating the perfonnance of the natural benn during past stonn events, comparing the beach profile at the site with beach profiles at sites of similar exposure characteristics (waves and tides) and similar size beach material, and calculating the wave runup and overtopping rates for various benn geometries using the techniques described in Section 4-3. If multiple benn configurations are included, the seaward benn should be constructed to the natural berm height, to prevent scarping, and the landward benn(s) to some stonn benn elevation.
(2) If the purpose of the fill is to restore an eroded beach to protect backshore improvements from major stonn damage, the width may be detennined as the protective width which has been lost during storms of record. It is recommended that this width be compared to the width calculated by the use of beach erosion/profile change models as described below.
(3) Where the beach fill serves as a stockpile to be periodically replenished, the benn should be wide enough to accommodate the recession expected during the intervals between nourishment operations. This can be estimated from long-tenn erosion rates if the fill material is similar to the native material, or it can be calculated based on
z 0
~ G'.; _J w
BEACH
REC
EM 1110-2·3301 31May95
longshore transport rates adjusted for the difference in grain size between the native and the fill material or use of numerical models such as GENESIS.
(4) The recommended design approach to detennine benn dimensions for stonn and flood protection projects involves the application of a profile response model, such as SBEACH, to evaluate the effects of stonns on various benn configurations. Using this approach, a large number of benn widths and dune elevations may be tested with a range of stonn parameters ranging from conditions representing 5-to 500-year return period events. This provides a more quantitative analysis of the perfonnance of the proposed benn. The relative effectiveness of benn elevation versus benn width for a given volume of sand can also be tested.
b. Wave adjusted design profile. The initial slope of any beach fill will typically be steeper than that of the natural profile over which it is placed due to the limitations of placement techniques. The subsequent behavior of the fill depends on the characteristics of the fill material and the nature of the wave climate. Design profiles are generally used for computing fill requirements since wave action will shape the profile into an equilibrium shape which depends on the grain size distribution, water level, and the wave climate (Figure 4-7). Often the design profile is assumed to be identical in shape to the pre-fill profile if grain size of the fill material is similar to that of the native beach material (Delft Hydraulics Laboratory 1986). If the fill
CONSTRUCTION LINE
DISTANCE OFFSHORE
Figure 4-7. Schematic showing construction profile response related to water level
4-15
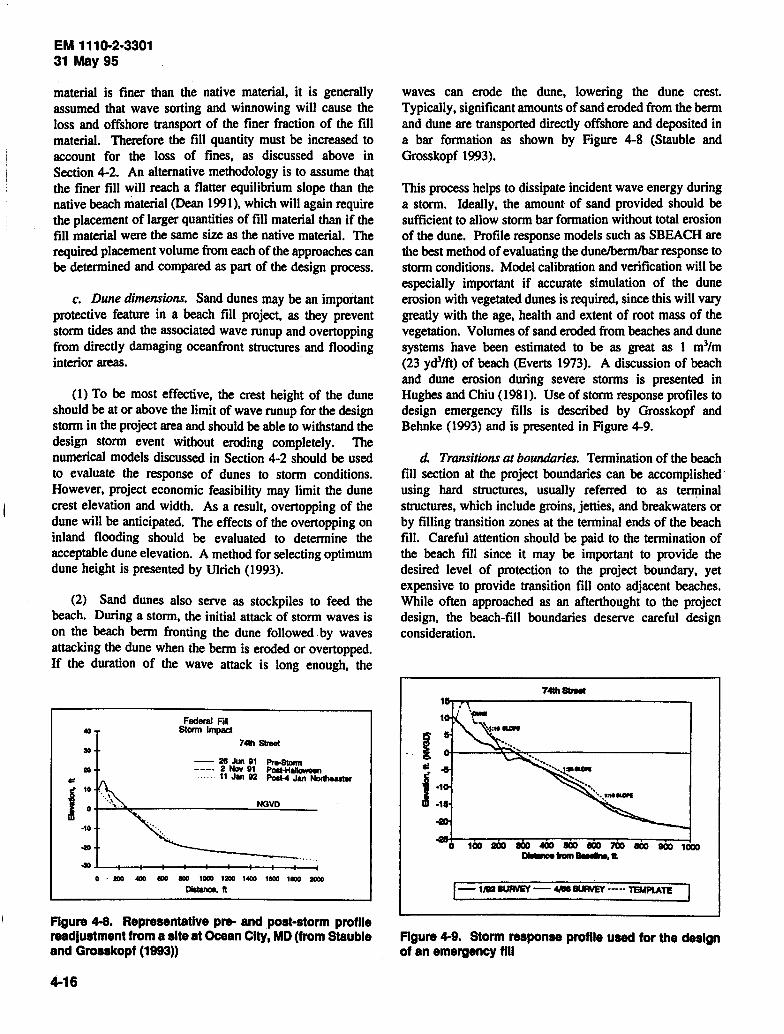
EM 1110-2·3301 31May95
material is finer than the native material, it is generally assumed that wave sorting and winnowing will cause the loss and offshore transport of the finer fraction of the fill material. Therefore the fill quantity must be increased to account for the loss of fines, as discussed above in Section 4-2. An alternative methodology is to assume that the finer fill will reach a flatter equilibrium slope than the native beach material (Dean 1991), which will again require the placement of larger quantities of fill material than if the fill material were the same size as the native material. The required placement volume from each of the approaches can be determined and compared as part of the design process.
c. Dune dimensions. Sand dunes may be an important protective feature in a beach fill project, as they prevent storm tides and the associated wave runup and overtopping from directly damaging oceanfront structures and flooding interior areas.
(1) To be most effective, the crest height of the dune should be at or above the limit of wave runup for the design storm in the project area and should be able to withstand the design storm event without eroding completely. The numerical models discussed in Section 4-2 should be used to evaluate the response of dunes to storm conditions. However, project economic feasibility may limit the dune crest elevation and width. As a result, overtopping of the dune will be anticipated. The effects of the overtopping on inland flooding should be evaluated to determine the acceptable dune elevation. A method for selecting optimum dune height is presented by Ulrich (1993).
(2) Sand dunes also serve as stockpiles to feed the beach. During a storm, the initial attack of storm waves is on the beach berm fronting the dune followed . by waves attacking the dune when the berm is eroded or overtopped. If the duration of the wave attack is long enough, the
·10
Federal Fill Storm Impact
74th Slr8el
- 26 Jun 111 Pre-Slonn ---· 2 Nov 111 Poat~
11 Jan 112 PoaM Jan Nonhaaster
o·a a• a 1~1a1a 1•1a aoco Dillance, ft
Figure 4-8. Representative pre- and post-storm profile readjustment from a site at Ocean City, MD (from Stauble and Gronkopf (1993))
4-16
waves can erode the dune, lowering the dune crest. Typically, significant amounts of sand eroded from the berm and dune are transported directly offshore and deposited in a bar formation as shown by Figure 4-8 (Stauble and Grosskopf 1993).
This process helps to dissipate incident wave energy during a storm. Ideally, the amount of sand provided should be sufficient to allow storm bar formation without total erosion of the dune. Profile response models such as SBEACH are the best method of evaluating the dune/berm/bar response to storm conditions. Model calibration and verification will be especially important if accurate simulation of the dune erosion with vegetated dunes is required, since this will vary greatly with the age, health and extent of root mass of the vegetation. Volumes of sand eroded from beaches and dune systems have been estimated to be as great as 1 m3/m (23 yd3/ft) of beach (Everts 1973). A discussion of beach and dune erosion during severe storms is presented in Hughes and Chiu (1981 ). Use of storm response profiles to design emergency fills is described by Grosskopf and Behnke (1993) and is presented in Figure 4-9.
d. Transitions at boundaries. Termination of the beach fill section at the project boundaries can be accomplished· using hard structures, usually referred to as te~nal structures, which include groins, jetties, and breakwaters or by filling transition zones at the terminal ends of the beach fill. Careful attention should be paid to the termination of the beach fill since it may be important to provide the desired level of protection to the project boundary, yet expensive to provide transition fill onto adjacent beaches. While often approached as an afterthought to the project design, the beach-fill boundaries deserve careful design consideration.
( ti
f ·1
·1
····--......... ... ................
"'·····.?=-aoPI
100 400 llOO 800 700 800 900 1000 ~fnlmBMllne,ft.
1-1182 8URVEY - ...- 8URVEY ••••• TEMPLATE
Figure 4-9. Storm response profile used for the design of an emergency fill
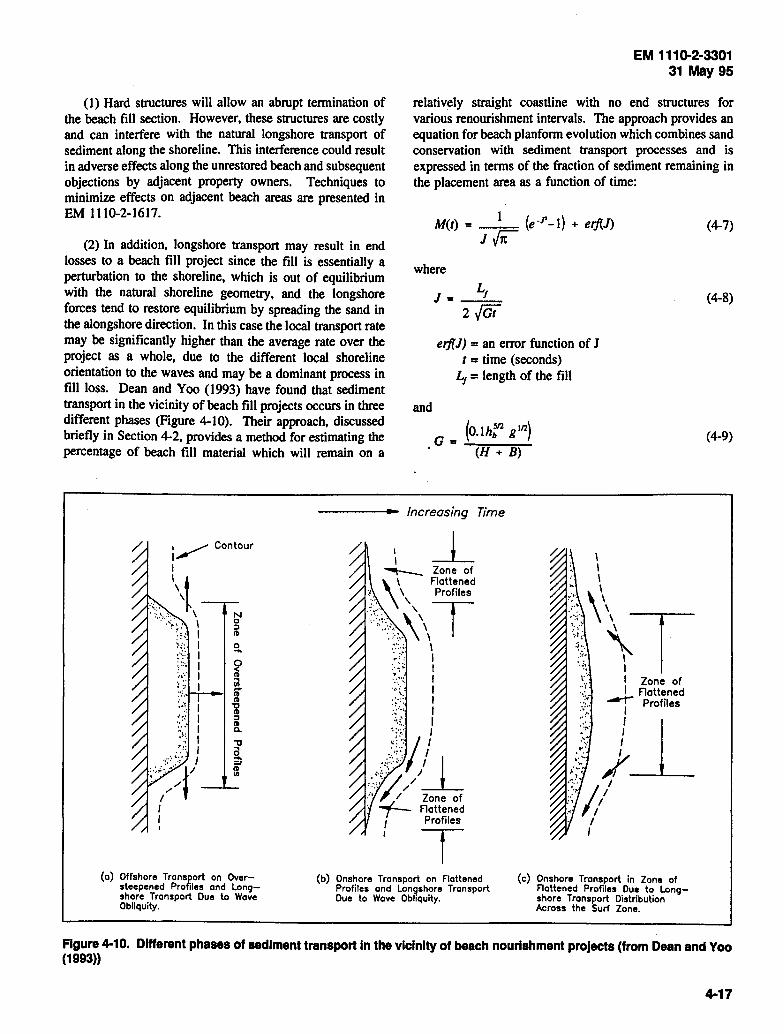
EM 1110-2·3301 31 May 95
(I) Hard structures will allow an abrupt tennination of the beach fill section. However, these structures are costly and can interfere with the natural longshore transport of sediment along the shoreline. This interference could result in adverse effects along the unrestored beach and subsequent objections by adjacent property owners. Techniques to minimize effects on adjacent beach areas are presented in EM 1110-2-1617.
relatively straight coastline with no end structures for various renourishment intervals. The approach provides an equation for beach planfonn evolution which combines sand conservation with sediment transport processes and is expressed in tenns of the fraction of sediment remaining in the placement area as a function of time:
(2) In addition, longshore transport may result in end losses to a beach fill project since the fill is essentially a perturbation to the shoreline, which is out of equilibrium with the natural shoreline geometry, and the longshore forces tend to restore equilibrium by spreading the sand in the alongshore direction. In this case the local transport rate may be significantly higher than the average rate over the project as a whole, due to the different local shoreline orientation to the waves and may be a dominant process in till loss. Dean and Yoo (1993) have found that sediment transport in the vicinity of beach till projects occurs in three different phases (Figure 4-I 0). Their approach, discussed briefly in Section 4-2, provides a method for estimating the percentage of beach fill material which will remain on a
M(t) = _l_ (e-12-1) + erj(J) J{it
(o) Offshore Transport on Oversleepened Profiles and Longshore Transport Due to Wove Obliquity.
where
L, J = ----
2 {Gt
erft.J) =an error function of J t =time (seconds)
L1 = length of the fill
and
G= (0. 1h:Z g 112
)
~(H==--+-B~)-
I I
Increasing Time
~ Zone of \ I Flattened
:1. . \ \ Profiles
.(::·. \'\T <::;:.:., \ ~.:·:.,. \
I /. I
:. ~;: I .:-.-.. ~: I '<. I
T~: : •.1.. I
':·~: I
.:.\'v1 .... : .. ;;/~ .:.:·JI./ Zone of · f- Flattened
1 Profiles I T
(b) Onshore Transport on Flattened Profiles ond Lonljshore Transport Due to Wove Obliquity.
(c) Onshore Transport in Zone of Flattened Profiles Due to Longshore Transport Distribution Across the Surf Zone.
(4-7)
(4-8)
(4-9)
Figure 4-10. Different phases of sediment transport In the vicinity of beach nourishment projects (from Dean and Yoo (1993))
4-17

EM 1110·2·3301 31 May 95
where the variables have been previously defined. Erf(J) can be obtained from various mathematical texts containing error functions and tables. An approximate relationship can be used when l/J is less than 1.0 (causing M(t) to be between 1.0 and 0.5) and is expressed as:
M(t) = 1 - l J{it
(4-10)
(a) Consider a beach fill project to be placed on a straight beach with no end structures and a placement length of 10,000 m (33,000 ft) with a breaker height (hb) of 1.0 m (3.3 ft), closure depth (H) of 6.0 m (19.6 ft), a berm height (B) of 1.5.m (4.9 ft), and a renourishment interval (t) of 5 years. The first step is to determine if Equation 4-10 is valid by using Equations 4-8 and 4-9 to calculate the value of l/J. In this case, G = 0.042, J = 1.96, and l/J = 0.51, satis~ing the conditions validating Equation 4-10. Using Equation 4-10, M(t) = 0.71, meaning that after 5 years, 71 percent of the fill material will remain within the fill length boundaries.
(b). Mitigation of fill end losses can be accomplished by extendmg the lateral ends of fill and tapering the fill ends at a smooth angle in relation to the pre-fill shoreline. Tapering the fill ends will decrease the perturbation effects and minimize the angle of shoreline orientation in relation to approaching wave direction. Optimum tapering lengths of fill end boundaries can be determined with the aid of shoreline response models such as GENESIS.
(3) Filled transition sections are subject to accelerated losses due to the difference in orientation of the transition section with respect to the natural shoreline. These losses are a result of the larger angle between the transition section shoreline and the nearshore wave crest in the project area. Inc~ases .in lo~gshore transport rates occur along these sections smce littoral transport is directly related to this angle. Alternative combinations of transition angle and length should be evaluated to determine the most costeffective design for the project. Procedures for determining longshore transport rates along beach segments with varied transition angles are presented in Chapter 4, Section V,3 of the Shore Protection Manual (1984). The shoreline response model of Dean ( 1991) provides an alternative method of estimating the response of a beach fiII termination to long-term average wave conditions. More complex beach fill transitions can be analyzed using the GENESIS shoreline response model (Hanson and Kraus 1993).
( 4) Costs of the transition sections over the project life should be compared to compartmenting the beach fiII material with groins or jetties and the most cost-effective
4-18
approach should be selected. However, environmental concerns, land ownership constraints, or other factors may determine the selection of the optimum transition.
e. Ancillary structures. In the majority of cases, renourishment of the beach fiII section is required to maintain the project dimensions during the project life. Structures such as groins, jetties, and offshore breakwaters can be incorporated in a beach fill project to reduce the nourishment requirements.
( 1) During the plan formulation phase of the project, alternative plans should be evaluated to determine if the incorporation of structures and reduction in periodic nourishment requirements is more cost-effective than designing the beach fill project without structures.
(2) Techniques for design of a groin system to reduce beach fill losses and offshore breakwater design are presented in EM 1110-2-1617 and the Shore Protection Manual (1984). Additional guidance for the design of offshore breakwaters for shoreline stabilization is presented in Dally and Pope (1986) and Chasten et al. (1993). Numerical shoreline change models such as GENESIS and that of~ (1991) are available to comparatively evaluate the performance of beach fills with and without structures such as groins and breakwaters. Hanson and Kraus ( 1989) present details of the use and applicability of the GENESIS numerical shoreline change model. ·
f. Advanced nourishment requirements. The majority of beach fill projects include nourishment to maintain the dimensions of the beach fill that were selected for construction. These beach dimensions and the resulting project performance are factored into the economic analysis of the project. In order to ensure that these design dimensions are maintained until the first periodic nourishment event occurs, advanced nourishment of the beach fill is usually incorporated during the initial beach fill operation. Advanced nourishment usually consists of placing an additional amount of beach fill (Figure 4-11) to offset the expected losses from the time of completion of the project to the first scheduled nourishment event.
(1) Historical erosion rates can be used to estimate the expected annual losses. Adjustment of the historical erosion losses may be necessary to account for differences between the beach fill and the native beach material on which the historical losses are based. Both the overfill factor R and the renourishment factor R1 may have to be used. I~ the absence of historical erosion rate data, the net longshore sediment transport rate in the project area can be used to estimate the expected annual loss of beach fill from the project. Another source of annual fill loss that must be
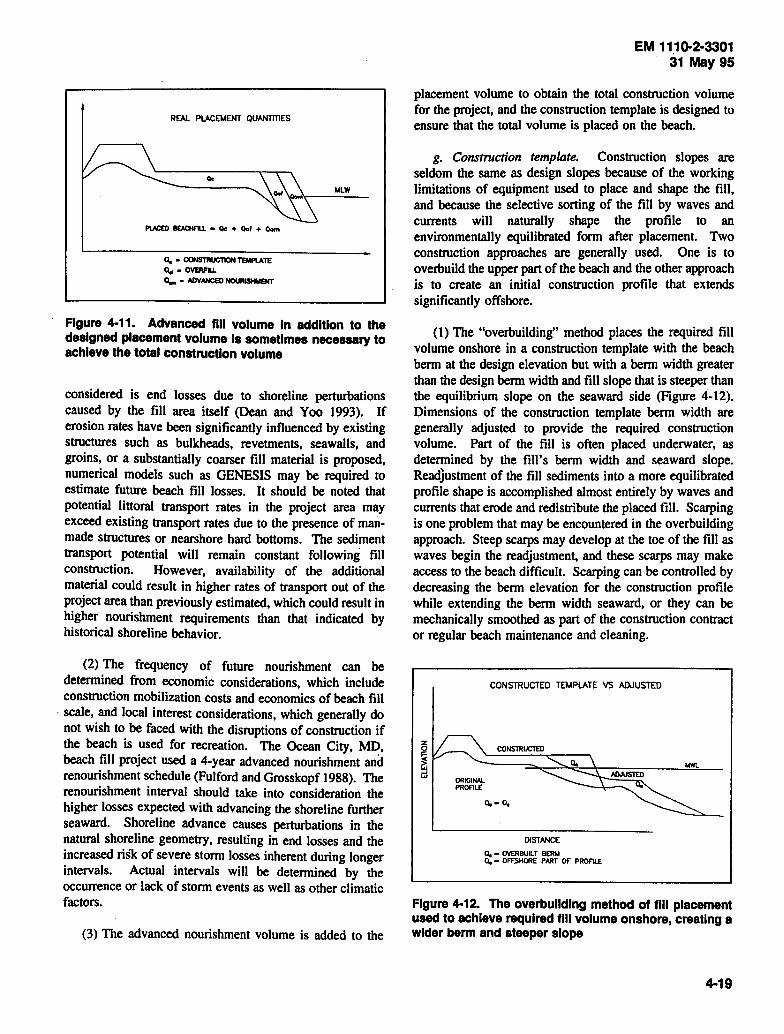
REAL PLACEMENT QUANTITIES
Qc
MLW
PLACED ll£ACHflU. • Qc + Qof + Qom
Figure 4-11. Advanced fill volume In addition to the designed placement volume Is sometimes nece888ry to achieve the total construction volume
considered is end losses due to shoreline perturbations caused by the fill area itself (Dean and Yoo 1993). If erosion rates have been significantly influenced by existing structures such as bulkheads, revetments, seawalls, and groins, or a substantially coarser fill material is proposed, numerical models such as GENESIS may be required to estimate future beach fill losses. It should be noted that potential littoral transport rates in the project area may exceed existing transport rates due to the presence of manmade structures or nearshore hard bottoms. The sediment transport potential will remain constant following fill construction. However, availability of the additional material could result in higher rates of transport out of the project area than previously estimated, which could result in higher nourishment requirements than that indicated by historical shoreline behavior.
(2) The frequency of future nourishment can be determined from economic considerations, which include construction mobilization costs and economics of beach fill
· scale, and local interest considerations, which generally do not wish to be faced with the disruptions of construction if the beach is used for recreation. The Ocean City, MD, beach fill project used a 4-year advanced nourishment and renourishment schedule (Fulford and Grosskopf 1988). The renourishment interval should take into consideration the higher losses expected with advancing the shoreline further seaward. Shoreline advance causes perturbations in the natural shoreline geometry, resulting in end losses and the increased risl< of severe storm losses inherent during longer intervals. Actual intervals will be determined by the occurrence or lack of storm events as well as other climatic factors.
(3) The advanced nourishment volume is added to the
EM 1110-2-3301 31 May 95
placement volume to obtain the total construction volume for the project, and the construction template is designed to ensure that the total volume is placed on the beach.
g. Construction template. Construction slopes are seldom the same as design slopes because of the working limitations of equipment used to place and shape the fill, and because the selective sorting of the fill by waves and currents will naturally shape the profile to an environmentally equilibrated form after placement. Two construction approaches are generally used. One is to overbuild the upper part of the beach and the other approach is to create an initial construction profile that extends significantly offshore.
(I) The "overbuilding" method places the required fill volume onshore in a construction template with the beach berm at the design elevation but with a berm width greater than the design berm width and fill slope that is steeper than the equilibrium slope on the seaward side (Figure 4-12). Dimensions of the construction template berm width are generally adjusted to provide the required construction volume. Part of the fill is often placed underwater, as determined by the fill' s berm width and seaward slope. Readjustment of the fill sediments into a more equilibrated profile shape is accomplished almost entirely by waves and currents that erode and redistribute the placed fill. Scarping is one problem that may be encountered in the overbuilding approach. Steep scarps may develop at the toe of the fill as waves begin the readjustment, and these scarps may make access to the beach difficult. Scarping can be controlled by decreasing the berm elevation for the construction profile while extending the berm width seaward, or they can be mechanically smoothed as part of the construction contract or regular beach maintenance and cleaning.
CONSTRUCTED TEMPLATE VS ADJUSTED
a.- 0.
DISTANCE
0. • OVERBUILT BERM Q, • Off.SHORE PART Of PROFILE
Figure 4-12. The overbulldlng method of flll placement used to achieve required flll volume onshore, creating a wider berm and steeper slope
4-19

EM 1110-2·3301 31May95
(2) The second approach is to initially place more of the fill offshore. Redistribution of the sediment across the profile by waves and currents will still take place after construction to equilibrate the profile shape, but much of the reworking will occur offshore of the fill rather than onshore. This method consists of specifying the total construction volume required in the profile, and a general placement profile, but doesn't require precise placement to construction template grade lines. Care must be taken to ensure that the volume is not placed too low on the profile where it will not be effective in storm protection. Using this construction approach, the contractor's payment is dependent on the amount of material placed on the beach to the offshore depth where the design slope meets the existing bottom. This approach provides the contractor with an incentive to minimize his fill losses.
(3) Both construction approaches result in an onshore fill section that is placed to a desired berm elevation and width and has steep initial slopes. This onshore fill eventually adjusts to a natural slope and narrows the berm, leaving the impression that much of the fill has been lost, although it has only moved offshore to reestablish a stable profile. During the planning and design of a beach fill project, a public involvement program should be conducted to educate the public regarding the natural and expected evolution of a beach fill. More protection may be realized during the evolution process by having more material higher up on the beach.
h. Volume of fill. Following the determination of the dimensions of the beach and dune for storm protection, the total quantity of fill required can be determined. The primary considerations are: (1) the design profile for the area, (2) characteristics of the borrow material compared to the native beach material, (3) the required overfill ratio (R1. ); and (4) advanced nourishment and overbuilding requirements. The first consideration involves determining the design profile and required berm width, as discussed previously, and then determining the volume of fill required to achieve that profile. The volume of fill required can then be calculated using the translation method or Dean's method presented in Section 4-2. It is recommended that both methods be used and compared. When comparing these two methods, the translation method must be adjusted using the overfill ratio (R1. ) to account for possible differences between the fill and native beach materials. If an artificial dune is included in the design, the volume of material required to achieve the design dune dimensions must be added to the design profile volume to determine the construction profile volume. An advanced nourishment fill volume may be added to the placement volume to obtain
4-20
the total construction volume, as shown in Figure 4-11. The total construction volume for a beach fill project can be represented as:
where
Vr =total of placed fill material (cubic meters (cubic feet))
(4-11)
Qd =quantity from design template (cubic meters/meter (cubic feet/feet))
Qo/ = quantity from overfill adjustment (cubic meters/ meter (cubic feet/feet))
Q0
=quantity from advanced nourishment (cubic meters/ meter (cubic feet/feet))
L, = length of shoreline reach (meters (feet))
The overfill adjustment is only necessary when determining volumes for the design nourished profile using the translation method.
(l) If the project area exhibits longshore variability, it may be necessary to subdivide the project area into segments or reaches. All volume determinations should be applied to each reach of shoreline considering the design conditions for each reach. Equation 4-11 can then be applied for each reach of shoreline and the volumes summed to determine the total construction volume.
i. Periodic nourishment. Following the initial beach fill placement, periodic nourishment of the beach will be required to maintain the project dimensions.
(1) The need for renourishment will be determined by the long-term average shoreline retreat or longshore transport rate calculations. It should be recognized by the designer that year-to-year erosion rates can vary greatly from the long-term average rates, and may be significantly influenced by the occurrence of major storms. Therefore, while an average nourishment interval can be estimated, the actual required interval will vary depending on beach conditions dictated by previous climatic conditions. If renourishment is being considered as part of the project design, the advanced nourishment quantities should be included in the total construction fill volume. Project monitoring is important in order to account for unusual conditions during the project life. These facts should be communicated to managers involved with the project and to the public. Provisions to accomplish the required monitoring and initiation of nourishment preparations should be addressed in the project O&M Manual.
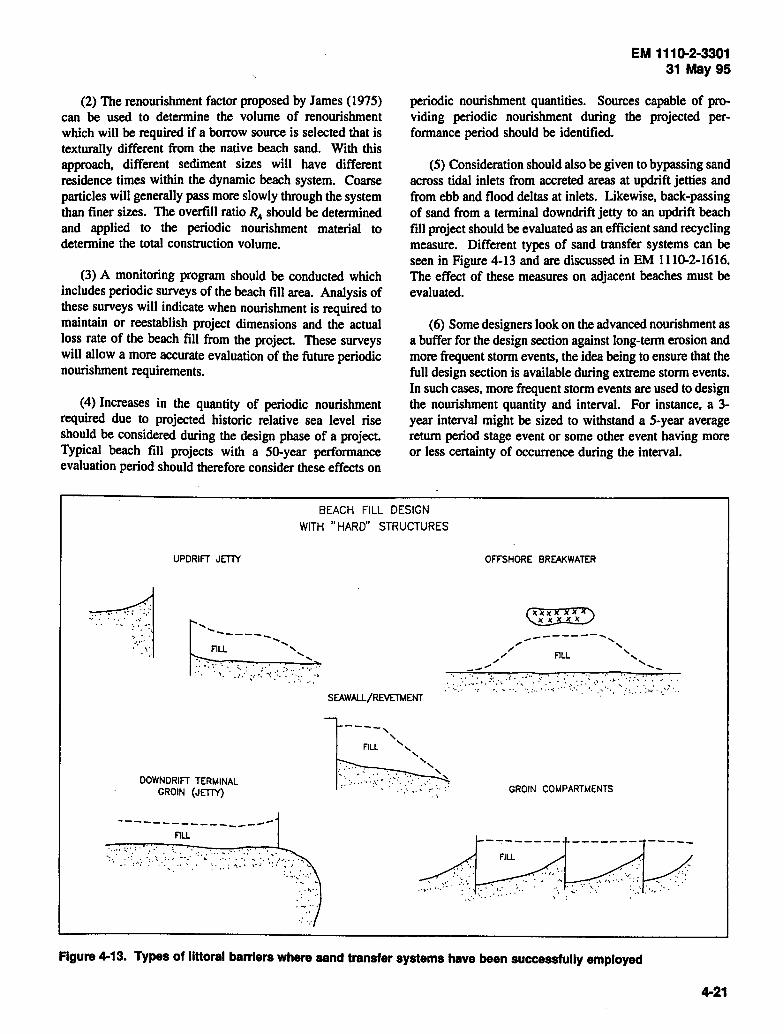
(2) The renourishment factor proposed by James (1975) can be used to determine the volume of renourishment which will be required if a borrow source is selected that is texturally different from the native beach sand. With this approach, different sediment sizes will have different residence times within the dynamic beach system. Coarse particles will generally pass more slowly through the system than finer sizes. The overfill ratio RA should be determined and applied to the periodic nourishment material to determine the total construction volume.
(3) A monitoring program should be conducted which includes periodic surveys of the beach fill area. Analysis of these surveys will indicate when nourishment is required to maintain or reestablish project dimensions and the actual loss rate of the beach fill from the project. These surveys will allow a more accurate evaluation of the future periodic nourishment requirements.
( 4) Increases in the quantity of periodic nourishment required due to projected historic relative sea level rise should be considered during the design phase of a project. Typical beach fill projects with a 50-year performance evaluation period should therefore consider these effects on
EM 1110-2·3301 31May95
periodic nourishment quantities. Sources capable of providing periodic nourishment during the projected performance period should be identified.
(5) Consideration should also be given to bypassing sand across tidal inlets from accreted areas at updrift jetties and from ebb and flood deltas at inlets. Likewise, back-passing of sand from a terminal downdrift jetty to an updrift beach fill project should be evaluated as an efficient sand recycling measure. Different types of sand transfer systems can be seen in Figure 4-13 and are discussed in EM 1110-2-1616. The effect of these measures on adjacent beaches must be evaluated.
(6) Some designers look on the advanced nourishment as a buffer for the design section against long-term erosion and more frequent storm events, the idea being to ensure that the full design section is available during extreme storm events. In such cases, more frequent storm events are used to design the nourishment quantity and interval. For instance, a 3-year interval might be sized to withstand a 5-year average return period stage event or some other event having more or less certainty of occurrence during the interval.
BEACH FILL DESIGN WITH "HARD" STRUCTURES
UPDRIFT JETTY
', ____ _ -........ FILL '
DOWNDRIFT TERMINAL GROIN (JETlY)
--------------FILL
........
SEAWALL/REVETMENT
----, ' FILL ',
' ' ' ' '
OFFSHORE BREAKWATER
---------- ............ ;" '
,/' FILL ', / .... __ , ,_
GROIN COMPARTMENTS
-------- ------- -----. . :·:
Figure 4-13. Types of littoral barriers where sand transfer systems have been successfully employed
4-21
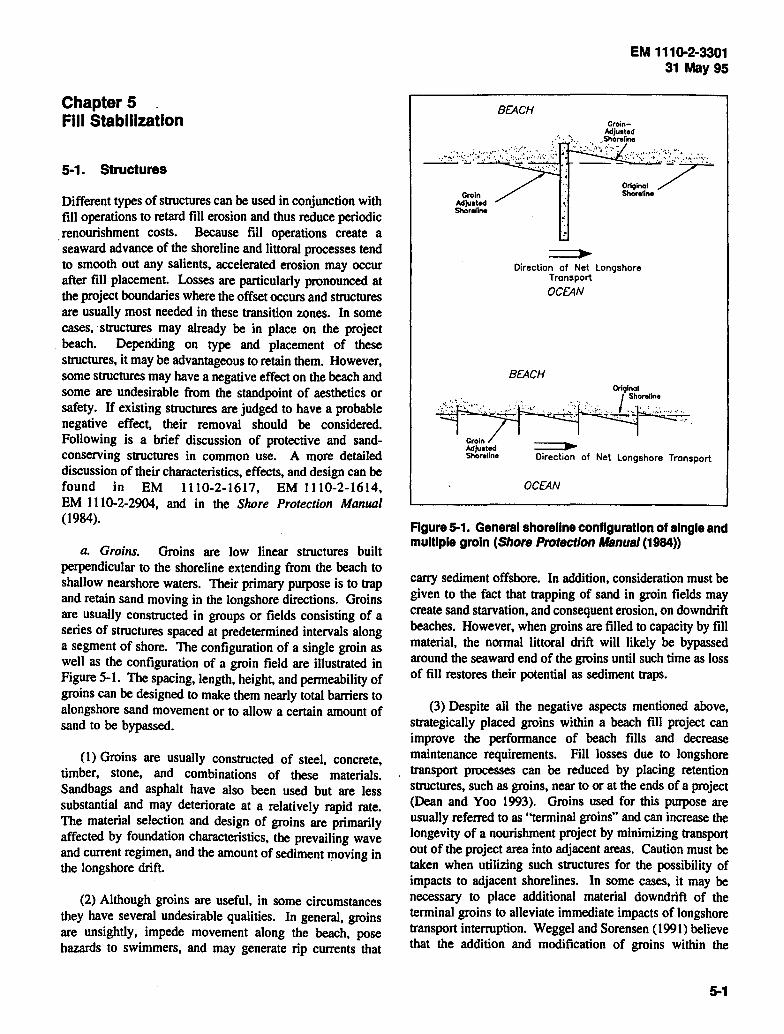
Chapter 5 Fiii Stablllzatlon
5-1. Structures
Different types of structures can be used in conjunction with fill operations to retard fill erosion and thus reduce periodic renourishment costs. Because fill operations create a seaward advance of the shoreline and littoral processes tend to smooth out any salients, accelerated erosion may occur after fill placement. Losses are particularly pronounced at the project boundaries where the offset occurs and structures are usually most needed in these transition zones. In some cases, ·structures may already be in place on the project beach. Depending on type and placement of these structures, it may be advantageous to retain them. However, some structures may have a negative effect on the beach and some are undesirable from the standpoint of aesthetics or safety. If existing structures are judged to have a probable negative effect, their removal should be considered. Following is a brief discussion of protective and sandconserving structures in common use. A more detailed discussion of their characteristics, effects, and design can be found in EM 1110-2-1617, EM 1110-2-1614, EM 1110-2-2904, and in the Slwre Protection Manual (1984).
a. Groins. Groins are low linear structures built perpendicular to the shoreline extending from the beach to shallow nearshore waters. Their primary purpose is to trap and retain sand moving in the longshore directions. Groins are usually constructed in groups or fields consisting of a series of structures spaced at predetermined intervals along a segment of shore. The configuration of a single groin as well as the configuration of a groin field are illustrated in Figure 5-1. The spacing, length, height, and permeability of groins can be designed to make them nearly total barriers to alongshore sand movement or to allow a certain amount of sand to be bypassed.
. (1) Groins are usually constructed of steel, concrete, timber, stone, and combinations of these materials. Sandbags and asphalt have also been used but are less substantial and may deteriorate at a relatively rapid rate. The material selection and design of groins are primarily affected by foundation characteristics, the prevailing wave and current regimen, and the amount of sediment moving in the longshore drift.
(2) Although groins are useful, in some circumstances they have several undesirable qualities. In general, groins are unsightly, impede movement along the beach, pose hazards to swimmers, and may generate rip currents that
BEACH
EM 1110-2·3301 31May95
CroinAdju1ted
:~ · .... .,.. ., .. S~oreline
---"'2'>: ··: .::;;;; ,,,, ,:, . '., ,., ;;~:::;·7
Groin Shoreline Adju1ted Shoreline
===> Direction of Net Longshore
Tronsport
OCEAN
BEACH
==> Direction of Net Longshore Transport
OCEAN
Figure 5-1. General shoreline configuration of slngle and multlple groin (Shore Protection Manual (1984))
carry sediment offshore. In addition, consideration must be given to the fact that trapping of sand in groin fields may create sand starvation, and consequent erosion, on downdrift beaches. However, when groins are filled to capacity by fill material, the normal littoral drift will likely be bypassed around the seaward end of the groins until such time as loss of fill restores their potential as sediment traps.
(3) Despite all the negative aspects mentioned above, strategically placed groins within a beach fill project can improve the performance of beach fills and decrease maintenance requirements. Fill losses due to longshore transport processes can be reduced by placing retention structures, such as groins, near to or at the ends of a project (Dean and Yoo 1993). Groins used for this purpose are usually referred to as "terminal groins" and can increase the longevity of a nourishment project by minimizing transport out of the project area into adjacent areas. Caution must be taken when utilizing such structures for the possibility of impacts to adjacent shorelines. In some cases, it may be necessary to place additional material downdrift of the terminal groins to alleviate immediate impacts of Iongshore transport interruption. Wegge) and Sorensen (1991) believe that the addition and modification of groins within the
5-1
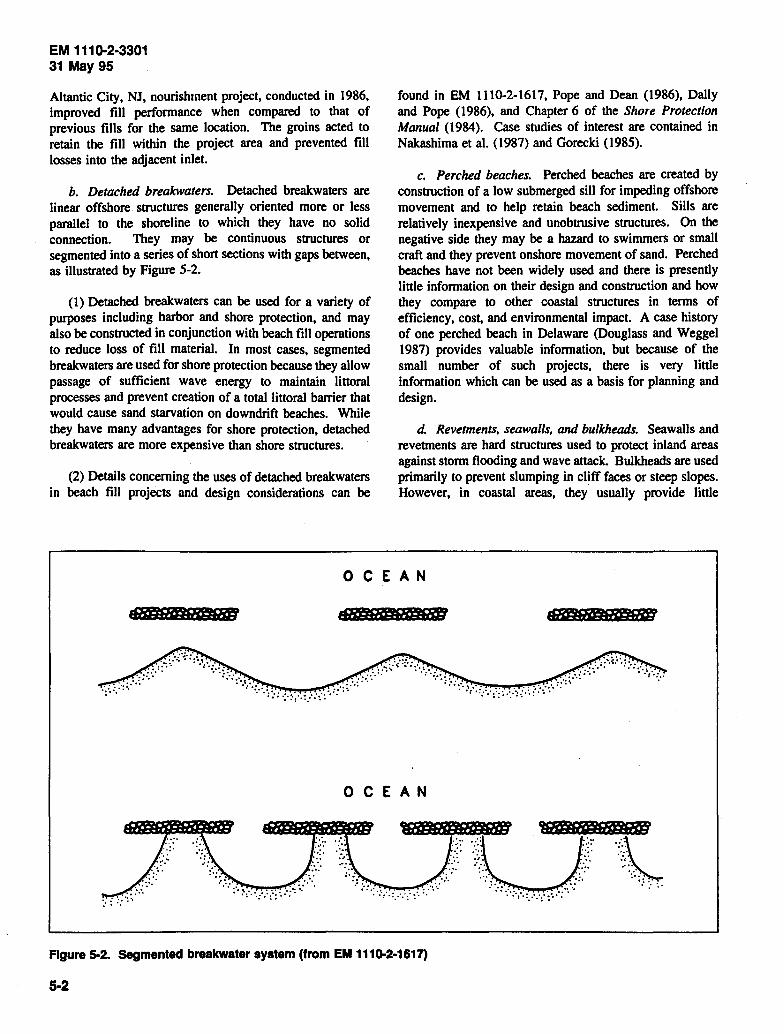
EM 1110-2·3301 31May95
Altantic City, NJ, nourishment project, conducted in 1986, improved fill performance when compared to that of previous fills for the same location. The groins acted to retain the fill within the project area and prevented fill losses into the adjacent inlet.
b. Detached breakwaters. Detached breakwaters are linear offshore structures generally oriented more or less parallel to the shoreline to which they have no solid connection. They may be continuous structures or segmented into a series of short sections with gaps between, as illustrated by Figure 5-2.
(1) Detached breakwaters can be used for a variety of purposes including harbor and shore protection, and may also be constructed in conjunction with beach fill operations to reduce loss of fill material. In most cases, segmented breakwaters are used for shore protection because they allow passage of sufficient wave energy to maintain littoral processes and prevent creation of a total littoral barrier that would cause sand starvation on downdrift beaches. While they have many advantages for shore protection, detached breakwaters are more expensive than shore structures.
(2) Details concerning the uses of detached breakwaters in beach fill projects and design considerations can be
found in EM 1110-2-1617, Pope and Dean (1986), Dally and Pope (1986), and Chapter 6 of the Shore Protection Manual (1984). Case studies of interest are contained in Nakashima et al. (1987) and Gorecki (1985).
c. Perched beaches. Perched beaches are created by construction of a low submerged sill for impeding offshore movement and to help retain beach sediment. Sills are relatively inexpensive and unobtrusive structures. On the negative side they may be a hazard to swimmers or small craft and they prevent onshore movement of sand. Perched beaches have not been widely used and there is presently little information on their design and construction and how they compare to other coastal structures in terms of efficiency, cost, and environmental impact. A case history of one perched beach in Delaware (Douglass and Weggel 1987) provides valuable information, but because of the small number of such projects, there is very little information which can be used as a basis for planning and design.
d. Revetments, seawalls, and bulkheads. Seawalls and revetments are hard structures used to protect inland areas against storm flooding and wave attack. Bulkheads are used primarily to prevent slumping in cliff faces or steep slopes. However, in coastal areas, they usually provide little
0 CE AN
OCEAN
Figure 5-2. Segmented breakwater system (from EM 1110-2-1617)
5·2
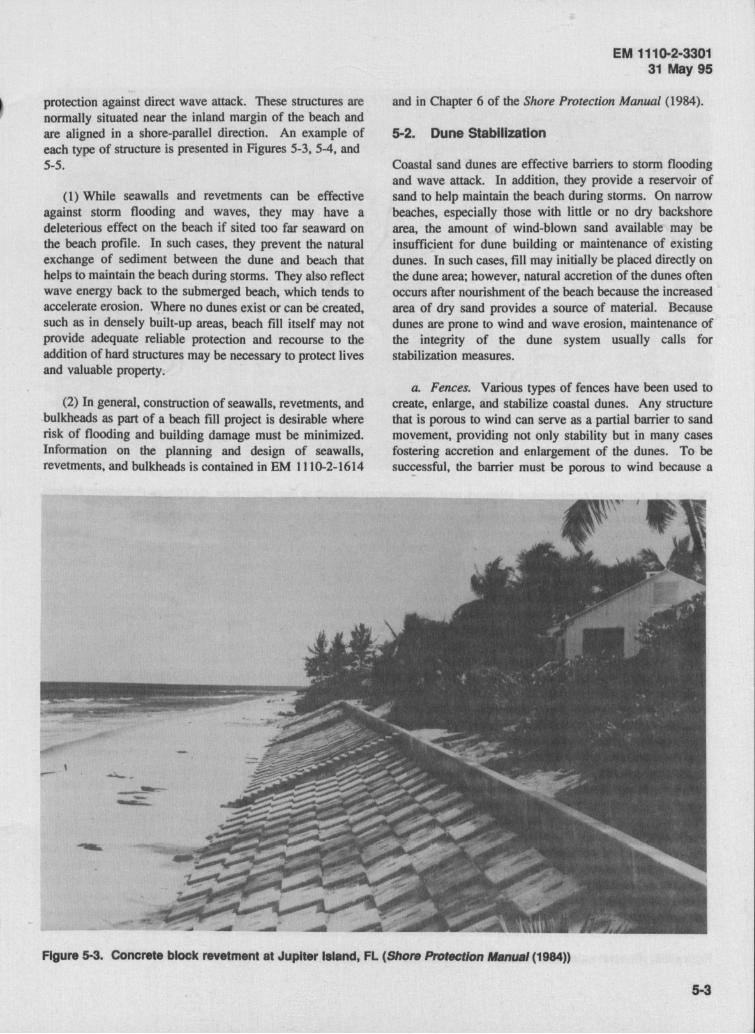
protection against direct wave attack. These structures are nonnally situated near the inland margin of the beach and are aligned in a shore-parallel direction. An example of each type of structure is presented in Figures 5-3, 5-4, and 5-5.
(1) While seawalls and revetments can be effective against stonn flooding and waves, they may have a deleterious effect on the beach if sited too far seaward on the beach profile. In such cases, they prevent the natural exchange of sediment between the dune and beetch that helps to maintain the beach during stonns. They also reflect wave energy back to the submerged beach, which tends to accelerate erosion. Where no dunes exist or can be created, such as in densely built-up areas, beach fill itself may not provide adequate reliable protection and recourse to the addition of hard structures may be necessary to protect lives and valuable property.
(2) In general, construction of seawalls, revetments, and bulkheads as part of a beach fill project is desirable where risk of flooding and building damage must be minimized. lnfonnation on the planning and design of seawalls, revetments, and bulkheads is contained in EM 1110-2-1614
EM 1110-2·3301 31 May 95
and in Chapter 6 of the Shore Protection Manual (1984).
5·2. Dune Stabilization
Coastal sand dunes are effective barriers to stonn flooding and wave attack. In addition, they provide a reservoir of sand to help maintain the beach during stonns. On narrow beaches, especially those with little or no dry backshore area, the amount of wind-blown sand available may be insufficient for dune building or maintenance of existing dunes. In such cases, fill may initially be placed directly on the dune area; however, natural accretion of the dunes often occurs after nourishment of the beach because the increased area of dry sand provides a source of material. Because dunes are prone to wind and wave erosion, maintenance of the integrity of the dune system usually calls for stabilization measures.
a. Fences. Various types of fences have been used to create, enlarge, and stabilize coastal dunes. Any structure that is porous to wind can serve as a partial barrier to sand movement, providing not only stability but in many cases fostering accretion and enlargement of the dunes. To be suc~essful, the barrier must be porous to wind because a
Figure 5-3. Concrete block revetment at Jupiter Island, FL (Shore Protection Manual (1984))
5-3
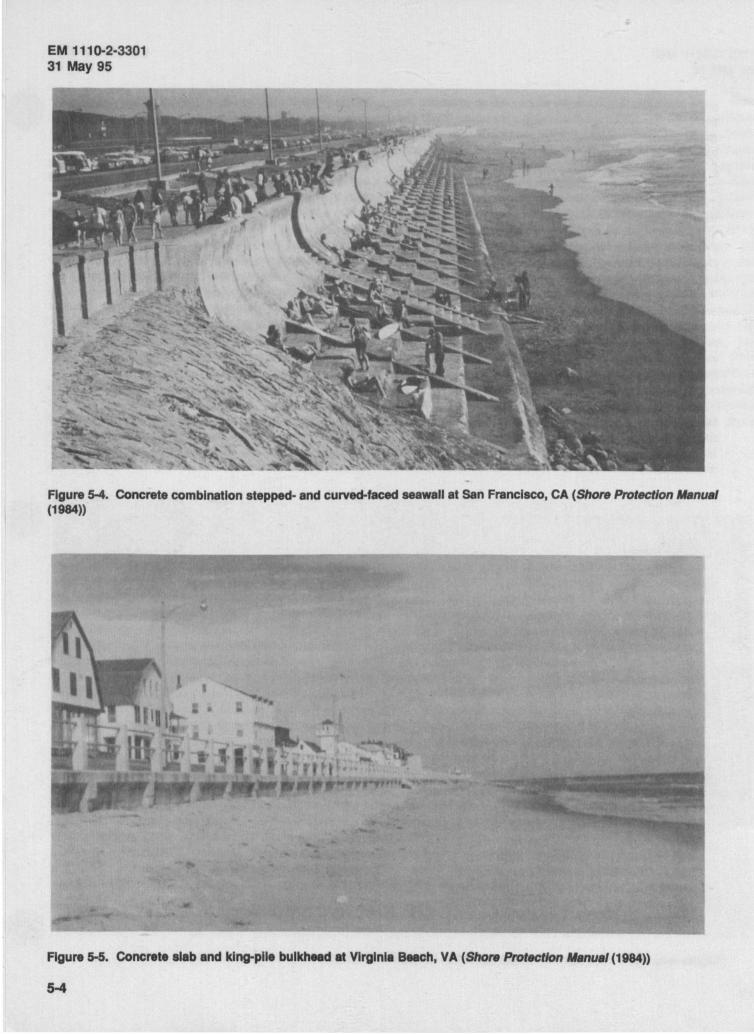
EM 1110-2-3301 31 May 95
Figure 5-4. Concrete combination stepped- and curved-faced seawall at San Francisco, CA (Shore Protection Manual (1984))
Figure 5-5. Concrete slab and king-pile bulkhead at Virginia Beach, VA (Shore Protection Afanua/(1984))
5-4
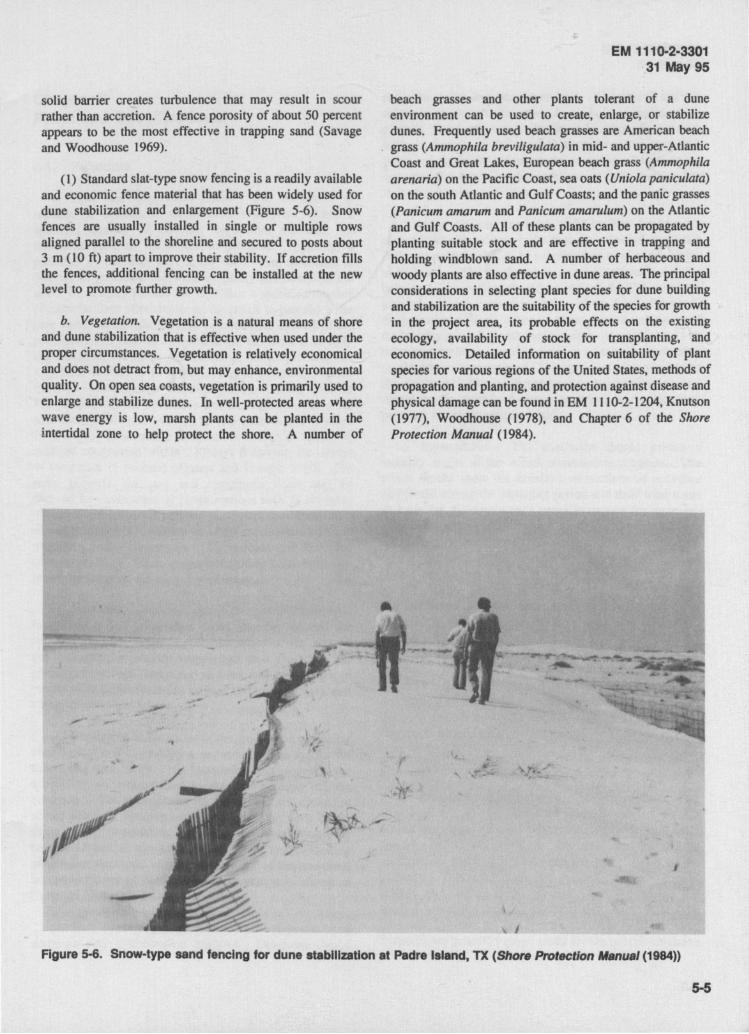
solid barrier creates turbulence that may result in scour rather than accretion. A fence porosity of about 50 percent appears to be the most effective in trapping sand (Savage and Woodhouse 1969).
(1) Standard slat-type snow fencing is a readily available and economic fence material that has been widely used for dune stabilization and enlargement (Figure 5-6). Snow fences are usually installed in single or multiple rows aligned parallel to the shoreline and secured to posts about 3 m (10 ft) apart to improve their stability. If accretion fills the fences, additional fencing can be installed at the new level to promote further growth.
b. Vegetation. Vegetation is a natural means of shore and dune stabilization that is effective when used under the proper circumstances. Vegetation is relatively economical and does not detract from, but may enhance, environmental quality. On open sea coasts, vegetation is primarily used to enlarge and stabilize dunes. In well-protected areas where wave energy is low, marsh plants can be planted in the intertidal zone to help protect the shore. A number of
-
EM 1110-2-3301 .31May95
beach grasses and other plants tolerant of a dune environment can be used to create, enlarge, or stabilize dunes. Frequently used beach grasses are American beach grass (Ammophila brevi/igulata) in mid- and upper-Atlantic Coast and Great Lakes, European beach grass (Ammophila arenaria) on the Pacific Coast, sea oats (Uniola paniculata) on the south Atlantic and Gulf Coasts; and the panic grasses (Panicum amarum and Panicum amarulum) on the Atlantic and Gulf Coasts. All of these plants can be propagated by planting suitable stock and are effective in trapping and holding windblown sand. A number of herbaceous and woody plants are also effective in dune areas. The principal considerations in selecting plant species for dune building and stabilization are the suitability of the species for growth in the project area, its probable effects on the existing ecology, availability of stock for transplanting, and economics. Detailed information on suitability of plant species for various regions of the United States, methods of propagation and planting, and protection against disease and physical damage can be found in EM J J 10-2-1204, Knutson (1977), Woodhouse (1978), and Chapter 6 of the Shore Protection Manual (1984) .
•
I
1
Figure 5-6. Snow-type sand fencing for dune stablllzatlon at Padre Island, TX (Shore Protection Manual (1984))
5-5
Chapter 6 Plans and Specifications
6-1. Schedule
a. Start and completion dates. The contractor is required to commence work under a contract within a specified number of calendar days after the date the contractor receives the notice to proceed. Typically, a period of 10 calendar days is specified. The contractor is directed to prosecute the work diligently and complete the entire work ready for use not later than a specified number of calendar days after receipt of the notice to proceed. The time stated for completion also includes final cleanup of the premises. The time of completion for the work is directly dependent on the scope and extent of the project and can vary from as short as 60 to 90 days up to a number of years for large-scale projects. For example, the Atlantic Coast of Maryland Shoreline Protection Project, which included the placement of about 2. 7 million m3 (3.5 million yd3) of beach fill and dune construction along about 8 miles of shoreline, required completion within 720 days following the receipt of the notice to proceed (Anders and Hanson 1990). For some projects, the start and completion dates may be di~tated by environmental considerations such as dredging wmdows or recreational seasons. Sufficient completion time should be provided in order to avoid excessively high bid proposals from contractors. To enforce the specified completion time for a project, liquidated damages are generally required for each day of delay.
b. Start and completion dates for specific sub-tasks. Inte~m start and completion dates may be required for specific subtasks, depending on the scope of the project. For example, an interim completion date for beach fill placement between designated stations may be required to enable other project features such as revetment or bulkhead construction to proceed.
(I) Depending on the scope of the project, the contractor may be. required to develop a network analysis system for schedul~ng the work. In preparing this system, the schedulmg of construction is the responsibility of the contractor. The requirement for the system is included to assure adequate planning and execution of the work and to assist the Contracting Officer in appraising the reasonablene~s of the proposed schedule and evaluating progress of the work. An example of one of the numerous acceptable types of network analysis systems is shown in Corps of Engineers Pamphlet 415-1-4.
(2) The system should consist of diagrams and accompanying mathematical analyses. Diagrams should
EM 1110-2·3301 31May95
show the order and interdependence of activities and the sequence in which the work is to be accomplished as planned by the contractor. The basic concept of a network analysis diagram is followed to show how the start of a given activity is dependent on the completion of preceding activities and how completion of one activity restricts the start of following activities.
(3) A preliminary network defining the contractor's planned operations during the first 60 calendar days after notice to proceed should be submitted soon after the notice to proceed. The contractor's general approach for the balance of the project should be indicated. The complete network analysis system consisting of the detailed network mathematical analysis, schedule of anticipated earnings as of the last day of each month, and network diagrams should be submitted within a specified number of calendar days after receipt of notice to proceed. The approved schedule should then be used by the contractor for planning, organizing, and directing the work, reporting progress, and requesting payment for work accomplished.
c. Expenditures. The contractor should submit a monthly report of the actual construction progress. The report should show the activities or portions of activities completed during the reporting period and their total value as basis for the contractor's periodic request for payment. Payment made should be based on the total value of such activities completed or partially completed after verification by the Contracting Officer. An updated network analysis should be used as a basis of partial payment. The report should state the percentage of the work actually completed and scheduled as of the report date and the progress along the critical path in terms of days ahead or behind the allowable dates. If the project is behind schedule, progress along other paths with negative slack should also be reported. The contractor should also submit a narrative report which should include but not be limited to a description of the problem areas, current and anticipated, delaying factors and their impact, and an explanation of corrective actions taken or proposed.
6-2. Specifications
a. Boundaries of project area. The limit of the contract area available to the contractor must be shown on the project drawings. Except where indicated, the contractor should confine his work to the area seaward of the construction baseline and between the lateral limits of the contract. This area does not generally include access, storage, and staging areas. Access routes and storage and staging areas required to perform the work should be provided by, and at the expense of, the local sponsor. Sponsors are generally given credit for the cost of obtaining
6-1
EM 1110-2·3301 31May95
the necessary easements and rights-of-way toward their share of project costs. The contractor should coordinate access to the work area and storage and staging area locations with the Contracting Officer. Unless otherwise approved by the Contracting Officer, excess equipment should only be stored in approved storage or staging areas or in temporary areas in the immediate vicinity of the site of the beach fill placement. Operation of grading and other construction equipment should not be permitted outside the work area limits except for ingress and egress to and from the site at approved locations.
b. Boundaries of bo"ow area. All excavation for beach fill material should be . performed within the borrow area limits shown on the project drawings. Excavation in the borrow areas may be restricted to specified elevations depending on the findings of the geotechnical investigations of the borrow site. For offshore sources, the contractor should be required to set appropriate buoys which should meet U.S. Coast Guard standards to delineate the limits of the borrow areas. The contractor should be required to have electronic positioning equipment capable of achieving class 1 survey accuracies as specified by EM 1110-2-1003. These accuracies are necessary to locate the dredge when operating in the borrow area. Continuous location of the dredge should be determined at all times during dredging operations. The location should be determined with a probable range of error not to exceed 15 m (50 ft) to avoid violations of the environmental permits and clearances and furnished as a part of the daily report of operations. Prior to initiation of any dredging, the contractor should submit for approval his proposed method of determining dredge location.
c. Routes between borrow area and project site. The determination of the route and the method of transporting the beach fill material from the borrow area to the fill area should be at the contractor's option. For offshore borrow sources, the contractor should be required to conduct the work in such manner as to obstruct navigation as little as possible. Upon completion of the work, the contractor should promptly remove his plant, including ranges, buoys, piles, and other marks placed by him under the contract in· navigable waters or on shore.
(1) If a pipeline dredge is utilized in a congested navigation area, the pipeline may have to be submerged except at the dredge or at the location of any booster pumps or pump-house barges. The contractor should maintain a tight discharge pipeline at all times. The joints of the pipeline should be so constructed as to preclude spillage and leakage. Upon development of a leak, the pipeline should be promptly repaired and the dredge may have to be shut down until a complete repair has been made.
6·2
(2) If a submerged pipeline is placed across navigable water, the contractor should notify the Contracting Officer in writing to be received in the District Office prior to the desired closure date. This notification should furnish the following:
(a) Location and depth (over the top of the pipeline) at which the submerged line should be placed.
(b) The desired length of time the navigable water is to be obstructed.
( c) The date and hour placement or removal should commence.
(d) The date and hour of anticipated completion.
It is recommended that a statement concerning submerged pipelines similar to the following be included in the dredging contract:
Submerged Pipelines. In the event the contractor elects to submerge his pipeline, the top of the submerged pipeline shall be no higher than the required dredging depth for a channel for which the pipeline is placed. The submerged pipeline shall be marked with signs, buoys, and lights as required to the complete satisfaction of the Contracting Officer. (USACE, Wilmington District 1994)
Complying with this requirement may require that the contractor excavate a trench in the channel bottom.
(3) If the contractor elects to use a hopper dredge or pump-out barge, overflow during loading should be permitted to the extent that designated turbidity and water quality standards are met. The contractor should limit the loading to partial loads, if necessary, to meet turbidity and water quality requirements for the overflow during loading. No overflow or spillage should be permitted during transport to the discharge site.
d. Placement methods. The contractor should be given the option of starting the beach fill placement operations at any point and proceeding in any direction along the project beach, unless special conditions exist.
(1) Acceptance reaches which are segments of beach measured along the construction baseline between the designated stations shown on the drawings should be used. For the case of the lateral termini, the acceptance reach is the segment of beach, measured along the construction baseline, between the longitudinal limit of fill and the subsequent designated station.
(2) Once the contractor begins placement in an acceptance reach, placement in that reach should be completed before proceeding to another acceptance reach. Beach fill placement operations should proceed in an orderly manner from reach to reach. If more than one dredge and/or pump-out facility is utilized by the contractor, more than one beach fill operation may be accomplished simultaneously. Placement of beach fill in more than two locations at any one time should only be allowed if adequate inspection is available.
(3) Prior to initiation of beach fill operations, the contractor should submit for approval his proposed plan for beach fill placement. The plan should include the type of dredge plant to be utilized, the location and type of any booster pump facilities to be utilized, and the order of work for beach fill placement. The Contracting Officer should reserve the right to reject any scenario which, in his opinion, may be detrimental to the stability of the in-place beach fill, which may unduly disrupt access to or use of the beach by the public during placement operations, or for any other credible reason. Excavation of sand from the existing beach for use as beach fill should not be permitted.
( 4) All materials excavated from the borrow areas should be transported to and deposited in the nearshore and on the beach or dune area within the lines (see paragraph 4-4.g), grades, and cross sections in a controlled manner so as to maximize sand retention within the beach fill section and minimize losses to the ocean. This should be accomplished in a manner acceptable to the Contracting Officer and may include, but not be limited to, temporary diking where required, control of the discharge pipe direction and velocity of discharge, and the control of the sand and water mixture. Temporary diking included within the dune cross section may be left in place and incorporated into the dune structure.
(5) For dredged borrow sources, fill placement on the beach can be accomplished by a single or double-pipe system. The double-pipe system consists of a yoke attached to the discharge line and, by use of a double-value arrangement, the discharge slurry is selectively distribut~d to either one pipe or the other, or to both pipes simultaneously. The beach is built by placing the first discharge pipe at the desired final fill elevation and pumping until the desired elevation is reached. By alternating between the two discharge lines, beach width is built to the full cross section as the discharge lines advance. Final placement to the design lines and grades can be accomplished using bulldozers.
(6) The contractor should be required to maintain and protect the beach fill in a satisfactory condition at all times
EM 1110-2·3301 31May95
until acceptance of the work. Prior to placement of beach fill, the contractor should remove from the work site all snags, driftwood, and similar foreign debris lying within the limits of the beach fill section.
(7) Excavated material should be placed and brought to rest on the beach to the lines, grades, and cross sections indicated on the drawings, unless otherwise directed by the Contracting Officer. Beach topography is subject to changes, and elevations on the beach at the time the work is accomplished may vary from the design elevations. Resulting beach fill quantities may also vary from those shown in the Unit Price Schedule. To accommodate this situation, the contracting Officer should reserve the right to vary the beach fill cross sections at any location along the beach.
(8) The contractor should be responsible for any damage caused by excessive water flowing landward of the beach fill section. Where a pipeline is placed along the beach, sand should be placed around the pipe to form a pedestrian ramp over the pipe at street ends and at mid blocks or at locations otherwise directed by the Contracting Officer. All such ramps should be maintained as long as the pipe is in pla~e.
e. Final project dimensions. The intent of the contract is to place beach fill to the lines and grades prescribed in the contract. Tolerances should be provided in the template for the practicality of construction. Landward of the surf zone, a tolerance 0.2 m (0.5 ft) above or below the beach fill template and measured vertically from the finished grade line is usually permitted. The contractor should be required, however, to provide his best efforts in placing material to the designated lines and grades landward of the influence of waves. It should be considered that the primary goal of nourishment is to place a specified volume of material per foot of beach. The required dimensions of the construction template, particularly the width of the construction berm, should not be explicitly specified so that the width of the berm can be adjusted during construction to account for actual foreshore slope the fill acquires during placement.
( 1) Any material placed above the prescribed cross section, plus the allowable tolerance, should not be included in the pay quantities. However, such material may be left in place at the discretion of the Contracting Officer. Continual placement of material to the plus tolerance should not be permitted. In the event that material placed at any prescribed cross section is below the minus tolerance, the contractor should be required to provide additional sand to the level of the beach fill template.
(2) Upon completion of all filling operations in any
6-3

EM 1110-2·3301 31 May 95
acceptance reach, beach fill should be graded and dressed so as to eliminate any undrained pockets and abrupt mounds or depressions in the beach fill surface as necessary to comply with tolerance requirements specified. All temporary dikes not incorporated into the dune cross section should be completely degraded.
(3) Any material that is deposited elsewhere than in places designated or approved by the Contracting Officer or his authorized representative should not be paid for and the contractor should be required to remove such misplaced material and deposit it where directed, at his expense.
f. Method of calculating fill volume for payment. Available options for calculating fill volumes for payment include tabulation of the fill delivered by truckload from land borrow sources, comparison of pre- and post-dredging surveys for offshore sources, and measurement of in-place volumes after placement. Of these options, the latter is generally recommended. With this method, acceptance reaches should be used for the purpose of closely monitoring the accumulative amounts of beach fill placed. Acceptance reaches should also be used to control the timing for pre-placement and post-placement surveys. The Contracting Officer should not accept payment for a reach until beach fill placement is completed within an acceptance reach and final surveys have been approved. Separate acceptance for the dune portion of the beach fill may be made upon approval of the Contracting Officer. In no case, however, should the contractor be paid more than once for sand placed in any space along any acceptance reach, should erosion occur before the entire volume of sand is placed. Unless otherwise approved by the Contracting Officer, acceptance reach stationing should be as shown on the contract drawings.
(1) Beach fill, satisfactorily placed, may be measured for payment by use of the average end area method. Quantity computations should be verified from survey data submitted by the contractor in accordance with specified procedures. The basis of measurement should be the pre-placement cross sections of the beach and dune area taken by the contractor just prior to placement of fill in any acceptance reach and a second set of cross sections of the same area taken by the contractor as soon as practicable after completion of beach fill placement for any acceptance reach. Once postplacement surveys have been taken in an acceptance reach, no removal of beach fill material should be permitted in that reach unless otherwise directed by the Contracting Officer. Landward of the surf zone limit, the area of fill material lying above the plus tolerance template should be deducted from the gross area and the net amount used as a basis for measurement. Seaward of the surf zone limit, the
quantity of fill material used as a basis for measurement should be that determined from the minimum of the area of fill measured between pre- and post-fill cross sections, less any material placed seaward of the intersection of the beach fill template with the existing sand surface. Reasonable constraints with respect to the construction template should be used on the foreshore portion of the profile. Keep in mind that the success of the project should be based on the placement of a required volume of fill per foot of beach.
(2) Payment for beach fill should be made at the contract unit price per cubic meter (cubic yard). Such payment should constitute full compensation for furnishing all labor and performing all work necessary to excavate, transport, and place beach fill material, and all other items of work required by the drawings and the specifications for which separate payment is not provided.
(3) Survey specifications should indicate that the contractor should conduct the original and final surveys and surveys for any period for which progress payments are requested. All these surveys should be conducted under the direction of the Contracting Officer, unless the Contracting Officer waives this requirement in a specific instance. The contractor_ should employ a registered and licensed land surveyor, experienced in land and hydrographic surveying, to perform the work required for quantity surveys. Prior to initiation of any quantity surveys, the contractor should submit to the Contracting Officer for approval a description of his method and the type of equipment that will be used for making quantity surveys.
( 4) The contractor should make such surveys and computations as are necessary to determine the quantities of work performed or sand placed. All original field notes, computations, and other records should be furnished to the Contracting Officer at the site of the work.
(5) The contractor should perform his pre-placement surveys of an acceptance reach no more than S days prior to placement of beach fill material. Prior to placement of beach fill material the contractor should submit to the
. Contracting Officer, all field notes, data disc(s), and computations in a sufficient amount of time so that control of quantities and, if necessary, adjustment to the berm width may be made.
(6) Post-placement surveys should be made as soon as practicable after completion of an acceptance reach. The contractor should use the same stations that were used in the pre-placement surveys. Post-placement surveys for the next reach should not be conducted until the previous reach is accepted by the Contracting Officer.

(7) The contractor should prepare and provide to the Contracting Officer, immediately after completion of an acceptance reach, cross-sectional drawings showing preplacement conditions, postplacement conditions, and the design beach fill template for each section surveyed. Survey cross sections should be taken perpendicular to the construction baseline at specified stations and at the beginning and ending acceptance reach stations. When unusual site or geographical conditions exist, additional
EM 1110-2·3301 31 May 95
stations and elevations should be taken for greater definition. Pre- and postplacement surveys should extend to a distance seaward of the intersection of the beach fill template with the existing sand surface. That distance should be at the discretion of the presiding District. The scale for the plotted cross-section drawing should be on the order of 2.5 cm = 1.5 m (1 in. = 5 ft) vertical and 2.5 cm = 6.1 m (1 in. = 20 ft) horizontal. All stations and elevation points taken from field books should be clearly indicated on the sections.

Chapter 7 Project Performance Monitoring
7·1. Purpose of Performance Monitoring
Beach nourishment has become a preferred method for controlling erosion and mitigating storm damage. Construction of a beach fill project represents a long-term commitment to a staged construction plan where the beach fill is reconstructed periodically to maintain the desired design over the life of the project. Design dimensions will v~ duri~g the.life of a given construction fill. Usually the design . d1mens10ns are determined to provide optimum protection ~rom storms over a wide frequency range based on theoreucal or laboratory models of design profile response. These models are necessarily conservative in order to account for the lateral and vertical variations that are characteristic of actual beach erosion and the ill-defined storm condition. The degree of natural rebuilding following a storm, or the occurrence of two or more closely spaced storms, is generally not addressed in the selection of the minimum cross section. Additional fill is placed to absorb the losses expected between reconstruction events and is theoretically adjusted to reflect the effects of borrow material on the long-term average loss rate. These losses reflect natural recovery of the native beach and an average of mild and extreme storm years. In the event of a single severe storm or an unusually stormy season, it may be necessary to schedule reconstruction earlier than anticipated. Under extreme circumstances, it may even be necessary to place emergency fills in order to avoid consequential damages. Beach fills operate as sacrificial structures in a dynamic environment, which makes it imperative that their condition and performance be monitored (see EM 1110-2-1004, Coastal Project Monitoring). The primary objectives for monitoring a beach fill project are as follows: ·
a. To document and assess project performance to determine how well it fulfills the protection requirements for which it was designed.
b. To identify maintenance and renourishment require.: men ts.
c. To evaluate project impacts.
d. To assess the behavior of the borrow area.
Accomplishing these objectives should follow a three-phase approach, which includes field data collection of required information, data analysis, and project assessment.
7·2. Fiii Placement Monitoring
EM 1110-2·3301 31May95
A monitoring plan for the fill placement area consists of four major components: beach profile surveys, beach sediment sampling, wave and water level measurements and aerial shoreline photography. These four componen~ define the minimum requirements for documenting and assessing the performance of a beach nourishment project. The monitoring process should begin before the placement of any material. Long-term and seasonal cycles of beach profile change and sediment distribution should be evaluated to determine the characteristics of the active native beach which is also an important part of the design phase. Shortterm and long-term assessment of project behavior is required to understand and document the redistribution of the nourished profile into a more naturally shaped profile as a result of the dominant coastal processes. The re-sorting processes of the fill occur as a result of wave and current action which hydraulically separate the new fill material into a more natural grain size zonation and cause rapid adjustments of the fill immediately after placement. Consequently, it is recommended that post-fill monitoring begin as soon as material is placed on a given segment of the project area.
a. Baseline data. It is very important that historical data on the native beach as it existed before the project be collected, compiled, and available for comparison with postproject monitoring results. However, sufficient data may already exist for· the native beach during the pre-project study. Pre-project and historical data required for the monitoring of such a project are described in Chapter 2 of this manual. In many instances, some of the data are discarded after project completion, particularly sediment samples. Without this valuable data, further studies and investigations of the project area are seriously hampered or precluded. It is therefore important to retain all data and sediment samples of the native beach. This is not only for comparison with monitoring data but as an irreplaceable scientific resource.
b. Beach profile data. Periodic surveying of profile lines in and adjacent to the project area before and immediately after placement of fill is the primary method of evaluating changes in dune, beach, and nearshore morphology. Selection of profile locations depends on the type of project, such as beach fill adjacent to an inlet or jetty, beach fill on a continuous shoreline, etc. The number of profile locations within the nourished area depends on the length of fill area and its proximity to inlets or other shore-normal structures. Spacing between profiles is site-specific;
7·1
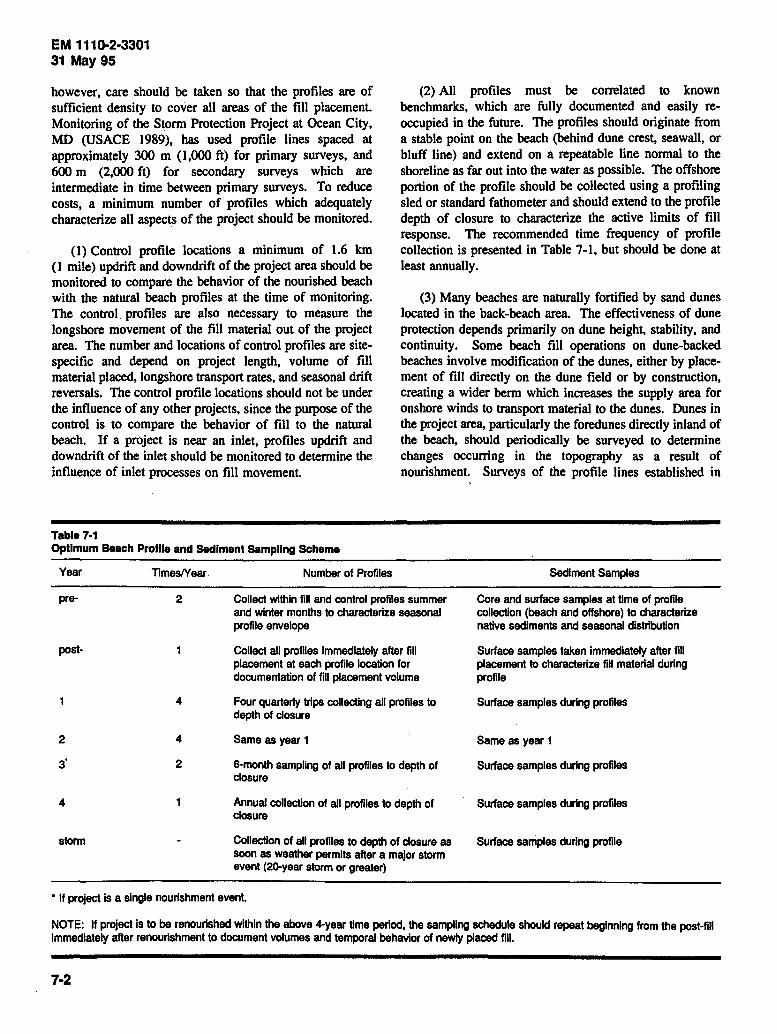
EM 1110-2·3301 31May95
however, care should be taken so that the profiles are of sufficient density to cover all areas of the fill placement. Monitoring of the Storm Protection Project at Ocean City, MD (USACE 1989), has used profile lines spaced at approximately 300 m (1,000 ft) for primary surveys, and 600 m (2,000 ft) for secondary surveys which are intermediate in time between primary surveys. To reduce costs, a minimum number of profiles which adequately characterize all aspects of the project should be monitored.
(1) Control profile locations a minimum of 1.6 km (1 mile) updrift and downdrift of the project area should be monitored to compare the behavior of the nourished beach with the natural beach profiles at the time of monitoring. The control profiles are also necessary to measure the longshore movement of the fill material out of the project area. The number and locations of control profiles are sitespecific and depend on project length, volume of fill material placed, longshore transport rates, and seasonal drift reversals. The control profile locations should not be under the influence of any other projects, since the purpose of the control is to compare the behavior of fill to the natural beach. If a project is near an inlet, profiles updrift and downdrift of the inlet should be monitored to determine the influence of inlet processes on fill movement.
Table 7-1 Optimum Beach Profile and Sediment Sampling Scheme
Year Times/Year. Number of Profiles
(2) All profiles must be correlated to known benchmarks, which are fully documented and easily reoccupied in the future. The profiles should originate from a stable point on the beach (behind dune crest, seawall, or bluff line) and extend on a repeatable line normal to the shoreline as far out into the water as possible. The offshore portion of the profile should be collected using a profiling sled or standard f athometer and should extend to the profile depth of closure to characterize the active limits of fill response. The recommended time frequency of profile collection is presented in Table 7-1, but should be done at least annually.
(3) Many beaches are naturally fortified by sand dunes located in the back-beach area. The effectiveness of dune protection depends primarily on dune height, stability, and continuity. Some beach fill operations on dune-backed beaches involve modification of the dunes, either by placement of fill directly on the dune field or by construction, creating a wider berm which increases the supply area for onshore winds to transport material to the dunes. Dunes in the project area, particularly the foredunes directly inland of the beach, should periodically be surveyed to determine changes occurring in the topography as a result of nourishment. Surveys of the profile lines established in
Sediment Samples
pre- 2 Collect within fill and control profiles summer Core and surface samples at time of profile and winter months to characterize seasonal collection (beach and offshore) to characterize profile envelope native sediments and seasonal distribution
post- Collect all profiles immediately after fill Surface samples taken immediately after fill placement at each profile location for placement to characterize fill material during documentation of fill placement volume profile
4 Four quarterly trips collecting all profiles to Surface samples during profiles depth of closure
2 4 Same as year 1 Same as year 1
3• 2 6-month sampling of all profiles to depth of Surface samples during profiles closure
4 Annual collection of all profiles to depth of Surface samples during profiles closure
storm Collection of all profiles to depth of closure as Surface samples during profile soon as weather permits after a major storm event (20-year storm or greater)
• If project is a single nourishment event.
NOTE: If project is to be renourlshed within the above 4-year time period, the sampling schedule should repeat beginning from the post-fiU immediately after renourlshment to document volumes and temporal behavior of newly placed fill.
7-2

the monitoring -study will indicate large-scale changes. Integrity of the dune defenses depends largely on crest height continuity. Potential critical areas of low foredune elevation may occur between the established profile lines. It is therefore desirable to survey a shore-parallel dune crest height profile of the foredunes at more closely spaced data points than the profile line spacing.
(4) Profile surveys should be conducted using sled survey apparatus. These systems are accurate and simplistic in design and are considered to be the best methods for collecting high-accuracy beach survey data. For areas not accessible by sled, surveys can be collected by conventional land survey methods on the dry beach out to wading depth and boat-mounted acoustic fathometers for submerged portions of the beach system.
c. Beach sediment sampling. Sediment samples should be collected for each profile line during the time of survey. A minimum of three samples should be collected on each profile at the following locations: mean high water (mhw); mid-tide level (mtl); and mean low water (mlw). In areas that are not under tidal influence, such as the Great Lakes, corresponding sediment samples should be collected at the following locations: base of dune, bluff, or seawall; midberm; and waterline. Sampling at the base of the dune or seawall is suggested if that location is subject to frequent storm and wave action.
(1) Stauble (1988) found that in order to comprehensively monitor the sediment redistribution across the entire profile, surface samples can alternatively be collected at selected morphological features such as the mid-berm, berm crest, step, bar trough, bar crest, and the seaward bar slope at the depth of closure as discussed in Chapter 2. This sampling characterizes the hydrodynamic zonation of the sediment distribution as the fill material readjusts, rather than sampling at fixed distances from a shore reference point regardless of profile shape.
(2) Core samples should also be collected at selected locations for selected profiles during the pre-nourishment data collection. These samples are used to characterize the variability in native beach seasonal and storm-related sediment distribution (Anders, Underwood, and Kimball 1987). Although the core sampling locations are projectspecific, it is suggested that the mid-berm, berm crest, midtide, and step be adequately sampled.
(3) The recommended temporal and spacial schedule for project sediment sampling is presented in Table 7-1. The time scheduling for sediment sampling is basically the same as the profile scheduling.
EM 1110-2·3301 31May95
d. Storm events. Extreme events, such as a major storm, often exert a pronounced and long-lasting effect on coastal areas. It is for this reason that the immediate effects of the event on the project area and the amount of recovery after the return of normal conditions are important items of information. To evaluate the effects of an extreme event, a data collection effort should be made as soon after the event as conditions permit. Plans should be provided in advance for this purpose so that minimum time elapses between the event and the commencement of field data collection. The items to be monitored and methods used for post-storm data collection are basically the same as used for scheduled surveys with an essential minimum of:
(1) Storm wind, wave, and surge data.
(2) Beach profile survey data.
(3) Sediment characteristics data.
e. Beach fill monitoring data analysis. Analysis of the profile monitoring data should include: profile volume change and shape readjustment; areas on profile of erosion and accretion; volume of fill remaining within the project area; -assessment of fill movement in both alongshore and cross-shore directions; and seasonal storm response. Analysis of sediment data should include: grain size statistics of native and fill material; documentation of grain size readjustment over the monitoring time period; seasonal and storm grain size response; and assessment of fill and renourishment factors for future fill design requirements.
(1) Stauble and Hoel (1986) documented short- and long-term project behavior and design guidelines. They examined project behavior 1 year after placement and important coastal processes influencing fill distribution. This indicated that the volume of fill remaining within the project is a function of several related physical factors as well as wave components. The amount of fill placed per unit length of beach may be a predictor of project response within the first year of placement.
(2) Past projects have shown that borrow suitability is an important parameter on project longevity. The selection of sediment sampling locations to be used for suitability analysis was examined by Stauble, Hanson, and Blake (1984) and found that a composite of mhw, mtl, and mlw samples gave the best representation of both the native beach and post-fill sediment characteristics. Furthermore, offshore grain size distributions changed little over the monitoring period. Suitability analysis, which includes offshore samples, was found to bias the native beach towards better suitability with finer borrow material, thus
7-3
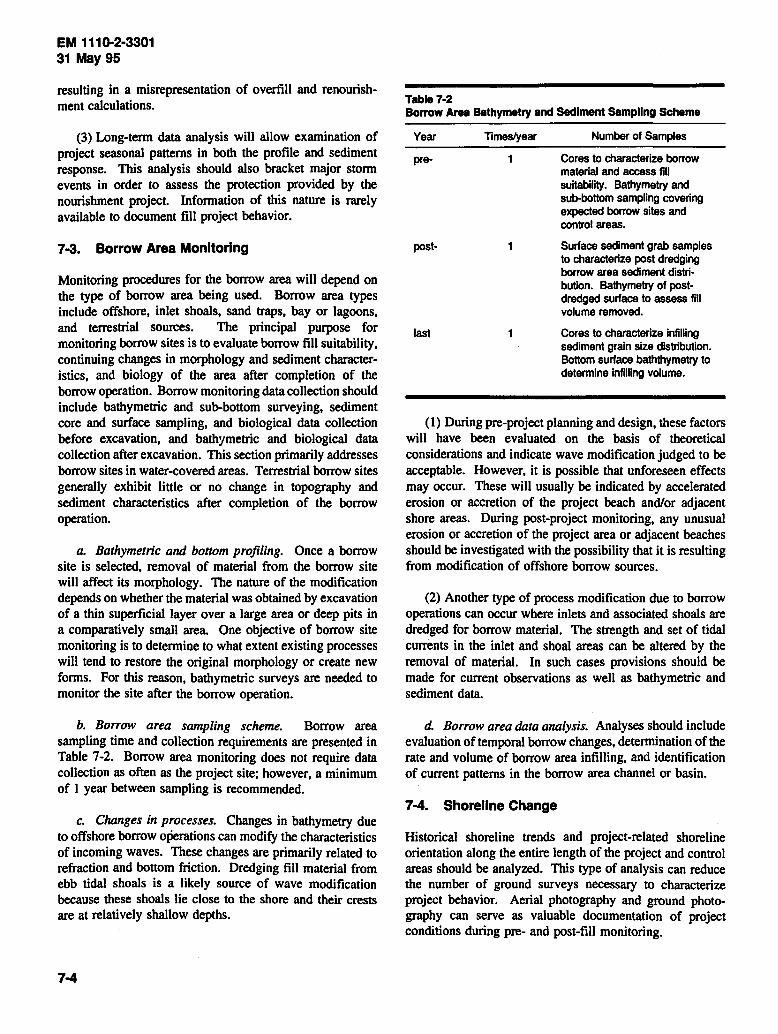
EM 1110-2·3301 31May95
resulting in a misrepresentation of overfill and renourishment calculations.
(3) Long-term data analysis will allow examination of project seasonal patterns in both the profile and sediment response. This analysis should also bracket major storm events in order to assess the protection provided by the nourishment project Information of this nature is rarely available to document fill project behavior.
7-3. Borrow Area Monitoring
Monitoring procedures for the borrow area will depend on the type of borrow area being used. Borrow area types include offshore, inlet shoals, sand traps, bay or lagoons, and terrestrial sources. The principal purpose for monitoring borrow sites is to evaluate borrow fill suitability, continuing changes in morphology and sediment characteristics, and biology of the area after completion of the borrow operation. Borrow monitoring data collection should include bathymetric and sub-bottom surveying, sediment core and surface sampling, and biological data collection before excavation, and bathymetric and biological data collection after excavation. This section primarily addresses borrow sites in water-covered areas. Terrestrial borrow sites generally exhibit little or no change in topography and sediment characteristics after completion of the borrow operation.
a. Bathymetric and bottom profiling. Once a borrow site is selected, removal of material from the borrow site will affect its morphology. The nature of the modification depends on whether the material was obtained by excavation of a thin superficial layer over a large area or deep pits in a comparatively small area. One objective of borrow site monitoring is to determine to what extent existing processes will tend to restore the original morphology or create new forms. For this reason, bathymetric surveys are needed to monitor the site after the borrow operation.
b. Borrow area sampling scheme. Borrow area sampling time and collection requirements are presented in Table 7-2. Borrow area monitoring does not require data collection as often as the project site; however, a minimum of 1 year between sampling is recommended.
c. Changes in processes. Changes in bathymetry due to offshore borrow OPerations can modify the characteristics of incoming waves. These changes are primarily related to refraction and bottom friction. Dredging fill material from ebb tidal shoals is a likely source of wave modification because these shoals lie close to the shore and their crests are at relatively shallow depths.
7-4
Table 7·2 Borrow Area Bathymetry and Sediment Sampling Scheme
Year Times/year
post·
last
Number of Samples
Cores to characterize borrow material and access fill suitability. Bathymetry and sub-bottom sampling covering expected borrow sites and control areas.
Surface sediment grab samples to characterize post dredging borrow area sediment distri· bution. Bathymetry of postdredged surface to assess fill volume removed.
Cores to characterize infilling sediment grain size distribution. Bottom surface baththymetry to determine Infilling volume.
( 1) During pre-project planning and design, these factors will have been evaluated on the basis of theoretical considerations and indicate wave modification judged to be acceptable. However, it is possible that unforeseen effects may occur. These will usually be indicated by accelerated erosion or accretion of the project beach and/or adjacent shore areas. During post-project monitoring, any unusual erosion or accretion of the project area or adjacent beaches should be investigated with the possibility that it is resulting from modification of offshore borrow sources.
(2) Another type of process modification due to borrow operations can occur where inlets and associated shoals are dredged for borrow material. The strength and set of tidal currents in the inlet and shoal areas can be altered by the removal of material. In such cases provisions should be made for current observations as well as bathymetric and sediment data.
d. Borrow area data analysis. Analyses should include evaluation of temporal borrow changes, determination of the rate and volume of borrow area infilling, and identification of current patterns in the borrow area channel or basin.
7-4. Shoreline Change
Historical shoreline trends and project-related shoreline orientation along the entire length of the project and control areas should be analyzed. This type of analysis can reduce the number of ground surveys necessary to characterize project behavior. Aerial photography and ground photography can serve as valuable documentation of project conditions during pre- and post-fill monitoring.
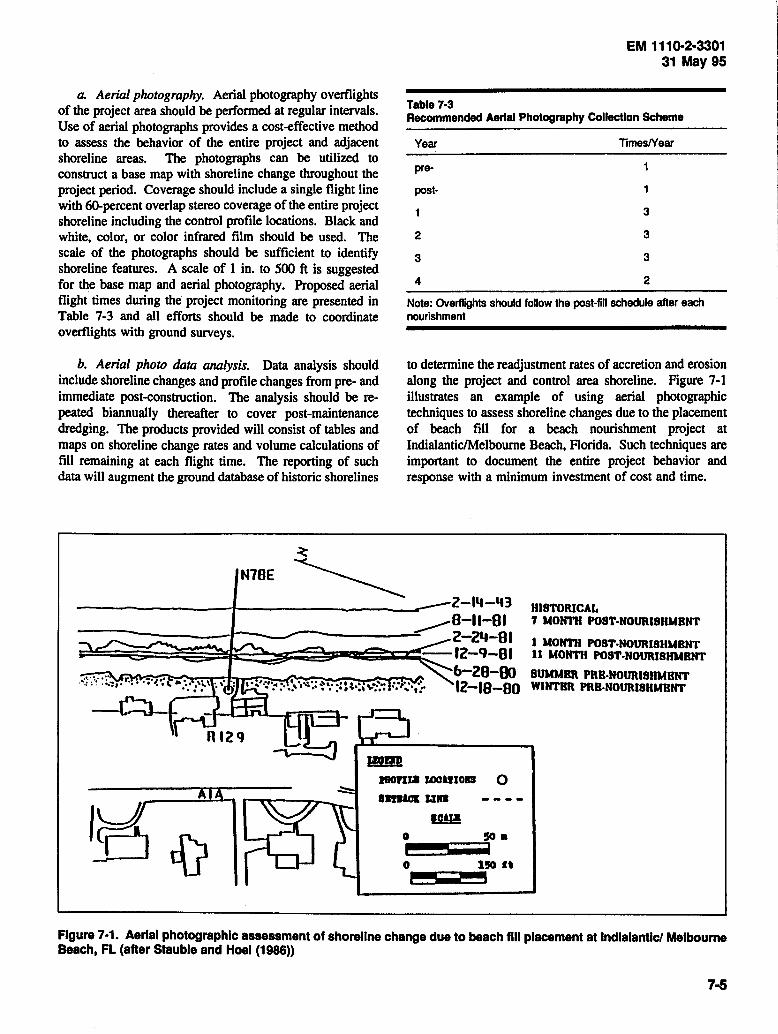
a. Aerial photography. Aerial photography overflights of the project area should be perfonned at regular intervals. Use of aerial photographs provides a cost-effective method to assess the behavior of the entire project and adjacent shoreline areas. The photographs can be utilized to construct a base map with shoreline change throughout the project period. Coverage should include a single flight line with 60-percent overlap stereo coverage of the entire project shoreline including the control profile locations. Black and white, color, or color infrared film should be used. The scale of the photographs should be sufficient to identify shoreline features. A scale of 1 in. to 500 ft is suggested for the base map and aerial photography. Proposed aerial flight times during the project monitoring are presented in Table 7-3 and all efforts should be made to coordinate overflights with ground surveys.
b. Aerial photo data analysis. Data analysis should include shoreline changes and profile changes from pre- and immediate post-construction. The analysis should be repeated biannually thereafter to cover post-maintenance dredging. The products provided will consist of tables and maps on shoreline change rates and volume calculations of fill remaining at each flight time. The reporting of such data will augment the ground database of historic shorelines
N78E
Table 7-3
EM 1110-2·3301 31 May 95
Recommended Aerlal Photography Collection Scheme
Year
pre
post-
2
3
4
Times/Year
3
3
3
2
Note: Overflights should follow the post-fill schedule after each nourishment
to determine the readjustment rates of accretion and erosion along the project and control area shoreline. Figure 7-1 illustrates an example of using aerial photographic techniques to assess shoreline changes due to the placement of beach fill for a beach nourishment project at Indialantic/Melbourne Beach, Florida. Such techniques are important to document the entire project behavior and response with a minimum investment of cost and time.
HISTORICAL 7 MONTH POST·NOURISHMBNT
1 MONTH POST-NOURISHMBNT U MONTH POST-NOURJSHUBNT
BUMMBR PRB-NOURJBllMBNT WINTBR PRB·NOURISHMBNT
IROftJ.8 f.OOlltOll 0 llDICI un -- --10 WI!
_O {( 0 !SO.
0 150 "
Figure 7-1. Aerial photographic assessment of shoreline change due to beach fill placement at lndlalantlc/ Melbourne Beach, FL (after Stauble and Hoel (1986))
7-5
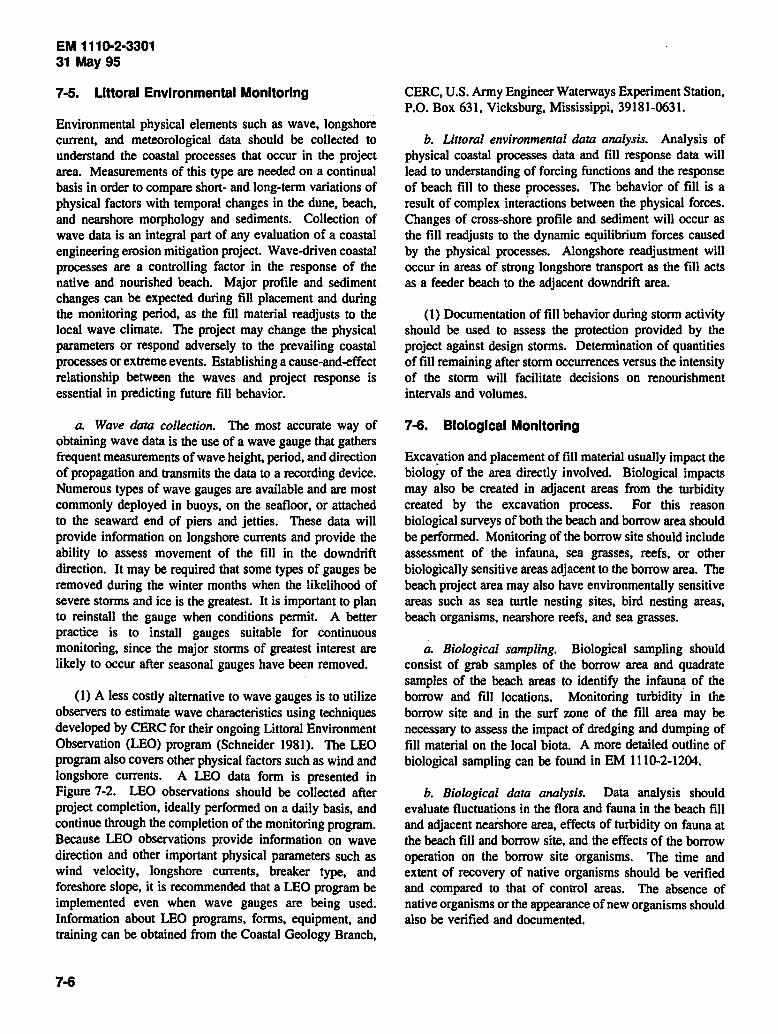
EM 1110-2·3301 31May95
7-5. Llttoral Envlronmental Monitoring
Environmental physical elements such as wave, longshore current, and meteorological data should be collected to understand the coastal processes that occur in the project area. Measurements of this type are needed on a continual basis in order to compare short- and long-term variations of physical factors with temporal changes in the dune, beach, and nearshore morphology and sediments. Collection of wave data is an integral part of any evaluation of a coastal engineering erosion mitigation project. Wave-driven coastal processes are a controlling factor in the response of the native and nourished beach. Major profile and sediment changes can be expected during fill placement and during the monitoring period, as the fill material readjusts to the local wave climate. The project may change the physical parameters or respond adversely to the prevailing coastal processes or extreme events. Establishing a cause-and-effect relationship between the waves and project response is essential in predicting future fill behavior.
a. Wave data collection. The most accurate way of obtaining wave data is the use of a wave gauge that gathers frequent measurements of wave height, period, and direction of propagation and transmits the data to a recording device. Numerous types of wave gauges are available and are most commonly deployed in buoys, on the seafloor, or attached to the seaward end of piers and jetties. These data will provide information on longshore currents and provide the ability to assess movement of the fill in the downdrift direction. It may be required that some types of gauges be removed during the winter months when the likelihood of severe storms and ice is the greatest. It is important to plan to reinstall the gauge when conditions permit. A better practice is to install gauges suitable for continuous monitoring, since the major storms of greatest interest are likely to occur after seasonal gauges have been removed.
(1) A less costly alternative to wave gauges is to utilize observers to estimate wave characteristics using techniques developed by CERC for their ongoing Littoral Environment Observation (LEO) program (Schneider 1981). The LEO program also covers other physical factors such as wind and longshore currents. A LEO data form is presented in Figure 7-2. LEO observations should be collected after project completion, ideally performed on a daily basis, and continue through the completion of the monitoring program. Because LEO observations provide information on wave direction and other important physical parameters such as wind velocity, longshore currents, breaker type, and foreshore slope, it is recommended that a LEO program be implemented even when wave gauges are being used. Information about LEO programs, forms, equipment, and training can be obtained from the Coastal Geology Branch,
7-6
CERC, U.S. Army Engineer Waterways Experiment Station, P.O. Box 631, Vicksburg, Mississippi, 39181-0631.
b. Littoral environmental data analysis. Analysis of physical coastal processes data and fill response data will lead to understanding of forcing functions and the response of beach fill to these processes. The behavior of fill is a result of complex interactions between the physical forces. Changes of cross-shore profile and sediment will occur as the fill readjusts to the dynamic equilibrium forces caused by the physical processes. Alongshore readjustment will occur in areas of strong longshore transport as the fill acts as a feeder beach to the adjacent downdrift area.
(1) Documentation of fill behavior during storm activity should be used to assess the protection provided by the project against design storms. Determination of quantities of fill remaining after storm occurrences versus the intensity of the storm will facilitate decisions on renourishment intervals and volumes.
7-6. Blologlcal Monitoring
Excav:ation and placement of fill material usually impact the biology of the area directly involved. Biological impacts may also be created in adjacent areas from the turbidity created by the excavation process. For this reason biological surveys of both the beach and borrow area should be performed. Monitoring of the borrow site should include assessment of the infauna, sea grasses, reefs, or other biologically sensitive areas adjacent to the borrow area. The beach project area may also have environmentally sensitive areas such as sea turtle nesting sites, bird nesting areas, beach organisms, nearshore reefs, and sea grasses.
a. Biological sampling. Biological sampling should consist of grab samples of the borrow area and quadrate samples of the beach areas to identify the infauna of the borrow and fill locations. Monitoring turbidity in the borrow site and in the surf zone of the fill area may be necessary to assess the impact of dredging and dumping of fill material on the local biota. A more detailed outline of biological sampling can be found in EM 1110-2-1204.
b. Biological data analysis. Data analysis should evaluate fluctuations in the flora and fauna in the beach fill and adjacent nearshore area, effects of turbidity on fauna at the beach fill and borrow site, and the effects of the borrow operation on the borrow site organisms. The time and extent of recovery of native organisms should be verified and compared to that of control areas. The absence of native organisms or the appearance of new organisms should also be verified and documented.
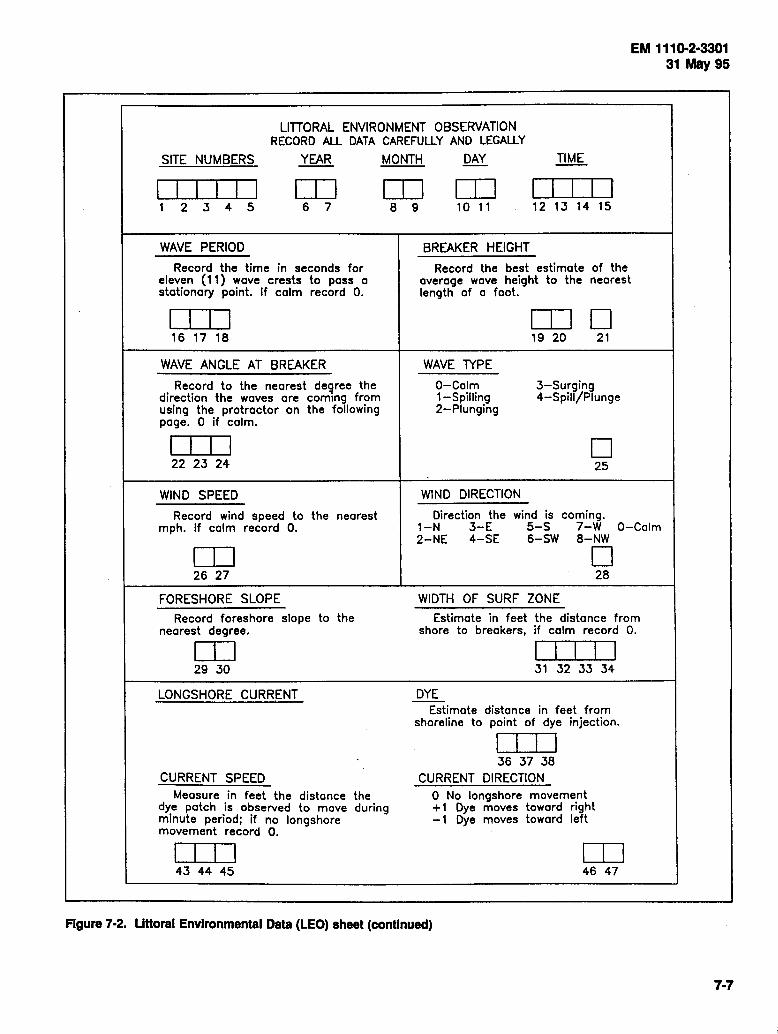
EM 1110-2·3301 31May95
LITTORAL ENVIRONMENT OBSERVATION RECORD ALL DATA CAREFULLY AND LEGALLY
SITE NUMBERS YEAR MONTH DAY TIME
I I I I I I I I I OJ OJ I I I I [ 1 2 3 4 5 6 7 8 9 10 11 12 13 14 15
WAVE PERIOD BREAKER HEIGHT
Record the time in seconds for Record the best estimate of the eleven (11) wave crests to pass a average wave height to the nearest stationary point. If calm record 0. length of a foot.
I I I I I I I D 16 17 18 19 20 21
WAVE ANGLE AT BREAKER WAVE lYPE
Record to the nearest deQree the 0-Colm 3-Surging direction the waves are coming from 1-Spilling 4-Spill/Plunge using the protractor on the following 2-Plunging page. 0 if calm.
I I I I D 22 23 24 25
WIND SPEED WIND DIRECTION
Record wind speed to the nearest Direction the wind is coming. mph. If calm record 0. 1-N 3-E 5-S 7-W 0-Calm
2-NE 4-SE 6-SW 8-NW
I I I D 26 27 28
FORESHORE SLOPE WIDTH OF SURF ZONE
Record foreshore slope to the Estimate in feet the distance from nearest degree. shore to breakers, if calm record 0.
I I I I I I I I 29 30 31 32 33 34
LONGSHORE CURRENT DYE --Estimate distance in feet from
shoreline to point of dye injection.
I I I I 36 37 38
CURRENT SPEED CURRENT DIRECTION Measure in feet the distance the 0 No longshore movement
dye patch is observed to move during + 1 Dye moves toward right minute period; if no longshore -1 Dye moves toward left movement record O.
I I I I rn 43 44 45 46 47
Rgure 7·2. Littoral Environmental Data (LEO} sheet (continued}
7.7

EM 1110-2·3301 31May95
RIP CURRENTS
If rip currents are present, indicate spacing (feet). If spacing is irregular estimate average spacing. If no rips record 0.
49 50 51 52
BEACH CUSPS
If cusps are present, indicate spacing (feet}. If spacing is irregular estimate average spacing. If no cusps record 0.
54 55 56
PLEASE PRINT:
SITE NAME
BEACH WIDTH
Measure the distance of the most seaward Beach Berm crest from a reference point to the nearest foot.
57 58 59 60
OBSERVER
Please Check The Form For Completeness
REMARKS:
OCEAN
t 90
0
OBSERVER
NOTE: If a pier is used for an observation platform: place 0-180 line on the roil parallel to the centerline of the pier, sight along the crest of the breaking waves and record the angle observed.
Figure 7·2. (Concluded)
7-8

Chapter 8 Operations and Maintenance (O&M) Manual
8·1. Purpose
Although there is not much to operate on a beach fill, there are sometimes auxiliary features that will require certaifl operations. Maintenance work and nourishment are generally needed as well as perfonnance and condition mon~toring during the economic life of the project to obtain the mtended purpose. The beach fill, with or without structures constructed for local shore protection and appurtenant visitor facilities, will be operated and maintained to obtain the anticipated benefits. The purpose of an O&M manual is to present detailed information to assist ~e responsible interest in operating and maintaining the project, and to describe the periodic nourishment and monitoring aspects of the project
8-2. Scope
The remainder of this chapter will present a possible outline for an O&M ·manual and briefly describe the contents of each section. A sample outline is illustrated in Appendix D. It should be modified to meet the needs of the individual project. The manual is divided into four parts. Part I presents general information about the project. Part II provides essential operation and maintenance information necessary to ensure the desired perfonnance of the project. Part III describes the periodic nourishment and monitoring of the project, while Part IV presents information concerning responsibilities of parties involved in the project.
8-3. Background
a. Authority. Cite the authority(s) which authorized the project construction.
b. Location. Describe the project location relati.ve to nearby urban centers, water bodies, or other geographic or demographic features. Give the north, east, south, and west project boundaries.
~· Brief description. Describe the major features of the P~Ject such as dune and bean heights, widths, and slopes. Give the volume of material placed, type and characteristics of any structures, and lengths, including transitions. Make reference to the appendix containing the as-built plans. Note the anticipated periodic nourishment volume and interval.
d. Protection provided. Discuss the protection provided
EM 1110-2·3301 31May95
by the project and, if practicable, identify the storm parameters, or combinations thereof, for which the project would limit inland damages to a minor and acceptable level.
e. Local cooperation. The local cooperation agreement (LCA) should be included in an appendix and referred to here. Identify the local sponsor and those represented by the sponsor if more than one entity is involved. State the cost-sharing arrangement for periodic nourishment and project monitoring and cite the technical document which supports the LCA and cost-sharing.
f. Construction history. Review the contracts used in constructing the project indicating the contractor, contract number, award and completion dates, and any significant events or circumstances encountered, and the volumes of materials involved.
8-4. Operation and Maintenance
This part of the O&M manual presents information on general duties and procedures to assist local interests with their responsibilities for operation and maintenance of the beach fill project (see ER 1110-2-2902).
a. Management. Establish the local person or persons that will be responsible for project administration, maintenance, and operational responsibilities as outlined in the O&M manual. Appointment recommendation and approval procedures should be stated.
b. Duties. Delineate the project management duties related to the project as outlined in ER 1110-2-2902. Some of these duties are briefly listed below:
(1) Maintain public ownership and use of the beach which formed the basis of Federal participation.
(2) Prevent unauthorized trespass or encroachment onto the project.
(3) Ensure alterations are approved by the District Engineer.
( 4) Ensure pedestrian and vehicular traffic are confined to designated access and use areas.
(5) Conduct periodic inspections, and operate and maintain the project as specified in this manual.
. c. ~eriodic inspections. Routine or emergency mspecttons should be provided for here. The size of the inspection team may vary from the person in charge up to a team of three or four depending on the scale and
8-1

EM 1110-2·3301 31. May 95
complexity of the project. Timing and number of routine inspections should be stated along with the features to be inspected, what information to record, and how and when it should be reported. A set of inspection forms should be developed to help ensure needed information is obtained. Inspection procedures to be followed before and after significant stonn events should also be included. Notification from the District or some other mechanism should be included to trigger pre-and post-storm action.
d. Reports. An inspection report is to be completed by the inspection team for each inspection to ensure that no part of the protection project is overlooked. Any item requiring repairs should be noted and satisfactory items should also be indicated. ·A completed and signed set of inspection forms, mentioned above, plus any pertinent photographs taken during the inspection will accompany and provide the basis for the report content. In the event that repairs have been made, either temporary or permanent, the nature and date of the repair are pertinent and should be included. The address to which the reports are to be submitted should be given along with the timing of the reports. All reports should indicate project deficiencies discovered during the inspection, and the scheduled remedial measures to correct the reported deficiencies.
e. Improvements or alterations. Drawings or prints of proposed improvements or alterations are to be submitted to the District Engineer sufficiently in advance of initiation of the proposed construction to ensure that the absence of his approval does not delay construction. As-built drawings will be furnished to the District Engineer and maintained with the original plans.
f. Project features. Chapter 2 and remaining chapters of this part of the O&M manual provide a detailed description of the feature and its operational and maintenance requirements. Chapters will typically cover such features as the dune, beach berm, groin(s), nearshore breakwater(s), revetment(s), seawall(s), and bulkhead(s).
8-5. Periodic Nourishment
This section of the O&M manual provides procedures for monitoring the condition of the beach fill portion of the stonn protection project, evaluating when nourishment will be required, and determining the volumes of nourishment needed. The project must be periodically nourished to ensure that the desired protection is provided throughout its life.
a. Scope. Refer to the design document and LCA to define periodic nourishment, its anticipated volume, and interval of placement Explain the concept of advanced
8-2
nourishment. Discuss the parameters and conditions that will trigger a nourishment event. Direct quotes from the design document provide credibility for the need to nourish the project. If "renourishment is triggered when, in effect, the project reaches its design configuration" is quoted from the design document, then those responsible need to understand that the design section is the minimum section required to provide the protection and not the maximum section desired or constructed. It should be emphasized that the profiles discussed are based on the configuration of the project beach that is expected once the beach has reached its "equilibrium" state. In most cases, this will be quite different from the configuration shown on the plans and specifications or that is constructed.
b. Monitoring. There are various components that need to be considered to understand the performance of a beach fill project and subsequent nourishment requirements. To assure that the project is providing at least the design level of protection, knowledge of the project conditions via project monitoring, as discussed previously, is imperative. Consequently, a monitoring program is designed as part of the periodic nourishment of the project. The monitoring program will be administered by the USACE Engineering Division.· Data collected during project monitoring will be used to assess the condition of the beach fill and to determine when to initiate a nourishment operation. See Chapter 7 and EM 1110-2-1004 for guidance on beach profile surveys, sediment samples, aerial photographs, wave data, etc. The application of these monitoring efforts to the project comprise the remaining topic items to be covered in this section of the O&M manual.
c. Nourishment. Moving material from the foreshore to the higher berm and/or dune area, or from an accreting area within the project limits is considered maintenance. Artificially adding new material to the beach fill project is considered nourishment. The need for nourishment is addressed by determining the protection provided by the existing beach fill project.
d. Routine monitoring analysis. The O&M manual will require routine inspection and survey of the beach fill project. Typical inspection forms are illustrated in Appendix D. These forms, as well as the inspections and surveys, should be tailored to meet the specific needs of the individual project. Routine analysis will compare existing profile shapes to a theoretical design equilibrium profile. This theoretical profile contains sufficient material to provide design level protection plus 1 year of advanced nourishment. If the comparison indicates that there is less than 1 year of advanced nourishment remaining in the profile, a beach profile erosion model is run to assess the remaining protection provided by the existing profile. The

focus here is on the volume remaining in the beach fill area represented by the profile. Based on the extent of the deficiency and the protection provided, a decision is made to initiate a project nourishment action.
e. Post-storm analysis. This analysis focuses on the protective features of the beach fill project located on the upper backshore portion of the beach consisting of the dune and/or the storm berm. Generally these features, once eroded, are not soon replaced by nature during post-storm beach recovery and therefore must be replaced by maintenance or nourishment of the project beach.
(1) Inspection and damage assessment will be conducted as soon as possibie after the passage of a significant storm. A joint district and local inspection team will assess the project area. Ground photography will be obtained at a minimum and, if warranted, aerial photography will be obtained to document the post-storm conditions. The inspection will assess the visible part of the project (i.e. dune/berm erosion, damaged fence, destroyed grass, etc.). Typical inspection forms are illustrated in Appendix D.
(2) If the extent of upper beach erosion is judged to have compromised the integrity of the project, more extensive data collection and analysis will be required. The District will immediately initiate beach profile surveys at the monument locations as described in the monitoring program. Due to the expediency required in reacting to a storm event causing damage to the project and/or upland development, the District should estabUsh and maintain an Indefinite Delivery Type Contract (IDTC) for post-storm surveying.
(3) Using the water level and wave height data from offshore gauges or other sources along with other physical data such as storm duration, wind speed and direction, the District will make an estimate of storm severity. This information will be provided to the local sponsor and appropriate District elements to document the amount of damages that the project prevented (reported in the "annual flood damages prevented" report). After collection and analysis of the survey data, a preliminary cost estimate of emergency maintenance and nourishment costs will be made by the District for local use and possible budgeting purposes.
f. Post-storm maintenance. Using the survey data, volume calculations will be made which will determine the quantity of sand required to restore the dune and/or berm to its design configuration. An assessment will be made as to the vulnerability of specific areas to additional damage during subsequent storms. An appropriate design of emergency maintenance will be performed. Survey data will be used to determine a source of sand within the project
EM 1110-2·3301 31May95
boundaries to be used for the repairs. Once the design is completed and a source of material identified, a construction cost estimate will be prepared. Construction will be undertaken by the local sponsor or they may contract with the District to prepare and manage the contract
g. Post-storm nourishment. If the above design and survey data indicate a need to obtain material from an outside source and the District and local sponsor determine the vulnerability analysis warrants such action, an out-ofcycle nourishment contracting procedure will be initiated and the proposed contract will be immediately advertised in the Commerce Business Daily (CBD). Design analysis will determine the required sand quantities and placement areas and the associated construction templates. Construction plans and specifications and cost estimates will be prepared, as well as related contract documents. Advertisement and award of the contract will be accomplished as soon as possible to allow as much flexibility as possible in scheduling the construction.
8-6. Responslbllltles
The following paragraphs define the roles and responsi·bilities of organizations and organizational elements for implementing the provisions of the O&M manual.
a. U.S. Army Corps of Engineers.
(1) The Programs and Project M1qtagement Division will be responsible for overall project management, coordination, budgeting, and programming activities within USACE. Coordination and initiation of project inspections and damage assessments will also be the responsibility of this office with assistance being provided by the engineering and construction divisions.
(2) The Engineering Division will be the design agent for construction contracts. This office will be responsible for continual monitoring and will maintain an IDTC for post-storm surveying for a quick response in the event of a significant coastal storm. Geotechnical analysis required for the identification of offshore borrow sources will be conducted as needed to ensure that an adequate supply of suitable beach fill material is available. The design, cost estimates, and preparation of construction contract documents for emergency maintenance or nourishment will be accomplished here.
(3) The Contracting Division is responsible for providing support to other elements concerning contracting-related issues, procedures, and the processing of contract documents.
8-3

EM 1110-2·3301 31May95
(4) The Construction Division will act as the construction agent for major maintenance (if an MOU with the locals exists) and nourishment contracts. Onsite control will be provided by an area office. This office will be responsible for management methods, procedures, policies, and interrelationships among the various local, state, and federal organizations associated with the various aspects of construction.
(5) The Planning Division is responsible for ensuring that all construction and related activities are in compliance with environmental policy, laws, and regulations. This office will also document the economic impacts of the project during coastal storms over the life of the project
b. Local sponsor. In accordance with the Local Cooperation Agreement, the local sponsor is responsible for the day-to-day operation and maintenance of the project as described in this O&M manual. The local sponsor will
8-4
represent and act in concert with various local and state agencies. Therefore, the local sponsor will act as the liaison between USACE and the other agencies involved with the project. Acting in cooperation with USACE, the local sponsor will closely monitor the project and during storms, will disseminate the appropriate directives according to the severity of the storm event. The local sponsor will also act as the main POC for coordinating and participating in poststorm inspections and damage assessments.
c. Financial. This section of the O&M manual describes the assignment of responsibility for the payment of cost as provided for in the LCA. Generally, cost for operation, maintenance, repair, and rehabilitation of all parts of the project are assigned to the local sponsor. Replacement of advanced nourishment or nourishment of the protective dune and/or berm is cost-shared by the Federal government in accordance with the LCA.

Appendix A Blbllography
Ahrens 1977 Ahrens, J. 1977. "Prediction of Irregular Wave Overtopping," Coastal Engineering Technical Aid No. 77-7, Coastal Engineering Research Center, U.S. Army Engineer Waterways Experiment Station, Vicksburg, MS.
Anders and Hansen 1990 Anders, F. J., and Hansen, M. 1990. "Beach and Borrow Site Sediment Investigation for a Beach Nourishment at Ocean City, Maryland," Technical Report CERC-90-5, U.S. Army Engineer Watetways Experiment Station, Vicksburg, MS.
Anders, Reed, and Meisburger 1990 Anders, F. J., Reed, D. W., and Meisburger, E. P. 1990. "Shoreline Movements; Report 2, Tybee Island, Georgia, to Cape Fear, North Carolina, 1851-1983," Technical Report CERC-83-1, U.S. Army Engineer Waterways Experiment Station, Vicksburg, MS.
Anders, Underwood, and Kimball 1987 Anders, F. J., Underwood, S. G., and Kimball, S. M. 1987. "Beach and Nearshore Sediment Sampling on a Developed Barrier, Fenwick Island, Maryland," Proceedings of Coastal Sediments '87, American Society of Civil Engineers, 1732-1744.
Bakker 1968 Bakker, W. T. 1968. "The Dynamics of a Coast with a Groin System," Proceedings of the 11th Coastal Engineering Conference, American Society of Civil Engineers, 492-517.
Battjes 1974 Battjes, J. A. 1974. "A Computation of Setup, Longshore Currents, Run-up and Overtopping Due to Wind-Generated Waves," Ph.D. Diss., Delft University of Technology, The Netherlands.
Birkemeier 1985 Birkemeier, W. A. 1985. "Field Data on Seaward Limit of Profile Change," Journal of Waterway, Port, Coastal and Ocean Engineering 111(3), 598-602.
Birkemeier, Kraus, Scbeffner, and Knowles 1987 Birkemeier, W. A., Kraus, N. C., Scheffner, N. W., and Knowles, S. C. 1987. "Feasibility Study of Quantitative Erosion Model for Use by Federal Emergency Management Agency in the Prediction of Coastal Flooding," Technical
EM 1110-2·3301 31May95
Report CERC-87-8, U.S. Army Engineer Waterways Experiment Station, Vicksburg, MS.
Dodge and Rosen 1988 Bodge, K. R., and Rosen, D. S. 1988. "Offshore Sand Sources for Beach Nourishment in Florida; Part I: Atlantic Coast," Beach Preservation Technology '88 Proceedings, Gainesville, FL, 175-190.
Bruun 1954 Bruun, P. 1954. "Coast Erosion and the Development of Beach Profiles," Journal Memorandum No. 44, U.S. Army Corps of Engineers, Beach Erosion Board, Washington, DC.
Bruun 1962 Bruun, P. 1962. "Sea-level Rise as a Cause of Shore Erosion," Journal of Waterways and Harbor Division, American Society of Civil Engineers, 88{WWI), 117-130.
Chasten, Rosati, McCormick, and Seabergb 1993 Chasten, M. A., Rosati, J. D., McCormick, J. W., and Seabergh, W. C. 1993. "Engineering Design Guidance for Detached Breakwaters as Shoreline Stabilization Structures," Tec~nical Report CERC-93-19, U.S. Army Engineer Waterways Experiment Station, Vicksburg, MS.
Cialone 1991 Cialone, M. A. 1991. "Coastal Modeling System (CMS) User's Manual," Instruction Report CERC-91-1, U.S. Army Engineer Waterways Experiment Station, Vicksburg, MS.
Dally and Pope 1986 Dally, W. R., and Pope, J. 1986. "Detached Breakwaters for Shore Protection," Technical Report CERC-86-1, U.S. Army Engineer Waterways Experiment Station, Vicksburg, MS.
Dean 1974a Dean, R. G. 1974a. ''Presentation of Research Results; Vol II, Evaluation and Development of Water Wave Theories for Engineering Application," Special Report 1, U.S. Army Engineer Waterways Experiment Station, Vicksburg, MS.
Dean 1974b Dean, R. G. 1974b. "Compatibility of Borrow Material for Beach Fills," Proceedings, 14th International Conference on Coastal Engineering, American Society of Civil Engineers, 1319-1333.
Dean 1976 Dean, R. G. 1976. "Beach Erosion: Causes, Processes, and Remedial Measures," CRC Reviews in Environmental Control, CRC Press, Inc., Boca Raton, FL, 6(3), 259-296.
A·1

EM 1110-2·3301 31May95
Dean 1977 Dean, R. G. 1977. "Equilibrium Beach Profiles: U.S. Atlantic and Gulf Coasts," Ocean Engineering Technical Report No. 12, Department of Civil Engineering, University of Delaware, Newark, DE.
Dean 1987 Dean, R. G. 1987. "Coastal Sediment Processes: Toward Engineering Solutions," Proceedings, Specialty Conference on Coastal Sediments '87, American Society of Civil Engineers, 1-24.
Dean 1991 Dean, R. G. 1991. "Equilibrium Beach Profiles: Characteristics and Applications," Journal Coastal Research 7, 53-84.
Dean and Yoo 1992 Dean, R. G., and Yoo, C. 1992. "Beach-Nourishment Perfonnance Predictions," Journal of Waterway, Port, Coastal, and Ocean Engineering 118(6), 567-586.
Dean and Yoo 1993 Dean, R. G., and Yoo, C. 1993. "Predictability of Beach Nourishment Performance," Beach Nourishment Engineering and Management Considerations, Donald K. Stauble and Nicholas C. Kraus, editors, American Society of Civil Engineers, 86-102.
Delft Hydraulics Laboratory 1986 Delft Hydraulics Laboratory. 1986. Manual On Artificial Beach Nourishment. Centre for Civil Engineering Research, Codes and Specifications, Rijkwaterstaat Delft Hydraulics, 184.
Douglass 1984 Douglass, S. L. 1984. "Irregular Wave Overtopping Rates," Proceedings of the 19th Coastal Engineering Conference, Houston, TX, 316-327.
Douglass and Weggel 1987 Douglass, S. L., and Weggel, J. R. 1987. "Performance of a Perched Beach - Slaughter Beach, Delaware," Proceedings of Coastal Sediments '87, American Society of Civil Engineers, Specialty Conference, New Orleans, LA.
Edelman 1968 Edelman, T. 1968. "Dune Erosion During Storm Conditions," Proceedings of the 11th Coastal Engineering Conference, American Society of Civil Engineers, 1305-1404.
Edelman 1972 Edelman, T. 1972. "Dune Erosion During Storm
A·2
Conditions," Proceedings of the 13th Coastal Engineering Conference, American Society of Civil Engineers, 719-722.
Everts 1973 Everts, C. H. 1973. "Beach Profile Changes in Western Long Island," in "Coastal Geomorphology," Proceedings of the 3rd Annual Geomorphology Symposia Series, 279-301.
Everts 1978 Everts, C. H. 1978. "Geometry of Profiles Across Inner Continental Shelves of the Atlantic and Gulf Coasts of the United States," Technical Paper No. 78-4, Coastal Engineering Research Center, U.S. Army Engineer Waterways Experiment Station, Vicksburg, MS.
Everts, Hattley, and Gibson 1983 Everts, C. H., Battley, J. P., Jr., and Gibson, P. N. 1983. "Shoreline Movements; Report 1: Cape Henry, Virginia to Cape Hatteras, North Carolina, 1949-1980," CERC-83-1, U.S. Army Engineer Waterways Experiment Station, Vicksburg, MS.
Field and Duane 1974 Field, M. E., and Duane, D. B. 1974. "Geomorphology and . Sediments of the Inner Continental Shelf, Cape Canaveral, Florida," CERC Technical Memorandum No. 42, U.S. Army Engineer Waterways Experiment Station, Vicksburg, MS.
Fowler and Smith 1987 Fowler, J.E., and Smith, E. R. 1987. "Movable-Bed Sand Model," Proceedings of Coastal Sediments '87, New Orleans, LA, 166-174.
Fulford and Grosskopf 1988 Fulford, E. T., and Grosskopf, W. G. 1988. "Storm Protection Project Design - Ocean City, Maryland," Proceedings of Beach Preservation Technology '89, Tampa, FL, 239-248.
Galvin 1972 Galvin, C. J. 1972. "A Gross Longshore Transport Rate Formula," Proceedings of the 13th Coastal Engineering Conference, Vancouver, B.C., Canada.
Goda 1970 Goda, Y. 1970. "A Synthesis of Breaker Indices," Proceedings of the Japan Society of Civil Engineers, No. 180.
Gorecki 1985 Gorecki, R. I. 1985. "Evalµation of Presque Isle Offshore Breakwaters for Beach Stabilization," Proceedings of

42nd Annual Meeting of the Coastal Engineering Research Board, Chicago, IL, 83-126.
Gravens and Kraus 1989 Gravens, M. B., and Kraus, N. C. 1989. ''Representation of the Groin Boundary Condition in Numerical Shoreline Change Models," Proceedings XX/II Congress, JAHR, C515-C522.
Grosskopf and Behnke 1993 Grosskopf, W. G., and Behnke, D. 1993. "An Emergency Remedial Beach Fill Design for Ocean City, Maryland," Shore and Beach 61(1), 8-12.
Hallermeier 1977 Hallermeier, R. J. 1977. "Calculating a Yearly Limit Depth to the Active Beach Profile," Technical Paper CERC-77-9, U.S. Army Engineer Waterways Experiment Station, Vicksburg, MS.
Hallermeier 1978 Hallermeier, R. J. 1978. "Uses for Calculated Limit Depth to Beach Erosion," Proceedings of 16th Conference on Coastal Engineering, American Society of Civil Engineers, 1493-1512.
Hallermeier 1981 Hallermeier, R. J. 1981. "Seaward Limit of Significant Sand Transport by Waves: An Annual Zonation for Seasonal Profiles," Coastal Engineering Technical Aid No. 81-2, U.S. Army Engineer Waterways Experiment Station, Vicksburg, MS.
Hansen and Scheffner 1990 Hansen, M., and Scheffner, N. 1990. "Coastal Engineering Studies in Support of Virginia Beach, Virginia, Beach Erosion Control and Hurricane Protection; Report 3, Evaluation and Design of Beach Fill," Technical Report CERC-88-1, U.S. Army Engineer Waterways Experiment Station, Vicksburg, MS.
Hanson 1987 Hanson, H. 1987. "GENESIS, a Generalized Shoreline Change Model for Engineering Use," Report No. 1007, Department of Water Resources Engineering, University of Lund, Sweden, 206 pp.
Hanson and Kraus 1986 Hanson, H., and Kraus, N. C. 1986. "Forecast of Shoreline Change Behind Multiple Coastal Structures," Coastal Engineering in Japan 29, 195-213.
Hanson and Kraus 1989 Hanson, H., and Kraus, N. C. 1989. "GENESIS:
EM 1110-2·3301 31May95
Generalized Model for Simulating Shoreline Change; Report 1, Technical Reference," Technical Report CERC-89-19, U.S. Army Engineer Waterways Experiment Station, Vicksburg, MS.
Hanson and Kraus 1993 Hanson, H., and Kraus, N. C. 1993. "Optimization of Beach Fill Transitions," Beach Nourishment Engineering and Management Considerations, Donald K. Stauble and Nicholas C. Kraus, editors, American Society of Civil Engineers, 103-117.
Harris 1981 Harris, D. L. 1981. "Tides and Tidal Datums in the United States," Special Report No. 7, Coastal Engineering Research Center, U.S. Army Engineer Waterways Experiment Station, Vicksburg, MS.
Hayes 1980 Hayes, M. 0. 1980. "General Morphology and Sediment Patterns in Tidal Inlets,'' Sedimentary Geology 26, 139-156.
Hobson 1977 Hobson, R. D. 1977. ''Review of Design Elements for Beach-Fill Evaluation," Technical Paper 77-6, Coastal Engineering Research Center, U.S. Army Engineer Waterways Experiment Station, Vicksburg, MS.
Holman 1986 Holman, R. A. 1986. "Extreme Value Statistics for Wave Runup on a Natural Beach," Coastal Engineering 9(6), 527-544.
Hudson 1979 Hudson, R. Y. 1979. "Coastal Hydraulic Models," Special Report No. 5, Coastal Engineering Research Center, U.S. Army Engineer Waterways Experiment Station, Vicksburg, MS.
Hughes and Chiu 1981 Hughes, S. A., and Chiu, T. Y. 1981. "Beach and Dune Erosion During Severe Storms," TR-043, Coastal and Oceanographic Engineering Department, University of Florida.
James 1974 James, J. R. 1974. "Borrow Material Texture and Beach Fill Stability," Proceedings, 14th International Conference on Coastal Engineering, American Society of Civil Engineers, 1334-1344.
James 1975 James, J. R. 1975. "Techniques in Evaluating Suitability of Borrow Material for Beach Nourishment," Technical
A·3
EM 1110-2·3301 31May95
Memorandum No. 60, Coastal Engineering Research Center, U.S. Army Engineer Waterways Experiment Station, Vicksburg, MS.
Jarret 1994 Jarret, T. 1994. Personal Communication, U.S. Army Engineer District, Wilmington, NC.
Knutson 1977 Knutson, P. L. 1977. "Planting Guidelines for Dune Creation and Stabilization," CETA 77-4, U.S. Army Engineer Waterways Experiment Station, Vicksburg, MS.
Kraus 1983 Kraus, N. C. 1983. "Applications of Shoreline Prediction Model," Proceedings, Coastal Structures '83, American Society of Civil Engineers, 632-645.
Kraus 1989 Kraus, N. C. 1989. "Beach Change Modeling and the Coastal Planning Process," Proceedings, Coastal Zone '89, American Society of Civil Engineers, 553-567.
Kraus, Hanson, and Harikai 1984 Kraus, N. C., Hanson, H., and Harikai, S. 1984. "Shoreline Change at Oarai Beach, Japan: Past, Present and Future," Proceedings of the 19th Engineering Conference, American Society of Civil Engineers, 2107-2123.
Kraus and Harikai 1983 Kraus, N. C., and Harikai, S. 1983. "Numerical Model of Shoreline Change at Oarai Beach," Coastal Engineering 7(1), 1-28.
Kriebel 1982 Kriebel, D. 1982. "Beach and Dune Response to Hurricanes," unpublished M.S. thesis, Department of Civil Engineering, University of Delaware, Newark, DE.
Kriebel and Dean 1985 Kriebel, D., and Dean, R. G. 1985. "Numerical Simulation of Time-Dependent Beach and Dune Erosion," Coascal Engineering 9, 221-245.
Krumbein 1957 Krumbein, W. C. 1957. "A Method for Specification of Sand for Beach Fills," Technical Memorandum 102, U.S. Army Corps of Engineers, Beach Erosion Board, Washington, DC.
Krumbein and James 1965 Krumbein, W. C., and James, W.R. 1965. "Spacial and Temporal Variations in Geometric and Material Properties of a Natural Beach," Technical Report No. 44, Coastal
A-4
Engineering Research Center, U.S. Army Engineer Waterways Experiment Station, Vicksburg, MS.
Larson 1988 Larson, M. 1988. "Quantification of Beach Profile Change," Report No. 1008, Department of Water Resources Engineering, University of Lund, Sweden.
Larson and Kraus 1989 Larson, M., and Kraus, N. C. 1989. "SBEACH: Numerical Model for Simulating Storm-Induced Beach Change; Report 1, Empirical Foundation and Model Development," Technical Report CERC-89-9, U.S. Army Engineer Waterways Experiment Station, Vicksburg, MS.
Leenknecht, Szulwalski, Sherlock, and George 1990 Leenknecht, D. A., Szulwalski, A. Z., Sherlock, A. R., and George, M. E. 1990. "Automated Coastal Engineering System: Technical Reference (Version 1.07)," Coastal Engineering Research Center, U.S. Army Engineer Waterways Experiment Station, Vicksburg, MS.
Leonard, Pilkey, and Clayton 1988 Leonard, L. A, Pilkey, 0. H., and Clayton, T. D. 1988. "An Assessment of Beach Replenishment Parameters," Proceedings of Beach Preservation Technology '88, Gainesville, FL, 115-122
Lillycrop, Pope, and Abel 1988 Lillycrop, W. J., Pope, J., and Abel, C. E. 1988. "Coastal Engineering Studi~ in Support of Virginia Beach, Virginia, Beach Erosion Control and Hurricane Protection Project; Report 2, Seawall Overtopping Evaluation," Technical Report CERC-88-1, U.S. Army Engineer Waterways Experiment Station, Vicksburg, MS.
Meisburger 199() Meisburger, E. P. 1990. "Exploration and Sampling Techniques for Borrow Areas," Technical Report CERC-90-18, U.S. Army Engineer Waterways Experiment Station, Vicksburg, MS.
Meisburger and Duane 1971 Meisburger, E. P., and Duane, D. B. 1971. "Geomorphology and Sediments of the Inner Continental Shelf, Palm Beach to Cape Kennedy, Florida," Technical Memorandum No. 34, Coastal Engineering Research Center, U.S. Army Engineer Waterways Experiment Station, Vicksburg, MS.
Meisburger and Field 1975 Meisburger, E. P., and Field, M. E. 1975. "Geomorphology, Shallow Structure, and Sediments of the Florida Inner Continental Shelf, Cape Canaveral to

Georgia," Technical Memorandum No. 54, Coastal Engineering Research Center, U.S. Army Engineer Waterways Experiment Station, Vicksburg, MS.
Moore 1982 Moore, B. 1982. "Beach Profile Evolution in Response to Changes in Water Level and Wave Height," M.S. thesis, Department of Civil Engineering, University of Delaware, Newark.
Nakashima, Pope, Mossa, and Dean 1987 Nakashima, L. D., Pope, J., Mossa, J., and Dean, J. L. 1987. "Initial Response of a Segmented Breakwater System, Holly Beach, Louisiana," Proceedings, Coastal Sediments '87, N. C. Kraus, editor, American Society of Civil Engineers, 1399-1414.
Oertel, Fowler, and Pope 1985 Oertel, G. F., Fowler, J.E., and Pope, J. 1985. "History of Erosion and Erosion Control Efforts at Tybee Island, Georgia," Miscellaneous Paper CERC-85-1, U.S. Army Engineer Waterways Experiment Station, Vicksburg, MS.
Owen 1980 Owen, M. W. 1980. "Design of Seawalls Allowing for Wave Overtopping," Report No. Ex 924, Hydraulics Research Station, Wallingford, England.
Parson 1992 Parson, L. E. 1992. "An Example of Coarse Grained Beach Nourishment: St Joseph, Michigan - Preliminary Results," Proceedings of the 5th Annual National Conference on Beach Preservation Technology, St. Petersburg, FL, 135-150.
Perlin and Dean 1978 Perlin, M., and Dean, R. G. 1978. "Prediction of Beach Planforms with Littoral Controls," Proceedings of the 16th Coastal Engineering Conference, American Society of Civil Engineers, 1818-1838.
Pope and Dean 1986 Pope, J., and Dean, J. L. 1986. "Development of Design Criteria for Segmented Breakwaters," Proceedings of the 20th Coastal Engineering Conference, American Society of Civil Engineers, 2144-2158.
Prins 1980 Prins, D. A. 1980. "Data Collection Methods for Sand Inventory-Type Surveys," Coastal Engineering Technical Aid No. 80-4, Coastal Engineering Research Center, U.S. Army Engineer Waterways Experiment Station, Vicksburg, MS.
Resio 1987
EM 1110-2·3301 31May95
Resio, D. T. 1987. "Extreme Runup Statistics on Natural Beaches," Miscellaneous Paper CERC-87-11, U.S. Army Engineer Waterways Experiment Station, Vicksburg, MS.
Savage and Woodhouse 1969 Savage, R. P., and Woodhouse, W.W., Jr. 1969. "Creation and Stabilization of Coastal Barrier Dunes," Proceedings of the 11th Conference on Coastal Engineering, American Society of Civil Engineers, 671-700.
SchefTner 1988 Scheffner, N. W. 1988. "Stable Three-Dimensional Biperiodic Waves in Shallow Water," Technical Report CERC-88-4, U.S. Army Engineer Waterways Experiment Station, Vicksburg, MS.
SchefTner 1989 Scheffner, N. W. 1989. "Dune Erosion-Frequency of Storm Occurrence Relationships," Proceedings, Coastal Zone '89, American Society of Civil Engineers, 595-606.
Schneider 1981 Schneider, C. 1981. "The Littoral Environment Observation (LEO) Data Collection Program," Technical Memorandum CERC-81-5, U.S. Army Engineer Waterways Experiment Station, Vicksburg, MS.
Schwartz and Musialowski 1980 Schwartz, R. K., and Musialowski, F. R. 1980. "Transport of Dredged Sediment Placed in the Nearshore Zone -Currituck Sand-Bypass Study (Phase I)," Technical Paper 80-1, Coastal Engineering Research Center, U.S. Army Engineer Waterways Experiment Station, Vicksburg, MS.
Shore Protection Manual 1984 Shore Protection Manual. 1984. 4th ed., 2 Vols, Coastal Engineering Research Center, U.S. Army Engineer Waterways Experiment Station, U.S. Government Printing Office, Washington, DC.
Smith and Jackson 1990 Smith, A. W., and Jackson, L. A. 1990. ''The Siting of Beach Nourishment Placements," Journal of the American Shore and Beach Preservation Association, 58(1), 17-24.
Stauble 1988 Stauble, D. K. 1988. "Beach Nourishment Monitoring, a Necessity to Project Design," Proceedings of the 1988 National Conference on Beach Preservation Technology, Gainesville, FL.
A·5

EM 1110-2·3301 31May95
Stauble (in preparation) Stauble, D. K. "A Physical Monitoring Plan for Northern Assateague Island, Maryland," in preparation, Coastal Engineering Research Center, U.S. Anny Engineer Waterways Experiment Station, Vicksburg, MS.
Stauble and Grosskopf 1993 Stauble, D. K., and Grosskopf, W. G. 1993. "Monitoring Project Response to Storm: Ocean City, Maryland Beach Fill," Shore and Beach 61(1), 23-33.
Stauble and Hoel 1986 Stauble, D. K., and Hoel J. 1986. "Physical and Biological Guidelines for Beach Restoration Projects; Part II, Guidelines for Beach Nourishment and Inlet Sand Bypass Projects, the Need for Guidelines, the Monitoring System," Sea Grant Extension Program, University of Florida, Gainesville, FL.
Stauble and Nelson 1984 Stauble, D. K., and Nelson, W. G. 1984. "Beach Restoration Guidelines: Prescription for Project Success," The New Threat to Beach Preservation. L. Tate, ed., Florida Shore and Beach Preservation Society; Tallahassee, FL, 137-155.
Stauble, Garcia, and Kraus 1993 Stauble, D. K., Garcia, A. W., and Kraus, N. C. 1993. "Beach Nourishment Project Response and Design Evaluation: Ocean City, Maryland," Technical Report CERC-93-13, U.S. Anny Engineer Waterways Experiment Station, Vicksburg, MS.
Stauble, Hansen, and Blake 1984 Stauble, D. K., Hansen, M., and Blake, W. 1984. "An Assessment of Beach· Nourishment Sediment Characteristics," Proceedings of the 19th Coastal Engineering Conference, American Society of Civil Engineers, Houston, TX, 1471-1487.
Stauble, Nelson, Hansen, Parson, and Gozelany 1982 Stauble, D. K., Nelson, W., Hansen, M. E., Parson, L. 'E., and Gozelany, J. 1982. "Biological and Physical Monitoring of the Indialantic/Melbourne Beach Nourishment Project," Technical Report, U.S. Anny Corps of Engineers District, Jacksonville, FL.
Ulrich 1993 Ulrich, C. P. 1993. "Selecting the Optimum Dune
A·6
Height for Panama City Beaches, Florida," Beach Nourishment Engineering and Management Considerations. Donald K. Stauble and Nicholas C. Kraus, eds., American Society of Civil Engineers, 148-161.
USACE 1991 USACE. 1991. "National Economic Development Procedures Manual - Coastal Storm Damage and Erosion," IWR Report No. 91-R-6, Water Resources Support Center, Institute for Water Resources, U.S. Anny Corps of Engineers, Springfield, VA.
Vellinga 1983 Vellinga, P. 1983. "Predictive Computational Model for Beach and Dune Erosion During Storm Surge," Publication 294, Waterloopkkundig Laboratorium, Delft, The Netherlands.
Vemulakonda, Scheffner, Earickson, and Chou 1988 Vemulakonda, S. R., Scheffner, N. W., Earickson,J. A., and Chou, L. W. 1988. "Kings Bay Coastal Processes Numerical Model," Technical Report CERC-88-3, U.S. Anny Engineer Waterways Experiment Station, Vicksburg, MS. ·
Weggel 1976 Weggel, J. R. 1976. "Wave Overtopping Equation," Proceedings of the 15th Coastal Engineering Conference, American Society of Civil Engineers, 2737-2755.
Weggel and Sorensen 1991 Weggel, J. R., and Sorensen, R. M. 1991. "Performance of the 1986 Atlantic City, New Jersey, Beach Nourishment Project," Shore and Beach 59(3), 29-36.
Williams and Meisburger 1987 Williams, S. J., and Meisburger, E. P. 1987. "Sand Sources for the Transgressive Barrier Coast of Long Island, New York: Evidence for Landward Transport of Shelf Sediment," Proceedings of Coastal Sediments 87, American Society of Civil Engineers, Vol. II, 1517-1532.
Woodhouse 1978 Woodhouse, W.W. 1978. "Dune Building and Stabilization with Vegetation," SR-3, Coastal Engineering Research Center, U.S. Army Engineer Waterways Experiment Station, Vicksburg, MS.

Appendix B Notation
Symbol
A
ab
AF
AN
B
D
D
d/
exp
g
g
h
H
H
Hb
H.
L,
l,
m
~
M"
Q.
Cc 011
o, Oor Ott
Definition
Scale parameter which depends mainly on sediment characteristics
Angle between breaker crest and shoreline
Value of the A parameter for the fill material
Value of the A parameter for the native sediments (from the equilibrium profile equation)
Desired berm height
Mean sediment diameter
Sediment grain size
Annual depth of closure (m) below mean low water
Base of natural logarithms (2.718)
Wave steepness
Acceleration due to gravity
Water depth at distance x from the shoreline
Primary contour interval
Depth of closure
Breaker height
Non-breaking significant wave height (m) that is exceeding 12 hr/year (0.137 % of the time)
Length of fill placement
Length of shoreline reach
Beach slope
Mean sediment diameter for borrow material
Mean sediment diameter for native material
Quantity from advanced nourishment
Quantity from construction template
Gross longshore transport rate
Material moving to the left
Quantity from overfill adjustment
Material moving to the right
EM 1110-2·3301 31 May 95
Units
m113
deg
m
mm
mm
m
miser!
m
m
m
m
m
m
mm
mm
m3/m
m3/m
m3/yr
m3/yr
m3/m
m3/yr
(Continued)
B-1

EM 1110-2·3301 31May95
Symbol
v
v
w
x y
•
8·2
Definition
Overfill ratio
Renourishment factor
Area enclosed by upper and lower primary contours
Area enclosed by midlevel contour
Associated wave period
Time interval between renourishment
Longshore velocity
Volume of fill required to increase berm width
Total of placed fill material
Sediment fall velocity
Distance from shore
Desired distance of seaward translation
Sediment diameter
Standard deviation or measure of sorting for borrow material
Standard deviation or measure of sorting for native .material
Winnowing function
Units
m2
m2
sec
sec
m/sec2
m3/m
m3
cm/sec
m
m

Appendix C Glossary
Accretion Natural or artificial buildup of land by the deposition of sediments.
Aeolian Transport Sediments which have been transported by winds.
Advanced Nourishment Placement of an additional amount of beach fill to offset the expected losses from the time of completion of the project to the first scheduled nourishment event.
Back Barrier Pertaining to the lagoon complex in the lee of a coastal barrier island, barrier spit, or baymouth barrier.
Backshore Zone of the shore lying between the foreshore and coastline comprising the berm or berms acted upon by waves only during severe storms.
Bar A submerged or emerged embankment of sand, gravel, or other unconsolidated material built on the seafloor by waves and currents.
Bar Crest Point of highest elevation associated with a bar system.
Bar Trough Point of lowest landward elevation associated with a bar system.
Barrier Island An elongated island running parallel to the mainland coast separated from the mainland by a lagoon or bay.
Bathymetry Measurement of water depth in oceans, seas, rivers, and lakes.
Baymouth Barrier A barrier structure extending partially or entirely across the mouth of a bay.
Beach Zone of unconsolidated material that extends landward from the low waterline to the place where there is marked change in the material or physiographic form or to the line of permanent vegetation.
Beach Fill
EM 1110-2·3301 31May95
Material placed on a beach to renourish eroding shores.
Beach Nourishment Process of replenishing a beach with material (usually sand) obtained from another location.
Beach Profile Intersection of the ground surface with a vertical plane.
Beach Renourishment Process of replenishing a beach. It may be brought about by natural longshore transport or artificially by the deposition of borrowed material.
Beach Slope Degree of inclination of the beach to the horizontal. Usually expressed as a ratio, such as 1:25 or 1 on 25, indicating 1 unit of vertical rise in 25 units of horizontal distance. Also expressed in a decimal fraction (0.04), degrees (2°18'), and percent (4%).
Berm Nearly horizontal part of the beach or backshore formed by the deposit of materials by wave action. Some beaches have no berms and others have one or more.
Berm crest Seaward limit of the berm.
Biogenic Sediment Of biological origin. Usually sediments composed of the hard parts of plants or animals and organic reef masses.
Borrow Material Material used for-placement of artificial beach nourishment.
Bulkhead A structure or partition to retain or prevent sliding of the land. A secondary purpose is to protect the upland against damage from wave action.
Calcareous Algae A calcium carbonate-producing marine algae that contributes to the sediment supply, usually in tropical environments.
Composite Grain Size Distribution of grain sizes determined using a group of sediment samples. For example, a composite grain size distribution can be determined for an entire beach profile location by combining all samples taken on that profile. Samples are usually done mathematically after a grain size analysis has been performed for each sediment sample.
C-1

EM 1110-2·3301 31May95
Construction Prorate The resulting fill profile shape at the time of fill placement
Construction Template Template defining the shape of the fill profile at the time of fill placement
Cross-Shore Transport Movement of beach material perpendicular to the shore by waves and currents.
Cusp A low mound of beach material, often in series, separated by crescent-shaped troughs spaced more or less at regular intervals along the beach face.
Deposition Addition and buildup of sediment by the action of natural forces.
Depth or Closure Depth beyond which sediments are normally affected by waves.
Depth or Effective Motion The offshore limit of beach profile adjustment for a specific time scale of interest.
Design Template The shape that fill material is expected to achieve after being worked by waves over the first few months to a year after fill placement The design profile may be based on the pre-fill profile shape if the fill material is similar to the original native beach material.
Detached Breakwater A structure detached from the shore constructed to protect a shore area, harbor, anchorage, or basin from waves.
Downdrift Direction in which littoral d.I:ift is moving.
Dune Hill or mound of windblown material, usually sand.
Dune Base The toe of the dune on the seaward side.
Dune Crest Highest elevation associated with a dune system.
Echinoids A class of free-moving echinoderms, mostly with rigidly plated bodies.
C-2
Equilibrium Prorate Response of a beach to long-term or extreme wave conditions governed primarily by sediment size characteristics. ·
Erosion Removal of sediment by the action of natural forces.
Esker Long narrow ridges of coarse sand and gravel produced by glacier processes usually extending in a sinuous course, roughly parallel with the direction of glacier movement.
Estuary A widened tidal mouth at a river valley where fresh water comes into contact with seawater, resulting in mixing and a complex biological and chemical environment.
Eustatic Sea Level Change Change in the relative volume of the world's ocean basins and the total amount of ocean water. It must be measured by recording the movement in sea surface elevation relative to a stable, undeformed, universally adopted reference frame. ·
Fall Velocity Speed at which an object falls through a fluid media governed by the object's effective diameter and fluid viscosity.
Feeder Beach An artificially widened beach serving to nourish downdrift beaches by natural littoral currents or forces.
Fetch Areas in which seas are generated by the wind having a fairly constant direction and speed.
Fillet Accumulation of sediment, at a littoral barrier such as a jetty.
Flu vial Pertaining to streams; e.g., fluvial sediments.
Foraminifera Protozoans characterized by tests of one to many chambers composed of calcite or of agglutinated particles.
Foredune Front dune immediately behind the backshore.
Foreshore Area that is ordinarily traversed by the uprush and backwash of waves as the tides rise and fall.

Groin Shore protection structure usually built perpendicular to the shoreline to trap littoral drift or reduce erosion of the shore.
Headland High, steep-faced promontory extending into the sea or lake.
High-Tide Mark Limit of wave uprush as it exists at the time samples are taken, many times marked by a line of debris running parallel to shore indicating the maximum elevation reached by each rising tide.
Hind casting Use of historic synoptic wind data to calculate characteristics of waves that probably occurred in the past.
Inlet A connecting passage between two bodies of water.
Intersecting Prome Based on the equilibrium profile approach, the profile after nourishment intersects the native profile landward of the depth of closure. Dependent upon inequalities between. the fill and native beach sediments.
Intertidal Between high and low tide.
Isopach Map Contour map showing the thickness of a deposit between two physical or arbitrary boundaries.
Jetty A shore-perpendicular structure built to stabilize an inlet and . prevent the inlet channel from filling with sediment
Lagoon Open water between a coastal barrier and the mainland.
Leeward Direction toward which wind is blowing or direction toward which waves are traveling.
Littoral Drift Movement of sediment alongshore. Also, the material being moved alongshore.
Littoral Transport Movement of littoral drift in the littoral zone by waves and currents. Includes IJ!Ovement parallel (alongshore) and perpendicular (cross-shore) to the shore.
Littoral Zone
EM 1110-2·3301 31May95
Indefinite zone extending seaward from the shoreline to just beyond the breaker zone.
Longshore Transport Transport of littoral sediments by a current flowing essentially parallel to the shoreline, usually generated by waves breaking at an angle to the shoreline.
Low-Tide Mark Limit of wave backrush, which is usually marked by a small deelivity in the profile. This feature, known as the step, may not always be evident.
Macrotidal Tidal ranges occurring where the tide is dissipated across wide sloping areas or confined to estuaries or gulfs with a typical range greater than 4 m.
Maximum Net Benefits Difference in damages to a project area between withoutproject and with-project conditions.
Mesotidal Tidal ranges occurring where both microtidal and macrotidal features are found (ranging from 2-4 m).
Microtidal Tidal ranges occurring on open ocean coasts having a range less than 2 m.
Mean High Water (mhw) Average height of high waters over a 19-yr period.
Mean Low Water (mlw) Average height of low waters over a 19-yr period.
Median Grain Size Diameter of sediment which marks the division of a grain size sample into two equal parts by weight.
Mica A naturally occurring silicate mineral contained in many sediment-producing rocks.
Mid-Tide Mark Location approximately midway between the low-tide line and the high-tide mark.
Native Beach Characteristics of a beach prior to the influence of artificial modifications.
C-3

EM 1110-2·3301 31May95
Nearshore Indefinite zone extending seaward from the shoreline well beyond the breaker zone.
Non-Intersecting Profile Based on the equilibrium profile approach, the nourished profile does not intersect the native profile before the closure depth and is dependent upon inequalities between the fill and native beach sediments.
Offshore Zone extending from the breaker line to the seaward edge of the continental shelf.
Onshore Direction landward from the sea or other large bodies of water.
Outwash Plain Body of outwashed sediment that fonns a broad plain.
Overbuilding Placement of required fill volume onshore in a construction template with the beach benn at the design elevation, but with a benn width greater than the design benn width and fill slope that is steeper than the equilibrium slope on the seaward side.
Overfill Ratio Volume of borrow material required to produce a stable unit of usable fill material with the same grain size characteristics as the native material.
Periodic Nourishment Periodic placement of artificial beach fill for replenishing a beach.
Planform The outline or shape of a body of water as detennined by the still-water line.
Profile Shape Parameter Based on the equilibrium profile approach, the shape of the equilibrium profile is dependent on a sediment characteristic (A) which is governed by size or fall velocity alone.
Profile translation Seaward translation of a nourished profile when using similar borrow material.
Quartz Mineral that is commonly the primary component of beach sand.
C-4
Renourishment Factor Technique used to predict how often renourishment will be needed using the selected borrow material.
Revetment Facing of stone or concrete built to protect a scarp, embankment, or shore structure against erosion by wave action or currents.
Rip Current Strong current flowing seaward from the shore. It usually appears as a visible band of turbid water.
River Currents Currents produced by incoming river flow.
Run up Rush of water up the face of a structure or beach due to waves.
Scarp More or less continuous line of cliffs or steep slopes facing in one general direction, which are caused by erosion or faulting.
Seawall Structure separating land and water areas, primarily designed to prevent erosion and other damage due to wave action.
Seaward Direction toward the open ocean or other large body of water.
Sediment Solid fragmented material (sand, gravel, silt, etc.) transported by wind, water, or ice or chemically precipitated from solution or secreted by organisms.
Shoal Sedimentary structure that accumulates near inlets due to sediment transport by tidal currents associated with inlets and navigation channels.
Shoaling Process of sediment deposition causing the accumulation of shoaling, or the process of becoming shallower.
Shore Narrow strip of land in immediate contact with the sea or other large bodies of water, including the zone between high- and low-water lines.

Shoreface The narrow zone seaward from the low-tide shoreline, covered by water, over which the beach sands and gravels actively oscillate with changing wave conditions.
Shoreline Intersection of a specified plane of water with the shore or beach. Line delineating the shoreline on National Ocean Survey (NOS) nautical charts and surveys.
Significant Wave Height Average height of the highest one third wave in a wave group.
Sorting Process occurring during sediment transport that tends to separate particles according to their size, density, and shape.
Spit An elongated, usually sandy, feature aligned parallel to the coast, that terminates in open water.
Storm Surge A rise above the normal water level on the open coast due to wind stress and low barometric pressure.
Stratigraphy Pertaining to the study of stratified rocks and sediments.
Subaqueous Processes Processes occurring under water.
Submarine Canyon Relatively narrow, deep depression with deep slopes, with bottom grades continuing downward occurring on the continental shelf, shelf break, and slope.
Submerged Proftle Based on the equilibrium profile approach, the nourished beach profile does not intersect the native profile and no subaerial beach exists after equilibrium and is dependent upon inequalities between the fill and native beach sediments.
Survey Sled An instrument pulled along the ocean bottom to survey coastal and beach areas.
Terminal Structure A structure placed at the terminating ends of a beach fill project to minimize transport of the borrow material out of the project area.
Terrestrial Sediment
EM 1110-2·3301 31May95
Sediments derived from inland geologic sources.
Tidal Current Currents created by the propagation of tides through coastal areas which induces water surface gradients and currents.
Updrift Direction along the coast in which littoral drift material is moving.
Wave Diffraction Phenomenon by which wave energy is transmitted laterally along the wave crest
Wave Direction Direction from which a wave approaches.
Wave Height Vertical distance between a crest and the preceding trough.
Wave Period Time for a wave crest to traverse a distance equal to one wavelength or the time for two waves to pass a fixed point.
Wave Refraction Wave transformation in which direction and height of the wave are modified due to the change in wave phase speed as water depth changes.
Wave Setup Superelevation of the water surface over normal surge elevation due to the onshore gradient of wave momentum.
Wave Spectra In wave studies, a graph, table, or mathematical equation showing the distribution of wave energy as a function of wave frequency. The spectrum may be based on observations or theoretical considerations.
Wave Steepness Ratio of wave height to wave length.
Wave Transformation Changes in the physical characteristics of a wave as it travels into shallow water.
Wind-Driven Currents Currents induced in the water column by wind stresses on the water's surface, especially during storms.
C-5

EM 1110-2·3301 31May95
With Project Estimate of damages after construction of a coastal project.
C-6
Without Project Estimate of damages that would occur in the absence of a coastal project.

Appendix D Operations and Maintenance Manual
(PROJECT NAME)
(SAMPLE) TABLE OF CONTENTS
PARA. TITLE
SECTION I - IN1RODUCTION
I-1. PURPOSE OF THIS MANUAL I-2. AUTHORIZATION I-3. LOCATION I-4. DESCRIPTION OF PROJECT I-5. PROTECTION PROVIDED I-6. CONSTRUCTION HISTORY I-7. LOCAL COOPERATION AGREEMENT
SECTION II - OPERATION AND MAINTENANCE
11-1. GENERAL 11-2. MANAGEMENT 11-3. DUTIES 11-4. PERIODIC INSPECTIONS 11-5. REPORTS 11-6. IMPROVEMENTS OR ALTERATIONS 11-7. PROJECT FEATURES (Description, Operation, Maintenance)
SECTION III - PERIODIC NOURISHMENT
III-1. SCOPE III-2. MONITORING (Surveys, Aerial Photography, Sediment Samples, Waves, etc.) III-3. NOURISHMENT III-4. ROUTINE MONITORING ANALYSIS III-5. POST-STORM ANALYSIS III-6. POST~STORM MAINTENANCE III-7 POST-STORM NOURISHMENT
SECTION IV - RESPONSIBILITIES
IV-1. U.S. ARMY CORPS OF ENGINEERS IV-2. LOCAL SPONSOR IV-3. FINANCIAL
APPENDICES
A. ENGINEER REGULATION NO. 1110-2-2902 B. LOCAL COOPERATION AGREEMENT C. INSPECTION REPORT FORMS D. AS-BUILT DRAWINGS
EM 1110-2·3301 31May95
PAGE NO.
0·1

EM 1110-2·3301 31May95
D-1. The inspection forms furnished in this appendix are samples from which the user should design forms that reflect specific project features. Instructions should be tailored to the Superintendent so that he knows how many beach and dune forms and how many structural forms he needs to complete during an inspection.
D-2. Assuming that the protection device is primarily the beach, berm, and dune, a form has been developed for that portion of the project. That form may need only minimal revision to suit the user's purposes. For example, the project name will need to be inserted. The user may also need to instruct the Superintendent at which stations he should inspect the beach. This may be uniformly along the shore, e.g., every 1,000 to 5,000 ft or at specific locations, e.g., dune crossovers, ramps, or parking lots.
D-3. The project may include erosion-control structures to protect the beach and dune. A terminal groin, system of groins, system of off shore breakwaters, or other structure may be included in the project. The structure inspection form needs to be modified to depict each of these structures. If the structure is not made of stone, other revisions will be needed to help the superintendent inspect the projecL He will need to be furnished with forms for each type of feature so that he can fill out one form for each structure.
0·2
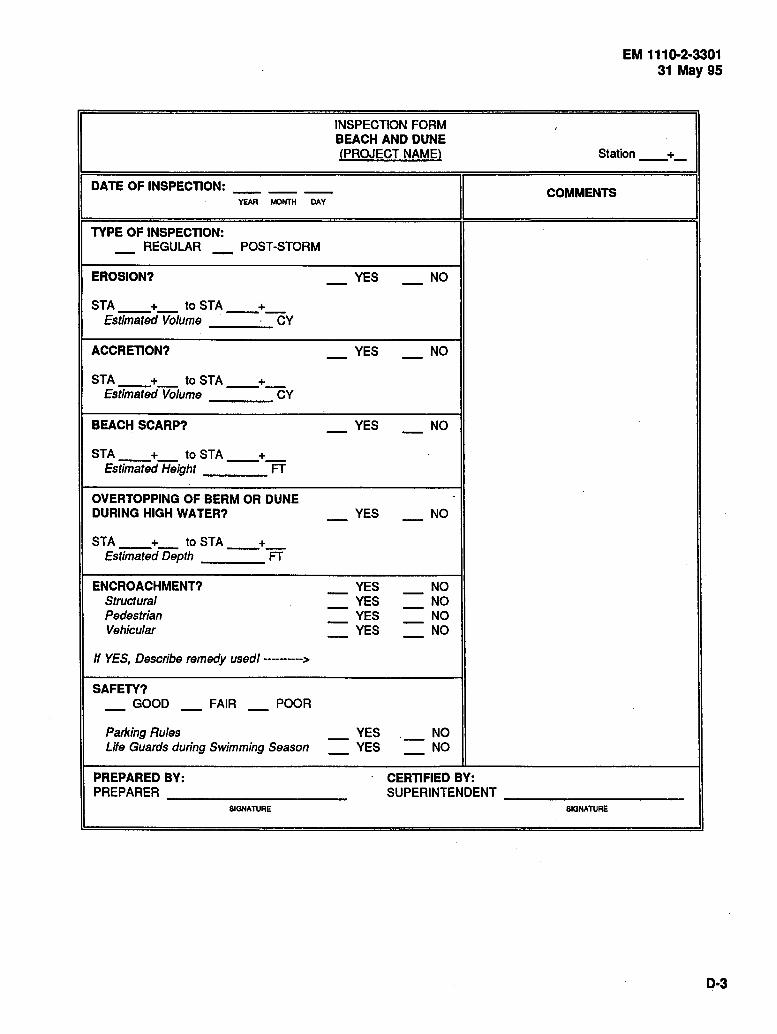
INSPECTION FORM BEACH AND DUNE (PROJECT NAME}
I DATE OF INSPECTION: ------
II YEAR MONTH DAV
TYPE OF INSPECTION: REGULAR POST-STORM - -
EROSION? YES NO - -STA + to STA __ +_
Estimated Volume CY
ACCRETION? YES NO - -STA __ +_ to STA +
Estimated Volume --CY
BEACH SCARP? YES NO - -STA __ +_ to STA __+_
Estimated Height FT
OVERTOPPING OF BERM OR DUNE . DURING HIGH WATER? YES NO - -STA __ +_ to STA __+_
Estimated Depth FT
ENCROACHMENT? YES NO - -Structural YES NO - -Pedestrian YES NO - -Vehicular YES NO - -If YES, Describe remedy used/---------->
SAFETY? GOOD FAIR POOR - - -
Parking Rules - YES - NO Life Guards during Swimming Season - YES - NO
PREPARED BY: CERTIFIED BY: PREPARER SUPERINTENDENT
SIGNATURE
EM 1110-2·3301 31May95
Station __ +_
COMMENTS
I
SIGNATURE
0·3
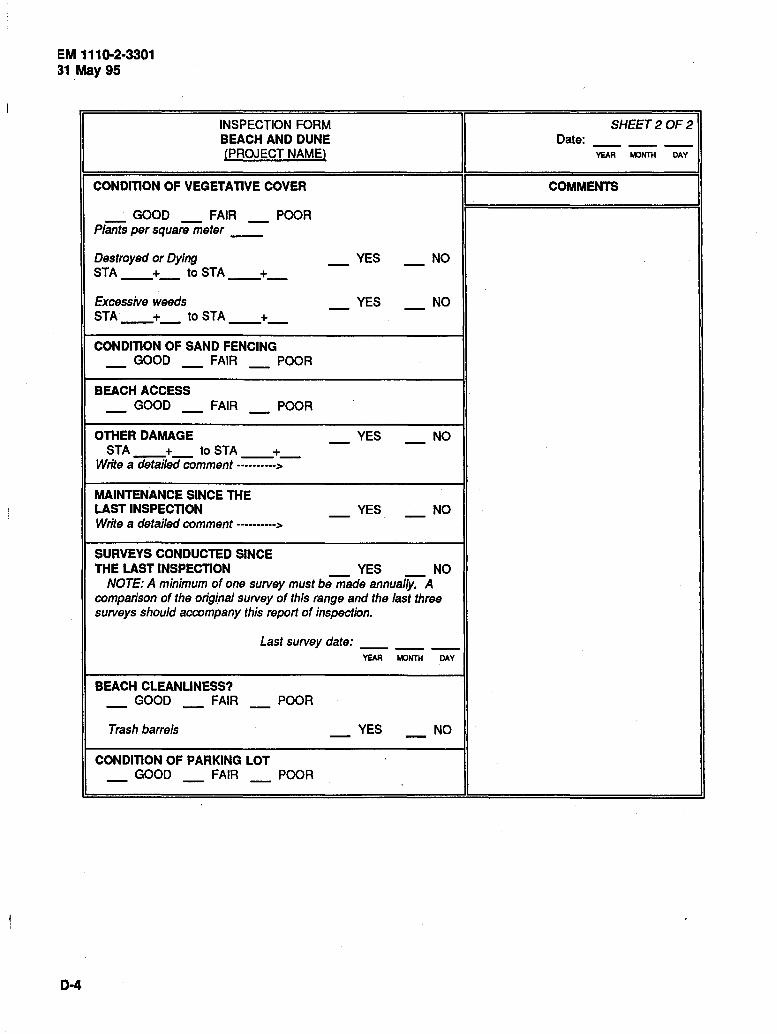
EM 1110-2·3301 31May95
0·4
INSPECTION FORM BEACH AND DUNE (PROJECT NAME)
CONDITION OF VEGETATIVE COVER
GOOD FAIR POOR - - -Plants p9r squar9 m9t9r __
DBstroyBd or Dying STA __ +_ to STA_+_
EXC9SSiV9 W99dS STA __ +_ to STA __ +_
CONDITION OF SAND FENCING _ GOOD _ FAIR _ POOR
BEACH ACCESS _GOOD_ FAIR
OTHER DAMAGE
_POOR
STA + to STA + Writ9 a d9tiiJ9d commBnt -==->-
YES NO
YES NO
YES NO
MAINTENANCE SINCE THE LAST INSPECTION _YES _NO Writ9 a d9tail9d commBnt ---------->
SURVEYS CONDUCTED SINCE THE LAST INSPECTION YES NO
NOTE: A minimum of on9 surv9y must b9mad9 annually. A comparison of th9 original surv9y of this rang9 and th9 last thr99 surv9ys should accompany this r9port of insp9ction.
Last surv9y dat9: _____ _
BEACH CLEANLINESS? _GOOD_ FAIR
Trash barr9ls
CONDITION OF PARKING LOT
POOR
_ GOOD _ FAIR _ POOR
VEAR MONTH DAV
_YES _NO
SHEET20F2 Date: _____ _
YEAR MONTH DAV
COMMENTS

INSPECTION FORM STRUCTURAL FEATURE
!PROJECT NAME)
I DATE Of INSPECTION: ____ _
. YEAR MONTH DAY
TYPE OF INSPECTION: _ REGULAR _ POST-STORM
DAMAGE TO TRUNK _YES LEFT SIDE RIGHT SIDE
Grain STA_+_ to STA_+_ L.,,gih_FT Kldlh_FT 0-,,lh_FT
DISPLACED ARMOR STONE SETTLING STEEPENING SLUMPING/SLUFFING STONE DETERIORATION EXPOSED UNDERLAYER OTHER (Comment)
_YES _YES _YES _YES _YES _YES _YES
_NO
_NO _NO _NO _NO _NO _NO _NO
DAMAGE TO CREST _YES _NO
DISPLACED ARMOR STONE SETTLING BRIDGING STONE DETERIORATION EXPOSED UNDERLA YER OTHER (Comment)
DAMAGE TO HEAD
DISPLACED ARMOR STONE SETTLING STEEPENING SLUMPING/SLUFFING STONE DETERIORATION EXPOSED UNDERLA YER OTHER (Comment)
_YES _YES _YES _YES _YES _YES
_NO _NO _NO _NO _NO _NO
_YES _NO
_ YES _YES _YES _ YES _YES _YES _YES
_NO _NO _NO _NO _NO _NO _NO
II
PREPARED BY: CERTIFIED BY:
EM 1110-2·3301 31May95
Station __ + _
COMMENTS
PREPARER ----------~ SUPERINTENDENT ---------SIGNATURE SIGNATURE
D·S
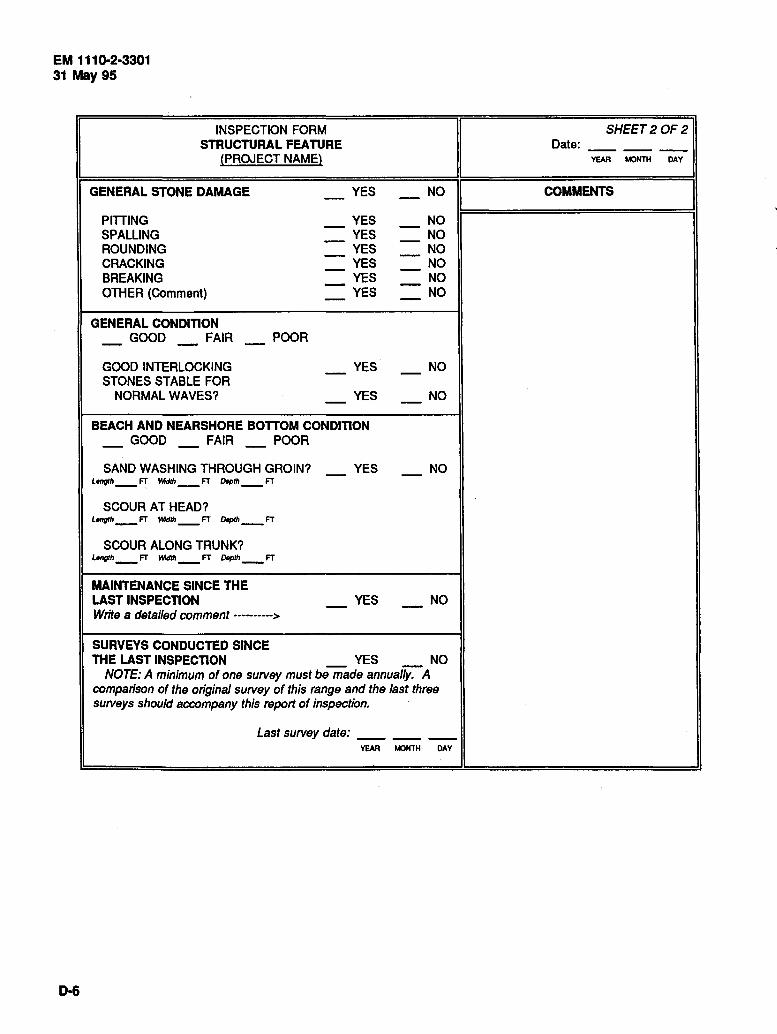
EM 1110-2·3301 31May95
INSPECTION FORM STRUCTURAL FEATURE
(PROJECT NAME)
5HEET20F2 Date: _____ _
YEAR MONTH DAY
GENERAL STONE DAMAGE YES - NO I COMMENTS I 1:=========================~1
D·6
PITTING SPALLING ROUNDING CRACKING BREAKING OTHER (Comment)
GENERAL CONDITION GOOD FAIR POOR
GOOD INTERLOCKING STONES STABLE FOR
NORMAL WAVES?
_YES _YES _YES _ YES
_YES _YES
_NO _NO _NO _NO _NO _NO
YES NO
YES NO
BEACH AND NEARSHORE BOTTOM CONDITION _ GOOD _ FAIR _ POOR
SAND WASHING THROUGH GROIN? Lellfllh_FT l\.ldth_FT Depth_FT
SCOUR AT HEAD? Lerl(llh_ FT l\.ldth_ FT Depth_ FT
SCOUR ALONG TRUNK? L•ngth_ FT l\.fdllr _FT Depth_ FT
MAINTENANCE SINCE THE LAST INSPECTION Write a detailed comment ---------->
SURVEYS CONDUCTED SINCE
_YES _NO
YES NO
THE LAST INSPECTION _ YES _ NO NOTE: A minimum of one survey must be made annually. A
comparison of the original survey of this range and the last three surveys should accompany this report of inspection.
Last survey date: _____ _ YEAR MONTH DAY
Related Documents