ELUCIDATING the MECHANISMS of TRANSPOSABLE ELEMENTS using EXPERIMENTAL and BIOINFORMATIC APPROACHES: the hAT SUPERFAMILY of TRANSPOSABLE ELEMENTS in the GENOME of AEDES AEGYPTI and TE DISPLAYER by Rebecca Rooke – complete as registered on ROSI A thesis submitted in conformity with the requirements for the degree of Masters of Science Graduate Department of Cell and Systems Biology University of Toronto © Copyright by Rebecca Rooke 2011

Welcome message from author
This document is posted to help you gain knowledge. Please leave a comment to let me know what you think about it! Share it to your friends and learn new things together.
Transcript
ELUCIDATING the MECHANISMS of TRANSPOSABLE ELEMENTS using EXPERIMENTAL and
BIOINFORMATIC APPROACHES: the hAT SUPERFAMILY of TRANSPOSABLE ELEMENTS in the
GENOME of AEDES AEGYPTI and TE DISPLAYER
by
Rebecca Rooke – complete as registered on ROSI
A thesis submitted in conformity with the requirements for the degree of Masters of Science
Graduate Department of Cell and Systems Biology University of Toronto
© Copyright by Rebecca Rooke 2011
ii
Elucidating the Mechanisms of Transposable Elements using
Experimental and Bioinformatic Approaches: The hAT
Superfamily of Transposable Elements in the Genome of Aedes
aegypti and TE Displayer
Rebecca Rooke
Masters of Science
Cell and Systems Biology University of Toronto
2011
Abstract
Transposable elements (TEs) are found in nearly all eukaryotic genomes and are a
major driving force of genome evolution. The hAT superfamily of TEs are found in a
variety of organisms, including plants, fungi, insects and animals. To date, only 14 hAT
TEs in the Aedes aegypti genome have been annotated as having a hAT transposase
coding sequence. In this study, extensive bioinformatic approaches have been
employed to find hAT TEs that encode transposases in the A. aegypti genome. A total
of six newly-identified TEs belonging to the hAT superfamily were discovered in the A.
aegypti genome. Furthermore, a computer program called TE Displayer was developed
to analyze TEs in genome sequences. TE Displayer detects TE-derived polymorphisms
in genome datasets and presents the results on a virtual gel image. TE Displayer
enables researchers to compare TE profiles in silico and provides a reference profile for
experimental analyses.

iii
Acknowledgments
First and foremost, I would like to thank my supervisor, Dr. Guojun Yang, for introducing
me to and guiding me through the exciting world of transposable elements. Your
constant enthusiasm about your research was nothing short of contagious. I appreciate
all the time and effort you gave me throughout these past two years to help me become
a better biologist.
I would also like to thank the members of my committee, Dr. George Espie and
Dr. Marla Sokolowski, for their valuable guidance and suggestions.
I could not have successfully completed my MSc without the academic, mental,
and emotional support of Amy Wong and Matt Janicki. You are both phenomenal people
who were always there to encourage and motivate me, laugh and joke with me, and you
provided me with a necessary fun and whacky world outside of the lab.
Lastly, I would like to thank my family for their support, motivation, and
encouragement. Thank you, Angela, for editing my thesis. You are my role model and
inspiration, not only in the world of academia, but in life as well. Thank you Mom and
Dad, for allowing me to choose my own path and for supporting me with every step I
took.
Funding: National Sciences and Engineering Research Council (RGPIN371565 to G.Y.); Canadian Foundation for Innovation (24456 to G.Y.); Ontario Research Fund; University of Toronto.
iv
Table of Contents
Acknowledgments ........................................................................................................... iii
Table of Contents ............................................................................................................ iv
List of Tables.................................................................................................................. vii
List of Figures ............................................................................................................... viii
List of Appendices ........................................................................................................... xi
Publications.................................................................................................................... xii
Glossary ........................................................................................................................ xiii
Chapter 1 Introduction to Transposable Elements ........................................................... 1
1 Transposable Elements (TEs) ..................................................................................... 1
1.1 TE Classification ................................................................................................... 1
1.2 Miniature Inverted Repeat Transposable Elements (MITEs) ................................. 5
1.3 Recently and Currently Active MITEs .................................................................... 6
1.4 Elucidating how MITEs Achieve High Copy Numbers ........................................... 9
1.5 Significance of TEs ............................................................................................. 11
Chapter 2 Elucidating the Transposase Sources for the Transposition of hAT MITEs ... 13
2 Introduction to hAT TEs ............................................................................................. 13
3 Methods ..................................................................................................................... 15
3.1 Determining and Cloning hAT MITEs .................................................................. 15
3.2 Finding TEs using a Top-Down Approach ........................................................... 16
3.3 Determining Candidate Transposases for the Transposition of hAT MITEs ........ 18
3.3.1 Retrieving All Putative hAT Transposases ............................................... 18
3.3.2 Identifying Recently Active Putative Transposases .................................. 19
3.3.3 Linking hAT MITEs with Putative Transposases ...................................... 19
3.3.4 Identifying Coding Sequences of Putative hAT Transposases ................. 19
v
3.3.5 Phylogenetic and Conserved Domain Analysis of Known and Putative hAT Transposases ........................................................................................... 20
3.4 Synthesizing and Cloning of Transposases ........................................................ 21
3.5 Yeast Excision Assays ........................................................................................ 23
4 Results ....................................................................................................................... 25
4.1 Computational Analyses...................................................................................... 25
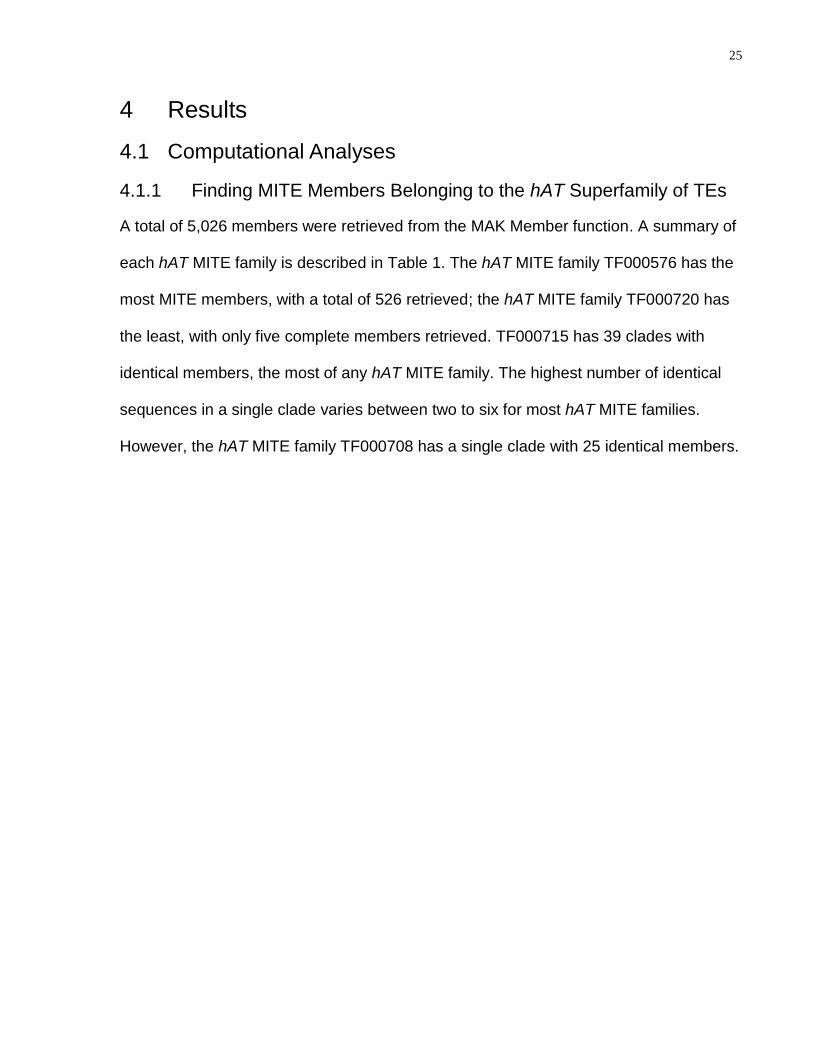
4.1.1 Finding MITE Members Belonging to the hAT Superfamily of TEs ........... 25
4.1.2 Finding TEs Encoding Putative hAT Tranposases ................................... 26
4.1.3 Analysis of hATTPases and their copies in the A. aegypti genome .......... 30
4.1.4 The Buster and Ac families of the hAT Superfamily ................................. 33
4.1.5 Conserved Domains in Known and Putative Transposase Sequences in the A. aegypti genome .............................................................................. 36
4.1.6 Linking MITEs to Putative hAT Transposases .......................................... 39
4.1.7 Finding TEs using a Top-Down Approach ................................................ 43
4.2 Experimental Analyses ........................................................................................ 44
4.2.1 Cloning MITEs .......................................................................................... 44
4.2.2 Candidate hAT Transposase Analysis and Cloning.................................. 45
4.2.3 Yeast Excision Assays with the Putative hAT Transposase hATTPase1646
5 Discussion ................................................................................................................. 51
Chapter 3 TE Displayer for Post Genomic Analysis of TEs ........................................... 56
6 Introduction to Transposon Display ........................................................................... 56
7 Methods ..................................................................................................................... 60
7.1 Algorithm ............................................................................................................. 60
7.2 Implementation .................................................................................................... 61
7.3 Output ................................................................................................................. 63
7.4 Parameters Used for Testing TE Displayer ......................................................... 63
7.5 Genomic Database Sources ............................................................................... 64
vi
8 Results ....................................................................................................................... 64
9 Discussion ................................................................................................................. 66
Chapter 4 Concluding Remarks ..................................................................................... 68
References..................................................................................................................... 70
Appendix I: Supplementary Materials ............................................................................ 79

vii
List of Tables
Table 1: Summary of output retrieved from MAK’s Member function. .............................. 26
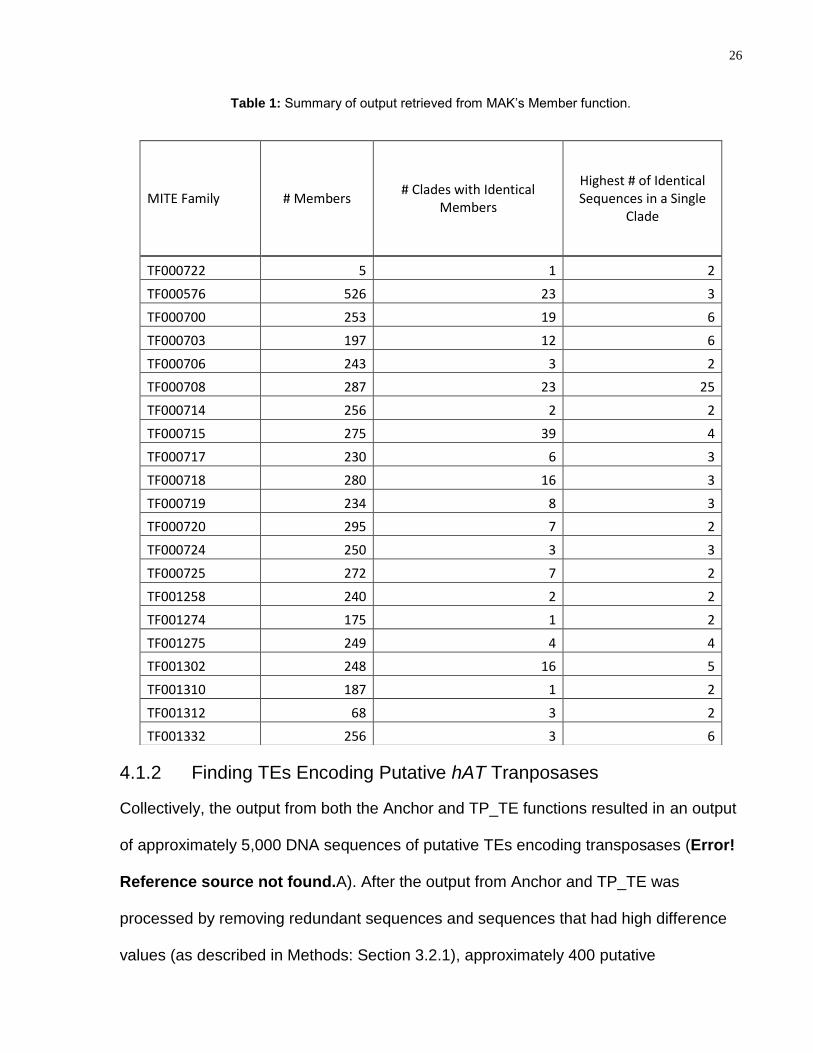
Table 2: A summary of the 23 hATTPases. Their accession and position in the A.
aegypti genome is shown, along with their size in bps and TSD sequence. .................... 29
Table 3: The number of individual hAT MITE sequences that were cloned into the donor
plasmid for each hAT MITE family. ......................................................................................... 45
Table 4 hAT primer sequences and genomes used to generate output for hAT elements
....................................................................................................................................................... 63
Supplementary Table 1: Consensus sequences of hAT MITE families from TEfam
(http://tefam.biochem.vt.edu) .................................................................................................... 79
Supplementary Table 2: Primer sequences used to amplify hAT MITEs from A. aegypti
genomic DNA. ............................................................................................................................. 81
Supplementary Table 3: Primer sequences of candidate transposase exons. Grey, six
additional nucleotides; pink, restriction enzyme site. ........................................................... 82
Supplementary Table 4: Novel hAT TE families. Consensus sequences and size (bp)
are shown, as well as the copy number for each family/subfamily. ................................... 97

viii
List of Figures
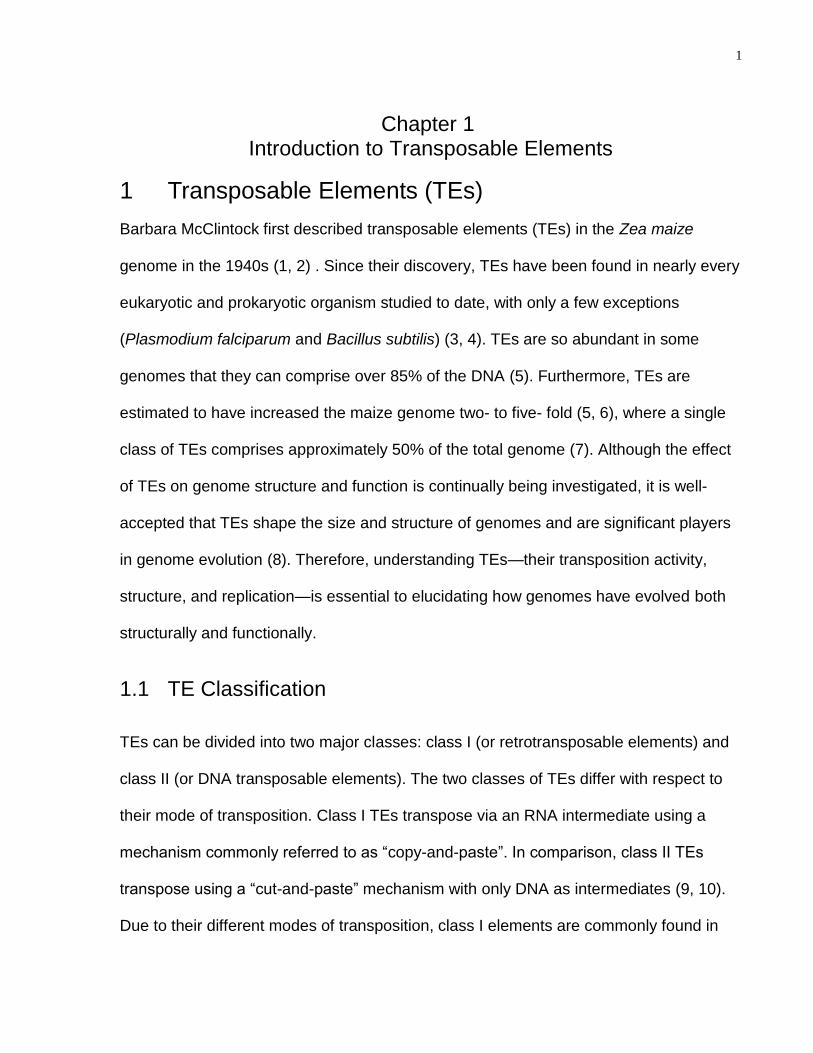
Figure 1: Graphical representation of the transposition of Class I TEs. The TE is
transcribed into RNA and then reverse-transcribed into cDNA. The cDNA is inserted into
the genome at a different location than the original element. ............................................... 2
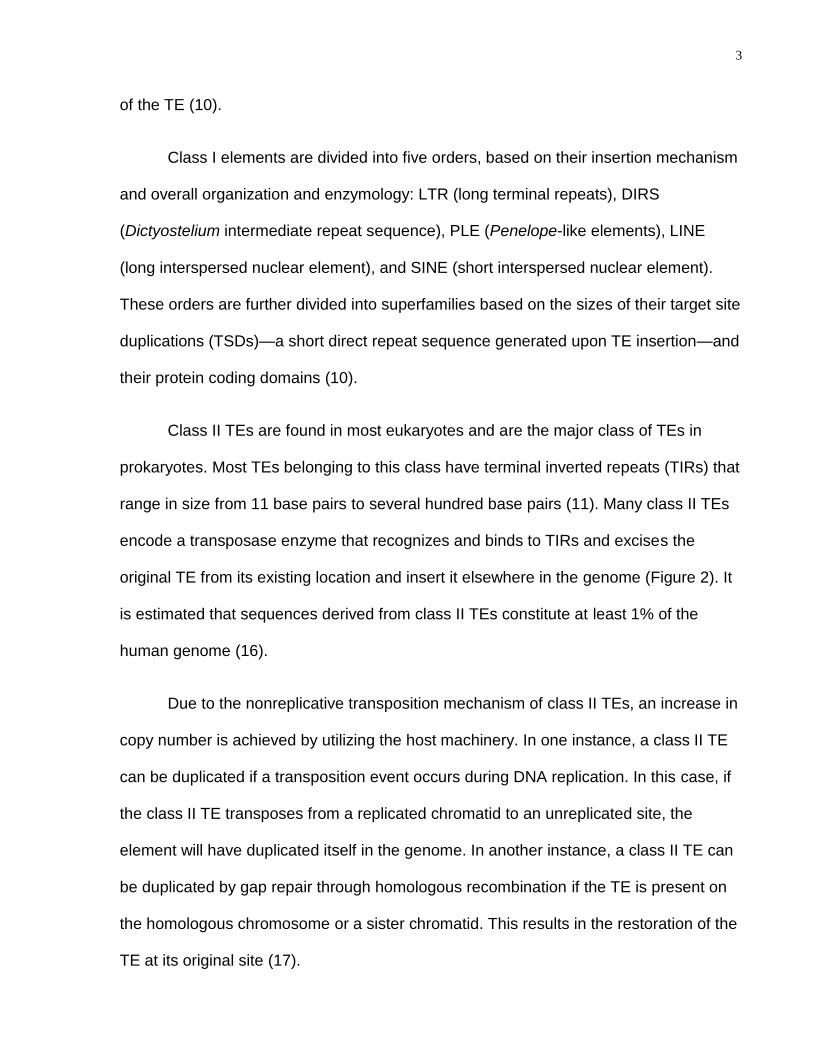
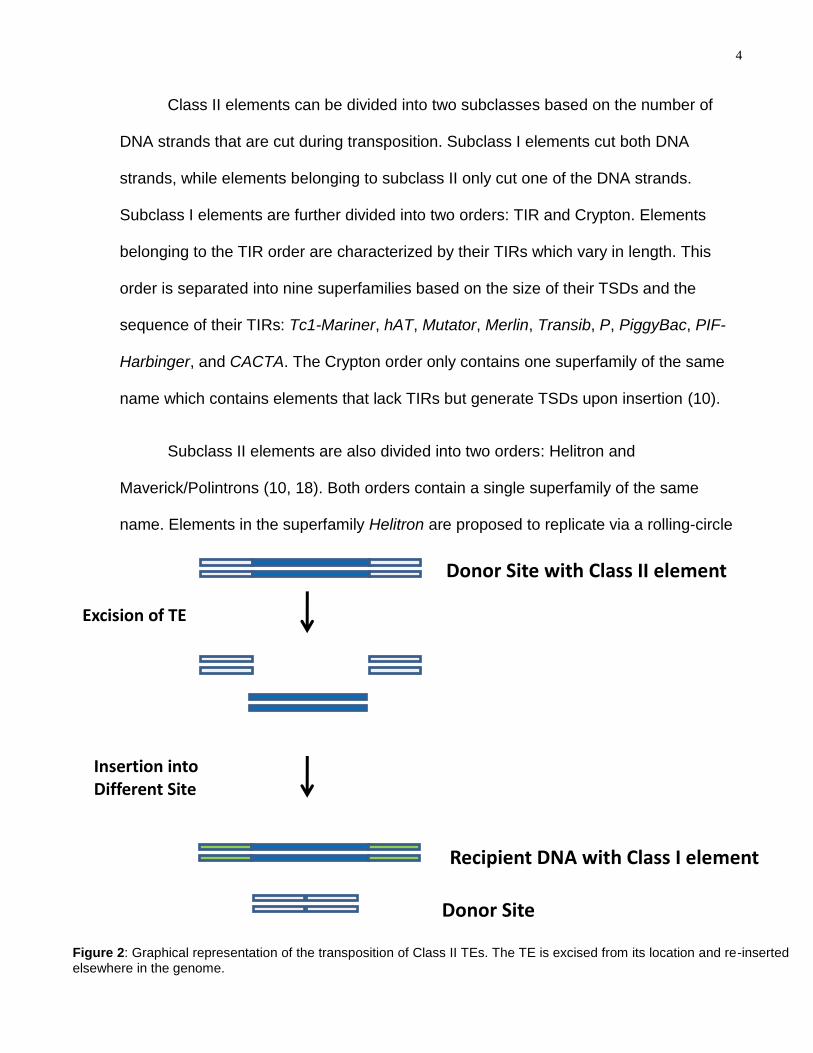
Figure 2: Graphical representation of the transposition of Class II TEs. The TE is
excised from its location and re-inserted elsewhere in the genome. ................................... 4
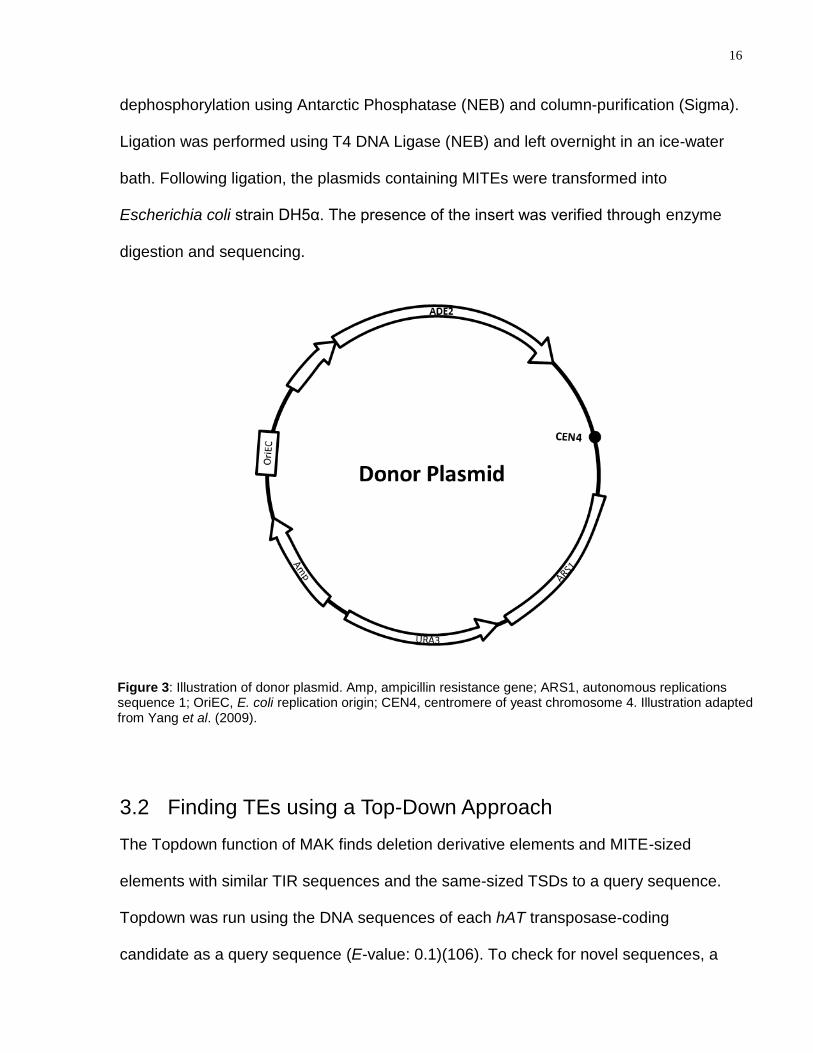
Figure 3: Illustration of donor plasmid. Amp, ampicillin resistance gene; ARS1,
autonomous replications sequence 1; OriEC, E. coli replication origin; CEN4,
centromere of yeast chromosome 4. Illustration adapted from Yang et al. (2009). ........ 16
Figure 4: An illustration of the primers designed for a hypothetical hAT transposase with
two exons and one intron. Green arrows, primers corresponding to exon #1; orange
arrows, primers corresponding to exon #2; TGATCA, SpeI site; GTCGAC, SalI site. .... 22
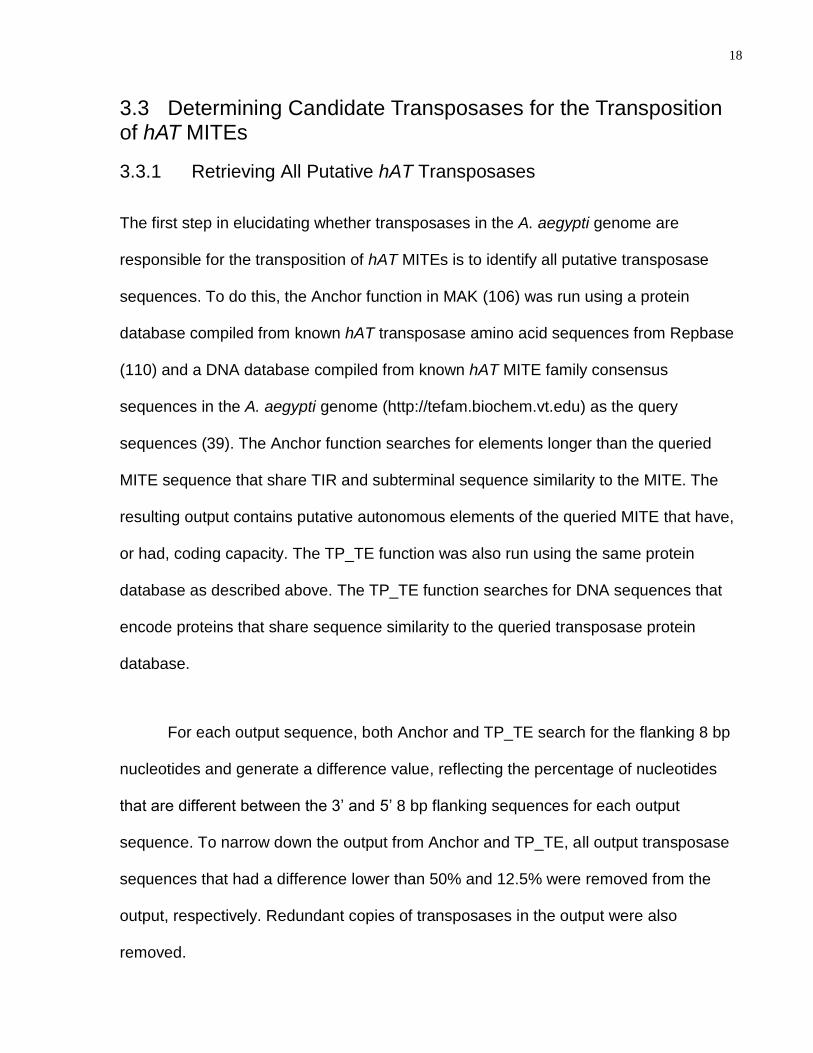
Figure 5: Illustration of transposase source plasmid. Amp, ampicillin resistance gene;
ARS H4, autonomous replication sequence of H4 gene; CEN6, centromere of yeast
chromosome 6; cyc1 ter, termination of yeast cyclin gene cyc1; OriEC, E. coli replication
origin; Pgal1, yeast gal1 promoter. Illustration adapted from Yang et al. (2009). ............ 23
Figure 6: A schematic representation of how the best candidate hAT transposase
sequences were selected. ........................................................................................................ 28
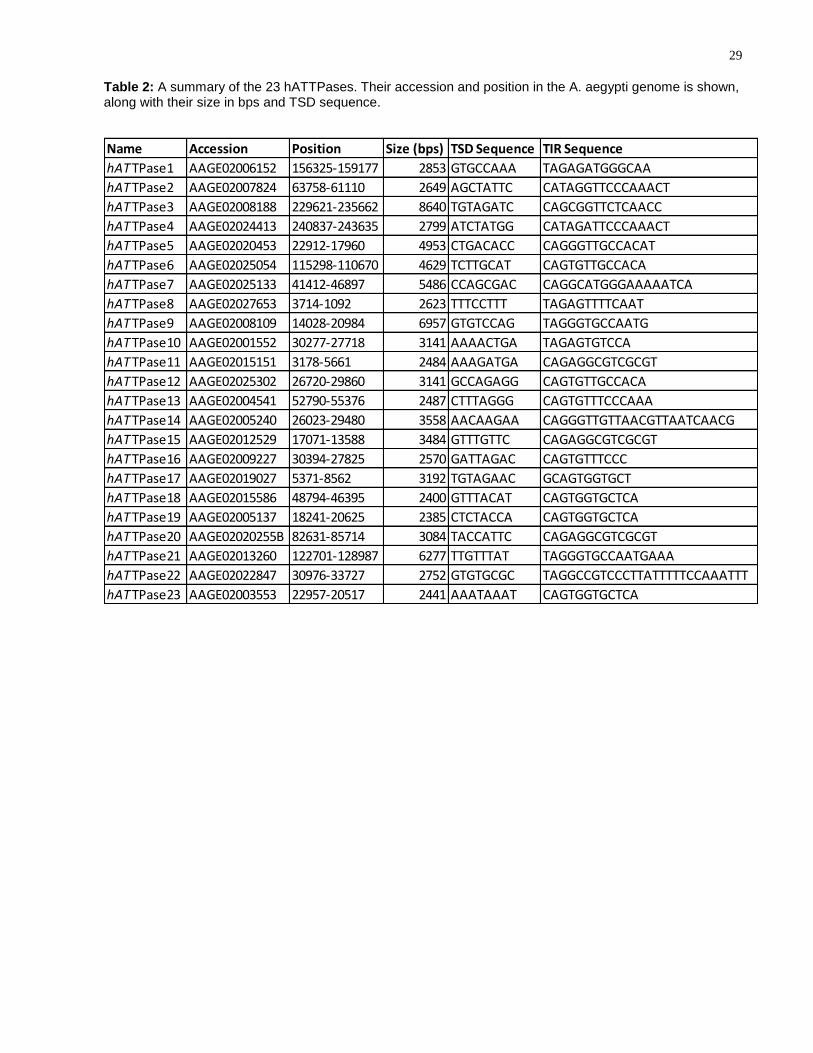
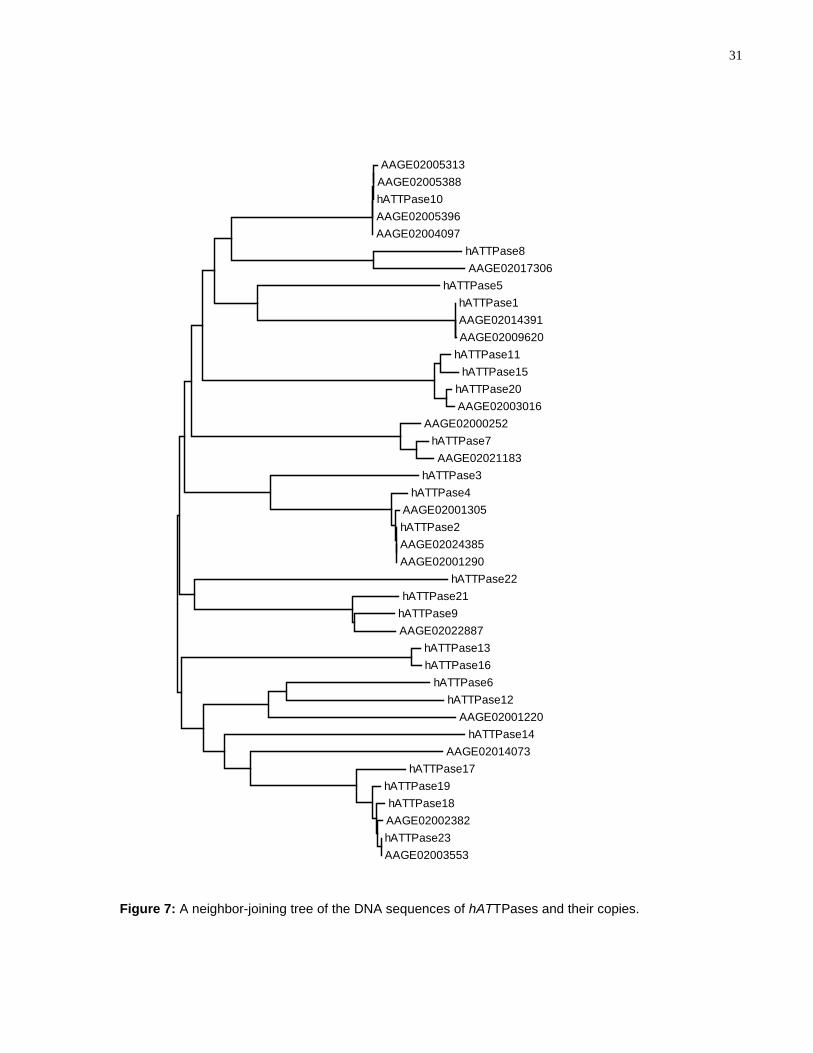
Figure 7: A neighbor-joining tree of the DNA sequences of hATTPases and their copies.
....................................................................................................................................................... 31
Figure 8: A maximum likelihood phylogenetic tree of the 23 hATTPase transposase
amino acid sequences (50% majority rule consensus). Numbers next to the nodes show
quartet puzzling reliability based on 10,000 puzzling steps, a measure of nodal support
similar to bootstrapping that is produced by TREE-PUZZLE .............................................. 32
Figure 9: A maximum likelihood phylogenetic tree of amino acid transposase
sequences from Arensburger et al. (2011) and amino acid sequences of annotated
ix
hATTPases (50% majority rule consensus). Numbers next to most nodes show quartet
puzzling reliability based on 10,000 puzzling steps, a measure of nodal support similar
to bootstrapping produced by TREE-PUZZLE. ..................................................................... 35
Figure 10: Sequence frequency logos of the TSD sequences for hATTPases and their
copies belonging to the Buster and Ac families. ................................................................... 36
Figure 11: A schematic representation of known intact hAT transposase sequences in
A. aegypti (from TEfam) and annotated hATTPases that have conserved sequence
domains. Grey lines, transposase sequence; blue, hAT family dimerization domain; red,
zinc finger domain; green, DUF659 domain of unknown function. .................................... 38
Figure 12: Figure illustrating which hATTPases DNA sequences have ends that are
similar in sequence to the ends of each MITE family. Red lines, match MITE family
TF000722; Blue line, match MITE family TF000576; green lines, match MITE family
TF000718; yellow lines, match MITE family TF000706; purple lines, match MITE family
TF001275; grey lines, match MITE family TF000715. ......................................................... 40
Figure 13: Alignment of the end sequences of hAT MITE families that match best with
the end sequences of the hATTPases DNA sequences ...................................................... 42
Figure 14: Alignment of the 5’ and 3’ ends of the three TE families found from TopDown
and the hATTPases-coding elements used to find them. .................................................... 44
Figure 15: Example of yeast colonies growing on media lacking histidine and uracil. All
transformation reactions that resulted in colony formation for all three conditions, as
shown above, were plated on media lacking adenine. ........................................................ 47
Figure 16: Yeast on media lacking adenine. Plates were streaked with colonies
incubated at 30ºC on media lacking histidine and uracil. Sections on plates are
representative of a single streaked colony. Red arrow, colony. ......................................... 48
Figure 17: Yeast on media lacking adenine. Plates were spread with yeast cells from
colonies incubated at 25ºC in liquid media lacking histidine and uracil. Red arrow,
colony ........................................................................................................................................... 49

x
Figure 18: Yeast on media lacking adenine. Plates were spread with yeast cells from
colonies incubated at 30ºC in liquid media lacking histidine and uracil. Red arrow,
colony ........................................................................................................................................... 50
Figure 19: A schematic representation of Transposon Display. (A) Genomic DNA is
extracted; (B) DNA is digested with MseI and adapters are ligated to the ends; (C) Pre-
amplification PCR is performed; (D) Selective PCR is performed; (E) Products are run
on a polyacrylamide gel. Blue boxes-adaptors; grey arrows-pre-amplification primers;
black arrows-selective amplification primers. ........................................................................ 59
Figure 20: Screen-shot of the bioinformatics program, TE Displayer ............................... 60
Figure 21: Diagram of TE Displayer algorithm (see Methods: Implementation). Red
arrowhead, pre-amplification primer; Black arrowhead, selective-amplification primer.
Adapted from Rooke & Yang (2010). ...................................................................................... 62
Figure 22: TE Displayer virtual gels. (A) hAT families in different species. Lane 1:
A.thaliana; lane 2: C.elegans; lane 3: rice; lane 4: A.aegypti; lane 5: D.melanogaster. (B)
mPing elementsin rice. Lane 1: O.sativa var. indica; lane 2: O.sativa var. japonica.
(C)TF000720 family in A.aegypti with different allowed primer mismatches. Lane 1: no
mismatches; lane 2: 1 mismatch; lane 3: 2 mismatches. (D) TF000700 family in
A.aegypti with different selective bases. Lane 1: no selective base; lane 2: A; lane 3: C;
lane 4: T; lane 5: G. Adapted from Rooke & Yang (2010). .................................................. 65
Supplementary Figure 1: The amino acid alignment of annotated hATTPases and
transposase protein sequences from Arsenburger et al. (2011). Alignments were
generated from M-COFFEE. .................................................................................................... 95
Supplementary Figure 2: Sequence of the putative hAT transposase, hATTP16.
Underlined sequence is the coding region. Insertion locations that were repaired are
denoted by asterisks (*). Substitutions that were repaired are denoted by red residues.
Grey background-intron; yellow background-TIRs ............................................................... 96

xi
List of Appendices
Appendix I: Supplementary Materials ............................................................................ 78
xii
Publications
Rooke, R. & G. Yang (2010) TE displayer for post genomic analysis of transposable elements. Bioinformatics, 27(2): 286-287
My contributions to this publication include: troubleshooting glitches in the
software; making the computer program more aesthetically-pleasing and easy to use;
inserting user-controlled options into the software, such as changing background and
font color; testing the program with numerous different databases; inspecting all output
to insure the software is generating expected results. Furthermore, I wrote and
submitted the publication (with editing from Dr. Guojun Yang) and generated all figures
for the manuscript. Compared to the publication, the thesis contains an expanded
introduction.
Janicki, M., Rooke, R. & G. Yang. In press. Bioinformatics and genomic analysis of transposable elements in eukaryotic genomes. Chromosome Research. DOI 10.1007/s10577-011-9230-7
My contributions to this publication include thoroughly editing the manuscript prior
to submission. Following submission, the first author and I were responsible for
addressing the reviewer’s comments and suggestions and editing the manuscript
accordingly.
xiii
Glossary
hAT: named after the hobo, Activator, and Tam3 transposable elements
MAK: MITE Analysis Kit
MITE: Miniature inverted-repeat transposable element
TD: Transposon display
TE: Transposable element
TIR: Terminal inverted repeat
TSD: Target site duplication
1
Chapter 1 Introduction to Transposable Elements
1 Transposable Elements (TEs)
Barbara McClintock first described transposable elements (TEs) in the Zea maize
genome in the 1940s (1, 2) . Since their discovery, TEs have been found in nearly every
eukaryotic and prokaryotic organism studied to date, with only a few exceptions
(Plasmodium falciparum and Bacillus subtilis) (3, 4). TEs are so abundant in some
genomes that they can comprise over 85% of the DNA (5). Furthermore, TEs are
estimated to have increased the maize genome two- to five- fold (5, 6), where a single
class of TEs comprises approximately 50% of the total genome (7). Although the effect
of TEs on genome structure and function is continually being investigated, it is well-
accepted that TEs shape the size and structure of genomes and are significant players
in genome evolution (8). Therefore, understanding TEs—their transposition activity,
structure, and replication—is essential to elucidating how genomes have evolved both
structurally and functionally.
1.1 TE Classification
TEs can be divided into two major classes: class I (or retrotransposable elements) and
class II (or DNA transposable elements). The two classes of TEs differ with respect to
their mode of transposition. Class I TEs transpose via an RNA intermediate using a
mechanism commonly referred to as ―copy-and-paste‖. In comparison, class II TEs
transpose using a ―cut-and-paste‖ mechanism with only DNA as intermediates (9, 10).
Due to their different modes of transposition, class I elements are commonly found in

2
Figure 1: Graphical representation of the transposition of Class I TEs. The TE is transcribed into RNA and then reverse-transcribed into cDNA. The cDNA is inserted into the genome at a different location than the original element.
high copy numbers in their host genomes, whereas class II elements are often found in
low copy numbers (11).
Class I TEs contribute to the major repetitive portions of large genomes (12-14).
For example, a single family of class I TEs comprises nearly 35% of the human genome
(15). The transposition mechanism of class I elements begins with the synthesis of RNA
transcripts using the genomic TE copy as a template. The RNA transcripts are
subsequently reverse transcribed into DNA by a TE-encoded reverse transcriptase and
inserted into the genome at a different location (Figure 1). As a result of this ―copy-and-
paste‖ transposition mechanism, each transposition event produces one additional copy
Donor DNA with Class I element
Transcription
RNA
Reverse Transcription
cDNA
Recipient DNA with Class I element
Donor DNA with Class I element
Figure 1: Graphical representation of the transposition of Class I TEs. The TE is transcribed into RNA and then reverse-transcribed into cDNA. The cDNA is inserted into the genome at a different location than the original element.
3
of the TE (10).
Class I elements are divided into five orders, based on their insertion mechanism
and overall organization and enzymology: LTR (long terminal repeats), DIRS
(Dictyostelium intermediate repeat sequence), PLE (Penelope-like elements), LINE
(long interspersed nuclear element), and SINE (short interspersed nuclear element).
These orders are further divided into superfamilies based on the sizes of their target site
duplications (TSDs)—a short direct repeat sequence generated upon TE insertion—and
their protein coding domains (10).
Class II TEs are found in most eukaryotes and are the major class of TEs in
prokaryotes. Most TEs belonging to this class have terminal inverted repeats (TIRs) that
range in size from 11 base pairs to several hundred base pairs (11). Many class II TEs
encode a transposase enzyme that recognizes and binds to TIRs and excises the
original TE from its existing location and insert it elsewhere in the genome (Figure 2). It
is estimated that sequences derived from class II TEs constitute at least 1% of the
human genome (16).
Due to the nonreplicative transposition mechanism of class II TEs, an increase in
copy number is achieved by utilizing the host machinery. In one instance, a class II TE
can be duplicated if a transposition event occurs during DNA replication. In this case, if
the class II TE transposes from a replicated chromatid to an unreplicated site, the
element will have duplicated itself in the genome. In another instance, a class II TE can
be duplicated by gap repair through homologous recombination if the TE is present on
the homologous chromosome or a sister chromatid. This results in the restoration of the
TE at its original site (17).
4
Class II elements can be divided into two subclasses based on the number of
DNA strands that are cut during transposition. Subclass I elements cut both DNA
strands, while elements belonging to subclass II only cut one of the DNA strands.
Subclass I elements are further divided into two orders: TIR and Crypton. Elements
belonging to the TIR order are characterized by their TIRs which vary in length. This
order is separated into nine superfamilies based on the size of their TSDs and the
sequence of their TIRs: Tc1-Mariner, hAT, Mutator, Merlin, Transib, P, PiggyBac, PIF-
Harbinger, and CACTA. The Crypton order only contains one superfamily of the same
name which contains elements that lack TIRs but generate TSDs upon insertion (10).
Subclass II elements are also divided into two orders: Helitron and
Maverick/Polintrons (10, 18). Both orders contain a single superfamily of the same
name. Elements in the superfamily Helitron are proposed to replicate via a rolling-circle
Donor Site with Class II element
Excision of TE
Recipient DNA with Class I element
Donor Site
Insertion into Different Site
Figure 2: Graphical representation of the transposition of Class II TEs. The TE is excised from its location and re-inserted elsewhere in the genome.
5
mechanism and do not generate TSDs (10). Alternatively, elements in the superfamily
Maverick/Polintron bear long TIRs and generate TSDs that are 6 bps in length (17-19).
1.2 Miniature Inverted Repeat Transposable Elements (MITEs)
Both class I and class II TEs contain autonomous and nonautonomous elements.
Autonomous elements are elements that encode the enzyme(s) necessary for their
transposition, while nonautonomous elements do not. Despite their differences,
autonomous and nonautonomous elements within the same superfamily may have
strong sequence similarity and often contain the same crucial characteristics required
for transposition (i.e. TIRs) (10). Some nonautonomous elements, such as the Dc
element, are generated by point mutations or deletions from the autonomous element,
rendering their transposase gene inactive, but maintaining enough sequence similarity
to be recognized by transposase produced by the autonomous element(s) (20).
Therefore, nonautonomous elements rely on transposases from autonomous TEs for
their transposition.
Miniature inverted repeat transposable elements (MITEs) are a type of
nonautonomous element that have TIRs and generate TSDs upon insertion. The first
MITE was discovered in maize while analyzing insertions in the waxy gene (21). The
MITE did not share sequence similarity with any known TE at the time and was present
in over 10 000 copies in the maize genome (22). MITEs are typically short (usually <500
bps in length), often located in or near genes (23-25) and are often found in high copy
numbers in the genomes in which they reside, despite lacking a transposase coding
sequence. Unlike other nonautonomous elements, the majority of MITEs are not
deletion derivatives of autonomous elements (26, 27). Two hypotheses exist to explain
6
the origin of MITEs: (a) a MITE arises from the fortuitous placement of TIR-like
sequences or solo TIRs that are recognized by an autonomous TE (28, 29) or (b) MITEs
are relics of past TEs whose autonomous elements have been degraded in the genome
or have not reached fixation within the population (27).
To date, MITEs have been found in organisms spanning all five kingdoms. They
are found in a diverse range of species, including Arabidopsis thaliana (30), Xenopus
laevis (31), Caenorhabditis elegans (32), Aedes aegypti (33), teleost fish (34), archaea
species (35) and humans (16, 36). In some species, MITEs make up a significant
portion of the genome. For example, rice (Oryza sativa) has a genome composed of
approximately 4% MITEs and MITE-derived sequences (37) and MITEs constitute 1-2%
of the C. elegans genome (38). Furthermore, approximately 16% of the yellow fever
mosquito’s (Aedes aegypti) total genome is composed of MITEs, the highest genome
percentage known so far (39).
1.3 Recently and Currently Active MITEs
In 2003, the first active MITE, named mPing, was identified in natural rice plants (40),
tissue culture (24), and plants derived from anther calli (23). It was later discovered that
mPing is active in plants derived from seeds treated with hydrostatic pressure (41) and
in recombinant inbred lines (42). In transgenic Arabidopsis plants and introgressed rice
plants, the transposase from Ping and Pong were demonstrated to mobilize mPing (42,
43). Although mPing is a deletion derivative of Ping, Pong encodes similar proteins to
Ping and is able to transpose mPing elements via cross-mobilization (24).
7
Since the discovery of mPing’s transposition activity, other active MITEs have
been identified. The MITEs dTstu1 and dTstu1-2 were shown to be active in potato
when a somaclonal variant, called Java kids purple (JKP), was generated from leaf
protoplast of the potato cultivar 72218. It was shown that dTsu1 excised from the
flavonoid 3’,5’-hydroxylase gene, thereby restoring the gene’s function and producing a
differently coloured tuber. Further investigation revealed that a dTstu1-like MITE,
dTstu1-2, was present in an allele in JKP, but was absent in every allele of the locus in
72218, indicating a new insertion event (44).
Similarly, the Arachis hypogaea MITE (AhMITE1) in the VL1 peanut mutant also
showed activity following stressful conditions to its host. When VL1 peanut mutants
were subjected to mutagenesis, the resulting plants differed phenotypically from VL1
mutants, in that they became resistant to late leaf spot (LLS) and susceptible to rust.
Molecular analysis showed that the phenotypic changes were due to the excision of
AhMITE1 from a pre-determined site. MITEs can be activated by mutagenesis (45) and
tissue culture stresses (23) and AhMITE1 follows this pattern in VL1 peanut mutant
plants.
Another known active MITE family, called mimp, was characterized in the
genome of the ascomycete fungus Fusarium oxysporum (46). The two subclasses of
mimp, referred to as mimp1 and mimp2, have 27 bp TIRs that share sequence similarity
to the autonomous element impala. Furthermore, both mimp and impala generate a
―TA‖ TSD upon insertion (47). Phenotypic assays that were performed to test the
functional link between impala and mimp showed that impala is responsible for mimp1
excision in different strains of F. oxysporum. Although the origin of mimp1 is still

8
unknown, it is speculated to either be a deletion derivative of impala or to have been
formed de novo (47).
Tc7 is a 921 bp MITE found in the genome of C. elegans (32). The terminal 38
bps of Tc7 have high sequence similarity to the terminal 38 bps of the autonomous
element Tc1. Like mimp and impala, Tc1 and Tc7 have the same TSDs (―TA‖). Using
Southern blotting, it was determined that Tc7 actively transposes in the germline of
mutator strains. Further analyses revealed that Tc1 is responsible for the transposition
of Tc7 and that Tc7 is not a deletion derivative of any known Tc1 element in C. elegans.
It was determined that Tc1 and Tc7 have similar transposition efficiencies and it is still
unclear why Tc7 copy numbers have not increased in mutator lines when Tc1 copy
numbers have (48).
In addition to MITEs that have been shown to be active, there are also MITEs
that are presumed to be currently or recently active. Most of these MITEs were
discovered using computational means and are predicted to be recently or currently
active based mostly on length and sequence conservation amongst members in the
genome. Recently active MITEs are highly homogenous in length and sequence,
especially in the TIRs and TSDs, as they have not yet accumulated mutations (49, 50).
For example, Nehza is thought to have recently transposed in the genomes of
Anabaena variabilis and Nostoc sp. Nehza is a MITE that is 132-171 bps in length, has
18bp TIRs, and generates 10 bp TSDs upon insertion. A total of eight copies of Nehza
in A. variabilis and two copies in Nostoc sp. are thought to have been recently active,
due to the highly conserved lengths and TIR sequences. Nehza is speculated to have
9
been cross-mobilized by the transposase ISNpu3 due to the fact that they share almost
identical TIR sequences (51).
Another family of MITEs, T2-MITEs, is speculated to be currently or recently
active in Xenopus tropicalis. TS clustering is a novel strategy that involves analyzing the
differences in short terminal sequences and can identify MITEs with weak TIR base-
matching. Using TS clustering, a total of 19 242 T2-MITEs were classified into 16 major
subfamilies. Analyses of subfamilies A1, B3 and C showed that they contained
members with highly conserved TSD sequences and contained completely identical
copies. Therefore, it was postulated that these subfamilies may be currently active or
recently active. However, no transposase source has been identified as being
potentially responsible for the transposition of T2-MITEs (52).
1.4 Elucidating how MITEs Achieve High Copy Numbers
Although MITEs do not encode a transposase enzyme, they are often found in high
copy numbers in the genomes which they reside. For example, in some rice strains
mPing can be present up to 1000-fold more than its autonomous partner Ping (25). It is
well-known that the DNA structure of MITEs plays a key role in their transposition.
Studies have shown that TIRs are extremely important in transposition, as they are
recognized and bound by transposase enzymes (53–59). However, the mechanism
through which MITEs achieve such high copy numbers, despite lacking a transposase
coding region, was unknown until recently.
In 2009, a breakthrough study by Yang and colleagues suggested mechanisms
that may explain why MITEs are so successful in achieving high copy numbers in

10
genomes. Rice Mariner-like transposons, called Osmars, were predicted to be the
transposase source of Stowaway MITEs (called Ost5, Ost8, etc.) in rice due to similar
TIR sequences and the same TSD sequence. To test this, a yeast assay was performed
in which two plasmids were co-transformed into yeast cells. One plasmid contained the
transposase source, while the other plasmid contained an ade2 gene interrupted by a
MITE. Transposition of the MITE was detected based on the recovery of the ADE2 gene
when yeast cells were plated on media lacking adenine (60).
In this study, six of the seven Osmar transposases showed activity, with the
highest excision frequency occurring between the Osmar14 transposase (Osm14) and
the Stowaway MITE Ost35. Site-directed mutagenesis of the elements revealed that the
Ost35 MITE contains multiple motifs throughout its internal region that promotes
excision by transposase. Surprisingly, the Osm14 3’ subterminal region contains a
repressive motif that dramatically decreases transposition efficiency (60).
It has been postulated that class II elements persist in genomes across
generations via the relaxation of transposase-DNA binding specificity, thereby softening
the effect of detrimental mutations (27, 61, 62). This theory is supported by the fact that
Osmar transposases are able to cross-mobilize distantly related elements and have
weak DNA-transposase binding specificity (60, 63). Therefore, MITEs may parasitize
these transposases and increase their copy numbers through internal enhancement
motifs, thereby ensuring their persistence in the genome.

11
1.5 Significance of TEs
In the past, TEs were considered to be ―parasitic‖ DNA that invaded genomes through
transposition (64). However, continual analyses of genomes began to shed light on the
prevalence of TEs across multiple organisms and their influence in these genomes.
Despite the improved understanding of TEs since their discovery, it still remains unclear
to what extent they contribute to genome diversity, evolution, and complexity.
The fact that TEs were once considered parasitic is not surprising, considering
that TE proliferation and transposition have the potential to cause harmful effects on
genomes. TEs are capable of causing mutations either by inserting themselves into
genes, or by their imprecise excision from genic regions, leaving what is known as a TE
―footprint‖. For example, the insertion of a P element and copia element into the white
locus in D. melanogaster resulted in a white eye phenotype, reflecting a lack of
pigmentation (65). Furthermore, TE transposition can affect the host at a genome-wide
level. For example, in D. melanogaster larvae, the excision of P elements can cause
massive chromosome breakage, thought to result in temperature-dependent lethality
and sterility (66). However, although mutations induced by TEs can be harmful, it has
also been suggested that these TE-induced mutations can benefit populations through
increased mutation rates, thereby enhancing adaptation to different environments (67).
Despite the harmful effects that TEs may have on their host, there are also
examples of TEs providing direct benefits to their hosts. In D. melanogaster, for
example, certain class I elements have adopted a role similar to that of telomerases.
The transposition of these class I elements, such as HET-A and TART, replaces
damaged chromosome ends thereby maintaining constant chromosome size (68–70). It
12
has also been suggested that endogenous class I elements may play a role in repairing
double-strand chromosome breaks through reverse transcriptase-mediated events (67,
71, 72).
In shaping the biological properties of the organisms that carry them, TEs can be
useful tools for biotechnological applications such as insertional mutagenesis,
transgenesis, and phylogenetic markers (6, 73–75). Even though TEs were discovered
over 60 years ago in the maize genome, active TEs are continually being discovered
and characterized. Active TEs are at the core of TE-derived genome evolution and can
result in an increase in genome size (76), chromosomal rearrangements (66, 77, 78),
and disrupting or altering gene expression (65, 79–86). Therefore, in-depth
investigations of TEs that are potentially and currently active at genome-wide scales
and the consequences of their activity are critical to understanding genome evolution.
13
Chapter 2 Elucidating the Transposase Sources for the Transposition of hAT
MITEs
2 Introduction to hAT TEs
The first TE ever discovered was the Ac element in maize, which belongs to the hAT
superfamily of TEs (87). The class II hAT superfamily is so named after the hobo
elements in Drosophila melanogaster, Activator (Ac) elements in maize, and Tam3
elements in Antirrhinum majus (88–90). hAT TEs are present in the genomes of a
variety of organisms including plants, mammals, fungi, amphibians, nematodes and fish
[see (91) for review]. Furthermore, hAT TEs are also found in humans, where they are
the most abundant class II TE, comprising approximately 195 Mb of the human genome
(92).
hAT TEs have also undergone molecular domestication, a process defined as a
TE-derived coding sequence resulting in a functional host protein (93). For example, a
gene in A. thaliana is derived from the transposase sequence of the hAT TE,
Daysleeper, and is speculated to act as a transcriptional regulator that is necessary for
plant development (94). Similarly, the DREF gene in D. melanogaster is a chimeric
gene that recruited a transposase DNA-binding domain from a hAT TE. The DREF gene
is involved in multiple cellular activities in D. melanogaster including DNA replication,
cell growth and differentiation (95, 96).
The elements in the hAT superfamily are characterized by generating 8 bp TSDs
upon insertion and having 5-27 bp TIRs, with limited interfamily sequence similarity (97).
Furthermore, both autonomous and nonautonomous elements are found in the hAT
14
superfamily. For autonomous hAT elements, the transposases have four amino acid
motifs: a zinc finger domain near the N-terminus; a DNA-binding domain; a catalytic
domain; and an insertion domain (88, 98–100). The end region of the catalytic domain is
often referred to as the hAT dimerization domain, as it is commonly conserved in hAT
transposases and plays a role in oligomerization. However, crystal structure analyses of
a hAT transposase suggest that multiple regions may be involved in oligomerization
(100).
Recent evidence suggests that the hAT superfamily can be divided into two
families of TEs based on transposase sequences and target-site selection: the Ac family
and the Buster family. The majority of members in the Ac family have a consensus TSD
sequence of 5’-nTnnnnAn-3’. In contrast, members of the Buster family have a TSD
consensus sequence of 5’-nnnTAnnn-3’. The most significant amino acid variation
between the two families lies in the DNA-binding and insertion domains (101).
TEs are a major contributing factor to the variability and biodiversity of insect
populations [see (102) for review]. The yellow fever mosquito, A. aegypti, is commonly
found in close proximity to human populations and is a major vector of yellow fever,
dengue fever, and chikungunya fever (103–105). Approximately 30,000 people die
every year in Africa and South America as a result of yellow fever (104). In 2007, the A.
aegypti genome was sequenced, revealing that approximately 47% of the genome is
composed of TEs (39). A total of 21 MITE families are present in the A. aegypti genome
related to the hAT superfamily (39). Uncovering which transposases are involved in the
activity of hAT MITE members could elucidate the mechanisms involved in the evolution
and biodiversification of the A. aegypti genome.

15
3 Methods
3.1 Determining and Cloning hAT MITEs
In order to identify hAT MITEs present in the A. aegypti genome, the bioinformatics tool
MAK was used (106). The Member function of MAK was run using the consensus
sequences of all 21 hAT MITE families from TEfam (http://tefam.biochem.vt.edu) as a
query database (39) (Supplementary Table 1). The output of the Member function
consisted of the nucleotide sequences of every member of each MITE family present in
the A. aegypti genome. A ClustalW alignment was performed for all the members of
each MITE family and a 90% consensus sequence was generated (107). Primers were
designed using the consensus sequence to amplify MITEs for each family
(Supplementary Table 2). Due to mutations in TIR sequences amongst members of
certain MITE families, more than one set of primers was often needed.
The A. aegypti genomic DNA was extracted using the protocol described in
Rivero et al. (2004) with the following modifications: a fresh pupa was used instead of
an adult mosquito; samples were incubated at 55ºC for 4 hours after protease addition;
the suspensions were extracted with a single phenol-chloroform step; and no RNAse
was added (108). PCR was carried out using Pfu DNA polymerase (Fermentas Life
Sciences, Burlington, ON), each primer set, and A. aegypti genomic DNA as a template
[95˚C, 5 min.; 35X (95˚C, 30 sec.; 57˚C, 30 sec.; 72˚C, 1 min.); 72˚C, 5 min.]. MITEs
were phosphorylated using T4 Polynucleotide Kinase (NEB, Pickering, ON) and were
column-purified (Sigma-Aldrich, Oakville, ON). The donor plasmid used for cloning the
MITEs has an ade2 gene that contains an HpaI site (Figure 3). The plasmid was digested
with HpaI restriction endonuclease (NEB) at 37˚C for 3 hours, followed by
16
dephosphorylation using Antarctic Phosphatase (NEB) and column-purification (Sigma).
Ligation was performed using T4 DNA Ligase (NEB) and left overnight in an ice-water
bath. Following ligation, the plasmids containing MITEs were transformed into
Escherichia coli strain DH5α. The presence of the insert was verified through enzyme
digestion and sequencing.
3.2 Finding TEs using a Top-Down Approach
The Topdown function of MAK finds deletion derivative elements and MITE-sized
elements with similar TIR sequences and the same-sized TSDs to a query sequence.
Topdown was run using the DNA sequences of each hAT transposase-coding
candidate as a query sequence (E-value: 0.1)(106). To check for novel sequences, a
Figure 3: Illustration of donor plasmid. Amp, ampicillin resistance gene; ARS1, autonomous replications sequence 1; OriEC, E. coli replication origin; CEN4, centromere of yeast chromosome 4. Illustration adapted from Yang et al. (2009).
17
BLASTn search (E-value: 10) was performed using the output of Topdown as query
sequences and all known hAT MITE members in A. aegypti (see Section 3.1:
Determining and Cloning hAT MITEs) as the database sequence. The results were
manually inspected for sequence similarities.
The Topdown output from each hAT transposase-coding candidate (referred to
as a hATTE family) was aligned and output sequence files were separated into
subfamilies based on sequence similarity in the internal regions. Redundant sequences
were removed. A 51% consensus sequence was generated for each hATTE family and
subfamily. To determine whether the hATTE families have been previously described, a
BLASTn search (E-value: 10) was performed using the consensus sequences and the
DNA sequences of all known hAT TEs in A. aegypti (109). The results were manually
inspected for matching sequences.
To retrieve all the members of each hATTE family, MAK’s Member function was
run using the consensus sequences as query sequences and the A. aegypti genome as
the database (e-value: 0.1)(106). Furthermore, to check whether TE families contained
members that are deletion derivatives of other TEs, a TBLASTX was performed using
the consensus sequences as query sequences against the NCBI nr database (E-value:
10)(109). Sequences with results containing the words ―transposon‖, ―transposable
element‖, and/or ―transposase‖ were manually inspected for sequence similarities to the
TE family/subfamily consensus sequence.
18
3.3 Determining Candidate Transposases for the Transposition of hAT MITEs
3.3.1 Retrieving All Putative hAT Transposases
The first step in elucidating whether transposases in the A. aegypti genome are
responsible for the transposition of hAT MITEs is to identify all putative transposase
sequences. To do this, the Anchor function in MAK (106) was run using a protein
database compiled from known hAT transposase amino acid sequences from Repbase
(110) and a DNA database compiled from known hAT MITE family consensus
sequences in the A. aegypti genome (http://tefam.biochem.vt.edu) as the query
sequences (39). The Anchor function searches for elements longer than the queried
MITE sequence that share TIR and subterminal sequence similarity to the MITE. The
resulting output contains putative autonomous elements of the queried MITE that have,
or had, coding capacity. The TP_TE function was also run using the same protein
database as described above. The TP_TE function searches for DNA sequences that
encode proteins that share sequence similarity to the queried transposase protein
database.
For each output sequence, both Anchor and TP_TE search for the flanking 8 bp
nucleotides and generate a difference value, reflecting the percentage of nucleotides
that are different between the 3’ and 5’ 8 bp flanking sequences for each output
sequence. To narrow down the output from Anchor and TP_TE, all output transposase
sequences that had a difference lower than 50% and 12.5% were removed from the
output, respectively. Redundant copies of transposases in the output were also
removed.

19
3.3.2 Identifying Recently Active Putative Transposases
The best candidate transposases responsible for cross-mobilizing recently active MITEs
are TEs that were also recently active. TEs that were recently active frequently have
highly conserved copies in a genome. Therefore, all output sequences were aligned
against each other using ClustalW (107). Afterwards, an unrooted neighbor-joining
phylogenetic tree was generated. Clades with highly conserved sequences were
identified from the tree and a representative from every clade that contained highly
conserved copies was selected with manual inspection.
3.3.3 Linking hAT MITEs with Putative Transposases
Since transposase proteins recognize and bind to the end sequences of TEs during
transposition (111), the DNA sequences of the transposases-coding elements whose
ends had the highest similarity to the MITE ends were also retrieved. To do this, 29 bps
from the 3’ and 5’ ends of each transposase-coding sequence in the TP_TE and Anchor
output, as well as from each MITE family (Supplementary Table 1) were isolated. These
end sequences were aligned using ClustalW and were manually inspected for high
sequence similarity between putative TEs encoding transposases and MITE families
(107).
3.3.4 Identifying Coding Sequences of Putative hAT Transposases
BLASTx was performed using the DNA sequences of putative TEs encoding hAT
transposases with highly conserved copies and those with similar ends to hAT MITE
families as the query sequences and the amino acid sequences of all known hAT
transposases as the search database (109, 110). The BLASTX results were manually
inspected for any conserved regions between the translated nucleotides and the hAT
20
proteins. The translated nucleotide query sequences with long matching stretches (>150
amino acids) to the hAT proteins were manually annotated as follows: (a) the matching
regions between the putative transposase and hAT protein were considered putative
exons; (b) DNA sequences between putative exons were inspected for a GT-AG
boundary, to define introns (112, 113); (c) the first and last exons were inspected for the
presence of start and stop codons, respectively; (d) finally, the putative transposase
sequences were inspected for mutations causing frame shifts and stop codons.
Sequences with mutations causing truncated protein-coding regions were repaired to
make a full-length coding sequence. The putative hAT transposase sequences with
coding sequences that had the least number of mutations and 100% identical 5’ and 3’
TSD sequences are referred to as hATTPases.
3.3.5 Phylogenetic and Conserved Domain Analysis of Known and Putative hAT Transposases
The software used to search for conserved domains was Batch Web CD-Search Tool,
with default parameters (Search against database: CDD; E-value: 0.01; Maximum
number of hits: 500; Low complexity filter) (114).
The copies of putative transposases were found by performing a BLASTn search
against the whole-genome shotgun reads database, using the nucleotide sequence of
each transposase as the query sequence (109). The BLASTn results were manually
inspected and sequence hits with an E-value of 0.0 and with query coverage >85%
were chosen as copies. A neighbor-joining tree was generated using MEGA version 5
using default parameters (115).

21
Two databases were used to make the maximum-likelihood trees: (i) all amino
acid sequences of the annotated hATTPases and (ii) all amino acid sequences of the
annotated haTTPases and the amino acid sequences of the transposases used in
Arsenburger et al. (2011) (see Supplementary Figure 1). Both databases were aligned
using the program M-Coffee (116). Each database was used as input for the program
ProtTest 3 (117) to identify the best amino acid substitution matrix for phylogenetic
analysis. ProtTest 3 produced the following results: Blosum62 with a gamma shape and
invariant sites; and WAG with a gamma shape, and among-site rate variation, for
databases (i) and (ii), respectively. The aligned databases were then used to make
phylogenetic trees using TREE-PUZZLE 5.2 based on the maximum-likelihood
optimality criterion (50% majority rule consensus) (118).
The 8 bp TSD sequences from each hATTPase and their copies were manually
isolated. Sequence frequency logos were generated using WebLogo (119).
3.4 Synthesizing and Cloning of Transposases
PCR-based gene synthesis methods were used to synthesize and clone the putative
transposases (120). Primers were designed to flank the coding regions of the candidate
transposases (Supplementary Table 3). An additional six nucleotides and a restriction
enzyme site were incorporated into the flanking regions of the outermost primers. For
transposases with multiple exons, primers were designed with an overlapping region
corresponding to neighboring exons (Figure 4).
PCR was carried out using iProof High-Fidelity DNA Polymerase (Bio-Rad,
Mississauga, ON) from A. aegypti genomic DNA [98˚C, 2 min; 35X (98˚C,10 sec.; 57˚C,

22
30 sec.; 72˚C, 45 sec.); 72˚C, 5 min.]. For transposases with multiple exons, each exon
was run on a 1% agarose gel via agarose gel-electrophoresis and gel-extracted
(Qiagen, Valencia, CA). Exons were joined using PCR [98˚C, 2 min.; 10X(98˚C ,10 sec.;
45˚C, 30 sec.; 72˚C, 30 sec.); 30X(98˚C, 10 sec.; 57˚C, 30 sec.; 72˚C for 45 sec-2 min.);
72˚C for 5 min.]
Once the full coding sequence of the transposase was synthesized, the
fragment was gel-extracted (Qiagen). The ends of the transposase, as well as the
transpososase source plasmid, were digested using the appropriate restriction enzymes
for 3-4 hours at 37ºC (Figure 5). After digestion, the products were column-purified
(Sigma). Once the transposase coding sequence was cloned into the plasmid,
transformation, ligation and verification were performed as described above (Section
3.1: Determining and Cloning hAT MITEs ). If the transposase sequence had single
Figure 4: An illustration of the primers designed for a hypothetical hAT transposase with two exons and one intron. Green arrows, primers corresponding to exon #1; orange arrows, primers corresponding to exon #2; TGATCA, SpeI site; GTCGAC, SalI site.
23
nucleotide point mutations, it was repaired with PCR-based gene synthesis using
primers bearing the correct sequence.
3.5 Yeast Excision Assays
To make yeast competent cells (Strain DG2523) for transformation, a yeast colony was
inoculated in 5 mL of YPD broth at 30ºC with shaking overnight until a 1:10 dilution of
the culture reached an OD600 of 0.2-0.4. The culture was transferred to 50 mL of YPD
with a starting OD600 of 0.2 and incubated with shaking at 30ºC until an OD600 of 0.5-0.8
was reached. Cells were pelleted by centrifugation for 5 min. at 4000rpm. The
supernatant was discarded and the pellet was resuspended in 25 mL of sterile water.
Figure 5: Illustration of transposase source plasmid. Amp, ampicillin resistance gene; ARS H4, autonomous replication sequence of H4 gene; CEN6, centromere of yeast chromosome 6; cyc1 ter, termination of yeast cyclin gene cyc1; OriEC, E. coli replication origin; Pgal1, yeast gal1 promoter. Illustration adapted from Yang et al. (2009).
24
Cells were pelleted by centrifugation for 5 min. at 4000rpm. The supernatant was
discarded and the pellet was resuspended in 1 ml of 100 mM lithium acetate. Cells were
pelleted by centrifugation for 2 min. at 7000rpm. The supernatant was discarded and
the cells were resuspended in 450 μL of 100 mM lithium acetate [adapted from (121)].
The co-transformation of yeast cells using a transposase and MITE plasmid were
executed as follows: 25 μL of yeast competent cells were mixed with 2.9 μL of carrier
DNA (salmon sperm, 5 mg/mL), 60 ng of transposase vector, 60 ng of pooled MITE
vectors, and 200 μL of PEG buffer (40% PEG, 100 mM LiAc, 10 mM Tris-pH 8.0, 1 mM
EDTA). Tubes were incubated at 42ºC for 45 min. The cells were pelleted by
centrifugation at 7000 rpm for 20 sec. and the supernatant was discarded. Cells were
re-suspended in 50 μL of sterile water and were plated on media lacking histidine and
uracil [adapted from (121)]. Plates were incubated at 30˚C until colonies formed and
then placed at room temperature. After approximately 2 weeks, the colonies were
either: (i) streaked on media lacking adenine or (ii) inoculated in 2 mL of media lacking
histidine and uracil at 24ºC or 30ºC for approximately a week and plated on media
lacking adenine. The plates with media lacking adenine were incubated at 30ºC and
inspected regularly for colony formation.
For a positive control, yeast colonies were co-transformed with two plasmids
(abbreviated pOst35 and pOsm14Tp) which contain the MITE Ost35 and the
transposase Osm14 from rice. These elements were previously shown to undergo
transposition in the same yeast assay (60). For the negative control, yeast cells were
co-transformed with the pOst35 and an empty transposase source plasmid.
25
4 Results
4.1 Computational Analyses
4.1.1 Finding MITE Members Belonging to the hAT Superfamily of TEs
A total of 5,026 members were retrieved from the MAK Member function. A summary of
each hAT MITE family is described in Table 1. The hAT MITE family TF000576 has the
most MITE members, with a total of 526 retrieved; the hAT MITE family TF000720 has
the least, with only five complete members retrieved. TF000715 has 39 clades with
identical members, the most of any hAT MITE family. The highest number of identical
sequences in a single clade varies between two to six for most hAT MITE families.
However, the hAT MITE family TF000708 has a single clade with 25 identical members.
26
Table 1: Summary of output retrieved from MAK’s Member function.
4.1.2 Finding TEs Encoding Putative hAT Tranposases
Collectively, the output from both the Anchor and TP_TE functions resulted in an output
of approximately 5,000 DNA sequences of putative TEs encoding transposases (Error!
Reference source not found.A). After the output from Anchor and TP_TE was
processed by removing redundant sequences and sequences that had high difference
values (as described in Methods: Section 3.2.1), approximately 400 putative
MITE Family # Members # Clades with Identical
Members
Highest # of Identical Sequences in a Single
Clade
TF000722 5 1 2
TF000576 526 23 3
TF000700 253 19 6
TF000703 197 12 6
TF000706 243 3 2
TF000708 287 23 25
TF000714 256 2 2
TF000715 275 39 4
TF000717 230 6 3
TF000718 280 16 3
TF000719 234 8 3
TF000720 295 7 2
TF000724 250 3 3
TF000725 272 7 2
TF001258 240 2 2
TF001274 175 1 2
TF001275 249 4 4
TF001302 248 16 5
TF001310 187 1 2
TF001312 68 3 2
TF001332 256 3 6

27
transposase sequences remained (Error! Reference source not found.B). These
results were further narrowed down by isolating the sequences with ends matching best
to known hAT MITE ends (Error! Reference source not found., I & ii) and by isolating
representative sequences with identical copies (Error! Reference source not found.,1
& 2). To select the best candidate TEs for encoding a hAT transposase, a BLASTX
search was performed against known hAT transposases (Error! Reference source not
found.C). The sequences that encoded amino acid sequences similar to known hAT
transposases were isolated, resulting in a total of 56 putative transposase sequences
(Error! Reference source not found.D). The TSDs on the 5’ and 3’ ends of a
sequence are typically identical. To refine the search, sequences with non-identical
predicted TSD similarity were removed, resulting in a total of 23 sequences (Error!
Reference source not found.E), referred to hereafter as hATTPases. A summary of
the 23 hATTPases is shown in Error! Reference source not found.. Based on the
manual annotation of the hATTPases and their similarity to hAT MITE ends, 14
hATTPase sequences were selected as candidates for experimental analyses (Error!
Reference source not found.F).

28
~5000 Sequences
56 Sequences
23 Sequences (hATTPases)
14 Sequences
Choose sequences with best annotations and
highest simialrity to MITE ends for experimental
analyses
A
~400 Sequences
B
i
D
E
F
C
Manually inspect TSDs and remove all sequences
whose TSDs are not 100% identical
Annotate
Anchor and TP_TE output
Remove redundant sequences and sequences with
high flanking sequence difference values
2
BLASTX all Sequences against
known hAT Transposases
Isolate candidates from clades
with highly conserved
sequences
Make tree
Align sequencesIsolate 3' and 5' ends from
sequences and hAT MITE
Align sequences
Isolate putative transposases
whose ends had highest
similarity to MITES
1
ii
Figure 6: A schematic representation of how the best candidate hAT transposase sequences were selected.
29
Table 2: A summary of the 23 hATTPases. Their accession and position in the A. aegypti genome is shown, along with their size in bps and TSD sequence.
Name Accession Position Size (bps) TSD Sequence TIR Sequence
hATTPase1 AAGE02006152 156325-159177 2853 GTGCCAAA TAGAGATGGGCAA
hATTPase2 AAGE02007824 63758-61110 2649 AGCTATTC CATAGGTTCCCAAACT
hATTPase3 AAGE02008188 229621-235662 8640 TGTAGATC CAGCGGTTCTCAACC
hATTPase4 AAGE02024413 240837-243635 2799 ATCTATGG CATAGATTCCCAAACT
hATTPase5 AAGE02020453 22912-17960 4953 CTGACACC CAGGGTTGCCACAT
hATTPase6 AAGE02025054 115298-110670 4629 TCTTGCAT CAGTGTTGCCACA
hATTPase7 AAGE02025133 41412-46897 5486 CCAGCGAC CAGGCATGGGAAAAATCA
hATTPase8 AAGE02027653 3714-1092 2623 TTTCCTTT TAGAGTTTTCAAT
hATTPase9 AAGE02008109 14028-20984 6957 GTGTCCAG TAGGGTGCCAATG
hATTPase10 AAGE02001552 30277-27718 3141 AAAACTGA TAGAGTGTCCA
hATTPase11 AAGE02015151 3178-5661 2484 AAAGATGA CAGAGGCGTCGCGT
hATTPase12 AAGE02025302 26720-29860 3141 GCCAGAGG CAGTGTTGCCACA
hATTPase13 AAGE02004541 52790-55376 2487 CTTTAGGG CAGTGTTTCCCAAA
hATTPase14 AAGE02005240 26023-29480 3558 AACAAGAA CAGGGTTGTTAACGTTAATCAACG
hATTPase15 AAGE02012529 17071-13588 3484 GTTTGTTC CAGAGGCGTCGCGT
hATTPase16 AAGE02009227 30394-27825 2570 GATTAGAC CAGTGTTTCCC
hATTPase17 AAGE02019027 5371-8562 3192 TGTAGAAC GCAGTGGTGCT
hATTPase18 AAGE02015586 48794-46395 2400 GTTTACAT CAGTGGTGCTCA
hATTPase19 AAGE02005137 18241-20625 2385 CTCTACCA CAGTGGTGCTCA
hATTPase20 AAGE02020255B 82631-85714 3084 TACCATTC CAGAGGCGTCGCGT
hATTPase21 AAGE02013260 122701-128987 6277 TTGTTTAT TAGGGTGCCAATGAAA
hATTPase22 AAGE02022847 30976-33727 2752 GTGTGCGC TAGGCCGTCCCTTATTTTTCCAAATTT
hATTPase23 AAGE02003553 22957-20517 2441 AAATAAAT CAGTGGTGCTCA

30
4.1.3 Analysis of hATTPases and their copies in the A. aegypti genome
To better understand the relationships between the hATTPases, their DNA sequence
copies were aligned and a neighbor-joining tree was generated (Figure 7). hATTPase10
has the most copies in the A. aegypti genome of an element that encodes a full or
partial hAT transposase, with a total of five. Some hATTPases are present in a single
copy in the A. aegypti genome, such as hATTPase5, hATTPase3, and hATTPase22.
Furthermore, a maximum-likelihood tree was generated using the amino acid
sequences of every annotated hATTPase (Figure 8). Interestingly, four distinct clades
are evident in the tree. Clades I and IV are highly supported, with node values of 95 and
96, respectively; while clades II and III have weaker support with node values of 73 and
69, respectively.
31
AAGE02005313
AAGE02005388
hATTPase10
AAGE02005396
AAGE02004097
hATTPase8
AAGE02017306
hATTPase5
hATTPase1
AAGE02014391
AAGE02009620
hATTPase11
hATTPase15
hATTPase20
AAGE02003016
AAGE02000252
hATTPase7
AAGE02021183
hATTPase3
hATTPase4
AAGE02001305
hATTPase2
AAGE02024385
AAGE02001290
hATTPase22
hATTPase21
hATTPase9
AAGE02022887
hATTPase13
hATTPase16
hATTPase6
hATTPase12
AAGE02001220
hATTPase14
AAGE02014073
hATTPase17
hATTPase19
hATTPase18
AAGE02002382
hATTPase23
AAGE02003553
Figure 7: A neighbor-joining tree of the DNA sequences of hATTPases and their copies.

32
hATTPase6
hATTPase12
hATTPase5
hATTPase19
hATTPase23
hATTPase18
hATTPase17
hATTPase13
hATTPase16
hATTPase2
hATTPase4
hATTPase3
hATTPase15
hATTPase20
hATTPase11
hATTPase8
hATTPase10
hATTPase7
hATTPase1
hATTPase14
hATTPase9
hATTPase21
hATTPase22
98
95
96
100
98
81
61
86
73
99
97
91
69
69
100
93
Figure 8: A maximum likelihood phylogenetic tree of the 23 hATTPase transposase amino acid sequences (50% majority rule consensus). Numbers next to the nodes show quartet puzzling reliability based on 10,000 puzzling steps, a measure of nodal support similar to bootstrapping that is produced by TREE-PUZZLE
I
II
III
IV
33
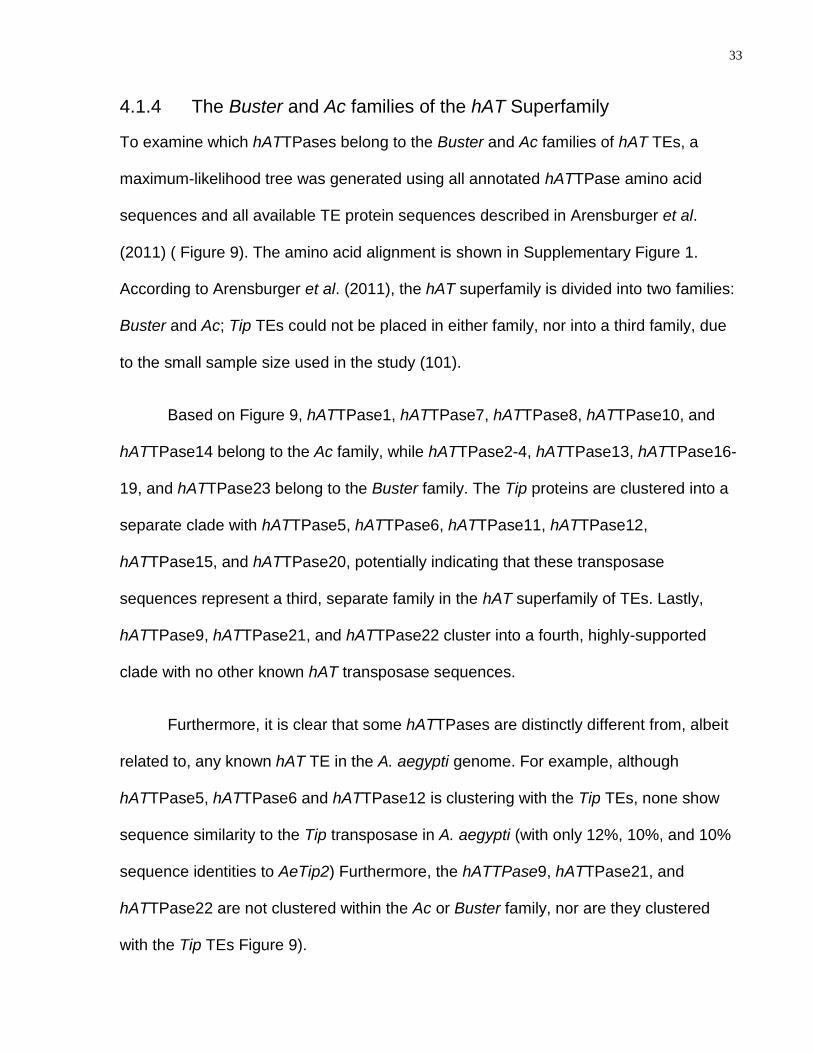
4.1.4 The Buster and Ac families of the hAT Superfamily
To examine which hATTPases belong to the Buster and Ac families of hAT TEs, a
maximum-likelihood tree was generated using all annotated hATTPase amino acid
sequences and all available TE protein sequences described in Arensburger et al.
(2011) ( Figure 9). The amino acid alignment is shown in Supplementary Figure 1.
According to Arensburger et al. (2011), the hAT superfamily is divided into two families:
Buster and Ac; Tip TEs could not be placed in either family, nor into a third family, due
to the small sample size used in the study (101).
Based on Figure 9, hATTPase1, hATTPase7, hATTPase8, hATTPase10, and
hATTPase14 belong to the Ac family, while hATTPase2-4, hATTPase13, hATTPase16-
19, and hATTPase23 belong to the Buster family. The Tip proteins are clustered into a
separate clade with hATTPase5, hATTPase6, hATTPase11, hATTPase12,
hATTPase15, and hATTPase20, potentially indicating that these transposase
sequences represent a third, separate family in the hAT superfamily of TEs. Lastly,
hATTPase9, hATTPase21, and hATTPase22 cluster into a fourth, highly-supported
clade with no other known hAT transposase sequences.
Furthermore, it is clear that some hATTPases are distinctly different from, albeit
related to, any known hAT TE in the A. aegypti genome. For example, although
hATTPase5, hATTPase6 and hATTPase12 is clustering with the Tip TEs, none show
sequence similarity to the Tip transposase in A. aegypti (with only 12%, 10%, and 10%
sequence identities to AeTip2) Furthermore, the hATTPase9, hATTPase21, and
hATTPase22 are not clustered within the Ac or Buster family, nor are they clustered
with the Tip TEs Figure 9).

34
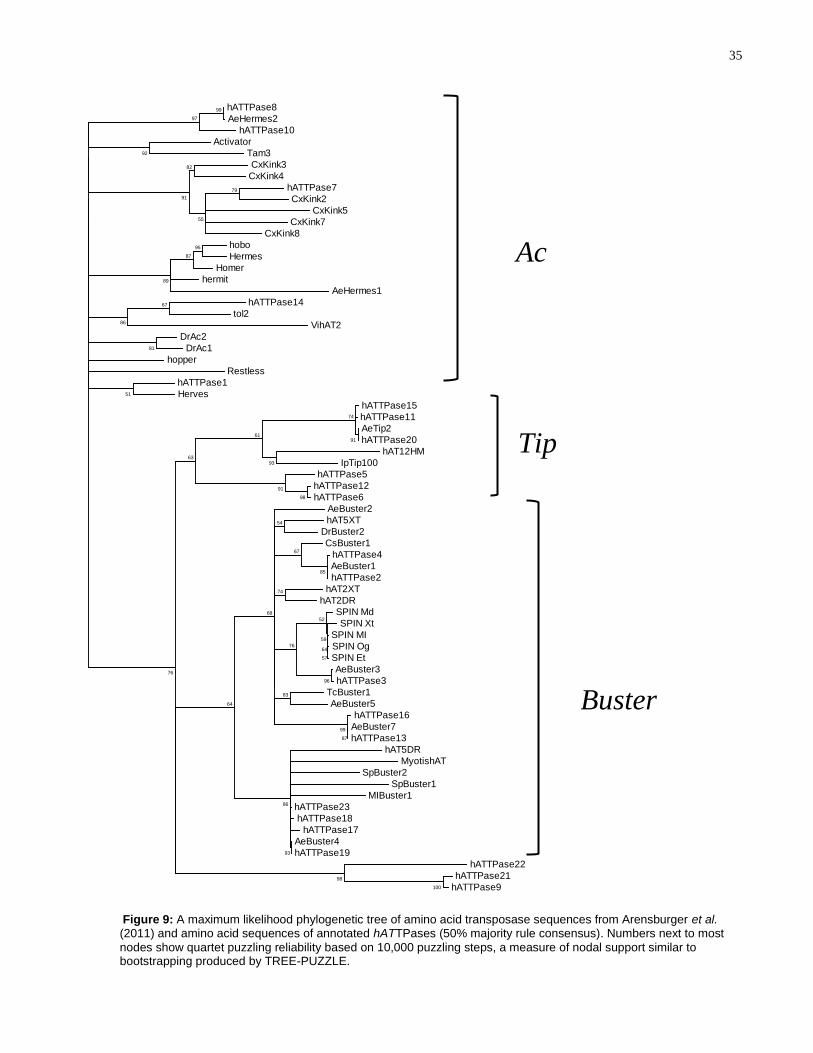
The Buster and Ac families of hAT TEs have TSD consensus sequences (101).
To determine whether the TSDs of the hATTPases and their copies share the same
consensus sequences as their respective families, sequence frequency logos were
generated (119). The hATTPases were separated into Buster and Ac families based on
the clustering shown in Figure 9. As seen in the sequence frequency logos, the majority
of the TSD sequences belonging to the Buster family have a ―T‖ at position 4 and ―A‖ at
position 5, as expected. Furthermore, the majority of the TSD sequences belonging to
the Ac family have a ―T‖ at position 2. However, although the majority of TSDs also
have an ―A‖ at position 7, ―G‖ also occurs frequently at that position (Figure 10).
35
Figure 9: A maximum likelihood phylogenetic tree of amino acid transposase sequences from Arensburger et al. (2011) and amino acid sequences of annotated hATTPases (50% majority rule consensus). Numbers next to most
nodes show quartet puzzling reliability based on 10,000 puzzling steps, a measure of nodal support similar to bootstrapping produced by TREE-PUZZLE.
hATTPase8
AeHermes2
hATTPase10
Activator
Tam3
CxKink3
CxKink4
hATTPase7
CxKink2
CxKink5
CxKink7
CxKink8
hobo
Hermes
Homer
hermit
AeHermes1
hATTPase14
tol2
VihAT2
DrAc2
DrAc1
hopper
Restless
hATTPase1
Herves
hATTPase15
hATTPase11
AeTip2
hATTPase20
hAT12HM
IpTip100
hATTPase5
hATTPase12
hATTPase6
AeBuster2
hAT5XT
DrBuster2
CsBuster1
hATTPase4
AeBuster1
hATTPase2
hAT2XT
hAT2DR
SPIN Md
SPIN Xt
SPIN MI
SPIN Og
SPIN Et
AeBuster3
hATTPase3
TcBuster1
AeBuster5
hATTPase16
AeBuster7
hATTPase13
hAT5DR
MyotishAT
SpBuster2
SpBuster1
MIBuster1
hATTPase23
hATTPase18
hATTPase17
AeBuster4
hATTPase19
hATTPase22
hATTPase21
hATTPase9
99
97
92
82
79
55
91
95
87
89
67
86
81
51
100
98
93
86
87
99
83
96
57
64
59
52
76
74
85
67
54
68
64
98
91
93
91
74
61
63
76
Ac
Tip
Buster
36
Figure 10: Sequence frequency logos of the TSD sequences for hATTPases and their copies belonging to the Buster and Ac families.
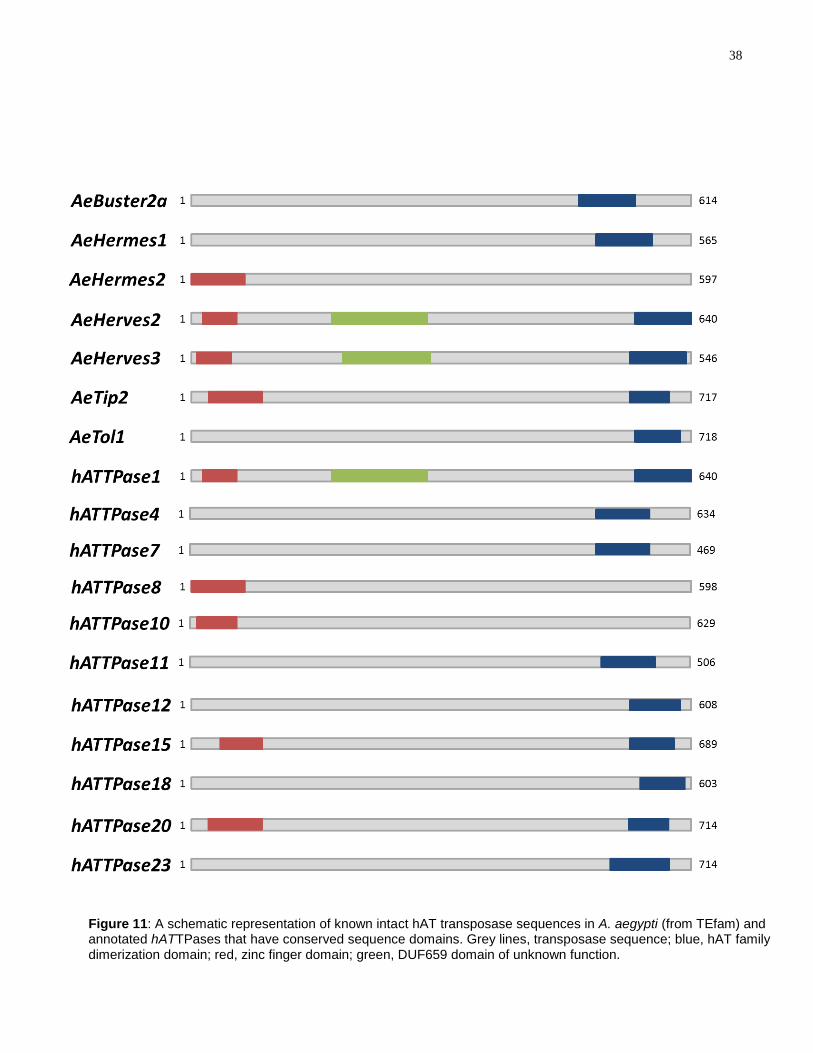
4.1.5 Conserved Domains in Known and Putative Transposase Sequences in the A. aegypti genome
There are currently 14 known hAT TEs in the A. aegypti genome that encode a
hAT transposase sequence, 10 of which encode intact transposase proteins
(http://tefam.biochem.vt.edu). The 10 intact sequences were analyzed for conserved
domains, to see which domains are common across known hAT transposase
sequences in the A. aegypti genome (Figure 11). Only 6 of the intact transposases have
hAT family dimerization domains and 4 have zinc finger domains. Two of the intact
transposases, AeHerves2 and AeHerves3, have a transposase domain of unknown
function called the DUF659 domain. This domain is also found in the harrow TE in
Drosophila (122).
Ac
Buster
37
The same conserved domain search was performed for all 23 annotated
hATTPase sequences. hATTPase1 has three domains: zinc finger, hAT family
dimerization and DUF659. hATTPase4, hATTPase7, hATTPase11, hATTPase12,
hATTPase18, and hATTPase23 have the hAT family dimerization domain while
hATTPase8, hATTPase10, hATTPase15 and hATTPase20 have the zinc finger domain.
The rest of the hATTPases--hATTPase2, hATTPase3, hATTPase5, hATTPase6,
hATTPase9, hATTPase13, hATTPase14, hATTPase16, hATTPase17, hATTPase19,
and hATTPase21—do not have any apparent conserved domains.
38
Figure 11: A schematic representation of known intact hAT transposase sequences in A. aegypti (from TEfam) and annotated hATTPases that have conserved sequence domains. Grey lines, transposase sequence; blue, hAT family dimerization domain; red, zinc finger domain; green, DUF659 domain of unknown function.

39
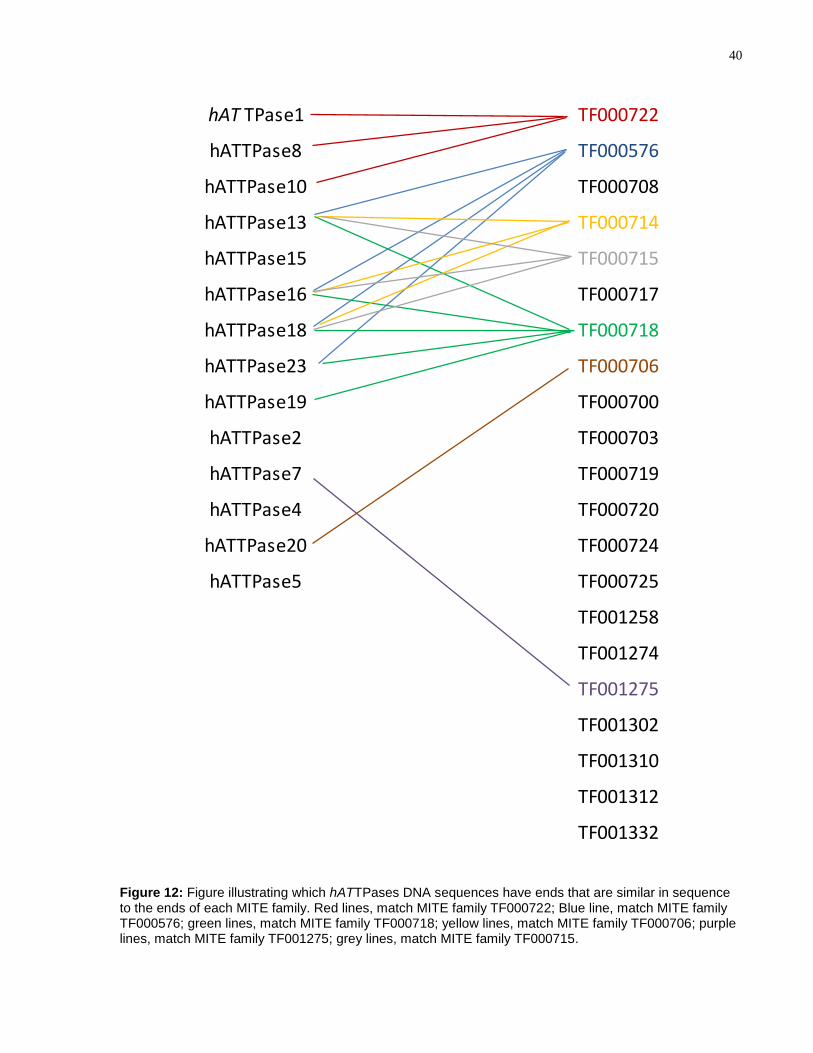
4.1.6 Linking MITEs to Putative hAT Transposases
The 23 hATTPases were manually annotated and the DNA sequences with the least
number of mutations in the coding regions and/or those that had similar terminal
sequences to hAT MITEs were chosen for experimental analyses. These include:
hATTPase1, hATTPase2, hATTPase4, hATTPase5, hATTPase7, hATTPase8,
hATTPase10, hATTPase13hATTPase16, hATTPase18, hATTPase19, and
hATTPase23. Figure 12 illustrates which hATTPases chosen for experimental analyses
have DNA terminal sequences which match best with the hAT MITE families; Figure 13
shows the alignments of the end sequences.
There are some MITE families that have multiple identical copies in the A.
aegypti genome. For example, the MITE family TF000708 has 25 identical copies
(Table 1); however, no element encoding a hATTPase bears similar end sequences as
the TF000708 MITE family. Compared to studies performed on rice, where almost every
Stowaway MITE family has TIR sequence similarity to the autonomous Osmar TEs,
there are 14 MITE families in A. aegypti that do not have similar ends to any TE
encoding a hATTPase or autonomous hAT TEs in the genome (123).
40
hAT TPase1 TF000722
hATTPase8 TF000576
hATTPase10 TF000708
hATTPase13 TF000714
hATTPase15 TF000715
hATTPase16 TF000717
hATTPase18 TF000718
hATTPase23 TF000706
hATTPase19 TF000700
hATTPase2 TF000703
hATTPase7 TF000719
hATTPase4 TF000720
hATTPase20 TF000724
hATTPase5 TF000725
TF001258
TF001274
TF001275
TF001302
TF001310
TF001312
TF001332
Figure 12: Figure illustrating which hATTPases DNA sequences have ends that are similar in sequence to the ends of each MITE family. Red lines, match MITE family TF000722; Blue line, match MITE family TF000576; green lines, match MITE family TF000718; yellow lines, match MITE family TF000706; purple lines, match MITE family TF001275; grey lines, match MITE family TF000715.
41
42
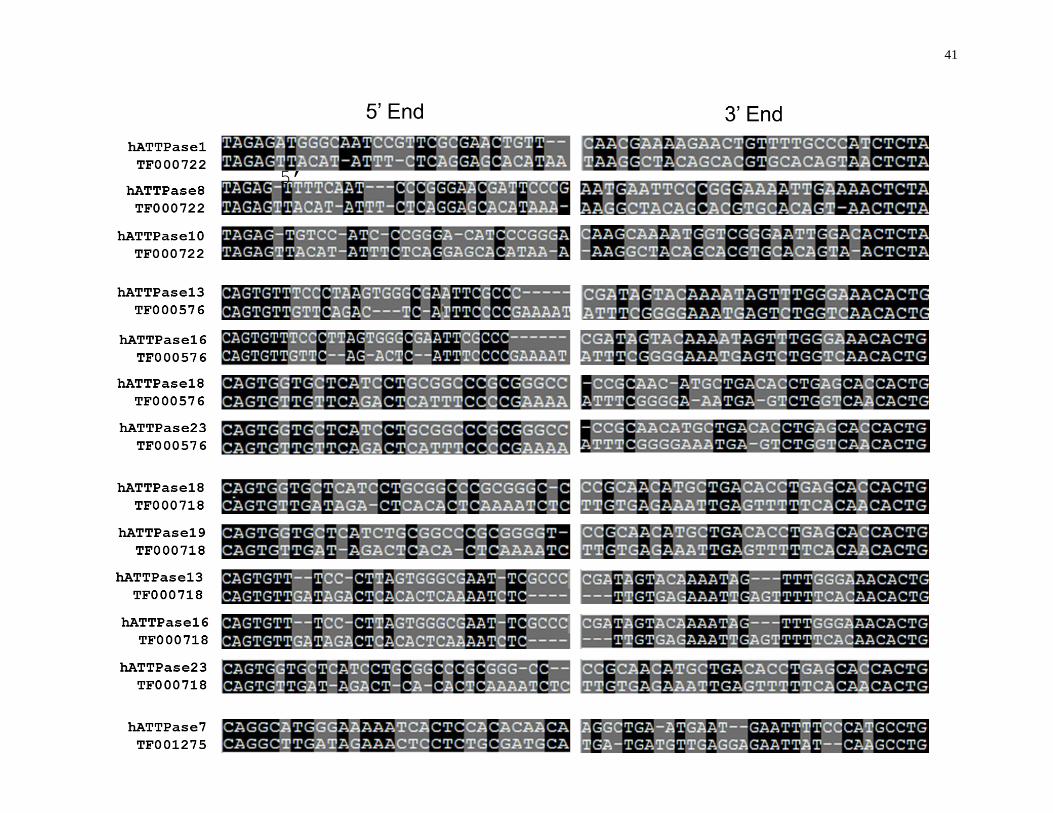
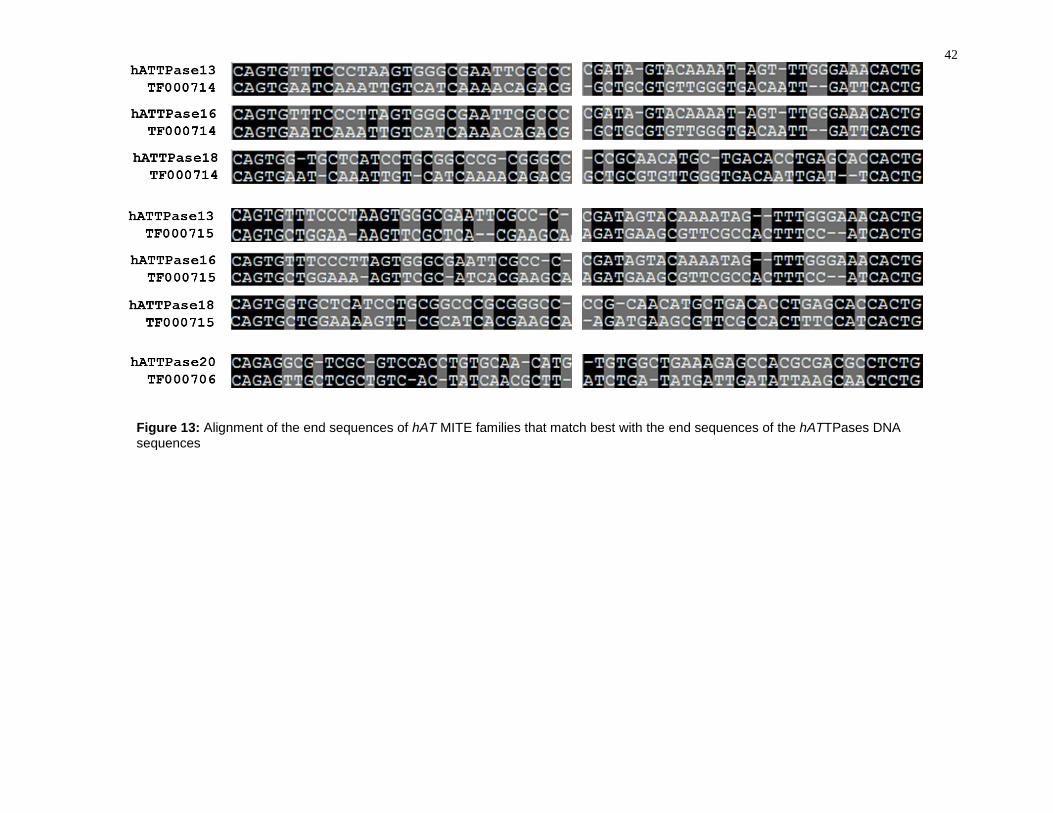
Figure 13: Alignment of the end sequences of hAT MITE families that match best with the end sequences of the hATTPases DNA sequences

43
4.1.7 Finding TEs using a Top-Down Approach
To find nonautonomous TEs that have not yet been identified and that are potentially
cross-mobilized by the hATTPases, the Topdown function of MAK was run using all
hATTPases DNA sequences as query sequences. Extensive sequence similarity
analysis revealed the existence of TEs that have not been recognized or identified in the
A. aegypti genome. Supplementary Table 4 shows the consensus sequence for each
new TE family. A total of three new TE families were found, all of which generate 8 bp
TSDs.
The new TE families were named according to the hATTPase-coding elements
that were used as the query sequence to find them. An alignment of the end sequences
of each new TE family with their respective hATTPase-coding elements shows that the
hATTPases-coding elements have highly similar sequences to the MITE families
(Figure 14). The hATTE1 family has the fewest members, with only 11. The hATTE2
family has 121 total members and is separated into 10 subfamilies. Translated
sequence searches revealed that all 10 subfamilies have amino acid sequence
similarities to the autonomous AeBuster1 TE. Specifically, all subfamilies of hATTE2
show amino acid sequence similarity to the end regions of the AeBuster1 transposase,
with E-values lower than 2e-11. The hATTE2G subfamily showed the most sequence
similarity with an overall query coverage of 34%. Lastly, the hATTE8 family is separated
into three subfamilies and has a total of 62 members.
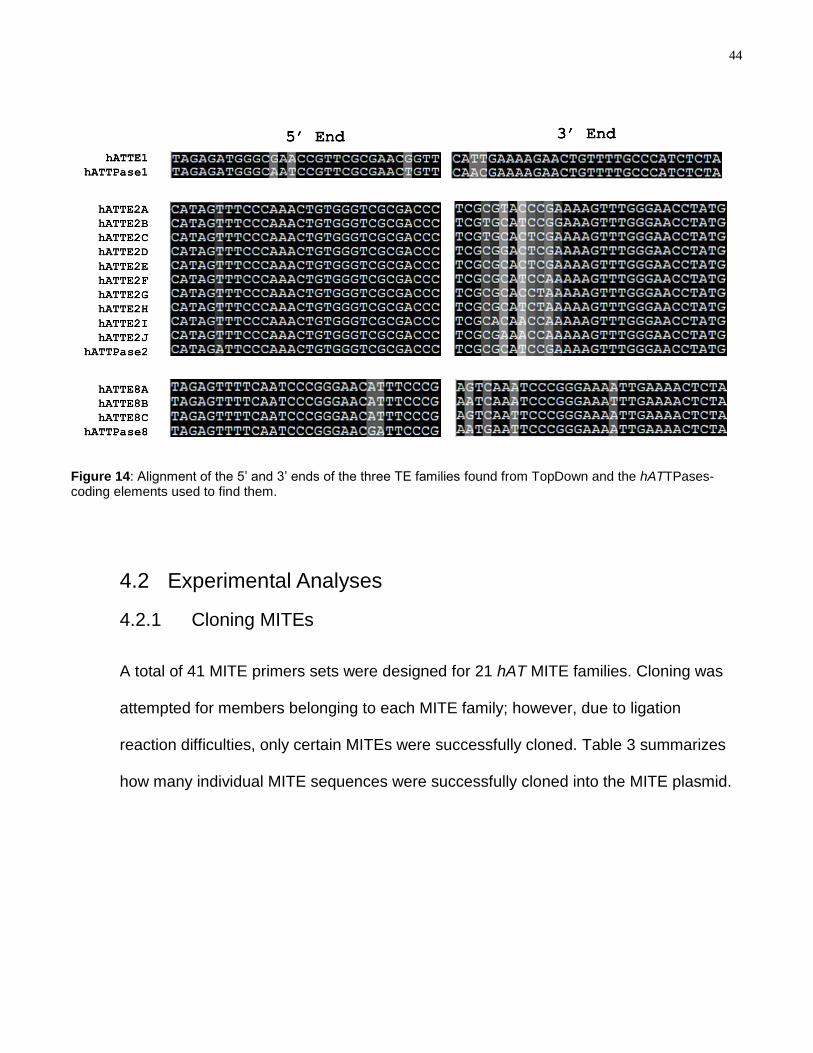
44
4.2 Experimental Analyses
4.2.1 Cloning MITEs
A total of 41 MITE primers sets were designed for 21 hAT MITE families. Cloning was
attempted for members belonging to each MITE family; however, due to ligation
reaction difficulties, only certain MITEs were successfully cloned. Table 3 summarizes
how many individual MITE sequences were successfully cloned into the MITE plasmid.
Figure 14: Alignment of the 5’ and 3’ ends of the three TE families found from TopDown and the hATTPases-coding elements used to find them.

45
Table 3: The number of individual hAT MITE sequences that were cloned into the donor plasmid for each hAT MITE family.
4.2.2 Candidate hAT Transposase Analysis and Cloning
Only one transposase coding sequence was successfully cloned and repaired:
hATTPase16. The hATTPase2 transposase was successfully cloned but was unable to
be repaired and joined. To repair the hATTPase16 transposase, two substitutions and
two insertions were fixed using PCR. Furthermore, the native transposase-coding
sequence had a single intron, flanked by the splice sites ―GT‖ and ―AG‖. The 2572 bp
long transposon has perfect 12 bp TIRs, composed of ―CCAGTGTTTCCC‖ (Error!
MITE Family # MITEs Cloned
TF00072 2
TF000576 6
TF000700 1
TF000703 8
TF000706 2
TF000708 2
TF000714 1
TF000715 1
TF000717 2
TF000718 1
TF000719 0
TF000720 1
TF000724 0
TF000725 0
TF001258 0
TF001274 0
TF001275 0
TF001302 1
TF001310 0
TF001312 0
TF001332 1
MITE Family # MITEs Cloned
TF00072 2
TF000576 6
TF000700 1
TF000703 8
TF000706 2
TF000708 2
TF000714 1
TF000715 1
TF000717 2
TF000718 1
TF000719 0
TF000720 1
TF000724 0
TF000725 0
TF001258 0
TF001274 0
TF001275 0
TF001302 1
TF001310 0
TF001312 0
TF001332 1
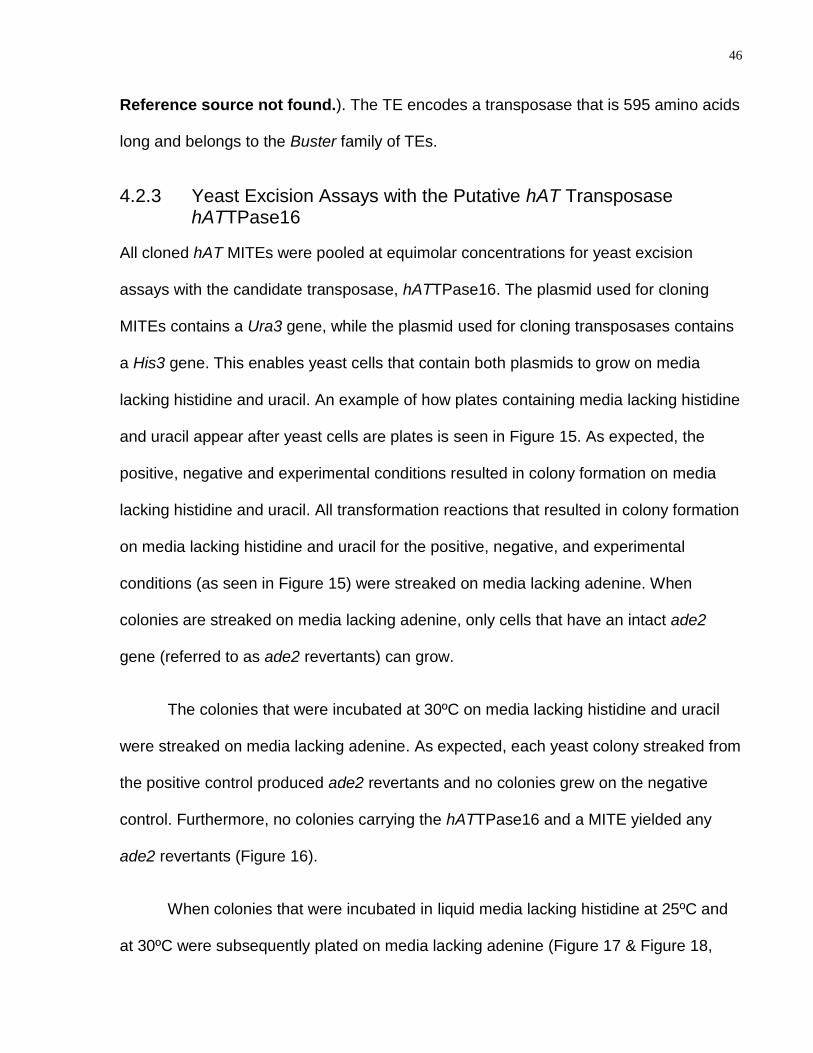
46
Reference source not found.). The TE encodes a transposase that is 595 amino acids
long and belongs to the Buster family of TEs.
4.2.3 Yeast Excision Assays with the Putative hAT Transposase hATTPase16
All cloned hAT MITEs were pooled at equimolar concentrations for yeast excision
assays with the candidate transposase, hATTPase16. The plasmid used for cloning
MITEs contains a Ura3 gene, while the plasmid used for cloning transposases contains
a His3 gene. This enables yeast cells that contain both plasmids to grow on media
lacking histidine and uracil. An example of how plates containing media lacking histidine
and uracil appear after yeast cells are plates is seen in Figure 15. As expected, the
positive, negative and experimental conditions resulted in colony formation on media
lacking histidine and uracil. All transformation reactions that resulted in colony formation
on media lacking histidine and uracil for the positive, negative, and experimental
conditions (as seen in Figure 15) were streaked on media lacking adenine. When
colonies are streaked on media lacking adenine, only cells that have an intact ade2
gene (referred to as ade2 revertants) can grow.
The colonies that were incubated at 30ºC on media lacking histidine and uracil
were streaked on media lacking adenine. As expected, each yeast colony streaked from
the positive control produced ade2 revertants and no colonies grew on the negative
control. Furthermore, no colonies carrying the hATTPase16 and a MITE yielded any
ade2 revertants (Figure 16).
When colonies that were incubated in liquid media lacking histidine at 25ºC and
at 30ºC were subsequently plated on media lacking adenine (Figure 17 & Figure 18,
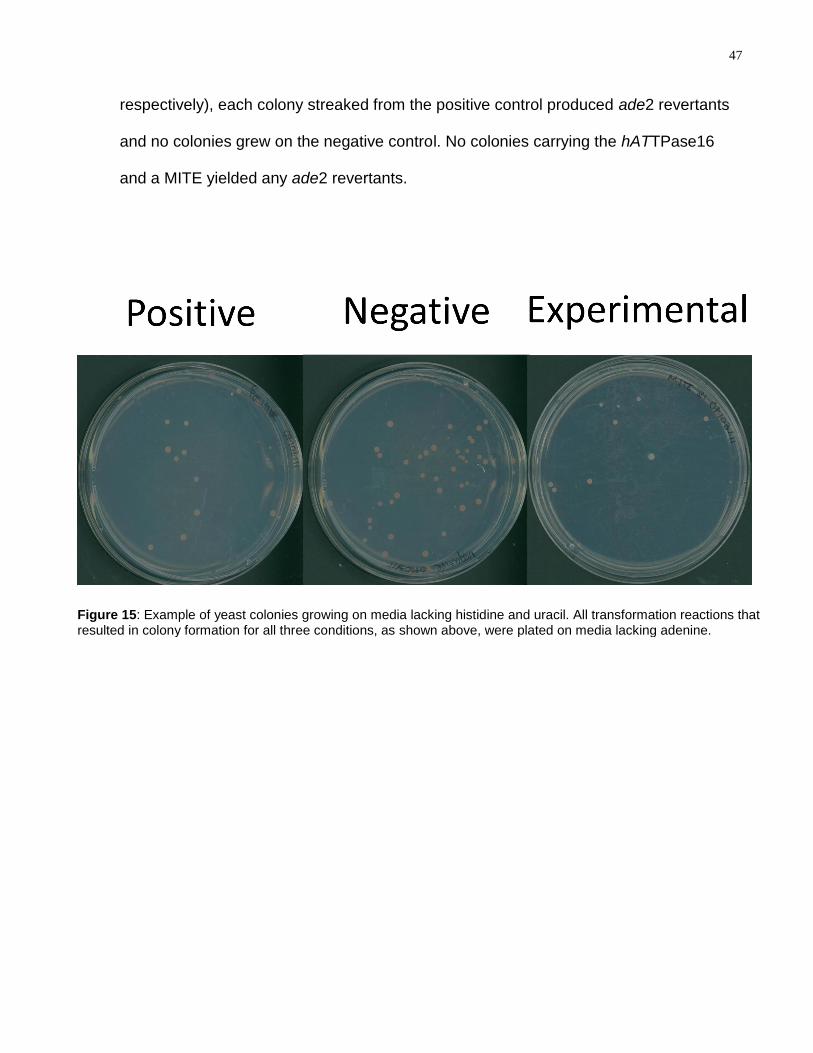
47
respectively), each colony streaked from the positive control produced ade2 revertants
and no colonies grew on the negative control. No colonies carrying the hATTPase16
and a MITE yielded any ade2 revertants.
Figure 15: Example of yeast colonies growing on media lacking histidine and uracil. All transformation reactions that resulted in colony formation for all three conditions, as shown above, were plated on media lacking adenine.
48
Figure 16: Yeast on media lacking adenine. Plates were streaked with colonies incubated at 30ºC on media lacking histidine and uracil. Sections on plates are representative of a single streaked colony. Red arrow, colony.

49
Figure 17: Yeast on media lacking adenine. Plates were spread with yeast cells from colonies incubated at 25ºC in liquid media lacking histidine and uracil. Red arrow, colony
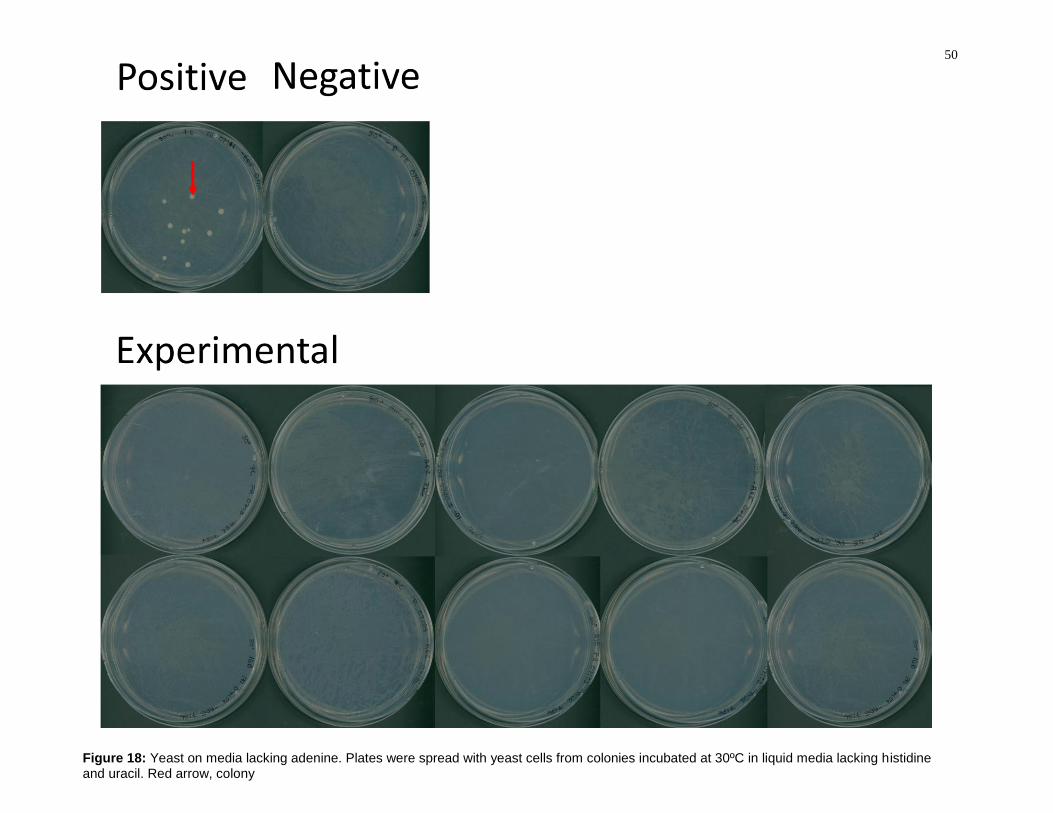
50
Figure 18: Yeast on media lacking adenine. Plates were spread with yeast cells from colonies incubated at 30ºC in liquid media lacking histidine and uracil. Red arrow, colony
51
5 Discussion
Using bioinformatic approachs, TEs encoding hAT transposases can be predicted.
Furthermore, TEs that were recently active can be predicted based on the presence of
multiple conserved copies of that TE in the genome. Since transposases recognize and
bind to the terminal regions of TEs during transposition (111), a prediction of which
transposase protein is responsible for the transposition of which TE(s) can be made
based on the sequence similarity of the terminal regions between two elements.
In this study, a total of 23 TEs were selected as candidates to encode full or
partial transposases belonging to the hAT superfamily. Extensive computational
analysis of these transposases was performed and the copies of each candidate hAT
transposase were retrieved. It was discovered that the candidate hATTPase10 has the
highest copy number of any known hAT transposase in the A. aegypti genome (39).
Amino acid sequence analysis grouped the candidate transposases into four
distinct clades. To determine if any candidates belonged to the Ac and Buster families,
phylogenetic analysis was performed using the amino acid sequences of the annotated
hATTPases as well as hAT transposase sequences from multiple organisms [described
in (101)]. Similarly, four distinct clades were formed. As expected, the Buster and Ac
families formed two separate clades. However, the Tip TEs formed a separate third
clade with high support. This was also seen in the analyses done by Arsenburger et al.
(2011) where the three Tip TEs used in their study remained separate from the Ac and
Buster families. In their study, it was concluded that there was an insufficient sample
52
size for the placement of the Tip TEs into either of the two families or into a separate
third family (101).
In this study, six hATTPases were also placed in the same clade as the Tip TEs.
Although the sample size is still small, these results indicate that the Tip TEs may form
a third family in the hAT superfamily of TEs. Another clade, formed by three
hATTPases, is separate from the Buster and Ac families, as well as the Tip TEs. These
three hATTPases cannot be placed into either the Ac or Buster family, into the Tip
clade, or into a separate clade due to the small sample size. Furthermore, a total of six
hATTPases don’t have any strong sequence similarity to any known hAT transposase in
A. aegypti, making these sequences newly described as encoding full or partial
transposase proteins (hATTPase5, hATTPase6, hATTPase12, hATTPase9,
hATTPase21, and hATTPase22).
Conserved domain analysis was performed to detect the presence of any of the
four conserved domains in hAT TEs (88, 98–100). The analysis revealed that not all
known intact hAT transposases in the A. aegypti genome have strong conservation of
transposase domains. This was also true for the candidate transposases selected in this
study. Although the hAT dimerization domain is often found in hAT transposases, it is
thought that multiple regions of a transposase can play a role in oligomerization (100).
Therefore, a highly conserved hAT dimerization domain may not be necessary for
transposition. In fact, the only active class II TE in A. aegypti to date, AeBuster1, doesn’t
show any strong sequence conservation for any transposase domain (101).
53
Using a top-down approach, three TE families were identified and described. The
members of these families all generate 8 bp TSDs upon insertion, likely making them
members of the hAT superfamily of TEs. Furthermore, all the hATTE families are
nonautonomous, as they do not encode any full length transposase. As expected, all
three families have strong end-sequence similarity with the hATTPase-coding elements
used to find them. Due to this strong end-sequence similarity, these hATTPases are
good candidates for the cross-mobilization of these TE families. Due to time constraints,
the activity of these MITE families has not yet been tested experimentally. Translated
sequence analysis revealed that the hATTE2 family shares amino acid sequence
similarity to the AeBuster1 transposase. Therefore, the hATTE2 family members are
likely deletion derivatives of the autonomous AeBuster1 TE. Due to the fact that the
hATTE2 and hATTE8 families have no amino acid sequence similarity to any known
transposase in A. aegypti, it is likely that these two families are MITEs that have never
before been described.
In this study, a total of 14 hAT TEs were selected as candidates to encode a hAT
transposase that can cross-mobilize hAT MITEs. These predictions were based on
sequence similarity to known hAT transposases and end-sequence similarity to hAT
MITEs. Due to the fact that 14 MITE families, some of which have multiple identical
copies, had no end-sequence similarity to any hATTPase; it is likely that there are hAT
TEs in the A. aegypti genome that are responsible for the cross-mobilization of these
MITEs and have not yet been identified. Only one candidate transposase, hATTPase16,
was successfully cloned and repaired. The candidate hATTPase2 was successfully
cloned, but after repairing the sequence, was unsuccessfully ligated back into the
vector. Although the coding regions of every other candidate transposase were

54
successfully amplified, the ligation reaction proved most difficult. Despite multiple
attempts and altering ligation conditions (e.g. temperature, reaction time, insert-vector
concentrations), no other transposase was cloned.
To test the activity of hATTPase16, it was co-transformed into yeast cells
containing hAT MITEs, and monitored for ade2 revertants at different conditions.
However, no ade2 revertants were observed in the experimental conditions. The most
likely reason for not observing a transposition event is that the hATTPase16
transposase enzyme does not recognize and bind to any of the hAT MITE ends. In this
study, a lenient approach was used to compare the similarity of MITE family and
hATTPase end sequences, in order to increase the probability of finding a hATTPase
that cross-mobilizes a MITE. Since transposase enzymes bind to terminal regions of
TEs as the first critical step in the transposition process, if the hATTPase16 transposase
cannot bind to the hAT MITEs, transposition will not occur. Furthermore, although the
terminal regions of the hATTPase16 TE shows some sequence similarity to four hAT
MITE families, it has been shown that single nucleotide substitutions in TIRs can
severely decrease transformation efficiency (47). Therefore, it is likely that the terminal
regions of the MITE families were too dissimilar for the transposase to recognize and
bind.
Further studies are required to fully comprehend the activity and consequences
of hAT MITE transposition. For example, binding studies, such as electrophoretic
mobility shift assays (EMSAs), using purified transposase enzymes and terminal region
DNA fragments can be performed to test the ability of each transposase to bind to MITE
sequences in vitro. DNA deletion analyses can be performed on hAT MITEs shown to
55
be cross-mobilized by transposases in order to test which TIR regions are necessary for
transposase binding and transposition. This will allow researchers to make better
predictions of which hAT MITEs a transposase is capable of mobilizing.
Understanding TE activity and amplification is essential to understanding how A.
aegypti has evolved and diversified. Being a major vector of yellow fever, dengue fever,
and chikungunya fever, there is a great need to understand the driving-forces of A.
aegypti genome evolution (103–105). In doing so, there will be a better understanding of
the biological properties of A. aegypti and the potential to develop the tools necessary to
produce pathogen-resistant strains(124).

56
Chapter 3 TE Displayer for Post Genomic Analysis of TEs
6 Introduction to Transposon Display
Transposon Display (TD) is a commonly used experimental technique to study TEs. TD
is frequently used to study TE insertion polymorphisms within a genome or between
genomes and is a technique derived from Amplified Fragment Length Polymorphism
(AFLP) (125, 126). Using polymerase chain reaction (PCR)-based methods, TD allows
for the separation and visualization of specific TEs in a genome. The process starts with
the extraction and digestion of genomic DNA with a restriction enzyme to generate DNA
fragments of different sizes. Adapters are then ligated to the ends of the digested
genomic DNA fragments (Error! Reference source not found.A-B). A pre-amplification
PCR is performed using a primer that is complementary to the adapter sequence and
another primer that is complementary to the TE sequence (Error! Reference source
not found.C). A second, selective PCR reaction is performed using the pre-
amplification products as templates with a nested primer set (Error! Reference source
not found.D). Selective amplification PCR products are analyzed by polyacrylamide gel
or capillary electrophoresis. DNA fragments can be extracted and sequenced if desired.
When the TE family being analyzed has a high copy number in a genome, one or more
selective nucleotide(s) can be added to the 3’ end of the adapter primer used in the
selective amplification reaction to reduce the number of bands per lane (125). The
resulting products consist of DNA fragments containing part of the TE and a flanking
genomic region outside of the TE. These fragments are then resolved on a
polyacrylamide gel, where each band indicates a transposable element at a specific
57
location in the genome (Error! Reference source not found.E). The copy number of
the TE family in a genome can be determined and an active TE can be revealed
through the detection of an insertion event within a genome.
Although TD is often used to study TEs experimentally, discovering and
analyzing TEs computationally has become common in TE research, and is made
possible by the abundance of genome sequencing efforts being performed on a variety
of different organisms. Furthermore, most TEs have recognizable structural signatures,
making their identification and annotation possible. In lieu of this, multiple computer
programs have been developed to find and analyze TEs in different genomes.
A novel bioinformatics tool has been developed that transforms TD into a
computational program. The program, called TE Displayer, was generated using
Practical Extraction and Report Language (PERL) with a Graphical User Interface and
runs in the Windows and Linux operating systems Using TE Displayer, a user can
choose genome databases and define parameters including an adapter oligo length
(bp), a restriction enzyme recognition site sequence for genomic DNA digestion,
selective base(s), the sequences of the pre-amplification TE primer and the sequence of
the selective amplification TE primer. In addition, a user can specify the allowed number
of mismatches for the pre-amplification PCR primer to anneal to its targets and choose
a DNA size ladder and color(s) for the virtual gel image. The output of TE Displayer
includes a detailed description of each fragment in text format and a graphical
representation of the fragments on a virtual gel image (Figure 20). TE Displayer was
tested using TEs in the Aedes aegypti, Drosophila melanogaster, Caenorhabditis
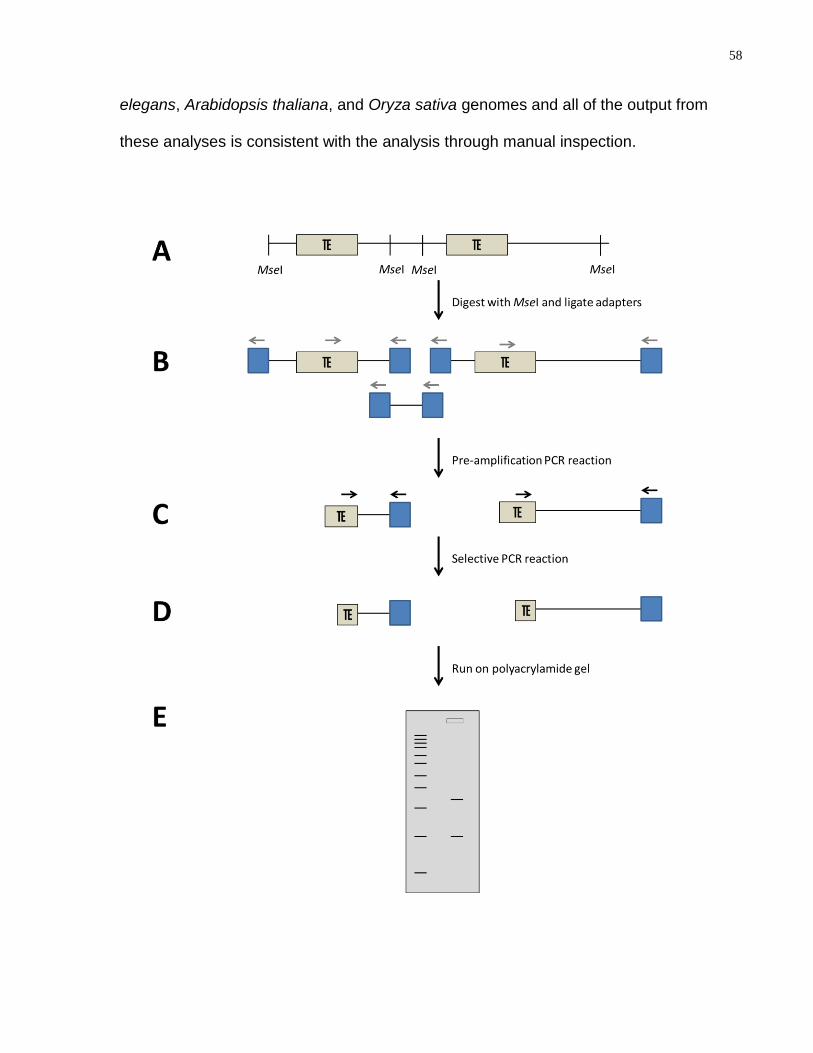
58
elegans, Arabidopsis thaliana, and Oryza sativa genomes and all of the output from
these analyses is consistent with the analysis through manual inspection.

59
Figure 19: A schematic representation of Transposon Display. (A) Genomic DNA is extracted; (B) DNA is digested with MseI and adapters are ligated to the ends; (C) Pre-amplification PCR is performed; (D) Selective PCR is performed; (E) Products are run on a polyacrylamide gel. Blue boxes-adaptors; grey arrows-pre-amplification primers; black arrows-selective amplification primers.
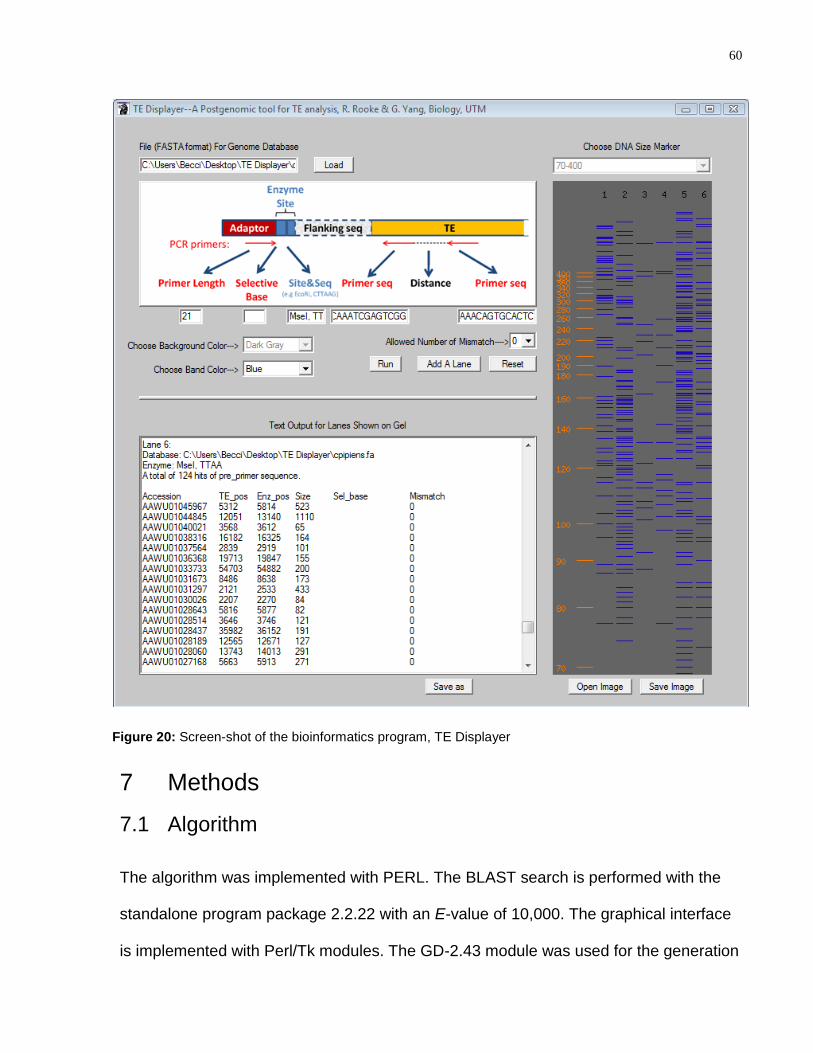
60
7 Methods
7.1 Algorithm
The algorithm was implemented with PERL. The BLAST search is performed with the
standalone program package 2.2.22 with an E-value of 10,000. The graphical interface
is implemented with Perl/Tk modules. The GD-2.43 module was used for the generation
Figure 20: Screen-shot of the bioinformatics program, TE Displayer

61
of the virtual gel images. BioPerl modules such as Bio::Tools::Run::StandAloneBlast
and Bio::SearchIO are used to perform BLAST searches and parse the output. TE
Displayer has been tested on Linux and Windows (XP, Vista, Windows 7) standalone
systems and the SciNet high performance system (University of Toronto).
7.2 Implementation
The parameters required to perform TE Displayer include: a restriction enzyme site, a
pre-amplification primer sequence, a selective amplification primer sequence, and an
adaptor size. Parameters that are not required, but can be used, if desired, include a
selective base (A, T, C, or G) and different nucleotide mismatch values (up to a total of
five mismatches) between the pre-amplification primer and the genomic sequence.
When TE Displayer is implemented, a BLAST search is performed using the pre-
amplification primer as the query sequence and the genomic sequence as the subject
database (Figure 21, i). A 5 kb flanking sequence is retrieved from the pre-amplification
primer sequence, which is subsequently searched for the nearest enzyme restriction
site to the pre-amplification primer (as specified by the user) (Figure 21, ii & iii).
Following this, the region between the pre-amplification primer and the closest
restriction enzyme site is scanned for the selective-amplification primer sequence
(Figure 21, iv). If the selective-amplification primer sequence is found (in the correct
orientation) in this region, the size of the conceptual amplicon is calculated as the size
of the selective-amplification primer, the size of the adaptor, and the region between
them (Figure 21, v). Every location that contains the target TE sequence is processed in
this manner and a conceptual amplicon is produced.
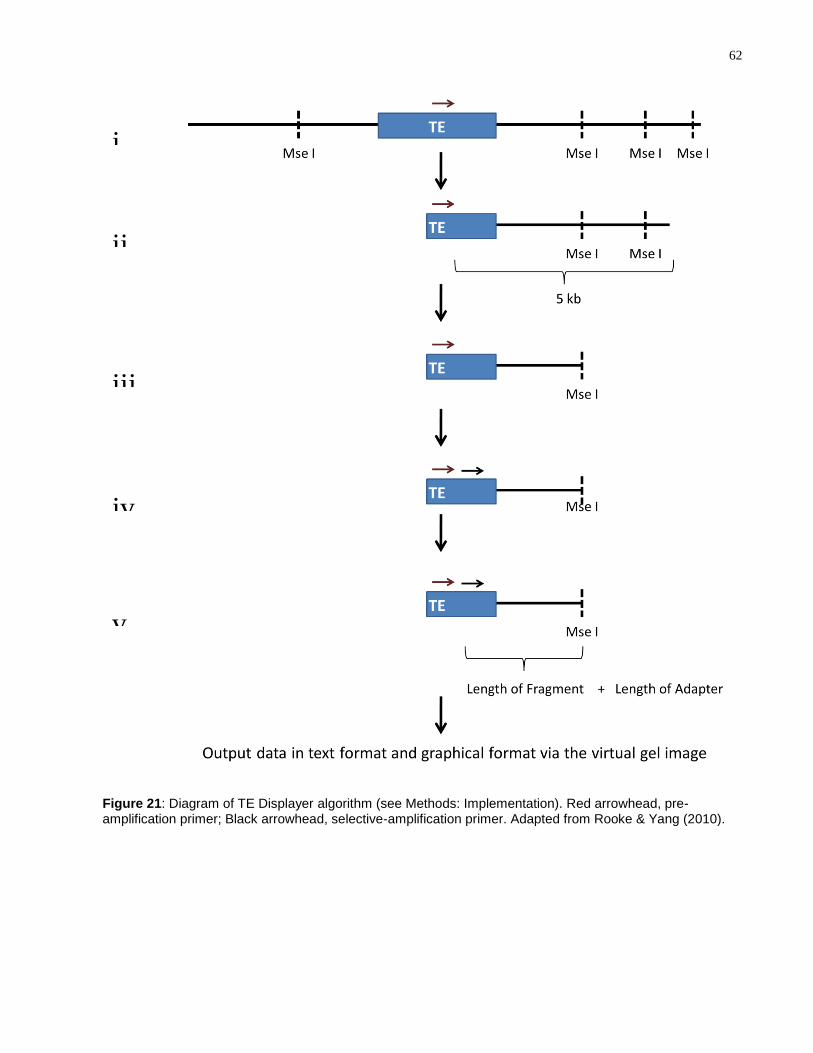
62
i
ii
iii
iv
v
Figure 21: Diagram of TE Displayer algorithm (see Methods: Implementation). Red arrowhead, pre-amplification primer; Black arrowhead, selective-amplification primer. Adapted from Rooke & Yang (2010).
63
7.3 Output
The output of TE Displayer includes a text output that contains the genomic location,
amplicon size, selective base, and number of mismatches for each amplicon.
Furthermore, the amplicons are displayed as ―bands‖ in a lane on a virtual gel-image.
The migration of the virtual bands are calculated using the formula D1/D2=S2/S1, where
D is distance and S is size. All output from TE Displayer is consistent with the output
from manual inspection.
7.4 Parameters Used for Testing TE Displayer
The primer sequences used to find hAT TEs in different genomes are outlined in Table
4. Primers were generated from consensus sequences corresponding to each element
ID found on TEfam (http://tefam.biochem.vt.edu/tefam/) or Repbase
(http://www.girinst.org/repbase/index.html). The adopter size was 10 bps, primer
mismatch value was 5, and the restriction enzyme used was MseI with a recognition site
of TTAA.
Table 4 hAT primer sequences and genomes used to generate output for hAT elements
Element ID
Pre-Amplification Primer
Sequence
Selective Amplification Primer
Sequence Genome
SIMPLEHAT2 CCCTAAACTCATTTGATTAT GTTGAGTTGGGTTACCCATT
Arabidopsis
thaliana
HATN1_CE ATTTGGATCGCGGCGTGAG GAGCGGCGTTTGAGCGACGC
Caenorhabditis
elegans
CRATA TGGTGGAGTAACCTCCGACG TCCCCGTTGCCATCTCTA
Oryza sativa
var. japonica
TF000700 TTGTATGGTTGTTTACATTTT GCAATAAAGAGCCGCCAGTT Aedes aegypti
64
The primer sequences for mPing in different varieties of O. sativa were the same
as those described in Jiang et al. (2003). The length of the adaptor was 19 bps, the
primer mismatch value was 0, and the restriction enzyme used was MseI.
For the TF000720 element in A. aegypti, the pre-amplification primer sequence
was 5’ GGCAAGCTGAAGTTATCTTG 3’ and the selective amplification primer
sequence was 5’ TTTCGTGTGTAGTATCT 3’. The adapter length was 21 bps and the
restriction enzyme used was MseI.
7.5 Genomic Database Sources
The genomic sequence of Aedes aegypti was downloaded from Vectorbase
(www.vectorbase.org), Arabidopsis thaliana from TAIR (www.arabidopsis.org), and
Caenorhabditis elegans from Wormbase (www.wormbase.org). The genome sequences
for O. sativa var. indica and var. japonica were obtained from Genomics
(ftp://ftp.genomics.org.cn/; release: 23/04/2008).
8 Results
TE Displayer was implemented using various genomes, including A. thaliana, C.
elegans, Oryza sativa, A. aegypti, and D. melanogaster. To compare different TE
profiles in these five genomes, primer sequences were developed for different hAT TEs
found in each organism. As expected, the banding pattern for each hAT family is
different across each organism, reflecting the different sizes and copy number of the TE
elements in each genome (Figure 22A). The copy numbers and sizes of each band
were consistent with manual inspection of the genomic sequences.
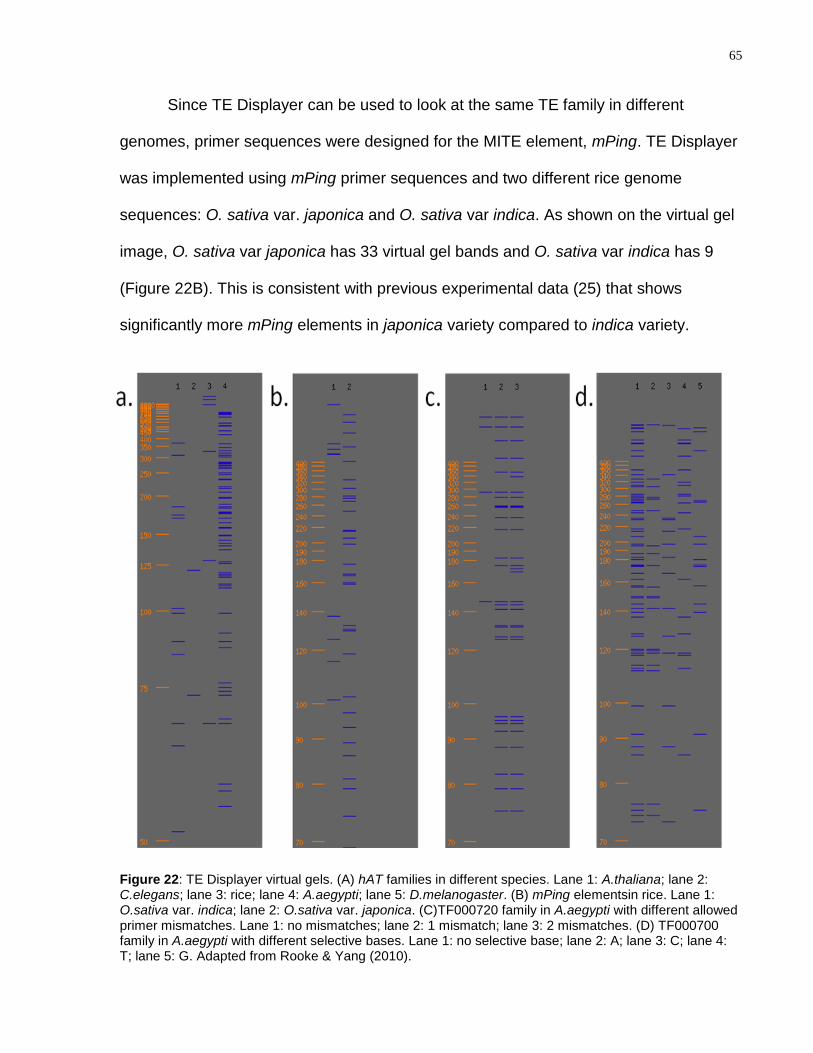
65
Since TE Displayer can be used to look at the same TE family in different
genomes, primer sequences were designed for the MITE element, mPing. TE Displayer
was implemented using mPing primer sequences and two different rice genome
sequences: O. sativa var. japonica and O. sativa var indica. As shown on the virtual gel
image, O. sativa var japonica has 33 virtual gel bands and O. sativa var indica has 9
(Figure 22B). This is consistent with previous experimental data (25) that shows
significantly more mPing elements in japonica variety compared to indica variety.
Figure 22: TE Displayer virtual gels. (A) hAT families in different species. Lane 1: A.thaliana; lane 2: C.elegans; lane 3: rice; lane 4: A.aegypti; lane 5: D.melanogaster. (B) mPing elementsin rice. Lane 1: O.sativa var. indica; lane 2: O.sativa var. japonica. (C)TF000720 family in A.aegypti with different allowed primer mismatches. Lane 1: no mismatches; lane 2: 1 mismatch; lane 3: 2 mismatches. (D) TF000700 family in A.aegypti with different selective bases. Lane 1: no selective base; lane 2: A; lane 3: C; lane 4: T; lane 5: G. Adapted from Rooke & Yang (2010).
66
To illustrate TE Displayers ability of to reduce the specificity of the pre-
amplification primer using mismatch nucleotide(s), a virtual gel image was generated
displaying the TF000720 TE family and using the A. aegypti genome as the database.
When no mismatches were permitted, only four bands appeared on the virtual gel
image. With one and two mismatches permitted, 33 and 37 bands appeared,
respectively (Figure 22C). As expected, the higher the number of mismatches allowed,
the less specific the pre-amplification primer search is, and the more bands are found
and appear on the virtual gel.
Selective base(s) are a valuable tool to reduce the number of bands per lane on
the virtual gel image. This is often necessary to resolve bands from genomes that have
a high copy number of the TE family of interest. When no selective bases are used to
search the A. aegypti genome for the TE family TF000700, a total of 78 bands appear
on the virtual gel image. When A, C, T, or G is used as the selective base, a total of 23,
14, 22, and 19 bands appear, respectively (Figure 22D).
9 Discussion
With the ever-increasing number of whole-genome sequences becoming available in
public databases, there is an increased need for bioinformatics tools that are capable of
processing and analyzing the large amount of data. In TE research, bioinformatics tools
capable of identifying, annotating, and analyzing TEs in genomic databases are
advantageous, if not necessary.
Discrepancies between TE Displayer output and that seen on a TD gel may be
found. For example, the experimental and in silico TE profiles of mPing are similar, but
67
not exactly the same [see (24)]. Discrepancies may be a result of: (i) transposition
activity of the TE of interest; (ii) incomplete genome sequences, resulting in fewer bands
seen on the virtual gel image; (iii) sequencing and genome-assembly errors, resulting in
incorrect band sizes; (iv) non-specific amplification during experimental analysis,
resulting in the appearance of non-target sequences.
TE Displayer enables a researcher to create a virtual gel image that mimics the
experimental outcome of TD, as well as providing detailed text output about band sizes
and genomic coordinates. Currently, TE transposition can be inferred from an individual
by the appearance of novel bands on a TD gel (24, 127). That being said, TE Displayer
can similarly be used to detect transposition events by comparing TE profiles across
different individuals, tissues, or generations. In addition, TE Displayer allows
researchers to compare computational TE profiles with that of experimental TE profiles,
enabling them to detect genome assembly and sequencing errors, and provides
researchers with an initial idea of what to expect on a TD gel.
68
Chapter 4 Concluding Remarks
Often considered ―parasitic‖, TEs are now known to have a beneficial role in
some instances for the genomes in which they reside. Multiple examples of molecular
domestication illustrate how TEs and TE-derived sequences can become essential
components of genomes, regulating gene expression and becoming crucial for proper
host development (93). Furthermore, TEs have been attributed as major drivers in
vertebrate diversity, and may play an important role in speciation (128). Although TE
movement throughout a genome can cause mutations either through their direct
insertion or from TE footprints at the location of excision, these mutations have been
attributed to enlarging genetic variation in populations (129).
TEs are a major driving force of genome evolution, despite the fact that the
majority of TEs are not active. In studying genome sequences and sizes, researchers
have revealed some interesting findings about eukaryotic genomes, including the fact
that an organism’s morphological complexity and genome size are not correlated and
that most eukaryotic DNA is comprised mostly of non-coding regions [see (130)for
review]. Moreover, it is becoming increasingly evident that TEs are the major contributor
to eukaryotic genome size, with total TE content and genome size having shown a
strong positive correlation (76, 131) Even though TEs were discovered over 60 years
ago in the maize genome, TEs continue to be discovered in a diversity of genomes.
Therefore, the importance of revealing which TEs are potentially and currently active on
a genome-wide scale and what consequences arise from their transposition is important

69
for understanding genome evolution. Identifying and grasping the entirety of active TEs
will provide a better understanding of genome structure and evolution.

70
References
1. McClintock B (1948) Mutable loci in maize. Carnegie Institute Washington Year Book
47:155-169.
2. McClintock B (1947) Cytogenetic studies of maize and Neurospora. Carnegie Institute
Washington Year Book 46:146-152.
3. Gardner MJ et al. (2002) Genome sequence of the human malaria parasite Plasmodium
falciparum. Nature 419:498-511.
4. Kunst F et al. (1997) The complete genome sequence of the gram-positive bacterium
Bacillus subtilis. Nature 390:249-256.
5. Schnable PS et al. (2009) The B73 maize genome: complexity, diversity, and dynamics.
Science 326:1112-1115.
6. SanMiguel P, Bennetzen JL (1998) Evidence that a recent increase in maize genome size
was caused by the massive amplification of intergene retrotransposons. Annals of Botany
82:37-44.
7. SanMiguel P et al. (1996) Nested retrotransposons in the intergenic regions of the maize
genome. Science 274:765-768.
8. Biemont C (2010) A brief history of the status of transposable elements: from junk DNA
to major players in evolution. Genetics 186:1085-1093.
9. Finnegan DJ (1989) Eukaryotic transposable elements and genome evolution. Trends in
Genetics 5:103-107.
10. Wicker T et al. (2007) A unified classification system for eukaryotic transposable
elements. Nature Reviews Genetics 8:973-982.
11. Bennetzen JL (2000) Transposable element contributions to plant gene and genome
evolution. Plant Molecular Biology 42:251-269.
12. Kumar A, Bennetzen JL (1999) Plant retrotransposons. Annual Review of Genetics
33:479-532.
13. Han JS, Boeke JD (2005) LINE-1 retrotransposons: modulators of quantity and quality of
mammalian gene expression? Bioessays 27:775-784.
14. Sabot F, Schulman AH (2006) Parasitism and the retrotransposon life cycle in plants: a
hitchhiker’s guide to the genome. Heredity 97:381-388.
15. Cordaux R, Batzer MA (2009) The impact of retrotransposons on human genome
evolution. Nature Reviews Genetics 10:691-703.
71
16. Smit AF, Riggs AD (1996) Tiggers and DNA transposon fossils in the human genome.
Proceedings of the National Academy of Science 93:1443-1448.
17. Feschotte C, Pritham EJ (2005) Non-mammalian c-integrases are encoded by giant
transposable elements. Trends in Genetics 21:551-552.
18. Kapitonov VV, Jurka J (2006) Self-synthesizing DNA transposons in eukaryotes.
Proceedings of the National Academy of Sciences 103:4540-4540.
19. Pritham EJ, Putliwala T, Feschotte C (2007) Mavericks, a novel class of giant transposable
elements widespread in eukaryotes and related to DNA viruses. Gene 390:3-17.
20. display.cgi?uids=1334917 Available at:
http://www.hubmed.org/display.cgi?uids=1334917 [Accessed August 16, 2011].
21. Bureau TE, Wessler SR (1992) Tourist: a large family of small inverted repeat elements
frequently associated with maize genes. Plant Cell 4:1283-1294.
22. Bureau TE, Wessler SR (1994) Mobile inverted-repeat elements of the Tourist family are
associated with the genes of many cereal grasses. Proceedings of the National Academy of
Sciences 91:1411-1415.
23. Kikuchi K, Terauchi K, Wada M, Hirano HY (2003) The plant MITE mPing is mobilized
in anther culture. Nature 421:167-170.
24. Jiang N et al. (2003) An active DNA transposon family in rice. Nature 421:163-167.
25. Naito K et al. (2006) Dramatic amplification of a rice transposable element during recent
domestication. Proceedings of the National Academy of Sciences 103:17620-17625.
26. Jiang N, Feschotte C, Zhang X, Wessler SR (2004) Using rice to understand the origin and
amplification of miniature inverted repeat transposable elements (MITEs). Current
Opinion in Plant Biology 7:115-119.
27. Feschotte C, Swamy L, Wessler SR (2003) Genome-wide analysis of mariner-like
transposable elements in rice reveals complex relationships with stowaway miniature
inverted repeat transposable elements (MITEs). Genetics 163:747-758.
28. MacRae AF, Clegg MT (1992) Evolution of Ac and Dsl elements in select grasses
(Poaceae). Genetica 86:55-66.
29. Tsubota SI, Huong DV (1991) Capture of flanking DNA by a P element in Drosophila
melanogaster: creation of a transposable element. Proceedings of the National Academy of
Sciences 88:693 -697.
30. Surzycki SA, Belknap WR (1999) Characterization of Repetitive DNA Elements in
Arabidopsis. J Mol Evol 48:684-691.
72
31. Unsal K, Morgan GT (1995) A novel group of families of short interspersed repetitive
elements (SINEs) in Xenopus: evidence of a specific target site for DNA-mediated
transposition of inverted-repeat SINEs. Journal of Molecular Biology 248:812-823.
32. Oosumi T, Garlick B, Belknap WR (1996) Identification of putative nonautonomous
transposable elements associated with several transposon families in Caenorhabditis
elegans. Journal of Molecular Evolution 43:11-18.
33. Tu Z (1997) Three novel families of miniature inverted-repeat transposable elements are
associated with genes of the yellow fever mosquito, Aedes aegypti. Proceedings of the
National Academy of Sciences 94:7475 -7480.
34. Izsvak Z et al. (1999) Short inverted-repeat transposable elements in teleost fish and
implications for a mechanism of their amplification. Journal of Molecular Evolution
48:13-21.
35. Brügger K et al. (2002) Mobile elements in archaeal genomes. FEMS Microbiology
Letters 206:131-141.
36. Morgan GT (1995) Identification in the human genome of mobile elements spread by
DNA-mediated transposition. Journal of Molecular Biology 254:1-5.
37. Oki N et al. (2008) A genome-wide view of miniature inverted-repeat transposable
elements (MITEs) in rice, Oryza sativa ssp. japonica. Genes & Genetic Systems 83:321-
329.
38. Surzycki SA, Belknap WR (2000) Repetitive-DNA elements are similarly distributed on
Caenorhabditis elegans autosomes. Proceedings of the National Academy of Science
97:245-249.
39. Nene V et al. (2007) Genome sequence of Aedes aegypti, a major arbovirus vector.
Science 316:1718-1723.
40. Nakazaki T et al. (2003) Mobilization of a transposon in the rice genome. Nature 421:170-
172.
41. Lin X et al. (2006) In planta mobilization of mPing and its putative autonomous element
Pong in rice by hydrostatic pressurization. Journal of Experimental Botony 57:2313-2323.
42. Shan X et al. (2005) Mobilization of the active MITE transposons mPing and Pong in rice
by introgression from wild rice (Zizania latifolia Griseb.). Molecular Biology and
Evolution 22:976-990.
43. Yang G, Zhang F, Hancock CN, Wessler SR (2007) Transposition of the Rice Miniature
Inverted Repeat Transposable Element mPing in Arabidopsis thaliana. Proceedings of the
National Academy of Sciences of the United States of America 104:10962-10967.
44. Momose M, Abe Y, Ozeki Y (2010) Miniature Inverted-Repeat Transposable Elements of
Stowaway Are Active in Potato. Genetics 186:59-66.
73
45. Patel M et al. (2004) High-oleate peanut mutants result from a MITE insertion into the
FAD2 gene. Theoretical and Applied Genetics 108:1492-1502.
46. Hua-Van A, Davière JM, Kaper F, Langin T, Daboussi MJ (2000) Genome organization in
Fusarium oxysporum: clusters of class II transposons. Current Genetics 37:339-347.
47. Dufresne M et al. (2007) Transposition of a fungal miniature inverted-repeat transposable
element through the action of a Tc1-like transposase. Genetics 175:441-452.
48. Rezsohazy R, van Luenen HGA, Durbin RM, Plasterk RHA (1997) Tc7, a Tc1-hitch
hiking transposon in Caenorhabditis elegans. Nucleic Acids Research 25:4048-4054.
49. Shirasu K, Schulman AH, Lahaye T, Schulze-Lefert P (2000) A contiguous 66-kb barley
DNA sequence provides evidence for reversible genome expansion. Genome Research
10:908-915.
50. Feschotte C (2004) Merlin, a new superfamily of DNA transposons identified in diverse
animal genomes and related to bacterial IS1016 insertion sequences. Molecular Biology
and Evolution 21:1769-1780.
51. Zhou F, Tran T, Xu Y (2008) Nezha, a novel active miniature inverted-repeat transposable
element in cyanobacteria. Biochemical and Biophysical Research Communications
365:790-794.
52. Hikosaka A, Kawahara A (2010) A systematic search and classification of T2 family
miniature inverted-repeat transposable elements (MITEs) in Xenopus tropicalis suggests
the existence of recently active MITE subfamilies. Molecular Genetics and Genomics
283:49-62.
53. Derbyshire KM, Kramer M, Grindley N (1990) Role of instability in the cis action of the
insertion sequence IS903 transposase. Proceedings of the National Academy of Sciences
87:4048-4052.
54. Huisman O, Errada PR, Signon L, Kleckner N (1989) Mutational analysis of IS10’s
outside end. EMBO Journal 8:2101-2109.
55. Makris JC, Nordmann PL, Reznikoff WS (1988) Mutational analysis of insertion sequence
50 (IS50) and transposon 5 (Tn5) ends. Proceedings of the National Academy of Sciences
85:2224-2228.
56. Mahillon J, Chandler M (1998) Insertion sequences. Microbiology and Molecular Biology
Reviews 62:725-774.
57. Derbyshire KM, Hwang L, Grindley ND (1987) Genetic analysis of the interaction of the
insertion sequence IS903 transposase with its terminal inverted repeats. Proceedings of the
National Academy of Sciences 84:8049-53.
58. Zerbib D et al. (1990) Functional organization of the ends of IS1: specific binding site for
an IS 1-encoded protein. Molecular Microbiology 4:1477-1486.
74
59. Johnson RC, Reznikoff WS (1983) DNA sequences at the ends of transposon Tn 5
required for transposition. Nature 304:280-282.
60. Yang G, Nagel DH, Feschotte C, Hancock CN, Wessler SR (2009) Tuned for
transposition: molecular determinants underlying the hyperactivity of a Stowaway MITE.
Science 325:1391-1394.
61. Hartl DL, Lozovskaya ER, Lawrence JG (1992) Nonautonomous transposable elements in
prokaryotes and eukaryotes. Genetica 86:47-53.
62. Lampe DJ, Walden KK, Robertson HM (2001) Loss of transposase-DNA interaction may
underlie the divergence of mariner family transposable elements and the ability of more
than one mariner to occupy the same genome. Molecular Biology and Evolution 18:954-
961.
63. Feschotte C, Osterlund MT, Peeler R, Wessler SR (2005) DNA-binding specificity of rice
mariner-like transposases and interactions with Stowaway MITEs. Nucleic Acids Research
33:2153-2165.
64. Orgel LE, Crick FH (1980) Selfish DNA: the ultimate parasite. Nature 284:604-607.
65. Bingham PM, Kidwell MG, Rubin GM (1982) The molecular basis of P-M hybrid
dysgenesis: the role of the P element, a P-strain-specific transposon family. Cell 29:995-
991004.
66. Engels WR et al. (1987) Somatic effects of P element activity in Drosophila melanogaster:
pupal lethality. Genetics 117:745-757.
67. Kidwell MG, Lisch D (1997) Transposable elements as sources of variation in animals and
plants. Proceedings of the National Academy of Sciences 94:7704-7711.
68. Biessmann H et al. (1992) HeT-A, a transposable element specifically involved in
“healing” broken chromosome ends in Drosophila melanogaster. Molecular and Cellular
Biology 12:3910-8.
69. Pardue ML, Danilevskaya ON, Lowenhaupt K, Slot F, Traverse KL (1996) Drosophila
telomeres: new views on chromosome evolution. Trends in Genetics 12:48-52.
70. Pardue M-L, DeBaryshe PG (2008) Drosophila telomeres: A variation on the telomerase
theme. Fly 2:101-110.
71. Moore JK, Haber JE (1996) Capture of retrotransposon DNA at the sites of chromosomal
double-strand breaks. Nature 383:644-646.
72. Teng SC, Kim B, Gabriel A (1996) Retrotransposon reverse-transcriptase-mediated repair
of chromosomal breaks. Nature 383:641-644.
73. Cooley L, Kelley R, Spradling A (1988) Insertional mutagenesis of the Drosophila
genome with single P elements. Science 239:1121-1128.
75
74. Ivics Z, Izsvák Z (2004) in Mobile Genetic Elements (Humana Press, New Jersey), pp
255-276.
75. Ostertag EM, Madison BB, Kano H (2007) Mutagenesis in rodents using the L1
retrotransposon. Genome Biology 8:S16.
76. Kidwell MG (2002) Transposable elements and the evolution of genome size in
eukaryotes. Genetica 115:49-63.
77. Evgen’ev MB et al. (2000) Mobile elements and chromosomal evolution in the virilis
group of Drosophila. Proceedings of the National Academy of Sciences 97:11337 -11342.
78. Oliver KR, Greene WK (2009) Transposable elements: powerful facilitators of evolution.
BioEssays 31:703-714.
79. Belancio VP, Hedges DJ, Deininger P (2008) Mammalian non-LTR retrotransposons: For
better or worse, in sickness and in health. Genome Research 18:343 -358.
80. Bartolomé C, Maside X, Charlesworth B (2002) On the Abundance and Distribution of
Transposable Elements in the Genome of Drosophila melanogaster. Molecular Biology
and Evolution 19:926 -937.
81. Callinan PA, Batzer MA (2006) in Genome and Disease (Karger Publishers, New York),
pp 104-115.
82. Wallace NA, Belancio VP, Deininger PL (2008) L1 mobile element expression causes
multiple types of toxicity. Gene 419:75-81.
83. Girard L, Freeling M (1999) Regulatory changes as a consequence of transposon insertion.
Developmental Genetics 25:291-296.
84. Medstrand P et al. (2005) Impact of transposable elements on the evolution of mammalian
gene regulation. Cytogenetic and Genome Research 110:342-352.
85. Kashkush K, Khasdan V (2007) Large-Scale Survey of Cytosine Methylation of
Retrotransposons and the Impact of Readout Transcription From Long Terminal Repeats
on Expression of Adjacent Rice Genes. Genetics 177:1975 -1985.
86. Romanish MT, Lock WM, de Lagemaat LN van, Dunn CA, Mager DL (2007) Repeated
Recruitment of LTR Retrotransposons as Promoters by the Anti-Apoptotic Locus NAIP
during Mammalian Evolution. PLoS Genetics 3:e10.
87. McClintock B (1950) The origin and behavior of mutable loci in maize. Proceedings of
the National Academy of Sciences 36:344-355.
88. Calvi BR, Hong TJ, Findley SD, Gelbart WM (1991) Evidence for a common
evolutionary origin of inverted repeat transposons in Drosophila and plants: hobo,
Activator, and Tam3. Cell 66:465-71.
76
89. Feldmar S, Kunze R (1991) The ORFa protein, the putative transposase of maize
transposable element Ac, has a basic DNA binding domain. EMBO Journal 10:4003-4010.
90. Warren WD, Atkinson PW, O’Brochta DA (1995) The Australian bushfly Musca
vetustissima contains a sequence related to transposons of the hobo, Ac and Tam3 family.
Gene 154:133-134.
91. Kempken F, Windhofer F (2001) The hAT family: a versatile transposon group common
to plants, fungi, animals, and man. Chromosoma 110:1-9.
92. Lander ES et al. (2001) Initial sequencing and analysis of the human genome. Nature
409:860-921.
93. Sinzelle L, Izsvak Z, Ivics Z (2009) Molecular domestication of transposable elements:
from detrimental parasites to useful host genes. Cell and Molecular Life Sciences 66:1073-
1093.
94. Bundock P, Hooykaas P (2005) An Arabidopsis hAT-like transposase is essential for plant
development. Nature 436:282-284.
95. Hirose F et al. (2001) Ectopic expression of DREF induces DNA synthesis, apoptosis, and
unusual morphogenesis in the Drosophila eye imaginal disc: possible interaction with
Polycomb and trithorax group proteins. Molecular and Cellular Biology 21:7231-7242.
96. Hirose F et al. (1996) Isolation and Characterization of cDNA for DREF, a Promoter-
activating Factor for Drosophila DNA Replication-related Genes. Journal of Biological
Chemistry 271:3930 -3937.
97. Kempken F, Kuck U (1996) restless, an active Ac-like transposon from the fungus
Tolypocladium inflatum: structure, expression, and alternative RNA splicing. Molecular
and Cellular Biology 16:6563-6572.
98. Essers L, Adolphs RH, Kunze R (2000) A highly conserved domain of the maize activator
transposase is involved in dimerization. Plant Cell 12:211-224.
99. Zhou L et al. (2004) Transposition of hAT elements links transposable elements and
V(D)J recombination. Nature 432:995-1001.
100. Hickman AB et al. (2005) Molecular architecture of a eukaryotic DNA transposase.
Nature Structural & Molecular Biology 12:715-721.
101. Arensburger P et al. (2011) Phylogenetic and Functional Characterization of the hAT
Transposon Superfamily. Genetics 188:45 -57.
102. Salvado J, Bensaadi-Merchermek N, Mouches C (1994) Transposable elements in
mosquitoes and other insect species. Comparative Biochemistry and Physiology Part B:
Comparative Biochemistry 109:531-544.

77
103. Gubler DJ (1998) Dengue and Dengue Hemorrhagic Fever. Clinical Microbiology
Reviews 11:480-496.
104. Tomori O (2004) Yellow Fever: The Recurring Plague. Critical Reviews in Clinical
Laboratory Sciences 41:391-427.
105. Ligon BL (2006) Infectious Diseases that Pose Specific Challenges After Natural
Disasters: A Review. Seminars in Pediatric Infectious Diseases 17:36-45.
106. Yang G, Hall TC (2003) MAK, a computational tool kit for automated MITE analysis.
Nucleic Acids Research 31:3659-3665.
107. Larkin MA et al. (2007) Clustal W and Clustal X version 2.0. Bioinformatics 23:2947 -
2948.
108. Rivero J et al. (2004) Optimization of Extraction Procedure for Mosquito DNA Suitable
for PCR-Based Techniques. International Journal of Tropical Insect Science 24:266-269.
109. Altschul SF, Gish W, Miller W, Myers EW, Lipman DJ (1990) Basic local alignment
search tool. Journal of Molecular Biology 215:403-410.
110. Jurka J (2000) Repbase Update: a database and an electronic journal of repetitive
elements. Trends in Genetics 16:418-420.
111. Craig NL (2002) in Mobile DNA II (American Society for Microbiology Press,
Washington, D.C.), pp 3-11.
112. Levine A, Durbin R (2001) A computational scan for U12-dependent introns in the human
genome sequence. Nucleic Acids Research 29:4006-4013.
113. Sheth N et al. (2006) Comprehensive splice-site analysis using comparative genomics.
Nucleic Acids Research 34:3955-3967.
114. Marchler-Bauer A et al. (2011) CDD: a Conserved Domain Database for the functional
annotation of proteins. Nucleic Acids Research 39:D225-D229.
115. Tamura K et al. (2011) MEGA5: Molecular Evolutionary Genetics Analysis using
Maximum Likelihood, Evolutionary Distance, and Maximum Parsimony Methods.
Molecular Biology and Evolution In Press.
116. Wallace IM, O’Sullivan O, Higgins DG, Notredame C (2006) M-Coffee: combining
multiple sequence alignment methods with T-Coffee. Nucleic Acids Research 34:1692 -
1699.
117. Darriba D, Taboada GL, Doallo R, Posada D (2011) ProtTest 3: fast selection of best-fit
models of protein evolution. Bioinformatics 27:1164 -1165.
78
118. Schmidt HA, Strimmer K, Vingron M, von Haeseler A (2002) TREE-PUZZLE: maximum
likelihood phylogenetic analysis using quartets and parallel computing. Bioinformatics
18:502 -504.
119. Crooks GE, Hon G, Chandonia J-M, Brenner SE (2004) WebLogo: A Sequence Logo
Generator. Genome Research 14:1188 -1190.
120. Dillon PJ, Rosen CA (1990) A rapid method for the construction of synthetic genes using
the polymerase chain reaction. Biotechniques 9:298-300.
121. Gietz RD, Schiestl RH (2007) Frozen competent yeast cells that can be transformed with
high efficiency using the LiAc/SS carrier DNA/PEG method. Nature Protocols 2:1-4.
122. Mota NR, Ludwig A, Da Silva Valente VL, Loreto ELS (2010) harrow: new Drosophila
hAT transposons involved in horizontal transfer. Insect Molecular Biology 19:217-228.
123. Feschotte C, Swamy L, Wessler SR (2003) Genome-Wide Analysis of mariner-Like
Transposable Elements in Rice Reveals Complex Relationships With Stowaway Miniature
Inverted Repeat Transposable Elements (MITEs). Genetics 163:747-758.
124. Adelman ZN, Jasinskiene N, James AA (2002) Development and applications of
transgenesis in the yellow fever mosquito, Aedes aegypti. Molecular and Biochemical
Parasitology 121:1-10.
125. Van den Broeck D et al. (1998) Transposon Display identifies individual transposable
elements in high copy number lines. Plant Journal 13:121-129.
126. Vos P et al. (1995) AFLP: a new technique for DNA fingerprinting. Nucleic Acids
Research 23:4407-4414.
127. Slotkin RK et al. (2009) Epigenetic reprogramming and small RNA silencing of
transposable elements in pollen. Cell 136:461-472.
128. Bohne A, Brunet F, Galiana-Arnoux D, Schultheis C, Volff J-N (2008) Transposable
elements as drivers of genomic and biological diversity in vertebrates. Chromosome
Research 16:203-215.
129. Kidwell MG, Lisch DR (2000) Transposable elements and host genome evolution. Trends
in Ecology & Evolution 15:95-99.
130. Gregory TR (2005) Synergy between sequence and size in large-scale genomics. Nature
Reviews Genetics 6:699-708.
131. Lynch M, Conery JS (2003) The Origins of Genome Complexity. Science 302:1401 -
1404.
.

79
Appendix I: Supplementary Materials
Supplementary Table 1: Consensus sequences of hAT MITE families from TEfam (http://tefam.biochem.vt.edu)
Family Name Length (bp)
TF000576 371
TF000719 397
TF000720 470
TF00072 481
TF000724 441
TF000725 431
TF001258 1288
TF001274 562
TF001275 420
TF001302 562
Consensus Sequence
CAGTGTTGTTCAGACTCATTTCCCCGAAAATAACATTTTCCGAACTACGAAGCCACGAAGTACTACAACCATGCTCTATGCTCCTAAGATAGAAAAGCAGATGGTTGAGCTTCAGTACTGCACACAAAATCGGA
TCAATTTGACCCAGAGAGCCACAATTCAAGTTTCGGTCAAATAAATGAGTGAGTGAGTGAGTTCGAATCATTTCACCGAAACTTGAATTACGGCCCACCGAGATCGAAACTGTCGGGTCCCATGTGCAACACTC
AAGCCCAACCACCTCCCCCTCCATCTCAGGAATACAACGCACAGTTATAACAGTTCATGGCTTCACAATTCGAATTTCGGGGAAATGAGTCTGGTCAACACTG
CTGAGAGAGAGGAGACAGCTGGCTTAGATTGCGAGCTCCCAAAAGTCATGGAAACCTGTCATCAACTGTCACTGAAAAACCGCACATTCGAGGGGCAGAGCGTGAAAAACCGTCAAAATTTGGCCAAACTAAA
ACTGGATGTGATTGAAATAGCAGGTTGCTTTCCTGTGCTCTCGCATATAAAATCGTTGAATATTTAAATATTGTCGATTGGACTAAAATCACTATTAAAGTTTTTCAGTTTTATGATCTTTTTGATAACAAATGGGA
TGTGAAAATGCTTTTGAACCGGTTTGTGCTCTCCGAACCATTGTGCACAACCCAAACATGAGAAGAAGACATCAAAGAAAGCAAAAAAACAAAGCCAGTTGTCAGTGAGCTGTCTCCTCTCTCTCAG
CTGGGAGGGAGAAACCAATACAAAATTTATGTACGTCATAGTGAGCCGGGATTCCGCTGTCACGAACTGTCACTGTGAGCCCAGATCTCAAACATTGGACTAACATGGAAAAAGCGCGTAACTGATTAAAACA
GATTTTCGCATTTCATCAAAAGTGACAAAAATCGAATGAAAATTAATTCATGCACACGATGCAAGTAATGTCACGTGAGCACCTTTCAATCTGATTGAATATAAAGCATTGAAAAACGCATCGTTTAACTTTTTC
CAGTGAAAATGAATATTTAGTGCATAGAAAACTGTGGCCCTTTTTCCATGTTTGTCAGGCAAGATCGAAAGTACACAACAAAAGAAAACTAGCGATTTTCCCCGAAGCCGGCCTTGATTGTTGTTGGCAAGCTG
AAGTTATCTTGCAGTTCAAACAAACGTTGTTCTATATTTCGTGTGTAGTATCTGTGCCTCCCTCCTAG
TAGAGTTACATATTTCTCAGGAGCACATAAATGTACTGACGAGCCTCCAACCAAACCGTCTCTCAGCTCATCGGAATCCTAGTGTGCTGCGCTAGACGGAAGCTCACGAAAATTTTGAAAGCGCGCGCTAAGTG
ATGTGCTCCCGGGGAGACTCGTCTCATGCGCTGTTCGGCGCTACGGCTCGCCTTCGGTATCCAAGTTGTGAAACAACTGCTTAGTAACGAACAGCCTCTACAACTATTTTCGCTTCATTATACAGGTGTCTAGAT
GGTCTACATGATATGGTCGAAGACTCGCGATCCAAGAGTTACCATTTTAATTTTAAACAGCACATGTGACGGAGCACATGAGACCGCAGTGATACACATCTCAAGAAAAATGAGGCGCACCGAAAAAGGTCTC
ACAATGTACAGCGCTCCCGTGCGCTTGCAAGCAATGAGGCTCCTGCACCTAAGGCTACAGCACGTGCACAGTAACTCTA
TAGCGTTGGGCAAATTTGTCTAAAACATCGATGTTAGTGAATCGATTCACATTTGAACTGCCGTATCGATTCACCGATTTAATCGAATCCTTTGAATCGATGTTCGTGAATCGATTCGAATCGATTAAATTTTTTTT
TTTTTTTTGATTTTGAAATGAGACCAAATGCATTTACATTGTATTTTAACATCTCTGAATTTAAATTAATTATTAAATTCAACAAGACAAATTTACTATTTCAAGGCTAGTTCAAAATTTGGTTTCTTTTCATCAGTT
CATTAAGAAATATTCATAAATTTTAACAAAATGAATCGAATCAAAAAATCGAATGAAGAAAATCGATTCACCTGATTTCAGATGCCCCAAACATCGATTCAAAAAATCGATTAATCGGAATGAAACATCGATTT
TCGGAACATCGATTCAAAATCGCCCAACGCTA
TAGTGATCCTTTATAGAGAGATAAGCGGAAGTAAAATGGAATGATTTGGCAACAGACCAGCAGTGCTGATTTTGCTCGGCATCGAGAATAATATTGTAACACGGACATGACTTCCTCATTGCTAAAAAGTGTATT
TTGTTTCGTTATAGATCTTTGAGCTACATATCCAAACTAATAAACAACCGAAAAAATCAACAACTAAAAGTCGCATTGACAAATATTTAAAAAAGAAAAATATTTCATTGTTTTGCTTTATGCAAAATTACTTTTA
CCGAAATAATTTCAAGCGGATTGCATTACTCCTCAAGAAAAGTTCAACACAAACATAACGCATGTTCGTTTGGCTCACACTTTGACAGCTCTCGCTGCTCGATTGGCTCACACTTTGACAGAAATGTCAGCTTCC
GCAAATCTCTTATAAAGGATTACTA
TAGGGTGCGGCTTATTTTTGAAAAGTTCTCAAAACCAAAAATTCGTGTGCTCTACTGAATTCAAATCACATTAAAAGAGAAACGTCAAAATTTGAGCCAAAAATATTAACATTTAGAGGTGGCGCAAGCGTCTTG
AAGTTGAATTTTCAGGTTATAAAAAATGACCTTCAGTAAAGTACACATAACTTTGTTATTTTTCAACCGATTTTAAAACTTTTAGCATCAATACCTTCAAAATTAAATTTGTTAAAACTTTGTTGAACAGCAAATTT
GTCTAAAATCAAAACAAGTTTTAGTTAAAAGTAATTTATTCCAAATTTTTCCTCATTTTACTAAAAATTTCAACTTTGTTTGACCATAACTTCATGATTACTCAACCGATTCCAAATCTTTTTACATGATTTTGATG
CTAATTTAATTGTTTTCAAACCATTCATATATCATATTTCACTAAAAAAATGTCTTGACCAAGTTATTCAGCAAAAACTGCACAAAAACATTATTTTATAACGAAAAATGCCAGTTTTGTCAAATCTTTGGCAGTT
AAATATTGTCTCTTAAGCTGAAACTGATTTTTATCATTTGTTAAACCTTTGGAAAGGACTTTGCAACAACTTTTAAATAATTTTGAAACAAAATTATGATTGCATATGTTAAAAATATATGCACTATTCAACTCGTA
ACTAAGGCAAGATGCTTTACATATTTAAGTTTAAAAAGAAAAAATGCTGTTTTCGGCAAAAAAACTTAAATTATCCAAAGAAATTTGATTTTTTCATTGAAAAATCATGTTTTTGGGTAGTTTTTGTTGAATACCTA
AGTCAAAAATATTTTTTAGAAAAAGATGTTGTATGTACAGTTTGAAAACAAATAAATTTTCTTCAAAAGTATGTGAAAAGTTTTGGAATCGATTGAGTTTTAATGAAGTTATGGTCAAACAAAAATGATTTTTTTAG
CAAAATGAGGAAAAATTTGGATATAAGTATTTTTAACTAAGACAAGTTTTGATTTTAGACAAATTTGATGTTCTACAAAATTTTTATAAATTTAATTTGAAAGAAAATGGTGCTAAAAGTTTTGAAATCGGTCTAA
AAATAACAAAGTTATGTTTACTTAACTGGAGGTAATTTTTTATAACTTGAAAATTCACCTTCAACACGCTTGCGCCACCTCTAAATGTTAATATTTTTGGCTCAGATTTTGAGGTTTCTCTTTTTTTGTGATTTGAAT
TCAGTAGAGCACACGAATTTTCGGTTTTGAGAACTTTTGAAAAATAAGCCGCACCCTA
CAGGCTTTGGAAAATTTAACGATCATTGACATACGAGCCATAATTTCATCTCATTTATCCGCCTGCATTCATACAACACGCATGACATTTATCGTTCGTGGAAGATAACGAGCCATGAACGAAAACAAGACAGA
CACACACCACCCACTGTTTGGCGCCGATCACTGTGTGTCAACACTTGTAACATTCGCTGACCCACTCTCATTCTGATCAAGAAACAGAGGCGAATATTTTCTATTTTCTGTGCTATGTTTGCAACCAAAGGGGTG
TTCAATGATCCAATAGATTATAATTAGGTTGTTAAAGGCTGCATTACCAGAAAATATGAAAGTTATTACCAATTTTATGCAAAACATAAATCACCCGAATGGCTCGATACTGTTGCAGTCTGTGAGAGTTGCTGC
TCTTGAACGCTCTCGTGCCACGTACCAAACGAGAGAGTGAATGTTTACATTCATAGGGCTCTCCGAATGCGATGTGCCACGAACTGTTATGGTTCGCGAACTGTAACACTCTCCGAATATGGTTCGATCGGCTTA
TTCGGATCAAAATCCAAACACTG
CAGGCTTGATAGAAACTCCTCTGCGATGCAAAGAGGAGGCGATTTTGCCGTTTTTCTGAGGAGAAAAAAATAAACTCAAAATTTTCAACACAGATCCTCAAGCGATTCGAGTGAGAGTGCAGAAAAATGCGAGG
ATTTTTTCAGACACTCTCTCTCTCTCGTTGCGATGCTCACCATCACTCACACTTCAAACGAACTCTCGAGTCTGCCGCCCGAACAGACAGTCCTCGGGGAGTTGTGAGAGCACCCTTTTTTGATGGAATTTTACT
CGGTTTTTTTTTGTGCTGCATCTTCCTCGCTCATTTTTCGTTGCCTCTCTGCTTAGCATTTTTTCGCTCCCTCGCAAAGAGGCAAAGGCAGCACGCTGCTCTAGAGTATGTCACCGAACTCTGATGATGTTGAGGA
GAATTATCAAGCCTG
CAGGCTTCCGAATTCTCACTCACTCTCACGATAATGGATTTATCCCTCACAGCAATTTTCAGCGATCAGCTGCCTTGGGATTTTATCCGTCCACAAAACAAAGCGAAAATAGATAATTGCACATTTCCGCAGCTG
CGAGAAGTTTGTTTTCTCTTTCTCCGATCCATGGAGAATTTTTCCTGTATCCATCGCCACGAGCAGCAGTTGCTTTTATGCACCAAATTAACCACTCCTTTCGTCAAGTTGGTGTGGTAGCATGGTTAGCGTGCAC
GCATCGCGGTTGTTTTTAGCAATGTTCTAGGTTCGAATCCCATCGCCGGCACTAGTTTTTGTTTATCCACATAGTGATAATTCTCCGGAGCAGTTGGTGAGCGAAAATATGATGGAGTGAAAATCAAATTATCCA
CAGAGTGGAGTGATTTTCGGTTATCCACCATCGTAGCTCCAGGGAAAATTAGTGTGAGCGATAAAAGATGTTCACGCGAGGAAGCGAAAAAAGCATTCTCCTTACGTGCGAAAAATCGTAGATTTCGCATCATT
GATACGAAAATTCAGAACCCTG
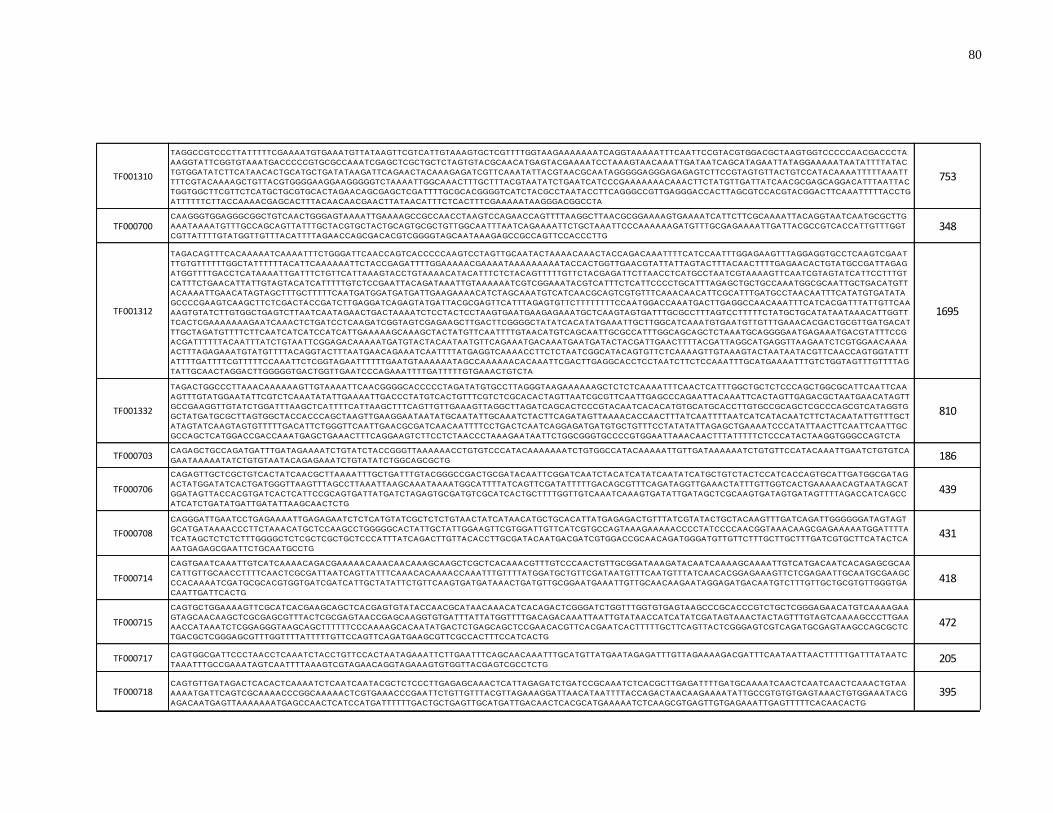
80
TF001310 753
TF000700 348
TF001312 1695
TF001332 810
TF000703 186
TF000706 439
TF000708 431
TF000714 418
TF000715 472
TF000717 205
TF000718 395
CAGGGATTGAATCCTGAGAAAATTGAGAGAATCTCTCATGTATCGCTCTCTGTAACTATCATAACATGCTGCACATTATGAGAGACTGTTTATCGTATACTGCTACAAGTTTGATCAGATTGGGGGGATAGTAGT
GCATGATAAAACCCTTCTAAACATGCTCCAAGCCTGGGGGCACTATTGCTATTGGAAGTTCGTGGATTGTTCATCGTGCCAGTAAAGAAAAACCCCTATCCCCAACGGTAAACAAGCGAGAAAAATGGATTTTA
TCATAGCTCTCTCTTTGGGGCTCTCGCTCGCTGCTCCCATTTATCAGACTTGTTACACCTTGCGATACAATGACGATCGTGGACCGCAACAGATGGGATGTTGTTCTTTGCTTGCTTTGATCGTGCTTCATACTCA
AATGAGAGCGAATTCTGCAATGCCTG
CAGTGAATCAAATTGTCATCAAAACAGACGAAAAACAAACAACAAAGCAAGCTCGCTCACAAACGTTTGTCCCAACTGTTGCGGATAAAGATACAATCAAAAGCAAAATTGTCATGACAATCACAGAGCGCAA
CATTGTTGCAACCTTTTCAACTCGCGATTAATCAGTTATTTCAAACACAAAACCAAATTTGTTTTATGGATGCTGTTCGATAATGTTTCAATGTTTATCAACACGGAGAAAGTTCTCGAGAATTGCAATGCGAAGC
CCACAAAATCGATGCGCACGTGGTGATCGATCATTGCTATATTCTGTTCAAGTGATGATAAACTGATGTTGCGGAATGAAATTGTTGCAACAAGAATAGGAGATGACAATGTCTTTGTTGCTGCGTGTTGGGTGA
CAATTGATTCACTG
CAGTGCTGGAAAAGTTCGCATCACGAAGCAGCTCACGAGTGTATACCAACGCATAACAAACATCACAGACTCGGGATCTGGTTTGGTGTGAGTAAGCCCGCACCCGTCTGCTCGGGAGAACATGTCAAAAGAA
GTAGCAACAAGCTCGCGAGCGTTTACTCGCGAGTAACCGAGCAAGGTGTGATTTATTATGGTTTTGACAGACAAATTAATTGTATAACCATCATATCGATAGTAAACTACTAGTTTGTAGTCAAAAGCCCTTGAA
AACCATAAATCTCGGAGGGTAAGCAGCTTTTTTCCCAAAAGCACAATATGACTCTGAGCAGCTCCGAACACGTTCACGAATCACTTTTTGCTTCAGTTACTCGGGAGTCGTCAGATGCGAGTAAGCCAGCGCTC
TGACGCTCGGGAGCGTTTGGTTTTATTTTTGTTCCAGTTCAGATGAAGCGTTCGCCACTTTCCATCACTG
CAGTGGCGATTCCCTAACCTCAAATCTACCTGTTCCACTAATAGAAATTCTTGAATTTCAGCAACAAATTTGCATGTTATGAATAGAGATTTGTTAGAAAAGACGATTTCAATAATTAACTTTTTGATTTATAATC
TAAATTTGCCGAAATAGTCAATTTTAAAGTCGTAGAACAGGTAGAAAGTGTGGTTACGAGTCGCCTCTG
CAGTGTTGATAGACTCACACTCAAAATCTCAATCAATACGCTCTCCCTTGAGAGCAAACTCATTAGAGATCTGATCCGCAAATCTCACGCTTGAGATTTTGATGCAAAATCAACTCAATCAACTCAAACTGTAA
AAAATGATTCAGTCGCAAAACCCGGCAAAAACTCGTGAAACCCGAATTCTGTTGTTTACGTTAGAAAGGATTAACATAATTTTACCAGACTAACAAGAAAATATTGCCGTGTGTGAGTAAACTGTGGAAATACG
AGACAATGAGTTAAAAAAATGAGCCAACTCATCCATGATTTTTTGACTGCTGAGTTGCATGATTGACAACTCACGCATGAAAAATCTCAAGCGTGAGTTGTGAGAAATTGAGTTTTTCACAACACTG
TAGGCCGTCCCTTATTTTTCGAAAATGTGAAATGTTATAAGTTCGTCATTGTAAAGTGCTCGTTTTGGTAAGAAAAAAATCAGGTAAAAATTTCAATTCCGTACGTGGACGCTAAGTGGTCCCCCAACGACCCTA
AAGGTATTCGGTGTAAATGACCCCCGTGCGCCAAATCGAGCTCGCTGCTCTAGTGTACGCAACATGAGTACGAAAATCCTAAAGTAACAAATTGATAATCAGCATAGAATTATAGGAAAAATAATATTTTATAC
TGTGGATATCTTCATAACACTGCATGCTGATATAAGATTCAGAACTACAAAGAGATCGTTCAAATATTACGTAACGCAATAGGGGGAGGGAGAGAGTCTTCCGTAGTGTTACTGTCCATACAAAATTTTTAAATT
TTTCGTACAAAAGCTGTTACGTGGGGAAGGAAGGGGGTCTAAAATTGGCAAACTTTGCTTTACGTAATATCTGAATCATCCCGAAAAAAACAAACTTCTATGTTGATTATCAACGCGAGCAGGACATTTAATTAC
TGGTGGCTTCGTTCTCATGCTGCGTGCACTAGAACAGCGAGCTCGATTTTGCGCACGGGGTCATCTACGCCTAATACCTTCAGGGCCGTTGAGGGACCACTTAGCGTCCACGTACGGACTTCAAATTTTTACCTG
ATTTTTTCTTACCAAAACGAGCACTTTACAACAACGAACTTATAACATTTCTCACTTTCGAAAAATAAGGGACGGCCTA
CAAGGGTGGAGGGCGGCTGTCAACTGGGAGTAAAATTGAAAAGCCGCCAACCTAAGTCCAGAACCAGTTTTAAGGCTTAACGCGGAAAAGTGAAAATCATTCTTCGCAAAATTACAGGTAATCAATGCGCTTG
AAATAAAATGTTTGCCAGCAGTTATTTGCTACGTGCTACTGCAGTGCGCTGTTGGCAATTTAATCAGAAAATTCTGCTAAATTCCCAAAAAAGATGTTTGCGAGAAAATTGATTACGCCGTCACCATTGTTTGGT
CGTTATTTTGTATGGTTGTTTACATTTTAGAACCAGCGACACGTCGGGGTAGCAATAAAGAGCCGCCAGTTCCACCCTTG
TAGACAGTTTCACAAAAATCAAAATTTCTGGGATTCAACCAGTCACCCCCAAGTCCTAGTTGCAATACTAAAACAAACTACCAGACAAATTTTCATCCAATTTGGAGAAGTTTAGGAGGTGCCTCAAGTCGAAT
TTGTGTTTTTTGGCTATTTTTTACATTCAAAAAATTCTACCGAGATTTTGGAAAAACGAAAATAAAAAAAAATACCACTGGTTGAACGTATTATTAGTACTTTACAACTTTTGAGAACACTGTATGCCGATTAGAG
ATGGTTTTGACCTCATAAAATTGATTTCTGTTCATTAAAGTACCTGTAAAACATACATTTCTCTACAGTTTTTGTTCTACGAGATTCTTAACCTCATGCCTAATCGTAAAAGTTCAATCGTAGTATCATTCCTTTGT
CATTTCTGAACATTATTGTAGTACATCATTTTTGTCTCCGAATTACAGATAAATTGTAAAAAATCGTCGGAAATACGTCATTTCTCATTCCCCTGCATTTAGAGCTGCTGCCAAATGGCGCAATTGCTGACATGTT
ACAAAATTGAACATAGTAGCTTTGCTTTTTCAATGATGGATGATGATTGAAGAAAACATCTAGCAAATGTCATCAACGCAGTCGTGTTTCAAACAACATTCGCATTTGATGCCTAACAATTTCATATGTGATATA
GCCCCGAAGTCAAGCTTCTCGACTACCGATCTTGAGGATCAGAGTATGATTACGCGAGTTCATTTAGAGTGTTCTTTTTTTTCCAATGGACCAAATGACTTGAGGCCAACAAATTTCATCACGATTTATTGTTCAA
AAGTGTATCTTGTGGCTGAGTCTTAATCAATAGAACTGACTAAAATCTCCTACTCCTAAGTGAATGAAGAGAAATGCTCAAGTAGTGATTTGCGCCTTTAGTCCTTTTTCTATGCTGCATATAATAAACATTGGTT
TCACTCGAAAAAAAGAATCAAACTCTGATCCTCAAGATCGGTAGTCGAGAAGCTTGACTTCGGGGCTATATCACATATGAAATTGCTTGGCATCAAATGTGAATGTTGTTTGAAACACGACTGCGTTGATGACAT
TTGCTAGATGTTTTCTTCAATCATCATCCATCATTGAAAAAGCAAAGCTACTATGTTCAATTTTGTAACATGTCAGCAATTGCGCCATTTGGCAGCAGCTCTAAATGCAGGGGAATGAGAAATGACGTATTTCCG
ACGATTTTTTACAATTTATCTGTAATTCGGAGACAAAAATGATGTACTACAATAATGTTCAGAAATGACAAATGAATGATACTACGATTGAACTTTTACGATTAGGCATGAGGTTAAGAATCTCGTGGAACAAAA
ACTTTAGAGAAATGTATGTTTTACAGGTACTTTAATGAACAGAAATCAATTTTATGAGGTCAAAACCTTCTCTAATCGGCATACAGTGTTCTCAAAAGTTGTAAAGTACTAATAATACGTTCAACCAGTGGTATTT
ATTTTGATTTTCGTTTTTCCAAATTCTCGGTAGAATTTTTTGAATGTAAAAAATAGCCAAAAAACACAAATTCGACTTGAGGCACCTCCTAATCTTCTCCAAATTTGCATGAAAATTTGTCTGGTAGTTTGTTTTAG
TATTGCAACTAGGACTTGGGGGTGACTGGTTGAATCCCAGAAATTTTGATTTTTGTGAAACTGTCTA
TAGACTGGCCCTTAAACAAAAAAGTTGTAAAATTCAACGGGGCACCCCCTAGATATGTGCCTTAGGGTAAGAAAAAAGCTCTCTCAAAATTTCAACTCATTTGGCTGCTCTCCCAGCTGGCGCATTCAATTCAA
AGTTTGTATGGAATATTCGTCTCAAATATATTGAAAATTGACCCTATGTCACTGTTTCGTCTCGCACACTAGTTAATCGCGTTCAATTGAGCCCAGAATTACAAATTCACTAGTTGAGACGCTAATGAACATAGTT
GCCGAAGGTTGTATCTGGATTTAAGCTCATTTTCATTAAGCTTTCAGTTGTTGAAAGTTAGGCTTAGATCAGCACTCCCGTACAATCACACATGTGCATGCACCTTGTGCCGCAGCTCGCCCAGCGTCATAGGTG
GCTATGATGCGCTTAGTGGCTACCACCCAGCTAAGTTGAAGGAATAATATGCAATATTGCAAATCTACTTCAGATAGTTAAAACACCAACTTTATCAATTTTAATCATCATACAATCTTCTACAATATTGTTTGCT
ATAGTATCAAGTAGTGTTTTTGACATTCTGGGTTCAATTGAACGCGATCAACAATTTTCCTGACTCAATCAGGAGATGATGTGCTGTTTCCTATATATTAGAGCTGAAAATCCCATATTAACTTCAATTCAATTGC
GCCAGCTCATGGACCGACCAAATGAGCTGAAACTTTCAGGAAGTCTTCCTCTAACCCTAAAGAATAATTCTGGCGGGTGCCCCGTGGAATTAAACAACTTTATTTTTCTCCCATACTAAGGTGGGCCAGTCTA
CAGAGCTGCCAGATGATTTGATAGAAAATCTGTATCTACCGGGTTAAAAAACCTGTGTCCCATACAAAAAAATCTGTGGCCATACAAAAATTGTTGATAAAAAATCTGTGTTCCATACAAATTGAATCTGTGTCA
GAATAAAAATATCTGTGTAATACAGAGAAATCTGTATATCTGGCAGCGCTG
CAGAGTTGCTCGCTGTCACTATCAACGCTTAAAATTTGCTGATTTGTACGGGCCGACTGCGATACAATTCGGATCAATCTACATCATATCAATATCATGCTGTCTACTCCATCACCAGTGCATTGATGGCGATAG
ACTATGGATATCACTGATGGGTTAAGTTTAGCCTTAAATTAAGCAAATAAAATGGCATTTTATCAGTTCGATATTTTTGACAGCGTTTCAGATAGGTTGAAACTATTTGTTGGTCACTGAAAAACAGTAATAGCAT
GGATAGTTACCACGTGATCACTCATTCCGCAGTGATTATGATCTAGAGTGCGATGTCGCATCACTGCTTTTGGTTGTCAAATCAAAGTGATATTGATAGCTCGCAAGTGATAGTGATAGTTTTAGACCATCAGCC
ATCATCTGATATGATTGATATTAAGCAACTCTG

81
Supplementary Table 2: Primer sequences used to amplify hAT MITEs from A. aegypti genomic DNA.
Mite Family Clade Forward Primer (5'-3') Reverse Primer (5'-3')
A TAGAGTTACATATTTCTCAGGAGCACATAAATGTACTGAC TAGAGTTACTGTGCACGTGCTGTAGC
B TAGAGTTACATATTTCTCTGGAGCACATAAATGTACTGAC TAGAGTTACTGTGCACGTGCTGTAGC
C TAGAGTCACATATTTCTCAGGATCACATAAATGTACTGAC TAGAGTTACGGTGCACGTGCTGTAG
D TAGAGTTACTTATTTCTCAGGAGCACATAAATGTACTGAC TAGAGTTACTGTGCACGTGCTGTAGC
A CAGTGTTGTTCAGACTCATTTCCCCG CAGTGTTGTTCAGACTCATTTCCCCG
B CAGTGTTGACCAGACTCATTTCCCC CAGTGTTGACCAGACTCATTTCCCC
C CAGTGTTGCTCAGACTCATTTCCCC CAGTGTTGCTCAGACTCATTTCCCC
D CAGTGTTGTTCAGACTCATTTCCCCG CAGTGTTGATCAGACTCATTTCCCCGA
E CAGTGTTGACCAGACTCATTTCCCC CAGTGTTGATCAGACTCATTTCCCCGA
F CAGTGTTGCTCAGACTCATTTCCCC CAGTGTTGATCAGACTCATTTCCCCGA
TF000700 A CAAGGGTGGAGGGCGG CAAGGGWGGWACTGGCGG
A CAGAGCTGCCAGATGATTTGATAGAAAACCT CAGGGCTGCCASATRTACAGATTTHYC
B CAGAGCTGCCAGATGATTTGATAGAAAATCTGT CAGGGCTGCCASATRTACAGATTTHYC
C CAGAGCTGCCAGATGATTTGAAAGAAAATCTG CAGGGCTGCCASATRTACAGATTTHYC
D CAGAGCTGCCAGATGGTTTGATAGAAAATCT CAGGGCTGCCASATRTACAGATTTHYC
A CAGAGTTGCTCGCTGTCACTATCAAYG CAGAGTTGCYTAATATCAATCATATCAGCTGATGGC
B CAGAGTTGCTCGATGTCACTATCAAYGC CAGAGTTGCYTAATATCAATCATATCAGCTGATGGC
A CAGGGATTGAATCCTGAGAAAATTGAGAGAATCTC CAGGCATTGCAGAATTCGCTCTCA
B CAGGGATTGAATCCTGAGAAAATTGAGAGAATCTC CAGGCGTTGCAGAATTCGCTCT
A CAGTGAATCAAATTATCATCAAAAYAGACRAAAAACAAAC CAGTGAATCAATTGTCACCCAACACG
B CAGTGAATCAAATTGTCATCAAAAYAGACRAAAAACA CAGTGAATCAATTGTCACCCAACACG
TF000715 A CAGTGCTGGAAAAGTTCGCATCACG CAGTGATGGAAAGTGGCGAACGC
A CAGTGGCGATTCCCTAACCTCAAATCTA CAGTGGCGACTCGTAACCTCAC
B CAGTGGCGATTCCCTAACCTCAAATCTA CAGAGGCGACTCGTAACCTCACT
TF000718 A CAGTGTTGATAGACTCACACTCAAAATMTCAATCAATACG CAGTGTTGTGAAAAACTCAATTTCTCACAACTCAC
TF000719 A CTGAGAGAGAGGAGACAGCTGGC CTGAGAGAGAGGAGACAGCTCACTGA
TF000720 A CTGGGAGGGAGAAACCAATACAAAATTTMTGTACG CTGGGAGGGAGGCACMGATACTA
A TAGCGTTGGGCAAATTTGTCYAKAACAT TAGCGWTGGGCGATTTTGAATCGATG
B TAGCGTTGGGCAAAATTGTCYAKAACATCGATGTTACTGA TAGCGWTGGGCGATTTTGAATCGATG
TF000725 A TAGTGATCCTTTATAGAGAGATAAGCGGAAGTAAAATGG TAGWAATCCTTTATAAGAGAGATTCGCGGAAGCT
TF001258 A TAGGGTGCGGCTTATTTTTSAAAAGTTCTCA TAGGGTGCGGCTTATTTTTSAAAAGTTCTCA
TF001274 A CAGGCTTTGGAAAATTTAACGATCATTGACACAC CAGTGTTTGGATTTYGATCMGAATAAGCCGA
TF001275 A CAGGCTTGATAGAAACTCCTCTGCGA CAGGCTTGATAATTCTCCTCAACATCATCAGAG
TF001302 A CAGGCTTCCGAATTCTCACTCACTCT CAGGGTTCTGAATTTTCGTATCAATGATGCGA
TF001310 A TAGGCCGTCCCTTATTTTTCGAAAATGC TAGGCCGTCCCTTATTTTTCGAAAATGC
TF001312 A TAGACAGTTTCACAAAAATMAAAATKTCTGGGATTYAACC TAGACAGTTTCACAAAAATMAAAATKTCTGGGATTYAACC
TF001332 A TAGACTGGCCCTTAAACAAAAAAGTTGTAAAAYTCAAC TAGACTGGCCCASYTYAGTATGGG
TF000717
TF000724
TF00072
TF000576
TF000703
TF000706
TF000708
TF000714
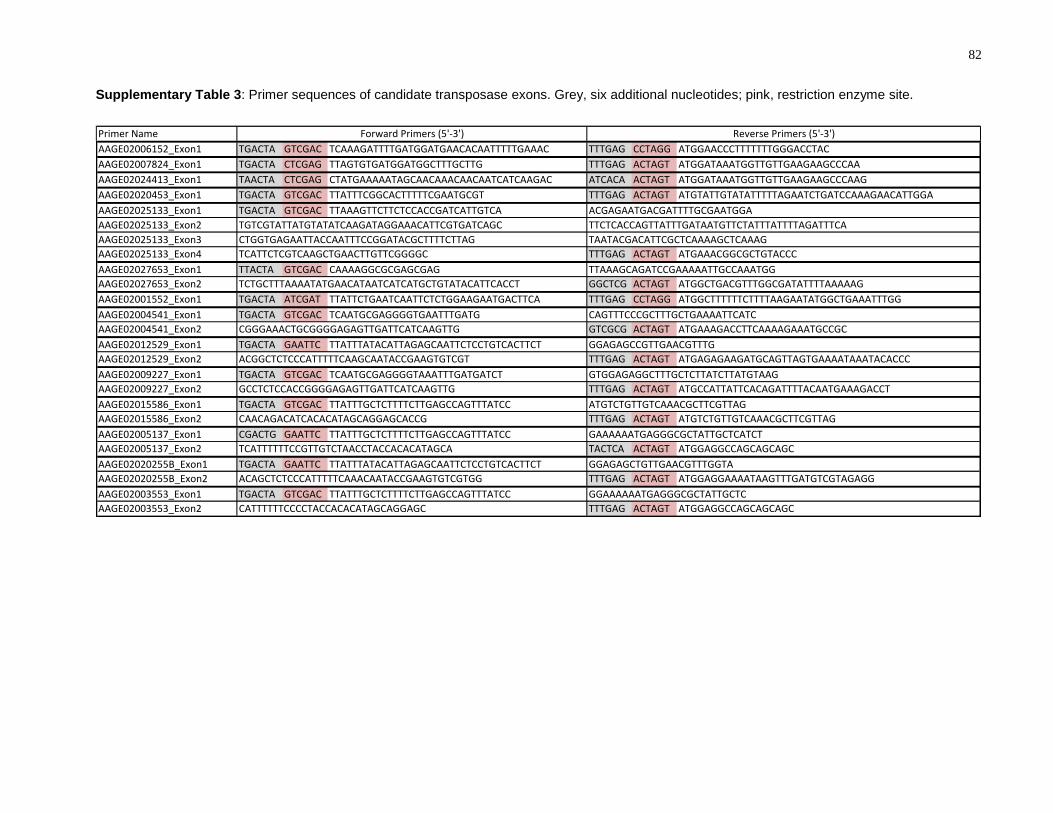
82
Supplementary Table 3: Primer sequences of candidate transposase exons. Grey, six additional nucleotides; pink, restriction enzyme site.
Primer Name
AAGE02006152_Exon1 TGACTA GTCGAC TCAAAGATTTTGATGGATGAACACAATTTTTGAAAC TTTGAG CCTAGG ATGGAACCCTTTTTTTGGGACCTAC
AAGE02007824_Exon1 TGACTA CTCGAG TTAGTGTGATGGATGGCTTTGCTTG TTTGAG ACTAGT ATGGATAAATGGTTGTTGAAGAAGCCCAA
AAGE02024413_Exon1 TAACTA CTCGAG CTATGAAAAATAGCAACAAACAACAATCATCAAGAC ATCACA ACTAGT ATGGATAAATGGTTGTTGAAGAAGCCCAAG
AAGE02020453_Exon1 TGACTA GTCGAC TTATTTCGGCACTTTTTCGAATGCGT TTTGAG ACTAGT ATGTATTGTATATTTTTAGAATCTGATCCAAAGAACATTGGA
AAGE02025133_Exon1 TGACTA GTCGAC TTAAAGTTCTTCTCCACCGATCATTGTCA
AAGE02025133_Exon2
AAGE02025133_Exon3
AAGE02025133_Exon4 TTTGAG ACTAGT ATGAAACGGCGCTGTACCC
AAGE02027653_Exon1 TTACTA GTCGAC CAAAAGGCGCGAGCGAG
AAGE02027653_Exon2 GGCTCG ACTAGT ATGGCTGACGTTTGGCGATATTTTAAAAAG
AAGE02001552_Exon1 TGACTA ATCGAT TTATTCTGAATCAATTCTCTGGAAGAATGACTTCA TTTGAG CCTAGG ATGGCTTTTTTCTTTTAAGAATATGGCTGAAATTTGG
AAGE02004541_Exon1 TGACTA GTCGAC TCAATGCGAGGGGTGAATTTGATG
AAGE02004541_Exon2 GTCGCG ACTAGT ATGAAAGACCTTCAAAAGAAATGCCGC
AAGE02012529_Exon1 TGACTA GAATTC TTATTTATACATTAGAGCAATTCTCCTGTCACTTCT
AAGE02012529_Exon2 TTTGAG ACTAGT ATGAGAGAAGATGCAGTTAGTGAAAATAAATACACCC
AAGE02009227_Exon1 TGACTA GTCGAC TCAATGCGAGGGGTAAATTTGATGATCT
AAGE02009227_Exon2 TTTGAG ACTAGT ATGCCATTATTCACAGATTTTACAATGAAAGACCT
AAGE02015586_Exon1 TGACTA GTCGAC TTATTTGCTCTTTTCTTGAGCCAGTTTATCC
AAGE02015586_Exon2 TTTGAG ACTAGT ATGTCTGTTGTCAAACGCTTCGTTAG
AAGE02005137_Exon1 CGACTG GAATTC TTATTTGCTCTTTTCTTGAGCCAGTTTATCC
AAGE02005137_Exon2 TACTCA ACTAGT ATGGAGGCCAGCAGCAGC
AAGE02020255B_Exon1 TGACTA GAATTC TTATTTATACATTAGAGCAATTCTCCTGTCACTTCT
AAGE02020255B_Exon2 TTTGAG ACTAGT ATGGAGGAAAATAAGTTTGATGTCGTAGAGG
AAGE02003553_Exon1 TGACTA GTCGAC TTATTTGCTCTTTTCTTGAGCCAGTTTATCC
AAGE02003553_Exon2 TTTGAG ACTAGT ATGGAGGCCAGCAGCAGC
CAGTTTCCCGCTTTGCTGAAAATTCATC
ACGGCTCTCCCATTTTTCAAGCAATACCGAAGTGTCGT
GGAGAGCCGTTGAACGTTTG
ACGAGAATGACGATTTTGCGAATGGA
TTCTCACCAGTTATTTGATAATGTTCTATTTATTTTAGATTTCA
TAATACGACATTCGCTCAAAAGCTCAAAG
TGTCGTATTATGTATATCAAGATAGGAAACATTCGTGATCAGC
CTGGTGAGAATTACCAATTTCCGGATACGCTTTTCTTAG
ACAGCTCTCCCATTTTTCAAACAATACCGAAGTGTCGTGG
GGAGAGCTGTTGAACGTTTGGTA
GGAAAAAATGAGGGCGCTATTGCTC
CATTTTTTCCCCTACCACACATAGCAGGAGC
Forward Primers (5'-3') Reverse Primers (5'-3')
GCCTCTCCACCGGGGAGAGTTGATTCATCAAGTTG
GTGGAGAGGCTTTGCTCTTATCTTATGTAAG
ATGTCTGTTGTCAAACGCTTCGTTAG
CAACAGACATCACACATAGCAGGAGCACCG
GAAAAAATGAGGGCGCTATTGCTCATCT
TCATTTTTTCCGTTGTCTAACCTACCACACATAGCA
TCATTCTCGTCAAGCTGAACTTGTTCGGGGC
TCTGCTTTAAAATATGAACATAATCATCATGCTGTATACATTCACCT
TTAAAGCAGATCCGAAAAATTGCCAAATGG
CGGGAAACTGCGGGGAGAGTTGATTCATCAAGTTG
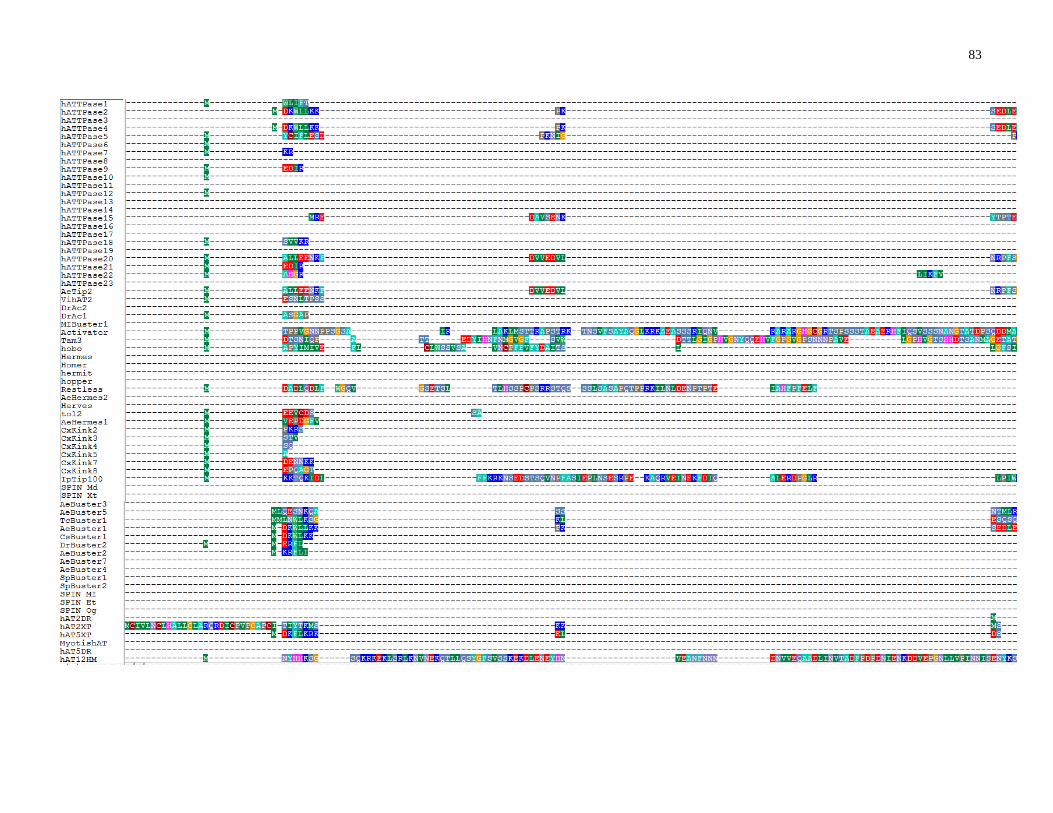
83
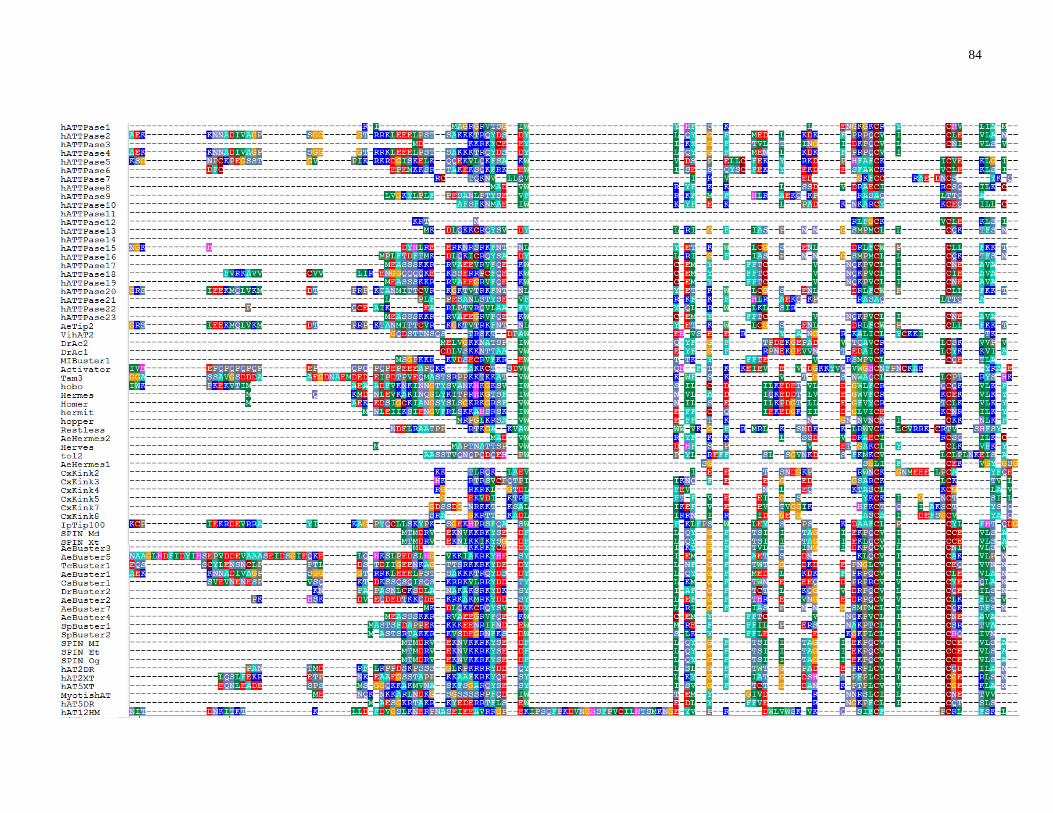
84

85

86
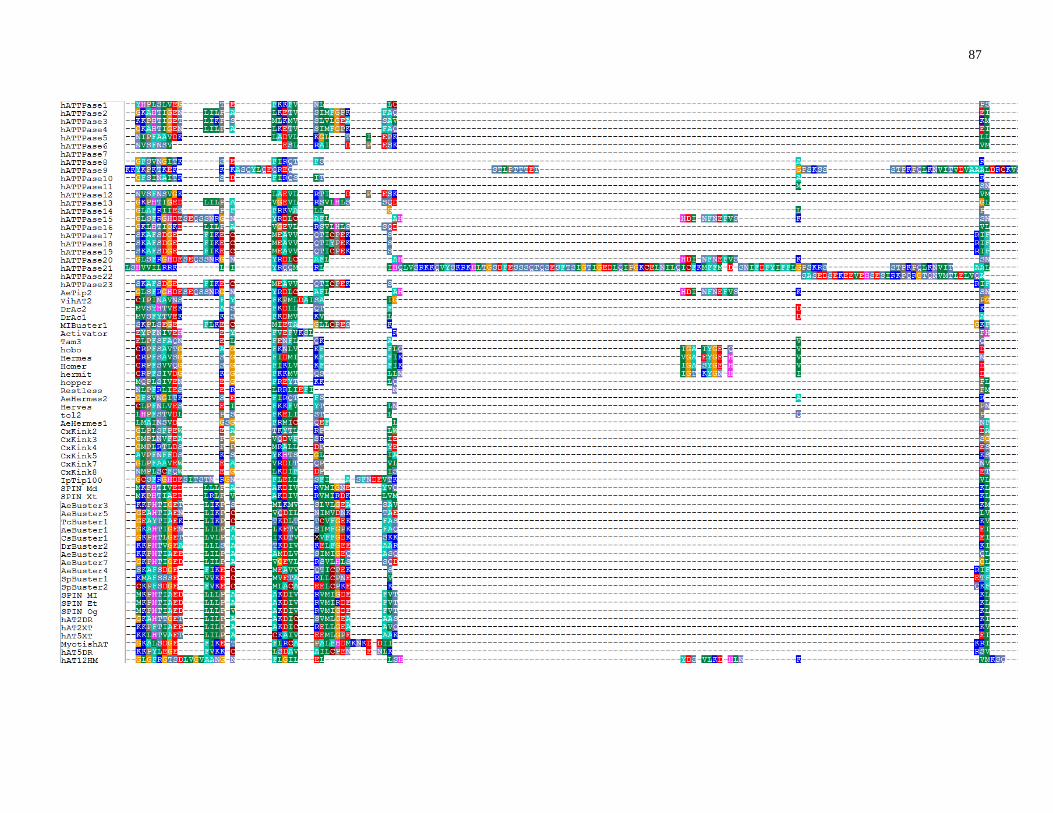
87
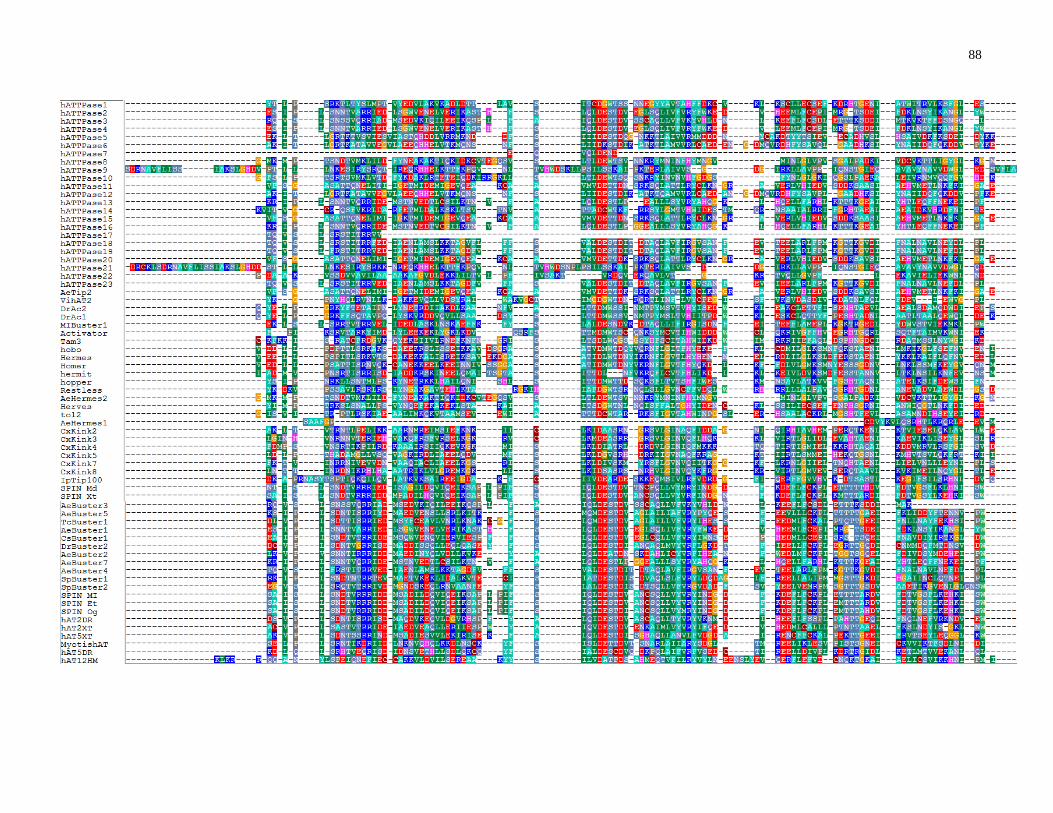
88

89

90
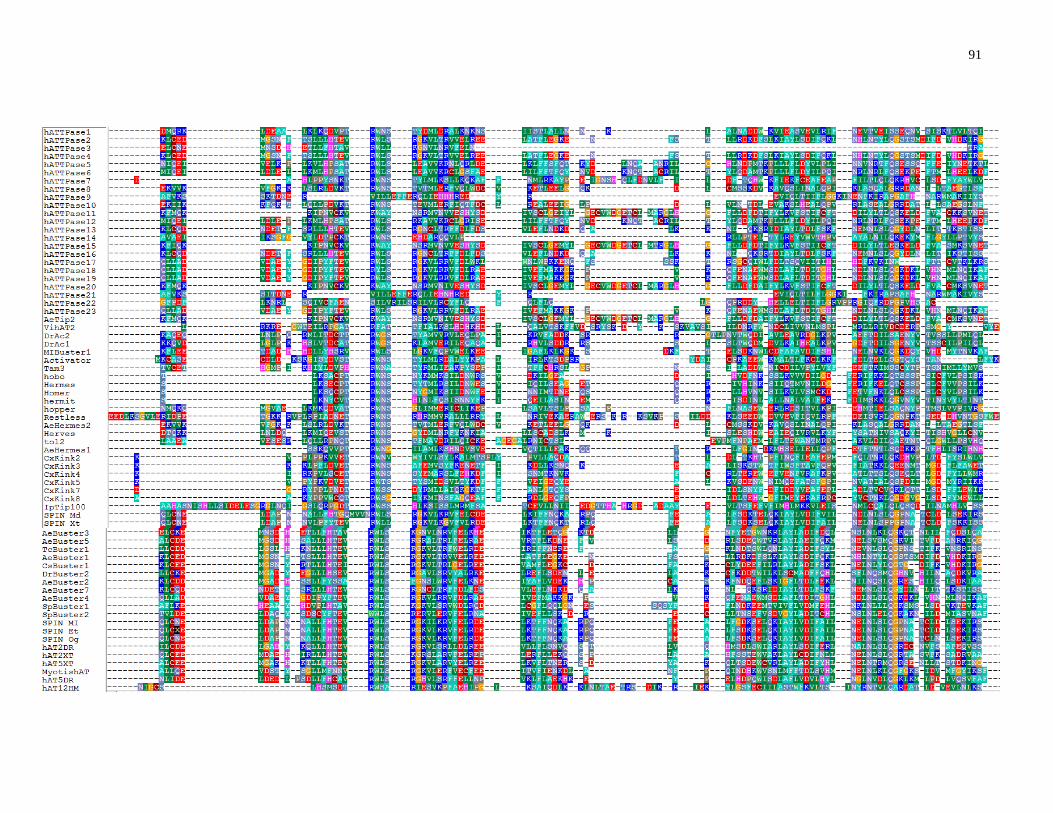
91

92
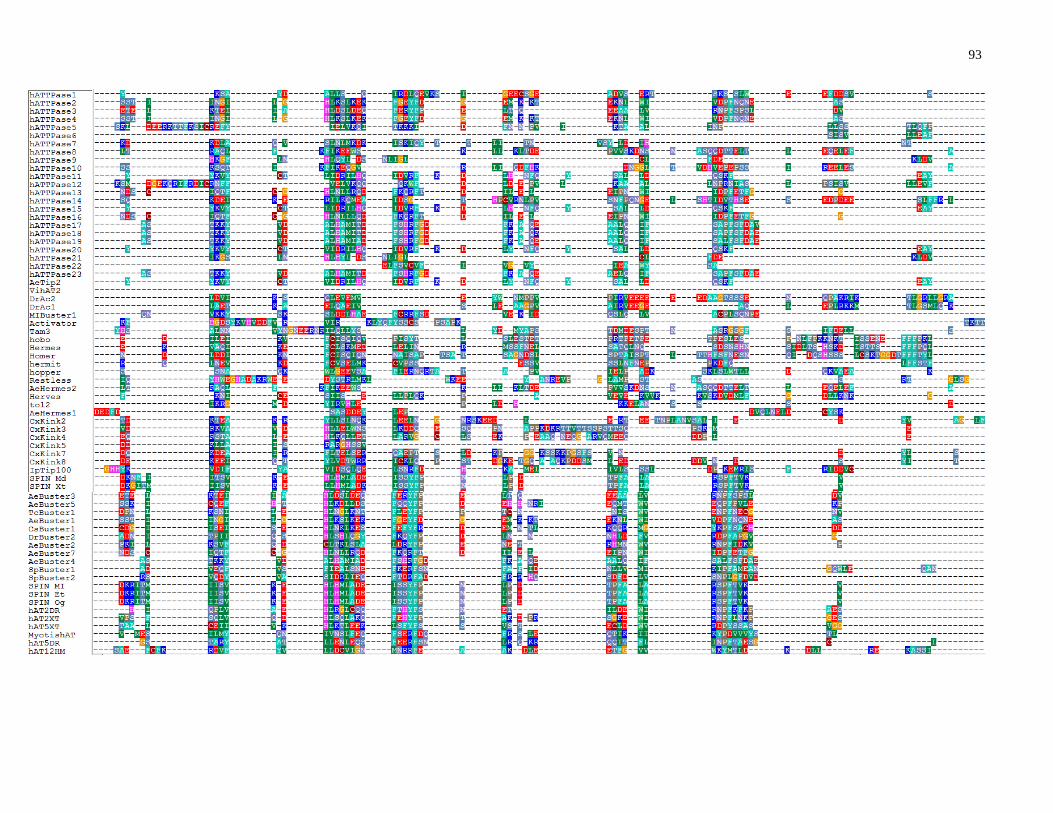
93
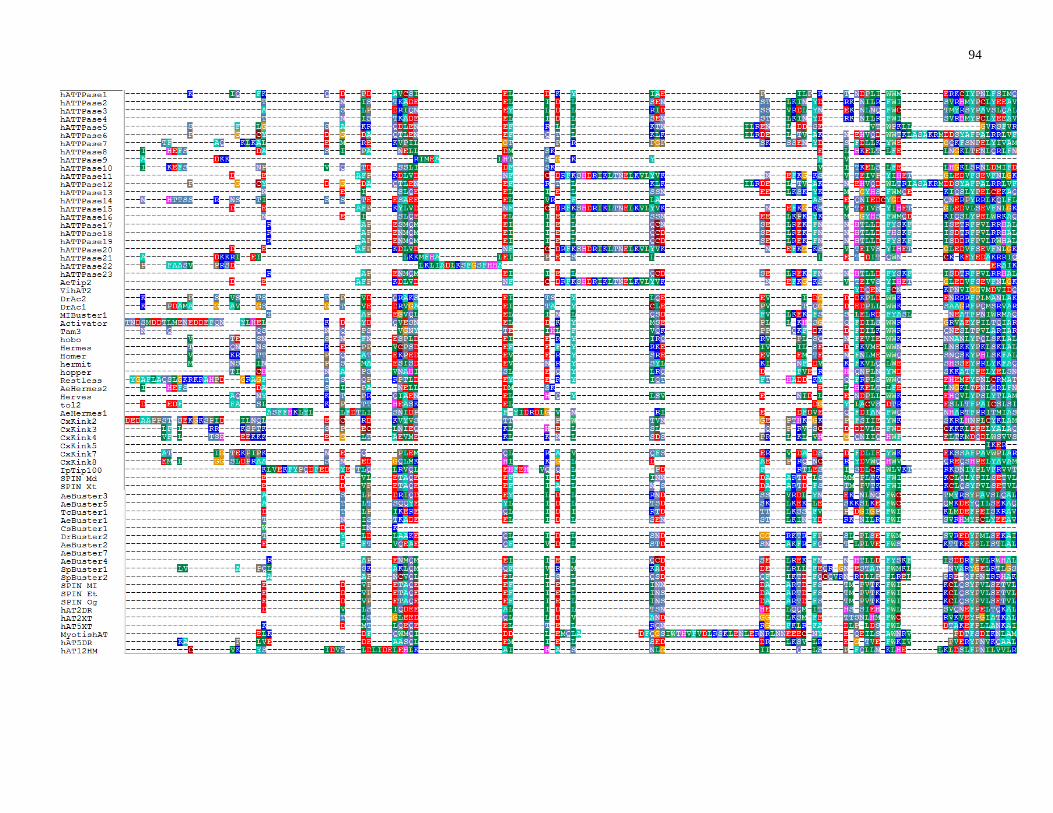
94

95
Supplementary Figure 1: The amino acid alignment of annotated hATTPases and transposase protein sequences from Arsenburger et al. (2011). Alignments were generated from M-COFFEE.

96
CCAGTGTTTCCCTTAGTGGGCGAATTCGCCCCCTAGGGGGCGATTTTCAGGCTCAGGGGGCAAAAATAGACGAAACCAAATTTGGG
GGGCGAAAACAGCAGGAAGGGGGCGAAAATTATCAAAACGTGCAATTGTTTTTTTATCTGGTATATGAACTTCCTCACCCAATTTATA
AATTGATTACCAACACATGTGTAGAGATTAATGTATTTAACCCTCACCTTGAACATTTTGCTTACCGGTCACTTATTCTCTTGCTTTGAC
TATCAACTGATCATCAGATATATCACAGTGCATTATATTTACCTTCTACGTACACGAATATTTTCGCACAGGAGTGAGCACCAGACATA
GCAAAAGTTGAAATGTTTTGTTATACAATTCGGGTCTTCTAACTTGTATTGCATATGGACAATTGACAACGATTCTTATGGTGAAAATT
TAATACCCACGAAAAATGTCACTGTTGCTCCTAAAGATCTTTAAACTAAAGCCCAAAGATTTTAACTACTGATTGTGTAGGTGAGTAA
ACCAATAATATTCGTTACTGTTTATGGAATTTGGACATGCCATTATTCACAGATTTTACAATGAAAGACCTTCAAAAGATATGCC
GCCAGTACAGCGCGGATTACTTAAGAATCGGTTTTATTGCATCGCCGAACAACGGTAGTATGCCAATGTGTCTGTTGTGTC
AGAAAACTTTCAGCAATGAAGCTATCCAG*TTAGAGGATCACTTTTTCCGGAAGCACGCTGATAAGAAGAATAAGGATTTG
GCGTATTTCCAGCATCTTCACGATCTCCAAAGAAAGCAATCCACCGTCCCGACGATATTCTCCTCTCTACAAAAACATGAT
GACGATGGATTGAAAGCATCGTATAATATTTCATTGATGATTGCTAAAGCTGGAAAGCTGCACACCATAGGCAAGGATTTG
ATTTTACCAGCTGTAGGCGAAGTTCTGCGTTCTGTATTACACCTTTCTTCACAAGATGTTCTCAAAAGAATTCCGCTAAGC
AACAACACAGTACAAAGACGTATTGATGAAATGTCCACAAACGTAGAGGATACCGTTTGTGGCATTTTGAAAACAAACGTT
TTTGCTTTGCAACTTGATGAATCAACTCTCCCCGGTACTACTAATAACTTAAGCTAAAAATTTAACGACTCAACCCTTCCT
TTTTCTCAATAGGTGGAGAGGCTTTGCTCTTATCTTATGTAAGATATGCTCATCAAGGAAAACTTCATCAGGAGCTTCTAT
TTGCAAGACATTTGAAAACCACTACGAAAGGAGAAGCCATTTATCACACATTGGAGCAATTCTTCAATGAAAAGGAAATTC
CATTCGATAACGTTGTATCAATTGCAACCGATGGAGCACCAGCTATGATTGGTCGCCACCGCGGAGTCCTTTCATATTTGA
GAAAAGCAGTTCCAAATATGTTAACAGTACATTGTGTGATTCATCGTCAGCATTTAGTGGCCCGTAATTTAAGTGAAAGAC
TTAATTGTTCTTTACAATTCGTTATATCTGCTGTTAACAGAATCAAGAGTAATGCACTTAACAGCAGACTTTTCGCGAAAC
TTTGTCAAGATAACGATGAAACCTTCAGACGATTATTGCTACACACAGAAGTACGATGGCTGTCCAGAGGGAATTGTTTGA
CGCGCTTTTTTGATCTTTTCGATTCAGTTCTTGAATTTTTGAACGATAAAGATCAAGCATTGAAAAAAAATCTCCAAAAAT
CCCGTACAGATATAGCGTATCTCACGGATCTGTTTTCTAAATTTAACGAAATGAATTTGTCGTTACAGGGTTATGATCTGA
ACTTGATTACAATAAAATCAACTATTTCCAGTTTTTTGGGAAAGTTGAAATGTTATGAACAAA*TTTGGGCCGGAGAGAAT
TTCGTCAGTTTCATGATGAAAATTCATCAAACGACTCAAATTAATGACAGTTGTATTCAAACTTTCTGTGGTCATCTTAAT
TTGTTACTTCAAGATTTCAAACAACGCTTTACGGATATTCTTGAATTAGAAATACCAAATTGGATCATTGATCCTTTCGAA
ACATTTGGAGGTAATGAAATCAGCCTTCAAGAAGAATTGATAGAATTGAGCTCCAATGAAGAACTTAAGCCTAAGTATAAA
ATGGGATACCATAGTTTTTGGATGCAGGATAAAATTCAAAGCTTGTATCCTGAACTCTGGAGAAAGGCTCAAAAATTTTTG
ATCGCATTTCCATCGTCTTACCTAGTAGAGCGAGGATTCAGTGTGGTGATGGACCTTATTACTAAAAAGCGAAACCGACTG
GATATCGTGGAGAGAGGTGACCTGCGTTTACTACTAACTACCATAGAACCTGATGTAATTAAGCTTACTAAAGATCATCAA
ATTTACCCCTCGCATGAATAAAGAAACATATGTGTTTTGTTTAAAATTCCAACCGACAAAAACAATGATTTTTGATCTACTTTTATCC
GAGAATGAAACGCCCAACATAGGGGGGCGAAAAAAAATTTAGCCTCCTAAAGGGGGCGATAGTACAAAATAGTTTGGGAAACACT
GG
Supplementary Figure 2: Sequence of the putative hAT transposase, hATTP16. Underlined sequence is the coding region. Insertion locations that were repaired are denoted by asterisks (*). Substitutions that were repaired are denoted by red residues. Grey background-intron; yellow background-TIRs
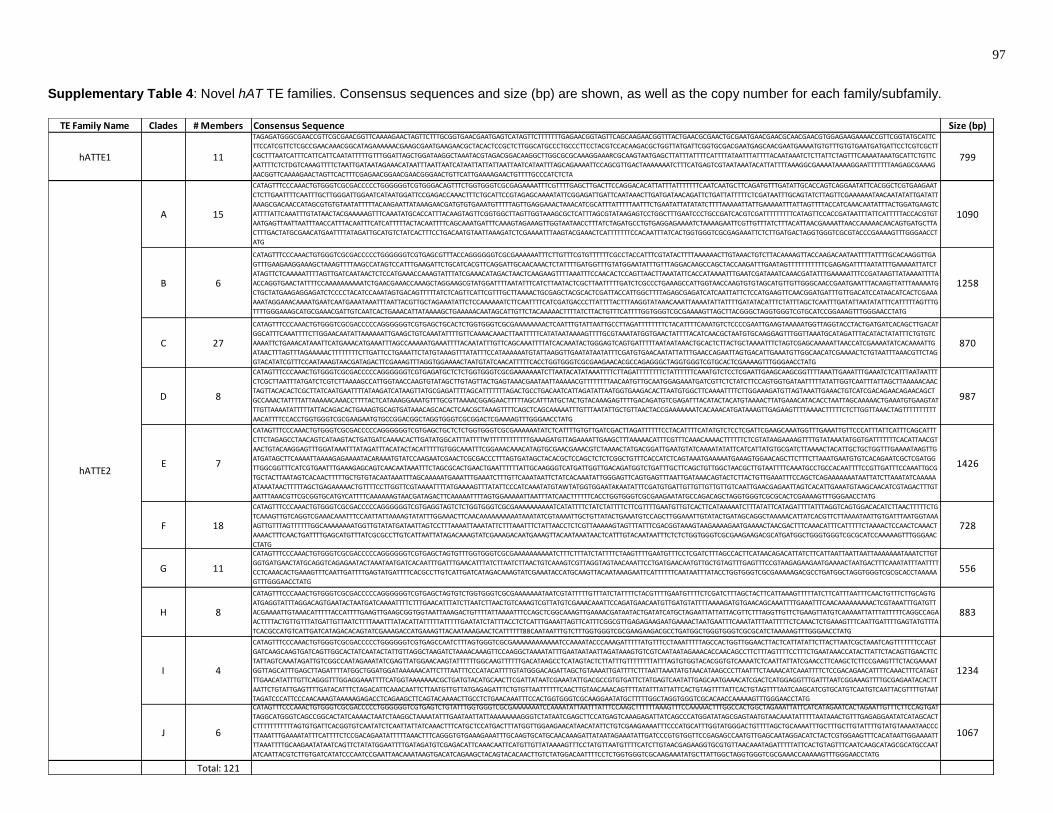
97
TE Family Name Clades # Members Consensus Sequence Size (bp)
hATTE1 11
TAGAGATGGGCGAACCGTTCGCGAACGGTTCAAAAGAACTAGTTCTTTGCGGTGAACGAATGAGTCATAGTTCTTTTTTTGAGAACGGTAGTTCAGCAAGAACGGTTTACTGAACGCGAACTGCGAATGAACGAACGCAACGAACGTGGAGAAGAAAACCGTTCGGTATGCATTC
TTCCATCGTTCTCGCCGAACAAACGGCATAGAAAAAACGAAGCGAATGAAGAACGCTACACTCCGCTCTTGGCATGCCCTGCCCTTCCTACGTCCACAAGACGCTGGTTATGATTCGGTGCGACGAATGAGCAACGAATGAAAATGTGTTTGTGTGAATGATGATTCCTCGTCGCTT
CGCTTTAATCATTTCATTCATTCAATATTTTTGTTTGGATTAGCTGGATAAGGCTAAATACGTAGACGGACAAGGCTTGGCGCGCAAAGGAAARCGCAAGTAATGAGCTTATTTATTTTCATTTTATAATTTATTTTACAATAAATCTCTTATTCTAGTTTCAAAATAAATGCATTCTGTTC
AATTTTCTCTDGTCAAAGTTTTCTAATTGATAATAGAAACATAATTTAATTAATCATAATTATTATTAATTAATCATAATTTAGCAGAAAATTCCAGCGTTGACTAAAAAAATCTTTCATGAGTCGTAATAAATACATTATTTTAAAGGCGAAAATAAAAGGAATTTTTTTAAGAGCGAAAG
AACGGTTCAAAAGAACTAGTTCACTTTCGAGAACGGAACGAACGGGAACTGTTCATTGAAAAGAACTGTTTTGCCCATCTCTA
799
A 15
CATAGTTTCCCAAACTGTGGGTCGCGACCCCCTGGGGGGTCGTGGGACAGTTTCTGGTGGGTCGCGAGAAAATTTCGTTTTGAGCTTGACTTCCAGGACACATTATTTATTTTTTTCAATCAATGCTTCAGATGTTTGATATTGCACCAGTCAGGAATATTCACGGCTCGTGAAGAAT
CTCTTGAATTTTCAATTTGCTTGGGATTGGAATCATAATGGATTCCGAGACCAAACTTTCTGCATTCCGTAGAGCAAAATATTCGGAGATTGATTCAATAAACTTGATGATAACAGATTCTGATTATTTTTCTCGATAATTTGCAGTATCTTAGTTCGAAAAAATAACAATATATTGATATT
AAAGCGACAACCATAGCGTGTGTAATATTTTTACAAGAATTATAAAGAACGATGTGTGAAATGTTTTTAGTTGAGGAAACTAAACATCGCATTTATTTTTAATTTCTGAATATTATATATCTTTTAAAAATTATTGAAAAATTTATTAGTTTTACCATCAAACAATATTTACTGGATGAAGTC
ATTTTATTCAAATTTGTATAACTACGAAAAAGTTTCAAATATGCACCATTTACAAGTAGTTCGGTGGCTTAGTTGGTAAAGCGCTCATTTAGCGTATAAGAGTCCTGGCTTTGAATCCCTGCCGATCACGTCGATTTTTTTTTCATAGTTCCACCGATAATTTATTCATTTTTACCACGTGT
AATGAGTTAATTAATTTAACCATTTACAATTTCATCATTTTTACTACAATTTTCAGCAAATGATTTCAAAGTAGAAAGTTGGTAATAACCTTTATCTAGATGCCTGTGAGGAGAAAATCTAAAAGAATTCGTTGTTTATCTTTACATTAACGAAAATTAACCAAAAACAACAGTGATGCTTA
CTTTGACTATGCGAACATGAATTTTATAGATTGCATGTCTATCACTTTCCTGACAATGTAATTAAAGATCTCGAAAATTTAAGTACGAAACTCATTTTTTTCCACAATTTATCACTGGTGGGTCGCGAGAAATTCTCTTGATGACTAGGTGGGTCGCGTACCCGAAAAGTTTGGGAACCT
ATG
1090
B 6
CATAGTTTCCCAAACTGTGGGTCGCGACCCCCTGGGGGGTCGTGAGCGTTTACCAGGGGGGTCGCGAAAAAATTTCTTGTTTCGTGTTTTTTCGCCTACCATTTCGTATACTTTTAAAAAACTTGTAAACTGTCTTACAAAAGTTACCAAGACAATAATTTTATTTTGCACAAGGTTGA
GTTTGAAGAAGGAAAGCTAAAGTTTTAAGCCATAGTCCATTTGAAGATTCTGCATCACGTTCAGGATTGCAACAAACTCTATTTTGATGGTTTGTATGGAATATTTGTTTAGGACAAGCCAGCTACCAAGATTTGAATAGTTTTTTTTTTTCGAGAGATTTTAATATTTGAAAAATTATCT
ATAGTTCTCAAAAATTTTAGTTGATCAATAACTCTCCATGAAACCAAAGTATTTATCGAAACATAGACTAACTCAAGAAGTTTTAAATTTCCAACACTCCAGTTAACTTAAATATTCACCATAAAATTTGAATCGATAAATCAAACGATATTTGAAAAATTTCCGATAAGTTATAAAATTTTA
ACCAGGTGAACTATTTTCCAAAAAAAAAATCTGAACGAAACCAAAGCTAGGAAGCGTATGGATTTTAATATTTCATCTTAATACTCGCTTAATTTTTGATCTCGCCCTGAAAGCCATTGGTAACCAAGTGTGTAGCATGTTGTTGGGCAACCGAATGAATTTACAAGTTATTTAAAAATG
CTGCTATGAAGAGGAGATCTCCCCTACATCCAAATAGTGACAGTTTTTATCTCAGTTCATTCGTTTGCTTAAAACTGCGAGCTACGCACTCGATTACCATTGGCTTTTAGAGCGAGATCATCAATTATTCTCCATGAAGTTCAACGGATGATTTGTTGACATCCATAACATCACTCGAAA
AAATAGGAAACAAAATGAATCAATGAAATAAATTTAATTACGTTGCTAGAAATATTCTCCAAAAAATCTTCAATTTTCATCGATGACCCTTATTTTACTTTAAGGTATAAACAAATTAAAATATTATTTTGATATACATTTCTATTTAGCTCAATTTGATATTAATATATTTCATTTTTAGTTTG
TTTTGGGAAAGCATGCGAAACGATTGTCAATCACTGAAACATTATAAAAGCTGAAAAACAATAGCATTGTTCTACAAAAACTTTTATCTTACTGTTTCATTTTGGTGGGTCGCGAAAAGTTAGCTTACGGGCTAGGTGGGTCGTGCATCCGGAAAGTTTGGGAACCTATG
1258
C 27
CATAGTTTCCCAAACTGTGGGTCGCGACCCCCAGGGGGGTCGTGAGCTGCACTCTGGTGGGTCGCGAAAAAAAACTCAATTTGTATTAATTGCCTTAGATTTTTTTTCTACATTTTCAAATGTCTCCCCGAATTGAAGTAAAAATGGTTAGGTACCTACTGATGATCACAGCTTGACAT
GGCATTTCAAATTTTCTTGGAACAATATTAAAAAATTGAAGCTGTCAAATATTTTGTTCAAAACAAACTTAATTTTTCATATAATAAAAGTTTTGCGTAAATATGGTGAACTATTTTACATCAACGCTAATGTGCAAGGAGTTTGGTTAAATGCATAGATTTACATACTATATTTCTGTGTC
AAAATTCTGAAACATAAATTCATGAAACATGAAATTTAGCCAAAAATGAAATTTTACAATATTTGTTCAGCAAATTTTATCACAAATACTGGGAGTCAGTGATTTTTAATAATAAACTGCACTCTTACTGCTAAAATTTCTAGTCGAGCAAAAATTAACCATCGAAAATATCACAAAATTG
ATAACTTTAGTTTAGAAAAACTTTTTTTTCTTGATTCCTGAAATTCTATGTAAAGTTTATATTTCCATAAAAAATGTATTAAGGTTGAATATAATATTTCGATGTGAACAATATTATTTGAACCAGAATTAGTGACATTGAAATGTTGGCAACATCGAAAACTCTGTAATTTAAACGTTCTAG
GTACATATCGTTTCCAATAAAGTAACGATAGACTTCGAAAGTTTAGGTGGAAAACTAATGTATCAACATTTTTCACCTGGTGGGTCGCGAAGAACACGCCAGAGGGCTAGGTGGGTCGTGCACTCGAAAAGTTTGGGAACCTATG
870
D 8
CATAGTTTCCCAAACTGTGGGTCGCGACCCCCAGGGGGGTCGTGAGATGCTCTCTGGTGGGTCGCGAAAAAAATCTTAATACATATAAATTTTCTTAGATTTTTTTTCTATTTTTTCAAATGTCTCCTCGAATTGAAGCAAGCGGTTTTAAATTGAAATTTGAAATCTCATTTAATAATTT
CTCGCTTAATTTATGATCTCGTCTTAAAAGCCATTGGTAACCAAGTGTATAGCTTGTAGTTACTGAGTAAACGAATAATTAAAAACGTTTTTTTTAACAATGTTGCAATGGAGAAATGATCGTTCTCTATCTTCCAGTGGTGATAATTTTTATATTGGTCAATTTATTAGCTTAAAAACAAC
TAGTTACACACTCGCTTATCAATGAATTTTATAAGATCATAAGTTATGCGAGATTTTAGCATTTTTTTAGACTGCCTGACAATCATTAGATATTAATGGTGAAGACACTTAATGTGGCTTCAAAATTTTCTTGGAAAGATGTTAGTAAATTGAAACTGTCATCGACAGAACAGAACAGCT
GCCAAACTATTTTATTAAAAACAAACCTTTTACTCATAAAGGAAATGTTTGCGTTAAAACGGAGAACTTTTTAGCATTTATGCTACTGTACAAAGAGTTTTGACAGATGTCGAGATTTACATACTACATGTAAAACTTATGAAACATACACCTAATTAGCAAAAACTGAAATGTGAAGTAT
TTGTTAAAATATTTTTATTACAGACACTGAAAGTGCAGTGATAAACAGCACACTCAACGCTAAAGTTTTCAGCTCAGCAAAAATTTGTTTAATATTGCTGTTAACTACCGAAAAAAATCACAAACATGATAAAGTTGAGAAGTTTTAAAACTTTTTCTCTTGGTTAAACTAGTTTTTTTTTT
AACATTTTCCACCTGGTGGGTCGCGAAGAATGTGCCGGACGGCTAGGTGGGTCGCGGACTCGAAAAGTTTGGGAACCTATG
987
E 7
CATAGTTTCCCAAACTGTGGGTCGCGACCCCCAGGGGGGTCGTGAGCTGCTCTCTGGTGGGTCGCGAAAAAATATCTCATTTTGTGTTGATCGACTTAGATTTTTTCCTACATTTTCATATGTCTCCTCGATTCGAAGCAAATGGTTTGAAATTGTTCCCATTTATTCATTTCAGCATTT
CTTCTAGAGCCTAACAGTCATAAGTACTGATGATCAAAACACTTGATATGGCATTTATTTTWTTTTTTTTTTTTGAAAGATGTTAGAAAATTGAAGCTTTAAAAACATTTCGTTTCAAACAAAACTTTTTTCTCGTATAAGAAAAGTTTTGTATAAATATGGTGATTTTTTTCACATTAACGT
AACTGTACAAGGAGTTTGGATAAATTTATAGATTTACATACTACATTTTTGTGGCAAATTTCGGAAACAAACATAGTGCGAACGAAACGTCTAAAACTATGACGGATTGAATGTATCAAAATATATTCATCATTATGTGCGATCTTAAAACTACATTGCTGCTGGTTTGAAAATAAGTTG
ATGATAGCTTCAAAATTAAAAGAGAAAATACARAAATGTATCCAAGAATCGAACTCGCGACCCTTTAGTGATAGCTACACGCTCCAGCTCTCTCGGCTGTTTCACCATCTCAGTAAATGAAAAATGAAAGTGGAACAGCTTCTTTCTTAAATGAATGTGTCACAGAATCGCTCGATGG
TTGGCGGTTTCATCGTGAATTTGAAAGAGCAGTCAACAATAAATTTCTAGCGCACTGAACTGAATTTTTTATTGCAAGGGTCATGATTGGTTGACAGATGGTCTGATTTGCTTCAGCTGTTGGCTAACGCTTGTAATTTTCAAATGCCTGCCACAATTTTCCGTTGATTTCCAAATTGCG
TGCTACTTAATAGTCACAACTTTTTGCTGTGTACAATAAATTTAGCAAAAATGAAATTTGAAATCTTTGTTCAAATAATTCTATCACAAATATTGGGAGTTCAGTGAGTTTAATTGATAAACAGTACTCTTACTGTTGAAATTTCCAGCTCAGAAAAAAATAATTATCTTAAATATCAAAAA
ATAAATAACTTTTTAGCTGAGAAAAACTGTTTTCCTTGGTTCGTAAAATTTTATGAAAAGTTTATATTCCCATCAAATATGTAWTATGGTGGAATAKAATATTTCGATGTGATTGTTGTTGTTGTTGTCAATTGAACGAGAATTAGTCACATTGAAATGTAAGCAACATCGTAGACTTTGT
AATTTAAACGTTCGCGGTGCATGYCATTTTCAAAAAAGTAACGATAGACTTCAAAAATTTTAGTGGAAAAATTAATTTATCAACTTTTTTCACCTGGTGGGTCGCGAAGAATATGCCAGACAGCTAGGTGGGTCGCGCACTCGAAAAGTTTGGGAACCTATG
1426
F 18
CATAGTTTCCCAAACTGTGGGTCGCGACCCCCAGGGGGGTCGTGAGGTAGTCTCTGGTGGGTCGCGAAAAAAAAAATCATATTTTCTATCTATTTTCTTCGTTTTGAATGTTGTCACTTCATAAAAATCTTTATATTCATAGATTTTATTTAGGTCAGTGGACACATCTTAACTTTTTCTG
TCAAAGTTGTCAGGTCGAAACAAATTTCCAATTATTAAAAGTATATTTGGAAACTTCAACAAAAAAAAAATAAATATCGTAAAATTGCTGTTATACTGAAATGTCCAGCTTGGAAATTGTATACTGATAGCAGGCTAAAAACATTATCACGTTCTTAAAATAATTGTGATTTAATGGTAAA
AGTTGTTTAGTTTTTTGGCAAAAAAAATGGTTGTATATGATAATTAGTCCTTTAAAATTAAATATTCTTTAAATTTCTATTAACCTCTCGTTAAAAAGTAGTTTATTTCGACGGTAAAGTAAGAAAAGAATGAAAACTAACGACTTTCAAACATTTCATTTTTCTAAAACTCCAACTCAAACT
AAAACTTTCAACTGATTTTGAGCATGTTTATCGCGCCTTGTCATTAATTATAGACAAAGTATCGAAAGACAATGAAAGTTACAATAAATAACTCATTTGTACAATAATTTCTCTCTGGTGGGTCGCGAAGAAGACGCATGATGGCTGGGTGGGTCGCGCATCCAAAAAGTTTGGGAAC
CTATG
728
G 11
CATAGTTTCCCAAACTGTGGGTCGCGACCCCCAGGGGGGTCGTGAGCTAGTGTTTGGTGGGTCGCGAAAAAAAAAATCTTTCTTTATCTATTTTCTAAGTTTTGAATGTTTCCTCGATCTTTAGCCACTTCATAACAGACATTATCTTCATTAATTAATTAATTAAAAAAATAAATCTTGT
GGTGATGAACTATGCAGGTCAGAGAATACTAAATAATGATCACAATTTGATTTGAACATTTATCTTAATCTTAACTGTCAAAGTCGTTAGGTAGTAACAAATTCCTGATGAACAATGTTGCTGTAGTTTGAGTTTCCGTAAGAGAAGAATGAAAACTAATGACTTTCAAATATTTAATTTT
CCTCAAACACTGAAAGTTTCAATTGATTTTGAGTATGATTTTCACGCCTTGTCATTGATCATAGACAAAGTATCGAAATACCATGCAAGTTACAATAAAGAATTCATTTTTTCAATAATTTATACCTGGTGGGTCGCGAAAAAGACGCCTGATGGCTAGGTGGGTCGCGCACCTAAAAA
GTTTGGGAACCTATG
556
H 8
CATAGTTTCCCAAACTGTGGGTCGCGACCCCCAGGGGGGTCGTGAGCTAGTGTCTGGTGGGTCGCGAAAAAAATAATCGTATTTTTGTTTATCTATTTTCTACGTTTTGAATGTTTTCTCGATCTTTAGCTACTTCATTAAAGTTTTTATCTTCATTTAATTTCAACTGTTTCTTGCAGTG
ATGAGGTATTTAGGACAGTGAATACTAATGATCAAAATTTTCTTTGAACATTTATCTTAATCTTAACTGTCAAAGTCGTTATGTCGAAACAAATTCCAGATGAACAATGTTGATGTATTTTAAAAGATGTGAACAGCAAATTTTGAAATTTCAACAAAAAAAAACTCGTAAATTTGATGTT
ACGAAAATTGTAAACATTTTTACCATTTTGAAGTTGAAGCGGTGGTAATTAAAGACTGTTTTATTAAAATTTCCAGCTCGGCAAAGTTGAAAACGATAATACTGATATCATGCTAGAATTATTATTACGTTCTTTAGGTTGTTCTGAAGTTATGTCAAAAATTATTTATTTTTCAGGCCAGA
ACTTTTACTGTTGTTTATGATTGTTAATCTTTTAAATTTATACATTATTTTTATTTTTGAATATCTATTTACCTCTCATTTGAAATTAGTTCATTTCGGCGTTGAGAGAAGAATGAAAACTAATGAATTTCAAATATTTAATTTTTCTCAAACTCTGAAAGTTTCAATTGATTTTGAGTATGTTTA
TCACGCCATGTCATTGATCATAGACACAGTATCGAAAGACCATGAAAGTTACAATAAAGAACTCATTTTTT88CAATAATTTGTCTTTGGTGGGTCGCGAAGAAGACGCCTGATGGCTGGGTGGGTCGCGCATCTAAAAAGTTTGGGAACCTATG
883
I 4
CATAGTTTCCCAAACTGTGGGTCGCGACCCCCTGGGGGGTCGTGAGCCAATCTTTAGTGGGTCGCGAAAAAAAAAAAATCCAAAATACCCAAAGATTTTTATGTTTCCTAAATTTTTAGCCACTGGTTGGAACTTACTCATTATATTCTTACTTAATCGCTAAATCAGTTTTTTTCCAGT
GATCAAGCAAGTGATCAGTTGGCACTATCAATACTATTGTTAGGCTAAGATCTAAAACAAAGTTCCAAGGCTAAAATATTTGAATAATAATTAGATAAAGTGTCGTCAATAATAGAAACACCAACAGCCTTCTTTAGTTTTCCTTTCTGAATAAACCATACTTATTCTACAGTTGAACTTC
TATTAGTCAAATAGATTGTCGGCCAATAGAAATATCGAGTTATGGAACAAGTATTTTTTGGCAAGTTTTTTGACATAAGCCTCATAGTACTCTTATTTGTTTTTTTTATTTAGTGTGGTACACGGTGTCAAAATCTCAATTATTATCGAACCTTCAAGCTCTTCCGAAGTTTCTACGAAAAT
GGTTAGCATTTGAGCTTAGATTTTATGGCTGGATGGATAAAAAACATTCTTTAATTTCCCATACATTTTGTATGGGACAGATTAGCTGTAAAATTGATTTTCTTTAATTAAATATGTAACATAAGCCCTTAATTTCTAAAACATCAAATTTTCTCCGACAGAACATTTTCAAACTTTCATAGT
TTGAACATATTTGTTCAGGGTTTGGAGGAAATTTTCATGGTAAAAAAACGCTGATGTACATGCAACTTCGATTATAATCGAAATATTGACGCCGTGTGATTCTATGAGTCAATATTGAGCAATGAAACATCGACTCATGGAGGTTTGATTTAATCGGAAAGTTTTGCGAGAATACACTT
AATTCTGTATTGAGTTTTGATACATTTCTAGACATTCAAACAATTCTTAATGTTGTTATGAGAGATTTCTGTGTTAATTTTTTCAACTTGTAACAAACAGTTTTATATTTATTATTCACTGTAGTTTTATTCACTGTAGTTTTAATCAAGCATCGTGCATGTCAATGTCAATTACGTTTTGTAAT
TAGATCCCATTCCCAACAAAGTAAAAAGAGACCTCAGAAGCTTCAGTACAAAACTTGCCTCTGAACAAATTTCCACTGGTGGGTCGCAAGGAATATGCTTTTTGGCTAGGTGGGTCGCACAACCAAAAAGTTTGGGAACCTATG
1234
J 6
CATAGTTTCCCAAACTGTGGGTCGCGACCCCCTGGGGGGTCGTGAGTCTGTATTTGGTGGGTCGCGAAAAAAATCCAAAATATTAATTTATTTCCAAGCTTTTTTAAAGTTTCCAAAAACTTTGGCCACTGGCTAGAAATTATTCATCATAGAATCACTAGAATTGTTTCTTCCAGTGAT
TAGGCATGGGTCAGCCGGCACTATCAAAACTAATCTAAGGCTAAAATATTTGAATAATTATTAAAAAAAAGGGTCTATAATCGAGCTTCCATGAGTCAAAGAGATTATCAGCCCATGGATATAGCGAGTAATGTAACAAATATTTTTAATAAACTGTTTGAGAGGAATATCATAGCACT
CTTTTTTTTTTTAGTGTGATTCACGGTGTCAATATCTCAATTATTATCAAACTTTCATGCTCCATGACTTTATGGTTGGAAGAACATAACATATTCTGTCGAAGAAAATTTCCCATGCATTTGGTATGGGACTGTTTTAGCTGCAAAATTTGCTTTGCTTGTATTTTGTATGTAAAATAACCC
TTAAATTTGAAAATATTTCATTTTCTCCGACAGAATATTTTTAAACTTTCAGGGTGTGAAAGAAATTTGCAAGTGCATGCAACAAAGATTATAATAGAAATATTGATCCCGTGTGGTTCCGAGAGCCAATGTTGAGCAATAGGACATCTACTCGTGGAAGTTTCACATAATTGGAAAATT
TTAAATTTTGCAAGAATATAATCAGTTCTATATGGAATTTTGATAGATGTCGAGACATTCAAACAATTCATGTTGTTATAAAAGTTTCCTATGTTAATGTTTTCATCTTGTAACGAGAAGGTGCGTGTTAACAAATAGATTTTTATTCACTGTAGTTTCAATCAAGCATAGCGCATGCCAAT
ATCAATTACGTCTTGTGATCATATCCCAATCCGAATTAACAAATAAGTGACATCAGAAGCTACAGTACACAACTTGTCTATGGACAATTTTCCTCTGGTGGGTCGCAAGAAATATGCTTATTGGCTAGGTGGGTCGCGAAACCAAAAAGTTTGGGAACCTATG
1067
Total: 121
hATTE2
Supplementary Table 4: Novel hAT TE families. Consensus sequences and size (bp) are shown, as well as the copy number for each family/subfamily.
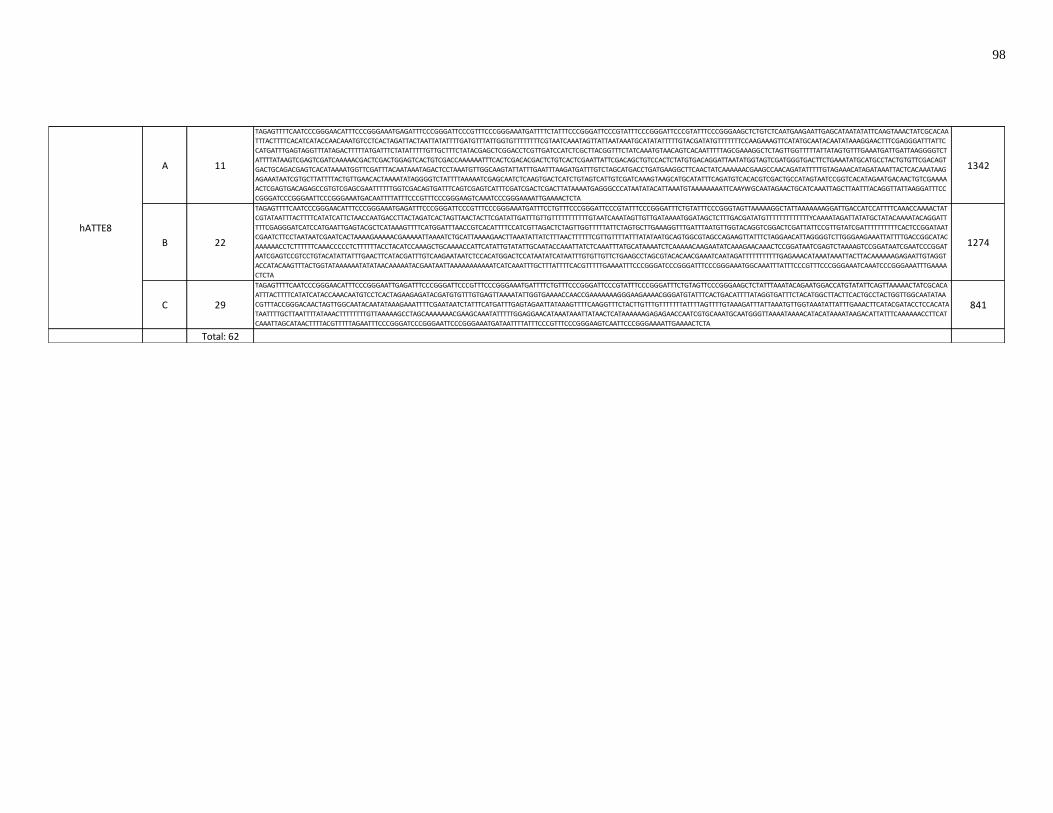
98
A 11
TAGAGTTTTCAATCCCGGGAACATTTCCCGGGAAATGAGATTTCCCGGGATTCCCGTTTCCCGGGAAATGATTTTCTATTTCCCGGGATTCCCGTATTTCCCGGGATTCCCGTATTTCCCGGGAAGCTCTGTCTCAATGAAGAATTGAGCATAATATATTCAAGTAAACTATCGCACAA
TTTACTTTTCACATCATACCAACAAATGTCCTCACTAGATTACTAATTATATTTTGATGTTTATTGGTGTTTTTTTTCGTAATCAAATAGTTATTAATAAATGCATATATTTTTGTACGATATGTTTTTTTCCAAGAAAGTTCATATGCAATACAATATAAAGGAACTTTCGAGGGATTTATTC
CATGATTTGAGTAGGTTTATAGACTTTTTATGATTTCTATATTTTTGTTGCTTTCTATACGAGCTCGGACCTCGTTGATCCATCTCGCTTACGGTTTCTATCAAATGTAACAGTCACAATTTTTAGCGAAAGGCTCTAGTTGGTTTTTATTATAGTGTTTGAAATGATTGATTAAGGGGTCT
ATTTTATAAGTCGAGTCGATCAAAAACGACTCGACTGGAGTCACTGTCGACCAAAAAATTTCACTCGACACGACTCTGTCACTCGAATTATTCGACAGCTGTCCACTCTATGTGACAGGATTAATATGGTAGTCGATGGGTGACTTCTGAAATATGCATGCCTACTGTGTTCGACAGT
GACTGCAGACGAGTCACATAAAATGGTTCGATTTACAATAAATAGACTCCTAAATGTTGGCAAGTATTATTTGAATTTAAGATGATTTGTCTAGCATGACCTGATGAAGGCTTCAACTATCAAAAAACGAAGCCAACAGATATTTTTGTAGAAACATAGATAAATTACTCACAAATAAG
AGAAATAATCGTGCTTATTTTACTGTTGAACACTAAAATATAGGGGTCTATTTTAAAAATCGAGCAATCTCAAGTGACTCATCTGTAGTCATTGTCGATCAAAGTAAGCATGCATATTTCAGATGTCACACGTCGACTGCCATAGTAATCCGGTCACATAGAATGACAACTGTCGAAAA
ACTCGAGTGACAGAGCCGTGTCGAGCGAATTTTTTGGTCGACAGTGATTTCAGTCGAGTCATTTCGATCGACTCGACTTATAAAATGAGGGCCCATAATATACATTAAATGTAAAAAAAATTCAAYWGCAATAGAACTGCATCAAATTAGCTTAATTTACAGGTTATTAAGGATTTCC
CGGGATCCCGGGAATTCCCGGGAAATGACAATTTTATTTCCCGTTTCCCGGGAAGTCAAATCCCGGGAAAATTGAAAACTCTA
1342
B 22
TAGAGTTTTCAATCCCGGGAACATTTCCCGGGAAATGAGATTTCCCGGGATTCCCGTTTCCCGGGAAATGATTTCCTGTTTCCCGGGATTCCCGTATTTCCCGGGATTTCTGTATTTCCCGGGTAGTTAAAAAGGCTATTAAAAAAAGGATTGACCATCCATTTTCAAACCAAAACTAT
CGTATAATTTACTTTTCATATCATTCTAACCAATGACCTTACTAGATCACTAGTTAACTACTTCGATATTGATTTGTTGTTTTTTTTTTTGTAATCAAATAGTTGTTGATAAAATGGATAGCTCTTTGACGATATGTTTTTTTTTTTTTYCAAAATAGATTATATGCTATACAAAATACAGGATT
TTTCGAGGGATCATCCATGAATTGAGTACGCTCATAAAGTTTTCATGGATTTAACCGTCACATTTTCCATCGTTAGACTCTAGTTGGTTTTTATTCTAGTGCTTGAAAGGTTTGATTTAATGTTGGTACAGGTCGGACTCGATTATTCCGTTGTATCGATTTTTTTTTTCACTCCGGATAAT
CGAATCTTCCTAATAATCGAATCACTAAAAGAAAAACGAAAAATTAAAATCTGCATTAAAAGAACTTAAATATTATCTTTAACTTTTTTCGTTGTTTTATTTATATAATGCAGTGGCGTAGCCAGAAGTTATTTCTAGGAACATTAGGGGTCTTGGGAAGAAATTATTTTGACCGGCATAC
AAAAAACCTCTTTTTTCAAACCCCCTCTTTTTTACCTACATCCAAAGCTGCAAAACCATTCATATTGTATATTGCAATACCAAATTATCTCAAATTTATGCATAAAATCTCAAAAACAAGAATATCAAAGAACAAACTCCGGATAATCGAGTCTAAAAGTCCGGATAATCGAATCCCGGAT
AATCGAGTCCGTCCTGTACATATTATTTGAACTTCATACGATTTGTCAAGAATAATCTCCACATGGACTCCATAATATCATAATTTGTGTTGTTCTGAAGCCTAGCGTACACAACGAAATCAATAGATTTTTTTTTTTGAGAAACATAAATAAATTACTTACAAAAAAGAGAATTGTAGGT
ACCATACAAGTTTACTGGTATAAAAAATATATAACAAAAATACGAATAATTAAAAAAAAAAATCATCAAATTTGCTTTATTTTCACGTTTTTGAAAATTTCCCGGGATCCCGGGATTTCCCGGGAAATGGCAAATTTATTTCCCGTTTCCCGGGAAATCAAATCCCGGGAAATTTGAAAA
CTCTA
1274
C 29
TAGAGTTTTCAATCCCGGGAACATTTCCCGGGAATTGAGATTTCCCGGGATTCCCGTTTCCCGGGAAATGATTTTCTGTTTCCCGGGATTCCCGTATTTCCCGGGATTTCTGTAGTTCCCGGGAAGCTCTATTTAAATACAGAATGGACCATGTATATTCAGTTAAAAACTATCGCACA
ATTTACTTTTCATATCATACCAAACAATGTCCTCACTAGAAGAGATACGATGTGTTTGTGAGTTAAAATATTGGTGAAAACCAACCGAAAAAAAGGGAAGAAAACGGGATGTATTTCACTGACATTTTATAGGTGATTTCTACATGGCTTACTTCACTGCCTACTGGTTGGCAATATAA
CGTTTACCGGGACAACTAGTTGGCAATACAATATAAAGAAATTTTCGAATAATCTATTTCATGATTTGAGTAGAATTATAAAGTTTTCAAGGTTTCTACTTGTTTGTTTTTTTATTTTAGTTTTGTAAAGATTTATTAAATGTTGGTAAATATTATTTGAAACTTCATACGATACCTCCACATA
TAATTTTGCTTAATTTTATAAACTTTTTTTTGTTAAAAAGCCTAGCAAAAAAACGAAGCAAATATTTTTGGAGGAACATAAATAAATTATAACTCATAAAAAAGAGAGAACCAATCGTGCAAATGCAATGGGTTAAAATAAAACATACATAAAATAAGACATTATTTCAAAAAACCTTCAT
CAAATTAGCATAACTTTTACGTTTTTAGAATTTCCCGGGATCCCGGGAATTCCCGGGAAATGATAATTTTATTTCCCGTTTCCCGGGAAGTCAATTCCCGGGAAAATTGAAAACTCTA
841
Total: 62
hATTE8

20
Related Documents