11 JUNE 2020 | VOL 3 | 1 Journal of Emerging Investigators • www.emerginginvestigators.org The property of a chemical to cause damage to a cell’s DNA is known as genotoxicity. Genotoxic damage can induce mutations, lead to cancer formation, or initiate other human diseases (5). Genotoxins can also cause oxidative damage in which reactive oxygen species (ROS) oxidize the nitrogenous bases, causing the DNA to become unstable. Oxidative damage can result in single-strand and double-strand DNA breaks as well (6). If damage caused by genotoxic chemicals is not naturally repaired, multiple types of mutations, or permanent changes to a cell’s DNA, can occur. Mutations are primarily classified as point or frameshift (7). As mutations accumulate, proteins controlling the rate at which a cell divides may be produced abnormally. This can initiate carcinogenesis, the formation of tumors that have the ability to become cancerous. Mutations can disrupt the normal outcome of many cell signaling pathways. Most tumors are benign and remain restricted to the area they originated, but as some grow and further mutate, they can become malignant and metastasize to other tissues (8). Sodium nitrite (NaNO 2 ) is a compound used abundantly in the meat industry during the process of curing to prevent microbial growth. When meats containing sodium nitrite are consumed, N-nitroso compounds (NOCs) are formed through the process of nitrosation, as nitrites combine with natural amines to form nitrosamines. Previous literature has linked red meat cured with nitrites to gastrointestinal cancer and glioma (9, 10). Nitrates and nitrites are suspected to play a role in the formation of cancers as they are precursors to NOCs. Nitrosamines are also strong neuro-carcinogens in many animal models (3). Potassium sulfate (K 2 SO 4 ) is another common food preservative used as an anti-browning agent and antioxidant. It is mostly found in dried fruits, vegetables, and sodas; more recently, it has been introduced into cosmetics and medicine. Sulfate exposure was shown to cause health problems such as dermatitis, abdominal pain, and asthmatic symptoms (11). A 2005 study found that sulfate can cause mitotic inhibition and increased the frequency of abnormal mitosis rates, indicating a possible link between sulfate intake and DNA damage (2). Hydrogen peroxide (H 2 O 2 ) is commonly used to preserve the sweetness of milk. One method of milk preservation consists of using hydrogen peroxide and catalase to reduce souring. Often, catalase does not degrade hydrogen peroxide completely and traces of hydrogen peroxide have been Elucidating the genotoxicity of synthetic food preservatives with the SOS chromotest SUMMARY The increased use of synthetic food preservatives makes it imperative to screen for their potential health risks. This project aimed to delineate the genotoxic potential and effects of commonly used synthetic food preservatives, specifically sodium nitrite, potassium sulfate, and hydrogen peroxide. We employed a colorimetric assay designed to test the induction of the DNA damage response using beta-galactosidase (β-gal) as a reporter. Evidence suggests these food preservatives may be genotoxic due to their ability to impair normal cellular pathways. We hypothesized that sodium nitrite would be the most genotoxic because nitrites are precursors to N-nitrosamines, a class of compounds that are carcinogenic byproducts of metabolism. Potassium sulfate and hydrogen peroxide were also initially hypothesized to be genotoxic. Two-fold serial dilutions were performed, and blue color formation was analyzed qualitatively and quantitatively to assess genotoxicity levels. The hypotheses were partially supported as all synthetic food preservatives demonstrated some degree of genotoxicity before and after metabolic activation; potassium sulfate was shown to be the most genotoxic. The inclusion of mammalian hepatic enzymes permitted for better correlation to humans, as results provided insight on the genotoxicity of food preservatives after normal metabolic function. These findings can inform future toxicology research to potentially prevent genetic damage and carcinogenesis. INTRODUCTION The use of synthetic food preservatives continues to grow as preservation techniques become more advanced. As such, it is crucial that certain chemicals and compounds in food are screened for deleterious effects. There has been recent controversy regarding the effects of such chemicals, which warrants questions over their continued use (1). By using the SOS Chromotest assay, the potential genotoxic effects of widely used food preservatives, specifically sodium nitrite, potassium sulfate, and hydrogen peroxide can be effectively evaluated, revealing information that may help to ensure the well-being of consumers and resolve discrepancies in current literature (2, 3). The addition of the rat liver S9 fraction can further characterize any genotoxic effects that may become apparent through this assay (4). Krish V. Shah, Conrad Rogers Harry D. Jacobs High School, Algonquin, Illinois Article

Welcome message from author
This document is posted to help you gain knowledge. Please leave a comment to let me know what you think about it! Share it to your friends and learn new things together.
Transcript
11 JUNE 2020 | VOL 3 | 1Journal of Emerging Investigators • www.emerginginvestigators.org
The property of a chemical to cause damage to a cell’s DNA is known as genotoxicity. Genotoxic damage can induce mutations, lead to cancer formation, or initiate other human diseases (5). Genotoxins can also cause oxidative damage in which reactive oxygen species (ROS) oxidize the nitrogenous bases, causing the DNA to become unstable. Oxidative damage can result in single-strand and double-strand DNA breaks as well (6). If damage caused by genotoxic chemicals is not naturally repaired, multiple types of mutations, or permanent changes to a cell’s DNA, can occur. Mutations are primarily classified as point or frameshift (7). As mutations accumulate, proteins controlling the rate at which a cell divides may be produced abnormally. This can initiate carcinogenesis, the formation of tumors that have the ability to become cancerous. Mutations can disrupt the normal outcome of many cell signaling pathways. Most tumors are benign and remain restricted to the area they originated, but as some grow and further mutate, they can become malignant and metastasize to other tissues (8). Sodium nitrite (NaNO2) is a compound used abundantly in the meat industry during the process of curing to prevent microbial growth. When meats containing sodium nitrite are consumed, N-nitroso compounds (NOCs) are formed through the process of nitrosation, as nitrites combine with natural amines to form nitrosamines. Previous literature has linked red meat cured with nitrites to gastrointestinal cancer and glioma (9, 10). Nitrates and nitrites are suspected to play a role in the formation of cancers as they are precursors to NOCs. Nitrosamines are also strong neuro-carcinogens in many animal models (3). Potassium sulfate (K2SO4) is another common food preservative used as an anti-browning agent and antioxidant. It is mostly found in dried fruits, vegetables, and sodas; more recently, it has been introduced into cosmetics and medicine. Sulfate exposure was shown to cause health problems such as dermatitis, abdominal pain, and asthmatic symptoms (11). A 2005 study found that sulfate can cause mitotic inhibition and increased the frequency of abnormal mitosis rates, indicating a possible link between sulfate intake and DNA damage (2). Hydrogen peroxide (H2O2) is commonly used to preserve the sweetness of milk. One method of milk preservation consists of using hydrogen peroxide and catalase to reduce souring. Often, catalase does not degrade hydrogen peroxide completely and traces of hydrogen peroxide have been
Elucidating the genotoxicity of synthetic food preservatives with the SOS chromotest
SUMMARYThe increased use of synthetic food preservatives makes it imperative to screen for their potential health risks. This project aimed to delineate the genotoxic potential and effects of commonly used synthetic food preservatives, specifically sodium nitrite, potassium sulfate, and hydrogen peroxide. We employed a colorimetric assay designed to test the induction of the DNA damage response using beta-galactosidase (β-gal) as a reporter. Evidence suggests these food preservatives may be genotoxic due to their ability to impair normal cellular pathways. We hypothesized that sodium nitrite would be the most genotoxic because nitrites are precursors to N-nitrosamines, a class of compounds that are carcinogenic byproducts of metabolism. Potassium sulfate and hydrogen peroxide were also initially hypothesized to be genotoxic. Two-fold serial dilutions were performed, and blue color formation was analyzed qualitatively and quantitatively to assess genotoxicity levels. The hypotheses were partially supported as all synthetic food preservatives demonstrated some degree of genotoxicity before and after metabolic activation; potassium sulfate was shown to be the most genotoxic. The inclusion of mammalian hepatic enzymes permitted for better correlation to humans, as results provided insight on the genotoxicity of food preservatives after normal metabolic function. These findings can inform future toxicology research to potentially prevent genetic damage and carcinogenesis.
INTRODUCTION The use of synthetic food preservatives continues to grow as preservation techniques become more advanced. As such, it is crucial that certain chemicals and compounds in food are screened for deleterious effects. There has been recent controversy regarding the effects of such chemicals, which warrants questions over their continued use (1). By using the SOS Chromotest assay, the potential genotoxic effects of widely used food preservatives, specifically sodium nitrite, potassium sulfate, and hydrogen peroxide can be effectively evaluated, revealing information that may help to ensure the well-being of consumers and resolve discrepancies in current literature (2, 3). The addition of the rat liver S9 fraction can further characterize any genotoxic effects that may become apparent through this assay (4).
Krish V. Shah, Conrad RogersHarry D. Jacobs High School, Algonquin, Illinois
Article
11 JUNE 2020 | VOL 3 | 2Journal of Emerging Investigators • www.emerginginvestigators.org
discovered in dairy products. Because this technique is used for the distribution of milk globally, it is important that its components are screened for genotoxicity. Comet assays performed in a previous study discovered that hydrogen peroxide increased damaging capacity to human hepatoma cells (12). This indicates hydrogen peroxide is a driver of oxidative stress and potential genotoxic compound. Taking into account the recent health concerns regarding synthetic food preservatives and their correlation with causing adverse health effects, we had the goal of elucidating the genotoxic potential of the food preservatives sodium nitrite, potassium sulfate, and hydrogen peroxide. We also incorporated a novel technique to qualitatively and quantitatively assess genotoxicity levels that would improve connections in our findings to human beings. Including hepatic enzymes would better replicate in vivo conditions and replicate the repair systems of humans more closely (12). All three food preservatives were genotoxic. Genotoxicity levels of sodium nitrite significantly increased after metabolic activation, and the bacteria were able to survive after hydrogen peroxide was metabolized, indicating genotoxicity effectively increased with metabolic activation. Potassium sulfate did not have major differences before and after incorporation of metabolic enzymes as initially predicted. This study demonstrates a potential health risk posed by the consumption of these food preservatives and suggests further evaluation before continued use.
RESULTSUnderstanding the SOS Chromotest and SOS response The human body has various self-repair mechanisms that act to combat different types of DNA damage. These mechanisms are collectively termed, the “DNA damage response (DDR).” DDR detects DNA lesions to promote repair (13). While the SOS box and associated proteins are not present in humans, understanding the SOS system can provide insight on how DDR pathways function. It also serves as a control for determining how chemicals impact the body. The SOS box is a 20-nucleotide long sequence present within the promoter region of genes. The SOS response plays a significant role in the detection of genotoxic substances and subsequent expression of DDR proteins. The LexA protein, which is abundant in prokaryotic cytosols, is a repressor that binds to repress the transcription of SOS-induced proteins. Under normal conditions, LexA can bind the SOS box, functioning as a repressor of SOS-induced proteins. On the other hand, when a cell incurs DNA damage, LexA is cleaved by RecA. Cleaved LexA is unable to bind the SOS box allowing RNA polymerase access to the promoter regions of DNA repair genes, synthesizing repair proteins (14). The SOS Chromotest uses the activation of genes in the SOS response to detect genotoxicity. It incorporates a strain of Escherichia coli in which the LacZ gene is placed under the control of the sf iA promoter. LacZ is responsible for the production of β-gal and sf iA is the first promoter in the SOS
response. When the de novo synthesis of β-gal occurs (as a result of DNA damage), β-gal degrades the lactose analog, X-gal, and an intense blue color is formed providing visual, colorimetric results as a measure of genotoxicity levels. This is then used as a basis for calculating the SOS inducing potency (SOSIP), a linear, universal parameter which measures a cell’s ability to induce the SOS response. Based on the β-gal formation and cleavage of X-gal, a dose responsive curve should be attained with positive results. The SOS Chromotest may confirm uncertainties from other assays such as the Ames test, a widely utilized method for evaluating mutagenic potential. For example, due to its higher sensitivity, the SOS Chromotest has revealed many genotoxic compounds that have been rejected as mutagenic in the Ames test. However, this increased sensitivity has also led to a greater number of false positives (15). Many genotoxins are activated after being metabolized. For this reason, the SOS Chromotest can be augmented with the addition of the rat liver S9 fraction. S9 contains both cytosol and microsomes which mimic mammalian hepatic metabolism in vivo. By using S9, the genotoxicity of a compound before and after natural metabolism can also be assessed. The use of S9 in toxicity assays has previously revealed the genotoxicity of thousands of chemicals that require metabolic activation (4).
Genotoxicity evaluation before metabolism In order to assess the genotoxicity prior to metabolic processes, the SOS Chromotest was performed without the inclusion of the S9 fraction. This data collected is the baseline control measurement. The experimental set up of the 96-well plate included the respective concentrations, ranging from 3.000% to 0.016% w/w, reagents for controls (sterility, negative, and positive) and three test samples (sodium nitrite, potassium sulfate, and hydrogen peroxide) (Table 1). The SOS Chromotest also included the use of 4-nitroquinoline 1-oxide (4NQO) and 2-aminoanthracene (2AA) as positive controls. Incubation time for the plates was a total of three hours. We expected these known genotoxins would develop a deep blue color at high concentrations that would gradually fade as concentrations decreased. 2AA requires metabolic activation to show genotoxic capabilities, therefore it will only follow this pattern after inclusion of the S9 fraction (12). A darker blue color intensity indicates the degradation of X-gal by β-gal, signifying that the SOS response was triggered and DNA damage occurred. After the results were photographed (Figure 1), a number value between 1 and 7 was assigned to the positive control wells (4NQO) for the blue color density (1 being the lightest and 7 being the darkest) and a number value of 0 was assigned to the negative control column wells (Table 2). The sterility control was performed to ensure the food preservatives did not affect the reagents in the SOS Chromotest. Sterility control wells did not have color development, indicating the assay functioned as expected. Based on the color intensity correlation with the sterility,
11 JUNE 2020 | VOL 3 | 3Journal of Emerging Investigators • www.emerginginvestigators.org
negative, and positive controls, test sample wells were assigned a number value between -1 and 7 (Table 2). A score of -1 signified the bacteria experienced acute toxicity and did not have normal β-gal production, while a score of 0 meant the bacteria survived but remained unharmed.
Genotoxicity evaluation using a metabolism model The second plate was set up with identical concentrations of reagents and test samples as described above (Table 1), but also included the S9 fraction. This would reveal
any potential food preservatives that were genotoxic after metabolic activation. The same controls were included in this experiment to ensure the S9 did not interfere with the assay. After the completion of the SOS Chromotest (Figure 2), the same scoring methodology was applied as previously done except the 2AA positive control wells were scored instead of the 4NQO wells (Table 3). The experimental wells were also scored based on their blue color intensities (Table 3) as done in the initial plate.
Conc. Level
1 2 3 4 5 6 7 8 9 10 11 12
Negative Control
Positive Control (4NQO)
Positive Control (2AA)
Sodium Nitrate (NaNO2) 3% Potassium Sulfate (K2SO4) 1% Hydrogen Peroxide (H2O2) 3%
20 µL 10 µL 5 µL 20 µL 10 µL 5 µL 20 µL 10 µL 5 µL
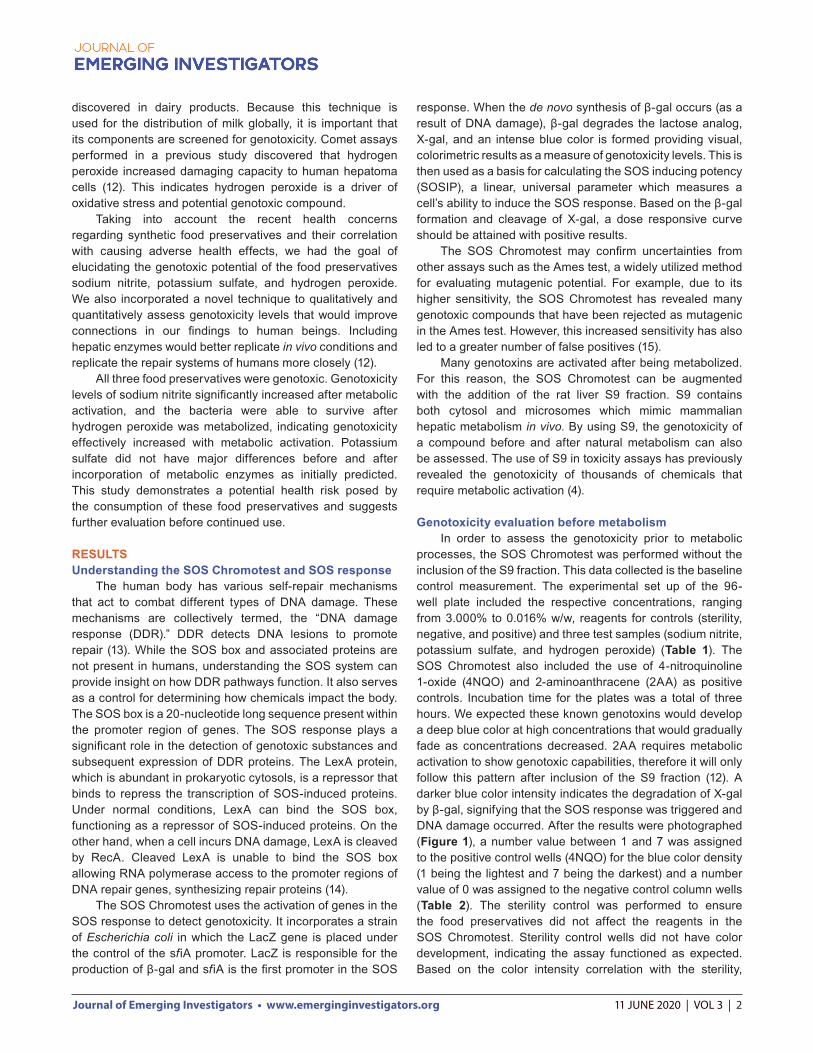
1 100 µL E. coli 100.000% 100.000% 3.000% 3.000% 3.000% 1.000% 1.000% 1.000% 3.000% 3.000% 3.000%
2 100 µL E. coli 50.000% 50.000% 1.500% 1.500% 1.500% 0.500% 0.500% 0.500% 1.500% 1.500% 1.500%
3 100 µL E. coli 25.000% 25.000% 0.750% 0.750% 0.750% 0.250% 0.250% 0.250% 0.750% 0.750% 0.750%
4 100 µL E. coli 12.500% 12.500% 0.375% 0.375% 0.375% 0.125% 0.125% 0.125% 0.375% 0.375% 0.375%
5 100 µL E. coli 6.250% 6.250% 0.188% 0.188% 0.188% 0.063% 0.063% 0.063% 0.188% 0.188% 0.188%
6 100 µL E. coli 3.125% 3.125% 0.094% 0.094% 0.094% 0.031% 0.031% 0.031% 0.094% 0.094% 0.094%
7 100 µL E. coli 1.563% 1.563% 0.047% 0.047% 0.047% 0.016% 0.016% 0.016% 0.047% 0.047% 0.047%
10 µL DMSO
10 µL 4NQO 10 µL 2AA 100 µL
NaNO2
100 µL NaNO2
100 µL NaNO2
100 µL K2SO4
100 µL K2SO4
100 µL K2SO4
100 µL H2O2
100 µL H2O2
100 µL H2O2
Table 1: SOS Chromotest Experimental Design. Each plate included the specific reagents listed in each well and all concentrations are listed in w/w. The second experiment also included the addition of the S9 fraction. Two-fold serial dilutions beginning with the initial concentrations at the top of the columns allowed for the maximum range of concentrations to be tested. Concentration levels are utilized to report concentrations in a uniform manner across the three samples. Each food preservative had three different testing volumes (20 µL, 10 µL, and 5 µL) of the same concentration of sample pipetted into each well.
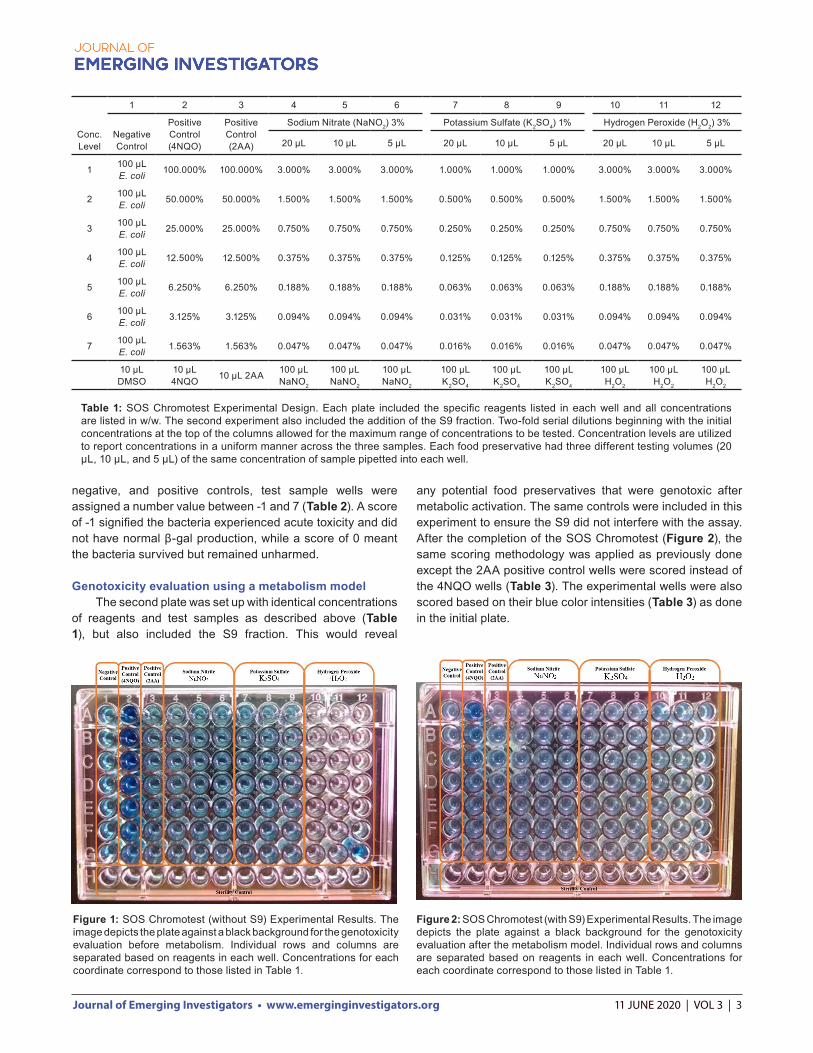
Figure 1: SOS Chromotest (without S9) Experimental Results. The image depicts the plate against a black background for the genotoxicity evaluation before metabolism. Individual rows and columns are separated based on reagents in each well. Concentrations for each coordinate correspond to those listed in Table 1.
Figure 2: SOS Chromotest (with S9) Experimental Results. The image depicts the plate against a black background for the genotoxicity evaluation after the metabolism model. Individual rows and columns are separated based on reagents in each well. Concentrations for each coordinate correspond to those listed in Table 1.
11 JUNE 2020 | VOL 3 | 4Journal of Emerging Investigators • www.emerginginvestigators.org
Evaluation of results Analysis of the genotoxic activity of the tested food preservatives can be carried out visually or by using photometric instrumentation (15). A plate reader could not be accessed during this investigation, so the SOSIP could not be calculated. However, numerical assignments were taken to provide quantitative data. Most data was collected and analyzed qualitatively based on blue color formation. Images of both plates (Figures 1 & 2) do not appropriately convey blue color development in the wells, making it difficult to delineate between positive and negative results using only the photographs. Though these results may appear difficult to discern, this is an artifact of the images themselves. Positive results were more apparent during in-person analysis. All numbers for the visual semi-quantitative method for analyzing results were assigned based on color developments observed in-person against both a black and white background. Intensity values against both the black and white backgrounds were averaged and then assigned for final analysis. Light color development in the negative control containing only E. coli was expected as a result of the LacZ::Sf iA fusion. To visualize numerical assignments, data were plotted in a line graph (Figures 3 & 4). This linear comparison is similar to that achieved from the SOSIP and helps analyze a potential
dose responsive curve associated with levels of chronic genotoxicity. Both positive controls (4NQO and 2AA) functioned as expected. While the color change in the 2AA column was notably of less magnitude compared to that of the 4NQO column, this was expected because 2AA is a weaker genotoxic compound (16). The S9 fraction metabolized the test samples and revealed genotoxicity because visual analysis demonstrated a dose responsive curve in the 2AA sample only in the second experiment (Figure 2). While S9 seemed to reduce genotoxicity of the 4NQO (Figure 2), results cannot be compared between the experiments due to the inherent variability of the SOS Chromotest procedure. Additionally, some cofactors in the S9 mixture may have interfered or diluted the 4NQO solution upon mixing, reducing the color change (16). Sodium nitrite displayed low levels of genotoxicity before metabolic activation as wells in which 10 µL and 5 µL of the samples were added showed low color development (Table 2). Lower concentration was correlated with genotoxicity, reaching a score of 2 for concentrations between 0.188% and 0.750% at a volume of 5 µL of sample (Figure 3). At lower concentrations, the genotoxic activity decreased. After metabolic activation, the genotoxicity levels significantly increased at all concentrations for all testing volumes.
Conc. Level
1 3 4 5 6 7 8 9 10 11 12
Negative Control
Positive Control (2AA)
Sodium Nitrate (NaNO2) 3% Potassium Sulfate (K2SO4) 1% Hydrogen Peroxide (H2O2) 3%
20 µL 10 µL 5 µL 20 µL 10 µL 5 µL 20 µL 10 µL 5 µL
1 0 7 0 1 3 1 1 1 5 4 2
2 0 6 1 2 3 1 1 1 3 3 2
3 0 5 2 2 4 1 2 2 3 3 2
4 0 4 3 3 4 2 2 2 2 2 2
5 0 3 3 3 2 0 2 1 1 1 0
6 0 2 3 3 2 0 0 0 0 0 0
7 0 1 3 3 0 0 0 0 0 0 0
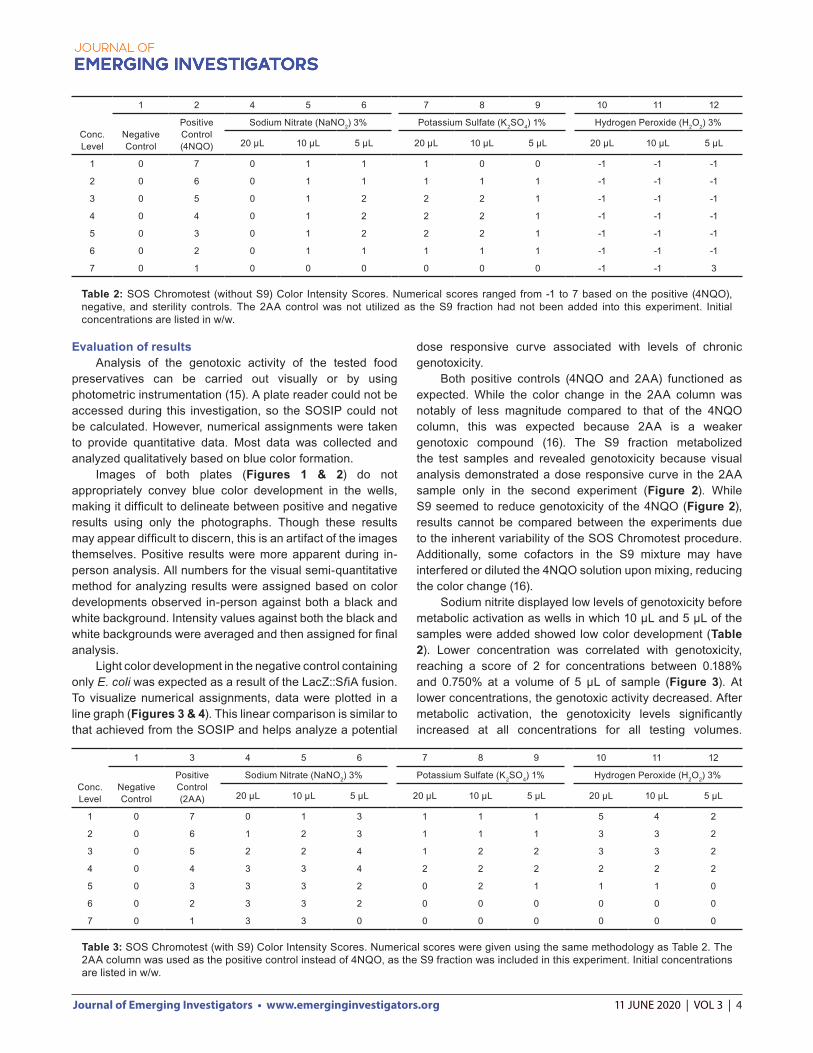
Table 3: SOS Chromotest (with S9) Color Intensity Scores. Numerical scores were given using the same methodology as Table 2. The 2AA column was used as the positive control instead of 4NQO, as the S9 fraction was included in this experiment. Initial concentrations are listed in w/w.
Conc. Level
1 2 4 5 6 7 8 9 10 11 12
Negative Control
Positive Control (4NQO)
Sodium Nitrate (NaNO2) 3% Potassium Sulfate (K2SO4) 1% Hydrogen Peroxide (H2O2) 3%
20 µL 10 µL 5 µL 20 µL 10 µL 5 µL 20 µL 10 µL 5 µL
1 0 7 0 1 1 1 0 0 -1 -1 -1
2 0 6 0 1 1 1 1 1 -1 -1 -1
3 0 5 0 1 2 2 2 1 -1 -1 -1
4 0 4 0 1 2 2 2 1 -1 -1 -1
5 0 3 0 1 2 2 2 1 -1 -1 -1
6 0 2 0 1 1 1 1 1 -1 -1 -1
7 0 1 0 0 0 0 0 0 -1 -1 3
Table 2: SOS Chromotest (without S9) Color Intensity Scores. Numerical scores ranged from -1 to 7 based on the positive (4NQO), negative, and sterility controls. The 2AA control was not utilized as the S9 fraction had not been added into this experiment. Initial concentrations are listed in w/w.
11 JUNE 2020 | VOL 3 | 5Journal of Emerging Investigators • www.emerginginvestigators.org
Sodium nitrite reached a maximum genotoxicity score of 4 at a concentration between 0.375% and 0.750% at a volume of 5 µL after metabolic activation. The genotoxicity trend was fairly constant across the three testing volumes; concentrations between 0.188% and 0.750% were most genotoxic, and concentrations above or below this range had lower levels of genotoxicity (Figure 4). Metabolic activation increased genotoxicity, confirming the expected outcome. Potassium sulfate induced low levels of genotoxicity, and metabolic activation did not have an effect on the results. None of the wells displayed acute toxicity and all had some level of color development. The maximum genotoxicity score was 2, which was obtained as concentrations approached a range of 0.063% to 0.250% (Table 2). Genotoxicity levels continued to be the highest at this concentration range after
the inclusion of the S9 fraction as well (Table 3). Hydrogen peroxide caused acute toxicity except at a 0.047% concentration at a volume of 5 µL, which reached a genotoxicity score of 3 (Table 2). After metabolic activation, all wells had some level of color development signifying metabolic effects on the level of genotoxicity. At a 3.000% concentration, a genotoxicity score of 5 was obtained, and genotoxic activity decreased as the concentration decreased (Table 3). A dose responsive curve was obtained for hydrogen peroxide (Figure 4). This trend was observed for all three volumes tested. We hypothesized that the sodium nitrite would be the most genotoxic because nitrites are precursors to N-nitrosamines. We predicted that after metabolic activation, the genotoxicity of sodium nitrite would increase as nitrosation can occur during metabolism (10). We hypothesized that potassium sulfate would be genotoxic because sulfates can affect the mitotic index of cells, which can lead to proliferation, and hydrogen peroxide was hypothesized to be genotoxic because it creates free radicals that induce oxidative stress (17, 12). Potassium sulfate and hydrogen peroxide were not predicted to have differing levels of genotoxicity after metabolic activation as they are byproducts of metabolism (12). These hypotheses were partially supported by the outcomes of this project.
DISCUSSION Our hypotheses were partially supported by our data, as the synthetic food preservatives were genotoxic and caused DNA damage to the E. coli. Clear qualitative analysis reveals that de novo synthesis of β-gal and subsequent degradation of X-gal occurred as a result of the triggering of the SOS response. Synthetic food preservatives were indeed genotoxic and caused DNA damage to the E. coli. Sodium nitrite and hydrogen peroxide were affected by the addition of the S9 fraction as well. Genotoxicity levels of sodium nitrite significantly increased after metabolic activation, and the bacteria were able to survive after hydrogen peroxide was metabolized. Potassium sulfate activity was not impacted by S9 supplementation as initially predicted. While the underlying mechanism behind the genotoxicity of the food preservatives is unknown, previously conducted research suggests several potential mechanisms. Sodium nitrite may be genotoxic because nitrites are precursors to NOCs. Research shows that NOC production is related to an increase in cancer because NOCs have the capability to inactivate tumor suppressor genes (3). Many of the enzymes used in nitrosation, which leads to NOC formation, are also used in metabolism. This may explain why the genotoxicity increased with the inclusion of the S9 fraction (16). Potassium sulfate may have been genotoxic because sulfates can cause DNA damage by inactivating genes that regulate cell proliferation. They also affect cell signaling pathways that play a role in controlling cell division and synthesis of new DNA (11). This is one of the most common forms of DNA damage and can possibly explain why the
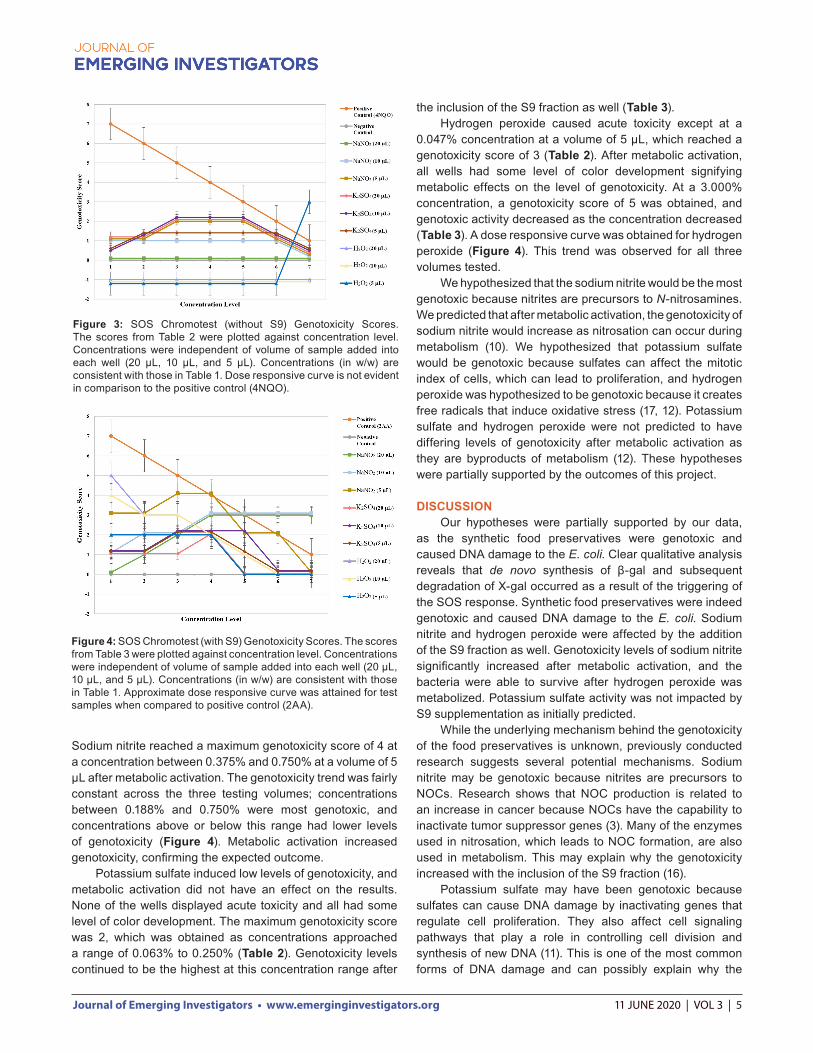
Figure 3: SOS Chromotest (without S9) Genotoxicity Scores. The scores from Table 2 were plotted against concentration level. Concentrations were independent of volume of sample added into each well (20 µL, 10 µL, and 5 µL). Concentrations (in w/w) are consistent with those in Table 1. Dose responsive curve is not evident in comparison to the positive control (4NQO).
Figure 4: SOS Chromotest (with S9) Genotoxicity Scores. The scores from Table 3 were plotted against concentration level. Concentrations were independent of volume of sample added into each well (20 µL, 10 µL, and 5 µL). Concentrations (in w/w) are consistent with those in Table 1. Approximate dose responsive curve was attained for test samples when compared to positive control (2AA).
11 JUNE 2020 | VOL 3 | 6Journal of Emerging Investigators • www.emerginginvestigators.org
potassium sulfate displayed genotoxicity under both testing conditions (+/- S9). Hydrogen peroxide may be leading to acute toxicity because the concentrations and testing volumes were too high. At the lowest concentration and lowest testing volume however, hydrogen peroxide was genotoxic. This may account for the genotoxicity increasing at lower concentrations, but it may also be indicative of a false positive. Hydrogen peroxide was metabolized in the second experiment and although it did not kill the bacteria, it displayed genotoxicity. This suggests the S9 fraction contained enzymes that break apart hydrogen peroxide into components that are genotoxic (16). As in previous studies, hydrogen peroxide most likely caused damage to the DNA through oxidative stress due to its ability to remove electrons from nitrogenous bases (12). By including the S9 fraction, the results display that the test samples were genotoxic after interacting with enzymes found in mammalian metabolism. Further research would elucidate the underlying mechanisms behind the demonstrated genotoxic effects. It may also lead to potential cures and preventative measures against DNA damage and tumorigenesis linked with certain food preservatives. If no actions are taken, the general well-being of the population may continue to be at risk from DNA damage created by the extensive consumption of synthetic food preservatives (18). Sterility, negative, and positive controls were performed in both experiments because of the variability in reaction of the E. coli and reagents; each plate required independent sets of controls. The variability of each individual SOS Chromotest due to high sensitivity explains why identical concentrations generated differing results (15). By repeating the controls, comparable baseline data were obtained for each individual experiment. Experimental error includes the possibility of contamination of the equipment or bacterial contamination, which we attempted to avoid by using aseptic techniques and an autoclave. Another area of concern was the viability of the bacteria. As a precautionary measure, E. coli were transformed to carry ampicillin resistance and were further selected with ampicillin. The negative control also served to reveal the viability of the bacterial cells (18). The negative and sterility controls in the second plate served to show the S9 fraction was not capable of cleaving β-gal or affecting the reagents and therefore inducing a color change. Some samples created an inverse dose responsive curve in which genotoxicity increased as concentration decreased. This may be attributed to experimental error or may have occurred because at higher concentrations, greater levels of repair in the bacteria were activated, reducing the subsequent color change (15). Various steps can be taken to improve the understanding in this field of research. Different types of assays that determine genotoxic potential should be performed. The experiments performed in this project should be repeated using the Ames test, which uses Salmonella to determine if chemical compounds are genotoxic and have caused
mutations. The Ames assay would be beneficial to supporting our conclusions, as it can reveal whether our results extend to other organisms, and can give a measure of colony-forming units to understand the decreased bacterial viability caused by hydrogen peroxide in greater detail (15). The comet assay is another technique that determines the level of DNA damage incurred by a cell by measuring strand breaks in DNA. It can display the type of DNA damage caused by synthetic food preservatives by offering a broad view of the extent of DNA damage (14). By using different assays, the accuracy of the method used in our project can be evaluated, and our results can be validated. In conclusion, this study provides valuable insight into the genotoxicity of commonly used synthetic food preservatives. Further evaluation on food extracts can serve as a more representative model of how much of these food preservatives are truly being consumed. Additionally, further work in the field can lead to increased awareness by the population and Food and Drug Administration and open up avenues for alternative methods of food preservation to lead to a healthier lifestyle globally.
MATERIALS AND METHODSBacterial strain The bacterial strain used in this study was PQ37, derived from E. coli through several mutations including the fusion of the LacZ gene with the Sf iA promoter. The cell membrane was also made more permeable to allow easier flow of test samples. The bacteria was sourced from Environmental Bio-Detection Products (EBPI).
Preparation of S9 4% v/v concentration S9 solution was prepared (16) by mixing liquid rat liver extract with the following cofactors: 8 mM MgCl2, 33 mM KCl, 100 mM sodium phosphate buffer pH 7.4, 5 mM glucose-6-phosphate, and 4 mM NADP. Rat liver extract and cofactors were obtained from EBPI.
Design and procedure for SOS Chromotest with and without S9 fraction All reagents and materials were purchased from Environmental Bio-Detection Products (EBPI). 3% w/w concentration sodium nitrite solution and a 1% w/w concentration potassium sulfate solution were prepared using double distilled water. The E. coli was hydrated with 10 mL of growth medium and 32 µg/mL ampicillin and placed in a shaking incubator at 37º C for 16 hours to reach logarithmic growth. Using a spectrophotometer (Fisher Scientific), the optical density of the bacteria at 600 nm was checked and diluted to 0.05 absorbance with fresh growth medium. 96-well plates were prepared in a setting in which column 1 contained the negative control, column 2 contained the positive control (4NQO), column 3 contained the S9 positive control (2AA), and columns 4-12 contained the test sample columns (Table 1). Each food preservative had three columns
11 JUNE 2020 | VOL 3 | 7Journal of Emerging Investigators • www.emerginginvestigators.org
and three different testing volumes (20 µL, 10 µL, and 5 µL). Reagents were pipetted into the wells using aseptic techniques. DMSO-saline was pipetted into respective wells to be used as a bacterial solvent. Two-fold serial dilutions were performed for the positive controls and repeated for all three food preservatives. 100 µL of bacterial suspension was added to all wells except the sterility control group (row H). The second plate contained the bacterial suspension, as well as 100 µL of the prepared S9 mix. Once the plates were completely prepared, they were incubated for 2 hours at 37º C. 50 µg/mL X-gal was pipetted into each well and the plates were incubated for an additional hour at 37º C. Blue color development was analyzed and number values were assigned based on blue intensity as compared to the positive, negative, and sterility controls.
ACKNOWLEDGEMENTS KVS would like to thank Will Lush at Environmental Bio-Detection Products Incorporated Laboratories (EBPI) in Mississauga, Canada for providing his expertise and constructive suggestions during the development of research methods. KVS also thanks the Illinois Junior Academy of Science (IJAS) for providing a research grant to purchase specialized equipment and reagents. Lastly, he thanks his parents and family for their ongoing support and encouragement.
Received: December 30, 2019Accepted: April 1, 2020Published: June 11, 2020
REFERENCES1. Gould, Grahame W. “Methods for Preservation and
Extension of Shelf Life.” International Journal of Food Microbiology, vol. 33, no. 1, Nov. 1996, pp. 51–64., doi:10.1016/0168-1605(96)01133-6.
2. Gömürgen, Ayşe Nihal. “Cytological Effect of the Potassium Metabisulphite and Potassium Nitrate Food Preservative on Root Tips of Allium Cepa L.” Cytologia, vol. 70, no. 2, June 2005, pp. 119–128., doi:10.1508/cytologia.70.119.
3. Mirvish, Sidney S., et al. “Total N-Nitroso Compounds and Their Precursors in Hot Dogs and in the Gastrointestinal Tract and Feces of Rats and Mice: Possible Etiologic Agents for Colon Cancer.” The Journal of Nutrition, vol. 132, no. 11, 1 Nov. 2002, doi:10.1093/jn/132.11.3526s.
4. Mersch-Sundermann, V., et al. “The Genotoxicity of Unsubstituted and Nitrated Polycyclic Aromatic Hydrocarbons.” Anticancer Research, vol. 13, no. 6A, Oct. 1993, pp. 2037–2048.
5. Phillips, David H., and Volker M. Arlt. “Genotoxicity: Damage to DNA and Its Consequences.” Experientia Supplementum Molecular, Clinical and Environmental Toxicology, 2009, pp. 87–110., doi:10.1007/978-3-7643-8336-7_4.
6. De Bont, R. “Endogenous DNA Damage in Humans: a Review of Quantitative Data.” Mutagenesis, vol. 19, no. 3, May 2004, pp. 169–185., doi:10.1093/mutage/geh025.
7. O’Connor, C. M. & Adams, J. U. Essentials of Cell Biology. Cambridge, MA: NPG Education, 2010.
8. Fernández-Medarde, A., and Eugenio Santos. “Ras in cancer and developmental diseases.” Genes Cancer. 2011; 2(3):344-58.
9. Dubrow, R., et al. “Dietary Components Related to N-Nitroso Compound Formation: A Prospective Study of Adult Glioma.” Cancer Epidemiology Biomarkers & Prevention, vol. 19, no. 7, July 2010, pp. 1709–1722., doi:10.1158/1055-9965.epi-10-0225.
10. Song, Peng, et al. “Dietary Nitrates, Nitrites, and Nitrosamines Intake and the Risk of Gastric Cancer: A Meta-Analysis.” Nutrients, vol. 7, no. 12, 1 Dec. 2015, pp. 9872–9895., doi:10.3390/nu7125505.
11. Vally, Hassan, and Neil L. A. Misso. “Adverse reactions to the sulphite additives.” Gastroenterology and Hepatology from Bed to Bench, vol. 5, no. 1, Winter 2012, pp. 16-23.
12. Benhusein, Ghazallam., et al. “Genotoxic Effect Induced by Hydrogen Peroxide in Human Hepatoma Cells Using Comet Assay.” Libyan Journal of Medicine, vol. 5, no. 1, 13 Jan. 2010, p. 4637., doi:10.3402/ljm.v5i0.4637.
13. Jackson, Stephen P., and Jiri Bartek. “The DNA-Damage Response in Human Biology and Disease.” Nature, vol. 461, no. 7267, 22 Oct. 2009, pp. 1071–1078., doi:10.1038/nature08467.
14. Janion, Celina. “Inducible SOS Response System of DNA Repair and Mutagenesis in Escherichia Coli.” International Journal of Biological Sciences, 23 Sept. 2008, pp. 338–344., doi:10.7150/ijbs.4.338.
15. Quillardet, P., et al. “SOS Chromotest, a Direct Assay of Induction of an SOS Function in Escherichia Coli K-12 to Measure Genotoxicity.” Proceedings of the National Academy of Sciences, vol. 79, no. 19, Oct. 1982, pp. 5971–5975., doi:10.1073/pnas.79.19.5971.
16. Registre, Marilyn, and Ray Proudlock. “The In Vitro Chromosome Aberration Test.” Genetic Toxicology Testing, 2016, pp. 207–267., doi:10.1016/b978-0-12-800764-8.00007-0.
17. Nair, B., and A. R. Elmore. “Final Report on the Safety Assessment of Sodium Sulfite, Potassium Sulfite, Ammonium Sulfite, Sodium Bisulfite, Ammonium Bisulfite, Sodium Metabisulfite and Potassium Metabisulfite.” International Journal of Toxicology, vol. 22, no. 2 Suppl, 2003, pp. 63–88., doi:10.1080/10915810305077x.
18. Clancy, Suzanne. “DNA damage & repair: mechanisms for maintaining DNA integrity.” Nature Education, vol. 1, no. 1, 2008, pp. 103.
Copyright: © 2020 Shah and Rogers. All JEI articles are distributed under the attribution non-commercial, no derivative license (http://creativecommons.org/licenses/by-nc-nd/3.0/). This means that anyone is free to share,
11 JUNE 2020 | VOL 3 | 8Journal of Emerging Investigators • www.emerginginvestigators.org
copy and distribute an unaltered article for non-commercial purposes provided the original author and source is credited.
Related Documents