Co-production of hydrogen and ethylene in an oxygen permeable membrane reactor by Faris Ihab Elmanakhly A thesis presented to the University of Waterloo in fulfillment of the thesis requirement for the degree of Master of Applied Science in Mechanical and Mechatronics Engineering Waterloo, Ontario, Canada, 2022 © Faris Ihab Elmanakhly 2022

Welcome message from author
This document is posted to help you gain knowledge. Please leave a comment to let me know what you think about it! Share it to your friends and learn new things together.
Transcript

Co-production of hydrogen and ethylene in
an oxygen permeable membrane reactor
by
Faris Ihab Elmanakhly
A thesis
presented to the University of Waterloo
in fulfillment of the
thesis requirement for the degree of
Master of Applied Science
in
Mechanical and Mechatronics Engineering
Waterloo, Ontario, Canada, 2022
© Faris Ihab Elmanakhly 2022

ii
AUTHOR'S DECLARATION
I hereby declare that I am the sole author of this thesis. This is a true copy of the thesis, including any
required final revisions, as accepted by my examiners. I understand that my thesis may be made
electronically available to the public.
iii
Abstract
The demand for low-carbon hydrogen keeps increasing. Hydrogen production from water splitting
attracts attention due to the easiness of hydrogen purification from hydrogen-water mixtures and the
flexibility of renewable energy integration. A potential technology is oxygen permeable membrane-
supported water splitting. The membrane separates oxygen from hydrogen and pushes the
thermodynamic equilibrium for higher water conversion ratios. Meanwhile, the call for a more
sustainable and less energy-intensive process for ethylene production has always been there. Integrating
oxidative coupling of methane (OCM) to membrane-supported water-splitting technology can utilize
the oxygen from water splitting to co-produce higher value products (e.g., ethylene).
The technology investigated uses catalysts to increase the number of active sites on the membrane
surface, which facilities the production rates and selectivity. On the feed side, the oxygen incorporation
process is through the gaseous oxygen and oxygen vacancies at the membrane surface to form lattice
oxygen. Then the lattice oxygen diffuses through the membrane driven by potential chemical gradients.
Once the lattice oxygen reaches the sweep side, a reaction between lattice oxygen and electron holes at
the membrane surface releases gases oxygen. The final step includes the mass transfer of gases oxygen
from the membrane surface (sweep side) to the gas (methane) stream, which provides the necessary
oxygen molecule for OCM reactions to convert methane to higher hydrocarbons such as ethane and
ethylene. The entire process can be driven by renewable energy to co-produce hydrogen and ethylene
with limited CO2 production, thanks to the high selectivity catalysts.
This research develops a high-fidelity membrane reactor model that combines the microkinetic of
water splitting, catalytic OCM reactions on the membrane surface, and the charged species diffusion
across the membrane. The model helps evaluate the effect of using an oxygen-permeable catalytic
membrane reactor on the co-production of ethylene and hydrogen. The results show that using a
membrane reactor for this process provides a more controlled oxygen inlet concentration (or partial
pressure), increasing ethane and ethylene production rates while enhancing the water conversion ratio.
The membrane reactor achieved a C2+ yield of 25.64 %, which lies in the industrial range for the C2+
yield estimated in this research. This achieved C2+ yield promotes this technology to be industrially
applicable.

iv
Acknowledgements
I have learned so many things from everyone who contributed to this journey during my graduate
program. I want to express my most profound appreciation and sincere gratitude to my supervisor Dr.
XiaoYu Wu for his assistance at every research project stage. I have significantly benefited from his
wealth of knowledge. I am incredibly grateful that he offered me this opportunity and continued faith
in me throughout my masters. I learned from him to always be eager to achieve better not just
academically but in my personal life too.
I want to thank my master’s thesis committee members, Professor Michael Fowler, Dr. Zhao Pan,
and my supervisor Dr. XiaoYu Wu for their feedback and contribution to getting the best version of
this research thesis.
Additionally, I would like to extend my sincere thanks to Professor Michael Fowler and Dr. XiaoYu
Wu for their academic supervision and Robert Stasko (CEO of Science Concepts International) for his
industrial supervision of the Hydrogen business Council project. Working on this project allowed me
to understand the importance of the transition into a hydrogen economy linked tightly to my research
and contacted various field representatives.
I would also like to thank my colleagues in the greener production research team led by Dr. XiaoYu
Wu at the University of Waterloo for their contributions to the field and their valuable insights.
During this uncertain time, it is also essential to recognize the people who made things slightly less
uncertain, remind you that everything happens for a reason, and direct you back to the right path. I am
grateful for having supportive parents and family who made so many unconditional sacrifices
throughout the years, and my only wish is to make them proud. Without their tremendous understanding
and encouragement in the past few years, it would be impossible to complete my studies. I also want to
thank my friends and colleagues for their mental and moral support along the way.
Lastly, I would like to express how privileged and honored I feel for being a graduate student at
Waterloo. My gratitude extends to the MME department at the University of Waterloo for the funding
opportunity to undertake my studies.
v
Table of Contents
AUTHOR'S DECLARATION ............................................................................................................... ii
Abstract ................................................................................................................................................. iii
Acknowledgements ............................................................................................................................... iv
List of Figures ....................................................................................................................................... ix
List of Tables ........................................................................................................................................ xii
Chapter 1 Literature review .................................................................................................................... 1
1.1 Chapter introduction .................................................................................................................... 1
1.2 Ethylene (C2H4) ........................................................................................................................... 2
1.2.1 Ethylene production importance ............................................................................................ 2
1.2.2 Current production methods of ethylene ............................................................................... 2
1.2.3 Limitations of the current ethylene production methods ....................................................... 3
1.3 Hydrogen (H2) ............................................................................................................................. 3
1.3.1 Hydrogen production importance .......................................................................................... 3
1.3.2 Current production methods of hydrogen .............................................................................. 5
1.3.3 Limitations of the current hydrogen production methods ..................................................... 8
1.4 What is next? ............................................................................................................................... 9
1.5 Direct & indirect methane conversion to ethylene .................................................................... 10
1.6 Oxidative coupling of methane (OCM) ..................................................................................... 11
1.6.1 Process ................................................................................................................................. 11
1.6.2 OCM limitations .................................................................................................................. 13
1.7 Membranes ................................................................................................................................ 15
1.7.1 Principle ............................................................................................................................... 15
1.7.2 Classification ....................................................................................................................... 15
1.7.3 Performance ......................................................................................................................... 17
1.8 Inorganic membranes (principle, classification, and configuration) ......................................... 17
1.9 Mixed ionic-electronic conductive perovskite membranes ....................................................... 18
1.9.1 Barium based perovskite (BCFZ) ........................................................................................ 20
1.9.2 Calcium based perovskite (LCF-91) .................................................................................... 20
1.9.3 Oxygen permeation in mixed ionic-electronic conductive membranes ............................... 21
1.10 Membrane Reactors ................................................................................................................. 23
1.10.1 Principle of Membrane Reactors ....................................................................................... 23

vi
1.10.2 Classification of Membrane Reactors ................................................................................ 24
1.10.3 Configuration of Membrane Reactors ............................................................................... 25
1.11 Chapter summary .................................................................................................................... 25
Chapter 2 Catalyst microkinetics of OCM reactions ............................................................................ 27
2.1 Chapter introduction .................................................................................................................. 27
2.2 Importance of catalyst implementation in OCM reactions ........................................................ 27
2.2.1 Incorporation of catalyst in membrane reactors .................................................................. 28
2.3 OCM catalysts ........................................................................................................................... 29
2.3.1 Lanthanum-oxide catalyst (La2O3) ...................................................................................... 29
2.3.2 Lanthanum-calcium-oxide catalyst (La2O3/CaO) ................................................................ 30
2.4 Heterogeneous surface reactions ............................................................................................... 32
2.4.1 Nature of active sites ........................................................................................................... 33
2.4.2 Catalytic active sites ............................................................................................................ 33
2.4.3 Membrane active sites ......................................................................................................... 35
2.5 La2O3/CaO OCM catalyst microkinetics model ........................................................................ 37
2.5.1 La2O3/CaO catalyst microkinetics model computing process ............................................. 40
2.5.2 Reactor geometry and operating conditions ........................................................................ 42
2.5.3 Estimation of the time step (Δt) ........................................................................................... 45
2.5.4 Defining the activation energies, reaction orders, and enthalpy of adsorption .................... 46
2.5.5 While loop condition ........................................................................................................... 47
2.5.6 Gas volume and catalyst per time step ................................................................................ 47
2.5.7 Molar flow rates for the new time step ................................................................................ 48
2.6 Chapter summary ...................................................................................................................... 50
Chapter 3 One-dimensional oxygen-permeable membrane reactor model .......................................... 51
3.1 Chapter introduction .................................................................................................................. 51
3.2 Implementation of OCM process in oxygen-permeable membrane reactors ............................ 51
3.3 The one-dimensional oxygen-permeable membrane reactor model .......................................... 52
3.3.1 Mechanism of the co-production process of hydrogen and ethylene using membrane
technology .................................................................................................................................... 54
3.3.2 Membrane reactor geometry ................................................................................................ 55
3.3.3 Governing equations ............................................................................................................ 57
3.3.4 Ode45 MATLAB solver ...................................................................................................... 72

vii
3.3.5 Cantera extension ................................................................................................................ 72
3.3.6 Tolerances ............................................................................................................................ 74
3.4 Model validation........................................................................................................................ 76
3.4.1 Influence of oxygen partial pressure on the formation rate of C2+ hydrocarbons and the
formation rate of COx ................................................................................................................... 78
3.4.2 Influence of space time and temperature on methane and oxygen conversion, the yield of
C2+ hydrocarbons, and COx .......................................................................................................... 81
3.4.3 Average parity plots (± 20 % relative prediction error)....................................................... 85
3.4.4 Influence of altering channel width ..................................................................................... 87
3.5 Chapter summary ...................................................................................................................... 88
Chapter 4 .............................................................................................................................................. 90
4.1 Chapter introduction .................................................................................................................. 90
4.2 Base case ................................................................................................................................... 90
4.2.1 Reactor geometry and operating conditions ........................................................................ 90
4.2.2 Model outputs (base case) ................................................................................................... 93
4.3 Systematic analysis.................................................................................................................... 95
4.3.1 Effect of reactor geometries on C2+ selectivity, yield, and methane conversion ................. 96
4.3.2 Effect of operating parameters on C2+ selectivity, yield, and methane conversion ............. 99
4.3.3 Effect of pressure drop on reactor performance ................................................................ 103
4.4 Sensitivity analysis .................................................................................................................. 104
4.4.1 Design parameters ............................................................................................................. 105
4.4.2 Operation parameters ......................................................................................................... 106
4.4.3 Kinetics parameters ........................................................................................................... 108
4.5 Economic feasibility of the OCM technology for the co-production of ethylene and hydrogen
............................................................................................................................................................ 110
4.5.1 Ethylene price estimation .................................................................................................. 111
4.5.2 Utility costs estimation ...................................................................................................... 113
4.5.3 Operating costs estimation................................................................................................. 115
4.5.4 Total ethylene price estimation and the required C2+ yield ............................................... 118
4.6 Target case ............................................................................................................................... 119
4.6.1 Reactor geometry and operating conditions ...................................................................... 119
4.6.2 Model outputs (target case) ............................................................................................... 120

viii
4.6.3 Effect of isothermal temperature on C2+ yield, methane conversion, and COx yield (target
case) ............................................................................................................................................ 128
4.6.4 Oxygen concentration along the membrane on the sweep side ......................................... 129
4.6.5 Carbon oxides (COx) concentration along the sweep side-channel ................................... 134
4.6.6 Membrane vs. pre-mixed reactor ....................................................................................... 137
4.7 Chapter summary .................................................................................................................... 139
Chapter 5 ............................................................................................................................................ 141
5.1 Conclusions ............................................................................................................................. 141
5.2 Recommendations for future work .......................................................................................... 142
Bibliography ....................................................................................................................................... 144
Appendix A Influence of channel width............................................................................................. 157
Appendix B Ethylene price estimation ............................................................................................... 158
Appendix C Oxygen trend analysis .................................................................................................... 161

ix
List of Figures
Figure 1-1: Forecast for the normalized price of oil and natural gas (2016 to 2040) [3] ....................... 1
Figure 1-2: Global hydrogen market 2013 [20] ..................................................................................... 4
Figure 1-3: Sources of hydrogen production in 2012 [2] ....................................................................... 5
Figure 1-4: Emission of CO2 during hydrogen production through SMR and coal gasification with
and without CCS [46] ..................................................................................................................... 8
Figure 1-5: Methane conversion scheme [50] ...................................................................................... 10
Figure 1-6: Oxidative coupling of methane (OCM) tradition reaction scheme [63] ............................ 13
Figure 1-7: Membrane separation process [69] .................................................................................... 15
Figure 1-8: Porous membrane vs. dense membrane [69] ..................................................................... 16
Figure 1-9: Multi-layered asymmetric structure of inorganic membranes [69] ................................... 18
Figure 1-10: Multi-channel monolithic membrane [69] ....................................................................... 18
Figure 1-11: Oxygen permeation process from high oxygen chemical potential side to the low oxygen
chemical potential side [88] .......................................................................................................... 23
Figure 2-1: Mechanism of OCM over La2O3 catalyst (1023 K, 10 % CH4 methane conversion) – dark
arrows (homogeneous reactions) and light arrows (surface reactions) [60] ................................ 29
Figure 2-2: Set of stochiometric equations from Stansch et al. kinetic model [91] ............................. 38
Figure 2-3: Flow chart showing computing process of La2O3/CaO catalyst microkinetics model ...... 41
Figure 2-4: Schematic showing the catalyst’s small porous particle .................................................... 44
Figure 3-1: Plug flow membrane reactor model showing feed side, sweep side, and membrane ........ 53
Figure 3-2: Co-production of C2H4 and H2 using oxygen-permeable membrane................................. 54
Figure 3-3: Feed and sweep channels and membrane dimensions ....................................................... 55
Figure 3-4: Control volumes for feed and sweep sides, showing mass balances at each (Δx) (change in
reactor length ................................................................................................................................ 57
Figure 3-5: Absolute tolerances effect on oxygen molar flow rate ...................................................... 74
Figure 3-6: Oxygen trend versus the reactor length for different absolute tolerances (T = 1133.15 K
(isothermal temperature), pressure drop applied, Vinlet = 7.5E-6 [m3/s], space time = 60 [kg
s/m3] and Rel tolerance = 1E-7) ................................................................................................... 75
Figure 3-7: Influence of p(O2) inlet on the formation rate of C2+ hydrocarbons and the formation rate
of COx reaction conditions at (a) 1073. K and (b) 973.1 K .......................................................... 80
Figure 3-8: Influence of space time and temperature on methane and oxygen conversion at (a)1103.3
K and (b) 973.1 K ......................................................................................................................... 83

x
Figure 3-9:Influence of space time and temperature on yield of C2+ hydrocarbons (a) 1103.3 K and (b)
973.1 K ......................................................................................................................................... 84
Figure 3-10: Influence of space time and temperature on yield of carbon oxides (a)1103.3 K and (b)
973.1 K ......................................................................................................................................... 84
Figure 3-11: Experimental vs. model results for the oxygen (a) and methane (b) conversion at 973.1
and 1103.2 K ................................................................................................................................ 86
Figure 3-12: Experimental vs. model results for (a) C2H4 and (b) C2H6 yield at 973.1 and 1103.2 K . 86
Figure 3-13: Experimental vs. model results for (a) CO and (b) CO2 yield at 973.1 and 1103.2 K ..... 87
Figure 4-1: Effect of altering channel length on (a) methane conversion, (b) C2+ selectivity, and (c)
yield (isothermal condition (T = 1103.3 K), pressure drop applied, base case reactor dimensions,
Abs tolerance = 1E-14 and Rel tolerance = 1E-7) ........................................................................ 97
Figure 4-2: Effect of altering channel height on methane conversion, C2+ selectivity, and yield
(isothermal condition (T = 1103.3 K), pressure drop applied, base case reactor dimensions, Abs
tolerance = 1E-14 and Rel tolerance = 1E-7) ............................................................................... 98
Figure 4-3: Effect of altering space-time on (a) methane conversion and (b) C2+ yield (isothermal
condition (T = 1103.3 K), pressure drop applied, base case reactor dimensions, Abs tolerance =
1E-14 and Rel tolerance = 1E-7) .................................................................................................. 99
Figure 4-4: Effect of altering isothermal temperature on (a) methane conversion, (b) C2+ selectivity,
and (c) yield (isothermal condition (T = 1103.3 K), pressure drop applied, base case reactor
dimensions, Abs tolerance = 1E-14 and Rel tolerance = 1E-7) .................................................. 101
Figure 4-5: Effect of altering catalyst total mass per membrane surface area on (a) methane
conversion, (b) C2+ selectivity, and (c) yield (isothermal condition (T = 1103.3 K), pressure drop
applied, base case reactor dimensions, Abs tolerance = 1E-14 and Rel tolerance = 1E-7) ........ 102
Figure 4-6: Percentage change of (a) channel height, (b) channel length, and (c) membrane thickness
vs percentage change of CH4 conversion and C2+ yield ............................................................. 105
Figure 4-7 : Percentage change of operation parameters vs percentage change of CH4 conversion and
C2+ yield ...................................................................................................................................... 107
Figure 4-8: Percentage change of (a) forward water splitting rate (b) oxygen vacancy diffusivity (Dv)
(c) forward oxygen incorporation rate vs percentage change of CH4 conversion and C2+ yield 109
Figure 4-9: Historical ethylene price (black), ethylene price forecast based on historical data (red),
and ethylene price forecast using OCM (blue) for the coming period. [59] ............................... 111
Figure 4-10: Summarized OCM process stages in the sweep side ..................................................... 112
xi
Figure 4-11 : Feed channel species concentrations along reactor length (a) H2O concentration (b) H2
concentration (c) N2 concentration (target case reactor geometry and operating conditions) .... 125
Figure 4-12 : Sweep channel species concentrations along reactor length (a) O2 concentration (b) CH4
concentration (c) C2H4 concentration (d) H2O concentration (e) C2H6 concentration (f) CO2
concentration (g) H2 concentration (h) CO concentration (i) N2 concentration (target case reactor
geometry and operating conditions) ........................................................................................... 127
Figure 4-13 : Effect of altering isothermal temperature on (a) methane conversion, (b) C2+ yield (c)
COx selectivity (target case) (isothermal condition, pressure drop applied, target case reactor
dimensions, space time : 60 kg s/m3 and VSTP(feed&sweep) : 7.50E-6 m3/s) .................................... 128
Figure 4-14: Oxygen molar flow rate trend vs. channel length .......................................................... 129
Figure 4-15 : Reaction rates (1,4,9 and 10) along reactor length (target case conditions) ................. 135
Figure 4-16: Reaction rates (3,4,6,8,9 and 10) along reactor length (target case conditions) ............ 136
Figure 4-17: Comparison between membrane reactor (target case) and pre-mixed reactor under the
same initial conditions ................................................................................................................ 138

xii
List of Tables
Table 1-1 : Comparison of various hydrogen production methods [38]................................................. 7
Table 1-2: Quantitative EDX results for LCF-91 membrane materials [80] ........................................ 21
Table 1-3: Types of membrane reactor [69] ......................................................................................... 24
Table 2-1: Dimensions and initial operating conditions (La2O3/CaO catalyst model) ......................... 42
Table 2-2: Kinetics parameters from Stanch et al. [91] ........................................................................ 47
Table 3-1: Resistance network [74] ...................................................................................................... 61
Table 3-2: Summary of the reaction kinetic parameters on LCF-91 membrane [74] ........................... 65
Table 3-3: Reynolds number and length of entrance region for feed and sweep sides ........................ 71
Table 3-4: Effect of change of absolute tolerance on the number of steps and step size ..................... 76
Table 3-5: Micro catalytic fixed-bed reactor vs. membrane reactor (dimensions and inlet operating
conditions) .................................................................................................................................... 78
Table 4-1: Dimensions and operating conditions (base case) .............................................................. 91
Table 4-2: Species concentration in the feed and sweep channels (base case) ..................................... 94
Table 4-3: Sweep side species conversion, selectivity, and yield values (base case) ........................... 94
Table 4-4: Mass flow rates balance (base case) ................................................................................... 95
Table 4-5 : Comparison between scenario 1 (pressure drop neglected) vs. scenario 2 (pressure drop
considered) ................................................................................................................................. 103
Table 4-6: Sensitivity analysis results for design parameters ............................................................. 106
Table 4-7: Sensitivity analysis results for operating parameters ........................................................ 108
Table 4-8: Sensitivity analysis results for kinetic parameters ............................................................ 110
Table 4-9: Feed side utility costs ........................................................................................................ 113
Table 4-10: Sweep side utility costs ................................................................................................... 114
Table 4-11: Operating costs summary ................................................................................................ 115
Table 4-12: Dimensions and operating conditions (target case) ........................................................ 119
Table 4-13: Species concentration in the feed and sweep channels (target case)............................... 122
Table 4-14: Sweep side species conversion, selectivity, and yield values (target case) ..................... 122
Table 4-15: Mass balance (target case) .............................................................................................. 123
Table 4-16: Reaction order for methane oxidation reactions (1, 2 and 3) .......................................... 130
Table 4-17 : Reaction order for CO, C2H6, and C2H4 oxidation reactions ......................................... 132

1
Chapter 1
Literature review
1.1 Chapter introduction
Interest in producing hydrogen in an efficient and low emissions process has gradually increased.
Various governmental and non-profitable organizations are considering hydrogen as the future fuel.
According to the international energy agency (IEA), around 7.2 exa-joules of hydrogen are used every
year in global industries [1]. The stats show that most of the global hydrogen production is from
hydrocarbons (around 96%), which results in around 500 megatonnes of CO2 emitted. Water
electrolysis only takes a small portion of the hydrogen production market (around 4%) [2].
Figure 1-1: Forecast for the normalized price of oil and natural gas (2016 to 2040) [3]
In addition, the price of oil has been gradually increasing in the last year compared to natural gas;
this trend is forecasted to continue according to IEA, and as shown in Figure 1-1. Natural gas shows a
higher level of abundance than oil in the upcoming years [3], which nominates it to be an alternative,
especially in the production of hydrocarbons.

2
The development and availability of technologies that allow for the transformation of natural gas
into value-added products nevertheless add a novel dimension to the capabilities of the chemical
processing industry.
The co-production of hydrogen and ethylene has been a research topic with high economic potential
and a one step closer to zero-emissions energy production. Both products have their contributions to
the petrochemical & energy industry. Combining water splitting and oxidative coupling of methane
(OCM) in an oxygen-permeable membrane reactor is a promising technology investigated in this
research. The membrane reactor technology combines the whole process into one unit without the
mechanical movements of the reactor. Economic feasibility, thus, can be achieved. Additionally, the
oxygen permeable membrane can shift the thermodynamic equilibrium to split water further to produce
hydrogen and increase the ethylene selectivity.
1.2 Ethylene (C2H4)
1.2.1 Ethylene production importance
Ethylene is one of the most essential petrochemically derived monomers [4]. 149.7 million tons of
ethylene were produced in 2017 worldwide [5]. Ethylene has various industrial uses as it is used directly
in polyethylene plastics used in food packagings construction components such as high-efficiency
windows, piping, and electrical conduits. The ethylene industry's estimated current global market
exceeds 330 billion pounds per year, representing a $200+ billion annual market [6].
1.2.2 Current production methods of ethylene
The petrochemical industry is familiar with steam cracking or thermal cracking to produce ethylene.
The process involves heating a feedstock to high temperatures over a catalyst (such as ZSM and SAPO
catalysts) [7,8]. Under typical conditions, steam cracking of ethane to ethylene records a conversion
rate of around 70 % and 50 % of ethylene yielding [9]. The feedstocks used in the process vary globally;
the U.S. and the Middle East use ethane (gas phase) as the primary feedstock. The rest of the world
predominately relies on naphtha (liquid phase) [6]. There has been a noticeable increase in the global
share of ethane as a feedstock globally in recent years due to its oversupply since the shale gas
revolution. The domination of ethane over naphtha can be linked to ethane's relativity lower price than
naphtha (18 cents per gallon) [10].

3
The steam cracking process involves homogeneous pyrolysis, which originates from converting
steam-diluted alkanes at high temperatures (approximately 800 °C) in reactor tubes. The feed is
preheated with steam up to the initial cracking temperature (500–680 °C). Subsequently, the mixed
stream is fed into a high-temperature reactor (750–875 °C) to complete the steam pyrolysis, with
residence times of 0.1– 0.5 s. The feed is cracked into small olefins and di-olefins. The effluent has to
be quenched within 0.02–0.1 s to avoid product degradation due to the high reactivity of the products.
The products are separated by distillation and absorption processes [11].
1.2.3 Limitations of the current ethylene production methods
Several issues accompany the current methods of ethylene production. Firstly, the unpredictable oil
prices and the global oil market directly affect the ethylene production rates. Studies [12,13] report how
the noticeable price of crude oil -which is currently the primary source of ethylene produced globally-
has pressured ethylene production. Secondly, current ethylene production methods are energy-intensive
processes. The total energy demand of the produced ethylene is 16 GJ/t (in the case of ethane as a
feedstock) and 23 GJ/t (naphtha is used as a feedstock) [9]. Steam cracking is an endothermic process
that is an energy-intensive process, and the process requires significant heat input by burning the
undesired reaction products for the endothermic dehydrogenation reactions, which results in severe
nitrogen oxides (pollutants) [14]. Thirdly, CO2 emission is another big concern. Steam cracking is
estimated to produce nearly 300 million tons of annual carbon dioxide emissions [15]. In another
source, the steam cracking process is estimated to produce around 2.6 tons of CO2 per ton of ethylene
produced [16]. These issues make research into alternative technologies more appealing. Intensifying
the direct methane conversion methods can lead to more effective and economical ways to produce
ethylene.
1.3 Hydrogen (H2)
1.3.1 Hydrogen production importance
Worldwide natural gas consumption has been rising over the past 20 years. In 2019, natural gas
consumption worldwide amounted to nearly 3.9 trillion cubic meters; this resulted in around 36.8 billion
tons of carbon dioxide emissions estimated by the global carbon project 2019 [17]. The reality of
climate change is a pressing concern and demands action. Global efforts are underway to decrease CO2
4
emissions by relying more on renewables, improving generation and end-use efficiency, and, more
importantly, switching to low carbon fuels [18].
Hydrogen can be an alternative fuel to reduce the fossil fuel dependency of various sectors such as
transportation or heavy industry. Hydrogen from renewables (such as wind, solar, geothermal, and
biomass) and low carbon resources (such as nuclear energy) can replace fossil fuel-based feedstocks in
CO₂ emission-intensive sectors. The utilization of renewable and low carbon resources to produce
hydrogen can effectively contribute to the reduction of carbon emissions as these sources have the
lowest recorded carbon intensity (0 to 0.6 kg CO2-eq (CO2 equivalent)/kg H2) [19]. In addition,
hydrogen can be combusted in a gas turbine or used directly in a fuel cell to generate work/electricity
without GHGs. Hydrogen can also help reduce urban emissions (i.e., SOx, ozone, PM 2.5, PM 10) [19].
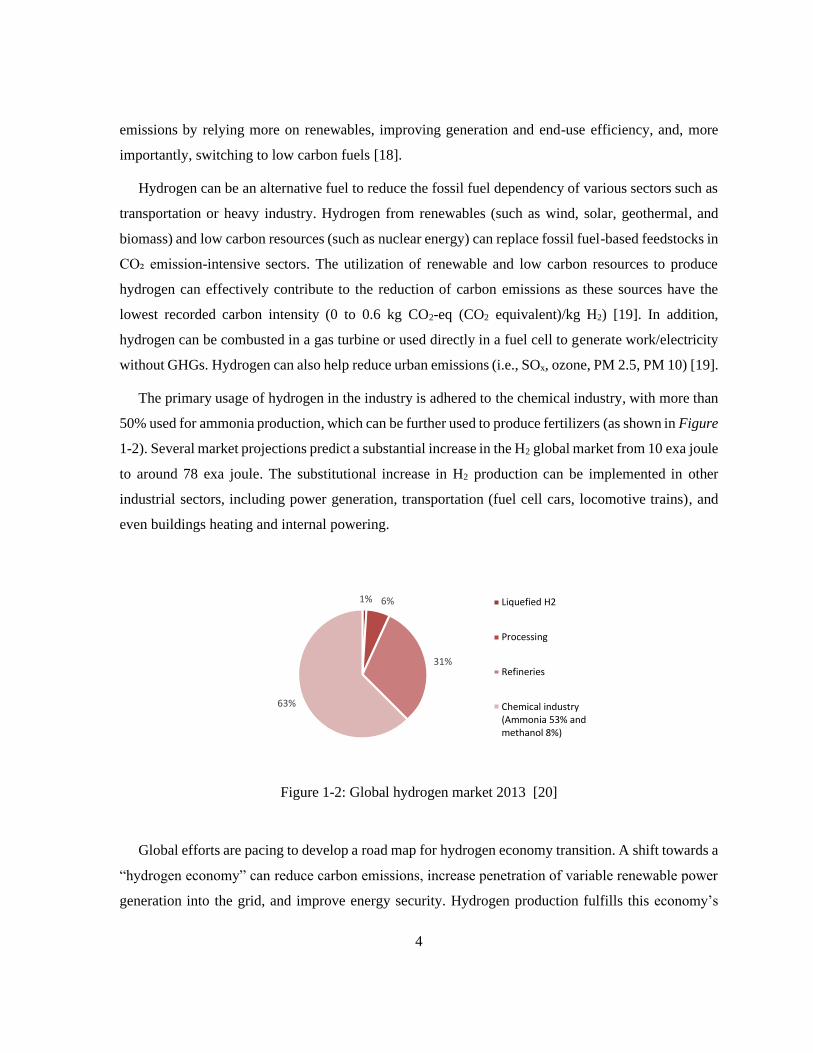
The primary usage of hydrogen in the industry is adhered to the chemical industry, with more than
50% used for ammonia production, which can be further used to produce fertilizers (as shown in Figure
1-2). Several market projections predict a substantial increase in the H2 global market from 10 exa joule
to around 78 exa joule. The substitutional increase in H2 production can be implemented in other
industrial sectors, including power generation, transportation (fuel cell cars, locomotive trains), and
even buildings heating and internal powering.
Figure 1-2: Global hydrogen market 2013 [20]
Global efforts are pacing to develop a road map for hydrogen economy transition. A shift towards a
“hydrogen economy” can reduce carbon emissions, increase penetration of variable renewable power
generation into the grid, and improve energy security. Hydrogen production fulfills this economy’s
1% 6%
31%
63%
Liquefied H2
Processing
Refineries
Chemical industry(Ammonia 53% andmethanol 8%)

5
significant energy needs while reducing urban pollution emissions and the overall carbon footprint.
Several countries and regions are developing roadmaps for the deployment of hydrogen technology and
building demonstration-scale projects for either hydrogen production or consumption. In Canada, the
hydrogen strategy has been considered at the federal level. In 2019, Natural Resources Canada (NRCan)
issued a report on potential pathways for hydrogen implementation. The report encourages the
establishment of research goals, the development of codes and standards related to hydrogen
deployment, and international information sharing and collaboration [21]. The UK Climate Change Act
is committed to a 100% emissions reduction from 1990 by 2050. To achieve the necessary carbon
reductions in the energy supply to meet this target, the UK Committee on Climate Change has released
a series of recommendations for the implementation of hydrogen [22]. Japan is deploying technologies
for hydrogen utilization, with 250,000 Combined Heat and Power (CHP) units in buildings and 2,400
hydrogen vehicles [23].
1.3.2 Current production methods of hydrogen
There are various methods to produce hydrogen on an industrial level. As shown in Figure 1-3,
most industrial hydrogen is produced from natural gas, as this method accounts for around 48 % of
the global hydrogen production.
Figure 1-3: Sources of hydrogen production in 2012 [2]
Steam-methane reforming (SMR) is an advanced and mature industrial process built upon the
existing pipeline infrastructure for a cost-effective natural gas supply [24]. Methane is the primary gas
component in natural gas, which reacts with steam on catalysts (such as nickel or noble metal catalysts)
4%
30%
48%
18%Water
Oil
Naturalgas
Coal

6
at high temperatures (700°C - 1000°C) and pressures (3 - 25 bar) to derive syngas. The syngas is made
up primarily of carbon monoxide and hydrogen, along with a small amount of carbon dioxide [25].
Next, the syngas undergoes the water gas shift (WGS) reaction, catalyzed by metals or metal oxides
(e.g., Fe [26][27][28]and Cu[29]) to convert carbon monoxide with steam to carbon dioxide and
additional hydrogen [30]. Finally, the pressure-swing absorption (PSA) separates hydrogen from
carbon dioxide and other impurities with CCS.
The chemical reactions involved in the SMR are:
Steam-methane reforming reaction
4 2 23CH H O CO H+ → +
ΔHr = 206 kJ/mol (1-1)
Water-gas shift reaction
2 2 2CO H O CO H+ → +
ΔHr = -41 kJ/mol (1-2)
Where,
▪ ΔHr: the standard reaction enthalpy for the specific reactions.
Coal and biomass gasification can also produce hydrogen and power, liquid fuels, and other
chemicals [31,32]. For coal gasification, coal (CH0.8) reacts with oxygen, steam, or CO2 under high
temperatures and pressures, resulting in syngas, as shown in Eqn. (1-3) [33]:
0.8 2 2 2 22 1.8CH O H O CO CO H+ + → + +
(1-3)
Next, solid impurities such as dust are removed, followed by the WGS reaction to convert carbon
monoxide to carbon dioxide while producing more hydrogen from steam [33]. A separation process
must be employed to achieve a high purity hydrogen gas product. Traditional gas separation methods
include cryogenic distillation, pressure swing adsorption, and membrane separation. Membranes such
as polymeric membranes, metal-organic framework (MOF) membranes, zeolite membranes, and mixed

7
ionic and electronic conducting membranes have been developed with higher energy efficiency and
intensified processes [34–36].
The water electrolysis process (also called water splitting reaction) involves decomposing water in
its liquid and gas state into oxygen and hydrogen gas by introducing an electric current (as shown in
Eqn. (1-4)). The easiness of hydrogen purification from hydrogen-water mixtures made this approach
more desirable, and it is now the only water splitting process that is economically utilized [37].
2 2 22H 2O H O→ +
ΔHr = 285.85 kJ/mol (1-4)
There are three major technologies for electrolysis, each of which has a respective fuel cell
technology: alkaline electrolyzers or fuel cells (AEL or AFC), polymer electrolyte membrane (PEM)
electrolyzers/fuel cells, and solid oxide electrolyzers (SOEC or SOFC). Each technology has its benefits
and drawbacks. Alkaline electrolysis is currently the most mature and widespread technology among
the three technologies. The solid oxide electrolysis is still primarily in its development phase, with few
commercial systems available.
Table 1-1 : Comparison of various hydrogen production methods [38]
Parameter SMR Coal Gasification Electrolysis
Efficiency
74%-85%
[39]
60%-75%
[39]
46%-81%
[40]
Hydrogen cost
[US$/kg]
[39,41]
2.27 (with CCS)
2.08 (no CCS)
2005 dollars
1.63 (with CCS)
1.34 (no CCS)
2005 dollars
5.78-23.27
(solar PV, 2007
dollars)
5.10-10.49
(solar thermal, 2007
dollars)
5.89-6.03
(wind, 2005 dollars)
2.17-2.63
(nuclear, 2007 dollars)
8
Lifecycle CO2-eq/H2
[kg/kg]
[42]
11.893 11.299 0.970 (wind)
2.412 (solar)
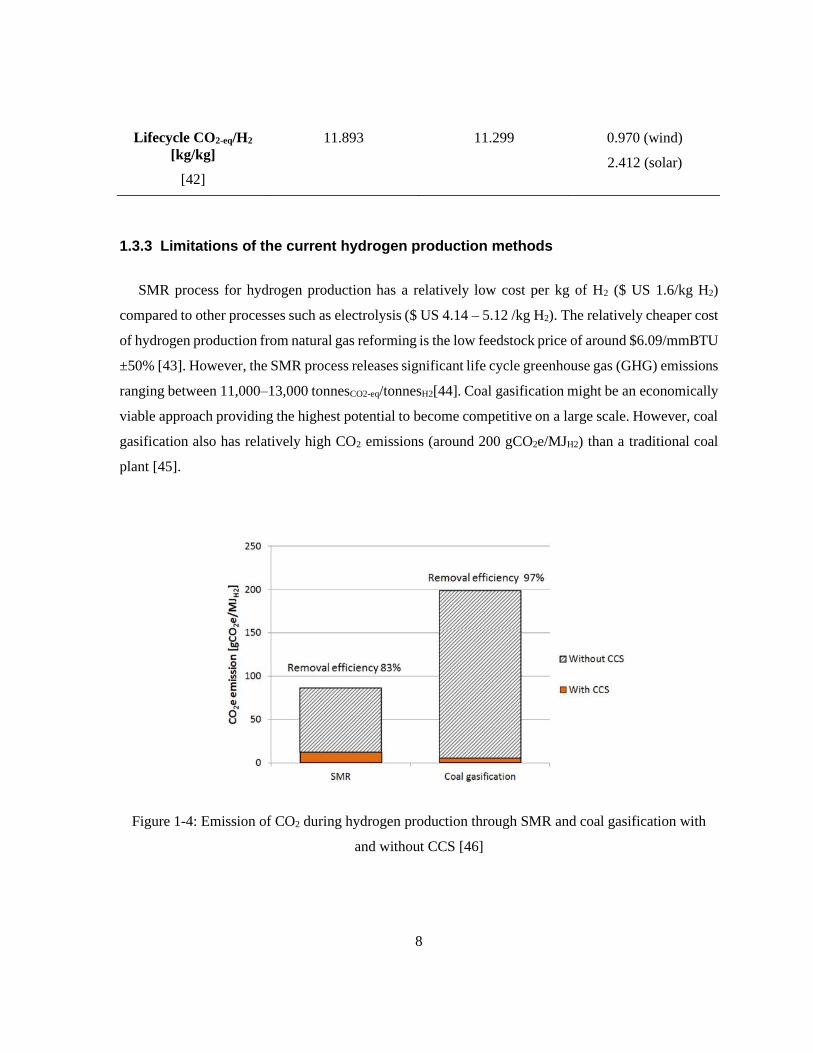
1.3.3 Limitations of the current hydrogen production methods
SMR process for hydrogen production has a relatively low cost per kg of H2 ($ US 1.6/kg H2)
compared to other processes such as electrolysis ($ US 4.14 – 5.12 /kg H2). The relatively cheaper cost
of hydrogen production from natural gas reforming is the low feedstock price of around $6.09/mmBTU
±50% [43]. However, the SMR process releases significant life cycle greenhouse gas (GHG) emissions
ranging between 11,000–13,000 tonnesCO2-eq/tonnesH2[44]. Coal gasification might be an economically
viable approach providing the highest potential to become competitive on a large scale. However, coal
gasification also has relatively high CO2 emissions (around 200 gCO2e/MJH2) than a traditional coal
plant [45].
Figure 1-4: Emission of CO2 during hydrogen production through SMR and coal gasification with
and without CCS [46]

9
Figure 1-4 shows the CO2 emissions released during hydrogen production through SMR and coal
gasification. The figure also shows the significant impact of applying the carbon capture & storage
(CCS) system on these processes. All the different technologies for the electrolysis of pure water to
produce hydrogen share the same limitations. One of these limitations involves the requirement of
excess energy in the form of overpotential to overcome the various activation barriers present. In
addition, electrolysis is normally a more capital expensive method of hydrogen generation than steam
reforming; the electricity required to split the water into hydrogen and oxygen accounts for around 80%
of the cost of hydrogen generation [47].
1.4 What is next?
Various limitations hinder the current industrial production of higher hydrocarbons through the
conversion of natural gas (methane is the principal component) and the efficient generation of hydrogen
as an energy carrier. CO2 emission has been a major global warming contributor [48]. International
Energy Agency (IEA) predicts that the CO2 emissions rate will double by 2030 since its value was
reported in 1990 [49]. Seeing as the current industrially applicable production methods for both
hydrogen and ethylene have a significant CO2 emission output, as showcased in Sections 1.2.3 and
1.3.3, it is necessary to investigate processes that involve the co-production of ethylene and hydrogen
as a by-product in a more economical way and, more importantly, more environmentally friendly.
Natural gas valorization, which involves ethylene production through the conversion of methane,
overcomes the limitations of traditional ethylene production, such as the steam cracking process. Using
natural gas (methane) as a feedstock (instead of ethane) in a direct catalytic reaction in a membrane
reactor (instead of a furnace) can help decrease the energy consumption noticeable in the case of steam
cracking and increase the selectivity toward ethylene production. The ethylene production from natural
gas can occur via two distinct routes, discussed next. An indirect route involves the conversion of
natural gas into syngas (a mixture of CO and H2), and a direct route involving the oxidative coupling
of methane (OCM) aims to produce ethylene. This reaction involves various homogeneous and
heterogeneous reactions in the primary and secondary steps explained further in Section 1.6.

10
1.5 Direct & indirect methane conversion to ethylene
The various attempts to shift the energy production industry from fossil fuel-based to a cleaner energy
source have developed much interest in converting methane to value-added hydrocarbons and
chemicals efficiently and cost-effectively.
Figure 1-5: Methane conversion scheme [50]
According to Figure 1-5, there are two paths for methane conversion to olefins (ethylene, propylene,
and butadiene) [51]. The indirect route involves the conversion of natural gas into syngas (a mixture of
CO and H2). A secondary step occurs where higher hydrocarbons are further cracked to produce
ethylene. More commonly known in the industry as methanol-to-olefins (MTO), this process occurs
via a multistep catalytic reaction involving SAPO-34, ZSM-5, and ZSM-22 as catalysts, as reported by
the literature [50]. Various parties have already commercialized the MTO process, including the Dalian
Institute of Chemical Physics (DICP) [52] and several other companies that have developed (but not
commercialized the technology), including ExxonMobil [7]. This indirect route for methane conversion
to olefins currently has more than 60% of the capital cost for methane reforming to syngas [53].
The direct methane conversion (DMC) processes to chemical and fuels trounce the conventional
syngas production approach when it comes to the complexity of multi-step reaction and energy losses
penalties. However, this technology cannot be considered industry robust due to the high inertness of
C-H bonds in methane and difficulty controlling the reaction selectivity.
Several DMC processes depend on the heterogeneous functionalist of CH4 and showed promising
conversion performance. Some of these processes are methane aromatization (MA), Non-oxidative

11
methane conversion, and oxidative coupling of methane (OCM) [54]. Other DMC processes involve
homogeneous chain-growth of CH4, such as methane cracking and homogeneous methane conversion,
but these are not the focus of this study. Firstly, MA is a process that involves the production of aromatic
compounds, which include C2H6 (benzene) and C10H8 (naphthalene) reactions. The MA is usually
processed in non-oxidative conditions and performs well when using a catalyst that combines metal
oxides and zeolites, such as Mo/ZSM-5 zeolites. A bi-functional mechanical activates CH4 on the
formed MoC sites. The oligomerization reaction follows on the acidic sites in zeolites [55].
4 2 6 66 9CH H C H→ +
ΔHr = 531 kJ/mol (1-5)
One of the limitations of this process is the deposition of coke on acidified sites, which eventually
leads to the deactivation of the catalyst and limits the thermodynamic yield of the reaction. Recent
attempts to overcome thermodynamic limitations on aromatic yields by selective removal of the
hydrogen coproduct include the development of membrane reactors [56,57]. Similarly, the direct non-
oxidative methane conversion is used to produce benzene predominantly with only little olefins in the
absence of O2. Most of the catalysts used in this process are based on Mo/zeolite catalysts. Like the
MA process, the direct nonoxidative methane conversion is accompanied by high coke yields and the
catalyst deactivation caused by coking. In addition, employing a catalytic direct non-oxidative methane
conversation includes many steps that involve compression and separation sections for product
recovery and purification and recovery and recycling of unreacted methane, along with refrigeration,
power generation, and utility sections. In this research, the attention is shifted toward an oxidative
couple of methane as a direct process for methane conversion into higher hydrocarbons. The process
has shown high potential since its discovery in the 1980s. However, it has not been commercially
practiced for various reasons discussed in the following sections.
1.6 Oxidative coupling of methane (OCM)
1.6.1 Process
As discussed in Section 1.2.3, finding a more accessible source of ethylene production that
overcomes the utilization of endothermic, high input temperatures, and costly stream reforming
processes is indispensable to moving forward with the energy sector. Many laboratories have

12
investigated natural gas conversion due to its potential to reestablish the higher carbons production
industry. Converting the methane component of natural gas into less volatile and more valuable
products has attracted interest in recent years. OCM is considered one of the most promising processes
that effectively utilize the pattern of natural gas cleanly and economically through the direct route of
methane conversion into higher valuable hydrocarbons such as ethane or ethylene [58]. The overall
OCM reaction involves the following:
4 2 2 4 22 2CH O C H H O+ → +
ΔHr = -209.3 kJ/molCH4 (1-6)
The primary reaction is accompanied by many homogeneous and heterogeneous reactions in the
primary and secondary steps [59].
4 2 2 6 2
12
2CH O C H H O+ → +
ΔHr = -20.2 kJ/molCH4 (1-7)
4 2 2 22 2CH O CO H O+ → +
ΔHr = -802.6 kJ/molCH4 (1-8)
In addition, the OCM reaction involves the reaction of CH4 and O2 over a heterogeneous catalyst at
elevated temperatures to form the desired products. The process overcomes the issue of energy loss by
avoiding the synthesis of gas or syngas (H2 /CO mixture) as an intermediate, which is typically followed
by the conversion into other chemicals by Fischer-Tropsch reactions or via methanol as a second
intermediate [60].
OCM reactions occur in high-temperature conditions that range between 900-1200 K, depending on
the catalyst used. Higher temperatures are essential to activate the C-H bond in the methane molecule.
The main feed components of the OCM reactions involve high concertation of CH4 and O2 to stay in
the safe range and limit the nonselective gas-phase reactions. The molar ratio of CH4/O2 ranges between
3-12 with or without diluents at moderate pressures (generally atmospheric pressure) [61].
4 2 2
12
2CH O CO H+ → +
ΔHr = -36.0 kJ/molCH4 (1-9)

13
The mechanism of OCM is based on the so-called heterogeneous-homogeneous (H-H) mechanism
[62]. Based on the H-H mechanism, the correlation between the adsorption energy of methane and its
activation energy on oxide surfaces has been established using theoretical calculations.
Figure 1-6: Oxidative coupling of methane (OCM) tradition reaction scheme [63]
The selective route of CH4 involves the direct conversions to C2H6, C2H4, and H2O in O2 and a
suitable catalyst [54]. The first step involves the abstraction of H from CH4 by the catalyst to form
methyl radicals (CH3•) [64]. The review paper by Lunsford in 1995 [62] suggests that the following
step involves the coupling of two CH3• which leads to the creation of ethane. Dehydrogenation of ethane
then produces ethylene. According to Conway et al.[65] This reaction is accompanied by the formation
of C2 hydrocarbons by the addition of CH3• to C2H4.
1.6.2 OCM limitations
Despite how robust the OCM reactions seem to be on a research level. The process is still considered
inadequate for industrial application. Several limitations arise that hinder the adsorption of the OCM
process as an industrial method of ethylene production. Parishan et al. [13] and Jaso et al. [66] claim
that a 30 % C2+ yield is necessary to make OCM competitive. While Kuo et al. [67] claim in their work
that a conversion above 35 %, coupled with a C2+ selectivity above 85%, renders OCM economically
attractive. However, the OCM process is not quite there yet.
The most impactful limitation that the OCM faces is the reported C2+ yield values. As stated in
Section 1.6.1, methane is converted to ethane in a primary step. However, breaking the C-H bond
requires high temperatures above 750 °C in most cases, causing the enhancement of undesired complete

14
and incomplete combustion reactions, which will result in a limitation in the overall C2+ selectivity.
Along with those mentioned above, the oxidative and the non-oxidative dehydrogenation of ethane into
ethylene during the OCM secondary steps can decrease the selectivity of C2+ even further. Due to the
complexity of the set of primary and secondary reactions of the OCM process. Low yields value always
accompanies the process of OCM in the published experimental work, as most of the published studies
report yields that range between 20-25% [59].
Furthermore, dissociating one hydrogen from methane molecule (CH3-H) to form methyl radial is
complex due to the scission of the first C-H bond (ca. 435 kJ/ mol). In order to overcome this limitation,
the activation energy required for methane activation has to be higher than the other significant products
included in the reaction. This can lead to non-selective and sequential oxidation of desired products,
especially in the absence of a selective catalyst; a tradeoff must usually happen for OCM reaction at
high temperatures over an active catalyst between conversion and product selectivity. In addition, as
pointed out by Cruzprat et al. [68], the direct route to H2 and C2H4 will be thermodynamically
disfavored, which means it would require high temperatures, consequently resulting in poor selectivity.
Another economic limitation highlighted by Jiang et al. [58] is that ethylene produced by OCM reaction
with an abundant supply of methane is still relatively more expensive than other industrial alternatives.
Finally, the limitations mentioned above are why great efforts have been carried out to improve the
performance of the OCM process since the 1980s. The complexity of the OCM reaction relates to two
important factors. Firstly, the necessity of developing novel catalysts which could contribute to
maintaining higher selectivity toward the desired product. OCM catalyst and their impact will be
discussed in chapter 2. Secondly, developing suitable reactors that can operate at low temperatures with
high methane conversion and high selectivity is essential to maintain a high yield for the product. Also,
it will help minimize the CO and CO2 generated from the undesirable surface and gas-phase combustion
reactions and, more importantly, avoid the intrusion of the homogenous gas phase free radical (i.e.,
combustion) that can be a determinant factor for the C2+ products. Various efforts were directed toward
developing the reactor configuration that houses the OCM process. Some of these developed involves
using a membrane reactor discussed in Section 1.10.

15
1.7 Membranes
1.7.1 Principle
A membrane can be defined as a region of discontinuity interposed between two phases. Membranes
can be both a permeable or semi-permeable medium and are characterized by permeation and perm-
selectivity. In other words, the membrane may have the ability to transport one component more readily
than others due to the differences in physical and chemical properties between the membrane and the
permeating components [69].
The membrane separation process is characterized by using a membrane to accomplish a particular
separation. The membrane can separate the feed stream into a retentate and permeate by controlling the
relative transport rates of various species, as shown in Figure 1-7. The separation process is evaluated
regarding permeation rate or permeation flux (mol/m2 s) [69]. The permeation flux is defined as the
molar (or volumetric or mass) flow rate of the fluid permeating through the membrane per unit area,
more in Chapter 3.
Figure 1-7: Membrane separation process [69]
1.7.2 Classification
Membranes can be classified according to different viewpoints. Membrane materials, morphology,
the structure of the membranes, preparation methods, separation principles, and application areas are
all criteria for membrane classifications. Membranes can be characterized based on their structure and
separation principle, determining the membrane application. Based on this fact, membranes can be
arranged into porous and dense (non-porous) membranes.

16
Figure 1-8: Porous membrane vs. dense membrane [69]
The porous membrane comprises a porous separation layer and induces separation by discriminating
between particle (molecular) sizes. The porous ceramic membrane's separation characteristics (i.e., flux
and selectivity) are directly impacted by pore size, thickness, and surface porosity [69]. One of the most
significant industrial advantages of porous ceramic membranes is their cost, either membrane materials
or membrane production. Thus, large-scale production for porous materials is more wildly standard.
Dense (non-porous) membranes are characterized by their dense separation layer. The separation
process in this type of membrane happens due to differences in solubility or reactivity and the mobility
of various species. A dense ceramic membrane contains crystalline ceramic materials such as perovskite
or fluorite, a mixture of solid oxides and metals, and the mixed ionic electronic conducting property.
This membrane type provides a high selectivity towards oxygen (or hydrogen) if the prepared
membrane is dense and defect-free while impermeable to most other gases. The mechanism involves
transporting the gas component (usually oxygen or hydrogen) in a dissociated or ionized form rather
than conventional molecular diffusion [70].
Hazbun et al. [71] studied the effect of using a dense ceramic oxygen permeation membrane on the
selectivity and conversion of the C2+ compounds in an OCM reaction. The study involved a two-layer
tubular membrane, a 10 % Y2O3, 89% ZrO2, 1% TiO2 layer for oxygen permeation, and a
LiO/MgO/ZrO2 layer as the catalyst. The reactive tubular membrane is tested for methane conversion
activity by placing the tube in a test apparatus that allows heated air or oxygen to flow outside the tube
and the methane gas within the tube. The feed gas, including methane, is gradually introduced inside
the tube with an inert gas carrier. The reaction of methane with the oxygen conducted through the mixed
conducting membrane occurs at the catalytic Mn sites resulting in higher hydrocarbon products,

17
coproduct water, and H2 and carbon oxides. The study concluded that C2+ yields much higher at 20-
25% and around 50–60 % selectivity with a 35–45 % conversion rate at 700–750 ºC. Thus, it can be
concluded that using a high oxygen permeable dense ceramic membrane with an OCM catalytically
active surface is crucial to achieving high C2+ yields.
1.7.3 Performance
The overall performance is evaluated based on permeability, selectivity, and stability. High
selectivity and permeability are both favored for ideal membranes. However, according to Tan et al.
[69], a compromise must be made to enhance these two factors, negatively affecting the other.
According to the same source, low permeability can be compensated to a certain extent by increasing
membrane surface area. In contrast, low selectivity leads to multi-stage processes, which are not
economical compared with established conventional processes.
1.8 Inorganic membranes (principle, classification, and configuration)
Inorganic membranes are characterized by high chemical and thermal resistances and high
mechanical stability; they are applied in demanding applications. On the other hand, they exhibit the
shortcoming of high cost because of their long and complicated production route in which multi-step
high-temperature treatment is required. They usually consist of several layers from one or more
different inorganic materials.
A porous substrate with large pores (1–15 µm for low flow resistance) but sufficient mechanical
strength is used to support a thin selective layer for separation. Al2O3, ZrO2, TiO2, Si3N4, carbon, glass,
and stainless steel are commonly used for macroporous support. In addition, a separation layer is also
an essential layer of the inorganic membranes. The separation layer may be dense (non-porous), such
as Pd-alloy membranes for hydrogen separation and mixed (electronic, ionic) conducting oxide
membranes for oxygen separation, or porous, such as metal oxides and silicalite or zeolite membranes.
A thin and defect-free separation layer is used to determine the flux and selectivity of inorganic
membranes [69].

18
Figure 1-9: Multi-layered asymmetric structure of inorganic membranes [69]
Inorganic membranes can be produced in the flat disk, tubular, monolithic multi-channel, or hollow
fiber configurations. The multi-channel monolithic form (which is shown in Figure 1-10) is developed
to increase the mechanical robustness and the surface area-to-volume ratio to around 130– 400 m2/m3
compared with 30–250 m2/m3 for tubular designs; this gives more separation area per unit volume of
the membrane element.
Figure 1-10: Multi-channel monolithic membrane [69]
In the monolithic membranes, the monolith bulk is made up of a porous support, and the separation
layer is produced on the inner surface of the channels. Therefore, feed is introduced in the channels,
and the permeate is obtained from the membrane wall.
1.9 Mixed ionic-electronic conductive perovskite membranes
Mixed ionic-electronic conductive (MIEC) perovskite membranes are inorganic membranes and
attractive candidates for oxygen permeation. This membrane type is based on solid electrolytes' oxygen
19
ionic conduction performance and is commonly perovskite and fluorite materials. The temperature
range for their application typically goes from 700 °C up to 1100 °C [72]. This type of membrane's
selectivity towards oxygen avoids using an air separation unit usually required to feed pure oxygen into
the reactor.
Perovskite membranes achieve higher oxygen fluxes than other membranes, such as fluorite
membranes, by varying the cations and adding dopants. A subset of perovskite exhibits both ionic and
electronic conductivities at elevated temperatures. Usually, alkaline-earth metal ions are doped in the
A site to create oxygen vacancies, while transition metal ions in B sites improve the electronic
properties [73].
When exposed to ample oxygen partial pressure gradient, the MIEC perovskite is oxygen selective-
permeable and demonstrates high ionic and electronic conductivity and high thermal and chemical
stability. The oxygen diffusion capabilities in perovskite materials are attributed to oxygen vacancies
and the mobility of charged species, i.e., electrons, holes, lattice oxygen, and oxygen vacancies. The
performance of an oxygen-permeable membrane for hydrogen and ethylene co-production is examined
based on the following [74] :
(1) High oxygen permeability: the oxygen permeability is directly proportional to the hydrogen
production rate on the feed side. Oxygen permeation depends on the ambipolar diffusion of ions and
electrons/holes across the membrane.
(2) High active surface area: surface reactions are essential steps on both sides of the membrane; the
overall C2+ formation and H2O splitting performance depend on the surface reactions, such as the
adsorption/desorption and heterogeneous gas-solid reactions.
(3) Good chemical and mechanical stabilities: the oxygen permeable membrane operates at elevated
temperatures, especially the perovskite membrane, as the conduction of oxygen ions requires a high
temperature (> 700 °C) since the process depends on the presence of oxygen vacancy sites that increase
with temperature [75]. The stability of the membrane materials during heating/cooling and under long-
term operations is of great importance for industrial applications.
(4) Low operating temperature: High operating temperature leads to higher surface reaction kinetics
and better oxygen permeability. However, this enhancement is accompanied by higher operational costs

20
since more insulation materials are required to decrease heat loss. Nevertheless, optimization is also
required to have the reactor operating at appropriate temperatures to achieve the best performances
[76].
According to Wu et al. [37], this type of membrane can be implemented in water splitting
technologies and integrated into Partial Oxidation of Methane (POM) to co-produce high purity
hydrogen and syngas. The study also noted the relationship between the operating temperatures and the
performance of the membrane reactor, which directly affects the hydrogen production rates. Mixed
perovskite-type oxides were examined in the OCM process to convert methane into higher C2+ products
such as ethylene and ethane [77].
1.9.1 Barium based perovskite (BCFZ)
Yao et al. [78] examined the BCFZ membranes morphology to determine its ability for oxygen
separation. The paper included examining the phase structure of BCFZ membranes using a
diffractometer with Cu radiation. In addition to that, the cross-section morphology of the membrane
was studied using a field emission scanning electron microscope at an excitation voltage of 15 kV. The
study results concluded that the BCFZ membranes adhere to a dense ceramic structure. The results also
show how the oxygen permeability of the BCFZ membranes increased with increases in the operating
temperature. The paper also examines the oxygen permeation flux of the membrane, and it shows an
increasing trend initially and then a decrease with increasing Zr content.
A study by Jiang et al. [79] in 2010 examined (BCFZ) oxygen-permeable membrane reactor. The
study involved increasing the hydrogen production rate by increasing the temperature and pressure
difference and reducing gases such as methane to the permeate side to consume the permeated oxygen.
A hydrogen production rate of 3.1 cm3 min-1 cm-2 was obtained at 950 °C. Jiang et al. [79] explain that
the continuous removal of oxygen from water dissociation led to continuously shifting the equilibrium
to the product side. Furthermore, the methane feeding to the permeate side provided a more significant
driving force for oxygen transport, which increases the amount of hydrogen produced.
1.9.2 Calcium based perovskite (LCF-91)
La0.9Ca0.1FeO3−δ (LCF-91) is a ceramic-based mixed conducting oxide membrane. This type of
membrane possesses a mixed ionic conductivity with prevailing electronic conduction. According to

21
the quantitative energy-dispersive X-ray spectroscopy (EDX) study, the stoichiometry of LCF-91
membrane material is shown in Table 1-2.
Table 1-2: Quantitative EDX results for LCF-91 membrane materials [80]
Elements La Ca Fe
Atomic concentration [%]
Calculated stoichiometry
42.41 ± 1.16
0.885 ± 0.023
5.53 ± 0.56
0.115 ± 0.011
52.06 ± 1.24
1.09 ± 0.025
The Goldschmidt tolerance factor, TG, is often used to identify whether the chemical compound can
form a stable perovskite lattice. LCF-91 has a tolerance factor in 0.954 < TG < 1.00, indicating that at
least the material LCF-91 is in a stable perovskite structure [81]. In this research, the focus would be
on this type of perovskite membrane. The membrane will be used to develop the framework for the
reactor design, which is modeled in Chapter 3.
The ability of LCF-91 membranes to enhance the water thermolysis reaction is investigated using
different oxygen sources and sweep cases, in the case methane is added to the sweep side of the reactor.
Wu et al. [80] performed water thermolysis experiments using 0.9 mm thick La0.9Ca0.1FeO3−δ (LCF-91)
perovskite membranes at 990 °C in a lab-scale button-cell reactor. LCF perovskite membranes are
chosen for this investigation for their stability in various conditions. The paper concluded that the water
thermolysis rate is enhanced when using the LCF-91 membrane, especially when fuel is added to the
sweep gas.
1.9.3 Oxygen permeation in mixed ionic-electronic conductive membranes
According to Wu et al. [80], one of the ways to decrease the cost of H2 production from water is to
adopt a process that utilizes heat and chemical potential to drive the water-splitting. This process can
be achievable by enhancing water thermolysis reaction by removing one of the products from the
reaction zone using oxygen-permeable dense mixed ionic–electronic conductive (MIEC) membranes.
This type of membrane makes the equilibrium reaction shift to the product side, which helps increase
the reaction conversion beyond the thermodynamic limits [82]. Shifting the reaction equilibrium to the

22
product side also helps maintain high conversion at lower temperatures, avoiding the deactivation of
catalyst and undesirable side reactions [83].
The oxygen permeation process through a perovskite mixed ionic-electronic conducting membrane
involves several sub-steps: oxygen adsorption, dissociation, recombination, and charge transfer [84].
Since a perovskite material is an ideal structure that shows limited capabilities for producing oxide ions,
the presence of point defects or imperfection is crucial for the bulk diffusion (lattice diffusion in oxides)
to take place [85,86]. Kroger and Vink first adopted the concept of defects and their importance for
mixed conduction ceramic materials [87]. Several defects may occur in a structure, such as vacancies
and interstitial atoms. In this research, the focus is directed more toward the vacancies mechanism. The
vacancy mechanism involves the presence of a vacancy in the site left by an atom or ion that is just
moved from its normal position to an adjacent unoccupied lattice site. Many oxygen vacancies are
formed by doping aliovalent cations [70]. The generated oxygen vacancies tend to be filled with oxygen
atoms and the formation of two-electron holes, as shown in Eqn. (1-10).
2
12
2
x
O OO V O h•• •+ +
(1-10)
Where the charged defects are defined using Kröger–Vink notation.
▪ 𝑂𝑂𝑥 : lattice oxygen
▪ 𝑉𝑂•• : oxygen vacancy
▪ h•: positive electron-hole
Electron holes are conducted when an electron deficiency arises in charges deviating from the
standard lattice ions. In a mixed ion and electron conductor (or, in this case, mixed ionic-electronic
conducting membrane), its overall conductivity performance arises from ionic and electronic defects
contributions. When this type of membrane experiences an oxygen chemical potential gradient that is
imposed on the membrane at high temperature, oxygen anions tend to permeate through the interface
of the membrane along the electron holes from the side containing the high oxygen chemical potential
side to the low oxygen chemical potential side, as shown in Figure 1-11. Meanwhile, the overall charge
neutrality is maintained by a counterbalancing flux of electrons [88].

23
Figure 1-11: Oxygen permeation process from high oxygen chemical potential side to the low oxygen
chemical potential side [88]
One of these two mechanisms follows the oxygen permeation process in this research. One of the
mechanisms suggests that the oxygen molecule -that comes up from the lattice oxygen- reacts with
methane on the catalyst and forms ethylene and water. The other mechanism suggests that the oxygen
diffuses into the catalyst becoming an oxygen lattice; methane then reacts with the catalyst forming the
same products as the first mechanism. The difference between the ionic conductivity of the catalyst and
the membrane used should indicate which mechanism applies, and this will be investigated more in
Chapter 2.
1.10 Membrane Reactors
1.10.1 Principle of Membrane Reactors
In order to achieve higher dissociation ratios, it is desirable to separate the products and shift the
thermodynamic equilibrium of these splitting reactions. Several methods were proposed to shift the
equilibrium, such as quenching [89] and heat-exchanger-loop [90]. However, the perm-selective
permeable membrane reactor has attracted the most attention due to its advantages in separating
products and continuous fuel production from splitting.
Integrating a membrane within a reactor allows the membrane to have a variety of uses, including
serving as a product separator, catalyst support, or reactant distributor. The membrane is usually used
to restrict the transport of certain species as it acts as a permeable or semi-permeable medium. This
membrane function allows for the transportation of one particular component more readily; this

24
permeation process occurs due to the differences in physical and chemical properties between the
membrane and the permeating components [69].
The capital and operational costs can be reduced significantly because the reaction and separation
processes happen simultaneously within a membrane reactor. Combining chemical reactions with the
membrane in a single-step process has several positive impacts, shifting the equilibrium reaction to the
product side, controlling the addition of a reactant by supplying only a particular reactant to the reaction
zone, gives an optimum concentration ratio of the two reactant streams and controlling the way for
gases to contact catalysts.
All the above will significantly improve the conversion and yield rates beyond equilibrium values
and obtain a conversion at less grave conditions, which will minimize the catalytic deactivation from
coke deposition and provide an improved catalyst life in the long run [69].
1.10.2 Classification of Membrane Reactors
Several types of membrane reactors are mainly listed in Table 1-3. The most commonly referred to
the reactor is the packed bed membrane reactor (PBMR), in which the reaction function is provided by
a packed bed of catalysts in contact with the membrane. This type of membrane reactor configuration
is ideal for highly selective membranes and situations where two reactions occur on either side of the
membrane – the product of the reaction on one side acting as a reactant on the other side. In contrast,
the exothermicity of the other compensates for the endothermicity of one reaction [69].
Table 1-3: Types of membrane reactors [69]
Membrane reactor type Description Acronym
Packed-bed membrane reactor
Fluidized-bed membrane reactor
Inert membrane reactor
Catalytic membrane reactor
Catalytic non-selective membrane reactor
Flow-through catalytic membrane reactor
Membrane microreactor
Electrolyte membrane reactor
Additional catalysts are packed in the membrane reactor
Catalysts in the reactor are present in a fluidized mode
Membrane does not participate directly in the reaction
Membrane functions as both catalyst and separator
Membrane is not selective but serves as a catalytic site for reactions
Catalytic reactions take place while the reactants flow through the membrane
Membrane is integrated with the microreactor having a characteristic length of <1 mm
An external electrical circuit is applied to complete reactions
PBMR
FBMR
IMR
CMR
CNMR
FTCMR
MMR
EMR

25
1.10.3 Configuration of Membrane Reactors
Unlike conventional reactors, membrane reactors usually have two separate compartments separated
by a membrane. They are designed and fabricated based on the membrane configuration and the
application conditions. There are three main MRs configurations [69]:
• Tubular MRs consist of feed streams on opposite sides of the membrane concurrently or counter.
Sweep gas is employed on the permeate side to reduce the build-up of products and therefore
reduce the potential rise in mass transfer resistance on the permeate side of the membrane.
• Disk/flat sheet MRs are easily fabricated with a relatively small amount of membrane material in
the laboratory. Catalyst is usually packed on the membrane or coated on the membrane surface.
• Hollow fiber MRs: following the same procedures as tubular MRs, hollow fiber membranes can
be assembled into reactors. They can offer a much greater packing density but suffer from poor
mechanical strength
1.11 Chapter summary
This chapter illustrated the current production methods of ethylene and hydrogen. Various
limitations hinder the current industrial production of higher hydrocarbons through the conversion of
natural gas (methane is the principal component) and the efficient generation of hydrogen as an energy
carrier. Direct and indirect methane conversion methods were illustrated, and the focus was then shifted
toward investigating the OCM process and its limitations. An oxygen permeable membrane-supported
water splitting is a potential technology that utilizes thermochemical energy to split water. Membrane-
supported water-splitting technology can be integrated with the OCM process to co-produce high purity
hydrogen and ethylene in a membrane reactor.
The membranes are classified based on their materials, morphology and structure, preparation
methods, separation principles, or application areas. This research focuses on a mixed ionic perovskite
membrane for its transport properties, chemical and thermal stability, and oxygen permeation. The
oxygen permeability in a composite mixed ionic-electronic conductive membrane is illustrated in this
chapter. Lastly, the principle of the membrane reactor is presented in this chapter. Integrating a
membrane within a reactor allows the membrane to have a variety of uses, including serving as a
product separator, catalyst support, or reactant distributor.
This thesis consists of a total of 5 chapters. The incorporation of a catalyst in a membrane reactor is
discussed in Chapter 2. A catalyst is applied in the membrane reactor to control significant reactions

26
and obtain intermediate products, such as C2+ hydrocarbons. A one-dimensional model of the catalytic
oxygen-permeable membrane reactor is developed in Chapter 3. A base case with a particular operating
condition is discussed in Chapter 4. In addition, sensitivity analysis and a parametric study are
performed to identify the critical parameters that affect the co-production performances in a membrane
reactor. Finally, Chapter 5 illustrates the research conclusions and recommendations for future work.
27
Chapter 2
Catalyst microkinetics of OCM reactions
2.1 Chapter introduction
Combining water splitting and OCM in an oxygen-permeable membrane reactor is a promising
technology that can use water splitting to co-produce a higher value product. Chapter 1 established the
fundamentals of the OCM process and presented the necessary background information about the new
membrane reactor technology proposed in this research.
One way to improve the surface kinetics and enhance the overall performance of the membrane
reactor is by implementing an appropriate OCM catalyst. This chapter investigates the importance of
catalyst implementation in OCM reactions. This chapter also investigates the nature of active sites
where highly reactive intermediates (i.e., chemisorbed species) are stabilized long enough to react. This
stabilization of a reactive intermediate is critical in catalytic reactions. For clarity, the actives sites are
divided into active catalytic and membrane-active sites, investigated in this chapter.
MATLAB is used to model a 10-step kinetic model of the OCM to C2+ hydrocarbons over a
La2O3/CaO catalyst developed based on kinetic measurements in a micro catalytic fixed-bed reactor.
The kinetics catalyst model is based on the model developed by Stanch et al. [91], which is considered
one of the most accurate experimental and statistical analysis models. The model developed in this
chapter predicts the catalyst kinetics for the one-dimensional oxygen-permeable membrane reactor
model developed and analyzed later in chapters Chapters 3 and 4.
2.2 Importance of catalyst implementation in OCM reactions
Implementing active and selective catalysts offers a greater reaction control and intermediate
products, such as C2+ hydrocarbons. For inorganic membranes, the oxygen flux can be significantly
improved by either decreasing the membrane thickness or improving the surface exchange kinetics.
Improving the surface kinetics is by implementing an appropriate OCM catalyst with adequate intrinsic
catalytic properties [69]. In a gas phase catalytic reaction, adsorption of the reactants on the catalyst's
surface is essential. The adsorption process can be divided into two types:
(1) Physical adoption

28
(2) Chemisorption
The chemisorption details how the reactants’ chemical structure becomes more reactive by
interacting with the catalyst that causes their bonds to be stretched, making them easier to break; this
directly affects the rate of the chemical reaction.
The ideal catalyst for the OCM reactions is the one that eases the breaking of a C-H bond in a methane
molecule (CH4) and the dimerization of methyl radicals (CH3). These two reactions are susceptible to
the coupling reaction toward higher hydrocarbons such as ethane and ethylene while minimizing the
carbon monoxide bond (C-O) formation at high conversion levels. However, if the oxygen permeation
rate is greater than the rate consumed in the methane coupling, deep oxidation of methyl radical and
C2+ products to COx will occur, and the C2+ yield will be reduced [69].
According to Lomonosov et al. [92], the Mars–Van Krevelen mechanism is the most accepted
hypothesis as it details how the CH4 reacts with the adsorbed O2 that is located at the active site of the
catalyst (as explained in a previous section) in order to form a methyl radical. In addition, the most
favorable OCM catalyst favors the equilibrium that allows for rapid transformation of oxygen species
responsible for the deep oxidation (O2-) to catalytically more desirable surface species (O2-). Zavyalova
et al. [64] provided several other properties that suitable OCM catalysts should have. These properties
include intrinsic basicity, oxygen-anion conductivity, ability to form oxygen vacancies, fast exchange
rates between atomic oxygen species on the surface, bulk oxygen-anion vacancies, and low sticking
coefficients of methyl radicals (CH3) on the catalyst surface.
2.2.1 Incorporation of catalyst in membrane reactors
According to Tan et al.[69] there are four ways to incorporate catalysts in the membranes of MRs:
(1) Catalyst physically separated from an inert membrane: the catalyst pellets are usually packed
or fluidized on the inert membrane, which acts as an extractor for fractionation of products and as
a distributor for controlled addition of reactants
(2) Catalyst coated on the membrane surface: the catalyst is coated on the membrane surface using
a catalyst paste. The catalyst layer is generally porous and is integrated with the membrane into a
single body
(3) Catalyst dispersed in the porous membrane structure: the catalyst is dispersed in the porous
substrate of the membrane to form a membrane catalyst

29
(4) Inherently catalytic membranes: the membrane material is inherently catalytic, and the
membrane serves as both catalyst and separator
Both methods 1 and 2 can be applied for the membrane reactor design discussed in this research. The
choice is based on the membrane channel height dimensions and whether the catalyst layer is relatively
thin compared to the channel height. If that is the case, coating a catalyst on the membrane surface is
suitable. The packing catalyst pellets method can also be used, but a small amount of catalyst mass
must be used.
2.3 OCM catalysts
2.3.1 Lanthanum-oxide catalyst (La2O3)
Various studies examined the OCM reactions over lanthanum oxide catalyst (La2O3). Simon et al.
[60] simulated the OCM reaction over lanthanum oxide (La2O3) in a catalytic jet-stirred reactor while
varying the operating conditions. The study presents a mechanism (shown in Figure 2-1) that entails
the initiation of the reaction, production of CO2, and the decomposition of C2H6 mechanisms for the
OCM reactions. The study also points out two OCM pathways common in various catalysts, not just
the La2O3. The first pathway leads to oxygenated species, and the second pathway leads to
hydrocarbons.
Figure 2-1: Mechanism of OCM over La2O3 catalyst (1023 K, 10 % CH4 methane conversion) – dark
arrows (homogeneous reactions) and light arrows (surface reactions) [60]

30
According to the mechanism presented by Simon et al. [60] (shown in Figure 2-1), the presence of
La2O3 catalyst increases the C2+ selectivity when the gas space-time is low by introducing new surface
initiation processes. Then, for higher gas space-time, the secondary reaction (shown in Eqn. (2-1)) is
responsible for decreasing C2+ selectivity.
2 3 2C + O CHO + HCHOH →
(2-1)
Furthermore, La2O3 catalysts showed several industrial limitations. Alexiadis et al. [93] reported that
despite showing reasonable but not industrially feasible, C2+ yields values in these studies, the poor
selectivity remains one of the significant hinders for the La-based catalyst to be fully commercialized
for the OCM reaction-based applications. Also, Van et al. [94], in their study on the temperature and
conversion dependence of selectivities in the oxidative coupling of methane on La2O3 catalysts,
emphasize the limitation of La-based catalysts by concluding that for all the La2O3 catalysts
investigated, the C2+ selectivity decreases linearly with methane conversion at temperatures above 900
°C. In addition, the studies from 1994 [95,96] examined the La2O3 under a wide range of temperatures
(1023-1173 K) and various catalyst qualities. The study reported that C2+ selectivity drastically
decreases with the increase in the conversion of methane.
On the other hand, Weiss et al. [97] showed results when analyzing the effect of maintaining low-
temperature conditions (at around 100 K) lower than the temperature used for industrial La2O3 catalysts
for catalyst reactions. The study suggests that using La2O3 with a larger specific area (12 m2/g) showed
more enhanced performance at low temperatures due to the noticeable increase in the defects on the
catalytic surface, which plays an essential role in adsorption and activation of the O2.
Based on the above, maintaining a low reactor temperature and low gas space-time for the La2O3
catalysts is the best approach to get the most suitable C2+ selectivity.
2.3.2 Lanthanum-calcium-oxide catalyst (La2O3/CaO)
Lanthanum-calcium oxide catalyst kinetics has proven the most reliable and comprehensive for OCM
applications [66,98], which is why it has been chosen to simulate the OCM reactor for this research.
La2O3/CaO can be prepared using wet impregnation of CaCO3 with an aqueous solution of La

31
(NO3)3●6H2O. Wenzhao et al. [99] developed a study about the inhibition of gas-phase oxidation of
ethylene in the oxidative conversion of methane La2O3/CaO. According to the study, lanthanum would
act as an inhibitor of methyl radical or methane oxidation calcium oxide as a promoter for ethane
dehydrogenation into ethylene and hydrogen, thus favoring oxidative dehydrogenation. A study by
Mleczko et al. [63] examined the oxidative coupling of methane over a La2O3/CaO catalyst was in a
laboratory-scale fluidized-bed reaction while supplying undiluted feed (pCH4 > 60 kPa). The study
pointed out how very reactive La2O3/CaO tended to be in an OCM reaction and reported a maximum
selectivity of 73.8 % and a maximum yield of 16 %; this is considered one of the highest published
values fluidized-bed reactors. However, the maximum yield tends to be lower at around 15.8 % for the
fixed-bed reactor. Godini et al. [66] developed a comparative analysis of three different reactor
structures, including a fixed-bed reactor and two different feeding structures of packed bed membrane
reactors. Three types of kinetic models have been used: La2O3/CaO, Mn/Na2WO4 /SiO2, and PbO/Al2
O3. The study’s quantitative results reported that La2O3/CaO has higher activity than other catalysts.
This property enables oxygen to react rapidly and to remain at a low level in the reaction side.
Consequently, it makes reaction more selective towards coupling products.
On the other hand, there are some limitations to using the OCM process over lanthanum-calcium
oxide. For instance, Ching et al. [100] examined the OCM process using La2O3/CaO catalyst by running
simulations of the OCM process in a fixed bed reactor for isothermal, adiabatic, and non-adiabatic
operations. The reactor chosen for the study was a conventional tubular reactor packed with La2O3/CaO
catalyst. The reactor operated at 110 kPa total pressure. The study pointed out that using La2O3/CaO as
a catalyst for OCM reaction results in a yield drop with the increase in the concentration of methane in
the feed. It is harder to find the optimum feed composition when using La2O3/CaO as a catalyst for
OCM reaction.
Lastly, it is essential to analyze the material's ability to conduct oxygen anions through their structure
as it facilitates the bulk transport of ions through the structure. One way to measure such an ability is
by using ionic conductivity. According to Etsell et al. [101], they were reported in their study about the
electrical properties of lanthanum oxide‐calcium oxide solid electrolytes that the ionic conductivity of
La2O3/CaO is about 2.4E-2 Ω-1 cm-1 at 1273.2 K and 15 % CaO composition. La2O3/CaO also exhibits
an n-type and p-type conductivity mixture at different catalyst compositions, temperatures, and oxygen
pressures. Etsell et al. [101] reported the conditions that favor the ionic conductivity over the other
32
types of conductivities in the La2O3/CaO catalyst, including low temperatures, intermediate oxygen
pressures, and CaO ratio of the La2O3/CaO catalyst.
2.4 Heterogeneous surface reactions
A description of the heterogeneous chemistry is needed to characterize a perovskite membrane's
catalytic activity and examine its coupling with oxygen permeation, gas-phase transport, and
elementary reactions. In a heterogeneous catalytic reaction, several steps occur respectively:
(1) Mass transfer (diffusion) of the reactant(s) from the bulk fluid to the external surface of the
catalyst pellet through the boundary layer of thickness
(2) Diffusion of the reactant through the catalyst pores to the immediate vicinity of the internal
catalytic surface
(3) Adsorption of reactant(s) onto the catalyst surface
(4) Catalyst surface reaction: That is where the role of active sites is essential, where the catalytic
reaction occurs. Several mechanics are used to describing the catalytic reactions [102] :
a. Single site: only the site on which the reactant is adsorbed is involved in the reaction.
b. Dual site: The adsorbed reactant interacts with another site (either unoccupied or occupied)
to form the product.
c. Eley–Rideal: an adsorbed molecule and a molecule in the gas phase, such as the reaction of
propylene and benzene
d. Langmuir–Hinshelwood mechanism: between two molecules over the surface of a
heterogeneous catalyst suggests that both molecules have to be adsorbed on the neighboring sites
to react and produce a particular product.
(5) Desorption of the products from the surface
(6) Diffusion of the products from the interior of the pellet to the external surface
(7) Mass transfer of the products from the external surface to the bulk fluid
It is essential to point out that when heterogeneous reactions are carried out at a steady state, the rates
of each of the three reaction steps in series (adsorption, surface reaction, and desorption) are equal.

33
2.4.1 Nature of active sites
Defining the role of active sites has changed along the way since its first established back in 1928
by Hugh Stott Taylor [103], who suggested that the catalytic reaction does not occur over the entire
solid surface but only at specific active sites or centers. Fogler [102] defined the active sites in his book
as sites where highly reactive intermediates (i.e., chemisorbed species) are stabilized long enough to
react. This stabilization of a reactive intermediate is critical in designing any catalyst.
2.4.2 Catalytic active sites
La2O3-based catalysts have high activity compared to other OCM catalysts [104], and that is why
several experimental investigations have centered around its OCM chemistry. For homolytic С–Н bond
cleavage (breaking), surface oxygen species possessing oxidizing properties and a high hydrogen atom
affinity is necessary for methane activation [92].
Palmer et al. [105] analyzed the possibility of surface peroxides as active sites being involved in
hydrogen atom abstraction from methane in the presence of La2O3. The proposed model for OCM over
La2O3-based catalysts suggested that the surface peroxides as the active oxygen source. The mechanism
is laid down as follows:
(1) The cycle is initiated by dissociative adsorption of molecular oxygen over an oxide-covered
surface to form a pair of surface peroxide sites.
(2) H-abstraction from CH4 at the surface O22- sites.
(3) Abstraction from CH4 generates a gas-phase •CH3 radical (as shown in Eqn. (2-2)).
2 2
2( ) 4 2( ) 3O + CH O H + CHs s
− −→ −
(2-2)
Where,
▪ 𝑂2(𝑠)2− : peroxide site
▪ •CH3: methyl radicals
Coupling of gas-phase •CH3 radicals to produce ethane. CH3 radicals are required for dimerization
(dimerization is an addition reaction in which two molecules of the same compound react with each

34
other to give the adduct) to ethane, as shown in Eqn. (2-3). The methyl radical generated via the
mechanism above combines ethane instead of reacting with surface oxygen-producing methoxy
species. The ethane undergoes dehydrogenation, producing ethylene, as shown in Eqn. (2-4) and Eqn.
(2-5).
3 3 2 6CH CH C H+ →
(2-3)
3 2 6 4 2 5CH + C H CH + C H→
(2-4)
2 5 3 2 4 4C H + CH C H + CH→
(2-5)
Where,
▪ •C2H5: ethyl radicals
Several other mechanisms are used to explain the surface reaction mechanisms. Langmuir–
Hinshelwood mechanism [106], which explains the reaction between two molecules over the surface
of a heterogeneous catalyst, suggests that both molecules have to be adsorbed on the neighboring sites
to react and produce a specific product through a biomolecular reaction. Eley–Rideal mechanism [107],
on the other hand, suggests that only one of the molecules can be adsorbed while the other can directly
react in its gas phase without adsorbing. However, according to Stanch et al. [91], the Eley-Rideal
reaction mechanism cannot be used to consider the interaction of methane and oxygen molecules and
adsorption of methane and oxygen on different active sites for the La2O3/CaO catalyst. The reason is
that the Eley-Rideal reaction mechanism could not describe the linear dependency of the hydrocarbons
formation on the methane partial pressure established in Stanch et al.'s [91] kinetic model of the OCM
over the La2O3/CaO catalyst. However, the Eley-Rideal mechanism was proposed for (CaO)x and
(CeO2)1-x catalysts.
Mars-Van Krevelen Mechanism is based on the idea that adsorption of one molecule occurs on top
of another molecule that had previously been adsorbed [107]. The mechanism also suggests that the
solid catalyst undergoes an oxidation-reduction cycle, in which electrons are removed and returned to
the solid catalyst between two sites in a catalytic process which means the solid catalyst undergoes an
oxidation-reduction cycle.

35
In summary, various groups suggest different mechanisms for OCM catalyst surface reactions. Most
of the OCM catalysts are similar in that they contain surface oxygen species with a high hydrogen atom
affinity and can activate hydrocarbon molecules. These species can exist on the surface of OCM
catalysts even when the gas phase contains no oxygen [92].
2.4.3 Membrane active sites
In this research, the feed side of the membrane reactor contains the water-splitting reaction. The
water is the only source of oxygen and is injected into the reactor by an inert gas carrier. Therefore, the
oxygen incorporation/dissociation reaction or the forward/reverse water thermolysis reaction occurs.
Assuming one-step heterogeneous reaction between the gas phase and the solid membrane surface.
, ,/
2 22r H f Hk k x
O OH O V O h H•• •+ ⎯⎯⎯→ + +
(2-6)
This step can be expanded into,
2 ( ) 2( ) 2( )
1
2g g gH O O H→ +
(2-7)
2( ) ( )
12
2
x
g O O sO V O h•• •+ +
(2-8)
Where,
▪ OxO: lattice oxygen
▪ VO••: oxygen vacancy
▪ h•: positive electron-hole
▪ kr, H and kf, H: forward and reverse reaction rate constants for water-splitting process
Eqn. (2-7) describes the gaseous water splitting process. In contrast, Eqn. (2-8) describes the overall
oxygen incorporation/discharge process, a reversible reaction on the feed and sweep sides membrane
surfaces. However, according to Ghoniem et al. [108], when fuel conversion occurs on the membrane
surface, this overall reaction may not accurately capture the surface reactions because the fuel

36
conversion reactions might influence some of the intermediate oxygen surface exchange processes.
That is why Ghoniem et al. [108] suggested two surface reactions :
,1 ,1/
2 2( ) 2 ( ) 2f bk kO s O s h− •+ ⎯⎯⎯→ +
(2-9)
,1 ,1/
2( ) ( )f bk k x
O OO s V O s h H− •• •+ ⎯⎯⎯→ + + +
(2-10)
Where,
▪ (s): vacant surface site
▪ O -: singly adsorbed charged surface oxygen anion
Eqn. (2-9) and Eqn. (2-10) can be used to describe the heterogenous reaction that occurs on the
membrane surface as follows [108] :
(1) Adsorption/desorption of gas-phase oxygen molecules onto/ from the membrane surface.
(2) Dissociation/association of adsorbed oxygen molecules into/ from oxygen atoms.
(3) Electron transfer with the lattice to form singly charged surface oxygen anions/oxygen atoms.
(4) Incorporation into/discharge from the crystalline structure by filling/forming an oxygen
vacancy.
(5) Electron transfer with the lattice to form fully charged/singly charged bulk oxygen anions.
Steps 1, 2, and 3 are associated with Eqn. (2-9), while steps 4 and 5 are associated with Eqn. (2-10).
In addition, on the sweep side of the membrane reactor, there are active sites for the association of
oxygen ions to form molecular oxygen, followed by desorption; this results in a slightly higher surface
exchange rate. The catalyst will be directly applied to the membrane surface on the sweep side. The
non-existence of oxygen molecules as a feed component will mean that the catalyst used has to have
the capability of storing lattice oxygen in its crystal structure to generate higher hydrocarbons. The
lattice oxygen diffuses out of the surface of the membrane. There are two paths for the diffusion of
lattice oxygen out of the surface of the membrane on sweep side:

37
(1) Reacting with electron holes to produce oxygen molecules.
(2) Diffusion through the catalyst if the trigger has higher oxygen conductivity.
LCF membrane ionic conductivity (σ) gives 3E-2 S cm-1 and 7E-2 S cm-1 at 973K and 1073K
compared to about 2.4E-2 Ω-1 cm-1 (2.4E-2 S cm-1) at 1273.2 K and 15 % CaO composition of ionic
conductivity for La2O3/CaO catalyst as mentioned in Section 2.3.2 [109]. This information can be used
to eliminate the second path of oxygen diffusion and supports the idea that the oxygen lattice can react
with the electron-hole to leave the surface of the membrane and transform to gas-phase oxygen, as
shown in Eqn. (2-11).
, ,/
2
12
2
r O f Ok kx
O OO h O V• ••+ ⎯⎯⎯→ +
(2-11)
Where,
▪ kf, O and kr, O: forward and reverse reaction rate constants for oxygen incorporation reaction
2.5 La2O3/CaO OCM catalyst microkinetics model
Stansch et al. [91] provide a study that offers a 10-step kinetic model of the oxidative coupling of
methane to C2+ hydrocarbons in a micro-catalytic fixed-bed reactor covering many reaction conditions.
(1 < PO2 < 20 kPa, 10 < PCH4 < 95 kPa, 700 < T < 955 °C, 0.76 < space-time < 250 kg s/m3). According
to Daneshpayeh et al. [98], the probability of the model of Stansch et al. [91] being valid exceeds
99.99%, which is significantly higher than the probability for other models. Such a high probability
proves that Stansch et al.'s [90] reaction network has a better validation than other models despite the
greater number of reactions and parameters. In other words, this model has a more realistic description
of OCM reaction behaviors. Therefore, this model was selected as a reaction network in this study.
Stansch et al. [91] provided a model that considered an almost complete set of elementary reactions
consisting of nine heterogeneous and one homogeneous reaction step. According to this model,
methane is converted into three parallel reactions:
(1) Formation of ethane by oxidative coupling of methane.
(2) Nonselective total oxidation of methane to carbon dioxide.
(3) Partial oxidation of methane to carbon monoxide. In which the carbon monoxide is then oxidized
to carbon dioxide.

38
In consecutive steps, ethane conversion proceeds by two parallel routes, i.e., by heterogeneous
catalytic oxidative dehydrogenation of ethane and thermal gas-phase dehydrogenation of ethane to
ethylene. In addition, ethylene can be converted to carbon monoxide in two parallel ways, i.e., partial
oxidation and steam reforming. Also, the carbon monoxide to carbon dioxide ratio is influenced by the
water-gas-shift reaction, which proceeds in both directions. In this reaction network model, direct
oxidation of ethane to carbon oxides was neglected, and reactions of ethane and ethylene to higher
hydrocarbons (C3+) with less than 5% selectivity were also neglected.
4 2 2 2
4 2 2 6 2
4 2 2 2
2 2
2 6 2 2 4 2
2 4 2 2
2 6 2 4
Step 1 : CH + 2O CO + 2H O
Step 2 : 2CH + 0.5O C H + H O
Step 3 : CH + O CO + H O + H
Step 4 : CO + 0.5O CO
Step 5: C H + 0.5O C H + H O
Step 6 : C H + 2O 2CO + 2H O
Step 7 : C H C H +
→
→
→
→
→
→
→ 2
2 4 2 2
2 2 2
2 2 2
H
Step 8 : C H + 2H O 2CO + 4H
Step 9 : CO + H O CO + H
Step 10 : CO + H CO + H O
→
→
→
Figure 2-2: Set of stochiometric equations from Stansch et al. kinetic model [91]
The model used a combination of the Hugoen-Watson equation and power-law rate equations to
describe the reaction rates equations. In order to describe the inhibiting effect of oxygen and carbon
dioxide, a Hougen-Watson type rate equation was applied, as shown in Eqn. (2-13) and Eqn. (2-12),
respectively. For the oxidation reactions, an inhibiting effect of carbon oxide (∆H𝑎𝑑,𝐶𝑂2) had to be
considered. In addition, the inhibiting effect of oxygen (∆H𝑎𝑑,𝑂2), directly impacts the primary selective
reaction step of ethane formation.
2
, , 2
2 2,
, u = 1,3-6
[1 ( )]
u
u u
ad u CO
E
m nR Tu C O
u H
nR Ti CO CO
k e p pr
K e p
−
−
=
+
(2-12)

39
,2 2
2
2 2 4
, ,2 2
2 2 2 2
2
2
2
2,
( )
[1 ( ) ( )]
ad O
ad O ad CO
HE
nR T R TO O CH
H H
nR T R TO O CO CO
k e K e p pr
K e p K e p
−−
− −
=
+ +
(2-13)
In addition, in order to determine rates of thermal dehydrogenation, steam reforming of ethylene, and
the water gas shift reaction, power-law rate equations were applied to quantify the rate equations for
steps from 7 – 10, which is shown in the set of Eqn. (2-14).
7
2 6
8
8 8
2 4 2
9
9 9
2
10
10 10
2 2
7 7
8 8
9 9
10 10
r = k
r k
k
k
E
R TC H
E
m nR TC H H O
E
m nR TCO H O
E
m nR TCO H
e p
e p p
r e p p
r e p p
−
−
−
−
=
=
=
(2-14)
Where,
▪ u: reaction step 1-10
▪ rj: reaction rate (catalytic), [mol/g s]
▪ ku: pre-exponential factor
▪ Ea,j: activation energy in the reaction step ‘j’, [J/mol]
▪ R: gas constant, [J/ mol K]
▪ T: temperature, [K]
▪ p: partial pressure, [Pa]
▪ mu: reaction order
▪ nu: reaction order
▪ n: estimated power exponent (0.40 at T > 1073.15 K, 0.65 at 1023.15 K and 1.00 at 973.15 K)
▪ 𝐾𝑢,𝐶𝑂2: CO2 adsorption constant, [Pa-1]
▪ 𝐾2,𝑂2: O2 adsorption constant for reaction step 2, [Pa-1]
▪ ∆H𝑎𝑑,𝐶𝑂2: adsorption enthalpy for CO2, [J/mol]
▪ ∆H𝑎𝑑,𝑂2: adsorption enthalpy for O2, [J/mol]
40
2.5.1 La2O3/CaO catalyst microkinetics model computing process
In order to present the developed La2O3/CaO catalyst microkinetics model, a flow chart detailing
the computing process is shown in Figure 2-3. The process starts by declaring the initial operating
conditions, discussed further in Section 2.5.2. The estimation for the time step is discussed in section
2.5.3, followed by estimating the partial pressure inlet species. The process also includes the declaration
of the kinetics parameters presented in Section 2.5.4. The model is based on a loop condition that details
the step that corresponds to the point at which the total volume of the species reacted is equal to or
higher than the total volume of the reactor, which indicates whether the input species have covered the
entire volume of the reactor. The loop condition is explained further in Section 2.5.5.
A decision command is used to compute the loop condition, in which the maximum length
developed reactor corresponds to the length at which the output molar flow rates are printed. The model
will print out the molar flow rates at the corresponding step if the condition is satisfied. If the condition
is not satisfied, the molar fractions, partial pressures, and reaction rates are computed at time step (j).
The formation/destruction rates are then computed based on the reaction rates obtained. Lastly, the
formation and destruction rates are used to obtain the new molar flow rates at the new time step (j+1),
illustrated in Section 2.5.7.
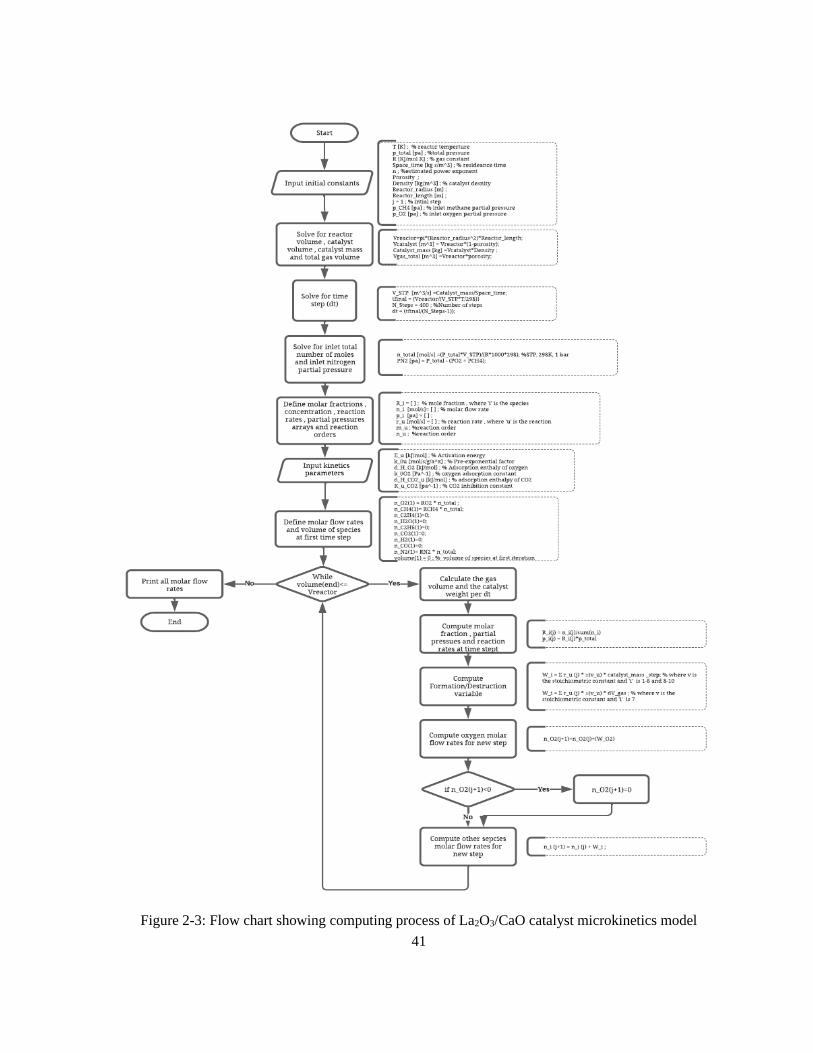
41
Figure 2-3: Flow chart showing computing process of La2O3/CaO catalyst microkinetics model

42
2.5.2 Reactor geometry and operating conditions
The MATLAB model developed depicts similar dimensions and operating conditions to the
comprehensive 10-step kinetic model developed by Stansch et al. [91] to ensure that the catalyst model
developed can accurately predict the La2O3/CaO catalyst kinetics. The model is based on a micro
catalytic fixed-bed reactor covering various reaction conditions presented in Table 2-1.
Table 2-1: Dimensions and initial operating conditions (La2O3/CaO catalyst model)
Parameter Value
Reactor radius (rreactor) [m]
Reactor length (Lreactor) [m]
Reactor volume (Vreactor) [m3]
Gas constant (R) [kJ/mol K]
Total pressure (ptotal) [Pa]
Temperature (T) [K]
Space time [kg s/m3]
Volumetric flow rate (��𝑆𝑇𝑃) [m3/s]
Total gas volume (Vgas) [m3]
Catalyst porosity (φ)
Catalyst volume (Vcatalyst) [m3]
Catalyst mass (mcatalyst) [kg]
Catalyst density (ρcatalyst) [kg/m3]
Inlet methane partial pressure (𝑝𝐶𝐻4,𝑖𝑛𝑙𝑒𝑡) [pa]
Inlet oxygen partial pressure (𝑝𝑂2,𝑖𝑛𝑙𝑒𝑡) [pa]
3E-3
2.27E-1
6.42E-6
8.31E-3
100000
973.15 ≤ T ≤ 1103.30
1.86 - 49.97
4.9E-3
3.85E-6
0.6
2.58E-6
9.2E-3
3600
10 ≤ 𝑃𝐶𝐻4,𝑖𝑛𝑙𝑒𝑡 ≤ 80
1.2 ≤ 𝑃𝑂2,𝑖𝑛𝑙𝑒𝑡 ≤ 18.1

43
For the reactor dimensions, the reactor developed has a cylindrical shape based on the reactor
schematic presented in the kinetic model developed by Stansch et al. [91]. The reactor volume was
calculated based on the cylindrical shape shown in Eqn. (2-15). The reactor radius and length shown in
Table 2-1 are also estimated based on the reactor schematic presented in a kinetic model developed by
Stansch et al. [91].
2( ) ( )reactor reactor reactorV r L=
(2-15)
Where,
▪ Vreactor: volume of the reactor, [m3]
▪ reactor: reactor radius, [m]
▪ Lreator: reactor length, [m]
According to the kinetic model developed by Stansch et al. [90], methane, oxygen, and nitrogen are
all inlet species for the operating condition. The inlet pressures of methane and oxygen are varied to
examine a wide range of reactor conditions. The partial inlet pressure of nitrogen is calculated based
on the assigned partial pressures of methane and oxygen, as shown in Eqn. (2-17). The partial pressures
of the inlet species are used to calculate the initial molar ratios, as shown in Eqn. (2-16).
ii
total
pR
p=
(2-16)
Where,
▪ Ri: Mole ratio for species ‘i'
▪ pi: partial pressure for species ‘i', [pa]
2 2 4( )N total O CHp p p p= − +
(2-17)
Where,
▪ 𝑝𝑁2: nitrogen partial pressure, [pa]
▪ 𝑝𝑂2: oxygen partial pressure, [pa]

44
▪ 𝑝𝐶𝐻4: methane partial pressure, [pa]
▪ 𝑝𝑡𝑜𝑡𝑎𝑙: total inlet pressure, [pa]
In order to find the total catalyst mass and volume, an estimation of the porosity is required. Due
to the porous nature of the La2O3/CaO catalyst used. The catalyst bulk consists of a porous catalyst
pellet made of small porous particles. The small porous particle is assumed to have a sphere-like core
and a cubic outer shape, as shown in Figure 2-4.
Figure 2-4: Schematic showing the catalyst’s small porous particle
The radius of the catalyst’s small porous particles can be estimated by equating its area and volume
ratio and the catalyst BET surface area and its specific volume, as shown in Eqn. (2-18). The porosity
is then estimated based on the ratio between the void volume between the core of the catalyst’s particle
and its outer shape and the total volume of the catalyst’s small porous particles.
, ( )
, ( )
catalyst particle sphere
catalyst particle sphere
A BET
V =
(2-18)
, , ( )
,
catalyst particle catalyst particle spherevoid
total catalyst particle
V VV
V V
−= =
(2-19)
Where,
▪ 𝐴𝑐𝑎𝑡𝑎𝑙𝑦𝑠𝑡,𝑝𝑎𝑟𝑡𝑖𝑐𝑙𝑒(𝑠𝑝ℎ𝑒𝑟𝑒) : catalyst small porous particle area (sphere core), [m2]
▪ 𝑉𝑐𝑎𝑡𝑎𝑙𝑦𝑠𝑡,𝑝𝑎𝑟𝑡𝑖𝑐𝑙𝑒(𝑠𝑝ℎ𝑒𝑟𝑒): catalyst small porous particle volume (sphere core), [m3]
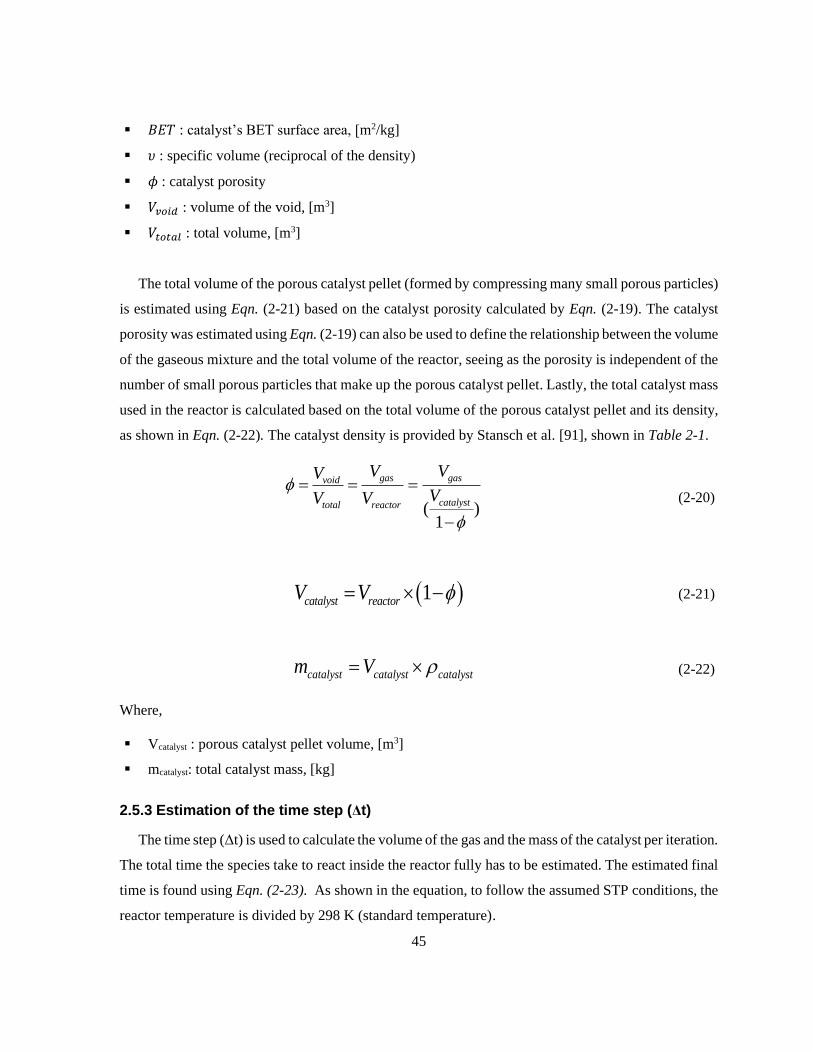
45
▪ 𝐵𝐸𝑇 : catalyst’s BET surface area, [m2/kg]
▪ 𝜐 : specific volume (reciprocal of the density)
▪ 𝜙 : catalyst porosity
▪ 𝑉𝑣𝑜𝑖𝑑 : volume of the void, [m3]
▪ 𝑉𝑡𝑜𝑡𝑎𝑙 : total volume, [m3]
The total volume of the porous catalyst pellet (formed by compressing many small porous particles)
is estimated using Eqn. (2-21) based on the catalyst porosity calculated by Eqn. (2-19). The catalyst
porosity was estimated using Eqn. (2-19) can also be used to define the relationship between the volume
of the gaseous mixture and the total volume of the reactor, seeing as the porosity is independent of the
number of small porous particles that make up the porous catalyst pellet. Lastly, the total catalyst mass
used in the reactor is calculated based on the total volume of the porous catalyst pellet and its density,
as shown in Eqn. (2-22). The catalyst density is provided by Stansch et al. [91], shown in Table 2-1.
( )1
gasvoid
total reac
gas
catalysor ttV
VV
V V
V
= = =
−
(2-20)
( )1 catalyst reactorV V = −
(2-21)
catalyst catalyst catalystm V =
(2-22)
Where,
▪ Vcatalyst : porous catalyst pellet volume, [m3]
▪ mcatalyst: total catalyst mass, [kg]
2.5.3 Estimation of the time step (Δt)
The time step (Δt) is used to calculate the volume of the gas and the mass of the catalyst per iteration.
The total time the species take to react inside the reactor fully has to be estimated. The estimated final
time is found using Eqn. (2-23). As shown in the equation, to follow the assumed STP conditions, the
reactor temperature is divided by 298 K (standard temperature).

46
The estimation of the time step might not be accurate; however, the accuracy of the time step does
not impact the model output. As explained, the reactor model is assessed based on the reactor volume
in which the total volume of the species reacted compared to the total volume of the reactor, which
indicates whether the input species have covered the entire volume of the reactor. The manually
assigned number of steps or iterations is 400 steps. The change in time parameter (Δt) is estimated using
Eqn. (2-24).
P
reactofinal
STP
ST
rVt
V T
T
=
(2-23)
- 1
final
steps
tt
n =
(2-24)
Where,
▪ tfinal: estimated final time, [s]
▪ T: reactor temperature, [K]
▪ TSTP: standard temperature (298 K), [K]
▪ nsteps: manually allocated number of iterations
2.5.4 Defining the activation energies, reaction orders, and enthalpy of adsorption
Table 2-2 presents all the kinetics parameters extracted from those listed in Stanch et al. [91] kinetics
model. As mentioned, the kinetics developed by Stanch et al. [91] applies the Hougen-Watson type rate
equation to describe the inhibiting effect of oxygen and carbon dioxide on the formation of ethane.

47
Table 2-2: Kinetics parameters from Stanch et al. [91]
Reaction kj
[mol/g s
pa-(m+n)]
Ea, j
[kJ/mol]
𝑲𝒋,𝑪𝑶𝟐
[Pa-1]
∆𝐇𝒂𝒅,𝑪𝑶𝟐
[kJ/mol]
𝑲𝟐,𝑶𝟐
[Pa-1]
∆𝐇𝒂𝒅,𝑶𝟐
[kJ/mol]
mj nj
1 0.2E-5 48 0.25E-12 -175 - - 0.24 0.76
2 23.2 182 0.83E-13 -186 0.23E-11 -124 1 0.4
3 0.52E-6 68 0.36E-13 -187 - - 0.57 0.85
4 0.11E-3 104 0.40E-12 -168 - - 1 0.55
5 1.7E-1 157 0.45E-12 -166 - - 0.95 0.37
6 6E-2 166 0.16E-12 -211 - - 1 0.96
7 1.2E+7* 226 - - - - - -
8 9.3E+3 300 - - - - 0.97 0
9 0.19E-3 173 - - - - 1 1
10 0.26E-1 220 - - - - 1 1
*Reaction 7 units [mol/s m3 Pa1]
2.5.5 While loop condition
A ‘while loop’ is used to calculate the molar flow rates of species at each time step along with the
reactor length. The loop condition (volume(end) < = Vreactor) is based on the total volume of the
species reacted compared to the total volume of the reactor, which indicates whether the input species
have covered the entire volume of the reactor. Once the total volume of the species exceeds the total
volume of the reactor, this indicates that there is no further reaction because the catalyst is fully
consumed.
2.5.6 Gas volume and catalyst per time step
In order to divide the reactor into a defined set of iterations, it is crucial to consider the amount of
catalyst per iteration and the total volume of species per iteration. Firstly, the change in the gas volume
at every iteration is calculated based on the ideal gas assumption (PV=nRT), as shown in Eqn. (2-25).
The change in total volume inside the reactor (ΔV = ΔVgas + ΔVcatatlyst.) is calculated using the porosity
and calculated change in gas volume as shown in Eqn. (2-26).

48
( )i
gas
total
n R TdV dt
p
=
(2-25)
gas
total
dVdV
=
(2-26)
The change in the catalyst volume is calculated in Eqn. (2-27) based on the relationship established
in the porosity calculated shown in Eqn. (2-19). The change in the catalyst mass is calculated using
the predefined catalyst density of 3600 kg/m3, as shown in Eqn. (2-28).
( ) 1 catalyst totaldV dV = −
(2-27)
catalyst catalyst catalystdm dV =
(2-28)
Where,
▪ dVcatalyst: change in catalyst volume, [m3]
▪ dVgas: change in gas volume, [m3]
▪ dVtotal: change in total volume (catalyst and gas), [m3]
▪ dmcatalyst: change in catalyst mass per step, [m3]
2.5.7 Molar flow rates for the new time step
As explained in Section 2.5, the model used a combination of the Hugoen-Watson equation and
power-law rate equations to describe the reaction rates equations. The partial pressures of each species
directly affect the reaction rates of the elementary steps, as shown in Eqn. (2-12), Eqn. (2-13), and Eqn.
(2-14). The partial pressures are calculated based on the molar ratios of each species, as shown in Eqn.
(2-30). The mole ratio of every species is calculated based on its corresponding molar flow rate and the
summation of all the molar flow rates for the specific iteration, as shown in Eqn. (2-29).

49
( )
( )R
j
ij
i
i
n
n
=
(2-29)
( ) ( )j j
i i totalp R p=
(2-30)
The formation and destruction rate (��𝑖) is calculated based on the reaction rates shown in Eqn.
(2-12), Eqn. (2-13), and Eqn. (2-14), in addition to the species’ stoichiometric coefficients. It is
favorable for formation rates and negative for destruction rates. Lastly, all the species' output molar
flow rates at the new step are calculated based on their corresponding formation and destruction rates
and their corresponding molar flow rates at the previous step, as shown in Eqn. (2-32).
i u uW r =
(2-31)
( 1) ( )j j
i i in n W+
= + (2-32)
Where,
▪ Wi: formation/destruction rate of species ‘i’, [mol/s]
▪ Ri(j): mole ratio of species ‘i’ at iteration ‘j.’
▪ ni(j): molar flow rate of species ‘i’ at iteration ‘j’, [mol/s]
▪ Σ ��𝑖: summation of molar flow rates at iteration ‘j.’
▪ pi(j): partial pressure of species ‘i’ at iteration ‘j,’ [pa]
▪ ru: rates for reaction ‘u’, [mol/s]
▪ vu: stoichiometric coefficient
▪ ni(j+1): molar flow rate of species ‘i’ at iteration ‘j+1’, [mol/s]

50
2.6 Chapter summary
Implementing active and selective catalysts offers a greater reaction control and intermediate
products, such as C2+ hydrocarbons. Several researchers have investigated various OCM catalysts'
kinetics, including lanthanum-calcium oxide catalyst (La2O3/CaO) kinetics, which has proven to be the
most reliable and comprehensive for OCM applications [66,98]. It has been chosen to simulate the
OCM reactor for this research.
Heterogeneous surface reactions are examined in this chapter to characterize the catalytic activity of
a perovskite membrane and examine its coupling with oxygen permeation and gas-phase transport and
reactions. The heterogeneous surface reactions include investigating the nature of catalytic and active
membrane sites. The proposed model for OCM over La2O3-based catalysts suggested that the surface
peroxides as the active oxygen source. The mechanism is laid down in Section 2.4.2. In addition,
Ghoniem et al. [108] offered two surface reactions that describe the heterogeneous reaction on the
membrane surface, shown in Section 2.4.3.
Lastly, a MATLAB model is developed in this chapter to predict the La2O3/CaO catalyst kinetics in
a micro-catalytic fixed-bed reactor covering many reaction conditions. The model depicts similar
dimensions and operating conditions to the comprehensive 10-step kinetic model developed by Stansch
et al. [91] to ensure that the catalyst model developed can accurately predict the La2O3/CaO catalyst
kinetics.
In Chapter 3, a one-dimensional oxygen-permeable membrane reactor model is developed. The
membrane reactor model builds on the catalyst model developed in this chapter to combine the
microkinetic of water splitting, catalytic OCM reactions on the membrane surface, and the charged
species diffusion across the membrane.
51
Chapter 3
One-dimensional oxygen-permeable membrane reactor model
3.1 Chapter introduction
This chapter investigates the co-production of hydrogen and ethylene from water splitting and OCM,
respectively. Unlike the chemical looping or redox cycles where the oxygen carriers move between the
oxidizing and reducing environments at high temperatures [110,111], this membrane technology
combines the oxidizing and reducing processes into one unit without mechanical movements of the
reactor. More effortless operation, thus, can be achieved. Additionally, the oxygen permeable
membrane can shift the thermodynamic equilibrium to split water further to produce hydrogen.
This chapter showcases the development of a one-dimensional model of an oxygen-permeable
membrane reactor for the selectivity of higher hydrocarbons in OCM reactions by providing a more
controlled oxygen inlet concentration (or partial pressure). The model is based on a plug-flow reactor
that mimics a monolith membrane reactor design. The multi-channel monolithic form is developed to
increase the mechanical robustness and the surface area-to-volume ratio and allow the introduction of
the feed in the channels. At the same time, the permeate is obtained from the membrane wall.
The model combines the microkinetics of water splitting, catalytic OCM reactions on the membrane
surface, and the charged species diffusion across the membrane, which includes the development of a
resistant-network permeation model and estimation of the oxygen flux through the membrane. In
addition, the La2O3/CaO catalyst microkinetics model developed in Chapter 2 will be incorporated into
this model to investigate the effect of fixing a catalyst on the membrane surface.
Ordinary differential equation solver from MATLAB is used to solve the governing differential
equations that concern mass balance and pressure drop along the length of the reactor.
3.2 Implementation of OCM process in oxygen-permeable membrane reactors
In a membrane reactor, chemical reactions and membrane separations are combined in one unit. A
lower fabrication cost can be achieved due to the integration of reaction and separation [69]. Porous or
dense inorganic membrane reactors for OCM applications can allow for much higher C2+ hydrocarbon
selectivity and yield [112]. In addition, dense mixed conducting ceramic membranes have excellent

52
permselectivity toward oxygen. Therefore, air/water can be used directly as a source of oxygen needed
for the OCM process.
In this research, the implementation of dense ceramic membranes can have an effective oxygen
distribution along the reactor into the catalyst bed. The local hydrocarbon to oxygen ratio in the reaction
zone is high, leading to much higher selectivity. As a result, the product yield can be significantly
increased since the total amount of oxygen participating in the reaction is not reduced. In addition,
methane loss is prevented due to back-permeation, one of the dense membrane characteristics.
The modification of the high-oxygen-permeable ceramic membrane surfaces with a proper OCM
catalyst can contribute to the overall yield of the membrane reactor [69]. It is also possible to increase
the yield by matching the oxygen permeation rate of the membrane and surface catalytic activation of
the methane on the membrane surface because the overall C2+ yield is determined by the combined
effects of both crucial factors [69]. Enhancing the surface catalytic activation of the methane on the
membrane surface may be performed by enhancing catalyst kinetics on the membrane surface. When
the oxygen permeation rate is greater than the rate consumed in the methane coupling, deep oxidation
of methyl radical and C2+ products to COx occurs, reducing the C2+ yield. Therefore, to reduce the gap
between OCM achieved yield (25 % in conventional OCM reactors [88]) and the desirable industrial
values (economically attractive C2+ yield threshold of 30 % [88]), improving the surface catalytic
activation of methane and the oxygen permeation rate must happen concurrently.
3.3 The one-dimensional oxygen-permeable membrane reactor model
The model design is based on a multi-channel monolithic form divided into a feed channel that
sweep channel. The two channels are considered two plug flow reactors that work simultaneously, and
a membrane separates them and allows for the oxygen permeation process between the feed and sweep
sides, as shown in Figure 3-1. On the feed channel, water (mole fraction = 0.8) is fed into the channel
alongside nitrogen (mole fraction = 0.2) which acts as an inert carrier gas. As a result of the water-
splitting process in the channel, three species are produced at the channel's outlet: unreacted water,
hydrogen, and nitrogen.
The oxygen-permeable membrane used is an LCF-91 membrane which acts as a reactant provider
as it allows the oxygen to permeate through it. As shown in Figure 3-1, the La2O3/CaO catalyst is
deposited on the surface of the membrane.

53
The sweep side-channel allows for methane injection (mole fraction = 0.7) and nitrogen (mole
fraction = 0.3) as an inert gas; this allows the OCM process to occur in which the membrane is providing
oxygen. The sweep side outlet shows unreacted oxygen, methane, C2+ species (ethane and ethylene),
water, COx (carbon monoxide and carbon dioxide), hydrogen, and nitrogen.
The membrane reactor model developed considers the membrane's surface reactions and the mass
transfer between the gas bulk and the membrane surface. Several operating conditions assumptions
were applied:
(1) Isothermal temperatures condition is considered, and the feed, sweep, and membrane temperatures
are constant and consistent. According to Bhatia et al. [100], the isothermal operation was considered
appropriate to study the influence of the changes in different operating variables without added
temperature effect.
(2) Steady operation, so the reaction rates on the feed and sweep side are correlated with the oxygen
flux across the membrane
Figure 3-1: Plug flow membrane reactor model showing feed side, sweep side, and membrane

54
3.3.1 Mechanism of the co-production process of hydrogen and ethylene using
membrane technology
Water is fed to the reactor on the feed side, and nitrogen is used as an inert carrier gas to carry the
desired amount of water into the feed side chamber. Water molecules react with the oxygen vacancies
on the oxygen permeable membrane to produce hydrogen and lattice oxygen, as shown in Eqn. (2-6).
The oxygen atom from water incorporates the lattice oxygen and diffuses through the oxygen-
permeable membrane due to the potential chemical gradient. A three-resistance model which details
the permeation process of oxygen through the membrane is shown in Section 3.3.3.1.3. The three-
resistance model is used to solve the vacancy flux (Jv), which relates to the formation/destruction rate
of the species on the feed side. Jv is a function of the concentration of water and oxygen on the sweep
side, seeing as the water-splitting rate must equal the rate of formation of the oxygen molecule on the
sweep side. The oxygen flux (𝐽𝑂2) is half of the Jv, which can then be used to find the concentration of
oxygen permeated from the feed side to the sweep side.
Figure 3-2: Co-production of C2H4 and H2 using oxygen-permeable membrane
On the sweep side, the OCM catalytic reaction occurs in which CH4 is fed into the sweep side
compartment and nitrogen as an inert gas. Nitrogen carries the task of controlling the temperature in
the reactor and overcoming the challenge of hot spot formation since OCM is a highly exothermic
reaction [100]. Thermal NOx can be formed by the oxidation of nitrogen in the air and requires
sufficient temperature and time to produce NOx. A rule of thumb is that below approximately 1700K,
the formation of thermal NOx is not significant enough [113]. The thermal NOx formation can be

55
neglected since the membrane reactor temperature is maintained at around 1300 K. Incorporating the
water-splitting process on the feed side channel will result in an overall endothermic process for the
entire reactor.
The CH4 reacts directly with the gaseous oxygen molecule to produce ethane, which then goes
through the dehydrogenation process to produce ethylene as part of the OCM process on the sweep side
(Figure 2-2). The oxygen molecule resulted in oxygen diffusion out of the membrane surface, as shown
in Eqn. (2-11). La2O3/CaO catalyst is applied to the surface membrane, and the reaction rates of the
primary OCM reactions (according to the kinetics provided by Stansch et al. [91]) are applied to find
the rates of formation/destruction of both the inlet species and products including higher hydrocarbons
and CO2, CO, and hydrogen.
The products on different sides of the membrane (i.e., hydrogen and ethylene) can be collected for
further applications. For example, ultrahigh-purity hydrogen can be separated from the steam-hydrogen
mixture on the feed side using a pressure-dependent absorption-desorption process which can be used
to split hydrogen from the hydrogen and nitrogen gas mixture [114]. The hydrogen can be used for fuel
cell or semiconductor industries [115]. The ethylene from OCM on the sweep side can be separated
from the gas mixture using cryogenic distillation [15] and used for various industrial applications, as
explained in Section 1.2.1.
3.3.2 Membrane reactor geometry
As explained in Section 3.3, the membrane reactor is divided into two plug flow reactors, one of
which acts as a feed side compartment, and the other reactor acts as a sweep side. These two reactors
are divided by a membrane in which the permeation process of oxygen across the membrane occurs.
Figure 3-3: Feed and sweep channels and membrane dimensions

56
The channels dimensions of the membrane reactor are shown in Figure 3-3. As shown, the feed and
sweep sides control volumes are assumed to be 1/4 of the entire reactor channel. This estimation is
possible due to symmetry, which means the boundaries of the chosen control volumes can be assumed
to have no interactions with the surrounding channels that share the same walls. This assumption will
allow studying the heat and mass transfers between the membrane and the two feed and sweep sides.
Based on the schematic shown in Figure 3-3, the surface area of the membrane is calculated using
Eqn. (3-1). While the cross-sectional area of the channels is calculated using Eqn. (3-2). Lastly, the
total volume of the reactor is calculated based on the rectangular cross-sectional area of the channels.
The total volume of the reactor is calculated using.
,s membrane membrane membraneA L w= (3-1)
,c channel channel channelA H w= (3-2)
reactor channel channel channelV L H w= (3-3)
Where,
▪ 𝐴𝑠,𝑚𝑒𝑚𝑏𝑟𝑎𝑛𝑒 : surface area of the membrane, [m2]
▪ 𝐿𝑚𝑒𝑚𝑏𝑟𝑎𝑛𝑒 : membrane length (which is equal to the channel length), [m]
▪ 𝐴𝑐,𝑐ℎ𝑎𝑛𝑛𝑒𝑙 : cross-sectional area of channels, [m2]
▪ 𝑉𝑟𝑒𝑎𝑐𝑡𝑜𝑟 : total volume of the reactor, [m3]

57
3.3.3 Governing equations
3.3.3.1 Mass balance
Figure 3-4 shows the mass balance at each (Δx) (change in reactor length) along with the 1/4 of the
entire reactor channel based on the symmetry configuration discussed in Section 3.3.2.
Figure 3-4: Control volumes for feed and sweep sides, showing mass balances at each (Δx) (change in
reactor length
The mass balance governing equation is shown in Eqn. (3-4) based on Figure 3-4 and the
assumptions described in Section 3.3. As shown in the figure, the feed side and sweep side are related
through the Jv and 𝐽𝑂2 , which will be explained in Sections 3.3.3.1.3 and 3.3.3.1.4.
, ,( ) ( )[ / m] [ / m]
i s i sd n W xmol s mol s
dx dx= (3-4)
Where,
▪ 𝑑(��𝑖,𝑠): change in molar flow rate of species ‘i’ and for channel ‘s’ [mol/s]
▪ 𝑑𝑥 : change in reactor length, [m]
▪ ��𝑖,𝑠: formation/destruction rate of species ‘i’ and for channel ‘s’ in relation to reactor length,
[mol/s]
58
3.3.3.1.1 Formation and destruction rates
On the feed side, the water-splitting process occurs in which water is fed to the reactor on the feed
side, and nitrogen is used as the carrier gas to carry the desired amount of water into the feed side
chamber. Water molecules react with the oxygen vacancies on the oxygen permeable membrane to
produce hydrogen and lattice oxygen, as explained in Section 3.3. The microkinetic of water splitting
and catalytic OCM reactions on the membrane surface on the sweep side are related through the charged
species diffusion across the membrane. That is why the formation/destruction rate of species ‘i’ is
proportional to the Jv [mol/m2 s], as shown in Eqn. (3-5). The (+) sign corresponds to species formation,
and the (-) sign corresponds to the consumption of species.
2 2, ,[ / ] ( )J [mol/m s] dA [m ]i feed v s membraneW mol s =
(3-5)
Where,
▪ ��𝑖,𝑓𝑒𝑒𝑑 : formation/destruction rate of species ‘i’ and for feed channel, [mol/s]
▪ 𝐽𝑣 : vacancy flux, [mol/m2 s]
▪ dA𝑠,𝑚𝑒𝑚𝑏𝑟𝑎𝑛𝑒: change in membrane surface area, [m2]
On the sweep side, OCM catalytic reaction occurs in which CH4 is fed into the sweep side
compartment and nitrogen as an inert gas. La2O3/CaO catalyst is applied to the surface membrane, and
the primary OCM reactions' reaction rates are explained in Section 3.3. The kinetics of the OCM
catalyst reaction is based on the La2O3/CaO OCM catalyst microkinetics model developed in Chapter
2, section 2.5. Therefore, the formation and destruction rate (��𝑖) is calculated using Eqn.(2-31) which
is based on the reaction rates shown in Eqn.(2-12), Eqn. (2-13), and Eqn. (2-14), in addition to the
species’ stoichiometric coefficients, positive for formation rates and negative for destruction rates.
3.3.3.1.2 Change in catalyst mass and gas volume per Δx
According to elementary reaction steps shown in Figure 2-2, given that the heterogeneous reactions
on the sweep side take place on the catalyst's surface, reaction rates (1-6, 8-10) are multiplied by the
change of catalyst mass per Δx. Meanwhile, the homogenous gaseous reaction rate (7) is multiplied by
the change in gas volume per Δx. The change of total volume over (Δx) [m3] is calculated using Eqn.
(3-6).

59
,dV =dx×A =dx×H ×w total c channel channel channel (3-6)
Where,
▪ dV𝑡𝑜𝑡𝑎𝑙 : change in total reactor volume, [m3]
The change of gas volume [m3] is calculated using Eqn. (3-7).
dV total channel channelgas dV dx H w = =
(3-7)
Where,
▪ dV𝑔𝑎𝑠 : change in gas volume, [m3]
▪ 𝜙 : porosity, [dimensionless]
Using the relation between the volume of gas and the catalyst volume, the change of catalyst volume
[m3] is calculated using Eqn. (3-8).
dV = (1 - ) dVcatalyst
(3-8)
Where,
▪ dV𝑐𝑎𝑡𝑎𝑙𝑦𝑠𝑡 : change in catalyst volume, [m3]
The change of catalyst mass [kg] is calculated using Eqn. (3-9).
dm = dV
dm (1 - ) (dx ) ( )
catalyst catalyst
catalyst channel channelH w
=
(3-9)
Where,
▪ dm𝑐𝑎𝑡𝑎𝑙𝑦𝑠𝑡 : change in catalyst mass, [kg]
3.3.3.1.3 Resistance network for oxygen permeation across the membrane
Wu et al. [74] developed the resistance-network kinetics model for oxygen permeation across the
membrane (from high oxygen concentration to low oxygen concentration). The oxygen permeation
process through an MIEC membrane can be divided into five steps, two mass transfer steps between

60
the gas phase and the surface, two surface reaction steps, and a bulk diffusion step through the
membrane. The resistance network treats each step as a ‘resistance’ for oxygen permeation. A series of
resistances are then identified to summarize the barriers to the oxygen permeation from the oxygen
source on the feed side to the oxygen sink on the sweep side. The kinetics of the model will change
according to oxygen sources. The feed side involves H2O direct-incorporation mechanism. On the
sweep side, oxygen formation involves Mars-van Krevelen (MvK) mechanism for fuel oxidation, as
shown in Table 3-1. According to Wu et al. [74], several assumptions were taken in order to simplify
the permeation model and solve for vacancy fluxes as follows :
Water feed side
2
' ' '
,v r H H O VJ k C C=
(3-10)
Where,
▪ 𝐽𝑣 ′ : the absolute value of oxygen vacancy flux at the feed side, [mol/m2 s]
▪ 𝑘𝑟,𝐻 : the reverse reaction rate constant for the hydrogen oxidation reaction, [m4/mol s]
▪ 𝐶𝐻2𝑂 ′ : the concentrations of water on the feed side, [mol]
▪ 𝐶𝑉 ′ : the oxygen vacancy concentration on the feed side, [mol]
Oxygen vacancy diffusion rate in the bulk
The Nernst-Planck equation models the charged species transfer as shown in Eqn. (3-11).
" '
V V Vv V V
C C CJ D D
y t
−= − =
(3-11)
Where,
▪ 𝐽𝑣: oxygen vacancy diffusion rate in bulk, [mol/m2 s]
▪ 𝐷𝑉: diffusivity of oxygen vacancy, [m2/s]
▪ 𝐶𝑉 ": the oxygen vacancy concentration on the sweep side, [mol]
▪ 𝑡: membrane thickness, [m]

61
Sweep side
2
~ " " " 0.5 "
, ,( )r Ov O V f O O VJ k C C k C C= − −
(3-12)
Where,
▪ ��𝑟,𝑂 and kf, O: reaction rate constants for the oxygen incorporation/dissociation, [m2.5/mol0.5 s]
▪ 𝐶𝑂 : concentration of oxygen sites in the lattice, [mol/cm3]
▪ 𝐶𝑂2
" : concentrations of oxygen on the sweep side, [mol]
By equating the oxygen vacancy flux on the feed side surface, Eqn. (3-10), through the bulk Eqn.
(3-11) and on the sweep side surface Eqn. (3-12), the vacancy flux equation can be expressed in the
potential difference over the sum of three resistances, as shown in Eqn. (3-13).
v
f b s
PJ
R R R
=
+ +
(3-13)
Where,
▪ Δ P: potential difference.
▪ Rf, Rb, and Rs: the feed side surface reaction resistances, bulk diffusion, and sweep side surface
reaction, respectively.
Table 3-1: Resistance network [74]
Oxygen source Water
Sweep side mechanism Inert sweep
Feed side reaction , ,/
2 22r H f Hk k x
O OH O V O h H•• •+ ⎯⎯⎯→ + +
Sweep side reaction
, ,/
2
12
2
r O f Ok kx
O OO h O V• ••+ ⎯⎯⎯→ +

62
Potential gradient (Δ P)
2
~
,
~ " 0.5
, ,
r O O
r O f O O
k C
k k C+
Surface reaction
resistance (feed side)
(Rf)
2 2
'
,
1
f H O H Ok C
Bulk resistance [Rb]
v
t
D
Surface reaction
resistance (sweep side)
(Rs)
2
~ " 0.5
, ,
1
r O f O Ok k C+
The vacancy flux is calculated using Eqn. (3-14) based on the above.
2
2 22
~
,
~ " 0.5
, ,2
~ ' " 0.5
, , ,
[mol/m s]1 t 1
D
r O O
r O f O O
v
f H O H O v r O f O O
k C
k k CJ
k C k k C
+ =
+ + +
(3-14)
Where,
▪ CO: concentration of oxygen sites in the lattice, assumed to be a constant value (82500 mol/m3,
estimated from the XRD measurements of the stoichiometric LCF-91 lattice size in the air) [116].
▪ 𝑘𝑟,𝐻2𝑂: water splitting reaction rate constant, [m4/mol s]
▪ ��𝑟,𝑂 and kf, O: reaction rate constants for the oxygen incorporation/dissociation, [m2.5/mol0.5 s]
▪ 𝐶𝐻2𝑂 ′ : surface concentration of water on the feed side, [mol]
▪ 𝐶𝑂2
" : surface concentration of oxygen on the sweep side, [mol]
▪ 𝐶𝑉 ′ and 𝐶𝑉
": concentrations of oxygen vacancies on the feed and sweep side, respectively, [mol]

63
▪ t: membrane thickness, [m]
▪ Dv: vacancy diffusivity, [m2/s]
As explained in Section 3.3.1, the vacancy flux is a function of water concentration on the feed side
and oxygen on the sweep side. The water-splitting rate must equal the oxygen molecule formation rate
on the sweep side. That is how the microkinetics of water splitting and catalytic OCM reactions on the
membrane surface are combined through the charged species diffusion across the membrane.
The homogeneous reaction in the gas phase is neglected on the feed side due to the slow kinetics
compared to the heterogeneous surface reaction. Therefore, the formation and destruction rates of
species ‘i’ on the feed side are proportional to the vacancy flux, as shown in Eqn. (3-15), Eqn. (3-16),
Eqn. (3-17). The destruction rate of water is related to vacancy flux, as shown in Eqn. (3-15). The
negative sign is the water species being consumed on the feed side-channel.
2 ,H O feed v membraneW J w= −
(3-15)
The formation rate of water is related to vacancy flux, as shown in Eqn. (3-16). The positive sign is
the hydrogen produced on the feed side-channel. Hydrogen production is the primary purpose of water
thermolysis.
2 ,H feed v membraneW J w=
(3-16)
Nitrogen gas is inert and does not react with the other species, as shown in Eqn. (3-17).
2 , 0N feedW = (3-17)
Where,
▪ ��𝐻2𝑂 : destruction rate of water on the feed side, [mol/s]
▪ ��𝐻2: formation rate of water on the feed side, [mol/s]
▪ ��𝑁2: formation rate of water on the feed side, [mol/s]

64
On the sweep side, the vacancy flux is related to the oxygen flux, which indicates the amount of
diffused oxygen from the feed side to the sweep side and can be used to find the concentration of oxygen
transported from the feed side to the sweep side. The oxygen flux is formulated in the next Section
3.3.3.1.4.
3.3.3.1.4 Oxygen flux
According to Sunarso et al. [73], as the oxygen diffuses across the perovskite membrane in the form
of oxygen ions or oxygen vacancies, the oxygen flux is half of the vacancy flux, as shown in Eqn.
(3-18).
2
2
2 22
~
,
~ " 0.5
, ,2
~ ' " 0.5
, , ,
1 1[mol/m s]
1 t 12 2
D
r O O
r O f O O
O v
f H O H O v r O f O O
k C
k k CJ J
k C k k C
+ = =
+ + +
(3-18)
The syms function in MATLAB is used to create symbolic scalar variables. This function is used in
the 1-D model to simultaneously solve Eqn. (3-10), Eqn. (3-11), and Eqn. (3-12) to estimate the flux
and the oxygen fluxes at every iteration. Based on the function results, the oxygen mass balance on the
sweep side is formulated as follows:
Based on the mass balance showcased in Section 3.3.3.1 and Figure 3-4, the change in oxygen molar
flow rate at every change in reactor length is estimated using Eqn. (3-19) and Eqn. (3-20).
2 2 22
, , , ,( ) ( ) ( )O sweep O sweep O sweep O s membranen x dx n x W J dA+ − = + (3-19)
2 2 2, , ( )O sweep O sweep O membraneJ wd n W
dx dx dx
= +
(3-20)
Where,
▪ 𝑑��𝑂2,𝑠𝑤𝑒𝑒𝑝: change of oxygen molar flow rate on the sweep side, [mol/s]

65
▪ ��𝑂2,𝑠𝑤𝑒𝑒𝑝: destruction rate of oxygen and on the sweep side in relation to reactor length, [mol/s]
3.3.3.1.5 Reaction constants
The forward water-splitting reaction rates are shown in Eqn. (2-6) will be fitted with water splitting
data. The reaction rate constants for the oxygen incorporation/dissociation are shown in Eqn. (2-11)
will be equipped using water feed – inert sweep data from Wu et al. [80]. The reaction rate constants
are fitted using the Arrhenius form, as shown in Eqn. (2-21).
• ii i
membrane
Eak A exp
RT
−=
(3-21)
Where,
▪ ki: reaction rate constant, [m4/mol s & m2.5/mol0.5 s]
▪ Ai: pre-exponential factor, [m4/mol s & m2.5/mol0.5 s]
▪ Eai: activation energy, [kJ/mol]
▪ R: gas constant, [kJ/mol K]
▪ Tmembrane: membrane temperature, [K]
Table 3-2 summarizes the pre-exponential factor, the activation energies for water splitting, and the
kinetic oxygen incorporation/dissociation reactions.
Table 3-2: Summary of the reaction kinetic parameters on LCF-91 membrane [74]
Parameter Pre-exponential factor (A) Activation energy (Ea)
𝑘𝑓,𝐻2𝑂 1.93E-6 [m4/mol s] 7.875 [kJ/mol]
𝑘𝑓,𝑂2 5.66E-5 [m2.5/mol0.5 s] 10.6 [kJ/mol]
𝑘~
𝑟,𝑂2 1.45E-3 [m/s] 111 [kJ/mol]
vD*
4.98E-7 [m2/s] 59.6 [kJ/mol]
* oxygen vacancy diffusivity (Dv) for LCF-91 was derived from separate transient dilatometry studies
[117]

66
3.3.3.1.6 Gas species diffusion
The binary diffusion coefficient is used to model different gas species diffusion on either the feed
or sweep side. The binary diffusion coefficients DAB between species A and B are calculated using
Eqn. (3-22).
( ) ( )
3 1.75 1/2
21/3 1/3
,
1 10 (1/ 1/ )s A BAB
total s A s B s
T M MD
p
− +=
+
(3-22)
Where,
▪ Ts: the temperature for side ‘s’, [K]
▪ MA and MB: atomic mass for species A and B, respectively, [g/mol]
▪ 𝛴𝐴𝜐𝑠 and 𝛴𝐵𝜐𝑠: diffusion volumes of molecules A and B, respectively.
▪ 𝑝𝑡𝑜𝑡𝑎𝑙,𝑠: total pressure for side ‘s’, [Pa]
3.3.3.1.7 Mass diffusion
Mass diffusion in the gas phase is used to solve the surface concentrations for both the water and
the oxygen. The mass diffusion in the gas phase is modeled as shown in Eqn. (3-23).
, , , , , , ,( )i m i s bulk i s surface i s bulk sJ h X X C= − (3-23)
Where,
▪ ℎ𝑚,𝑖,𝑠: mass transfer coefficient for species ‘i’ on the side ‘s’, [m/s]
▪ Xbulk,i,s: mole fraction of bulk species ‘i’ on the side ‘s’
▪ Xsurface,i,s : mole fraction of surface species ‘i’ on the side ‘s’
▪ 𝐶𝑏𝑢𝑙𝑘,𝑠: total molar concentration of the gas on the side ‘s’, [mol/m3]

67
The mass transfer coefficient is calculated directly using the gas-specific diffusion and Sherwood
number, which is 3.61 for laminar flow in a square-shaped channel [110].
, ,2
m i s i
s
Shh D
H=
(3-24)
Where,
▪ Sh: dimensionless number used in the mass-transfer operation, estimated as 3.61 for laminar
flow.
▪ Hs: channel height in both feed and sweep sides ‘s’
▪ Di: diffusivity of the species ‘i’
3.3.3.2 Pressure drop
As the gas travels through the pipes, the friction causes the pressure to drop so that the pressure at
the outlet is always lower than the pressure at the inlet, which is called friction loss or pressure drop. In
general, the pressure drop is a function of several parameters, bed characteristics, e.g., bed height,
particle diameter, porosity, and its distribution, and fluid characteristics, e.g., viscosity, density, and
velocity [118].
The feed side channel is assumed to be a pipe, in which the concept of pressure gradient and Darcy
friction factor in a fully developed flow can be used to solve the pressure drop in the feed side.
Meanwhile, on the sweep side, seeing as the amount of catalyst mass used in the model is significantly
low, which is related to the increase in porosity, it can be remarked that the porosity will not have
significance on the pressure drop. The same concept of pressure gradient and friction factor in a fully
developed flow can be applied to solve the pressure drop on the sweep side. The pressure drops for a
gas flowing through a pipe can usually be neglected because of low gas density. However, when the
flow is significantly high, and the channel is long and narrow, which is the case for the current suggested
design, the pipe wall friction loss can signification, leading to a pressure drop. It is convenient to use
the Darcy friction factor, which accounts for the pressure drop due to the friction with the pipe walls.
Several assumptions are applied to use the Darcy friction factor to solve the pressure drop in the
reactor’s channels:
• Darcy friction factor (f) is assumed constant throughout the channel.

68
• Reactor channels are assumed to be operating at a steady state, which means the mass flow rate at
any point down the reactor is equal to the entering mass flow rate (ρ0 V0= ρ V).
• The ratio between the length of the reactor channel and the hydraulic diameter (L/D) is assumed
to be very large since Darcy frictional factor is only applicable in such conditions.
• As the pressure drop gradient across the reactor length is calculated, a negative sign is added to
convey the pressure dropping as the length changes (Δx).
2
2
m
h
upf
dx D
= − (3-25)
Where,
▪ 𝑓: Darcy friction factor, [dimensionless]
▪ 𝜌 : fluid density, [kg/m3]
▪ 𝑢𝑚: mean velocity, [𝑚/𝑠]
▪ Dh: hydraulic diameter, [m]
The Darcy friction factor is estimated based on flow condition and its Reynolds number. The Darcy
friction factor is calculated for a fully developed laminar flow, as shown in Eqn. (3-26).
64
Ref =
(3-26)
For fully developed turbulent flow, the Darcy friction factor also depends on the channel surface
condition and increases with the increase of the surface roughness (e). The Darcy friction factor is
estimated as shown in Eqn. (3-27).
1 / 2.512log
3.7 Re
e D
f f
= − +
(3-27)
69
The Darcy friction factor is estimated for a smooth surface condition that encompasses an extensive
Reynolds number range, as shown in Eqn. (3-28).
2(0.790ln Re 1.64)f −= − , 63000 Re (5 10 ) (3-28)
Where,
▪ Re: Reynold’s number, [dimensionless]
▪ e: surface roughness, [µm]
▪ D: channel diameter, [m]
▪ e/D: relative surface roughness
The hydraulic diameter is used to solve the pressure drop, seeing as the chosen membrane reactor
depicts a rectangular-shaped cross-sectional area for both sweep and feed side channels. The hydraulic
diameter for both the channels is estimated using Eqn. (3-29).
,
,
2 c channel
h s
full channel
AD
H w −
=
+ (3-29)
Where,
▪ Dh,s: hydraulic diameter for channel ‘s’, [m]
▪ Ac, channel: a cross-sectional area for the channel, [m2]
▪ H: full channel height, [m]
▪ wfull-channel: full channel width, [m]
The mean velocity of the gas flow is used to estimate the pressure drop. The mean velocity is estimated
based on the volumetric flow rate and the cross-sectional area of the channel, as shown in Eqn. (3-30).
,
,
,
STP s
m s
c channel
Vu
A= (3-30)
Where,
▪ um,s: mean velocity of gas flow for channel ‘s’, [m/s]

70
▪ ��𝑆𝑇𝑃,𝑠: volumetric flow rate at STP conditions for channel ‘s’, [m3/s]
3.3.3.2.1 Estimating the flow condition and length of the entrance region
A flow is described as a fully developed flow when the velocity profile does not change with
streamwise direction. Physically, there would be no change in velocity profile towards the streamwise
direction (δu/δx = 0). It is essential to compare the length of the entrance region (the distance traveled
by the flow before it becomes fully developed and the size of the reactor to determine if the flow is
fully developed. Suppose the entrance region is smaller than the length of the channel. In that case, it
means that the inviscid core in the flow and boundary layer meet at the end of the entrance layer by the
axis of the channel and results in one dense area, and it can be claimed that the flow is fully developed.
The thickness of the boundary layer grows as the fluid flows downstream, and eventually, the layer
edge reaches the channel centerline. Based on the aforementioned, the thickness of the boundary layer
is half of the channel height.
(1) Reynolds number
, ,
,
,,
Re =
2
( )Re
s h s m s
s
s
STP sc channel
s
Full channel
s
s
c channel
D u
A V
H Aw
−
+
=
(3-31)
Where,
▪ Res: Reynold’s number for channel ‘s’
▪ 𝜌𝑠 : fluid density for channel ‘s’ (calculated using “Cantera” extension), [kg/m3]
▪ um,s: mean velocity of gas flow for channel ‘s’, [m/s]
▪ Dh,s: hydraulic diameter for channel ‘s’, [m]
▪ μs : viscosity of fluid for channel ‘s’ (calculated using “Cantera extension”), [kg/m s]

71
(2) Length of entrance region (laminar flow conditions)
,
. 0 06 Reentrance
s
h s
L
D= (3-32)
Where,
▪ Lentrance: entrance region length, [m]
Based on the above equations, the flow condition and the length of the entrance region are estimated
for both the feed and sweep channels. Table 3-3 shows the results obtained from estimating the
Reynolds number. The Reynolds number is estimated to be 27.70 and 32.40 for the feed and sweep
channels, respectively. The estimated Reynolds number lies in the laminar flow region (Re < 2300)
which means the flows in both the feed and sweep channels are laminar flows. The entrance region for
laminar flow conditions is calculated as shown in Eqn. (3-32). The entrance region is 6.5E-3 and 7.6E-
3 m for the feed and sweep channels, respectively. The length of the feed and sweep channels is much
longer than the estimated length of the entrance region, and therefore the flow in both channels is
considered fully developed.
Table 3-3: Reynolds number and length of entrance region for feed and sweep sides
Parameter Feed side Sweep side
Re
𝜌 [kg/m3]
Ac [m2]
Hchannel [m]
wfull-channel [m]
��𝑆𝑇𝑃 [m3/s]
𝜇 [kg/m s]
27.70
0.22
5E-5
2E-3
0.1
2.66E-4
4.11E-5
32.40
0.21
5E-5
2E-3
0.1
2.66E-4
3.44E-5
Lentrance [m]
Dh [m]
Lchannel [m]
6.5E-3
3.9E-3
1.5
7.6E-3
3.9E-3
1.5

72
3.3.4 Ode45 MATLAB solver
MATLAB’s standard solver for ordinary differential equations (ODEs) is used to model the one-
dimensional plug flow membrane reactor in this research. This function implements a Runge-Kutta
method with a variable time step for efficient computation. The ODE45 function is suitable for this
model because it can solve first-order equations. The first step would be to develop first-order
governing equations investigated in Section 3.3.3. The ode 45 functions are usually coded as follows:
[ , ] ode45(@fname, tspan, xinit, options)t x = (3-33)
Where,
▪ fname: the name of the function Mfile used to evaluate the right-hand-side function
▪ tspan: the vector defining the beginning and end limits of integration
▪ xinit: the vector of initial conditions
▪ options: usually used to assign tolerances
▪ t: the value of the independent variable at which the solution array x is calculated
▪ x: an array (or matrix) with size length(t) by length (xinit)
3.3.5 Cantera extension
Cantera is an open-source suite of tools for problems involving chemical kinetics, thermodynamics,
and transport processes. Cantera extension for MATLAB was used to define the gas mixture and
determine some of its properties to solve the pressure and temperature change along the reactor length.
The properties calculated using the Cantera extension are as follows:
(1) Defining the gas mixture
The mixture is defined as a class that inherits low-density gases that obey the ideal gas equation of
state. Standard mass-action reaction rate expressions for low-density gases are also implemented. The
set function defines the gas mixture properties and equates them to the temperature, pressure, and
mole fractions.
gas_f = IdealGasMix('gri30.cti','gri30_mix')
gas_s = IdealGasMix('gri30.cti','gri30_mix')
73
set(gas_f,'T',T_f,'P',P_f,'X',X_gf)
set(gas_s,'T',T_s,'P',P_s,'X',X_gs)
(2) Thermal conductivity of gas mixture (feed and sweep gas mixtures)
Using the function ‘thermalConductivity(gas)’ returns thermal conductivity of gas in [W/m K]
thermalConductivity(gas_f)
thermalConductivity(gas_s)
(3) Non-dimensional enthalpies
Using the function ‘enthalpies_RT(gas)’ returns the non-dimensional enthalpies of all species and are
divided by RT
enthalpies_RT(gas_f)
enthalpies_RT(gas_s)
(4) Specific heat capacities
Using the original function returns molar-basis specific heats at constant pressure with unit[J/kmol-K]
cp_mole(gas_f)
cp_mole(gas_s)
(5) Gas mixture density (feed and sweep gas mixtures)
Using the function ‘density(gas) results in the density of the gas mixture in [kg/m3]
density(gas_f)
density(gas_s)
(6) Gas mixture viscosity (feed and sweep gas mixtures)
Using the function ‘Viscosity(gas)’ returns the viscosity of the gas mixture in [kg/m s]
viscosity(gas_f)
viscosity(gas_s)

74
3.3.6 Tolerances
Relative tolerances measure the error relative to the magnitude of each solution component. It
controls the number of correct digits in all solution components, except those more diminutive than the
absolute tolerance. This tolerance is a threshold below which the solution's value becomes unimportant.
If the solution |y| is smaller than absolute tolerance, the solver does not need to obtain any correct digits
in |y|. The absolute and relative tolerances were altered to examine their effect on the oxygen molar
flow rates and determine the most suitable tolerances. Adjusting the relative tolerance did not
significantly affect the molar flow rates; it was kept at 1E-7. On the other hand, alerting the absolute
tolerance (while keeping the relative tolerance constant) affects the molar flow rates, as shown in Figure
3-5. The figure shows oxygen molar flow rates versus absolute tolerance (in log scale).
Figure 3-5: Absolute tolerances effect on oxygen molar flow rate
Figure 3-6 shows the oxygen trend versus the reactor length for scenarios with different absolute
tolerances. The figure shows that all the scenarios maintain the same oxygen trend. However, the
change of the absolute tolerance (while maintaining fixed relative tolerances) alters the number of
iterations and the step size.
8.14E-6
8.15E-6
8.15E-6
8.15E-6
8.15E-6
8.15E-6
8.15E-6
1E-17 1E-14 1E-11 1E-8 1E-5
n(O
2) [
mo
l/s]
Absloute Tolerance
n(O₂) (sweep side)
* T = 1133.15 K (isothermal temperture) * Pressure drop applied
* ��𝑖𝑛𝑙𝑒𝑡 = 7.5E-6 [m3/s]* Space time = 60 [kg s/m3]* Tolerances applied

75
Figure 3-6: Oxygen trend versus the reactor length for different absolute tolerances (T = 1133.15 K
(isothermal temperature), pressure drop applied, Vinlet = 7.5E-6 [m3/s], space time = 60 [kg s/m3] and
Rel tolerance = 1E-7)
As shown in Table 3-4, increasing the absolute tolerance increases the number of steps, making the
code more reliable. In addition, the table shows the minimum calculated step size (Δx) for every
scenario. A more significant number of steps significantly reduces the step size by integrating more
steps. This reduction in step size allows the model to mimic a more realistic membrane reactor by
minimizing the homogeneous blocks assumption.
0E+0
1E-6
2E-6
3E-6
4E-6
0 0.5 1 1.5 2 2.5 3
n(O
2) [
mo
l/s]
Reactor length [m]
Abs tolerance =1E-12
0E+0
1E-6
2E-6
3E-6
4E-6
0 0.5 1 1.5 2 2.5 3
n(O
2) [
mo
l/s]
Reactor length [m]
Abs tolerance =1E-13
0E+0
1E-6
2E-6
3E-6
4E-6
0 0.5 1 1.5 2 2.5 3
n(O
2) [
mo
l/s]
Reactor length [m]
Abs tolerance =1E-14
0E+0
1E-6
2E-6
3E-6
4E-6
0 0.5 1 1.5 2 2.5 3
n(O
2) [
mo
l/s]
Reactor length [m]
Abs tolerance=1E-15
0E+0
1E-6
2E-6
3E-6
4E-6
0 0.5 1 1.5 2 2.5 3
n(O
2) [
mo
l/s]
Reactor length [m]
Abs tolerance=1E-16

76
Table 3-4: Effect of change of absolute tolerance on the number of steps and step size
Absolute Relative N. of steps Δx
1E-12 1E-7 461 4.60E-5
1E-13 1E-7 685 1.01E-5
1E-14 1E-7 785 2.44E-6
1E-15 1E-7 825 2.94E-7
1E-16 1E-7 861 8.72E-8
An absolute tolerance of 1E-14 is chosen for the model for several reasons. Firstly, the trend shown
in Figure 3-5 can determine the most suitable absolute tolerance to use, seeing as the oxygen molar
flow rates started to stabilize, starting from 1E-14 tolerance to 1E-16 tolerances. Secondly, the absolute
tolerance of 1E-14 averages a suitable number of iterations and step size for analysis purposes.
3.4 Model validation
The inlet and output molar flow rates of the species are used to calculate conversion, selectivities,
yield, and rates of formation values. The model was validated by comparing the theoretical predictions
of differential kinetics with the experimental results for OCM in a micro catalytic fixed-bed reactor
with La2O3/CaO as a catalyst, reported by Stansch et al. [91]. The validation of the membrane reactor
model was performed to ensure that the mathematical models could reasonably predict the oxygen-
permeable membrane reactor performance. Several assumptions were applied to the developed
membrane reactor to validate the kinetics of the sweep side:
(1) The membrane’s function of transporting oxygen from the feed side to the sweep side is switched
off; instead, oxygen is fed directly to the sweep side.
(2) Feed side water-splitting reaction is neglected (since it depends on Jv).
(3) Temperature change along the reactor length is assumed negligible (isothermal condition).
(4) Pressure drop along the reactor length is assumed negligible.
(5) The sweep side-channel cross-sectional area is equated to the cross-sectional area provided in the
catalyst paper by Stanch et al. [91], assuming a square-shaped channel for the membrane reactor
(as shown in Eqn. (3-34) and Eqn. (3-35)).

77
( ) (rectangular )
2
4
circular cross sectional cross sectionalA A
dL w
− −=
=
(3-34)
Assuming a squared shaped channel for the membrane reactor for simplification,
( ) (squared )
2
22
2
4
4
4
circular cross sectional cross sectionalA A
dH H
dH
dH
− −=
=
=
=
(3-35)
Where,
▪ L: channel length for membrane reactor, [m]
▪ w: channel’s width membrane reactor, [m]
▪ H: channel’s height membrane reactor, [m]
▪ d: diameter of circular channel for catalyst reactor, [m]
The reactor’s dimensions and the inlet operating conditions for both the reactors are kept consistent
to ensure the validation has high accuracy. The reactor’s dimensions and the inlet operating conditions
are shown in Table 3-5. The dimensions for the micro catalytic mixed bed reactor by Stansch et al. [91]
are based on the reactor schematic shown in the referenced paper. The operating conditions are all based
on Figure 6 in the referenced paper.

78
Table 3-5: Micro catalytic fixed-bed reactor vs. membrane reactor (dimensions and inlet operating
conditions)
Parameter
Microcatalytic fixed-bed
reactor by Stansch et al.
[91]
Membrane reactor
Channel length (Lchannel) [m]
Channel height (Hchannel) [m]
Channel width (wchannel) [m]
Channel radius (rchannel) [m]
Cross sectional area (Across sectional) [m2]
Space-time [kg s/m3]
Volumetric flow rate (��𝑆𝑇𝑃) [m3/s]
Number of steps
Inlet oxygen partial pressure (𝑝𝑂2) [Pa]
Inlet methane partial pressure (𝑝𝐶𝐻4) [Pa]
Inlet nitrogen partial pressure (𝑝𝑁2) [Pa]
Inlet oxygen mole ratio (𝑅𝑂2) [Pa]
Inlet methane mole ratio (𝑅𝐶𝐻4) [Pa]
Inlet nitrogen mole ratio (𝑅𝑁2) [Pa]
0.227
-
-
3E-3
2.83E-5
1.86
4.9E-3
239
5304.9
70000
24695
-
-
-
0.227
5.3E-3
5.3E-3
-
2.83E-5
1.86
4.9E-3
239
-
-
-
0.18
0.7
0.12
3.4.1 Influence of oxygen partial pressure on the formation rate of C2+ hydrocarbons
and the formation rate of COx
The influence of altering the oxygen partial pressure (𝑝𝑂2) the rate of formation of C2+ hydrocarbons
and carbon oxides has been investigated in this section. The initial conditions are adjusted to take into
consideration the influence of altering the initial oxygen partial pressure (𝑝𝑂2,𝑖𝑛𝑙𝑒𝑡) (2.93 and 18.35 kPa

79
at 973.1 K) and (1.23 and 18.12 kPa at 1073.2 K) while considering a constant initial partial pressure
of methane ( 𝑝𝐶𝐻4,𝑖𝑛𝑙𝑒𝑡 ) and also alternating between two different reactor temperatures. The
corresponding initial nitrogen partial pressure is calculated based on Eqn. (2-17) shown in Chapter 2.
Altering the partial pressure affects the initial molar ratio of the inlet species and affects the species'
initial mole ratio, as shown in Eqn. (3-36) and Eqn. (3-37), respectively.
( )
( )
i
i
total
pR
p=
(3-36)
( ) ( )i totalin R n=
(3-37)
Where,
▪ Ri: Mole ratio for species ‘i', [dimensionless]
▪ pi: partial pressure for species ‘i’, [pa]
▪ 𝑝𝑡𝑜𝑡𝑎𝑙: total inlet pressure, [pa]
▪ ��(𝑖): molar flow rate for species ‘i', [mol/s]
▪ ��𝑡𝑜𝑡𝑎𝑙: total molar flow rate for species, [mol/s]
In addition, the rate of formation of COx and higher hydrocarbon (C2+) is calculated using Eqn. (3-38)
and Eqn. (3-39), respectively.
2 6 2 4
2
,( ) ,( )
m
C H outlet C H outlet
C
catalyst
n nR
+
+= (3-38)
2 2,( ) ,( ) ,( )( )
m
CO outlet CO outlet CO inlet
COx
catalyst
n n nR
+ −= (3-39)
Where,
▪ 𝑅𝐶2+: rate of formation of C2+ hydrocarbons, [mol/kg s]

80
▪ 𝑅𝐶𝑂𝑥: rate of formation of carbon oxides (COx), [mol/kg s]
The initial oxygen partial pressures were varied from 1.23 to 5.30 kPa. At the same time, the
isothermal reactor temperature was alternated between 1073.2 and 973.1 K. The solid lines show the
experimental results obtained from Stansch et al. [90]. While the dotted lines show the developed
membrane reactor results. Figure 3-7 shows the influence of 𝑃𝑂2,𝑖𝑛𝑙𝑒𝑡 on the formation rate of C2+
hydrocarbons and the formation rate of COx reaction conditions. For the C2+ rate of formation, at higher
temperature (1073.2 K), the rate of hydrocarbon formation passed through its maximum; this is because
the increasing temperature led to an increase in the reaction rates and also the diminishing of the
inhibiting effect of oxygen at higher temperatures [91]. At the same temperature, the rate of carbon
oxides formation also increased with the partial pressure of oxygen. The rate was almost a linear
function of the partial pressure of oxygen. This might be because the formation of carbon oxides was
not inhibited by oxygen, as observed for the formation of C2+ hydrocarbon.
At lower temperatures (973.1 K), the formation of C2+ hydrocarbons significantly decreased; this
might be due to the inhibiting effect of carbon dioxide. The increasing partial pressure of carbon dioxide
led to a decrease in the ethylene-to-ethane ratio [91]. The results obtained show that the developed
membrane model can predict the effect of altering the reactor operating conditions on the rate of
formation of the primary products, including C2+ hydrocarbons and carbon oxides.
(a) (b)
Figure 3-7: Influence of p(O2) inlet on the formation rate of C2+ hydrocarbons and the formation rate of
COx reaction conditions at (a) 1073. K and (b) 973.1 K
0
0.1
0.2
0.3
0.4
0.5
0.6
0
0.05
0.1
0.15
0.2
0.25
0.3
0 2 4 6
R(C
2+)
[m
ol/
kg s
]
R(C
Ox)
[m
ol/
kg s
]
p(O2) [kPa]
RCOx (exp, 1073.2 K)RCOx (model, 1073.2 K)RC₂₊ (exp, 1073.2 K)RC₂₊ (model, 1073.2 K)
0
0.04
0.08
0.12
0.16
0.2
0
0.02
0.04
0.06
0.08
0.1
0.12
0 2 4 6
R(C
2+)
[m
ol/
kg s
]
R(C
Ox)
[m
ol/
kg s
]
p(O2) [kPa]
RCOx (exp, 973.1 K)RCOx (model, 973.1 K)RC₂₊ (exp, 973.1 K)RC₂₊ (model, 973.1 K)

81
3.4.2 Influence of space time and temperature on methane and oxygen conversion,
the yield of C2+ hydrocarbons, and COx
The influence of space-time and reactor temperature on reactor performance parameters has been
investigated in this section to validate the process of the developed membrane reactor model. These
parameters include methane and oxygen conversion, calculated using Eqn. (3-40) and Eqn. (3-41),
respectively.
2 4 2 6 2
4
2 4
,( ) ,( ) ,( ) ,( )
,( )
( 2) ( 2) ( ) ( )X 100
( )
C H outlet C H outlet CO outlet CO outlet
CH
C H inlet
n n n n
n
+ + +=
(3-40)
2 2
2
2
,( ) ,( )
,( )
X = ( ) 100O inlet O outlet
O
O inlet
n n
n
−
(3-41)
Where,
▪ 𝑋𝐶𝐻4 : methane conversion, [%]
▪ 𝑋𝑂2: oxygen conversion, [%]
▪ ��𝑖,𝑖𝑛𝑙𝑒𝑡: inlet species ‘i' molar flow rates, [mol/s]
▪ ��𝑖,𝑜𝑢𝑡𝑙𝑒𝑡: outlet species ‘i' molar flow rates, [mol/s]
The yield of the reactor output is also investigated. The selectivity and yield of the higher
hydrocarbons (C2H6 and C2H4) are shown in Eqn. (3-42) and Eqn. (3-43), respectively. Also, the CO2
(CO and CO2) selectivity and yield are shown in Eqn. (3-44) and Eqn. (3-45).
2 4 2 6 2 4 2
2
4 4
,( ) ,( ) ,( ) 6,( )
,( ) ,( )
S 2C H outlet C H outlet C H inlet C H inlet
C
CH inlet CH outlet
n n n n
n n+
+ − −=
− (3-42)
2 4 2YC CH CX S
+ += (3-43)

82
2 2
4 4
( ) ( ) ( ) ( )
( ) ( )
x
CO outlet CO outlet CO inlet CO inlet
CO
CH inlet CH outlet
n n n nS
n n
+ − −=
−
(3-44)
4Y
x xCO CH COX S= (3-45)
Where,
▪ 𝑆𝐶𝑂𝑥: COx selectivity, [%]
▪ 𝑆𝐶2+: C2+ hydrocarbons selectivity, [%]
▪ 𝑌𝐶2+: C2+ hydrocarbons yield, [%]
▪ 𝑌𝐶𝑂𝑥: COx yield, [%]
For all the figures, the space-time was varied from 1.87 to 25 kg s/m3. At the same time, the
isothermal reactor temperature was alternated between 1103.2 and 973.1 K. The solid lines show the
experimental results obtained from Stansch et al. [90]. At the same time, the dotted lines show the
developed membrane reactor results. It is noticeable that there is an almost asymmetrical distribution
of the data points for all variables. This shows that the developed membrane model can predict the
effect of altering the reactor operating conditions on conversions of methane and oxygen and yields to
C2+ hydrocarbons and carbon oxides with a high degree of accuracy.
Figure 3-8 shows the influence of altering the space, time, and temperature on methane and oxygen
conversion. At 1103.2 K, almost complete conversion of oxygen (𝑋𝑂2 > 95%) was already achieved for
the contact time of 25 kg s/m3. At 973.1 K, the conversion of oxygen increased slowly with space-time
compared to the dependences measured at 1103.2 K. For both temperatures, the course of the
conversion of methane corresponded to that of oxygen. No further methane conversion with space-time
was measured when oxygen conversion was complete.
Figure 3-9 shows the influence of altering the space, time, and temperature on the C2+ yield of ethane
and ethylene. For ethane yield, at longer contact times, the characteristics of the ethane yield depended
on temperature. At high temperatures (1103.2 K), the yield of ethane leveled off, although oxygen was
still available. At the same temperature, the ethane yield characteristics show its maximum yield. For

83
ethylene yield, the dependence of ethylene yield on the space-time at low values of this parameter
confirms the generally accepted thesis that ethylene is formed in a consecutive reaction of ethane.
However, the leveling off observed at long contact times indicates that ethylene also is an intermediate
product of the OCM reaction. The leveling off observed at long space-time indicates that ethylene also
is an intermediate product of the OCM reaction [91].
Figure 3-10 shows the influence of altering the space-time and temperature on carbon oxides (CO
and CO2). For CO yield, at high temperatures (1103.2 K) and low space-time (space-time < 3.69 kg
s/m3), the yield of carbon monoxide passed through a maximum value. The yield drop occurred at high
temperatures, mainly in the range of space times for which oxygen was still available. However, when
oxygen was converted entirely, the yield decreased further with the contact time. For CO2 yield, there
is a noticeable increase for all temperatures with space-time. Rapid growth at short contact times
indicates that carbon dioxide is also the primary product [91].
(a) (b)
Figure 3-8: Influence of space time and temperature on methane and oxygen conversion at (a)1103.3
K and (b) 973.1 K
0
5
10
15
20
25
0
20
40
60
80
100
1.87 3.69 7.66 14.94 25.00
X(C
H4)
[%
]
X(O
2) [
%]
Space time [kg s/m3]
XO₂ (exp,1103.2 K) [%]
XO₂ (model,1103.2 K) [%]
XCH₄ (exp,1103.2 K) [%]
XCH₄ (model,1103.2 K) [%]0
2
4
6
8
10
12
0
10
20
30
40
50
60
70
1.87 3.69 7.66 14.94 25.00
X(C
H4)
[%
]
X(O
2) [
%]
Space time [kg s/m3]
XO₂ (exp, 973.1 K) [%]
XO₂ (model,973.1 K) [%]
XCH₄ (exp, 973.1 K) [%]
XCH₄ (model, 973.1 K) [%]
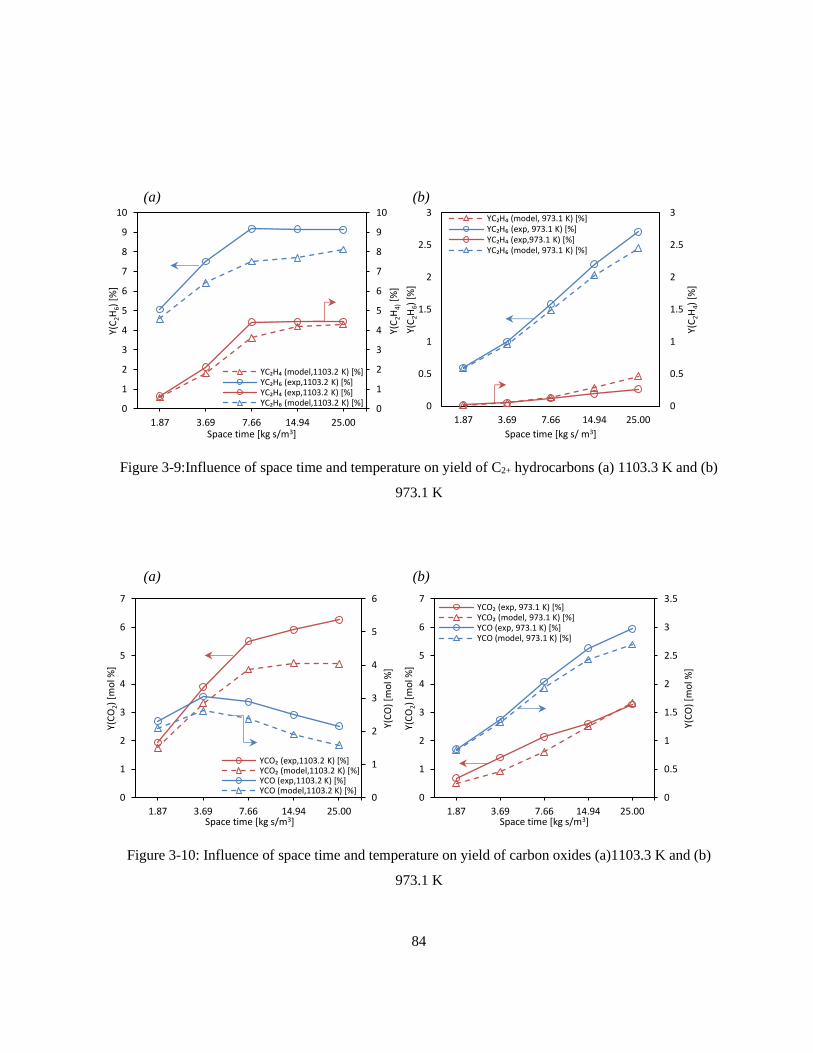
84
(a) (b)
Figure 3-9:Influence of space time and temperature on yield of C2+ hydrocarbons (a) 1103.3 K and (b)
973.1 K
(a) (b)
Figure 3-10: Influence of space time and temperature on yield of carbon oxides (a)1103.3 K and (b)
973.1 K
0
1
2
3
4
5
6
7
8
9
10
0
1
2
3
4
5
6
7
8
9
10
1.87 3.69 7.66 14.94 25.00
Y(C
2H
4)[%
]
Y(C
2H
6)
[%]
Space time [kg s/m3]
YC₂H₄ (model,1103.2 K) [%]YC₂H₆ (exp,1103.2 K) [%]YC₂H₄ (exp,1103.2 K) [%]YC₂H₆ (model,1103.2 K) [%] 0
0.5
1
1.5
2
2.5
3
0
0.5
1
1.5
2
2.5
3
1.87 3.69 7.66 14.94 25.00
Y(C
2H
4)
[%]
Y(C
2H6)
[%
]
Space time [kg s/ m3]
YC₂H₄ (model, 973.1 K) [%]YC₂H₆ (exp, 973.1 K) [%]YC₂H₄ (exp,973.1 K) [%]YC₂H₆ (model, 973.1 K) [%]
0
1
2
3
4
5
6
0
1
2
3
4
5
6
7
1.87 3.69 7.66 14.94 25.00
Y(C
O)
[mo
l %]
Y(C
O2)
[m
ol %
]
Space time [kg s/m3]
YCO₂ (exp,1103.2 K) [%]YCO₂ (model,1103.2 K) [%]YCO (exp,1103.2 K) [%]YCO (model,1103.2 K) [%]
0
0.5
1
1.5
2
2.5
3
3.5
0
1
2
3
4
5
6
7
1.87 3.69 7.66 14.94 25.00
Y(C
O)
[mo
l %]
Y(C
O2)
[m
ol %
]
Space time [kg s/m3]
YCO₂ (exp, 973.1 K) [%]YCO₂ (model, 973.1 K) [%]YCO (exp, 973.1 K) [%]YCO (model, 973.1 K) [%]

85
3.4.3 Average parity plots (± 20 % relative prediction error)
A parity plot is a scatterplot that compares experimental data against model data. Each point has
coordinates, where x is the experimental value and y is the corresponding model value. A dotted line
of the equation y = x is added as a reference. The limits of the parity plots are set for ± 20 %, shown by
the two solid black lines.
Figure 3-11 shows the experimental vs. model results for the oxygen and methane conversion at
973.1 and 1103.2 K. The prediction of the methane and oxygen conversions at 1103.2 and 973.1 K are
well within the ± 20% limit compared to experimental results.
Figure 3-12 shows experimental vs. model results for C2+ hydrocarbons yield at 973.1 and 1103.2
K. The average relative prediction for the rate of formation of higher hydrocarbons and rate of formation
of carbon oxides at 1103.2 and 973.1 K are well within the 20 % limit compared to experimental results.
Figure 3-13 shows experimental vs. model results for COx yield at 973.1 and 1103.2 K. The majority
of the model predicted data points are at 1103.2 and 973.1 K are well within the 20% limit compared
to experimental results. In contrast, some data points were predicted with lower accuracy, which might
be because of several sources of errors that may have resulted in some of the differences between the
published experimental results reported by Stansch et al. [91] and the generated results using the
membrane reactor model :
(1) Fitting error (standard error of estimate): is due to estimating the actual values when plotting
them; it accompanies the estimated activation energies values (Ea,j) and pre-exponential values
(k0,j).
(2) Numerical error: This type of error is due to the Δt (time step). In order to reduce the numerical
error, the time step must be changed to a point where the results' difference is not differential.
It is noticeable that an almost asymmetrical distribution of the data points on both diagonal sides
was obtained for all variables. This observation can be used to conclude that the membrane reactor
mode developed can predict the reactor's performance parameters (including conversions of methane
and oxygen and yields to C2+ hydrocarbons and carbon oxides with an average accuracy between ±
20% average relative error limit.
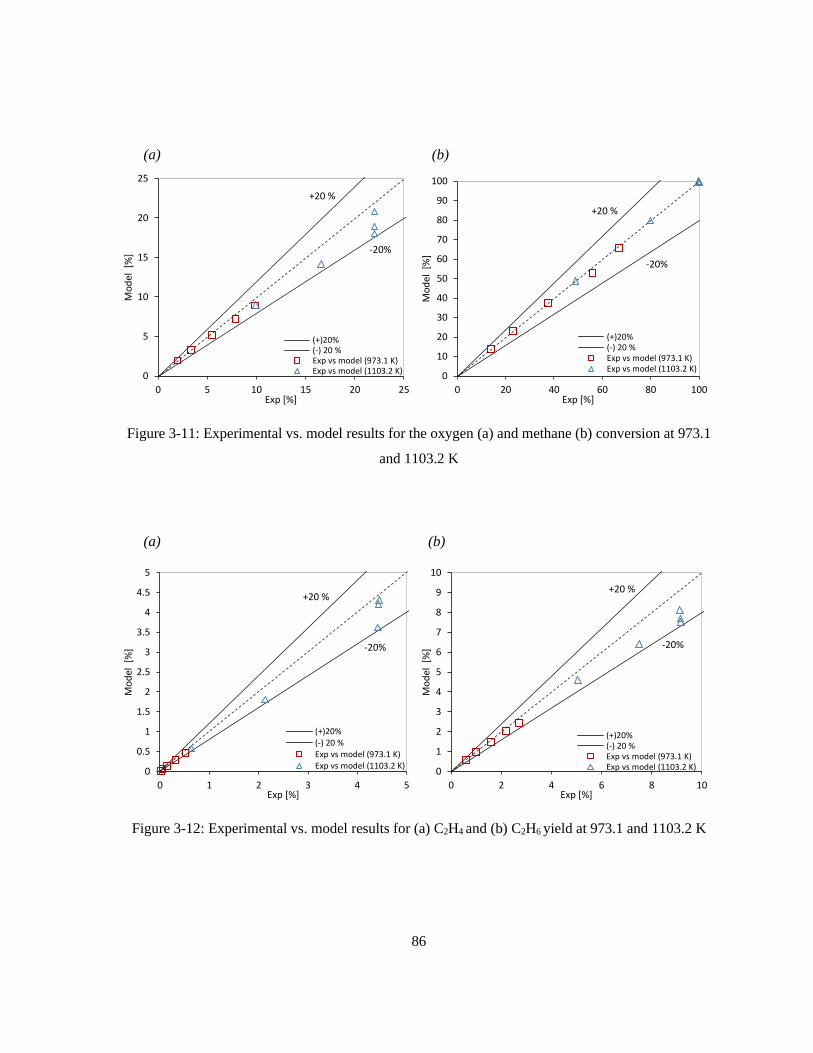
86
(a) (b)
Figure 3-11: Experimental vs. model results for the oxygen (a) and methane (b) conversion at 973.1
and 1103.2 K
(a) (b)
Figure 3-12: Experimental vs. model results for (a) C2H4 and (b) C2H6 yield at 973.1 and 1103.2 K
+20 %
-20%
0
5
10
15
20
25
0 5 10 15 20 25
Mo
del
[%
]
Exp [%]
(+)20%(-) 20 %Exp vs model (973.1 K)Exp vs model (1103.2 K)
+20 %
-20%
0
10
20
30
40
50
60
70
80
90
100
0 20 40 60 80 100
Mo
del
[%
]
Exp [%]
(+)20%(-) 20 %Exp vs model (973.1 K)Exp vs model (1103.2 K)
+20 %
-20%
0
0.5
1
1.5
2
2.5
3
3.5
4
4.5
5
0 1 2 3 4 5
Mo
del
[%
]
Exp [%]
(+)20%(-) 20 %Exp vs model (973.1 K)Exp vs model (1103.2 K)
+20 %
-20%
0
1
2
3
4
5
6
7
8
9
10
0 2 4 6 8 10
Mo
del
[%
]
Exp [%]
(+)20%(-) 20 %Exp vs model (973.1 K)Exp vs model (1103.2 K)

87
(a) (b)
Figure 3-13: Experimental vs. model results for (a) CO and (b) CO2 yield at 973.1 and 1103.2 K
3.4.4 Influence of altering channel width
Based on the membrane reactor model shown in Figure 3-1, the membrane reactor model is
computed along the length of the reactor. The width of the channel does not influence the membrane
reactor model or the governing equations. This is because the membrane reactor model is modeled in
one-dimensional along the reactor length, which means that the direction of the width is assumed to be
uniform. That is why it is essential to validate the accuracy of the model by investigating the effect of
altering the channel width (membrane width) while fixing the ratio between the volumetric flow rate
and the channel (��𝑆𝑇𝑃/wmembrane). Based on mass balance equation on the feed side shown in Eqn. (3-5),
the channel width (membrane width) is a constant parameter. The mass balance can be solved as shown
in Eqn. (3-46).
, 2 2[ / m ] ( / )J [ / m ]j feed
v
membrane
d nmol s mol s
dx w= + −
(3-46)
The channel width was altered between three different cases. The inlet volumetric flow rate was
recorded in the three cases and used to find the ratio between the two parameters. ��𝑆𝑇𝑃/wmembrane is
maintained constant, and the ratio between the molar flow rate and the channel width (∆��𝑗/wmembrane) is
obtained. The ∆��𝑗/wmembrane was found to be consistent as the width was altered and the ��𝑆𝑇𝑃/wmembrane
+20 %
-20%
0
0.5
1
1.5
2
2.5
3
3.5
4
4.5
5
0 1 2 3 4 5
Mo
del
[%
]
Exp [%]
(+)20%(-) 20 %Exp vs model (973.1 K)Exp vs model (1103.2 K)
+20 %
-20%
0
1
2
3
4
5
6
7
8
9
10
0 2 4 6 8 10
Mo
del
[%
]
Exp [%]
(+)20%(-) 20 %Exp vs model (973.1 K)Exp vs model (1103.2 K)

88
is maintained, which correlates with the hypothesis and validates that the model is working correctly
based on the assumptions taken. The result of the analysis is shown in Appendix A.
3.5 Chapter summary
This chapter investigates the implementation of the OCM process in an inorganic catalyst membrane
reactor for the co-production of hydrogen and ethylene. The chapter showcased the development of a
catalytic membrane reactor. The model is based on a plug-flow reactor that mimics a monolith
membrane reactor design. The membrane reactor is divided into a feed, sweep, and membrane. On the
feed side, the oxygen incorporation process is through the gaseous oxygen and oxygen vacancies at the
membrane surface to form lattice oxygen. Then the lattice oxygen diffuses through the membrane
driven by potential chemical gradients. Once the lattice oxygen reaches the sweep side, a reaction
between lattice oxygen and electron holes at the membrane surface releases gases oxygen. The final
step includes the mass transfer of gases oxygen from the membrane surface (sweep side) to the gas
(methane) stream, which provides the necessary oxygen molecule for OCM reactions to convert
methane to higher hydrocarbons such as ethane and ethylene. The development of the model included
the development of the governing equations, including mass balance and pressure drop. MATLAB
ordinary differential solver (Ode45) is used to solve governing differential equations that concern mass
balance and pressure drop along the length of the reactor. The chapter also discussed the development
of the resistance network and the connection between vacancy flux and oxygen flux. The resistances
network includes the gas species diffusion on either the feed or sweep side. In addition, mass diffusion
in the gas phase is used to solve the surface concentrations for both water and oxygen.
The membrane reactor model was validated by comparing the theoretical predictions of differential
kinetics with the experimental results for OCM in a micro catalytic fixed-bed reactor with La2O3/CaO
as a catalyst, reported by Stansch et al. [91]. Parity plots are constructed with average error limits of ±
20 %. It is noticeable that an almost asymmetrical distribution of the data points on both diagonal sides
was obtained for all variables. This observation can conclude that the membrane reactor mode
developed can predict reactors' performance parameters (including conversions of methane and oxygen
and yields to C2+ hydrocarbons and carbon oxides with an average accuracy of between 20% average
relative error limit. Lastly, in order to further validate the accuracy of the membrane reactor model
developed the influence of altering channel width while maintaining the ��𝑆𝑇𝑃/wmembrane constant. The
∆��𝑗/wmembrane was found to be consistent as the width was altered and the��𝑆𝑇𝑃/wmembrane is maintained

89
which correlates with the hypothesis and validates that the model is working correctly based on the
assumptions taken.
In Chapter 4, the one-dimensional membrane reactor model developed will be analyzed further by
developing a base case that establishes the correct relationships between these parameters and the
membrane reactor performance. A systematic analysis and parametric study will be presented to
analyze the base case scenario thoroughly. Base case analysis remarks will be used to develop a target
case that demonstrates if the technology is industrially applicable through investigating the membrane
reactor’s output C2+ yield.

90
Chapter 4
Membrane reactor model results analysis
4.1 Chapter introduction
This chapter builds on the one-dimensional oxygen permeable catalytic membrane reactor model
developed in Chapter 3. A base case is developed and analyzed by establishing the correct relationships
between several parameters and the membrane reactor performance. A systematic and sensitivity
analysis will be presented to identify the critical parameters that affect the co-production performances
in a membrane reactor. In addition, the economic feasibility of the OCM technology for the co-
production of ethylene and hydrogen is investigated by estimating the required ethylene yield and
selectivity needed to obtain an economically favorable ethylene price. Base case analysis remarks will
be used to develop a target case that demonstrates if the technology is industrially applicable through
investigating the membrane reactor’s output C2+ yield.
The target case developed will also be analyzed to understand the effect of improving the membrane
reactor’s operating condition. Lastly, this chapter also investigates the benefits of implementing the
membrane in an OCM catalytic reactor to produce higher hydrocarbons versus using a pre-mixed
reactor for the same purpose. The two scenarios will be compared to draw several conclusions about
the impacts of an oxygen-permeable membrane and its influence on the OCM reactor performance and,
more importantly, on the environment.
4.2 Base case
4.2.1 Reactor geometry and operating conditions
The reactor dimensions and the initial operating conditions for the developed base case are
summarized in Table 4-1. The reactor dimensions were consistent with similar membrane reactors'
literature values. The operating conditions were based on a comprehensive 10-step kinetic model of the
oxidative coupling of methane to C2+ hydrocarbons over a La2O3/CaO catalyst based on kinetic
measurements in a micro catalytic fixed-bed reactor.

91
Table 4-1: Dimensions and operating conditions (base case)
Parameter Feed side Sweep side Membrane
Membrane thickness (t) [m]
Full Channel height (H) [m]
¼ Channel height (Hchannel) [m]
Channel length (Lchannel) [m]
Channel width (wchannel) [m]*
Temperature (T) [K]
Total inlet pressure (ptotal,inlet) [Pa]
Inlet water mole fraction
Inlet nitrogen mole fraction (feed)
Inlet methane mole fraction
Inlet nitrogen mole fraction (sweep)
Volumetric flow rate (STP) [m3/s]
Space time [kg s/m3]
Catalyst density [kg/m3]
Catalyst porosity
Total catalyst mass [kg]
Total membrane surface area [m2]
Catalyst per membrane surface area [kg/m2]
-
2E-3
1E-3
1.50
5E-2
1103.3
100000
0.8
0.2
-
-
7.23E-5
-
-
-
-
-
-
-
2E-3
1E-3
1.50
5E-2
1103.3
100000
-
-
0.7
0.3
7.23E-5
1.86
3600
0.9995
1.35E-4
-
1.8E-3
9E-4
-
-
-
-
1103.3
-
-
-
-
-
-
-
-
-
-
7.5E-2
-
* Channel width is equal to the membrane width based on the reactor schematic
The membrane thickness was kept at 9E-4 m, consistent with the membrane thickness reported by
Wu et al. [74]. The channel height was maintained at 1 mm for a quarter of the channel, consistent with
the membrane reactor model developed by Wu et al. [74]. The feed and sweep sides control volumes

92
are assumed to be 1/4 of the entire reactor channel. This estimation is possible due to symmetry, which
means the boundaries of the chosen control volumes can be assumed to have no interactions with the
other channels that share the same wall with the considered channels. The feed and sweep sides control
volumes assumption mentioned will allow us to study the heat and mass transfers between the
membrane and the two feed and sweep sides. The channel length and width magnitude for both feed
and sweep channels was consistent with the literature's oxygen transport membrane models [119,120].
Mastropasqua et al. [119] reported a channel width of 2.15E-2 m for their developed one-dimensional
model for a planar oxygen transport membrane module. Rodriguez et al. [120] reported a channel length
of 4 m for their proposed reactor design for ethylene production.
Water is fed to the membrane feed surface, and it reacts with the oxygen vacancies to produce
hydrogen. In contrast, the oxygen atom from water incorporates the lattice oxygen and diffuses through
the membrane due to the potential chemical gradient. On the other side, methane reacts with the lattice
oxygen ions to produce higher hydrocarbon. The sweep side operating conditions are based on the
micro catalytic fixed-bed reactor developed by Stansch et al. [91]. The catalyst porosity reported by
Stansch et al. [91] for their micro catalytic fixed-bed reactor was altered on the sweep side because
there is a direct relationship between the porosity and the total catalyst mass (as shown in Eqn. (4-3)).
Adjusting the porosity and reducing the total catalyst mass reduces the catalyst mass per step, directly
affecting the formation/destruction rates, as explained in section 3.3.3.1.1.
, , , ,channel sweep channel sweep channel sweep channel sweepV L H w=
(4-1)
, (1 )catalyst channel sweepV V = −
(4-2)
,total catalyst catalyst catalystM V =
(4-3)
Where,
▪ 𝑉𝑐ℎ𝑎𝑛𝑛𝑒𝑙,𝑠𝑤𝑒𝑒𝑝: total volume of the sweep side channel, [m3]
▪ 𝐿𝑐ℎ𝑎𝑛𝑛𝑒𝑙 : length of the sweep side channel, [m]
93
▪ 𝐻𝑐ℎ𝑎𝑛𝑛𝑒𝑙,𝑠𝑤𝑒𝑒𝑝 : height of sweep side channel, [m]
▪ 𝑤𝑐ℎ𝑎𝑛𝑛𝑒𝑙,𝑠𝑤𝑒𝑒𝑝 : width of the sweep side channel, [m]
▪ 𝑉𝑐𝑎𝑡𝑎𝑙𝑦𝑠𝑡 : total volume of catalyst in sweep side, [m3]
▪ 𝜙 : catalyst porosity
▪ 𝑀𝑡𝑜𝑡𝑎𝑙,𝑐𝑎𝑡𝑎𝑙𝑦𝑠𝑡 : total catalyst mass, [kg]
▪ 𝜌𝑐𝑎𝑡𝑎𝑙𝑦𝑠𝑡 : catalyst density, [kg/m3]
In addition, the space-time was adjusted to match the lowest reported value by Stansch et al. [91] to
maintain a suitable volumetric flow rate, seeing as the space-time directly affects the volumetric flow
rate (on the sweep side) according to Eqn. (4-4).
,,( )
space time
total catalystSTP sweep
MV = (4-4)
Where,
▪ ,( )STP sweepV : volumetric flow rate at STP conditions on sweep side, [m3/s]
4.2.2 Model outputs (base case)
It is important to note that most of the research in this field has been focused on improving the C2+’s
yield and making this process feasible on larger scales. Many authors have suggested C2+ reactor yields,
which are necessary to make the process competitive with the conventional technologies; that is why
one of the focuses of the cases presented - including the base case - would be to highlight the ability of
the membrane reactor to obtain a relatively higher C2+ yield. The selectivity and yield of C2+ are
calculated using Eqn. (3-42) and Eqn. (3-43), respectively. The COx selectivity is calculated using
Eq(3-44). The methane conversion needed to be calculated to obtain the selectivity and yield values, as
shown in Eq(3-40). Finally, the oxygen conversion was also essential to keep an eye on methane
oxidation to ensure the optimum methane conversion level for the specific case is achieved. The oxygen
conversion is calculated based on Eq(3-41).
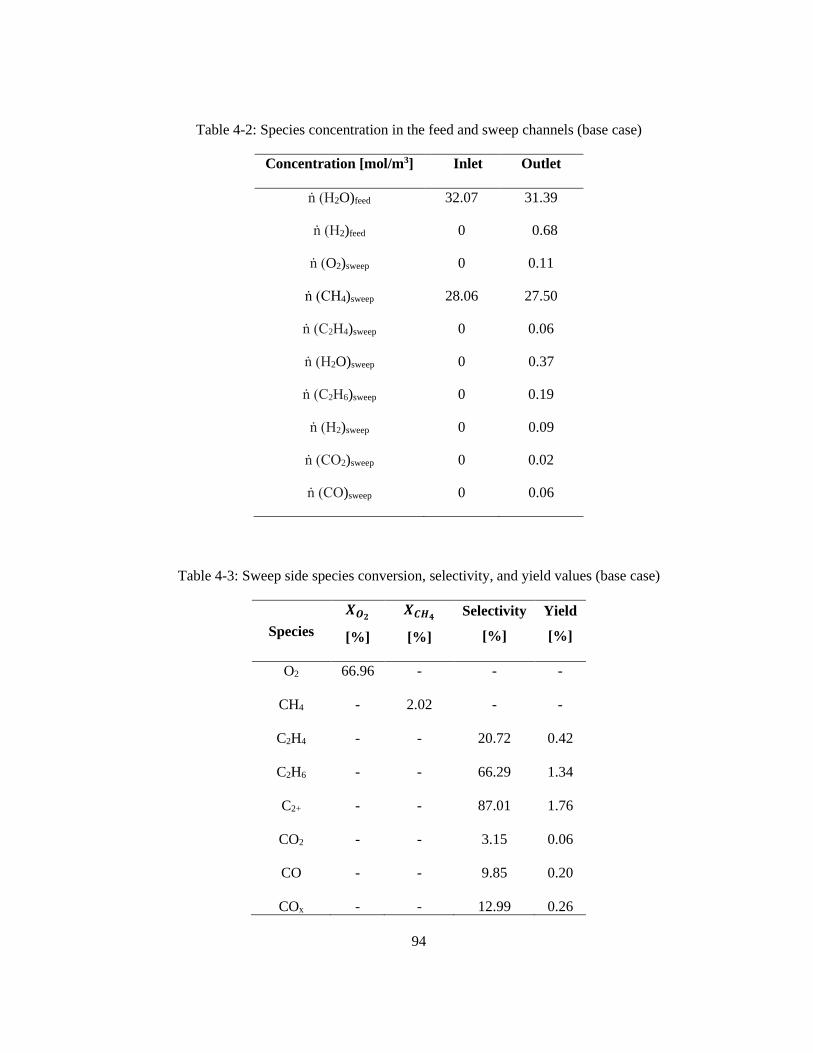
94
Table 4-2: Species concentration in the feed and sweep channels (base case)
Concentration [mol/m3] Inlet Outlet
ṅ (H2O)feed
ṅ (H2)feed
ṅ (O2)sweep
ṅ (CH4)sweep
ṅ (C2H4)sweep
ṅ (H2O)sweep
ṅ (C2H6)sweep
ṅ (H2)sweep
ṅ (CO2)sweep
ṅ (CO)sweep
32.07
0
0
28.06
0
0
0
0
0
0
31.39
0.68
0.11
27.50
0.06
0.37
0.19
0.09
0.02
0.06
Table 4-3: Sweep side species conversion, selectivity, and yield values (base case)
Species
𝑿𝑶𝟐
[%]
𝑿𝑪𝑯𝟒
[%]
Selectivity
[%]
Yield
[%]
O2
CH4
C2H4
C2H6
C2+
CO2
CO
COx
66.96
-
-
-
-
-
-
-
-
2.02
-
-
-
-
-
-
-
-
20.72
66.29
87.01
3.15
9.85
12.99
-
-
0.42
1.34
1.76
0.06
0.20
0.26
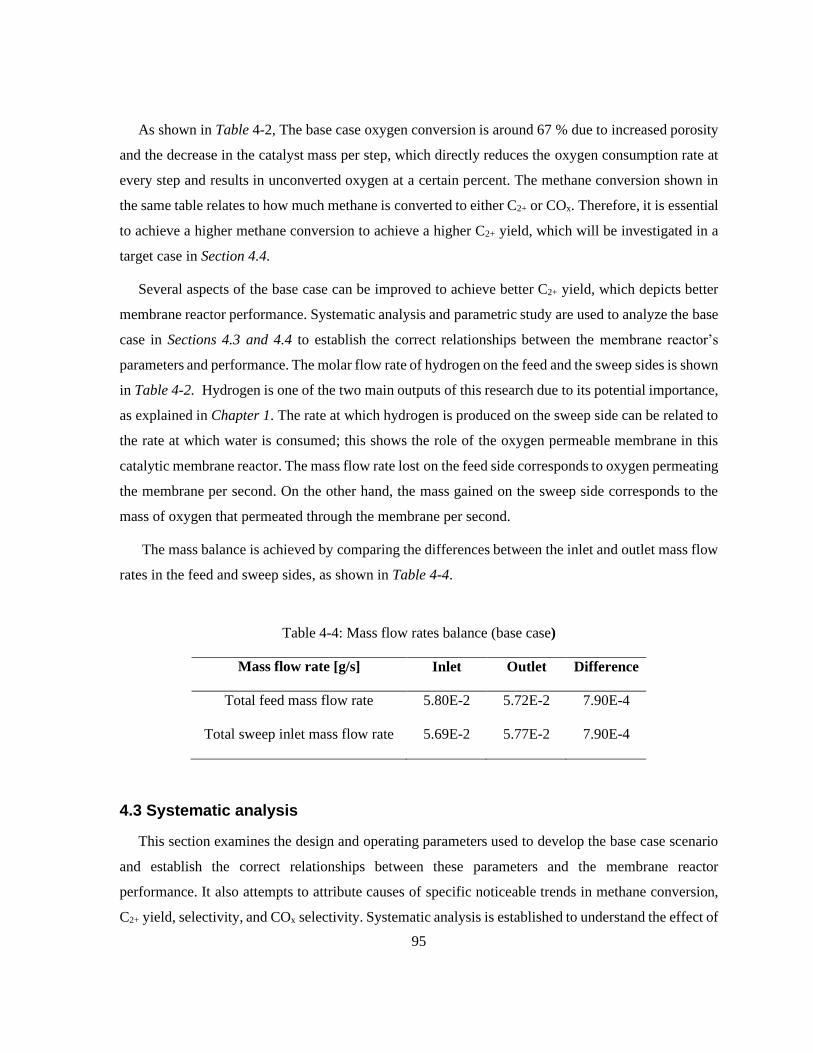
95
As shown in Table 4-2, The base case oxygen conversion is around 67 % due to increased porosity
and the decrease in the catalyst mass per step, which directly reduces the oxygen consumption rate at
every step and results in unconverted oxygen at a certain percent. The methane conversion shown in
the same table relates to how much methane is converted to either C2+ or COx. Therefore, it is essential
to achieve a higher methane conversion to achieve a higher C2+ yield, which will be investigated in a
target case in Section 4.4.
Several aspects of the base case can be improved to achieve better C2+ yield, which depicts better
membrane reactor performance. Systematic analysis and parametric study are used to analyze the base
case in Sections 4.3 and 4.4 to establish the correct relationships between the membrane reactor’s
parameters and performance. The molar flow rate of hydrogen on the feed and the sweep sides is shown
in Table 4-2. Hydrogen is one of the two main outputs of this research due to its potential importance,
as explained in Chapter 1. The rate at which hydrogen is produced on the sweep side can be related to
the rate at which water is consumed; this shows the role of the oxygen permeable membrane in this
catalytic membrane reactor. The mass flow rate lost on the feed side corresponds to oxygen permeating
the membrane per second. On the other hand, the mass gained on the sweep side corresponds to the
mass of oxygen that permeated through the membrane per second.
The mass balance is achieved by comparing the differences between the inlet and outlet mass flow
rates in the feed and sweep sides, as shown in Table 4-4.
Table 4-4: Mass flow rates balance (base case)
Mass flow rate [g/s] Inlet Outlet Difference
Total feed mass flow rate
Total sweep inlet mass flow rate
5.80E-2
5.69E-2
5.72E-2
5.77E-2
7.90E-4
7.90E-4
4.3 Systematic analysis
This section examines the design and operating parameters used to develop the base case scenario
and establish the correct relationships between these parameters and the membrane reactor
performance. It also attempts to attribute causes of specific noticeable trends in methane conversion,
C2+ yield, selectivity, and COx selectivity. Systematic analysis is established to understand the effect of

96
altering several designs and operating parameters on achieving the best possible methane conversion
and C2+ yield, which directly enhances the membrane reactor performance. In addition, a parametric
study (sensitivity analysis) is established to know how target variables are affected based on changes
in design, operating, and kinetics parameters. Lastly, applying the pressure drop on the membrane
reactor is analyzed. Conclusions are drawn about the impact of the pressure drop on the membrane
reactor performance. The conclusion drawn from this section is used to develop the target case scenario
in Section 4.6.
4.3.1 Effect of reactor geometries on C2+ selectivity, yield, and methane conversion
4.3.1.1 Altering channel length
Channel length for both the feed and sweep channel were also altered to examine its effect on the
C2+ selectivity, yield, and methane conversion. The systematic analysis included the base case scenario
and four other cases where the channel length ranges between 1.1 to 1.9 m. It is essential to point out
that the space-time was adjusted across the 5 cases to have a consistent volumetric flow rate for the 5
cases of around 7.23E-5 m3/s.
Figure 4-1 (a) shows a relative percentage increase of 31.68 % in methane conversion between the
base case and case 4 increased as the channel length manually increased to 1.9 m. The increase in
channel length allows the species more volume to react. Specifically, the methane, which will have
more volume to convert to C2+, also explains the increase in the C2+ yield as the channel length
increases. Increasing methane conversion is accompanied by a relative percentage increase in C2+ yield
of around 27 % between the base case and case 4 and a relative percentage decrease in C2+ selectivity
of around 3.26 % between the base case and case 4.

97
(a) (b)
(c)
Figure 4-1: Effect of altering channel length on (a) methane conversion, (b) C2+ selectivity, and (c)
yield (isothermal condition (T = 1103.3 K), pressure drop applied, base case reactor dimensions, Abs
tolerance = 1E-14 and Rel tolerance = 1E-7)
4.3.1.2 Altering channel height
Channel height for both the feed and sweep channels was also altered to examine its effect on the
C2+ selectivity, yield, and methane conversion. Similar to altering the other reactor dimensions, the
systematic analysis included the base case scenario and four other cases where the channel height ranges
Base case, 2.02%
0.0%
0.5%
1.0%
1.5%
2.0%
2.5%
3.0%
0.00 0.50 1.00 1.50 2.00
Met
han
e co
nve
rsio
n [
%]
Channel length [m]
Base case, 87.01%
83%
84%
85%
86%
87%
88%
89%
90%
91%
0.00 0.50 1.00 1.50 2.00
C2+
sele
ctiv
ity
[%
]
Channel length [m]
Base case, 1.76%
0.0%
0.5%
1.0%
1.5%
2.0%
2.5%
0.00 0.50 1.00 1.50 2.00
C2+
yied
l [%
]
Channel length [m]

98
between 1E-4 to 1E-2 m. It is essential to point out that the space-time was adjusted across the 5 cases
to have a consistent volumetric flow rate from the 5 cases of around 7.23E-5 m3/s.
(a) (b)
(c)
Figure 4-2: Effect of altering channel height on methane conversion, C2+ selectivity, and yield
(isothermal condition (T = 1103.3 K), pressure drop applied, base case reactor dimensions, Abs
tolerance = 1E-14 and Rel tolerance = 1E-7)
Figure 4-2 shows the positive impact of decreasing the channel height from 1E-3 to 1E-4 m on the
methane conversion as it shows an absolute percentage increase of 3.76 % between the base case and
Base case, 2.02%
0%
2%
4%
6%
8%
10%
12%
14%
16%
18%
20%
0 0.005 0.01 0.015
Met
han
e co
nve
rsio
n [
%]
Channel height [m]
Base case, 87.01%
0%
10%
20%
30%
40%
50%
60%
70%
80%
90%
100%
0 0.005 0.01 0.015
C2+
sele
ctiv
ity
[%]
Channel height [m]
Base case, 1.76%
0%
1%
2%
3%
4%
5%
6%
7%
8%
9%
10%
0 0.005 0.01 0.015
C2+
yiel
d [
%]
Channel height [m]

99
case 1. As expected, the increase in methane conversion is accompanied by an absolute percentage
increase of 1.60 % in the C2+ yield between the base case and case 1 and an absolute percentage decrease
of 28.92 % in the C2+ selectivity between the base case and case 1. Increasing the channel height leads
to a drop in the mass transfer coefficient (ℎ𝑚(𝑗,𝑖)). As a result, the difference between gas species in
bulk and on the surface increases, which leads to a drop in oxygen flux. The decrease in the vacancy
and oxygen fluxes can explain the decrease in methane conversion as the channel height increases. As
the oxygen flux decreases, the amount of oxygen being permeated across the membrane also decreases,
which means the methane oxidation rate decrease and allows less methane to convert into higher
hydrocarbons.
4.3.2 Effect of operating parameters on C2+ selectivity, yield, and methane conversion
4.3.2.1 Altering Space-time
The space-time was varied between 5 different cases, including the base case. The order of
magnitude for the space-time altered between the different cases. The lowest space-time investigated
is 0.0186 kg s/m3, and the highest space-time investigated is 186.79 kg s/m3.
(a) (b)
Figure 4-3: Effect of altering space-time on (a) methane conversion and (b) C2+ yield (isothermal
condition (T = 1103.3 K), pressure drop applied, base case reactor dimensions, Abs tolerance = 1E-14
and Rel tolerance = 1E-7)
Base case, 2.02%
0%
1%
2%
3%
4%
5%
0 50 100 150 200
Met
han
e co
nve
rsio
n [
%]
Space time [kg/m3]
Base case, 1.76%
0%
1%
2%
3%
4%
5%
0 50 100 150 200
C2+
yiel
d [
%]
Space time [kg s /m3]

100
Figure 4-3 (a) and (b) show the methane conversion and C2+ yield trends as the space-time is
increased between the cases. There is a clear increasing trend for methane conversion as space-time
increases. The methane achieves its highest conversion of 4.43% in case 4, which correlates with the
highest investigated space-time of 186.79 kg s/m3 in the same case. The C2+ achieves its optimum yield
of 4.30 % in case 4, which correlates with the highest investigated space-time of 186.79 kg s/m3 in the
same case. The positive trend showcased can be explained by the increase in space-time, representing
the increase in the mean residence time. Increasing the mean residence time means increasing the time
it takes for the number of species that takes up the control volume specified to either ultimately enter
or completely exit the reactor. In other words, the species, primarily methane and oxygen, have more
time to react and convert into C2+, which is why an increase in the C2+ is noticeable.
4.3.2.2 Altering isothermal temperature
In this study, isothermal operating is assumed. However, it is critical to have adequate heat
supply and thermal management in industrial applications to achieve the best performances. As shown
in Figure 4-4 (a), the methane conversion shows an absolute percentage increase of 3.19% between the
base case and case 4 as the isothermal temperature increases from 1103.3 to 1203.3 K. Increasing the
temperature affects the rate equations positively impacts the rate of methane consumption. At high
temperatures, the C2+ selectivity drops, which may be attributed to the complete oxidation of ethane
and ethylene to CO2 and CO. Therefore, oxidative and non-oxidative dehydrogenation as well as deep
oxidation of C2+ product to COx play an essential role in the OCM reaction network and should be
considered in the kinetic modeling. The increase in the C2+ yield with temperature is also linked to the
higher activation energies for the primary selective step, i.e., the formation of ethane from methane,
compared to the one(s) of the nonselective primary step(s). This aspect is a common feature of the
OCM reaction observed for various OCM catalysts.
As shown in Figure 4-4 (c), it is also noticeable that the highest temperature examined of
1203.3 K correlates to the highest C2+ yield of 3.47 % for case 4. The increase in C2+ yield is expected
due to increased methane conversion between the specified cases, following the already established
direct relationship.
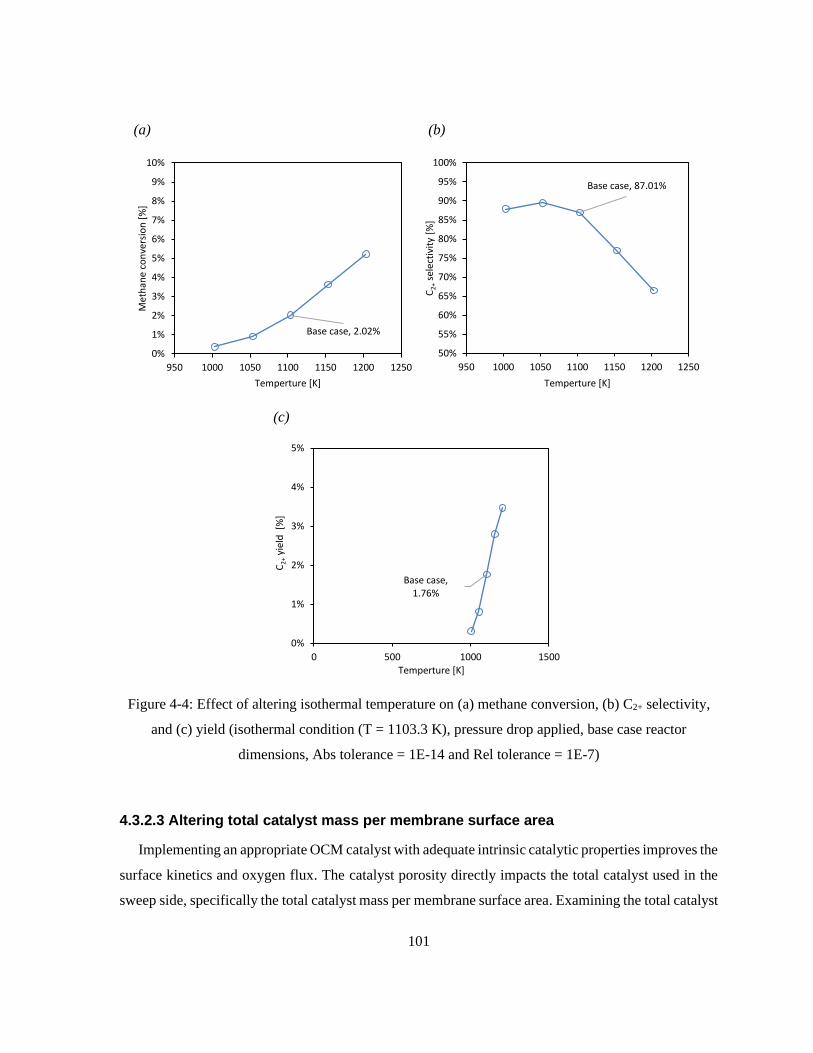
101
(a) (b)
(c)
Figure 4-4: Effect of altering isothermal temperature on (a) methane conversion, (b) C2+ selectivity,
and (c) yield (isothermal condition (T = 1103.3 K), pressure drop applied, base case reactor
dimensions, Abs tolerance = 1E-14 and Rel tolerance = 1E-7)
4.3.2.3 Altering total catalyst mass per membrane surface area
Implementing an appropriate OCM catalyst with adequate intrinsic catalytic properties improves the
surface kinetics and oxygen flux. The catalyst porosity directly impacts the total catalyst used in the
sweep side, specifically the total catalyst mass per membrane surface area. Examining the total catalyst
Base case, 2.02%
0%
1%
2%
3%
4%
5%
6%
7%
8%
9%
10%
950 1000 1050 1100 1150 1200 1250
Met
han
e co
nve
rsio
n [
%]
Temperture [K]
Base case, 87.01%
50%
55%
60%
65%
70%
75%
80%
85%
90%
95%
100%
950 1000 1050 1100 1150 1200 1250
C2+
sele
ctiv
ity
[%]
Temperture [K]
Base case, 1.76%
0%
1%
2%
3%
4%
5%
0 500 1000 1500
C2+
yiel
d [
%]
Temperture [K]

102
mass per membrane surface area's effect on methane conversion, C2+ selectivity, and yield is essential.
The total catalyst mass per membrane surface area was adjusted throughout five cases, including the
base case. The total catalyst mass per membrane surface area was ranged between 3.2E-3 and 3.6E-4
[kg/m2] between the 5 cases. The space-time was also adjusted across the five cases to have consistent
volumetric flow rate and molar flow rates of methane and nitrogen at the channel inlet.
(a) (b)
(c)
Figure 4-5: Effect of altering catalyst total mass per membrane surface area on (a) methane
conversion, (b) C2+ selectivity, and (c) yield (isothermal condition (T = 1103.3 K), pressure drop
applied, base case reactor dimensions, Abs tolerance = 1E-14 and Rel tolerance = 1E-7)
Base case, 2.02%
0%
1%
2%
3%
4%
5%
6%
7%
8%
9%
10%
0.0E+0 1.0E-3 2.0E-3 3.0E-3 4.0E-3
Met
han
e co
nve
rsio
n [
%]
Catalyst mass/Membrane surface area [kg/m2]
Base case, 87.01%
0%
10%
20%
30%
40%
50%
60%
70%
80%
90%
100%
0.0E+0 1.0E-3 2.0E-3 3.0E-3 4.0E-3
C2
+ Se
lect
ivit
y [
%]
Catalyst mass/Membrane surface area [kg/m2]
Base case, 1.76%
0%
1%
2%
3%
4%
5%
6%
7%
8%
9%
10%
0.0E+0 1.0E-3 2.0E-3 3.0E-3 4.0E-3
C2+
yiel
d [
%]
Catalyst mass/Membrane surface area [kg/m2]

103
As shown in Figure 4-5 (a) and (b), the increase in total catalyst mass per membrane surface area is
accompanied by a decrease in methane conversion, reaching 0.50 % for case 4, followed by a decrease
in C2+ yield due to the direct relationship between the two quantities reaching 0.44 % for case 4. The
results also showed that the change in catalyst mass per Δx increases as the total catalyst mass per
membrane surface area decreases, which means more catalyst is available at every iteration. Catalysts
are used to decrease the activation energy and facilitate the reactions. Therefore, more catalyst mass
per Δx can enhance fuel oxidation rates and increase methane conversion. This information can clarify
the inverse relationship between methane conversion and total catalyst mass per membrane surface
area.
4.3.3 Effect of pressure drop on reactor performance
The pressured drop in the axial direction is investigated by applying the Darcy friction factor
equation as explained in Chapter 3, Section 3.3.3.2. Applying the pressure drop makes the one-
dimensional membrane reactor model realistic and closer to reality. Usually, the pressure drop
significantly impacts a plug flow reactor. The pressure drop can result in an expansion of the gas and
increased volumetric flow rate with position down the reactor, leading to lower conversion rates. In
order to examine the effect of pressure drop on the reactor performance, two scenarios for the base case
were compared in which the pressure drop is enabled in one scenario. At the same time, the other has
a negligible pressure drop in the axial direction.
Table 4-5 : Comparison between scenario 1 (pressure drop neglected) vs. scenario 2 (pressure drop
considered)
Scenario Scenario 1 (pressure
drop neglected)
Scenario 2 (pressure drop
considered)
Conversion Value [%] Value [%]
O2
CH4
67.02
2.02
66.96
2.02
Selectivity Value [%] Value [%]
C2+
COx
87.06
12.99
87.01
12.99
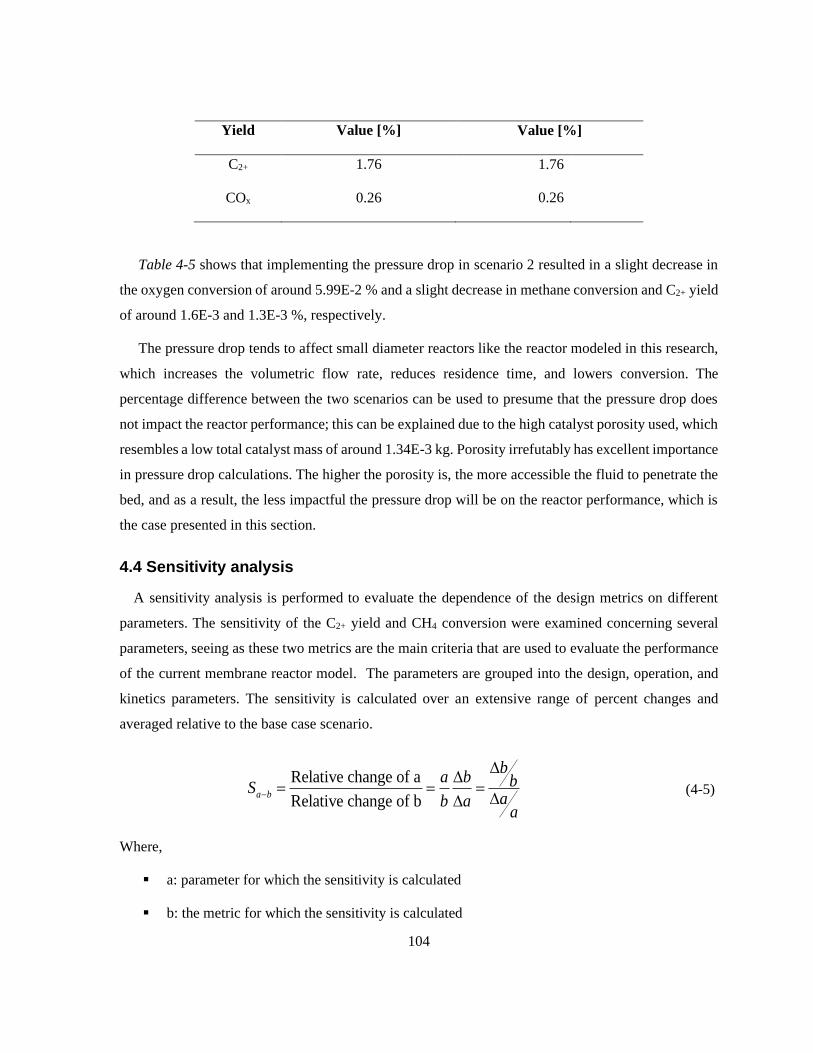
104
Yield Value [%] Value [%]
C2+
COx
1.76
0.26
1.76
0.26
Table 4-5 shows that implementing the pressure drop in scenario 2 resulted in a slight decrease in
the oxygen conversion of around 5.99E-2 % and a slight decrease in methane conversion and C2+ yield
of around 1.6E-3 and 1.3E-3 %, respectively.
The pressure drop tends to affect small diameter reactors like the reactor modeled in this research,
which increases the volumetric flow rate, reduces residence time, and lowers conversion. The
percentage difference between the two scenarios can be used to presume that the pressure drop does
not impact the reactor performance; this can be explained due to the high catalyst porosity used, which
resembles a low total catalyst mass of around 1.34E-3 kg. Porosity irrefutably has excellent importance
in pressure drop calculations. The higher the porosity is, the more accessible the fluid to penetrate the
bed, and as a result, the less impactful the pressure drop will be on the reactor performance, which is
the case presented in this section.
4.4 Sensitivity analysis
A sensitivity analysis is performed to evaluate the dependence of the design metrics on different
parameters. The sensitivity of the C2+ yield and CH4 conversion were examined concerning several
parameters, seeing as these two metrics are the main criteria that are used to evaluate the performance
of the current membrane reactor model. The parameters are grouped into the design, operation, and
kinetics parameters. The sensitivity is calculated over an extensive range of percent changes and
averaged relative to the base case scenario.
Relative change of a
Relative change of ba b
ba b bS
ab aa
−
= = =
(4-5)
Where,
▪ a: parameter for which the sensitivity is calculated
▪ b: the metric for which the sensitivity is calculated

105
4.4.1 Design parameters
(a) (b)
(c)
Figure 4-6: Percentage change of (a) channel height, (b) channel length, and (c) membrane thickness
vs percentage change of CH4 conversion and C2+ yield
Table 4-6 shows the sensitivity analysis results concerning the design parameters. The averaged
sensitivity results show that the membrane reactor is sensitive to channel length. The increase in channel
length leads to methane having more volume to convert to C2+, and this also explains the increase in
the C2+ yield as the channel length increases.
-140
-90
-40
10
60
110
160
-100 -50 0 50 100
% C
han
ge o
f C
H4
con
vers
ion
an
d C
2+
yiel
d
% Change of channel height
CH4 conversion
C2+ yield
-100
-80
-60
-40
-20
0
20
40
60
80
100
-100 -50 0 50 100
% C
han
ge o
f C
H4
con
vers
ion
an
d C
2+
yiel
d
% Change of channel length
CH4 conversion
C2+ yield
-0.4
-0.3
-0.2
-0.1
0
0.1
0.2
0.3
0.4
-100 -50 0 50 100
% C
han
ge o
f C
H4
con
vers
ion
an
d C
2+
yiel
d
% Change of membrane thickness
CH₄ conversion [%]
C₂₊ yield [%]

106
Figure 4-6 (a) shows that increasing the channel height leads to a drop in the mass transfer
coefficient (ℎ𝑚(𝑗,𝑖)). As a result, the difference between the gas species in bulk and on the surface
increases, which leads to a drop in the oxygen flux and ultimately the methane conversion and the C2+
yield.
Figure 4-6 (c) shows an inverse relationship between the membrane thickness and the C2+ yield and
methane conversion. Decreasing the thickness of the membrane leads to an increase in the vacancy and
oxygen flux; this means that thinner membranes are required to enhance the C2+ yield and the overall
membrane reactor performance. Table 4-6 shows low sensitivity when varying the membrane thickness.
The low sensitivity might be related to the fact that the bulk diffusion across the membrane is not the
limiting step, which makes the effect of varying membrane thickness not obvious.
Table 4-6: Sensitivity analysis results for design parameters
Parameter Base value 𝑺𝑿(𝑪𝑯𝟒) 𝑺𝑪𝟐+𝒚𝒊𝒆𝒍𝒅
Channel height [m] 1E-3
-0.729 -0.49
Channel length [m]
Membrane thickness [m]
1.5
9E-4
1.13
-0.0047
1.01
-0.0043
4.4.2 Operation parameters
(a) (b)
-100
-80
-60
-40
-20
0
20
40
60
80
100
-15 -10 -5 0 5 10 15
% C
han
ge o
f C
H4
con
vers
ion
an
d C
2+ y
ield
% Change of isothermal temperture
CH4 conversion
C2+ yield-10
-8
-6
-4
-2
0
2
4
6
8
-15 -10 -5 0 5 10 15
% C
han
ge o
f C
H4
con
vers
ion
an
d C
2+ y
ield
% Change of space time
CH4 conversion
C2+ yield

107
(c)
Figure 4-7 : Percentage change of operation parameters vs percentage change of CH4 conversion and
C2+ yield
Table 4-7 summarizes the sensitivity analysis results for the operation parameters, namely
isothermal temperature, space-time, and catalyst mass per membrane surface area. The averaged
sensitivity results show that the membrane reactor is most sensitive to the operating temperature.
As shown in Figure 4-7 (a), the averaged sensitivity results show that the isothermal temperature is
the second most impactful operation parameter on the membrane performance. This study assumes the
isothermal condition along the feed channel, sweep channel, and membrane. Nevertheless, the overall
reaction in the membrane reactor is endothermic. It is critical to have adequate heat supply and thermal
management in industrial applications to achieve the best performances. Higher operating temperature
leads to faster surface kinetics, and therefore, methane is consumed faster with the increase of oxygen
flux. A 10 % increase in the isothermal temperature led to a 79 % increase in the methane conversion
and a 58 % increase in the C2+ yield.
As shown in Figure 4-7 (b), altering the space-time is not as impactful to the membrane reactor
performance as the isothermal temperature. Increasing the space-time means increasing the time for the
number of species that take up the specified control volume to enter or completely exit the reactor. In
other words, the species, primarily methane and oxygen, have more time to react and convert into C2+,
-100
-80
-60
-40
-20
0
20
40
60
80
100
-100 -50 0 50 100
% C
han
ge o
f C
H4
con
vers
ion
an
d C
2+
yiel
d
% Change of catalyst mass/membrane surface area
CH4 conversion
C2+ yield

108
which is why an increase in the methane conversion and C2+ yield is noticeable. A 10 % increase in
space time leads to only a 5.88 % increase in methane conversion and a 6.31 % increase in the C2+ yield.
Figure 4-7 (c) depicts the direct relationship between the total catalyst mass per membrane surface
area and the membrane reactor performance parameters (methane conversion and the C2+ yield). A 40
% increase in the total catalyst mass per membrane surface area results in a 35.50 % increase in the
methane conversion and a 39.20 % increase in the C2+ yield. The increase in the total catalyst mass per
membrane surface area increases the catalyst mass at every iteration (established in Section 4.3.2.3),
which enhances the surface kinetics and increases the methane conversion and C2+ yield.
Table 4-7: Sensitivity analysis results for operating parameters
Parameter Base value 𝑺𝑿(𝑪𝑯𝟒) 𝑺𝑪𝟐+𝒚𝒊𝒆𝒍𝒅
Space time [kg s/m3] 1.87 0.68 0.7
Isothermal temperature [K] 1103.3 9.65 8.17
Catalyst mass per membrane surface area
[kg/m2]
1.8E-3 6.89E-1 7.12E-1
4.4.3 Kinetics parameters
(a) (b)
-0.5
-0.4
-0.3
-0.2
-0.1
0
0.1
0.2
0.3
0.4
0.5
-15 -10 -5 0 5 10 15
% C
han
ge o
f C
H4
con
vers
ion
an
d C
2+
yiel
d
% Change of kf,H
CH4 conversion
C2+ yield
-0.5
-0.4
-0.3
-0.2
-0.1
0
0.1
0.2
0.3
0.4
0.5
-15 -10 -5 0 5 10 15
% C
han
ge o
f C
H4
con
vers
ion
an
d C
2+
yiel
d
% Change of Dv
CH4 conversion
C2+ yield

109
(c)
Figure 4-8: Percentage change of (a) forward water splitting rate (b) oxygen vacancy diffusivity (Dv)
(c) forward oxygen incorporation rate vs percentage change of CH4 conversion and C2+ yield
Table 4-8 shows the sensitivity of the membrane reactor to the kinetic parameters. The kinetics
parameters were varied between ± 10 % by altering the pre-exponential factor. The averaged sensitivity
results show presented kinetic parameters have a minor impact on that membrane reactor performance
compared to the other parameters showcased in the sections above. Improving these two kinetic
parameters will result in a minimal increase in the C2+ yield and methane conversion.
Figure 4-8 (a) shows that increasing the rate of vacancy diffusivity increases the methane conversion
and C2+ yield. Increasing the rate of vacancy diffusivity leads to a decrease in bulk resistance (Rb). The
decrease in bulk resistance (Rb) increases the oxygen flux and the vacancy flux (based on Eqn. (3-14)),
which increases the methane conversion and C2+ yield because of the rate at which oxygen is being
permeated to the sweep side increases.
Figure 4-8 (b) shows that increasing the forward water splitting rate increases the methane
conversion and C2+ yield. Increasing the water splitting rate leads to a decreased surface reaction
resistance on the feed side (Rf). The decrease in the surface reaction resistance on the feed side increases
the oxygen flux and the vacancy flux based on the inverse relationship between them (Eqn. (3-14)).
The methane conversion and C2+ yield increase because oxygen permeating the sweep side increases.
Figure 4-8 (c) shows that increasing the forward oxygen incorporation rate increases the methane
conversion and C2+ yield. Increasing the forward rate of oxygen incorporation will increase the rate at
which the oxygen lattice can react with the electron-hole to leave the surface of the membrane and
-0.5
-0.4
-0.3
-0.2
-0.1
0
0.1
0.2
0.3
0.4
0.5
-15 -10 -5 0 5 10 15
% C
han
ge o
f C
H4
con
vers
ion
an
d C
2+
yiel
d
% Change of kf,O
CH4 conversion
C2+ yield

110
transform to gas-phase oxygen, as shown in Eq. (2-11). The aforementioned means that more oxygen
will be available on the sweep side, enhancing the methane conversion and the C2+ yield. The membrane
reactor seems to be equally sensitive to the forward water splitting rate and the forward rate of oxygen
incorporation, as shown in Table 4-8. The aforementioned suggests that the water-splitting rate is equal
to the rate of formation of the oxygen molecule, as established in Section 3.3.1.
Table 4-8: Sensitivity analysis results for kinetic parameters
Parameter Base value 𝑺𝑿(𝑪𝑯𝟒) 𝑺𝑪𝟐+𝒚𝒊𝒆𝒍𝒅
Dv [m2 / s] 7.51E-10 1.04E-2 1.13E-2
kf,H [m4/mol s]
kf,O [m2.5/mol0.5 s]
8.18E-7
1.78E-5
6.31E-3
6.31E-3
7.08E-3
7.08E-3
4.5 Economic feasibility of the OCM technology for the co-production of
ethylene and hydrogen
This section attempts to estimate the profitability of integrating the OCM process in a membrane
reactor based on the total operating and utility costs of C2H4 production. The estimation of the total
operating expenses of C2H4 production can help set a criterion for the target case developed later in this
chapter. Although the section does not cover all financial matters, it is a good indicator for choosing
among alternatives and finding out which part of the process should be improved. The focus is on the
utility and operating costs of significant steps in simplifying the OCM process. Some costs and
technical requirements were excluded, such as initial capital costs and energy requirements. That is
why this is not a full techno-economic assessment of the OCM process, as it is out of the scope of this
thesis. Cruellas et al. [59] provided a more comprehensive economic evaluation.
Cruellas et al. [59] have quantified the performance of the OCM reactor from a techno-economic
point of view. To do so, the group developed a one-dimensional membrane reactor model. The catalyst
used is La2O3/CaO catalyst, and its kinetics are based on the data provided by Stansch et al. [91]. Several
assumptions were implemented in which the system is assumed to be kinetic limited; that is, it has been
assumed that there are no mass and heat transfer limitations. Also, an isothermal temperature condition
was assumed in the membrane reactor. It is also important to note that in the model developed, the
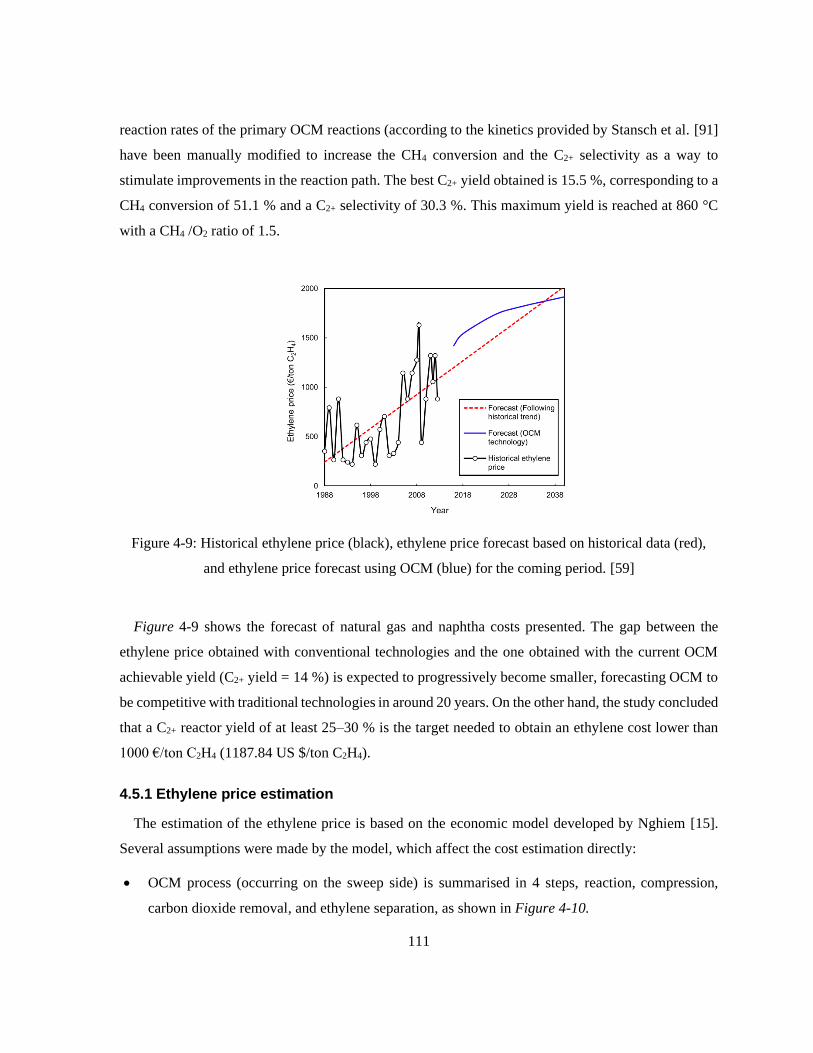
111
reaction rates of the primary OCM reactions (according to the kinetics provided by Stansch et al. [91]
have been manually modified to increase the CH4 conversion and the C2+ selectivity as a way to
stimulate improvements in the reaction path. The best C2+ yield obtained is 15.5 %, corresponding to a
CH4 conversion of 51.1 % and a C2+ selectivity of 30.3 %. This maximum yield is reached at 860 °C
with a CH4 /O2 ratio of 1.5.
Figure 4-9: Historical ethylene price (black), ethylene price forecast based on historical data (red),
and ethylene price forecast using OCM (blue) for the coming period. [59]
Figure 4-9 shows the forecast of natural gas and naphtha costs presented. The gap between the
ethylene price obtained with conventional technologies and the one obtained with the current OCM
achievable yield (C2+ yield = 14 %) is expected to progressively become smaller, forecasting OCM to
be competitive with traditional technologies in around 20 years. On the other hand, the study concluded
that a C2+ reactor yield of at least 25–30 % is the target needed to obtain an ethylene cost lower than
1000 €/ton C2H4 (1187.84 US $/ton C2H4).
4.5.1 Ethylene price estimation
The estimation of the ethylene price is based on the economic model developed by Nghiem [15].
Several assumptions were made by the model, which affect the cost estimation directly:
• OCM process (occurring on the sweep side) is summarised in 4 steps, reaction, compression,
carbon dioxide removal, and ethylene separation, as shown in Figure 4-10.
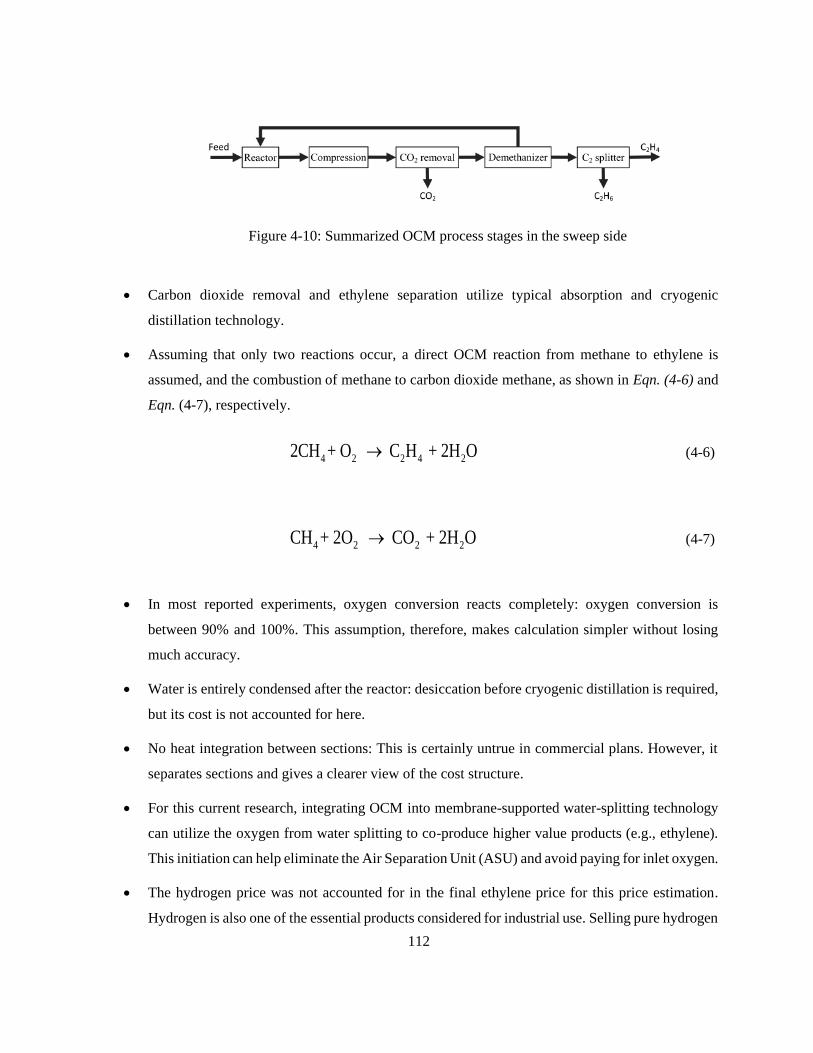
112
Figure 4-10: Summarized OCM process stages in the sweep side
• Carbon dioxide removal and ethylene separation utilize typical absorption and cryogenic
distillation technology.
• Assuming that only two reactions occur, a direct OCM reaction from methane to ethylene is
assumed, and the combustion of methane to carbon dioxide methane, as shown in Eqn. (4-6) and
Eqn. (4-7), respectively.
4 2 2 4 22CH + O C H + 2H O→
(4-6)
4 2 2 2CH + 2O CO + 2H O→
(4-7)
• In most reported experiments, oxygen conversion reacts completely: oxygen conversion is
between 90% and 100%. This assumption, therefore, makes calculation simpler without losing
much accuracy.
• Water is entirely condensed after the reactor: desiccation before cryogenic distillation is required,
but its cost is not accounted for here.
• No heat integration between sections: This is certainly untrue in commercial plans. However, it
separates sections and gives a clearer view of the cost structure.
• For this current research, integrating OCM into membrane-supported water-splitting technology
can utilize the oxygen from water splitting to co-produce higher value products (e.g., ethylene).
This initiation can help eliminate the Air Separation Unit (ASU) and avoid paying for inlet oxygen.
• The hydrogen price was not accounted for in the final ethylene price for this price estimation.
Hydrogen is also one of the essential products considered for industrial use. Selling pure hydrogen

113
as a by-product can reduce the target price/ton needed to make the OCM produced ethylene
industrially applicably. According to market sources [121], green hydrogen produced with
renewable resources costs between about $3/kg ($3000/ton) and $6.55/kg ($6550/ton). Fossil-
based hydrogen costs about $1.80/kg ($1800/ton).
4.5.2 Utility costs estimation
Utility costs are calculated according to Eqn. (4-8), developed by Ulrich et al. [122]. Natural gas is
chosen as fuel with an estimated price of $160.29/ton [15]. The water prices are estimated based on
water rates in Toronto, Canada [123]. The catalyst and membrane costing have been taken from e-
commerce websites, i.e., Alibaba [124–127].
(CE PCI)+b(C ) utility fuelC a=
(4-8)
Where,
▪ Cutility: the price of the utility, [$]
▪ Cfuel: the price of fuel, [$/GJ]
▪ CE PCI: plant cost dimensionless index [128]
▪ a and b: coefficients whose units depend on utility type.
4.5.2.1 Feed side utility costs
Table 4-9: Feed side utility costs
Utility Total cost
Inlet water
Electricity
$51.65/ton
$0.104/kWh
(1) Inlet water
Assuming 1 ton of water (1018.32 liters) is used as an inlet, the inlet water is the only oxygen source
in the membrane reactor model. It is injected into the reactor by an inert gas carrier. Therefore, the
oxygen incorporation/dissociation reaction or the forward/reverse water thermolysis reaction occurs.
(2) Electricity
For electricity, a = 1.3E-4 and b = 0.01. Electricity price calculated by Eqn.(4-8) is $0.104/kWh.

114
4.5.2.2 Sweep side utility costs
Table 4-10: Sweep side utility costs
Utility Total price
Catalyst
Membrane
Electricity
Methane
Refrigerant
$2.01/kg
$0.46/kg
$0.104/kWh
$160.29/ton
$43.51/GJ
(1) Catalyst
La2O3/CaO catalyst pricing was estimated by collecting data from online vendors. La2O3 powder
was found on Alibaba [129]. The cost of purified CaO is taken from the same source [129]. Table B -
1 shows the estimated total cost of the catalyst.
(2) Membrane
In order to estimate the total cost of the membrane (shown in Table B - 2), the average cost of all
the salts needed to synthesize 1 kg of the membrane in $/kg is collected from online vendors. The
amount to synthesize per kg of perovskite and the total weight of membrane needed are based on the
membrane designed by Wu et al. [37]. The actual cost of salt is calculated as the product of the average
cost and the amount required to synthesize 1 kg of perovskite. Lastly, the total cost is calculated using
Eqn. (4-9).
,Cmembrane salts membrane s membraneC W A=
(4-9)
Where,
▪ 𝐶𝑚𝑒𝑚𝑏𝑟𝑎𝑛𝑒 : total cost of the membrane, [$]
▪ 𝐶𝑠𝑎𝑙𝑡𝑠 : actual cost of salts, [$]
▪ 𝑊𝑚𝑒𝑚𝑏𝑟𝑎𝑛𝑒 : total weight of membrane needed, [kg/m2]
▪ 𝐴𝑠,𝑚𝑒𝑚𝑏𝑟𝑎𝑛𝑒 : total surface area of the membrane, [m2]

115
(3) Electricity
Similar to estimation on the feed side.
(4) Methane
Natural gas is chosen as fuel with an estimated price of $160.29/ton [15].
(5) Refrigerant
The total price is estimated using Eqn. (4-8). A = 0.6Q-0.9 T3 and b = 1.1x10⁶T5 with Q is cooling
capacity in kJ/s (maximum 1000), and T is the absolute temperature. Q is chosen as 1000 concerning
the scale of the OCM plant based on the Nghiem [15] model.
4.5.3 Operating costs estimation
Based on the simplified OCM process shown in Figure 4-10 and the assumption that only two
reactions occur, a direct OCM reaction from methane to ethylene is assumed, and methane to carbon
dioxide is the combustion, as shown in Eqn. (4-6) and Eqn. (4-7). The operating costs include reactions,
compression, carbon dioxide removal, ethylene separation, and ethane production. Table 4-11 shows
the summary of the operating costs calculations. The amount needed for every item is calculated based
on the inlet and outlet composition shown in Table B - 3.
Table 4-11: Operating costs summary
Item Price Amount Total cost in terms of ethylene [$]
Reactions
Methane
Compression
$160.29/t
[15]
$0.009/Nm3 [15]
2 4
8
7 C HS
2 4
2 4
222.4
C H
C H
Y
Y
−
2 4
183
C HS
2 4
14.47.2
C HY−
Carbon dioxide removal
Pump
Caustic wash
$1.3/t [15]
$6.49/t [15]
2 4
2 4
22 22
7
C H
C H
S
S
−
2 4 2 4
2 4
0.16 0.16 0.08C H C H
C H
X Y
Y
− +
2 4
4.094.09
C HS−
2 4 2 4
1.04 1.040.52
C H C HY S− +
Ethylene separation
Refrigerant $43.5/GJ
[15] 2 4
2 4
4.8 4.8
7
C H
C H
X
Y
−
2 4 2 4
30 30
C H C HY S−
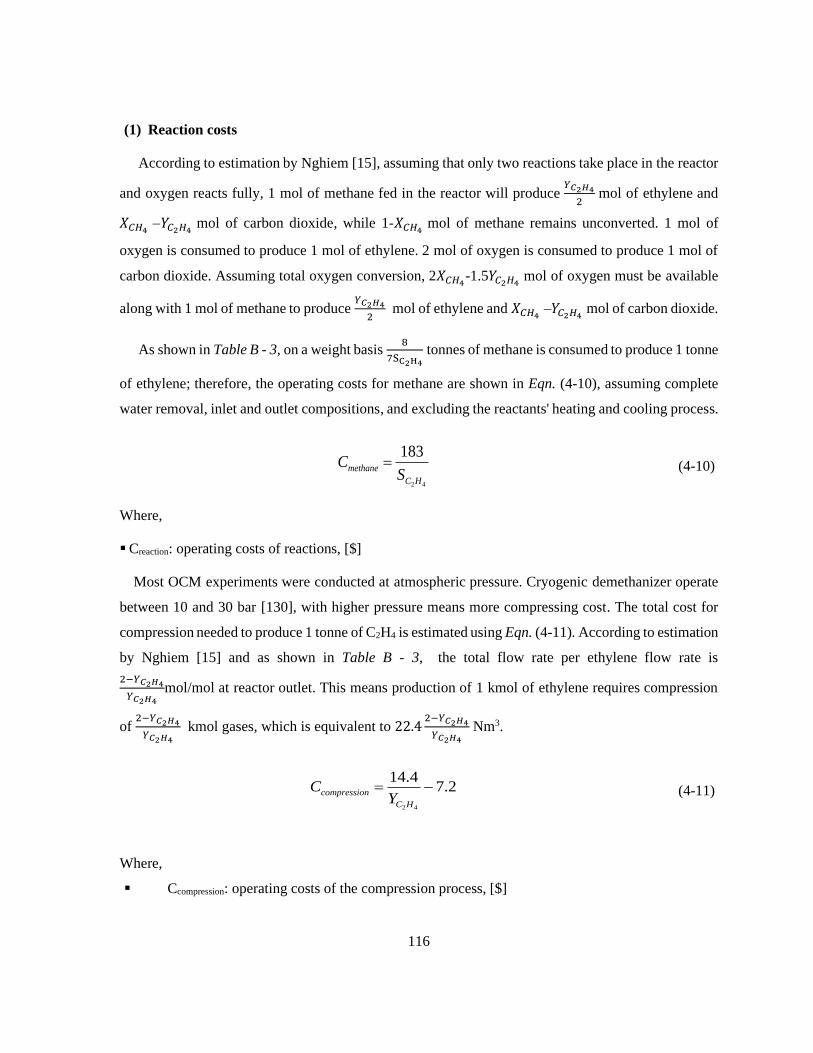
116
(1) Reaction costs
According to estimation by Nghiem [15], assuming that only two reactions take place in the reactor
and oxygen reacts fully, 1 mol of methane fed in the reactor will produce 𝑌𝐶2𝐻4
2 mol of ethylene and
𝑋𝐶𝐻4 –𝑌𝐶2𝐻4
mol of carbon dioxide, while 1-𝑋𝐶𝐻4 mol of methane remains unconverted. 1 mol of
oxygen is consumed to produce 1 mol of ethylene. 2 mol of oxygen is consumed to produce 1 mol of
carbon dioxide. Assuming total oxygen conversion, 2𝑋𝐶𝐻4-1.5𝑌𝐶2𝐻4
mol of oxygen must be available
along with 1 mol of methane to produce 𝑌𝐶2𝐻4
2 mol of ethylene and 𝑋𝐶𝐻4
–𝑌𝐶2𝐻4 mol of carbon dioxide.
As shown in Table B - 3, on a weight basis 8
7SC2H4
tonnes of methane is consumed to produce 1 tonne
of ethylene; therefore, the operating costs for methane are shown in Eqn. (4-10), assuming complete
water removal, inlet and outlet compositions, and excluding the reactants' heating and cooling process.
2 4
183methane
C H
CS
=
(4-10)
Where,
▪ Creaction: operating costs of reactions, [$]
Most OCM experiments were conducted at atmospheric pressure. Cryogenic demethanizer operate
between 10 and 30 bar [130], with higher pressure means more compressing cost. The total cost for
compression needed to produce 1 tonne of C2H4 is estimated using Eqn. (4-11). According to estimation
by Nghiem [15] and as shown in Table B - 3, the total flow rate per ethylene flow rate is
2−𝑌𝐶2𝐻4
𝑌𝐶2𝐻4
mol/mol at reactor outlet. This means production of 1 kmol of ethylene requires compression
of 2−𝑌𝐶2𝐻4
𝑌𝐶2𝐻4
kmol gases, which is equivalent to 22.42−𝑌𝐶2𝐻4
𝑌𝐶2𝐻4
Nm3.
2 4
14.47.2compr i
C
ess n
H
oCY
−=
(4-11)
Where,
▪ Ccompression: operating costs of the compression process, [$]
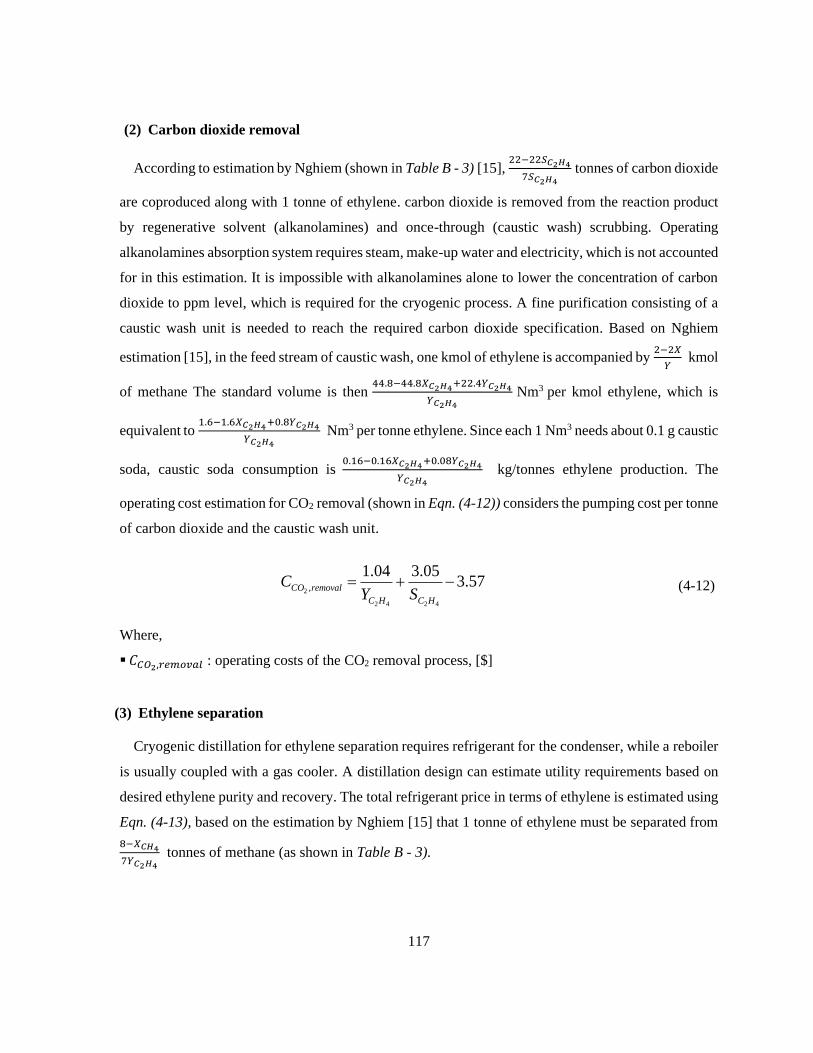
117
(2) Carbon dioxide removal
According to estimation by Nghiem (shown in Table B - 3) [15], 22−22𝑆𝐶2𝐻4
7𝑆𝐶2𝐻4
tonnes of carbon dioxide
are coproduced along with 1 tonne of ethylene. carbon dioxide is removed from the reaction product
by regenerative solvent (alkanolamines) and once-through (caustic wash) scrubbing. Operating
alkanolamines absorption system requires steam, make-up water and electricity, which is not accounted
for in this estimation. It is impossible with alkanolamines alone to lower the concentration of carbon
dioxide to ppm level, which is required for the cryogenic process. A fine purification consisting of a
caustic wash unit is needed to reach the required carbon dioxide specification. Based on Nghiem
estimation [15], in the feed stream of caustic wash, one kmol of ethylene is accompanied by 2−2𝑋
𝑌 kmol
of methane The standard volume is then 44.8−44.8𝑋𝐶2𝐻4+22.4𝑌𝐶2𝐻4
𝑌𝐶2𝐻4
Nm3 per kmol ethylene, which is
equivalent to 1.6−1.6𝑋𝐶2𝐻4+0.8𝑌𝐶2𝐻4
𝑌𝐶2𝐻4
Nm3 per tonne ethylene. Since each 1 Nm3 needs about 0.1 g caustic
soda, caustic soda consumption is 0.16−0.16𝑋𝐶2𝐻4+0.08𝑌𝐶2𝐻4
𝑌𝐶2𝐻4
kg/tonnes ethylene production. The
operating cost estimation for CO2 removal (shown in Eqn. (4-12)) considers the pumping cost per tonne
of carbon dioxide and the caustic wash unit.
2
2 4 2 4
,
1. 304 .053.57CO removal
C H C H
CY S
= + −
(4-12)
Where,
▪ 𝐶𝐶𝑂2,𝑟𝑒𝑚𝑜𝑣𝑎𝑙 : operating costs of the CO2 removal process, [$]
(3) Ethylene separation
Cryogenic distillation for ethylene separation requires refrigerant for the condenser, while a reboiler
is usually coupled with a gas cooler. A distillation design can estimate utility requirements based on
desired ethylene purity and recovery. The total refrigerant price in terms of ethylene is estimated using
Eqn. (4-13), based on the estimation by Nghiem [15] that 1 tonne of ethylene must be separated from
8−𝑋𝐶𝐻4
7𝑌𝐶2𝐻4
tonnes of methane (as shown in Table B - 3).

118
2 4
2 4 2 4
,
30 30CC H seperation
C H C HY S= −
(4-13)
Where,
▪ 𝐶𝐶2𝐻4,𝑠𝑒𝑝𝑒𝑟𝑎𝑡𝑖𝑜𝑛 : operating costs of ethylene separation, [$]
(4) Ethane production
The formation of ethane reduces compression and carbon dioxide removal costs because volumetric
flow rate and carbon dioxide are reduced, but the cost of C2+ fractionation is added (estimated to be
80𝑆𝐶2𝐻6
𝑆𝐶2𝐻4
by Nghiem [15]). Ethane and ethylene have similar properties and can be considered the same
in carbon dioxide absorption and demethanizer sections. Therefore, operating cost per unit C2+ can be
obtained by replacing 𝑆𝐶2𝐻4 and 𝑌𝐶2𝐻4
by 𝑆𝐶2+ and 𝑌𝐶2+
.As operating pressure and temperature are
fixed, a simple equation for estimating the total ethylene price based on the above can be drawn (shown
in Eqn. (4-14)). The equation also considers the formation of ethane, as discussed in the previous
section.
2 6
2 2 2 4
2
2 4
C45.44 156.05
10.77 80C H
ethylene
C C C H C H
C S
Y
S
S S S+ +
+ += −+
(4-14)
Where,
▪ 𝐶𝑒𝑡ℎ𝑦𝑙𝑒𝑛𝑒 : total ethylene price, [$]
4.5.4 Total ethylene price estimation and the required C2+ yield
The total C2H4 price is estimated based on the utilities and operating costs. Based on the cost
estimation, the operating cost depends primarily on yield and selectivity. Based on the Eqn. (4-14) and
using the base case results of 87.01 % of C2+ selectivity, 1.76 % of C2+ yield, 20.72 % of C2H4
selectivity, and 66.29 % of C2H6 selectivity, the total estimated price of C2H4 is 2971.88 US $/ton C2H4.
An increase in both the C2H4 yield and selectivity is required in order to achieve a more industrially
favorable C2H4 price.
Based on the Eqn. (4-14), around 25 % of C2+ yield and 22 % of C2+ selectivity are needed to
maintain the overall ethylene price of around 1128.99 US $/ton of C2H4, which is below the industrial
limit set by Cruellas et al. [59] techno-economics model.
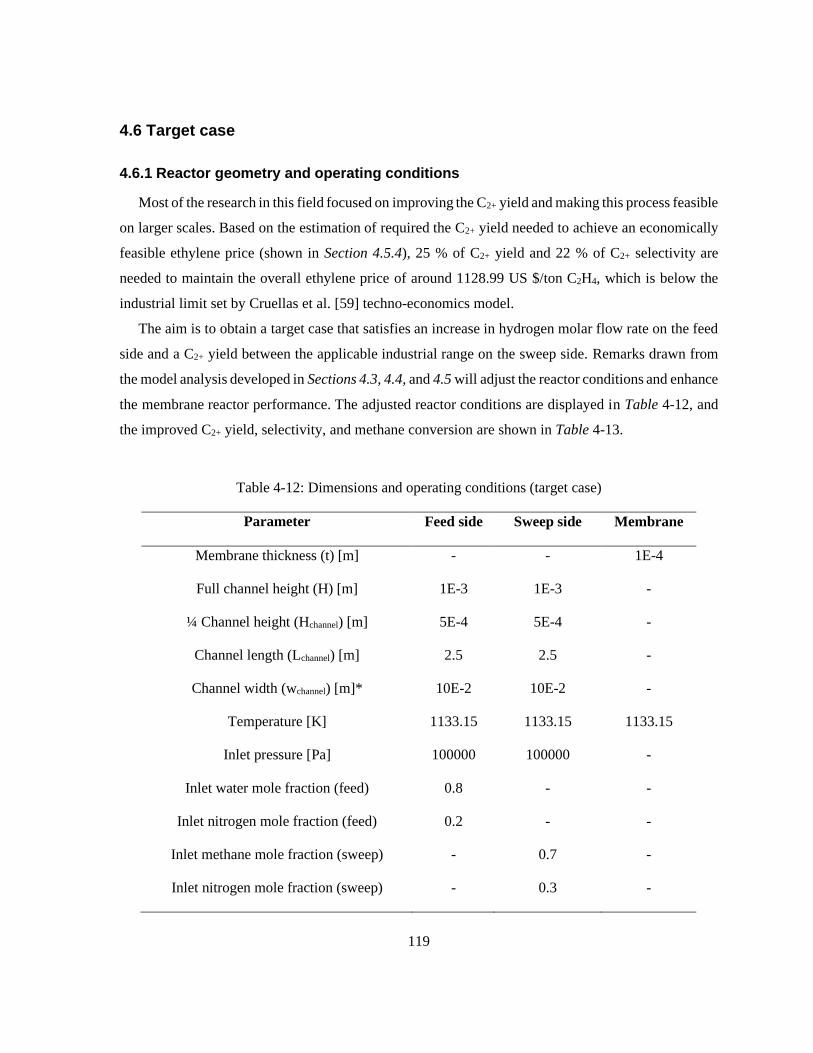
119
4.6 Target case
4.6.1 Reactor geometry and operating conditions
Most of the research in this field focused on improving the C2+ yield and making this process feasible
on larger scales. Based on the estimation of required the C2+ yield needed to achieve an economically
feasible ethylene price (shown in Section 4.5.4), 25 % of C2+ yield and 22 % of C2+ selectivity are
needed to maintain the overall ethylene price of around 1128.99 US $/ton C2H4, which is below the
industrial limit set by Cruellas et al. [59] techno-economics model.
The aim is to obtain a target case that satisfies an increase in hydrogen molar flow rate on the feed
side and a C2+ yield between the applicable industrial range on the sweep side. Remarks drawn from
the model analysis developed in Sections 4.3, 4.4, and 4.5 will adjust the reactor conditions and enhance
the membrane reactor performance. The adjusted reactor conditions are displayed in Table 4-12, and
the improved C2+ yield, selectivity, and methane conversion are shown in Table 4-13.
Table 4-12: Dimensions and operating conditions (target case)
Parameter Feed side Sweep side Membrane
Membrane thickness (t) [m]
Full channel height (H) [m]
¼ Channel height (Hchannel) [m]
Channel length (Lchannel) [m]
Channel width (wchannel) [m]*
Temperature [K]
Inlet pressure [Pa]
Inlet water mole fraction (feed)
Inlet nitrogen mole fraction (feed)
Inlet methane mole fraction (sweep)
Inlet nitrogen mole fraction (sweep)
-
1E-3
5E-4
2.5
10E-2
1133.15
100000
0.8
0.2
-
-
-
1E-3
5E-4
2.5
10E-2
1133.15
100000
-
-
0.7
0.3
1E-4
-
-
-
-
1133.15
-
-
-
-
-

120
Volumetric flow rate [STP][m3/s]
Space time [kg s/m3]
Catalyst density
Porosity
Total catalyst mass [kg]
Total membrane surface area [m2]
Catalyst per membrane surface area
[kg/m2]
7.5E-6
-
-
-
-
-
-
7.5E-6
60
3600
0.999
4.5E-4
-
1.8E-3
-
-
-
-
-
2.5E-1
-
* Channel width is equal to the membrane width based on the reactor schematic
4.6.2 Model outputs (target case)
As shown in Table 4-12, the membrane thickness is decreased to 1E-4 m (100 microns) compared
to 9E-4 m for the base case. It was found that decreasing the membrane thickness positively impacts
the Jv due to the inverse relationship between the two parameters, as shown in Eqn. (3-14). The channel
height is decreased to 5E-4 m compared to 1E-3 m for the base case; this corresponds to an entire
channel height of 1 mm, which is engineerable. It also complies with the conclusion drawn in the
systematic analysis about altering the channel height on the C2+ yield, presented in Section 4.3.1.2. The
channel length increases to 2.50 m compared to 1.50 m for the base case; the increase in channel length
complies with the systemic analysis conclusion. The increasing channel length positively impacts the
C2+ yield and the overall membrane reactor performance, as presented in Section 4.3.1.1. The channel
length chosen for the target case also lies in the length range reported in the literature [120].
The isothermal temperature applied to the target case is 1133.15 K, slightly higher than 1103.3 K,
which is the temperature applied for the base case. Even though the increase is slight, the alternation
aligns with the systematic analysis conclusion about the effect of the isothermal temperature on the C2+
yield. It was found that the reactor starts to favor the formation of the COx yield rather than the higher
hydrocarbons at higher temperatures for the altered reactor conditions and dimensions, which is
investigated further in Section 4.6.3. The pressure chosen is 1E+5 Pa (or 1 bar), which is equivalent to
the absolute pressure at the STP condition, and it is consistent with the base case model and the

121
La2O3/CaO catalyst model developed in Chapter 3. The concentration of the inlet species in both the
feed and sweep sides are based on the micro catalytic model developed by Stansch et al. [91].
Space-time increases from 1.86 to 60 kg s/m3, aligning with the systematic analysis conclusion
shown in Section 4.3.2 while being the range specified in the model developed by Stansch et al. [91].
Increasing the space-time means increasing the time for the number of species that take up the specified
control volume to enter or completely exit the reactor. In other words, the species, primarily methane
and oxygen, have more time to react and convert into C2+, which is why an increase in the C2+ is
noticeable.
Catalyst porosity is decreased compared to the base case. The catalyst porosity directly impacts the
total catalyst mass per membrane surface are used on the sweep side. As concluded from the systematic
analysis, decreasing the porosity increased the catalyst mass, which increased the methane conversion
and the C2+ yield.
Table 4-13 and Table 4-14 show species concentration and membrane reactor performance criteria.
The increase in channel length, isothermal temperature, space-time, and decreased membrane thickness
lead to a 50 % increase in methane conversion between the base and target cases. These observations
can be related to the concluded effects drawn from the systematic analysis presented in Section 4.3. The
increase in methane conversion directly impacts the C2+ yield due to the direct relationship between the
two quantities. This enhanced methane conversion increase led to a 23.73 % absolute percentage
increase in the yield value between the two cases, allowing the targe case to achieve the economic
yield limit specified of 25-30 % by Cruellas et al. [59] and also surpasses the economic C2+ yield and
selectivity (estimated in Section 4.5.4) of 25 % yield and 22 %, respectively. The increase in methane
conversion led to increased COx yield, which is expected due to their mathematical relationship.

122
Table 4-13: Species concentration in the feed and sweep channels (target case)
Concentration [mol/m3] Inlet Outlet
ṅ (H2O)feed
ṅ (H2)feed
ṅ (O2)sweep
ṅ (CH4)sweep
ṅ (C2H4)sweep
ṅ (H2O)sweep
ṅ (C2H6)sweep
ṅ (H2)sweep
ṅ (CO2)sweep
ṅ (CO)sweep
32.07
0
0
28.06
0
0
0
0
0
0
1.63
30.44
0.41
13.24
3.36
16.09
0.22
5.88
6.18
1.79
*Nitrogen concentration [mol/m3] is 30.44 for feed and 12.03 for sweep
Table 4-14: Sweep side species conversion, selectivity, and yield values (target case)
Species
𝑿𝑶𝟐
[%]
𝑿𝑪𝑯𝟒
[%]
Selectivity
[%]
Yield
[%]
O2
CH4
C2H4
C2H6
C2+
CO2
CO
COx
97.34
-
-
-
-
-
-
-
-
52.78
-
-
-
-
-
-
-
-
45.32
2.98
48.30
39.65
12.05
51.70
-
-
23.92
1.57
25.49
20.93
6.36
27.29

123
Table 4-13 shows the hydrogen molar flow rate on the feed side-channel outlet produced as a result
of the water-splitting process in the feed side channel and also on the sweep side-channel outlet
produced as a result of nonselective oxidation of methane to carbon monoxide (reaction 3), thermal
gas-phase dehydrogenation of ethane (reaction 7) and the water-gas-shift reaction (reaction 9). There
is an increase in the produced hydrogen for the target case compared to the base case. The increase can
be related to various altered factors between the two scenarios. Altering the reactor dimension between
the two cases can explain the noticeable increase in hydrogen production, significantly increasing
channel length and space-time, allowing the water more time and volume to split into oxygen and
hydrogen. On the sweep side, the concentration of hydrogen exhibited a dependence on the space-time
that was very similar to the one observed for carbon monoxide. In addition, the increase in isothermal
temperature led to an overall increase in the reaction rates for the target case, which led to increasing
the concentration of hydrogen.
Table 4-15: Mass balance (target case)
Mass flow rate [g/s] Inlet Outlet Difference
Total feed mass flow rate
Total sweep inlet mass flow rate
6.02E-3
5.90E-3
2.37E-3
9.55E-3
3.65E-3
3.65E-3
Tolerances applied to the target case are similar to tolerances applied to the base case, which are 1E-
14 for the absolute tolerance and 1E-7 for the relative tolerances. Lastly, similar to the base case
scenario, a mass flow rate balance is conducted to validate the mass balance of the model, as shown in
Table 4-15.

124
4.6.2.1 Species concentration along the feed and sweep channels
In order to have a better understanding of the target case, species concentration along the feed and
sweep channels is illustrated in this section. The feed channel species concentrations are shown in
Figure 4-11, while the sweep channel species concentrations are shown in Figure 4-12. The
concentration of all the species is calculated based on the molar flow rate and the total volumetric flow
rate, as shown in Eq. (4-15).
ii
nC
V
= (4-15)
Where,
▪ Ci: concentration of species ‘i’, [mol/m3]
▪ ni: molar flow rate of species ‘i’, [mol/s]
▪ ��: volumetric flow rate, [m3/s]
As shown in Figure 4-11 (a), water serves as the oxygen source, and a water thermolysis reaction
takes place on the feed side channel (high P(O2)), specifically on the membrane surface. The
heterogeneous water thermolysis on the LCF-91 membrane results in hydrogen and lattice oxygen
production, as shown in Eq.(2-6). The decreasing water concentration trend along the reactor length
correlates with the hypothesis and corresponds with the water-splitting process mechanism.
Figure 4-11(b) shows an increasing concentration trend of hydrogen along the feed side channel
length. The hydrogen-oxygen bonds break either on the membrane surface (heterogeneously) or in the
gas phase (homogeneously). Next, the hydrogen radicals recombine into hydrogen molecules carried
away by the feed gas.
Figure 4-11 (c) shows that nitrogen is an inert carrier gas to carry the desired amount of water into
the feed side chamber. Nitrogen is an inert gas that does not get involved in the reaction; its
concentration does not change along the reactor length.

125
(a) (b)
(c)
Figure 4-11: Feed channel species concentrations along reactor length (a) H2O concentration (b) H2
concentration (c) N2 concentration (target case reactor geometry and operating conditions)
Figure 4-12 (a) and (b) show the oxygen and methane concentration along the sweep side channel
length. The oxygen concertation shows a gradual increase at the channel's beginning, which
corresponds to the oxygen permeation process through the membrane. The oxygen starts to be
consumed afterward during the OCM process. The gradual increase in oxygen concentration seen
between 0.5 to 2.5 m can be linked to the decrease in the destruction rate of oxygen, which is caused
by the decrease in reaction rates 1,2,3,4, and 5. The entire oxygen trend on the sweep side channel will
be investigated in Section 4.6.4. Methane and nitrogen are fed into the sweep side channel. The methane
concentration shows a gradually decreasing trend that indicates its consumption and shows the
influence of methane on the rate of consecutive selective reactions.
Figure 4-12 (c) and (e) show the C2+ concentrations along the sweep side channel length. The course
of ethane concentration indicates that this component is formed as a primary product of the OCM
reaction. It also shows how consecutive reactions strongly influence ethane. The dependence of the
ethylene concentration on the ethane yield confirms the generally accepted thesis that ethylene is
formed in a consecutive reaction of ethane as a result of heterogeneous catalytic oxidative
0
10
20
30
40
0 0.5 1 1.5 2 2.5 3
C(H
2O
) [m
ol/
m3]
Reactor length [m]
C(H2O) [mol/m^3]
0
10
20
30
40
0 0.5 1 1.5 2 2.5 3
C(H
2) [
mo
l/m
3]
Reactor length [m]
C(H2) [mol/m^3]
0
2
4
6
8
10
0 0.5 1 1.5 2 2.5 3
C(N
2) [
mo
l/m
3 ]
Reactor length [m]
C(N2) [mol/m^3]

126
dehydrogenation of ethane (reaction 5) and indicates that ethylene also is an intermediate product of
the OCM reaction.
Figure 4-12 (d) shows an increasing trend of H2O on the sweep side channel. H2O is considered one
of the primary products due to the OCM reaction. The increase of water concentration in the channel
can dilute the system, increasing the conversion of reactant and C2+ yield.
Figure 4-12 (f) and (h) show the increasing COx concentration along the sweep side channel length.
The steep gradient of the COx concentrations indicates that these components are formed as a primary
product of the OCM reaction. The presence of CO2 in the mixture inhibits the overall catalytic reaction
rate and may cause a drop in conversion, selectivity, and yield.
Figure 4-12 (g) shows an increasing hydrogen concentration along the sweep side channel length.
Hydrogen is produced on the sweep side as a result of nonselective oxidation of methane to carbon
monoxide (reaction 3), thermal gas-phase dehydrogenation of ethane (reaction 7), and the water-gas-
shift reaction (reaction 9). The yield of hydrogen exhibited was very similar to the one observed for
carbon monoxide, which was also reported by Stansch et al. [91].
Figure 4-12 (i) shows the nitrogen concentration along the sweep side channel length. Nitrogen
carries the task of controlling the temperature in the reactor and overcoming the challenge of hot spot
formation since OCM is a highly exothermic reaction. Similar to the feed side channel, Nitrogen does
not get involved in the reaction; that is why its concentration does not change along the reactor length.
(a) (b)
0
0.1
0.2
0.3
0.4
0.5
0 0.5 1 1.5 2 2.5 3
C(O
2) [
mo
l/m
3 ]
Reactor length [m]
C(O2) [mol/m^3]0
10
20
30
0 0.5 1 1.5 2 2.5 3
C(C
H4)
[m
ol/
m3 ]
Reactor length [m]
C(CH4) [mol/m^3]

127
(c) (d)
(e) (f)
(g) (h)
(i)
Figure 4-12 : Sweep channel species concentrations along reactor length (a) O2 concentration (b) CH4
concentration (c) C2H4 concentration (d) H2O concentration (e) C2H6 concentration (f) CO2
concentration (g) H2 concentration (h) CO concentration (i) N2 concentration (target case reactor
geometry and operating conditions)
0
1
2
3
4
0 0.5 1 1.5 2 2.5 3
C(C
2H
4)
[mo
l/m
3]
Reactor length [m]
C(C2H4) [mol/m^3]0
5
10
15
20
0 0.5 1 1.5 2 2.5 3
C(H
2O
) [m
ol/
m3]
Reactor length [m]
C(H2O) [mol/m^3]
0
0.1
0.2
0.3
0.4
0 0.5 1 1.5 2 2.5 3
C(C
2H6)
[m
ol/
m3 ]
Reactor length [m]
C(C2H6) [mol/m^3]0
2
4
6
8
0 0.5 1 1.5 2 2.5 3
C(C
O2)
[m
ol/
m3 ]
Reactor length [m]
C(CO2) [mol/m^3]
0
2
4
6
8
0 0.5 1 1.5 2 2.5 3
C(H
2) [
mo
l/m
3 ]
Reactor length [m]
C(H2) [mol/m^3]0
1
1
2
2
0 0.5 1 1.5 2 2.5 3
C(C
O)
[mo
l/m
3 ]
Reactor length [m]
C(CO) [mol/m^3]
0
5
10
15
0 0.5 1 1.5 2 2.5 3
C(N
2) [
mo
l/s]
Reactor length [m]
C(N2) [mol/m^3]

128
4.6.3 Effect of isothermal temperature on C2+ yield, methane conversion, and COx
yield (target case)
(a) (b)
(c)
Figure 4-13 : Effect of altering isothermal temperature on (a) methane conversion, (b) C2+ yield (c)
COx selectivity (target case) (isothermal condition, pressure drop applied, target case reactor
dimensions, space time : 60 kg s/m3 and VSTP(feed & sweep) : 7.50E-6 m3/s)
The effect of isothermal temperature on the C2+ yield, methane conversion, and COx was examined
for the target case reactor dimensions and conditions. Figure 4-13 (a) shows that methane conversion
increases with the isothermal temperature from 11.07 % in case 1 to 52.78 % in the target case.
Target case, 52.78%
0%
10%
20%
30%
40%
50%
60%
1000 1050 1100 1150 1200 1250
Met
han
e co
nve
rsio
n [
%]
Temperture [K]
Target case, 25.49%
0%
5%
10%
15%
20%
25%
30%
1000 1050 1100 1150 1200 1250
C2+
yiel
d [
%]
Temperture [K]
Target case, 51.70%
0%
10%
20%
30%
40%
50%
60%
70%
1000 1050 1100 1150 1200 1250
CO
xse
lect
ivit
y [%
]
Temperture [K]

129
However, there is a noticeable drop in methane conversion from 52.78 % in the target case to 38.92 %
in case 4.
Figure 4-13(b) shows a similar trend of altering isothermal temperature on C2+ yield. The temperature
increase from 1003.15 to 1133.15 K shows an increase in C2+ yield from 9.95 % to 25.49 % (target case
C2+ yield), which is expected due to the increase in methane conversion at the specified temperatures.
The increase in methane conversion is caused by the increase in the reaction rates due to elevated
temperatures, which increases the formation rates and eventually increases the conversion rate of
methane. The direct relationship between C2+ yield and methane conversion explains the increase in
C2+ yield at specified temperatures. There is a significant drop in the methane conversion and the C2+
yield at temperatures above 1133.15 K. The drop is due to the prevailing CH4 combustions at higher
temperatures, thus hampering the achievement of high selectivity towards the desired result products.
The drop is also accompanied by an increase in the COx selectivity shown in Figure 4-13 (c). At the
specified temperatures, oxidation of C2+ started to predominate, and the reactor started to favor the
formation of COx rather than higher hydrocarbons. Higher reactor temperatures were not applied to the
target case to increase the methane conversion.
4.6.4 Oxygen concentration along the membrane on the sweep side
In this section, the oxygen trend along the reactor length is investigated. It is essential to investigate
how oxygen is consumed along the sweep side channel. It would clarify how functional the membrane
permeates the oxygen from the feed side to the sweep side.
Figure 4-14: Oxygen molar flow rate trend vs. channel length
0E+0
5E-7
1E-6
2E-6
2E-6
3E-6
3E-6
4E-6
0 0.5 1 1.5 2 2.5 3
n(O
2) [
mo
l/s]
Channel length [m]
*Isothermal condtion*Pressure drop applied*Non-fixed dx *Abs tolerance = 1E-14 , Rel tolerance = 1E-7
Initial trend
3
2
1
1
2
3
Peak
Valley

130
Figure 4-14 shows the oxygen molar flow rate trend along the reactor length. This section will
investigate the initial increasing trend, the formation of the peak trend, and the valley. The three
highlighted sections in Figure 4-14 correspond to the investigated iterations.
4.6.4.1 Initial trend
The increase in the oxygen molar flow rate trend (starting from 0 to 1.22E-5 m) is annotated in
Figure 4-14 as (1). In order to understand why the peak trend starts formulating around the highlighted
reactor length, it is crucial to study the change in variables such as the change in oxygen molar flow
rate (∆��𝑂2), the destruction rate (��𝑂2
), and oxygen flux (𝐽𝑂2) which affects the oxygen trend directly.
The ∆��𝑂2 is directly affected by the ��𝑂2
and 𝐽𝑂2 Along the reactor length as shown in Section 3.3.3.1.
The variation of these parameters at the specified reactor length is presented in Table C - 1.
As shown in Table C - 1, the ��𝑂2 is lower than the 𝐽𝑂2
before the peak position, which results in a
positive ∆��𝑂2 which affects the oxygen trend positively and results in an increasing trend. In order to
investigate the trend that the ��𝑂2 follows it is important to look at the reaction rates which directly
impact the ��𝑂2as shown in Section 3.3.3.1. The reaction rates for the specified iterations are shown in
Table C - 2. ��𝑂2 shows an increasing trend because all the reaction rates increase along with the
specified iterations. The increase in the reaction rates is due to the species' partial pressures, shown in
Table C - 3.
Table 4-16: Reaction order for methane oxidation reactions (1, 2 and 3)
Reaction mu nu
4 2 2 2Step 1 : CH + 2O CO + 2H O→ 0.24 0.76
4 2 2 6 2Step 2 : 2CH + 0.5O C H + H O→ 1 0.4
4 2 2 2Step 3 : CH + O CO + H O + H→ 0.57 0.85
The partial pressure of methane (PCH4) is the only partial pressure showing a decreasing trend along
with the specified iterations, which is expected. The methane is being consumed gradually as a primary
reactant for the OCM process. The decrease in the PCH4 affects reactions 1, 2, and 3 according to the
Hougen-Watson rate and Power-Law rate equations shown in Section 3.3.3.1. However, reactions 1
and 3 still show an increasing trend because of the increase in the partial pressure of oxygen (PO2)

131
which has a higher reaction order, as shown in Table 4-16. For reaction 2, the rate at which the PO2
increases is 24.76 % which is significantly higher than the rate at which PCH4decreases which is around
3.84E-5%, and that is why the overall reaction two trends still increase.
To conclude this section, the initial increasing trend occurs due to the increase in most species'
formation rates along with the specified iteration, showcased by the increase in the partial pressures
of the sweep side species.
4.6.4.2 Peak
The peak trend (4.95E-2 and 5.96E-2 m) is annotated in Figure 4-14 as (2) oxygen molar flow rates
that form the peak trend along the reactor length. Similar to the previous section, it is crucial to study
the change in variables such as the change in oxygen molar flow rate (closely ∆��𝑂2), the destruction
rate (��𝑂2), and oxygen flux (𝐽𝑂2
) which affects the oxygen trend directly. The variation of these
parameters at the specified reactor length is presented in Table C - 4. Similar to the initial trend section
the ��𝑂2 is lower than the 𝐽𝑂2
before the peak position, which results in a positive ∆��𝑂2 which affects
the oxygen trend positively and results in an increasing trend. After the peak, the ��𝑂2 is higher than the
𝐽𝑂2.This trend results in a negative ∆��𝑂2
which affects the oxygen trend negatively and results in a
decreasing trend. The methane oxidation reactions (1, 2, and 3) and CO, C2H6, and C2H4 oxidation
reactions (4, 5, and 6) are examined because they affect the ��𝑂2 directly, as shown in Section 3.5.2.1.
As shown in Table C - 5, ��𝑂2 increases before the peak because all the reaction rates increase.
However, some reaction rates increase after the peak, and some do not.
• Methane oxidation reactions (1, 2, and 3) have an increasing trend before the peak and a decreasing
trend after the peak
• CO, C2H6, and C2H4 oxidation reactions (4, 5, and 6) have an increasing trend before the peak and
also an increasing trend after the peak
The increase in CO, C2H6, and C2H4 oxidation reactions (4, 5, and 6) rates has a more significant
impact on the ��𝑂2seeing as the overall value increases after the peak. The partial pressures values of
the sweep side species are investigated to understand why some of the reaction rates fluctuate around
the peak point,

132
After the peak, the drop in the oxygen and methane partial pressures slowed down methane oxidation
reactions (1, 2, and 3). At the same time, the increase in CO, C2H6, and C2H4 oxidation reactions (4, 5,
and 6) is due to the increase in the partial pressures of CO, C2H6, and C2H4, respectively. Even with the
drop in the oxygen partial pressure along the reactor length (especially after the peak), the increase of
the species mentioned is higher due to their higher reaction order, as shown in Table 4-17.
Table 4-17 : Reaction order for CO, C2H6, and C2H4 oxidation reactions
Reaction mu nu
2 2Step 4 : CO + 0.5O CO→ 1.00 0.55
2 6 2 2 4 2Step 5: C H + 0.5O C H + H O→ 0.95 0.37
2 4 2 2Step 6 : C H + 2O 2CO + 2H O→ 1.00 0.96
Lastly, the gradual decrease of the 𝐽𝑂2 Along the reactor, length is investigated to determine why
this occurs along the specified reactor length. According to Eqn. (3-18), the oxygen flux is directly
affected by the total concentration of sweep-side oxygen, and the feed-side consumed water.
As shown in Table C - 7, the oxygen concentration increases before the peak due to the increase in
the molar flow rate of oxygen due to the positive ∆��𝑂2. This increase reduces the potential chemical
term due to the inverse relationship between the two parameters, which lowers the vacancy and oxygen
flux, as shown in the presented data. After the peak, the oxygen concentration decreases due to the
decrease in the molar flow rate of oxygen due to the negative ∆��𝑂2. This decrease boosts the potential
chemical term; however, the vacancy flux and the oxygen flux terms still decrease due to the surface
reaction resistance on the feed side (Rf) and surface reaction resistance on the sweep side (Rs).
The decrease of the surface reaction resistances in the feed and sweep sides are due to the constant
decrease in the molar flow rate of water on the feed side and the decrease in oxygen molar flow rate on
the sweep side. In conclusion, the formation of the peak is due to two main reasons:
(1) The gradual decrease of the 𝐽𝑂2 along the reactor length
a. The increase in the oxygen concentration on the sweep side-channel and the decrease in the
concertation of water on the feed side-channel

133
b. The oxygen flux drops along the channel, and as both water and methane concentrations decrease
along the membrane, the potential chemical difference for the oxygen permeation becomes
smaller. As a result, the oxygen flux at the channel outlet is lower than the values at the inlet.
(2) The increase in the destruction rate of oxygen ��𝑂2
a. The increase in CO, C2H6, and C2H4 oxidation reactions (4, 5, and 6), respectively, after the peak,
is caused due to the increase of CO, C2H6, and C2H4 partial pressures, in addition to a higher impact
on the WO2 due to higher reaction order
4.6.4.3 Valley
The gradual increasing trend annotated in Figure 4-14 as (3) is investigated in this section. As
shown in Table C - 8, the ∆��𝑂2 turns positive after the iteration indicated. The reason behind the ∆��𝑂2
from negative to positive is that the 𝐽𝑂2at this position starts to be greater than the ��𝑂2
, even though
the two parameters are decreasing. This observation means that the rate at which oxygen is added to
the sweep side is more than the rate the OCM process consumes it.
Similar to the previous section, the reaction rates 1, 2, 3, 4, 5, and 6 are examined because of their
direct effect on the ��𝑂2 . In order to explain the reason behind the drop-in ��𝑂2 reaction rates were
examined and presented in Table C - 9.
The partial pressures for the sweep side species along the specified iterations are examined and
presented in Table C - 10. Similar to the previous sections, the partial pressures will clarify the reaction
rates trends obtained. As shown in Table C - 9, the drop-in reaction rates 1, 2, 3, and 5 after the indicated
iteration indicate why there is a drop in the ��𝑂2.
• Reaction 1 rate: decreases due to the decrease in 𝑃𝑂2 and 𝑃𝐶𝐻4
.
• Reaction 2 rate: decreases due to the decrease in 𝑃𝑂2 and 𝑃𝐶𝐻4
.
• Reaction 3 rate: decreases due to a decrease in 𝑃𝑂2 and 𝑃𝐶𝐻4
.
• Reaction 4 rate: increases due to the increase of the 𝑃𝐶𝑂 while having a higher reaction order than
𝑃𝑂2which decreases along the reaction length.
• Reaction 5 rate: decreases due to the decrease of both 𝑃𝐶2𝐻6 and 𝑃𝑂2
.
• Reaction 6 rate: increases due to the increase of the 𝑃𝐶2𝐻4 while having a higher reaction order
than 𝑃𝑂2which decreases along the reaction length.
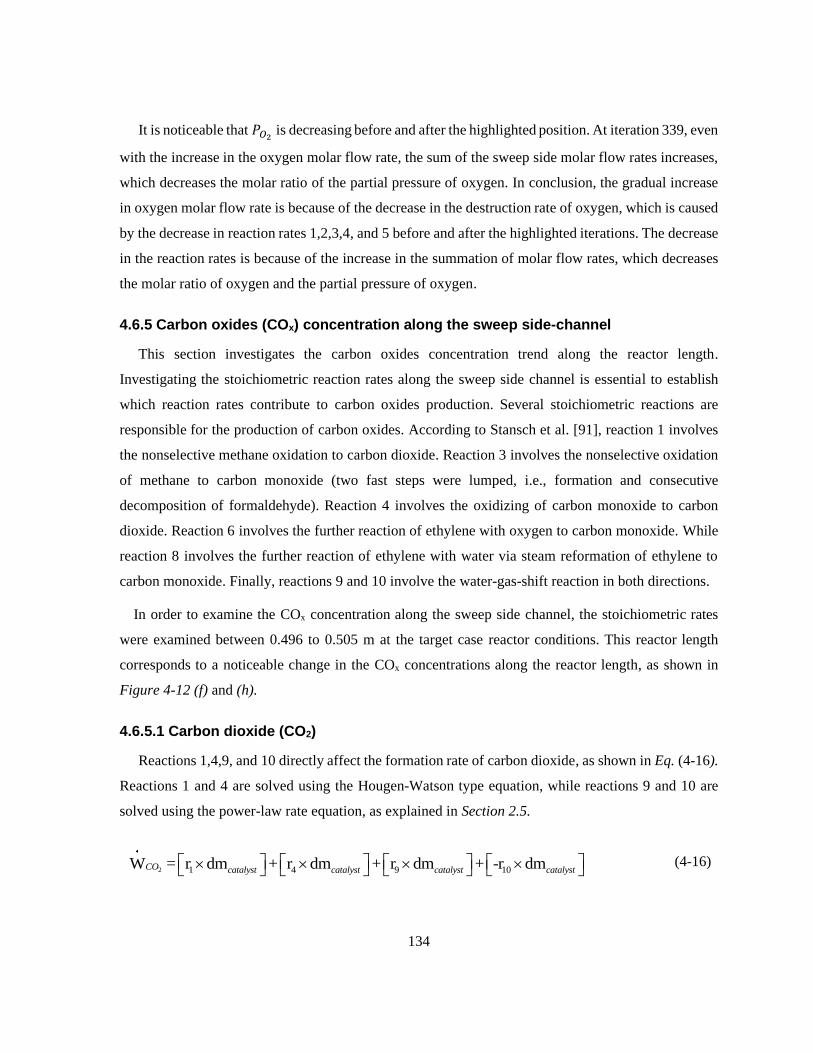
134
It is noticeable that 𝑃𝑂2 is decreasing before and after the highlighted position. At iteration 339, even
with the increase in the oxygen molar flow rate, the sum of the sweep side molar flow rates increases,
which decreases the molar ratio of the partial pressure of oxygen. In conclusion, the gradual increase
in oxygen molar flow rate is because of the decrease in the destruction rate of oxygen, which is caused
by the decrease in reaction rates 1,2,3,4, and 5 before and after the highlighted iterations. The decrease
in the reaction rates is because of the increase in the summation of molar flow rates, which decreases
the molar ratio of oxygen and the partial pressure of oxygen.
4.6.5 Carbon oxides (COx) concentration along the sweep side-channel
This section investigates the carbon oxides concentration trend along the reactor length.
Investigating the stoichiometric reaction rates along the sweep side channel is essential to establish
which reaction rates contribute to carbon oxides production. Several stoichiometric reactions are
responsible for the production of carbon oxides. According to Stansch et al. [91], reaction 1 involves
the nonselective methane oxidation to carbon dioxide. Reaction 3 involves the nonselective oxidation
of methane to carbon monoxide (two fast steps were lumped, i.e., formation and consecutive
decomposition of formaldehyde). Reaction 4 involves the oxidizing of carbon monoxide to carbon
dioxide. Reaction 6 involves the further reaction of ethylene with oxygen to carbon monoxide. While
reaction 8 involves the further reaction of ethylene with water via steam reformation of ethylene to
carbon monoxide. Finally, reactions 9 and 10 involve the water-gas-shift reaction in both directions.
In order to examine the COx concentration along the sweep side channel, the stoichiometric rates
were examined between 0.496 to 0.505 m at the target case reactor conditions. This reactor length
corresponds to a noticeable change in the COx concentrations along the reactor length, as shown in
Figure 4-12 (f) and (h).
4.6.5.1 Carbon dioxide (CO2)
Reactions 1,4,9, and 10 directly affect the formation rate of carbon dioxide, as shown in Eq. (4-16).
Reactions 1 and 4 are solved using the Hougen-Watson type equation, while reactions 9 and 10 are
solved using the power-law rate equation, as explained in Section 2.5.
2 1 4 9 10W = r dm + r dm + r dm + -r dmCO catalyst catalyst catalyst catalyst
(4-16)

135
As shown in Figure 4-15 (f), the increase in the concentration of carbon dioxide is due to reaction
four which involves the oxidizing of carbon monoxide to carbon dioxide and exhibits the highest
reaction rate. In addition, the increase in the concentration of carbon dioxide can also be linked to the
increase in reaction 9 rate, which involves the forward water-gas-shift reaction. In addition, the
activation energies for the formation of carbon monoxide and carbon dioxide, which amounted to 48
and 68 kJ/mol, respectively, are significantly lower than the activation energy of the formation of ethane
which may contribute to the noticeable increase in their formation.
Figure 4-15: Reaction rates (1,4,9 and 10) along reactor length (target case conditions)
4.6.5.2 Carbon monoxide (CO)
Reactions 3,4,6,8,9 and 10 directly affect the formation rate of carbon monoxide, as shown in
Eq.(4-17). Reactions 3,4 and 6 are solved using the Hougen-Watson type equation, while reactions 8,9,
and 10 are solved using the power-law rate equation as explained in Section 2.5.
3 4 6 8 9 10W = r dm + -r dm + (2 r ) dm + (2 r ) dm + -r dm + r dmCO catalyst catalyst catalyst catalyst catalyst catalyst
(4-17)
Figure 4-15(h) shows an overall increase in the concentration of carbon monoxide due to the increase
in its partial pressure due to the catalytic oxidation of ethylene and catalytic conversion of methane to
carbon monoxide. However, there is a decrease in the rate of formation of carbon monoxide at the
specified reactor iterations, which corresponds to the same iterations at which there is a noticeable
0E+0
1E-5
2E-5
3E-5
4E-5
5E-5
6E-5
0.495 0.5 0.505 0.51
Rea
ctio
n r
ate
[mo
l/g
s]
Reactor length [m]
r1 [mol/g s] r4 [mol/g s]
r9 [mol/g s] r10 [mol/g s]
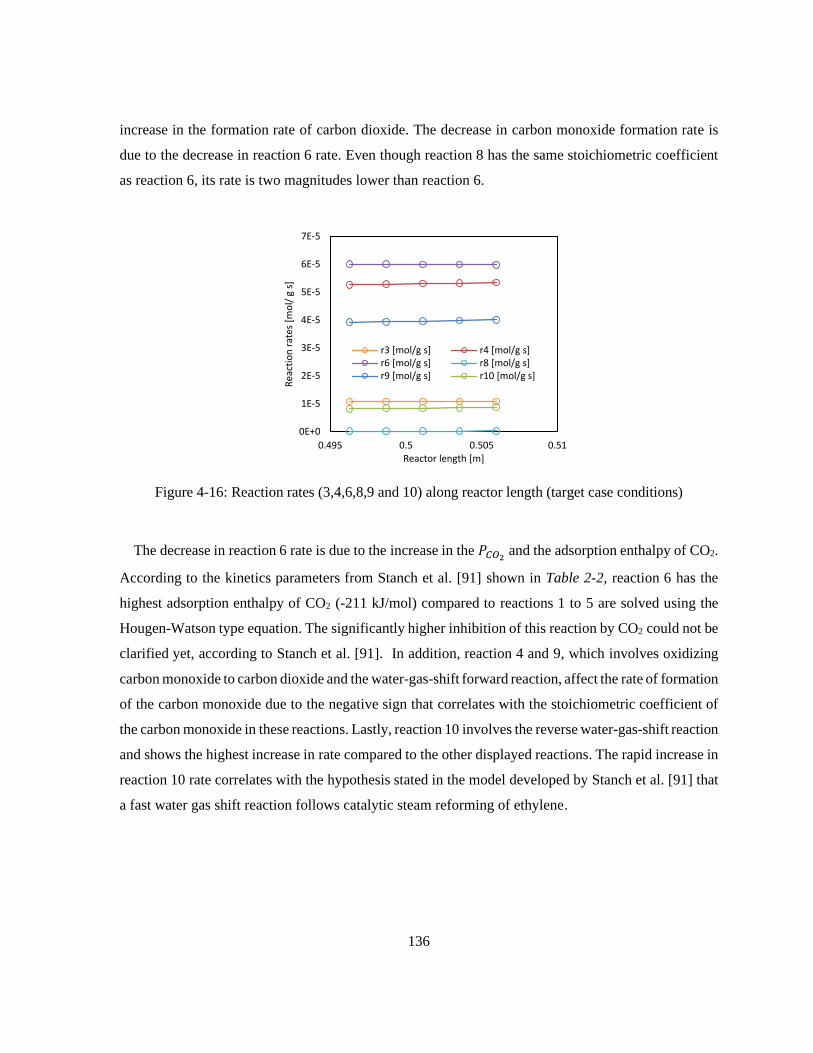
136
increase in the formation rate of carbon dioxide. The decrease in carbon monoxide formation rate is
due to the decrease in reaction 6 rate. Even though reaction 8 has the same stoichiometric coefficient
as reaction 6, its rate is two magnitudes lower than reaction 6.
Figure 4-16: Reaction rates (3,4,6,8,9 and 10) along reactor length (target case conditions)
The decrease in reaction 6 rate is due to the increase in the 𝑃𝐶𝑂2 and the adsorption enthalpy of CO2.
According to the kinetics parameters from Stanch et al. [91] shown in Table 2-2, reaction 6 has the
highest adsorption enthalpy of CO2 (-211 kJ/mol) compared to reactions 1 to 5 are solved using the
Hougen-Watson type equation. The significantly higher inhibition of this reaction by CO2 could not be
clarified yet, according to Stanch et al. [91]. In addition, reaction 4 and 9, which involves oxidizing
carbon monoxide to carbon dioxide and the water-gas-shift forward reaction, affect the rate of formation
of the carbon monoxide due to the negative sign that correlates with the stoichiometric coefficient of
the carbon monoxide in these reactions. Lastly, reaction 10 involves the reverse water-gas-shift reaction
and shows the highest increase in rate compared to the other displayed reactions. The rapid increase in
reaction 10 rate correlates with the hypothesis stated in the model developed by Stanch et al. [91] that
a fast water gas shift reaction follows catalytic steam reforming of ethylene.
0E+0
1E-5
2E-5
3E-5
4E-5
5E-5
6E-5
7E-5
0.495 0.5 0.505 0.51
Rea
ctio
n r
ates
[m
ol/
g s
]
Reactor length [m]
r3 [mol/g s] r4 [mol/g s]r6 [mol/g s] r8 [mol/g s]r9 [mol/g s] r10 [mol/g s]

137
4.6.6 Membrane vs. pre-mixed reactor
It is crucial to investigate the implications of using a membrane OCM reactor versus a pre-mixed
reactor to understand the importance of implementing the membrane technology in the OCM process
for the co-production of hydrogen and ethylene.
4.6.6.1 Membrane reactor scenario
This scenario includes a catalytic membrane reactor with both feed and sweep sides. Due to the
water-splitting process, the oxygen-permeable membrane permeates oxygen from the feed side. The
oxygen permeated is used to oxidize the methane injected in the sweep side in the oxidative coupling
of the methane process to produce higher hydrocarbons. This scenario’s reactor conditions and results
are based on the target case conditions shown in Table 4-12.
4.6.6.2 Pre-mixed reactor
For this scenario, membrane function is disabled, which means that oxygen needed for the OCM
process is directly injected into the reactor. The inlet oxygen molar flow rate and mole fractions are
calculated based on the difference between the inlet and outlet water molar flow rates on the feed side
from the membrane reactor scenario, as shown in Eq. (4-18).
2 2
2
, , , ,
scenario, ,
2
H O feed inlet H O feed outlet
membraneO sweep inlet
n n
n
−
=
(4-18)
Where,
▪ 2 , ,O sweep inletn : inlet oxygen molar flow rate on sweep side, [mol/s]
▪ 2 , ,H O feed inletn : inlet water molar flow rate on the feed side, [mol/s]
▪ 2 , ,H O feed outletn : outlet water molar flow rate on the feed side, [mol/s]
Furthermore, the inlet methane and nitrogen mole fractions are calculated based on the updated mole
fraction of oxygen calculated. The isothermal temperature condition is still maintained and assumes

138
that the pressure drop is negligible. Finally, the volumetric flow rate was adjusted to maintain consistent
methane and nitrogen inlet molar rates similar to the membrane reactor scenario.
4.6.6.3 Results & discussion
The conversion of reactants selectivity evaluates the performance of the reactor and yield of products
which are calculated using Eq(3-40), Eq(3-41), Eqn. (3-42), and Eqn. (3-43), respectively. In addition,
the COx selectivity is calculated using Eq(3-44). The COx selectivity is an important parameter to
investigate since it determines how clean the technology is. Low COx selectivity will ensure that the
membrane reactor is more selective towards higher hydrocarbons which is favorable.
Figure 4-17: Comparison between membrane reactor (target case) and pre-mixed reactor under the
same initial conditions
Based on the results shown in Figure 4-17, the implementation of the membrane resulted in various
improvements compared to the pre-mixed reactor. Firstly, a 19 % absolute percentage increase in
methane conversion is accompanied by a 2 % increase in the C2+ yield and a 1.30 % absolute percentage
increase in C2+ selectivity. The membrane reactor also showed a 33.57 % absolute percentage increase
in the hydrogen concentration compared to the pre-mixed reactor. It is important to note that the
hydrogen concentration for the membrane reactor also considered the hydrogen produced as a result of
the water-splitting process on the feed side channel, in addition to the hydrogen produced on the sweep
0%
10%
20%
30%
40%
50%
60%
70%
80%
90%
100%
X(O₂) X(CH₄) S(C₂₊) S(COₓ) Y(C₂₊) Y(COₓ) C(H₂)
Membrane reactor
Pre-mixed reactor

139
side as a result of nonselective oxidation of methane to carbon monoxide (reaction 3), thermal gas-
phase dehydrogenation of ethane (reaction 7) and the water-gas-shift reaction (reaction 9).
However, the membrane reactor shows a higher selectivity towards COx with a 22.62 % absolute
percentage increase in COx selectivity, which is also reflected in the higher COx yield for the membrane
reactor case. The higher COx selectivity and yield obtained can be explained due to the significant
increase in the methane conversion that is noticeable in the membrane reactor compared to the pre-
mixed reactor. This increase in COx output can hinder the adaption of this technology on a larger scale
due to its environmental effects.
4.7 Chapter summary
This chapter showcased the development of a base case scenario for the one-dimensional catalyst
membrane reactor model developed in Chapter 3. Several assumptions are applied to the current base
case, including isothermal operating and the correlation between reaction rates on the feed and sweep
side and the membrane's oxygen flux. The chapter also showcased the required geometry and reactor
condition needed to develop the base case and the remarks drawn from the base case scenario results.
The base case showed a relatively lower C2+ yield of 1.86 %, which was expected due to the low
methane conversion of around 1.76 %.
The chapter also tried to estimate the C2+ yield and selectivity required to achieve an industrially
favorable price, concluding that this research's OCM membrane reactor technology is economically
feasible. Although the estimation does not cover all financial matters, it is a good indicator for choosing
among alternatives and finding out which part of the process should be improved. It was concluded that
around 25 % of C2+ yield and 22 % of C2+ selectivity were needed to maintain the overall ethylene price
of around 1128.99 US $/ton C2H4, which is below the industrial limit indicated by Cruellas et al. [59]
techno-economic model.
This chapter developed a model analysis section to investigate altering the reactor dimensions and
conditions on the membrane reactor performance. The systematic analysis showed that increasing
channel length, isothermal temperature, space-time, and catalyst mass per membrane surface area and
decreasing the membrane thickness and channel height could positively impact the methane conversion
and the C2+ yield. Sensitivity analysis is used to evaluate the dependence of the design metrics on
different parameters. The sensitivity of the C2+ yield and CH4 conversion were examined concerning
design, operation, and kinetics parameters. The averaged sensitivity results show that the membrane
140
reactor is most sensitive to the operating temperature. Higher operating temperature leads to faster
surface kinetics, and therefore, methane is consumed faster with the increase of oxygen flux. A 10 %
increase in the isothermal temperature led to a 79 % increase in the methane conversion and a 58 %
increase in the C2+ yield. The systematic and sensitivity analysis remarks were used to develop a target
case in which the methane conversion reached 52.78 % along with a C2+ yield of 25.49 %. These
optimum case results demonstrated how this technology could compete with the current ethylene prices,
as it can achieve the economic yield limit specified of 25-30 % by Cruellas et al. [59] and also surpasses
the economic C2+ yield and selectivity (estimated in Section 4.5.4) of 25 % yield and 22 %, respectively.
Lastly, the chapter showcased the importance of implementing a membrane in a reactor to produce
higher hydrocarbon using the OCM process. A comparison was drawn between a membrane reactor
and a premixed reactor (the membrane function is disabled). The reactor conditions were matched
between the two cases. The amount of oxygen permeated in the membrane reactor case was used as an
inlet oxygen concentration for the premixed reactor. A comparison between the target case and a pre-
mixed reactor case showed that the implementation of the membrane resulted in various improvements
compared to the pre-mixed reactor, including an enhanced methane conversion, which is accompanied
by an increase in the C2+ yield and the C2+ selectivity. The improvements also included increasing the
percentage concentration of hydrogen produced as a by-product. The increase in the methane
conversion is accompanied by increased COx selectivity and yield. The increase in COx output can
hinder the adaption of this technology on a larger scale due to its environmental effects.

141
Chapter 5
Conclusions and future work
5.1 Conclusions
In this research, hydrogen and ethylene co-production in an oxygen permeable membrane reactor is
studied. The membrane has two functions; firstly, they are used as product separators in which H2O
provided in the reactor is separated into H2 and O2 that diffuses through the membrane. Meanwhile, the
membrane acts as a reactant provider to ultimately provide oxygen molecules through the permeation
process to the sweep side, where the OCM process occurs for ethylene production.
The one-dimensional model is developed based on a plug flow reactor (PFR). The PFR is usually
used to model reactions involving changing temperatures, pressures, and flow densities. A typical PFR
could be a tube packed with solid material (frequently a catalyst). Which are called packed bed reactors
or PBRs; The geometry of the membrane reactor modeled is based on a monolith reactor to account for
the simultaneous feeding of water and methane in a feed and sweep channel, respectively. In addition,
the monolith reactors have a high surface-area-to-volume ratio and can be readily produced and
modularized on an industrial scale. Ordinary differential equation solver from MATLAB is used to
solve the governing differential equations that concern mass balance and pressure drop along the length
of the reactor.
The use of catalysts on the membrane surface is essential as it improves the catalytic surface
activation reaction while the oxygen permeation rate increases. In addition, incorporating the catalyst
microkinetics into the membrane reactor model can help solve the rate of formation parameters of the
species in the sweep side of the membrane reactor, which involves the OCM mechanism for higher
hydrocarbons production.
Sensitivity and systematic analysis in Chapter 4 showed that increasing channel length, isothermal
temperature, space-time, and catalyst mass per membrane surface area while decreasing the membrane
thickness and channel height can raise the methane conversion and the C2+ yield. The averaged
sensitivity results show that the membrane reactor is most sensitive to the operating temperature. Higher
operating temperature leads to faster surface kinetics, and therefore, methane is consumed faster with

142
the increase of oxygen flux. A 10 % increase in the isothermal temperature led to a 79 % increase in
the methane conversion and a 58 % increase in the C2+ yield.
Finally, it was concluded that incorporating membrane in an OCM reactor could help improve the
methane conversion, accompanied by a 2 % absolute percentage increase in the C2+ yield and a 1.30 %
absolute percentage increase in C2+ selectivity. However, the membrane reactor shows a higher
selectivity towards COx with a 22.62 % absolute percentage increase in COx selectivity. This increase
in COx output can hinder the adaption of this technology on a larger scale due to its environmental
effects.
Estimating the C2+ yield and selectivity required to achieve an industrially favorable price will
conclude that this research's OCM membrane reactor technology is economically feasible. Although
the estimation does not cover all financial matters, it is a good indicator for choosing among alternatives
and finding out which part of the process should be improved. It was concluded that around 25 % of
C2+ yield and 22 % of C2+ selectivity were needed to maintain the overall ethylene price of around
1128.99 US $/ton of C2H4, which is below the industrial limit indicated by Cruellas et al. [59] techno
economics model.
5.2 Recommendations for future work
Several implementations can further improve the obtained membrane reactors’ performance criteria
and help further examine the feasibility of the technology presented in this research:
(1) Examining further OCM catalysts can be part of future work concerning the implementation of
OCM in catalytic membrane reactors. As explained in Chapter 2, using an appropriate catalyst in
OCM reaction is crucial to the overall process. It can ease breaking a C-H bond in a methane
molecule (CH4) and dimerizing methyl radicals (CH3). These are susceptible to the coupling
reaction toward higher hydrocarbons such as ethane and ethylene while minimizing the carbon
monoxide bond (C-O) formation at high conversion levels. Applying the reaction network for a
more selective OCM catalyst in a one-dimensional model can positively impact the results by
improving the surface kinetics. Several catalyst show good selectivity towards C2+ and a relatively
higher methane conversion [131] [98] [132] [133] [134]. For instance, The Mn/Na2WO4/SiO2 catalyst
is one of the most effective catalysts for the OCM reaction. Selectivity of 66.9 % C2+ at 37.7 %
CH4 conversion, 80 % C2+ selectivity at 20 % CH4 conversion, and 80 % C2+ selectivity at 33 %
CH4 conversion with excellent catalyst stability can nominate this catalyst to be an excellent

143
candidate. In addition, the usage of barium-based perovskite (BSCF) membrane can help increase
hydrogen production on the feed side. As explained in Chapter 1, BSCF exhibits a high oxygen
permeation rate. According to studies [79], the continuous removal of oxygen from water
dissociation will lead to continuously shifting the equilibrium to the product side; in other words,
increasing hydrogen production.
(2) Developing a 3D catalytic oxygen-permeable membrane reactor model that builds on the 1D model
investigated in this research can help investigate this technology further. Enabling factors like
adiabatic temperature along the sweep and feed sides will make the model more realistic and closer
to reality.
(3) In order to examine the feasibility of the technology presented in this research, a techno-economic
analysis should be developed to build on the ethylene price estimation shown in this research. The
techno-economic model will allow the development of a cost-effective membrane reactor system
and plant, which will justify implementing this co-production process versus other conventional
production processes, such as steam methane reforming and ethane cracking. The complete
techno-economic analysis should include initial capital costs and energy requirements for each
stage of the OCM process.

144
Bibliography
[1] IEA, Technology Roadmap Hydrogen and Fuel Cells, (2015).
https://www.iea.org/reports/technology-roadmap-hydrogen-and-fuel-cells.
[2] S. Koumi Ngoh, D. Njomo, An overview of hydrogen gas production from solar energy,
Renew. Sustain. Energy Rev. 16 (2012) 6782–6792.
https://doi.org/https://doi.org/10.1016/j.rser.2012.07.027.
[3] I.E. Agency, World Energy Outlook-2017, (2017).
[4] A. Alshammari, V.N. Kalevaru, A. Bagabas, A. Martin, Production of ethylene and its
commercial importance in the global market, 2016. https://doi.org/10.4018/978-1-4666-9975-
5.ch004.
[5] METI, Forecast of Global Supply and Demand Trends for Petrochemical Products (from 2010
to 2023), (2019). https://www.meti.go.jp/english/press/2019/1017_001.html.
[6] Siluria, Ethylene Industry, (2020).
https://siluria.com/Commercial_Applications/Ethylene_Industry.
[7] T. Ren, M.K. Patel, K. Blok, Steam cracking and methane to olefins: Energy use, CO2
emissions and production costs, Energy. 33 (2008) 817–833.
https://doi.org/10.1016/j.energy.2008.01.002.
[8] G. Radaelli, Low-Energy , Low-Cost Production of Ethylene by Low- Temperature Oxidative
Coupling of Methane Final Technical Report, (2017).
[9] H. Schmalz, T. Wirth, Ullmann’s Encyclopedia of Industrial Chemistry, (2003) 335521.
[10] A. Greenwood, ICIS, Fears of US ethane price spike overblown, (2016).
https://www.icis.com/explore/resources/news/2016/09/06/10031804/fears-of-us-ethane-price-
spike-overblown-analyst/.
[11] C.A. Gärtner, A.C. vanVeen, J.A. Lercher, Oxidative dehydrogenation of ethane: Common
principles and mechanistic aspects, ChemCatChem. 5 (2013) 3196–3217.
https://doi.org/10.1002/cctc.201200966.
[12] N. Wo, M. Neumann, Oxidative coupling of methane : Resolution of the surface and gas phase
contributions to the mechanism of the oxidative coupling of methane at, (2016).

145
[13] S. Parishan, P. Littlewood, A. Arinchtein, V. Fleischer, R. Schomäcker, Chemical looping as a
reactor concept for the oxidative coupling of methane over the MnxOy-Na2WO4/SiO2
catalyst, benefits and limitation, Catal. Today. 311 (2018) 40–47.
https://doi.org/10.1016/j.cattod.2017.08.019.
[14] A.S. Bodke, D.A. Olschki, L.D. Schmidt, E. Ranzi, High selectivities to ethylene by partial
oxidation of ethane, Science (80-. ). 285 (1999) 712–715.
https://doi.org/10.1126/science.285.5428.712.
[15] X.S. Nghiem, Ethylene Production by Oxidative Coupling of Methane : New Process Flow
Diagram Based on Adsorptive Separation, Dr. Thesis, Tech. Univ. Berlin, Fak. III -
Prozesswissenschaften. (2014).
[16] V. Spallina, I.C. Velarde, J.A.M. Jimenez, H.R. Godini, F. Gallucci, M. Van Sint Annaland,
Techno-economic assessment of different routes for olefins production through the oxidative
coupling of methane (OCM): Advances in benchmark technologies, Energy Convers. Manag.
154 (2017) 244–261. https://doi.org/10.1016/j.enconman.2017.10.061.
[17] N. Sönnichsen, Natural gas consumption worldwide from 1998 to 2019 (in billion cubic
meters), (2021). https://www.statista.com/statistics/282717/global-natural-gas-consumption/.
[18] A.F. Ghoniem, Needs, resources and climate change: Clean and efficient conversion
technologies, Prog. Energy Combust. Sci. 37 (2011) 15–51.
https://doi.org/10.1016/j.pecs.2010.02.006.
[19] M. Ewing, B. Israel, T. Jutt, H. Talebian, L. Stepanik, Hydrogen on the path to net-zero
emissions Costs and climate benefits, Pembin. Inst. (2020).
https://www.pembina.org/pub/hydrogen-primer.
[20] X. Zhang, R. You, Z. Wei, X. Jiang, J. Yang, Y. Pan, P. Wu, Q. Jia, Z. Bao, L. Bai, M. Jin, B.
Sumpter, V. Fung, W. Huang, Z. Wu, Radical Chemistry and Reaction Mechanisms of
Propane Oxidative Dehydrogenation over Hexagonal Boron Nitride Catalysts, Angew.
Chemie - Int. Ed. 59 (2020) 8042–8046. https://doi.org/10.1002/anie.202002440.
[21] Natural Resources Canada, 2019 Hydrogen Pathways, Enabling a clean growth future for
Canadians, (2019) 103. https://www.nrcan.gc.ca/energy-efficiency/transportation-alternative-
fuels/resource-library/2019-hydrogen-pathways-enabling-clean-growth-future-for-

146
canadians/21961.
[22] CCC, UK regulations: the Climate Change Act, Comm. Clim. Chang. (2018).
https://www.theccc.org.uk/the-need-to-act/a-legal-duty-to-act/.
[23] M. Jensterle, J. Narita, R. Piria, S. Samadi, M. Prantner, K. Crone, S. Siegemund, S. Kan, T.
Matsumoto, Y. Shibata, The role of clean hydrogen in the future energy systems of Japan and
Germany, Berlin: Adelphi. (2019).
[24] M. Ghazvini, M. Sadeghzadeh, M.H. Ahmadi, S. Moosavi, F. Pourfayaz, Geothermal energy
use in hydrogen production: A review, Int. J. Energy Res. 43 (2019) 7823–7851.
https://doi.org/10.1002/er.4778.
[25] Office of Energy Efficiency and Renewable Energy, Hydrogen Production: Natural Gas
Reforming, United States Dep. Energy. (n.d.).
https://www.energy.gov/eere/fuelcells/hydrogen-production-natural-gas-reforming.
[26] D.G. Rethwisch, J.A. Dumesic, The effects of metal-oxygen bond strength on properties of
oxides: II. Water-gas shift over bulk oxides, Appl. Catal. 21 (1986) 97–109.
https://doi.org/10.1016/S0166-9834(00)81331-7.
[27] D.C. Grenoble, M.M. Estadt, D.F. Ollis, The chemistry and catalysis of the water gas shift
reaction. 1. The kinetics over supported metal catalysts, J. Catal. 67 (1981) 90–102.
https://doi.org/10.1016/0021-9517(81)90263-3.
[28] A. Boudjemaa, A. Auroux, S. Boumaza, M. Trari, O. Cherifi, R. Bouarab, Hydrogen
production on iron-magnesium oxide in the high-temperature water-gas shift reaction, React.
Kinet. Catal. Lett. 98 (2009) 319–325. https://doi.org/10.1007/s11144-009-0084-3.
[29] N.E. Amadeo, M.A. Laborde, Hydrogen production from the low-temperature water-gas shift
reaction: Kinetics and simulation of the industrial reactor, Int. J. Hydrogen Energy. 20 (1995)
949–956. https://doi.org/10.1016/0360-3199(94)00130-R.
[30] R. Bouarab, S. Bennici, C. Mirodatos, A. Auroux, Hydrogen Production from the Water-Gas
Shift Reaction on Iron Oxide Catalysts, J. Catal. 2014 (2014) 1–6.
https://doi.org/10.1155/2014/612575.
[31] K. Yamashita, L. Barreto, Energyplexes for the 21st century: Coal gasification for co-
producing hydrogen, electricity and liquid fuels, Energy. 30 (2005) 2453–2473.
147
https://doi.org/10.1016/j.energy.2004.12.002.
[32] C. Higman, S. Tam, Advances in coal gasification, hydrogenation, and gas treating for the
production of chemicals and fuels, Chem. Rev. 114 (2014) 1673–1708.
https://doi.org/10.1021/cr400202m.
[33] Office of Energy Efficiency and Renewable Energy, Hydrogen Production: Coal Gasification,
United States Dep. Energy. (2016). https://www.energy.gov/eere/fuelcells/hydrogen-
production-coal-gasification.
[34] P. Rezaee, H.R. Naeij, A new approach to separate hydrogen from carbon dioxide using
graphdiyne-like membrane, Sci. Rep. 10 (2020) 1–13. https://doi.org/10.1038/s41598-020-
69933-9.
[35] X.-Y. Wu, L. Cai, X. Zhu, A.F. Ghoniem, W. Yang, A high-efficiency novel IGCC-OTM
carbon capture power plant design, J. Adv. Manuf. Process. 2 (2020) e10059.
https://doi.org/https://doi.org/10.1002/amp2.10059.
[36] L. Cai, X.Y. Wu, X. Zhu, A.F. Ghoniem, W. Yang, High-performance oxygen transport
membrane reactors integrated with IGCC for carbon capture, AIChE J. 66 (2020).
https://doi.org/10.1002/aic.16247.
[37] A.F.G. Xiao-Yu Wu, Yudong Chen, Design and cost analysis of perovskite oxygen permeable
membrane reactors for hydrogen and syngas co-production, Dep. Mech. Eng. Massachusetts
Inst. Technol. (2012). https://doi.org/10.1017/CBO9781107415324.004.
[38] F. Elmanakhly, A. DaCosta, B. Berry, R. Stasko, M. Fowler, X.Y. Wu, Hydrogen economy
transition plan: A case study on Ontario, AIMS Energy. 9 (2021) 775–811.
https://doi.org/10.3934/ENERGY.2021036.
[39] P. Nikolaidis, A. Poullikkas, A comparative overview of hydrogen production processes,
Renew. Sustain. Energy Rev. 67 (2017) 597–611.
https://doi.org/https://doi.org/10.1016/j.rser.2016.09.044.
[40] A. Buttler, H. Spliethoff, Current status of water electrolysis for energy storage, grid balancing
and sector coupling via power-to-gas and power-to-liquids: A review, Renew. Sustain. Energy
Rev. 82 (2018) 2440–2454. https://doi.org/10.1016/j.rser.2017.09.003.
[41] J.R. Bartels, M.B. Pate, N.K. Olson, An economic survey of hydrogen production from

148
conventional and alternative energy sources, Int. J. Hydrogen Energy. 35 (2010) 8371–8384.
https://doi.org/https://doi.org/10.1016/j.ijhydene.2010.04.035.
[42] E. Cetinkaya, I. Dincer, G.F. Naterer, Life cycle assessment of various hydrogen production
methods, Int. J. Hydrogen Energy. 37 (2012) 2071–2080.
https://doi.org/10.1016/j.ijhydene.2011.10.064.
[43] U.D. of Energy, Hydrogen & Fuel Cells Program, (n.d.). https://www.hydrogen.energy.gov/.
[44] B. Olateju, J. Monds, A. Kumar, Large scale hydrogen production from wind energy for the
upgrading of bitumen from oil sands, Appl. Energy. 118 (2014) 48–56.
https://doi.org/10.1016/j.apenergy.2013.12.013.
[45] BBC, Coal gasification: The clean energy of the future?, (2014).
https://www.bbc.com/news/business-26921145.
[46] F. Ognissanto, T. Landen, A. Stevens, M. Emre, D. Naberezhnykh, Evaluation of the CO2
emissions pathway from hydrogen production to fuel cell car utilisation, The Institution of
Engineering and Technology, 2017. https://doi.org/10.1049/iet-its.2016.0210.
[47] K. Scott, Introduction to Electrolysis, Electrolysers and Hydrogen Production, in: Royal
Society of Chemistry, 2019: pp. 1–27. https://doi.org/10.1039/9781788016049-00001.
[48] D. Akal, S. Öztuna, M.K. Büyükakın, A review of hydrogen usage in internal combustion
engines (gasoline-Lpg-diesel) from combustion performance aspect, Int. J. Hydrogen Energy.
(2020) 1–12. https://doi.org/10.1016/j.ijhydene.2020.02.001.
[49] IEA, The clean hydrogen future has already begun, (2019).
https://www.iea.org/commentaries/the-clean-hydrogen-future-has-already-begun.
[50] K. Huang, J.B. Miller, G.W. Huber, J.A. Dumesic, C.T. Maravelias, A General Framework for
the Evaluation of Direct Nonoxidative Methane Conversion Strategies, Joule. 2 (2018) 349–
365. https://doi.org/10.1016/j.joule.2018.01.001.
[51] American chemistry, OLEFINS, (2021).
https://www.americanchemistry.com/ProductsTechnology/Olefins/#:~:text=Olefins are a class
of,and 1%2C3-butadiene.
[52] P. Tian, Y. Wei, M. Ye, Z. Liu, Methanol to olefins (MTO): From fundamentals to
commercialization, ACS Catal. 5 (2015) 1922–1938.
149
https://doi.org/10.1021/acscatal.5b00007.
[53] A. Holmen, Direct conversion of methane to fuels and chemicals, Catal. Today. 142 (2009) 2–
8. https://doi.org/10.1016/j.cattod.2009.01.004.
[54] M.C. Alvarez-Galvan, N. Mota, M. Ojeda, S. Rojas, R.M. Navarro, J.L.G. Fierro, Direct
methane conversion routes to chemicals and fuels, Catal. Today. 171 (2011) 15–23.
https://doi.org/10.1016/j.cattod.2011.02.028.
[55] J.J. Spivey, G. Hutchings, Catalytic aromatization of methane, Chem. Soc. Rev. 43 (2014)
792–803. https://doi.org/10.1039/c3cs60259a.
[56] Z. Cao, H. Jiang, H. Luo, S. Baumann, W.A. Meulenberg, J. Assmann, L. Mleczko, Y. Liu, J.
Caro, Natural gas to fuels and chemicals: Improved methane aromatization in an oxygen-
permeable membrane reactor, Angew. Chemie - Int. Ed. 52 (2013) 13794–13797.
https://doi.org/10.1002/anie.201307935.
[57] J. Xue, Y. Chen, Y. Wei, A. Feldhoff, H. Wang, J. Caro, Gas to Liquids: Natural Gas
Conversion to Aromatic Fuels and Chemicals in a Hydrogen-Permeable Ceramic Hollow
Fiber Membrane Reactor, ACS Catal. 6 (2016) 2448–2451.
https://doi.org/10.1021/acscatal.6b00004.
[58] T. Jiang, J. Song, M. Huo, N.T. Yang, J. Liu, J. Zhang, Y. Sun, Y. Zhu, La2O3 catalysts with
((diverse spatial dimensionality)) for oxidative coupling of methane to produce ethylene and
ethane, RSC Adv. 6 (2016) 34872–34876. https://doi.org/10.1039/c6ra01805j.
[59] A. Cruellas, J.J. Bakker, M. van Sint Annaland, J.A. Medrano, F. Gallucci, Techno-economic
analysis of oxidative coupling of methane: Current state of the art and future perspectives,
Energy Convers. Manag. 198 (2019) 111789.
https://doi.org/10.1016/j.enconman.2019.111789.
[60] Y. Simon, F. Baronnet, P.M. Marquaire, Kinetic modeling of the oxidative coupling of
methane La2O3, Ind. Eng. Chem. Res. 46 (2007) 1914–1922.
https://doi.org/10.1021/ie060151w.
[61] B. Zohour, Oxidative Coupling of Methane using Nanofiber Catalysts and Discovery of
Catalysts for Atmospheric Reduction of CO2 to Methanol, J. Phys. A Math. Theor. 44 (2017)
1–8. https://doi.org/10.1088/1751-8113/44/8/085201.

150
[62] J.H. Lunsford, The Catalytic Oxidative Coupling of Methane, Angew. Chemie Int. Ed.
English. 34 (1995) 970–980. https://doi.org/10.1002/anie.199509701.
[63] L. Mleczko, U. Pannek, M. Rothaemel, M. Baerns, Oxidative Coupling of Methane over a
La2O3/CaO Catalyst. Optimization of Reaction Conditions in a Bubbling Fluidized-bed
Reactor, Can. J. Chem. Eng. 74 (1996) 279–287. https://doi.org/10.1002/cjce.5450740213.
[64] U. Zavyalova, M. Holena, R. Schlögl, M. Baerns, Statistical analysis of past catalytic data on
oxidative methane coupling for new insights into the composition of high-performance
catalysts, ChemCatChem. 3 (2011) 1935–1947. https://doi.org/10.1002/cctc.201100186.
[65] S.J. Conway, D.J. Wang, J.H. Lunsford, Selective oxidation of methane and ethane over Li+-
MgO-Cl- catalysts promoted with metal oxides, Appl. Catal. A, Gen. 79 (1991) 0–4.
https://doi.org/10.1016/0926-860X(91)85001-E.
[66] S. Jašo, H.R. Godini, H. Arellano-Garcia, M. Omidkhah, G. Wozny, Analysis of attainable
reactor performance for the oxidative methane coupling process, Chem. Eng. Sci. 65 (2010)
6341–6352. https://doi.org/10.1016/j.ces.2010.08.019.
[67] J.C.W. Kuo, C.T. Kresge, R.E. Palermo, Evaluation of direct methane conversion to higher
hydrocarbons and oxygenates, Catal. Today. 4 (1989) 463–470. https://doi.org/10.1016/0920-
5861(89)85042-4.
[68] O. Czuprat, T. Schiestel, H. Voss, J. Caro, Oxidative coupling of methane in a BCFZ
perovskite hollow fiber membrane reactor, Ind. Eng. Chem. Res. 49 (2010) 10230–10236.
https://doi.org/10.1021/ie100282g.
[69] X. Tan, K. Li, Inorganic Membrane Reactors: Fundamentals and Applications, 2015.
https://doi.org/10.1002/9781118672839.
[70] P. Zhu, I. Falls, Ceramic Membranes for Permeation, 2008.
[71] E.A. Hazbun, CERAMC MEMBRANE AND USE THEREOF FOR HYDROCARBON
CONVERSION, (1989).
[72] A.A. Plazaola, A.C. Labella, Y. Liu, N.B. Porras, D.A.P. Tanaka, M.V.S. Annaland, F.
Gallucci, Mixed ionic-electronic conducting membranes (MIEC) for their application in
membrane reactors: A review, Processes. 7 (2019). https://doi.org/10.3390/pr7030128.
[73] J. Sunarso, S. Baumann, J.M. Serra, W.A. Meulenberg, S. Liu, Y.S. Lin, J.C. Diniz da Costa,

151
Mixed ionic-electronic conducting (MIEC) ceramic-based membranes for oxygen separation,
J. Memb. Sci. 320 (2008) 13–41. https://doi.org/10.1016/j.memsci.2008.03.074.
[74] X.Y. Wu, L. Chang, M. Uddi, P. Kirchen, A.F. Ghoniem, Toward enhanced hydrogen
generation from water using oxygen permeating LCF membranes, Phys. Chem. Chem. Phys.
17 (2015) 10093–10107. https://doi.org/10.1039/c5cp00584a.
[75] P. Bernardo, E. Drioli, Membrane engineering for a sustainable production of ethylene, Fuel
Process. Technol. 212 (2021) 106624. https://doi.org/10.1016/j.fuproc.2020.106624.
[76] X.-Y. Wu, Y. Luo, F. Hess, W. Lipiński, Editorial: Sustainable Hydrogen for Energy, Fuel and
Commodity Applications, Front. Energy Res. . 9 (2021) 231.
[77] N.I. Il’chenko, Y.I. Pyatnitskij, N. V. Pavlenko, Oxidative coupling of methane on metal-like
catalysts, Ukr. Khimicheskij Zhurnal. 67 (2001) 40–48.
[78] W. Yao, H. Cheng, P. Wang, X. Lu, X. Zou, Q. Xu, Hydrogen Production by Catalytic Partial
Oxidation of Coke Oven Gas in BaCo0.7Fe0.3-xZrxO3-δ Ceramic Membrane Reactors,
MATEC Web Conf. 67 (2016) 6–11. https://doi.org/10.1051/matecconf/20166704002.
[79] H. Jiang, H. Wang, F. Liang, S. Werth, S. Schirrmeister, T. Schiestel, J. Caro, Improved water
dissociation and nitrous oxide decomposition by in situ oxygen removal in perovskite catalytic
membrane reactor, Catal. Today. 156 (2010) 187–190.
https://doi.org/10.1016/j.cattod.2010.02.027.
[80] X.Y. Wu, L. Chang, M. Uddi, P. Kirchen, A.F. Ghoniem, Toward enhanced hydrogen
generation from water using oxygen permeating LCF membranes, Phys. Chem. Chem. Phys.
17 (2015) 10093–10107. https://doi.org/10.1039/c5cp00584a.
[81] R.D. Shannon, Revised effective ionic radii in halides and chalcogenides, Acta Crystallogr.
A32 (1976) 751–767.
[82] H.S. Fogler, Elements of Reaction Engineering, 4th ed., 2006. https://learning-oreilly-
com.proxy.lib.uwaterloo.ca/library/view/elements-of-chemical/9780133887822/ch01.xhtml.
[83] J.N. Armor, Applications of catalytic inorganic membrane reactors to refinery products,
(1998) 1999.
[84] J.A. Lane, J.A. Kilner, Oxygen surface exchange on gadolinia doped ceria, Solid State Ionics.
136–137 (2000) 927–932. https://doi.org/10.1016/S0167-2738(00)00530-0.
152
[85] P.J. Gellings, H.J.M. Bouwmeester, Ion and mixed conducting oxides as catalysts, Catal.
Today. 12 (1992) 1–101. https://doi.org/10.1016/0920-5861(92)80046-P.
[86] R. V. Franca, A. Thursfield, I.S. Metcalfe, La 0.6Sr 0.4Co 0.2Fe 0.8O 3-δ microtubular
membranes for hydrogen production from water splitting, J. Memb. Sci. 389 (2012) 173–181.
https://doi.org/10.1016/j.memsci.2011.10.027.
[87] F.A. Kroger, H.J. Vink, Relations between the Concentrations of Imperfections in Crystalline
Solids, in: N.Y. Academic (Ed.), Solid State Phys. Adv. Res. Appl. Vol. 3, Vol. 3, 1956: pp.
307–435. https://doi.org/10.1016/S0081-1947(08)60135-6.
[88] Y. Liu, X. Tan, K. Li, Mixed conducting ceramics for catalytic membrane processing, Catal.
Rev. - Sci. Eng. 48 (2006) 145–198. https://doi.org/10.1080/01614940600631348.
[89] S.Z. Baykara, Experimental solar water thermolysis, Int. J. Hydrogen Energy. 29 (2004)
1459–1469. https://doi.org/10.1016/j.ijhydene.2004.02.011.
[90] H.H.G. Jellinek, H. Kachi, The catalytic thermal decomposition of water and the production of
hydrogen, Int. J. Hydrogen Energy. 9 (1984) 677–688. https://doi.org/10.1016/0360-
3199(84)90265-9.
[91] Z. Stansch, L. Mleczko M, Baerns, Comprehensive Kinetics of Oxidative Coupling of
Methane over the La2O3/CaO Catalyst, Ind. Eng. Chem. Res. 36 (1997) 2568–2579.
https://doi.org/10.1021/ie960562k.
[92] V.I. Lomonosov, M.Y. Sinev, Oxidative coupling of methane: Mechanism and kinetics, Kinet.
Catal. 57 (2016) 647–676. https://doi.org/10.1134/S0023158416050128.
[93] V.I. Alexiadis, T. Serres, G.B. Marin, C. Mirodatos, J.W. Thybaut, Y. Schuurman, Analysis of
volume-to-surface ratio effects on methane oxidative coupling using microkinetic modeling,
AIChE J. 64 (2018) 2603–2611. https://doi.org/10.1002/aic.16152.
[94] T. Le Van, C. Louis, M. Kermarec, M. Che, J.M. Tatibouët, Temperature and conversion
dependence of selectivities in the oxidative coupling of methane on La2O3 catalysts, Catal.
Today. 13 (1992) 321–328. https://doi.org/10.1016/0920-5861(92)80156-H.
[95] B. Pascal, L. Yongdan, M. Paul-Marie, C. Guy-Marie, B. FranGois, Competition between the
gas and surface reactions for the oxidative coupling of methane, Appl. Catal. 29 (1994) 190.
https://doi.org/10.1016/S0166-9834(00)82623-8.

153
[96] G.M. Côme, Y. Li, P. Barbe, N. Gueritey, P.M. Marquaire, F. Baronnet, Competition between
gas and surface reactions in the oxidative coupling of methane 2. Isothermal experiments in a
catalytic jet-stirred gas phase reactor, Catal. Today. 30 (1996) 215–222.
https://doi.org/10.1016/0920-5861(96)00012-0.
[97] A.H. Weiss, J. Cook, R. Holmes, N. Davidova, P. Kovacheva, M. Traikova, Low Temperature
Oxidative Coupling of Methane over a La2O3 Catalyst, 2 (1990) 243–253.
https://doi.org/10.1021/bk-1990-0437.ch022.
[98] M. Daneshpayeh, A. Khodadadi, N. Mostoufi, Y. Mortazavi, R. Sotudeh-Gharebagh, A.
Talebizadeh, Kinetic modeling of oxidative coupling of methane over Mn/Na2WO4/SiO2
catalyst, Fuel Process. Technol. 90 (2009) 403–410.
https://doi.org/10.1016/j.fuproc.2008.11.001.
[99] L. Yu, W. Li, V. Ducarme, C. Mirodatos, G.A. Martin, Inhibition of gas-phase oxidation of
ethylene in the oxidative conversion of methane and ethane over CaO, La2O3/CaO and SrO-
La2O3/CaO catalysts, Appl. Catal. A Gen. 175 (1998) 173–179.
https://doi.org/10.1016/S0926-860X(98)00208-7.
[100] T.T. Ching, A.R. Mohamed, S. Bhatia, Modeling of catalytic reactor for oxidative coupling of
methane using La2O3/CaO catalyst, Chem. Eng. J. 87 (2002) 49–59.
https://doi.org/10.1016/S1385-8947(01)00191-7.
[101] T.H. Etsell, S.N. Flengas, The Electrical Properties of Lanthanum Oxide-Calcium Oxide Solid
Electrolytes, J. Electrochem. Soc. 116 (1969) 771. https://doi.org/10.1149/1.2412050.
[102] H.S. Fogler, Essentials of Chemical Reaction Engineering, second edition, Pearson, 2017.
[103] Hugh Stott Taylor, A theory of the catalytic surface, R. Soc. 108 (1925).
https://doi.org/https://doi.org/10.1098/rspa.1925.0061.
[104] L. Shenggang, D.A. Dixon, Mechanism of oxide-catalyzed selective oxidation: A
computational perspective, in: D.A. Dixon (Ed.), Annu. Rep. Comput. Chem., Elsevier, 2019:
pp. 287–333. https://doi.org/https://doi.org/10.1016/bs.arcc.2019.08.007.
[105] M.S. Palmer, M. Neurock, M.M. Olken, Periodic density functional theory study of methane
activation over La2O3: Activity of O2-, O-, O22-, oxygen point defect, and Sr2+-doped
surface sites, J. Am. Chem. Soc. 124 (2002) 8452–8461. https://doi.org/10.1021/ja0121235.

154
[106] J. Keith, Physical chemistry, 1999.
[107] J. Ross, Heterogeneous Catalysis - Fundamentals and Applications, Elsevier, 2012.
https://app.knovel.com/hotlink/pdf/id:kt009GDRN2/heterogeneous-catalysis/introduction.
[108] J. Hong, P. Kirchen, A.F. Ghoniem, Analysis of heterogeneous oxygen exchange and fuel
oxidation on the catalytic surface of perovskite membranes, J. Memb. Sci. 445 (2013) 96–106.
https://doi.org/10.1016/j.memsci.2013.05.055.
[109] A.S. Yu, J. Kim, T.S. Oh, G. Kim, R.J. Gorte, J.M. Vohs, Decreasing interfacial losses with
catalysts in La0.9Ca0.1FeO3-δ membranes for syngas production, Appl. Catal. A Gen. 486
(2014) 259–265. https://doi.org/10.1016/j.apcata.2014.08.028.
[110] Z. Zhao, C.O. Iloeje, T. Chen, A.F. Ghoniem, Design of a rotary reactor for chemical-looping
combustion. Part 1: Fundamentals and design methodology, Fuel. 121 (2014) 327–343.
https://doi.org/10.1016/j.fuel.2013.11.056.
[111] E.J. Sheu, A.F. Ghoniem, Receiver reactor concept and model development for a solar steam
redox reformer, Sol. Energy. 125 (2016) 339–359.
https://doi.org/10.1016/j.solener.2015.12.024.
[112] S. Liu, X. Tan, K. Li, R. Hughes, Methane coupling using catalytic membrane reactors, Catal.
Rev. - Sci. Eng. 43 (2001) 147–198. https://doi.org/10.1081/CR-100104388.
[113] W.R. Bussman, C.E. Baukal, Ambient conditions impact CO and NOx emissions: Part II, Pet.
Technol. Q. 14 (2009) 37–41.
[114] W. Betteridge, J. Hope, Separation of Hydrogen From Gas Mixtures., Platin. Met. Rev. 19
(1975) 50–59.
[115] W. Li, Z. Cao, L. Cai, L. Zhang, X. Zhu, W. Yang, H2S-tolerant oxygen-permeable ceramic
membranes for hydrogen separation with a performance comparable to those of palladium-
based membranes, Energy Environ. Sci. 10 (2017) 101–106.
https://doi.org/10.1039/c6ee02967a.
[116] G. Pecchi, M.G. Jiliberto, A. Buljan, E.J. Delgado, Relation between defects and catalytic
activity of calcium doped LaFeO 3 perovskite, Solid State Ionics. 187 (2011) 27–32.
https://doi.org/10.1016/j.ssi.2011.02.014.
[117] A. Hunt, Corrigendum to Measuring the oxygen profile and permeation flux across an ion

155
transport (LCF) membrane and the development and validation of a multistep surface
exchange model [J. Membr. Sci. 468 (2014) 62-72], J. Memb. Sci. 479 (2015) 276–276.
https://doi.org/10.1016/j.memsci.2015.01.011.
[118] R.K. Herz, Chemical Reaction Engineering - Part 13 - intro to Plug Flow Reactors, i (2014) 1–
15.
[119] L. Mastropasqua, F. Drago, P. Chiesa, A. Giuffrida, Oxygen transport membranes for efficient
glass melting, Membranes (Basel). 10 (2020) 1–32.
https://doi.org/10.3390/membranes10120442.
[120] M.L. Rodríguez, D.E. Ardissone, E. López, M.N. Pedernera, D.O. Borio, Reactor designs for
ethylene production via ethane oxidative dehydrogenation: Comparison of performance, Ind.
Eng. Chem. Res. 50 (2011) 2690–2697. https://doi.org/10.1021/ie100738q.
[121] T. DiChristopher, Experts explain why green hydrogen costs have fallen and will keep falling,
(n.d.). https://www.spglobal.com/marketintelligence/en/news-insights/latest-news-
headlines/experts-explain-why-green-hydrogen-costs-have-fallen-and-will-keep-falling-
63037203.
[122] G. Ulrich, P. Vasudevan, How to estimate utility costs, (2006). https://go-gale-
com.proxy.lib.uwaterloo.ca/ps/retrieve.do?tabID=T002&resultListType=RESULT_LIST&sea
rchResultsType=SingleTab&hitCount=1&searchType=AdvancedSearchForm¤tPositio
n=1&docId=GALE%7CA144981499&docType=Article&sort=RELEVANCE&contentSegme
nt=ZO.
[123] C. of Toronto, 2020 Water Rates & Fees, (2020). https://www.toronto.ca/services-
payments/property-taxes-utilities/utility-bill/water-rates-and-fees-copy/2020-water-rates-fees/.
[124] ALIBABA, Lanthanum Nitrate Price, (n.d.). https://www.alibaba.com/product-
detail/LaNO33-99-9999-Purity-10277-43-7-Lanthanum-
Nitrate_62560728094.html?mark=google_shopping&seo=1.
[125] ALIBABA, Calcium Nitrate, (n.d.). https://www.alibaba.com/product-detail/Calcium-Nitrate-
99-Ca-NO3-
2_60608190917.html?spm=a2700.7724857.normal_offer.d_title.2b56171e8AoK5E.
[126] ALIBABA, Industry Grade Ferric Nitrate Catalyst, (n.d.). https://www.alibaba.com/product-

156
detail/Industry-Grade-Ferric-Nitrate-Catalyst-
Fe_62501021090.html?spm=a2700.7724857.normal_offer.d_title.77e82b0fCUzG60.
[127] ALIBABA, calcium oxide powder, (n.d.). https://www.alibaba.com/product-detail/Calcium-
Oxide-Powder-Powder-Calcium-
Oxide_62209334799.html?spm=a2700.galleryofferlist.normal_offer.d_title.53bc7481IaLhjZ&
s=p.
[128] chemical-process-industry (CPI) professionals, THE CHEMICAL ENGINEERING PLANT
COST INDEX, (2011). https://www.chemengonline.com/pci-home.
[129] ALIBABA, lanthanum oxide la2O3 powder, (n.d.). https://www.alibaba.com/product-
detail/lanthanum-oxide-la2O3-powder_62356032581.html?mark=google_shopping&seo=1.
[130] H. ZIMMERMANN, R. WALZL, Ullmann’s encyclopedia of industrial chemistry, Reprod.
Dev. Toxicol. (2017) 797–809. https://doi.org/10.1016/B978-0-12-804239-7.00042-1.
[131] S. Lacombe, Z. Durjanova, L. Mleczko, C. Mirodatos, Kinetic modelling of the oxidative
coupling of methane over lanthanum oxide in connection with mechanistic studies, Chem.
Eng. Technol. 18 (1995) 216–223. https://doi.org/10.1002/ceat.270180311.
[132] A. Vatani, E. Jabbari, M. Askarieh, M.A. Torangi, Kinetic modeling of oxidative coupling of
methane over Li/MgO catalyst by genetic algorithm, J. Nat. Gas Sci. Eng. 20 (2014) 347–356.
https://doi.org/10.1016/j.jngse.2014.07.005.
[133] 2 Ali Farsi1, 2∗, Sattar Ghader1, Ali Moradi1, Seyed Soheil Mansouri1, 2, Vahid Shadravan1,
2011 ] 1. Department ofChemical Engineering, Shahid Bahonar University ofKerman,
Kerman, Iran; 2. Young Researchers Society, Shahid Bahonar University ofKerman, Kerman,
Iran [ Manuscript received September 7, 2010; revised January 19, Abstract,
La0.6Sr0.4Co0.8Fe0.2O3−δ nanocatalyst.pdf, (n.d.).
[134] S. Cheng, X. Shuai, Simulation of a catalytic membrane reactor for oxidative coupling of
Methane, AIChE J. 41 (1995) 1598–1601. https://doi.org/10.1002/aic.690410625.

157
Appendix A
Influence of channel width
The channel width was altered between 5E-2 m (base case), 7E-2 m, and 9E-2 m. The inlet volumetric
flow rate was recorded in the three cases and used to find the ratio between the two parameters. As
shown in Table A - 1, ��𝑆𝑇𝑃/wmembrane is maintained constant. In order to validate the feed side accuracy,
the ratio between the molar flow rate of hydrogen on the feed side and the channel width
(∆��𝐻2/wmembrane) is calculated and plotted in Figure A - 1. As expected, the ratio obtained is consistent
given that the ��𝑆𝑇𝑃/wmembrane is maintained constant and the channel width (membrane width) is altered.
Similarly, the sweep side accuracy is validated by plotting the ratio between the molar flow rate of
methane on the sweep side and the channel width (∆��𝐶𝐻4/wmembrane). The trend also shows consistency
of the ∆��𝐶𝐻4/wmembrane as the channel width (membrane width) is altered between the three cases.
Table A - 1 : Change in channel width as VSTP/wchannel is constant
Case Volumetric flow rate(inlet) [m3/s] wchannel [m] ��𝑺𝑻𝑷/wchannel
Base case 7.23E-5 5E-2 1.4E-3
Case 1 1.01E-4 7E-2 1.4E-3
Case 2 1.30E-4 9E-2 1.4E-3
(a) (b)
Figure A - 1 : Ratio between (a) ṅ(H2) and wchannel (b) ṅ(CH4) and wchannel along reactor length
0E+0
2E-4
4E-4
6E-4
8E-4
1E-3
1E-3
0 0.5 1 1.5 2
n(H
2)w
chan
nel
Channel length [m]
n(H₂)/width [base case]
n(H₂)/width [case 1]
n(H₂)/width [case 2]
Isothermal temp. T = 1103.3 [K]ptotal = 1 bar Space-time = 1.87 [kg s/m3]Base case reactor dimensionsAbs tol. = 1E-14 and Rel tol. = 1E-7
3.96E-2
3.98E-2
4.00E-2
4.02E-2
4.04E-2
4.06E-2
4.08E-2
0 0.5 1 1.5 2
n(C
H4)
/wch
ann
el
Channel length [m]
n(CH₄)/width [base case]
n(CH₄)/width [case 1]
n(CH₄)/width [case 2]
Isothermal temp. T = 1103.3 [K]ptotal = 1 bar Space-time = 1.87 [kg s/m3]Base case reactor dimensionsAbs tol. = 1E-14 and Rel tol. = 1E-7

158
Appendix B
Ethylene price estimation
(1) Catalyst
La2O3/caO catalyst pricing was estimated by collecting data from online vendors. La2O3 powder
was found on Alibaba [129]. The cost of purified CaO is taken from the same source [129]. Table B -
1 shows the estimated total cost of the catalyst.
Table B - 1: Total catalyst cost
Compound Price/kg Atomic
concentration
[%]
Amount of
catalyst
used [kg]
The actual
price of each
compound [$]
The total
cost of
catalyst [$]
La2O3
$5/kg
27
0.27
5
1.35
CaO $0.9/kg 73 0.73 0.9 0.657
(2) Membrane
In order to estimate the total cost of the membrane (shown in Table B - 2), the average cost of all
the salts needed to synthesize 1 kg of the membrane in $/kg is collected from online vendors. The
amount to synthesize per kg of perovskite and the total weight of membrane needed are based on the
membrane designed by Wu et al. [37]. The actual cost of salt is calculated as the product of the average
cost and the amount required to synthesize 1 kg of perovskite. Lastly, the total cost is calculated using
Eqn. (4-9).
Table B - 2: Total membrane cost
Required salts Average
cost [$/kg]
Required to
synthesize 1 kg of
perovskites [kg]
Total weight
of membrane
needed
[kg/m2]
Actual
cost of
the salts
[$]
Total surface
area
membrane
[m2]
Total cost
[$]
La (NO3)3•6H2O $2.50 1.67
5.76
4.19
0.0103 0.46 Ca (NO3)2•4H2O $0.29 0.10 0.029
Fe (NO3)3•9H2O $2.00 1.74 3.46

159
(3) Inlet and outlet composition
Assuming that only two reactions occur, a direct OCM reaction from methane to ethylene is assumed,
and methane to carbon dioxide is the combustion, as shown in Eqn. (4-6) and Eqn. (4-15), respectively.
In addition to assuming that complete water removal, inlet, and outlet compositions are calculated and
summarized in Table B - 3.
According to estimation by Nghiem [15], assuming that only two reactions take place in the reactor
and oxygen reacts fully, 1 mol of methane fed in the reactor will produce 𝑌𝐶2𝐻4
2 mol of ethylene and
𝑋𝐶𝐻4 –𝑌𝐶2𝐻4
mol of carbon dioxide, while 1-𝑋𝐶𝐻4 mol of methane remains unconverted. 1 mol of
oxygen is consumed to produce 1 mol of ethylene. 2 mol of oxygen is consumed to produce 1 mol of
carbon dioxide. Assuming total oxygen conversion, 2𝑋𝐶𝐻4-1.5𝑌𝐶2𝐻4
mol of oxygen must be available
along with 1 mol of methane to produce 𝑌𝐶2𝐻4
2 mol of ethylene and 𝑋𝐶𝐻4
–𝑌𝐶2𝐻4 mol of carbon dioxide.

160
Table B - 3 : Inlet and outlet composition
Methane Oxygen Ethylene Carbon
dioxide
Total
Molecular mass
Methane
Oxygen
Ethylene
Carbon dioxide
16
32
28
44
Methane feed, [mol]
Inlet
Outlet
Consumption
1
1-X
X
2X-1.5Y
0
2X-1.5Y
0
Y/2
0
0
X(1-S)
0
1+2X-1.5Y
1 −𝑌
2
3X-1.5Y
Ethylene production, [mol]
Inlet
Outlet
Consumption
2
𝑌
2 − 2𝑋
𝑌
2
𝑆
4 − 3𝑆
𝑆
0
4 − 3𝑆
𝑆
0
1
0
0
2 − 2𝑆
𝑆
0
2 + 4𝑋 − 3𝑋
𝑌
2 − 𝑌
𝑌
6 − 3𝑆
𝑆
Ethylene production, [g]
Inlet
Outlet
Consumption
8
7𝑌
8 − 8𝑋
7𝑌
8
7𝑆
32 − 24𝑆
7𝑆
0
32 − 24𝑆
7𝑆
0
1
0
0
22 − 22𝑆
7𝑆
0
8 + 32𝑋 − 24𝑌
7𝑌
8 + 14𝑋 − 15𝑌
7𝑌
40 − 96𝑆
7𝑆
** S and Y are selectivity and yield of ethylene, while X is the methane conversion.
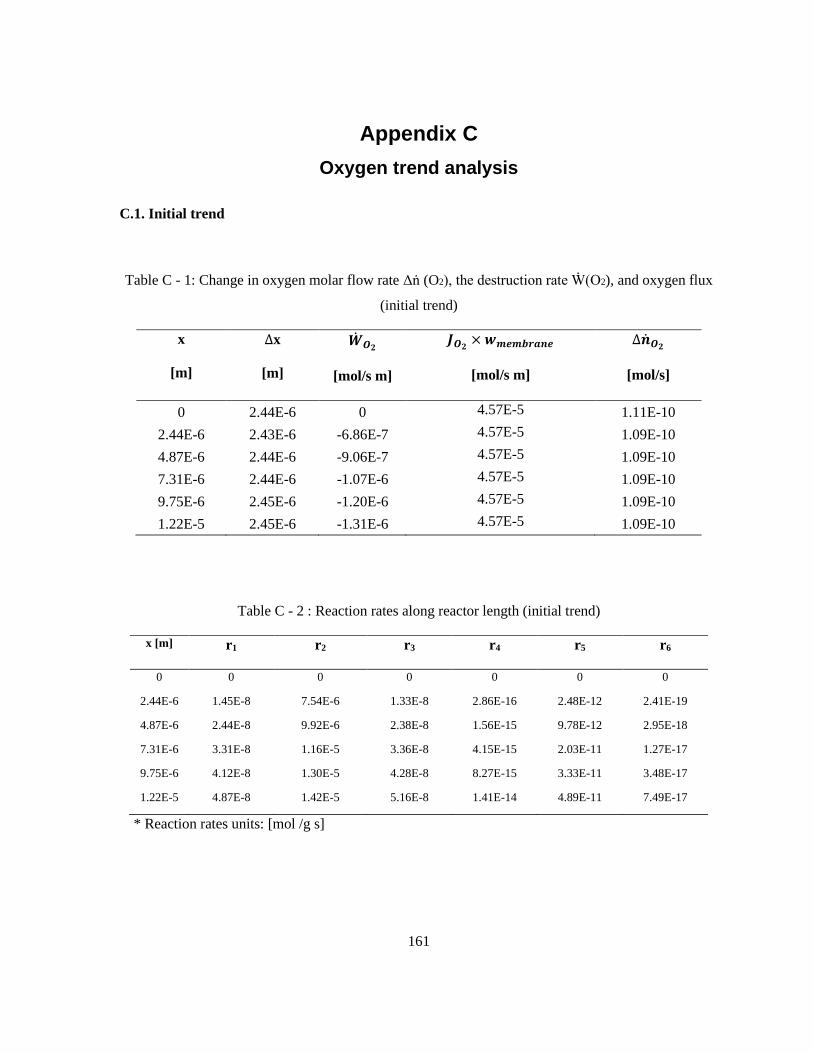
161
Appendix C
Oxygen trend analysis
C.1. Initial trend
Table C - 1: Change in oxygen molar flow rate Δṅ (O2), the destruction rate Ẇ(O2), and oxygen flux
(initial trend)
x
[m]
∆x
[m]
��𝑶𝟐
[mol/s m]
𝑱𝑶𝟐× 𝒘𝒎𝒆𝒎𝒃𝒓𝒂𝒏𝒆
[mol/s m]
∆��𝑶𝟐
[mol/s]
0 2.44E-6 0 4.57E-5 1.11E-10
2.44E-6 2.43E-6 -6.86E-7 4.57E-5 1.09E-10
4.87E-6 2.44E-6 -9.06E-7 4.57E-5 1.09E-10
7.31E-6 2.44E-6 -1.07E-6 4.57E-5 1.09E-10
9.75E-6 2.45E-6 -1.20E-6 4.57E-5 1.09E-10
1.22E-5 2.45E-6 -1.31E-6 4.57E-5 1.09E-10
Table C - 2 : Reaction rates along reactor length (initial trend)
x [m] r1 r2 r3 r4 r5 r6
0 0 0 0 0 0 0
2.44E-6 1.45E-8 7.54E-6 1.33E-8 2.86E-16 2.48E-12 2.41E-19
4.87E-6 2.44E-8 9.92E-6 2.38E-8 1.56E-15 9.78E-12 2.95E-18
7.31E-6 3.31E-8 1.16E-5 3.36E-8 4.15E-15 2.03E-11 1.27E-17
9.75E-6 4.12E-8 1.30E-5 4.28E-8 8.27E-15 3.33E-11 3.48E-17
1.22E-5 4.87E-8 1.42E-5 5.16E-8 1.41E-14 4.89E-11 7.49E-17
* Reaction rates units: [mol /g s]

162
Table C - 3: Sweep side species partial pressures along reactor length (initial trend)
x [m] 𝑷𝑶𝟐 𝑷𝑪𝑯𝟒
𝑷𝑪𝟐𝑯𝟒 𝑷𝑯𝟐𝑶 𝑷𝑪𝟐𝑯𝟔
𝑷𝑪𝑶𝟐 𝑷𝑯𝟐
𝑷𝑪𝑶
0 0 7E+4 0 0 0 0 0 0
2.44E-6 3.67E-2 7E+4 4.30E-9 5.93E-4 5.90E-4 1.10E-6 1.00E-6 9.96E-7
4.87E-6 7.31E-2 7E+4 2.72E-8 1.92E-3 1.91E-3 3.98E-6 3.76E-6 3.73E-6
7.31E-6 1.09E-1 7E+4 7.94E-8 3.55E-3 3.53E-3 8.22E-6 8.02E-6 7.94E-6
9.75E-6 1.45E-1 7E+4 1.66E-7 5.36E-3 5.31E-3 1.36E-5 1.37E-5 1.35E-5
1.22E-5 1.81E-1 7E+4 2.89E-7 7.37E-3 7.31E-3 2.02E-5 2.07E-5 2.04E-5
* Partial pressures units: [Pa]
C.2. peak trend
Table C - 4: Change in oxygen molar flow rate Δṅ (O2), the destruction rate Ẇ(O2), and oxygen flux
(peak)
x [m] ∆x [m] ��𝑶𝟐[mol/s
m]
𝑱𝑶𝟐× 𝒘𝒎𝒆𝒎𝒃𝒓𝒂𝒏𝒆 [mol/s m] ∆��𝑶𝟐
[mol/s]
4.9514E-2 1.1344E-3 -4.2856E-5 4.567E-5 3.1889E-9
5.0648E-2 1.1344E-3 -4.3384E-5 4.567E-5 2.5905E-9
5.1783E-2 1.1233E-3 -4.3898E-5 4.567E-5 1.9873E-9
5.2906E-2 1.1232E-3 -4.4399E-5 4.567E-5 1.4248E-9
5.4029E-2 1.1233E-3 -4.4885E-5 4.567E-5 8.7847E-10
5.5152E-2 1.1233E-3 -4.5357E-5 4.567E-5 3.4845E-10
5.6276E-2 1.1226E-3 -4.5814E-5 4.567E-5 -1.6451E-10
5.7398E-2 1.1227E-3 -4.6255E-5 4.567E-5 -6.5996E-10
5.8521E-2 1.1226E-3 -4.6681E-5 4.567E-5 -1.1375E-9
4.9514E-2 1.1226E-3 -4.7090E-5 4.567E-5 -1.5971E-9

163
Table C - 5 : Reaction rates along reactor length (peak)
x [m] r1 r2 r3 r4 r5 r6
4.951E-2 1.258E-5 2.405E-4 2.557E-5 3.615E-6 2.671E-5 2.597E-5
5.065E-2 1.261E-5 2.407E-4 2.564E-5 3.814E-6 2.732E-5 2.713E-5
5.178E-2 1.264E-5 2.408E-4 2.569E-5 4.018E-6 2.791E-5 2.828E-5
5.291E-2 1.266E-5 2.408E-4 2.573E-5 4.227E-6 2.848E-5 2.944E-5
5.403E-2 1.267E-5 2.407E-4 2.576E-5 4.439E-6 2.905E-5 3.058E-5
5.515E-2 1.267E-5 2.406E-4 2.576E-5 4.656E-6 2.959E-5 3.172E-5
5.628E-2 1.267E-5 2.405E-4 2.576E-5 4.877E-6 3.013E-5 3.284E-5
5.740E-2 1.267E-5 2.403E-4 2.574E-5 5.101E-6 3.065E-5 3.396E-5
5.852E-2 1.265E-5 2.400E-4 2.571E-5 5.330E-6 3.115E-5 3.505E-5
4.951E-2 1.264E-5 2.397E-4 2.566E-5 5.558E-6 3.164E-5 3.610E-5
* Reaction rates units: [mol /g s]
Table C - 6: Sweep side species partial pressures along reactor length (peak)
x [m] 𝑷𝑶𝟐 𝑷𝑪𝑯𝟒
𝑷𝑪𝟐𝑯𝟒 𝑷𝑯𝟐𝑶 𝑷𝑪𝟐𝑯𝟔
𝑷𝑪𝑶𝟐 𝑷𝑯𝟐
𝑷𝑪𝑶
4.95E-2 2.73E+2 6.83E+4 9.34E+1 7.63E+2 4.63E+2 2.90E+1 1.33E+2 9.36E+1
5.06E-2 2.74E+2 6.83E+4 9.74E+1 7.87E+2 4.73E+2 3.01E+1 1.38E+2 9.86E+1
5.18E-2 2.75E+2 6.82E+4 1.02E+2 8.13E+2 4.84E+2 3.13E+1 1.44E+2 1.04E+2
5.29E-2 2.76E+2 6.82E+4 1.06E+2 8.38E+2 4.94E+2 3.24E+1 1.50E+2 1.09E+2
5.40E-2 2.76E+2 6.81E+4 1.10E+2 8.63E+2 5.04E+2 3.35E+1 1.56E+2 1.14E+2
5.52E-2 2.76E+2 6.81E+4 1.14E+2 8.89E+2 5.14E+2 3.47E+1 1.62E+2 1.20E+2
5.63E-2 2.76E+2 6.81E+4 1.18E+2 9.15E+2 5.23E+2 3.59E+1 1.68E+2 1.26E+2
5.74E-2 2.76E+2 6.80E+4 1.22E+2 9.40E+2 5.33E+2 3.71E+1 1.74E+2 1.31E+2
5.85E-2 2.76E+2 6.80E+4 1.27E+2 9.67E+2 5.42E+2 3.83E+1 1.81E+2 1.37E+2
4.95E-2 2.75E+2 6.79E+4 1.31E+2 9.93E+2 5.52E+2 3.95E+1 1.87E+2 1.43E+2
* Partial pressures units: [Pa]

164
Table C - 7: Oxygen flux permeation network parameters along reactor length (peak trend)
x [m] 𝑪𝑶𝟐
(𝑿𝑶𝟐,𝒔𝒖𝒓𝒇 × 𝑪𝒔𝒘𝒆𝒆𝒑,𝒕𝒐𝒕𝒂𝒍)
𝑪𝑯𝟐𝑶
(𝑿𝑯𝟐𝑶,𝒔𝒖𝒓𝒇 × 𝑪𝒇𝒆𝒆𝒅,𝒕𝒐𝒕𝒂𝒍)
Chemical
potential term
Oxygen flux
[mol/m2 s]
4.9514E-2 2.9085E+1 8.3315E+3 9.2273 4.567E-4
5.0648E-2 2.9161E+1 8.3279E+3 9.2152 4.567E-4
5.1783E-2 2.9217E+1 8.3242E+3 9.2064 4.567E-4
5.2906E-2 2.9253E+1 8.3206E+3 9.2007 4.567E-4
5.4029E-2 2.9271E+1 8.3170E+3 9.1979 4.567E-4
5.5152E-2 2.9271E+1 8.3134E+3 9.1980 4.567E-4
5.6276E-2 2.9253E+1 8.3097E+3 9.2007 4.567E-4
5.7398E-2 2.9219E+1 8.3061E+3 9.2061 4.567E-4
5.8521E-2 2.9169E+1 8.3025E+3 9.2140 4.567E-4
4.9514E-2 2.9103E+1 8.2989E+3 9.2244 4.567E-4
C.3. Valley
Table C - 8: Change in oxygen molar flow rate is affected by the destruction rate of oxygen and the
oxygen flux along the reactor length (valley)
x [m] ∆x [m] ��𝑶𝟐[mol/s
m]
𝑱𝑶𝟐× 𝒘𝒎𝒆𝒎𝒃𝒓𝒂𝒏𝒆
[mol/s m]
∆��𝑶𝟐[mol/s]
2.7732E-1 1.2658E-3 -4.5693E-5 4.566736254E-5 -3.2862E-11
2.7859E-1 1.2928E-3 -4.5685E-5 4.566736249E-5 -2.3335E-11
2.7988E-1 1.2928E-3 -4.5678E-5 4.566736245E-5 -1.3235E-11
2.8117E-1 1.2928E-3 -4.5669E-5 4.566736241E-5 -3.0458E-12
2.8247E-1 1.2928E-3 -4.5662E-5 4.566736236E-5 7.0156E-12
2.8376E-1 1.3217E-3 -4.5654E-5 4.566736232E-5 1.7331E-11
2.8508E-1 1.3217E-3 -4.5647E-5 4.566736228E-5 2.7364E-11

165
Table C - 9 : Reaction rates along reactor length (valley)
x [m] r1 r2 r3 r4 r5 r6
2.773E-1 5.439E-6 1.406E-4 9.790E-6 3.198E-5 2.773E-1 5.439E-6
2.786E-1 5.436E-6 1.405E-4 9.782E-6 3.211E-5 2.786E-1 5.436E-6
2.799E-1 5.432E-6 1.404E-4 9.775E-6 3.223E-5 2.799E-1 5.432E-6
2.812E-1 5.429E-6 1.402E-4 9.768E-6 3.236E-5 2.812E-1 5.429E-6
2.825E-1 5.426E-6 1.401E-4 9.761E-6 3.249E-5 2.825E-1 5.426E-6
2.838E-1 5.423E-6 1.400E-4 9.755E-06 3.262E-5 2.838E-1 5.423E-6
2.851E-1 5.420E-6 1.398E-4 9.748E-6 3.274E-5 2.851E-1 5.420E-6
* Reaction rates units: [mol /g s]
Table C - 10 : Sweep side species partial pressures along reactor length (valley)
x [m] 𝑷𝑶𝟐 𝑷𝑪𝑯𝟒
𝑷𝑪𝟐𝑯𝟒 𝑷𝑯𝟐𝑶 𝑷𝑪𝟐𝑯𝟔
𝑷𝑪𝑶𝟐 𝑷𝑯𝟐
𝑷𝑪𝑶
4.95E-2 9.74E+1 6.03E+4 1.17E+3 5.34E+3 8.86E+2 4.63E+2 1.78E+3 1.49E+3
5.06E-2 9.74E+1 6.03E+4 1.17E+3 5.36E+3 8.86E+2 4.66E+2 1.79E+3 1.49E+3
5.18E-2 9.74E+1 6.03E+4 1.18E+3 5.39E+3 8.85E+2 4.70E+2 1.80E+3 1.50E+3
5.29E-2 9.73E+1 6.02E+4 1.18E+3 5.41E+3 8.85E+2 4.74E+2 1.81E+3 1.51E+3
5.40E-2 9.73E+1 6.02E+4 1.19E+3 5.43E+3 8.84E+2 4.77E+2 1.82E+3 1.51E+3
5.52E-2 9.73E+1 6.01E+4 1.19E+3 5.45E+3 8.83E+2 4.81E+2 1.83E+3 1.52E+3
5.63E-2 9.73E+1 6.01E+4 1.20E+3 5.47E+3 8.83E+2 4.85E+2 1.83E+3 1.53E+3
5.74E-2 9.74E+1 6.03E+4 1.17E+3 5.34E+3 8.86E+2 4.63E+2 1.78E+3 1.49E+3
5.85E-2 9.74E+1 6.03E+4 1.17E+3 5.36E+3 8.86E+2 4.66E+2 1.79E+3 1.49E+3
4.95E-2 9.74E+1 6.03E+4 1.18E+3 5.39E+3 8.85E+2 4.70E+2 1.80E+3 1.50E+3
Related Documents