ELLEN BRANCH KAITLYN COLLINS LAUREN CHANDLER NOBLES A Comparative Display of Health Outcomes in Eastern North Carolina

ELLEN BRANCH KAITLYN COLLINS LAUREN CHANDLER NOBLES A Comparative Display of Health Outcomes in Eastern North Carolina.
Dec 16, 2015
Welcome message from author
This document is posted to help you gain knowledge. Please leave a comment to let me know what you think about it! Share it to your friends and learn new things together.
Transcript

ELLEN BRANCHKAITLYN COLLINS
LAUREN CHANDLER NOBLES
A Comparative Display of Health Outcomes in Eastern
North Carolina
Health Outcomes in Eastern N.C.
A comparative display of health outcomes in Eastern North Carolina by category of race (white or non-white) and county Counties were grouped by white, non-white, or evenly
balanced (20% or less difference) Non-white: African American, Asian, American Indian/
Alaskan Native, Native Hawaiian/Pacific Islander, Other, and 2 or more races
Is there a correlation between a person being of a minority race (non-white) and having higher disease (or stroke) mortality rates? Hypothesis: Being of a minority race (non-white) is positively
correlated with a higher disease (or stroke) mortality rate.
Methodology
Comparison Groups: White vs. non-white Data source: NC Health Data Explorer Measures: 1 year mortality rates per 100,000 in 2010 for 5
health indicators (white and non-white)1. Heart disease2. Cancer3. Stroke4. COPD5. Diabetes
Rates were used instead of counts to allow comparison of health events between two populations.
Counties of focus: counties in the Eastern N.C. region Counties of particular focus include, but are not limited to: Tyrrell,
Hertford, Washington, Hyde, Jones, Hoke, Perquimans, Currituck, Greene, Dare, Bertie, Pender, Camden

5 Indicators of Health
According to the North Carolina State Center for Health Statistics, the top five leading causes of death in Eastern N.C. are: heart disease, cancer, cerebrovascular disease, chronic lower respiratory disease, and diabetes. In place of cerebrovascular disease, stroke is used
because it is classified as a cerebrovascular accident. In place of chronic lower respiratory disease, COPD is
used because it is a broad term for chronic respiratory diseases, such as chronic bronchitis and emphysema. Chronic Obstructive Pulmonary Disease

County Groupings
Mostly White (19)- Beaufort, Brunswick, Camden, Carteret, Chowan, Columbus, Craven, Currituck, Dare, Gates, Harnett, Hyde, Johnston, Jones, New Hanover, Onslow, Pamlico, Pender, Perquimans
Mostly Non-White (5)- Bertie, Edgecombe, Hertford, North Hampton, Robeson
Evenly Balanced* (17)- Bladen, Cumberland, Duplin, Greene, Halifax, Hoke, Lenoir, Martin, Nash, Pasquotank, Pitt, Sampson, Scotland, Tyrrell, Washington, Wayne, Wilson
* +/- 20% population distribution

5 Indicators of Health: Heart Disease
Heart Disease
• Minorities are at a greater risk for heart disease.
• African Americans and American Indians/Alaskan Natives are more likely than whites to have high blood pressure.
• Mexican Americans are more likely to be obese/overweight.• Both are risk factors

Heart Disease Findings in Eastern N.C.
Highest
Lowest
Average
0 50 100 150 200 250 300 350
Average Heart Disease Mortality in Whites in Eastern NC, 2010
Heart Disease- Whites
Highest
Lowest
Average
0 50 100 150 200 250 300 350
Average Heart Disease Mortality in Non-whites in Eastern NC, 2010
Heart Disease- Non Whites
Non-whites fare slightly worse than whites for heart disease mortality rates.
Lowest: Hertford, New Hanover, Hoke, Pamlico, Pender Highest: Tyrrell, Martin, Scotland, Washington, Hyde
Lowest: Hyde, Gates, Dare, Tyrrell, BertieHighest: Washington, Martin, Columbus, Perquimans, Nash

5 Indicators of Health: Cancer
Cancer
• Health care coverage and low socioeconomic status are the most obvious factors that contribute to health disparities in cancer among various racial and ethnic groups.
• African Americans have the highest rates of cancer.

Cancer Findings in Eastern N.C.
Highest
Lowest
Average
0 50 100 150 200 250 300
Average Cancer Mortality in Whites in Eastern NC, 2010
Cancer-Whites
Highest
Lowest
Average
0 50 100 150 200 250
Average Cancer Mortality for Non-whites in Eastern NC, 2010
Cancer-Non Whites
Whites fare worse than non-whites for cancer mortality rates.
Lowest: Pitt, Camden, Pamlico, Pender, Perquimans Highest: Tyrrell, Gates, Jones, Washington, Pasquotank
Lowest: Dare, Tyrrell, Camden, Perquimans, Martin Highest: Wilson, Lenoir, Pitt, Carteret, Columbus

5 Indicators of Health: Stroke
Stroke • African Americans have a much higher risk of death from
strokes than Whites.• Higher risk of controllable risk factors: high blood
pressure, diabetes • Uncontrollable risk factors include being African American,
Hispanic, or Asian/ Pacific Islander.

Stroke Findings in Eastern N.C.
Highest
Lowest
Average
0 10 20 30 40 50 60 70
Average Stroke Mortality in Whites in Eastern NC, 2010
Stroke-Whites
Highest
Lowest
Average
0 20 40 60 80 100 120 140
Average Stroke Mortality for Non-whites in Eastern NC, 2010
Stroke- Non Whites
Non-whites generally fare worse than whites for stroke mortality rates.
Lowest: Hoke, Lenoir, Dare, Gates, Pasquotank Highest: Jones, Beaufort, Halifax, Greene, Edgecombe
Lowest: Perquimans, Pamlico, Currituck, Scotland, Pender Highest: Hyde, Dare, Greene, Edgecombe, Camden

5 Indicators of Health: COPD
COPD Age-adjusted death rates are
higher among Whites and men.
Whites have the highest rates for women, and Native American/Alaskan Native women are 2nd.
Hispanics have much lower rates than Whites and other racial groups.
COPD findings in Eastern N.C.
Highest
Lowest
Average
0 10 20 30 40 50 60 70 80 90 100
Average COPD Mortality in Whites in Eastern NC, 2010
COPD-Whites
Highest
Lowest
Average
0 10 20 30 40 50 60 70 80
Average COPD Mortality for Non-whites in Eastern NC, 2010
COPD-Non Whites
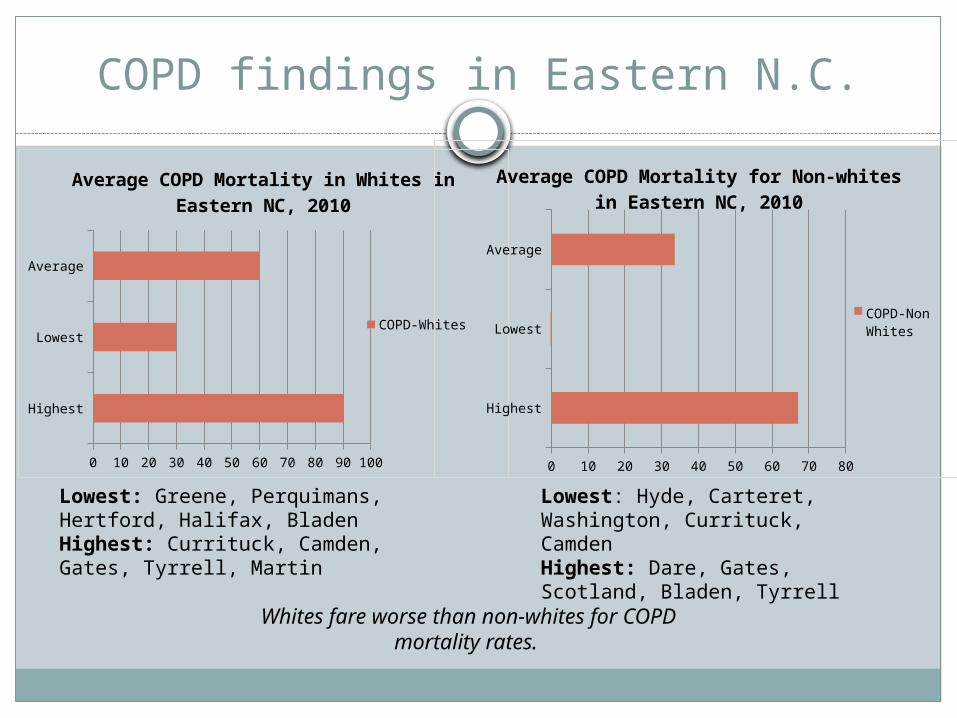
Whites fare worse than non-whites for COPD mortality rates.
Lowest: Greene, Perquimans, Hertford, Halifax, Bladen Highest: Currituck, Camden, Gates, Tyrrell, Martin
Lowest: Hyde, Carteret, Washington, Currituck, Camden Highest: Dare, Gates, Scotland, Bladen, Tyrrell
5 Health Indicators: Diabetes
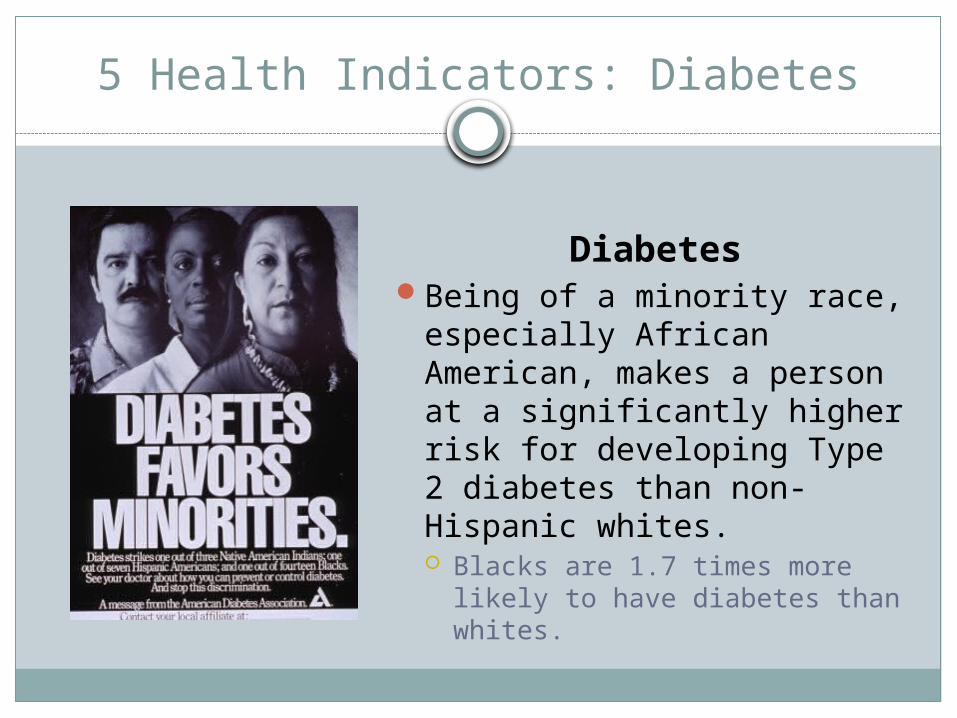
DiabetesBeing of a minority race,
especially African American, makes a person at a significantly higher risk for developing Type 2 diabetes than non-Hispanic whites. Blacks are 1.7 times more likely
to have diabetes than whites.

Diabetes Findings in Eastern N.C.
Highest
Lowest
Average
0 5 10 15 20 25 30 35 40 45
Average Diabetes Mortality in Whites in Eastern NC, 2010
Diabetes- Whites
Highest
Lowest
Average
0 10 20 30 40 50 60 70 80 90 100
Average Diabetes Mortality for Non-whites in Eastern NC, 2010
Diabetes-Non Whites
Non-whites fare much worse than whites for diabetes mortality rates.
Lowest: Tyrrell, Washington, Currituck, Perquimans, Pamlico Highest: Bertie, Hertford, Robeson, Chowan, Hyde
Lowest: Camden, Currituck, Pamlico, Carteret, DareHighest: Pender, Tyrrell, Sampson, Scotland, Wayne
Conclusions
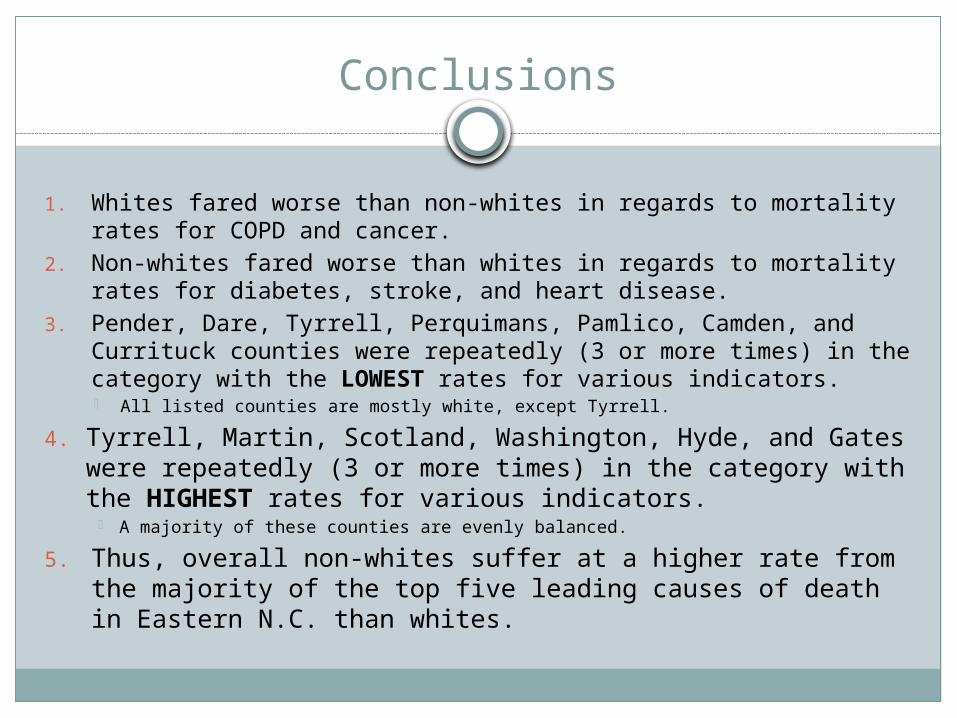
1. Whites fared worse than non-whites in regards to mortality rates for COPD and cancer.
2. Non-whites fared worse than whites in regards to mortality rates for diabetes, stroke, and heart disease.
3. Pender, Dare, Tyrrell, Perquimans, Pamlico, Camden, and Currituck counties were repeatedly (3 or more times) in the category with the LOWEST rates for various indicators. All listed counties are mostly white, except Tyrrell.
4. Tyrrell, Martin, Scotland, Washington, Hyde, and Gates were repeatedly (3 or more times) in the category with the HIGHEST rates for various indicators.
A majority of these counties are evenly balanced.
5. Thus, overall non-whites suffer at a higher rate from the majority of the top five leading causes of death in Eastern N.C. than whites.

SOURCES
http://seer.cancer.gov/statfacts/html/all.html http://www.cancer.gov/cancertopics/factsheet/disparities/cancer-health-
disparities#4 http://www.cdc.gov/heartdisease/statistics.htm http://www.lung.org/assets/documents/publications/solddc-chapters/
copd.pdf http://www.stroke.org/site/PageServer?pagename=RISK http://
www.strokeassociation.org/STROKEORG/AboutStroke/UnderstandingRisk/Understanding-Risk_UCM_308539_SubHomePage.jsp
www.mayoclinic.com/health/stroke/DS00150/DSECTION=risk-factors www.cdc.gov/diabetes/index.htm http://books.google.com/books?id=5Sn4xuHBfmkC&pg=PA159&lpg=P
A159&dq=copd+rates+in+minorities&source=bl&ots=s3EMGQ4E1T&sig=ZtsRjLR2nbFcfhIG0c5jLuVLFzM&hl=en&sa=X&ei=1Et0UcP1MrWu4AOo1oGYBw&ved=0CHcQ6AEwBg#v=onepage&q=copd%20rates%20in%20minorities&f=false
Related Documents