Group Versus Individual Use of Power-Only EPMcreate as a Creativity Enhancement Technique for Requirements Elicitation 2013 V. Sakhnini, L. Mich, and D.M. Berry EMSE Group Sizes in CETs Pg. 1

Welcome message from author
This document is posted to help you gain knowledge. Please leave a comment to let me know what you think about it! Share it to your friends and learn new things together.
Transcript

Group Versus Individual Useof Power-Only EPMcreate asa Creativity EnhancementTechnique for RequirementsElicitation
2013 V. Sakhnini, L. Mich, and D.M. Berry EMSE Group Sizes in CETs Pg. 1

by
Victoria Sakhnini1,Luisa Mich2,Daniel M. Berry1
1University of Waterloo, Canada,[email protected], [email protected] of Trento, Italy,[email protected]
2013 V. Sakhnini, L. Mich, and D.M. Berry EMSE Group Sizes in CETs Pg. 2

Introduction
Creativity is often needed in requirementselicitation, e.g., in generating ideas forrequirements.
Techniques to enhance creativity are believedto be useful.
In our research, we have been investigatingEPMcreate (EPM Creative RequirementsEngineering [A] TEchnique), which is basedon the Elementary Pragmatic Model (EPM) ofthe pragmatics of communication.
2013 V. Sakhnini, L. Mich, and D.M. Berry EMSE Group Sizes in CETs Pg. 3

Acronyms to Save Space in Slides
RElic = requirements elicitation
RA = requirements analyst or engineer
BS = brainstorming
CET = creativity enhancement technique
2013 V. Sakhnini, L. Mich, and D.M. Berry EMSE Group Sizes in CETs Pg. 4

EPMcreate
EPMcreate supports idea generation in RElicby focusing the RA’s search for ideas on onlyone logical combination of two stakeholders’viewpoints at a time.
16 combinations are possible, correspondingto the 16 basic boolean functions, fi for0≤ i≤15, of two variables.
2013 V. Sakhnini, L. Mich, and D.M. Berry EMSE Group Sizes in CETs Pg. 5

16 Boolean Functionsof 2 Variablesiiiiiiiiiiiiiiiiiiiiiiiiiiiiiiiiiiiiiiiiiiiiiiiiiiiiiiiiiiiiii
V1 V2 f 0 f 1 f 2 f 3 f 4 f 5 f 6 f 7iiiiiiiiiiiiiiiiiiiiiiiiiiiiiiiiiiiiiiiiiiiiiiiiiiiiiiiiiiiiiiiiiiiiiiiiiiiiiiiiiiiiiiiiiiiiiiiiiiiiiiiiiiiiiiiiiiiiiiiiiiii0 0 0 0 0 0 0 0 0 00 1 0 0 0 0 1 1 1 11 0 0 0 1 1 0 0 1 1
ccccccc
1 ccccccc
1 ccccccc
0 ccccccc
1 ccccccc
0 ccccccc
1 ccccccc
0 ccccccc
1 ccccccc
0 ccccccc
1 ccccccc
iiiiiiiiiiiiiiiiiiiiiiiiiiiiiiiiiiiiiiiiiiiiiiiiiiiiiiiiiiiiiiiiiiiiiiiiiiiiiiiiiiiiiiiiiiiiiiiiiiiiiiiiiiiiiiiiiiiiiiiiiiii
V1 V2 f 8 f 9 f 10 f 11 f 12 f 13 f 14 f 15iiiiiiiiiiiiiiiiiiiiiiiiiiiiiiiiiiiiiiiiiiiiiiiiiiiiiiiiiiiiiiiiiiiiiiiiiiiiiiiiiiiiiiiiiiiiiiiiiiiiiiiiiiiiiiiiiiiiiiiiiiii0 0 1 1 1 1 1 1 1 10 1 0 0 0 0 1 1 1 11 0 0 0 1 1 0 0 1 11 1 0 1 0 1 0 1 0 1iiiiiiiiiiiiiiiiiiiiiiiiiiiiiiiiiiiiiiiiiiiiiiiiiiiiiiiiiiiiiicc
ccccc
ccccccc
ccccccc
ccccccc
ccccccc
ccccccc
ccccccc
ccccccc
ccccccc
ccccccc
ccccccc
2013 V. Sakhnini, L. Mich, and D.M. Berry EMSE Group Sizes in CETs Pg. 6

EPMcreate in Practice
EPMcreate can be used whenever ideageneration is needed during RElic.
When a lead RA determines that EPMcreateshould be applied during RElic for the systembeing built, …
2013 V. Sakhnini, L. Mich, and D.M. Berry EMSE Group Sizes in CETs Pg. 7

EPMcreate in Practice, Cont’d
she chooses 2 kinds of stakeholders, SH1 andSH2, usually users of the system with differentroles.
E.g., the selected stakeholder types could be
g students and lecturers for an e-learningapplication, and
g employees of the selling and buyingcompanies for a system supporting acompany’s B2B activities.
2013 V. Sakhnini, L. Mich, and D.M. Berry EMSE Group Sizes in CETs Pg. 8

EPMcreate in Practice, Cont’d
Normally, not all pairs of stakeholder types areused.
The lead RA chooses pairs she believes to beinformative.
She then convenes a group of RAs and showsthem the Venn Diagram on the next slide.
2013 V. Sakhnini, L. Mich, and D.M. Berry EMSE Group Sizes in CETs Pg. 9

Venn Diagram of Viewpoints
Stakeholder A Shared Viewpoints Stakeholder B
Other Viewpoints
The two ellipses represent 2 stakeholders’viewpoints.
2013 V. Sakhnini, L. Mich, and D.M. Berry EMSE Group Sizes in CETs Pg. 10

Instructions given to RAs
The lead RA tells all convened RAs:
“Today, we are going to generate requirementideas for the system S in 16 idea generationsteps. In all the steps, you will be pretendingto think from the viewpoints of two particularstakeholders of S, SH1 and SH2.
2013 V. Sakhnini, L. Mich, and D.M. Berry EMSE Group Sizes in CETs Pg. 11

Step 0, for f 0 = 0
In Step 0, you will blank out your minds.
Step 1, for f 1 = SH1∧SH2
In Step 1, you will try to come up with ideasfor problem solutions that are needed by bothSH1 and SH2.
2013 V. Sakhnini, L. Mich, and D.M. Berry EMSE Group Sizes in CETs Pg. 12

Step 2, for f 2 = SH1∧¬SH2
In Step 2, you will try to come up with ideasfor problem solutions that are needed by SH1but not by SH2.
Step 3, for f 3 = SH1
In Step 3, you will try to come up with ideasfor problem solutions that are needed by SH1without concern as to whether they areneeded by SH2.
2013 V. Sakhnini, L. Mich, and D.M. Berry EMSE Group Sizes in CETs Pg. 13

Step 4, for f 4 = ¬SH1∧SH2
In Step 4, you will try to come up with ideasfor problem solutions that are needed by SH2but not by SH1.
Step 5, for f 5 = SH2
In Step 5, you will try to come up with ideasfor problem solutions that are needed by SH2without concern as to whether they areneeded by SH1.…
2013 V. Sakhnini, L. Mich, and D.M. Berry EMSE Group Sizes in CETs Pg. 14
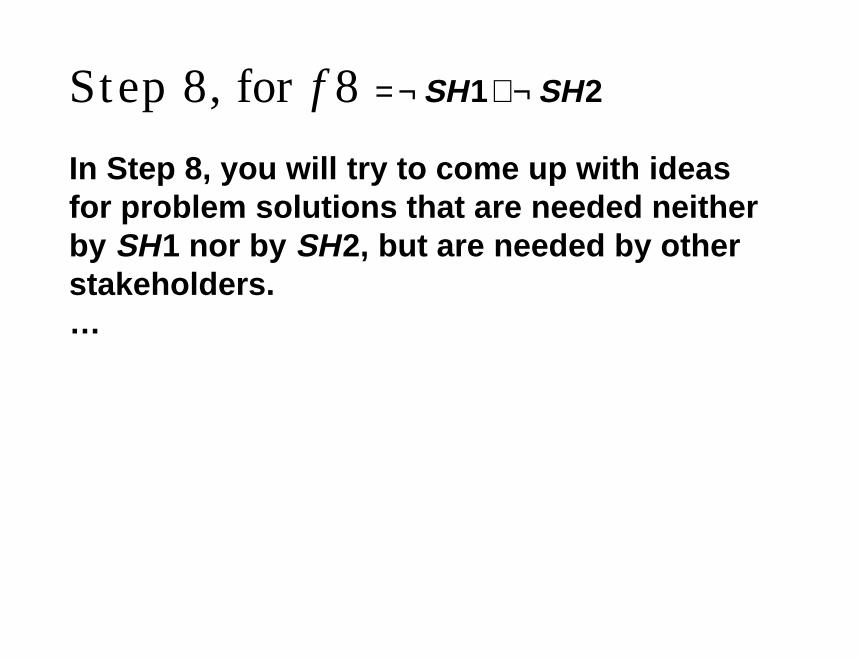
Step 8, for f 8 = ¬SH1∧¬SH2
In Step 8, you will try to come up with ideasfor problem solutions that are needed neitherby SH1 nor by SH2, but are needed by otherstakeholders.…
2013 V. Sakhnini, L. Mich, and D.M. Berry EMSE Group Sizes in CETs Pg. 15
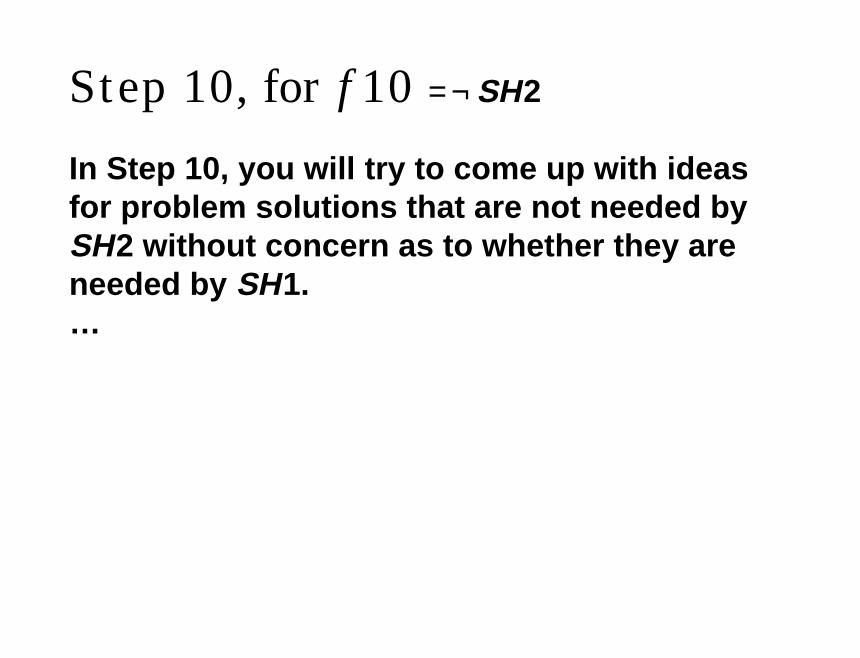
Step 10, for f 10 = ¬SH2
In Step 10, you will try to come up with ideasfor problem solutions that are not needed bySH2 without concern as to whether they areneeded by SH1.…
2013 V. Sakhnini, L. Mich, and D.M. Berry EMSE Group Sizes in CETs Pg. 16

Step 15, for f 15 = 1
In Step 15, you will try to come up with ideasfor problem solutions without concern as towhether they are needed by either SH1 orSH2.”
2013 V. Sakhnini, L. Mich, and D.M. Berry EMSE Group Sizes in CETs Pg. 17
Optimization, POEPMcreate
We demonstrated in experiments that oneoptimization of EPMcreate, the Power-OnlyEPMcreate (POEPMcreate), is more efficient insupporting idea generation for RElic.
POEPMcreate does only the 4 steps whosenames include the powers of 2, namely Steps1, 2, 4, and 8.
“more efficient” means that more and betterideas are generated in a smaller amount oftime (with no space–time tradeoff)!
2013 V. Sakhnini, L. Mich, and D.M. Berry EMSE Group Sizes in CETs Pg. 18
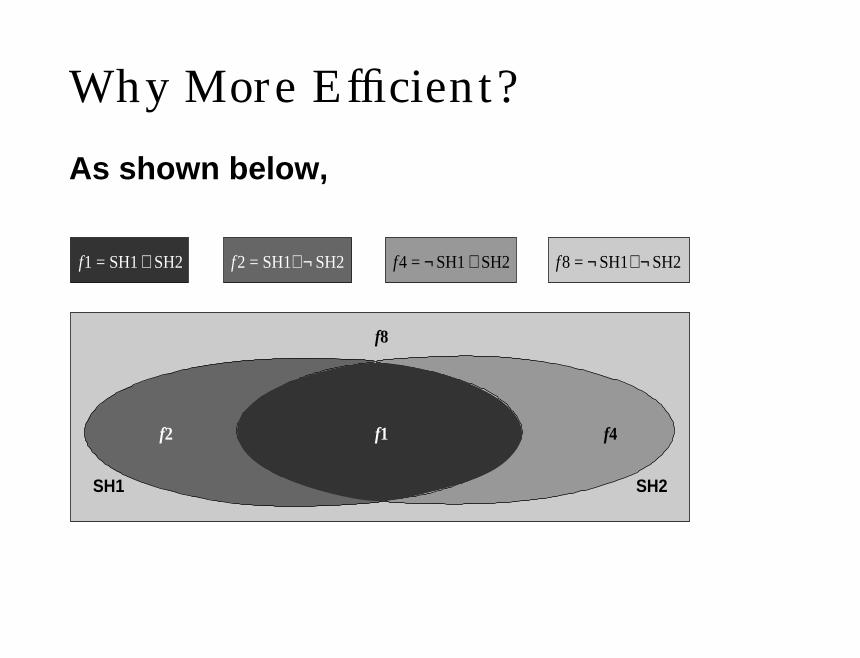
Why More Efficient?
As shown below,
8 = SH1 SH2f f f1 = SH1 SH2 2 = SH1 SH2 4 = SH1 SH2f ¬∧ ¬ ∧ ∧¬¬∧
SH1
f
ff
8
12 4
SH2
f
2013 V. Sakhnini, L. Mich, and D.M. Berry EMSE Group Sizes in CETs Pg. 19
Why, Cont’d
the Boolean function of each of the power-of-2steps corresponds to exactly one of the fourregions of the Venn Diagram shown before.
Thus, the 4 power-of-2 steps suffice to coverthe entire space of potential ideas, …
and the other 12 steps just repeat thecoverage.
2013 V. Sakhnini, L. Mich, and D.M. Berry EMSE Group Sizes in CETs Pg. 20

EPMcreate’s Effectiveness
We have conducted controlled experimentswhich used an online course system, an e-government system, the Website of a jazzfestival, and the Website of a Canadian highschool as the systems about which to elicitrequirement ideas.
2013 V. Sakhnini, L. Mich, and D.M. Berry EMSE Group Sizes in CETs Pg. 21

Notation in the Results
In the following, “A ≥ B ” ≡ “A is more effectivethan B in helping to generate requirementideas, measured by numbers of both raw(quantity) ideas and new (quality) ideas”.
Here, “new” is taken relative to the existingsystem.
2013 V. Sakhnini, L. Mich, and D.M. Berry EMSE Group Sizes in CETs Pg. 22

Controlled Experiment Results
These controlled experiments concluded withstatistically significant results that
EPMcreate ≥ BS
and
POEPMcreate ≥ EPMcreate.
2013 V. Sakhnini, L. Mich, and D.M. Berry EMSE Group Sizes in CETs Pg. 23

Focus on POEPMcreate
Because POEPMcreate ≥ EPMcreate in bothspace and time,
and thus we will be using only POEPMcreate,
we focus our experiments on POEPMcreate,
to conserve the very valuable subjectresource.
2013 V. Sakhnini, L. Mich, and D.M. Berry EMSE Group Sizes in CETs Pg. 24

New Research Question
Does the number of members of an elicitationgroup using EPMcreate or POEPMcreate as aCET affect the number of requirement ideasgenerated by the group and by each member?
When we started, we really had no idea aboutthe answer.
So we started with null hypotheses.
2013 V. Sakhnini, L. Mich, and D.M. Berry EMSE Group Sizes in CETs Pg. 25

Hypotheses
H1 In POEPMcreate, the number of membersof an elicitation group has no effect on thequantity and quality of the requirementideas generated by the group.
H2 In POEPMcreate, the number of membersof an elicitation group has no effect on thequantity and quality of the requirementideas generated on average by eachmember of the group.
2013 V. Sakhnini, L. Mich, and D.M. Berry EMSE Group Sizes in CETs Pg. 26

Method
We combined the data of 3 identicallystructured experiments in which individualsand groups of size 2 and 4 used POEPMcreateto generate ideas for requirements forenhancing one Canadian high school’sWebsite.
2013 V. Sakhnini, L. Mich, and D.M. Berry EMSE Group Sizes in CETs Pg. 27

Method, Cont’d
Later, for triangulation, we conducted a surveyto determine software developmentpractitioners’ attitudes on the comparison ofthe effectiveness of individuals and groups inrequirements elicitation for real projects.
2013 V. Sakhnini, L. Mich, and D.M. Berry EMSE Group Sizes in CETs Pg. 28
Results of the Experiments
The next two slides show graphs of the data ofthe combined experiments:
1. the number of raw and new requirementsideas generated by entire groups, and
2. the number of raw and new requirementsideas generated on average by eachmember of groups.
2013 V. Sakhnini, L. Mich, and D.M. Berry EMSE Group Sizes in CETs Pg. 29

76 74
44 40 40 38
90
67 66 63
45 42 40
30 30 27 27
18 18
70.5 70.5
36 36.5 35.5 28
68.5
57.5
46 51.5
36 32 32.5
20.5
29
19.5 15.5 17 18
0
10
20
30
40
50
60
70
80
90
100 4-‐Grou
p
4-‐Grou
p
4-‐Grou
p
4-‐Grou
p
4-‐Grou
p
4-‐Grou
p
2-‐Grou
p
2-‐Grou
p
2-‐Grou
p
2-‐Grou
p
2-‐Grou
p
2-‐Grou
p
2-‐Grou
p
2-‐Grou
p
1-‐Grou
p
1-‐Grou
p
1-‐Grou
p
1-‐Grou
p
1-‐Grou
p
Number of Raw Requirement Ideas Generated by POEPMcreate Groups
Number of New Requirement Ideas Generated by POEPMcreate Groups

19 18.5
11 10 10 9.5
45
33.5 33
31.5
22.5 21
20
15
30
27 27
18 18 17.625 17.625
9 9.125 8.875 7
34.25
28.75
23
25.75
18 16 16.25
10.25
29
19.5
15.5 17
18
0
5
10
15
20
25
30
35
40
45
50 4-‐Grou
p
4-‐Grou
p
4-‐Grou
p
4-‐Grou
p
4-‐Grou
p
4-‐Grou
p
2-‐Grou
p
2-‐Grou
p
2-‐Grou
p
2-‐Grou
p
2-‐Grou
p
2-‐Grou
p
2-‐Grou
p
2-‐Grou
p
1-‐Grou
p
1-‐Grou
p
1-‐Grou
p
1-‐Grou
p
1-‐Grou
p
Number of Raw Requirement Ideas Generated by Each Member of POEPMcreate Groups Number of New Requirement Ideas Generated by Each Member of POEPMcreate Groups

Pre-Tests
We did some several tests, some dataadjustment, and some more tests to ensurethat it was legitimate to combine the data of 3identically-run experiments into one analysisas if they were 1 experiment.
2013 V. Sakhnini, L. Mich, and D.M. Berry EMSE Group Sizes in CETs Pg. 32

Refined Hypotheses
H1 and H2 are refined into 4 subhypotheses,HPTR, HPTN, HPAR, and HPAN:
2013 V. Sakhnini, L. Mich, and D.M. Berry EMSE Group Sizes in CETs Pg. 33

The number of members of an elicitation
group usingIKL P: POEPMcreateE: EPMcreate M
NO
has no effect on theIJJKJJL
per group memberA: average number of ideas
per groupT: total number of ideas
MJJNJJO
ofIKL N: newR: raw M
NOrequirement ideas generated.
2013 V. Sakhnini, L. Mich, and D.M. Berry EMSE Group Sizes in CETs Pg. 34

Summary of Conclusions
The table on the next slide summarizes theconclusions about the subhypotheses that aredrawn from the data, …
giving in for each subhypothesis,
g whetherg how strongly, andg why
it is rejected.
2013 V. Sakhnini, L. Mich, and D.M. Berry EMSE Group Sizes in CETs Pg. 35

Summary of the Effects of Changes in Group Size on the Subhypothesis Dependent Variables
SubhypothesesH1 H2
# Raw # New # Raw # NewRequirement Requirement Requirement Requirement
Compared Ideas Ideas Ideas IdeasGroup Generated Generated Generated Generated
Sizes (s) by by by byWhole Group Group Member
PTR PTN PAR PAN
s1 → s2*** ↑ 39.24 ** ↑ 28.32 ↑ 7.62 ↑ 4.26
(*** ↑ 39.24) (** ↑ 28.32) ( ↑ 7.62) ( ↑ 4.32)
s2 → s4* ↓ 22.64 ↓ 14.06 *** ↓ 21.44 ** ↓ 15.51
(* ↓ 22.60) ( ↓ 14.02) (** ↓ 21.44) (** ↓ 15.49)
s1 → s4↑ 16.60 ↑ 14.26 * ↓ 13.82 * ↓ 11.25
( ↑ 16.64) ( ↑ 14.30) (* ↓ 13.80) (* ↓ 11.24)

In Other Words
It appears that the size of a group usingPOEPMcreate does affect the number of rawand new requirement ideas generated by thegroup and by each member of the group.
2013 V. Sakhnini, L. Mich, and D.M. Berry EMSE Group Sizes in CETs Pg. 37

In Other Words, Cont’d
For whole groups and for average members ofgroups, group size 2 is the peak.
A 4-person whole group generates more ideasthan a 1-person whole group (i.e., anindividual).
The average group member in a 4-persongroup generates fewer ideas than in a 1-person group.
2013 V. Sakhnini, L. Mich, and D.M. Berry EMSE Group Sizes in CETs Pg. 38
Hmmmmm! Individuals & BS
There is empirical evidence that in BS forrequirement ideas, individuals are moreeffective than groups.
Maybe synergy is not what it’s cracked up tobe!?!?
2013 V. Sakhnini, L. Mich, and D.M. Berry EMSE Group Sizes in CETs Pg. 39

Triangulation
The survey results, shown on the next slide,indicate that experienced softwaredevelopment practitioners have observed thesame and seem to act accordingly.
First, they use groups more than they useindividuals for idea generation.
2013 V. Sakhnini, L. Mich, and D.M. Berry EMSE Group Sizes in CETs Pg. 40
The kind of ReqElic technique used in ReqElic Group activity sessions - We use brainstorming in group ReqElic sessions
in all our projects 5 9%
in most of our projects 20 38%
in some of our projects 22 42%
in none of our projects 6 11%
The kind of ReqElic technique used in ReqElic Group activity sessions - We use other creativity techniques in group ReqElic sessions
in all our projects 4 8%
in most of our projects 12 23%
in some of our projects 28 53%
in none of our projects 9 17%
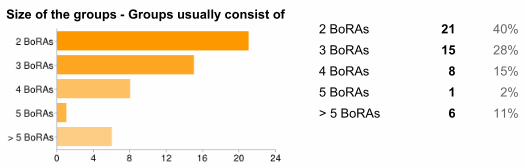
Size of the groups - Groups usually consist of2 BoRAs 21 40%
3 BoRAs 15 28%
4 BoRAs 8 15%
5 BoRAs 1 2%
> 5 BoRAs 6 11%
Size of ideal groups4 individuals 12 23%
2 groups of 2 20 38%
1 group of 4 21 40%

Speculation
We observed that for POEPMcreate,
g a 4-person group generates on average 75raw requirement ideas, 18.75 per member,but
g a 2-person group generates on average55.38 raw requirement ideas, 27.69 permember.
2013 V. Sakhnini, L. Mich, and D.M. Berry EMSE Group Sizes in CETs Pg. 41

Best Use of a Set of Analysts
So, if you have 4 analysts, …
maybe it’s better to have
two independent 2-person groupsgenerating 110.76 ideas
than
one 4-person group generating 75 ideas.
2013 V. Sakhnini, L. Mich, and D.M. Berry EMSE Group Sizes in CETs Pg. 42

Duplicated Ideas?
What about the duplicated ideas between thetwo independent 2-person groups?
We tested the duplication of ideas amongpairs of groups and found it to be uniformlyless than 110.76 − 75 = 35.76!
Wow!!
2013 V. Sakhnini, L. Mich, and D.M. Berry EMSE Group Sizes in CETs Pg. 43

Plot of PTR Data
Look at the plot of the PTR data on the nextslide.
The plot for the PTN data is almost the same.
2013 V. Sakhnini, L. Mich, and D.M. Berry EMSE Group Sizes in CETs Pg. 44

100
90
80
70
60
50
40
30
20
0
10
0 1 2 3 4
Group Size
Num
ber
of R
aw I
deas
y = 6.8745x + 29.771

Plot, Cont’d
This plot shows that the overall relationbetween
a group’s size and
the number of ideas of any kind generated bythe group
is definitely not linear.
A quadratic regression would work.
2013 V. Sakhnini, L. Mich, and D.M. Berry EMSE Group Sizes in CETs Pg. 46

Theory to Explain Result
We have developed a theory
g that explains our results,
g that is applicable to any CET, and
g that is testable.
2013 V. Sakhnini, L. Mich, and D.M. Berry EMSE Group Sizes in CETs Pg. 47

Theory, Cont’d
Group overhead drags against group synergy.
Each of group overhead and group synergy isa group phenomenon.
Thus, each of group overhead and groupsynergy grows quadratically with group size.
number of persons, lines of communication
5,104,63,32,11,0
2013 V. Sakhnini, L. Mich, and D.M. Berry EMSE Group Sizes in CETs Pg. 48
Theory, Cont’d
Let’s measure synergy as the number S ofideas arising from it.
Let’s measure overhead as the number O ofideas lost as a result of it.
Let n be the number of persons in a group,then we expect that
S = an 2 + b
O = An 2 + B
for some constants, a, b, A, and B.
2013 V. Sakhnini, L. Mich, and D.M. Berry EMSE Group Sizes in CETs Pg. 49

Theory, Cont’d
Then, the total number I of ideas generated bya group of size n is
I = S − O
I = (an 2 + b) − (An 2 + B)
For each CET, a, b, A, and B are set to causethe peak at a different n.
For example, for BS, the peak is at n = 1,
2013 V. Sakhnini, L. Mich, and D.M. Berry EMSE Group Sizes in CETs Pg. 50

Theory, Cont’d
For POEPMcreate, the peak is some wherebetween 2 and 3, inclusive.
Lacking POEPMcreate data for n = 3, wecannot say where the peak is forPOEPMcreate.
For example if a group with three peoplegenerates the same number of ideas as agroup with two people, the peak would be atn = 2.5.
2013 V. Sakhnini, L. Mich, and D.M. Berry EMSE Group Sizes in CETs Pg. 51

Theory, Cont’d
So, for each CET c, the constants are a c, b c,A c, and B c, and
I c = (a c n 2 + b c ) − (A c n 2 + B c )
We propose this equation for I c as a theory tobe tested empirically for a variety of CETs.
2013 V. Sakhnini, L. Mich, and D.M. Berry EMSE Group Sizes in CETs Pg. 52

Theory, Cont’d
For each CET, an experiment similar to thosedescribed in this talk
will be conducted with all group sizes rangingfrom 1 through at least 4,
or more if necessary,
to establish the constants for the CET.
We invite the promoters of the various CETs toconduct these experiments with their CETs.
2013 V. Sakhnini, L. Mich, and D.M. Berry EMSE Group Sizes in CETs Pg. 53

Future Work
More experiments to increase and balance thenumbers of each size of group, to add groupsizes, to try
g to confirm and strengthen these results,
g to answer the speculation, and
g to confirm the theory.
More survey data for better triangulation.
2013 V. Sakhnini, L. Mich, and D.M. Berry EMSE Group Sizes in CETs Pg. 54

Now Read Our Paper!
I hope that we have gotten you excited enoughthat you will now go and read our paper!
It’s at
http://link.springer.com/article/10.1007/s10664-016-9475-z
2013 V. Sakhnini, L. Mich, and D.M. Berry EMSE Group Sizes in CETs Pg. 55
Related Documents