ELEMENT BLUE A NICHE CONTENT AGGREGATION AND GENERATION PLATFORM

Welcome message from author
This document is posted to help you gain knowledge. Please leave a comment to let me know what you think about it! Share it to your friends and learn new things together.
Transcript

ELEMENT BLUEA NICHE CONTENT AGGREGATION AND
GENERATION PLATFORM

MENTOR
LALIT MOHAN GOYALAssistant Professor - Dept. Of Computer Science
IMS Engineering College
TEAM
RAHUL S VERMA
SATYAM GUPTA
SHIVANGI

INTRODUCTIONWHAT AND HOW?
INTRODUCTION
Element Blue is an Integrated Platform. It includes:
A Dashboard for authors/content marketers.
Dynamic front end for readers/consumers.
In browser Data Visualization.
Content Aggregation, Trend Analysis.

INTRODUCTION
We are using a open source technology stack to develop.
Dashboard : Django / Python [1][2]
Front End : HTML, CSS, JAVASCRIPT
Data Visualization : D3.js [3]
Hosting : Heroku, Amazon Web Services [4][5]
Data / Text Mining : Orange [6]

LITERATURE
REVIEWCASE STUDY AND BUSINESS MODEL
DIGITAL MARKETING TRENDS
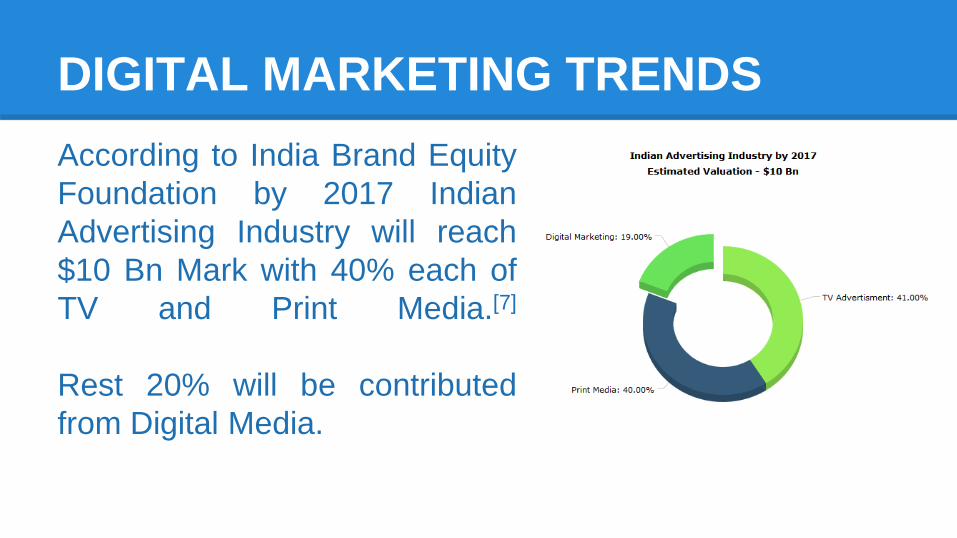
According to India Brand Equity
Foundation by 2017 Indian
Advertising Industry will reach
$10 Bn Mark with 40% each of
TV and Print Media.[7]
Rest 20% will be contributed
from Digital Media.
DIGITAL MARKETING TRENDS
Some common Digital Marketing modes.
Social Media (Facebook, Twitter, Tumblr)
Youtube channels
Email Marketing
Blogging, RSS and News Feeds
Search Engine Optimization
SCOPE FOR ELEMENT BLUE
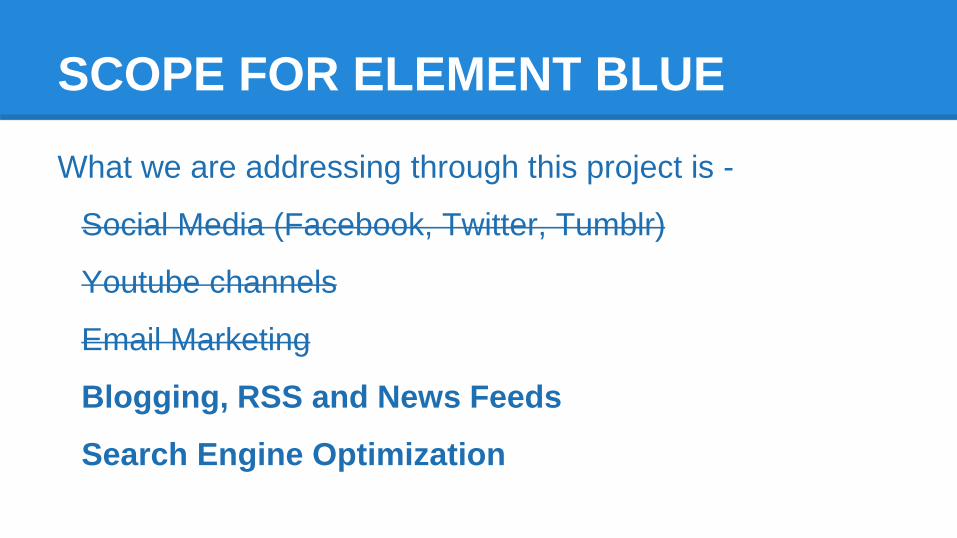
What we are addressing through this project is -
Social Media (Facebook, Twitter, Tumblr)
Youtube channels
Email Marketing
Blogging, RSS and News Feeds
Search Engine Optimization
PROSPECTIVE USERS
Micro, Small and Medium Enterprises
First Generation Entrepreneurs
Product bloggers
Trend Specialists
Content Marketers
Casual Bloggers
CURRENT ISSUES
Traditional marketing poses obstacles such as
High Expenses
Fundamentally It Broadcasts
No measures for effectiveness
No Tools to Project at Specific Demography
WHY DIGITAL MARKETING
Relatively Low Cost.
Content Driven Model.
No constraints like time slots or classifieds.
Customized according to demography serviced.
Access to performance assessment tools.

CORE SERVICESWHAT’S INSIDE?

CONTENT AGGREGATION
Content Aggregation is a prerequisite for Trend Analysis.
It is the most crucial stage for this Project.
There is practically Infinite data on web.
Aggregation Focuses on what’s Important.
It helps in Personalizing according to user’s Interests.

CONTENT AGGREGATION MODEL
Top terms
Starbucks
Topic
Coffee
Suggested Topics
Coffee
New Variant
Awesome
Coffee Bot
Starbucks
Suggested Sources
Starbucks
I<3Coffee
Input Aggregation
Recommendation
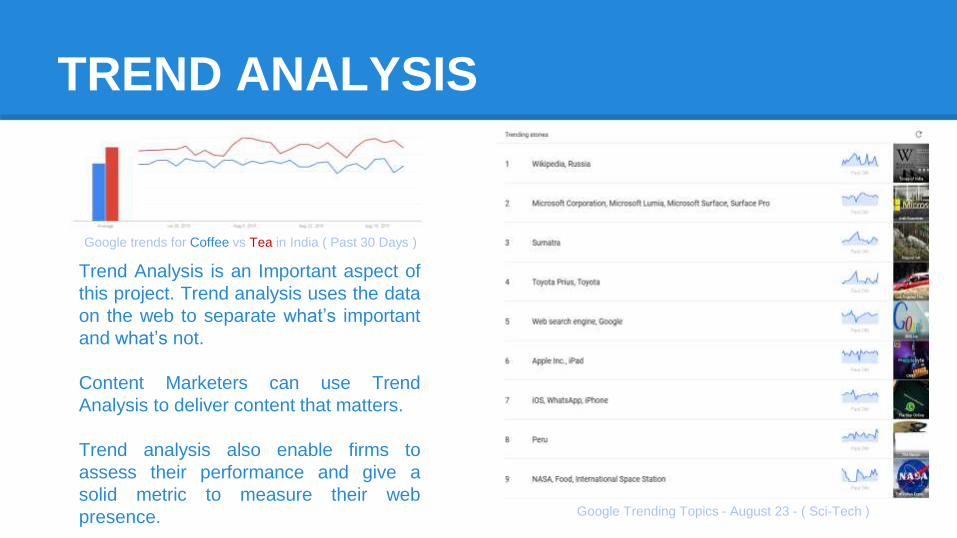
TREND ANALYSIS
Google trends for Coffee vs Tea in India ( Past 30 Days )
Google Trending Topics - August 23 - ( Sci-Tech )
Trend Analysis is an Important aspect of
this project. Trend analysis uses the data
on the web to separate what’s important
and what’s not.
Content Marketers can use Trend
Analysis to deliver content that matters.
Trend analysis also enable firms to
assess their performance and give a
solid metric to measure their web
presence.
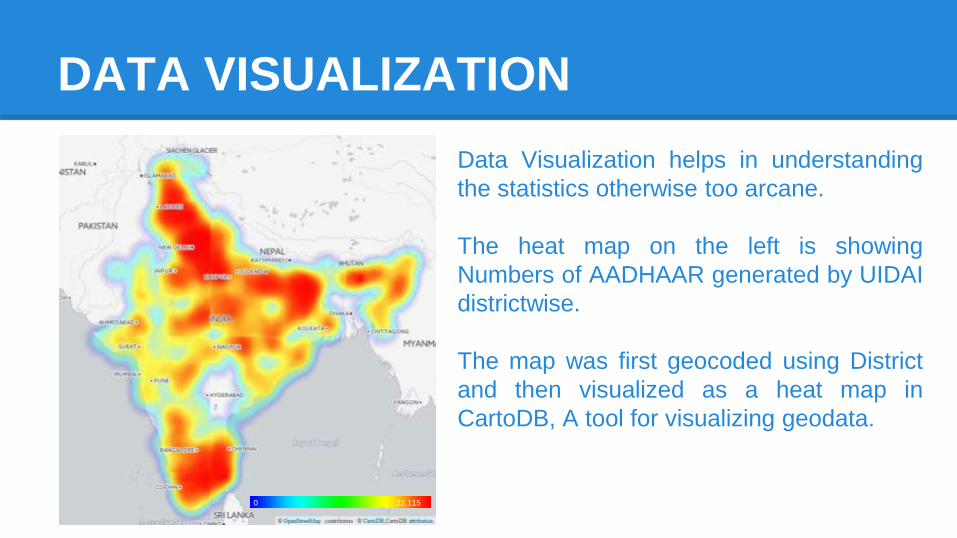
DATA VISUALIZATION
Data Visualization helps in understanding
the statistics otherwise too arcane.
The heat map on the left is showing
Numbers of AADHAAR generated by UIDAI
districtwise.
The map was first geocoded using District
and then visualized as a heat map in
CartoDB, A tool for visualizing geodata.
0 22,115
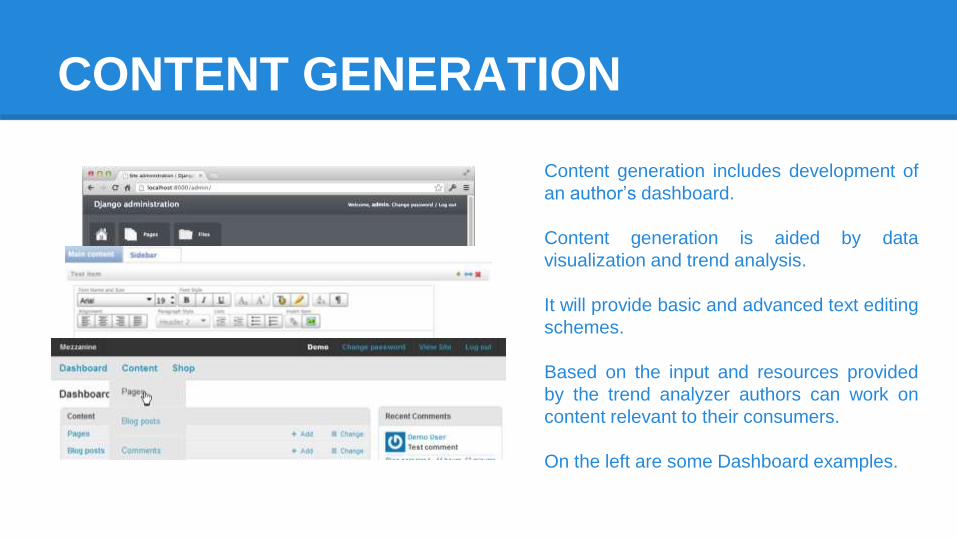
CONTENT GENERATION
Content generation includes development of
an author’s dashboard.
Content generation is aided by data
visualization and trend analysis.
It will provide basic and advanced text editing
schemes.
Based on the input and resources provided
by the trend analyzer authors can work on
content relevant to their consumers.
On the left are some Dashboard examples.
PROBLEM FORMULATION
NEED AND SIGNIFICANCE

WHERE ARE WE NOW?
More people are starting their own ventures.
They need strong marketing efforts to survive.
But they lack the technological understanding required.
Expensive and vague traditional marketing mediums.
Sophisticated tools require highly skilled manpower,
which again costs higher.
TECHNOLOGICAL ISSUES
Enormous amount of data require large infrastructure to
store and analyze it.
Sources are often heterogenous posing problems in data
analysis.
Fast propagation and time sensitive data.

OUR SOLUTION
Reducing number of resources, rather than crawling up
the whole web, we will focus on top 10 sources to mine
data.
Clustering based on keywords at User- and Topic- level,
for example in a twitter sentiment analysis, retweet is an
efficient metric for Topic-level and mentions for User
level.[8]
Reducing computation overhead and retaining quality of
content delivered.
SIGNIFICANCE
Reduces the technical dependency of users.
Getting their consumers well informed about service or
product they offer.
Increasing the web presence and reach.
Unified platform to research, create and recreate visually.

METHODOLOGY
The Roadmap for Development and
Technology
DASHBOARD
We will start from dashboard, to be developed using Django
which is a Python Web Development Framework.
Django supports fast application development along with
security and scalability.
Django powered sites - Disqus, Pinterest, Instagram

DATA VISUALIZATION
Integrated in browser Data Visualization will be developed
using D3.js which is a data driven visualization library
written in JavaScript.
D3 brings data to life using HTML, SVG, and CSS.
Data-driven approach to DOM manipulation.
DATA / TEXT MINING
Orange is a Python-based, powerful and open source tool
for data mining.
It has components for machine learning, add-ons for
bioinformatics and text mining. It’s packed with features for
data analytics.
HOSTING AND DEPLOYMENT
In our final phase we will be deploying the application on
cloud preferably using Amazon Web Services or Heroku
given the excellent array of development features they both
provide.
Heroku is a cloud platform as a service where as AWS is a
cloud Infrastructure as a service.

THANK YOU
Anything you would like to ask?
References on next page.
REFERENCES
[1] Django Framework - https://www.djangoproject.com/
[2] Python - https://www.python.org/
[3] D3.js - http://d3js.org/
[4] Heroku - https://www.heroku.com/
[5] Amazon Web Services - https://aws.amazon.com/
[6] Orange - http://orange.biolab.si/
[7] IBBF - Advertising and Marketing Industry in India - India Brand Equity Foundation
[8] Multimedia Data Mining and Analytics: Disruptive Innovation - Aaron Baughman, Jiang Gao, Jia-Yu Pan, Valery A. Petrushin
Related Documents


