Electrostatic Potential Maps Models that visually portray polarity and dipoles

Electrostatic Potential Maps Models that visually portray polarity and dipoles.
Dec 17, 2015
Welcome message from author
This document is posted to help you gain knowledge. Please leave a comment to let me know what you think about it! Share it to your friends and learn new things together.
Transcript

Electrostatic Potential MapsModels that visually portray polarity and dipoles

Hydrogen Halides

When identical polar bonds point in opposite directions,the effects of their polaritiescancel, giving no net dipolemoment. When they do notpoint in opposite directions,there is a net effect and a netmolecular dipole moment,designated
Molecular Polarity Molecular Polarity & Dipole Moment& Dipole Moment
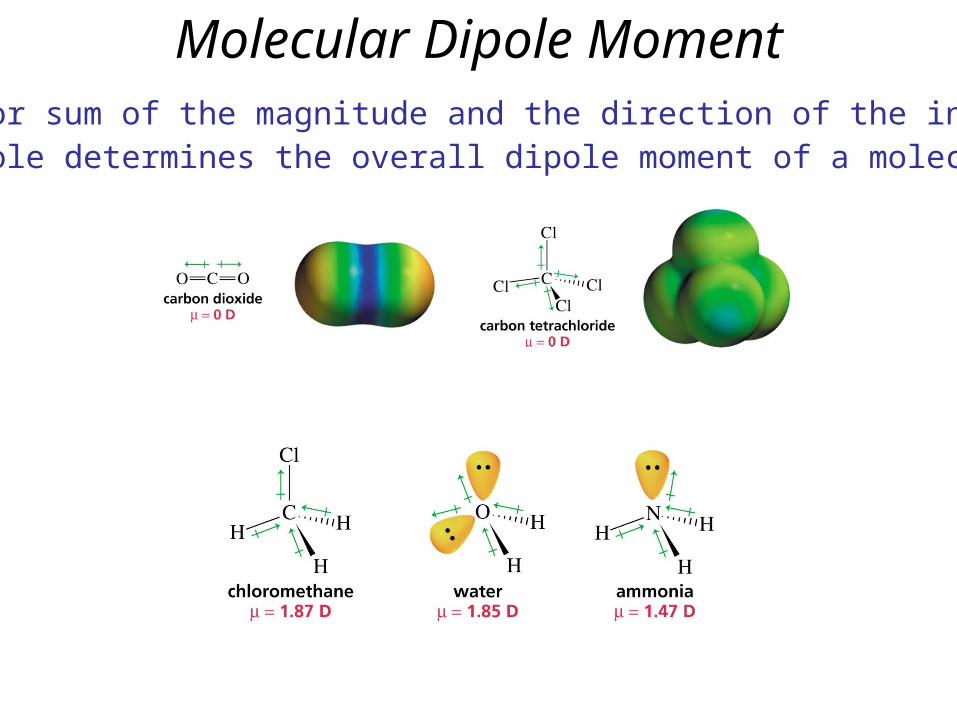
The vector sum of the magnitude and the direction of the individual bond dipole determines the overall dipole moment of a molecule
Molecular Dipole Moment
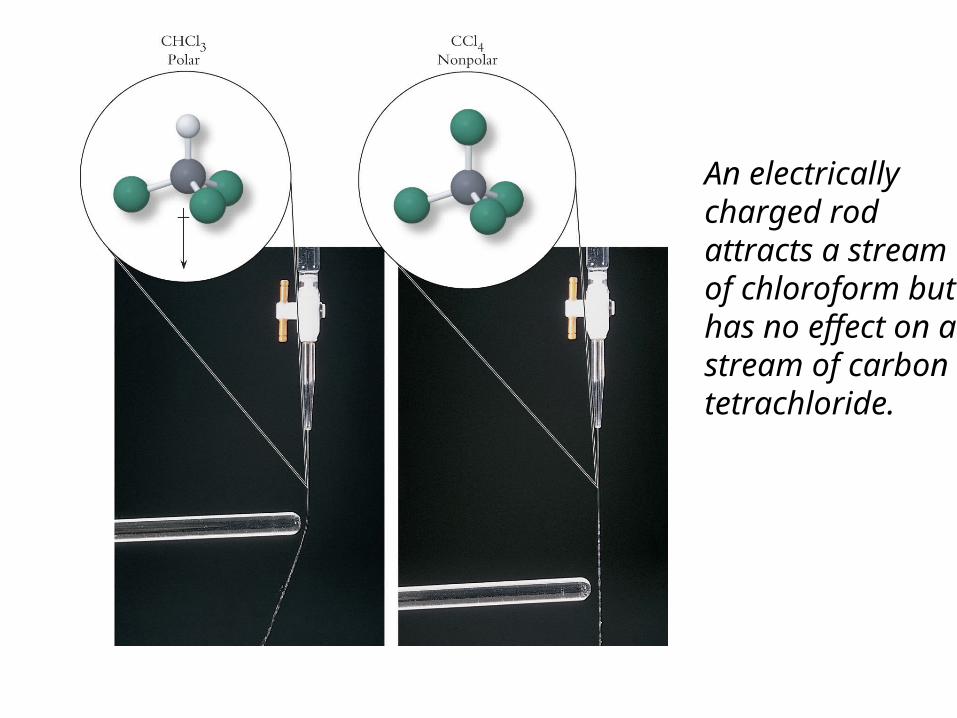
An electrically charged rod attracts a streamof chloroform buthas no effect on a stream of carbontetrachloride.

Ammonia and in the Ammonium Ion

Water

• Resultant Molecular Dipoles > 0• Solubility: Polar molecules that
dissolve or are dissolved in like molecules
Polarity & Physical PropertiesOzone and Water
• The Lotus flower• Water & dirt repellancy
0.1278 nm
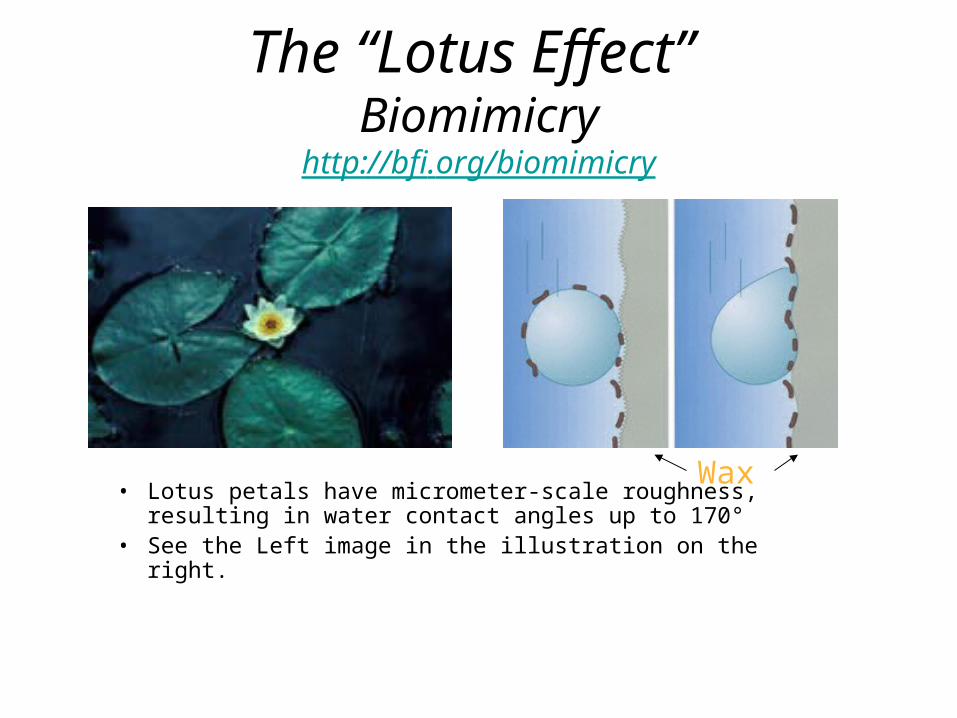
The “Lotus Effect” Biomimicry
http://bfi.org/biomimicry
• Lotus petals have micrometer-scale roughness, resulting in water contact angles up to 170°
• See the Left image in the illustration on the right.
Wax
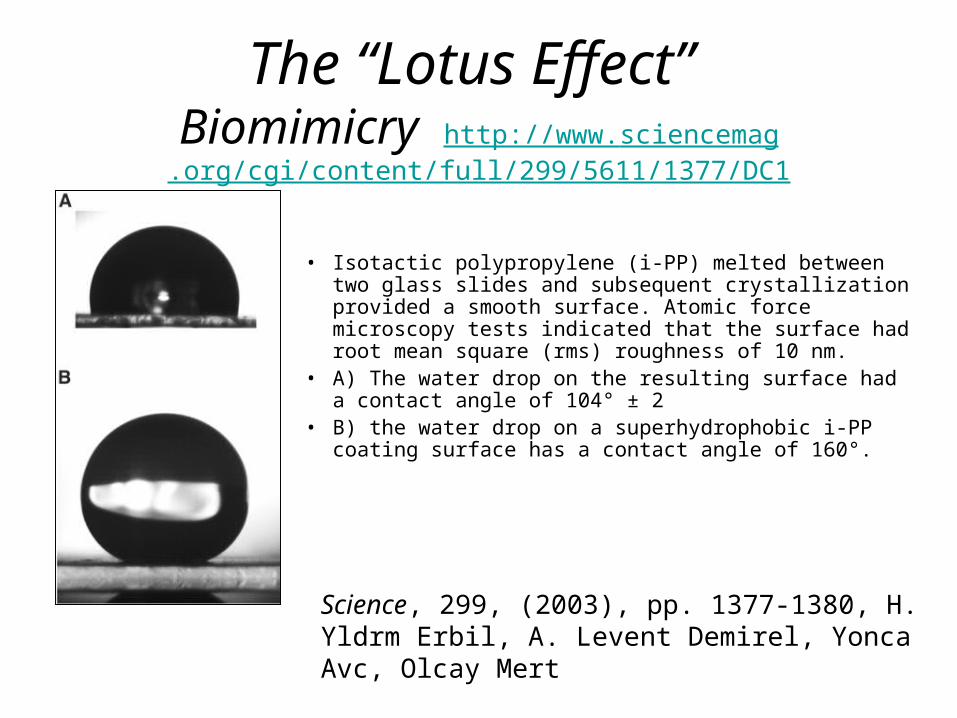
The “Lotus Effect” Biomimicry http://www.sciencemag
.org/cgi/content/full/299/5611/1377/DC1
• Isotactic polypropylene (i-PP) melted between two glass slides and subsequent crystallization provided a smooth surface. Atomic force microscopy tests indicated that the surface had root mean square (rms) roughness of 10 nm.
• A) The water drop on the resulting surface had a contact angle of 104° ± 2
• B) the water drop on a superhydrophobic i-PP coating surface has a contact angle of 160°.
Science, 299, (2003), pp. 1377-1380, H. Yldrm Erbil, A. Levent Demirel, Yonca Avc, Olcay Mert

Molecular Representations
Empirical Formula, Molecular Formula, Structure: (Lewis, Kekule, Condensed, Line), Visual Model: wireframe, stick, ball & stick, space filling, electrostatic, energy surface


Draw bond-line structures for each of the four molecules.
1.
2.
3.
4.
ketone
O
1.
aldehyde
H
O
O
2.
NOT
carboxylic acid
C
O
O
H
C
O
2
H
O
H
O
or
or
3.
ester (carboxylic acid ester)
O
O
C
H
3
O
O
C
O
O
C
H
3
or
NOT
4.

Question 12
• The molecular formula of morpholine is:
• A) C2HNO
• B) C4HNO
• C) C4H4NO
• D) C4H5NO
• E) C4H9NO

Question 13
• The respective number of bonded pairs of electrons and of unshared pairs of electrons in morpholine is:
• A) 7, 0
• B) 7, 1
• C) 15, 0
• D) 15, 1
• E) 15, 3

Formulas &Kekulé / Condensed / Bond-Line
Structures / Drawings
Molecular formula? Empirical Formula?
Bond-Line Structure?
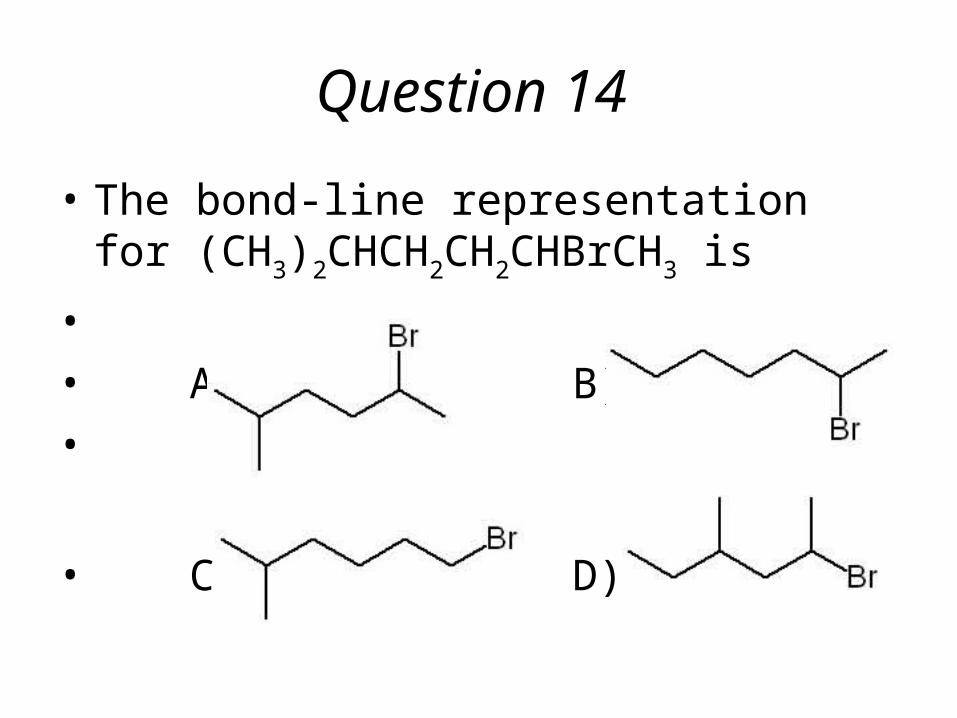
Question 14
• The bond-line representation for (CH3)2CHCH2CH2CHBrCH3 is
•
• A) B)
•
• C) D)

Select the best condensed structural formula for the following bond-line structure:
HHO OH
O
A. (CH3)2CHCH2COHOHCOH
B. CH3CH3CHCH2C(OH)2CHO
C. (CH3)2CHCH2C(OH)2CHO
D. (CH3)2CHCH2C(OH)2COH
E. CH3CHCH3CH2C(OH)2CHO
Question 15
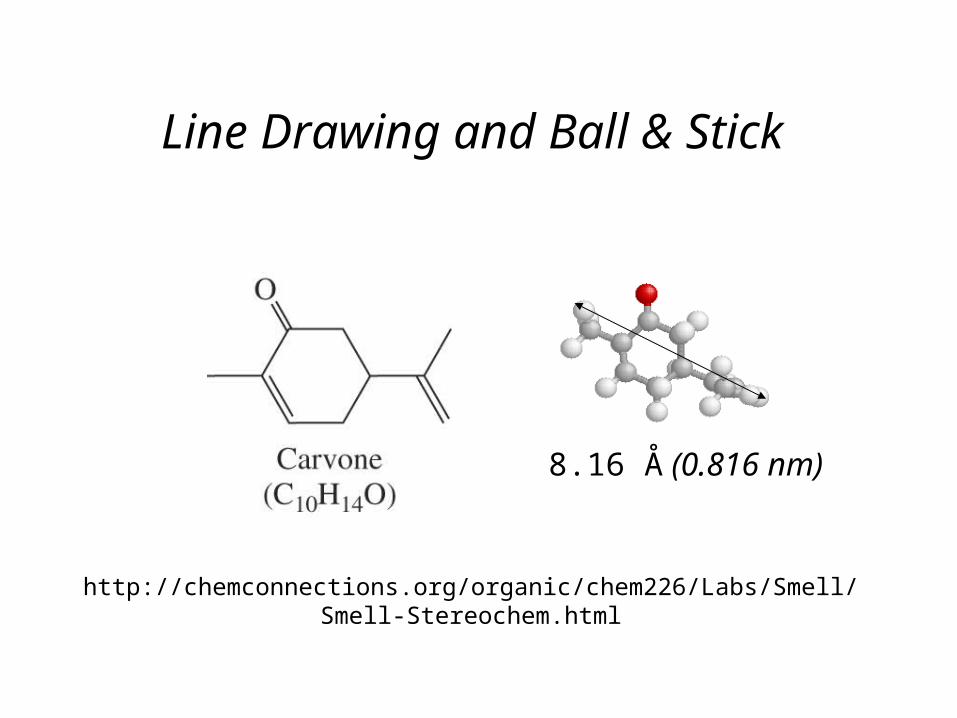
Line Drawing and Ball & Stick
8.16 Å (0.816 nm)
http://chemconnections.org/organic/chem226/Labs/Smell/Smell-Stereochem.html

Question 16While on-line, click on the jmol-structure
on the left. Which one of the formulas or structural renderings that follow is correct?
C
H
3
C
H
2
O
H
C
H
2
C
O
O
H
C
H
3
O
O
H
O
H
O
C
2
H
3
O
B)
C)
D)
E)
A)

Question 17
• How many constitutional alcohol isomers have the molecular formula C4H10O?
• A) two
• B) three
• C) four
• D) five

More Molecular Representations
Empirical Formula, Molecular Formula, Structure: (Lewis, Kekule, Condensed, Line), Visual Model: wireframe, stick, ball & stick, space filling, electrostatic, energy surface
Worksheet: Organic Molecules 1http://chemconnections.org/organic/chem226/Labs/VSEPR/
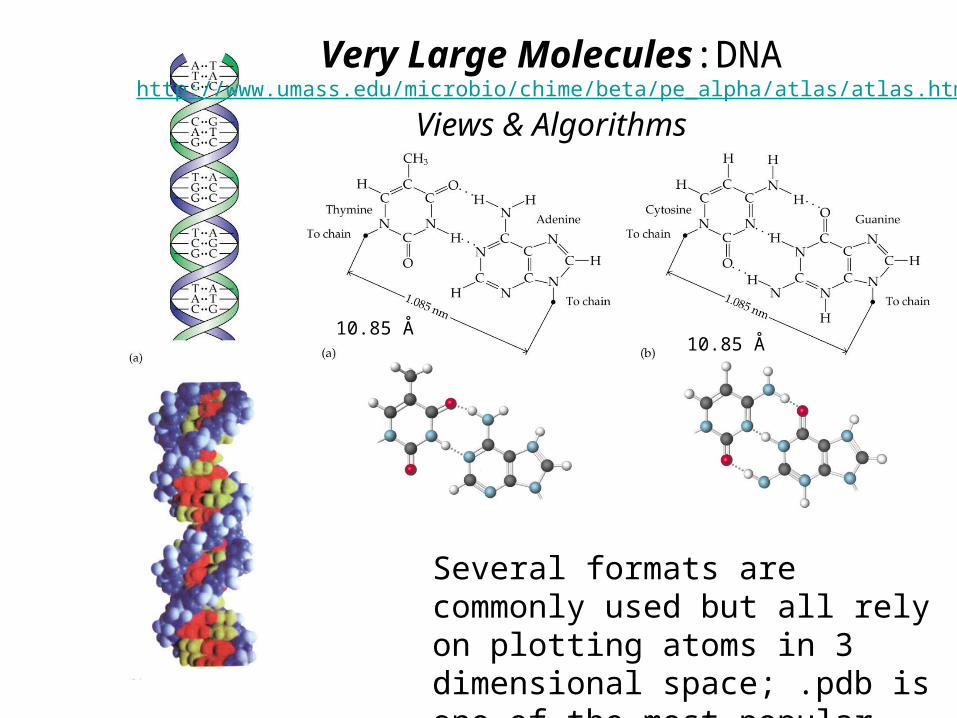
Very Large Molecules:DNAhttp://www.umass.edu/microbio/chime/beta/pe_alpha/atlas/atlas.htm
Views & Algorithms
10.85 Å10.85 Å
Several formats are commonly used but all rely on plotting atoms in 3 dimensional space; .pdb is one of the most popular.

Very Large Moleculeshttp://info.bio.cmu.edu/courses/03231/ProtStruc/ProtStruc.htm
B-DNA: Size, Shape & Self Assembly
http://molvis.sdsc.edu/pdb/dna_b_form.pdb
46 Å
12 base sequence
(1953-2003)
Rosalind Franklin’sPhoto

Atomic Orbitalss and p orbitals

Molecular Orbitals
• Atomic orbitals mix to form molecular orbitals
•The total number of molecular orbitals (bonding + non- and anti bonding orbitals) equal the total number of atomic orbitals
bond is formed by overlapping of two s orbitals

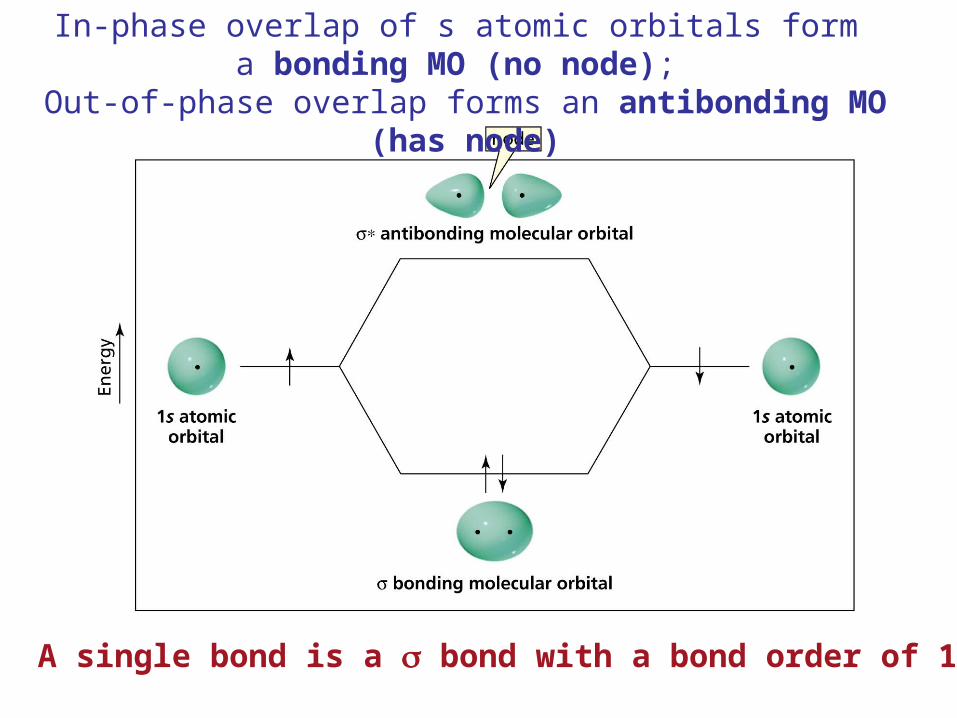
In-phase overlap of s atomic orbitals form a bonding MO (no node);
Out-of-phase overlap forms an antibonding MO (has node)
A single bond is a bond with a bond order of 1.

A sigma bond () is also formed by end-on overlap of two p orbitals
Double bonds have 1 and 1 bond with a bond order of 2.A bond is weaker than a bond.A double bond is shorter and stronger than a single bond.

Pi bond () is formed by sideways overlap of two parallel p orbitals

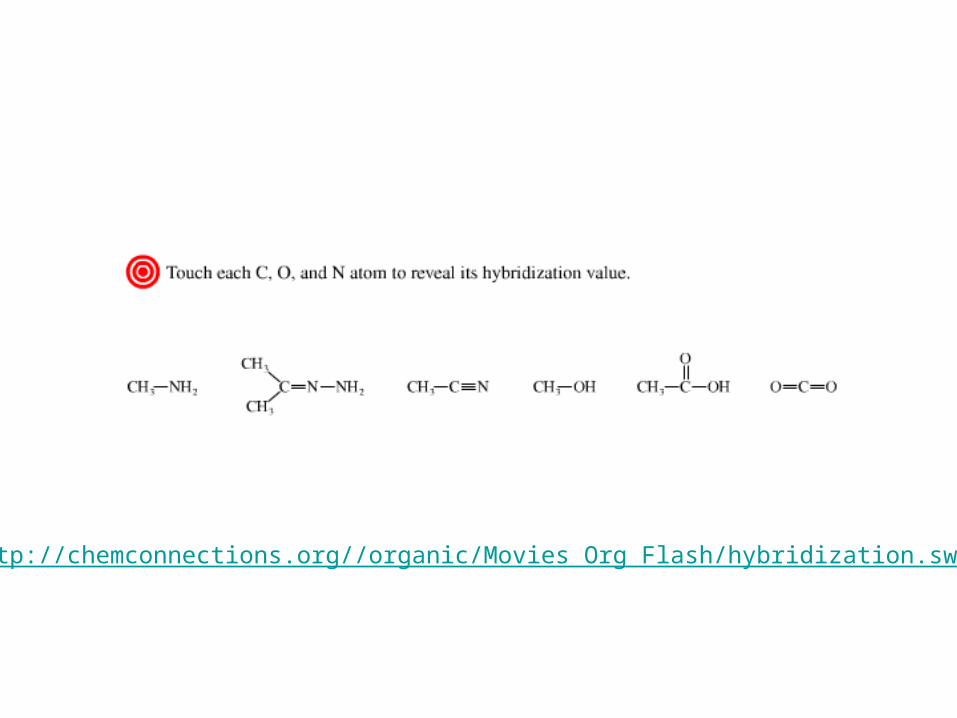
Mixing Atomic OrbitalsHybridization of s and p orbitals

Single Bonds (Methane)
Hybridization of s and p atomic orbitals:
http://chemconnections.org/organic/Movies%20Org%20Flash/HybridizationofCarbon.swf

The atomic orbitals used in bond formation determine the bond angles
• Tetrahedral bond angle: 109.5°
• Electron pairs spread themselves into space as far from each other as possible

Hybrid Orbitals of Ethane

Bonding in Ethene: A Double Bond
Double bonds have 1 and 1 bond. A double bond is shorter and stronger than a single bond.
http://chemconnections.org/organic/Movies%20Org%20Flash/HybridizationofCarbon.swf

• The bond angle in the sp2 carbon is 120°
• The sp2 carbon is the trigonal planar carbon
An sp2-Hybridized Carbon
http://chemconnections.org/organic/Movies%20Org%20Flash/HybridizationofCarbon.swf
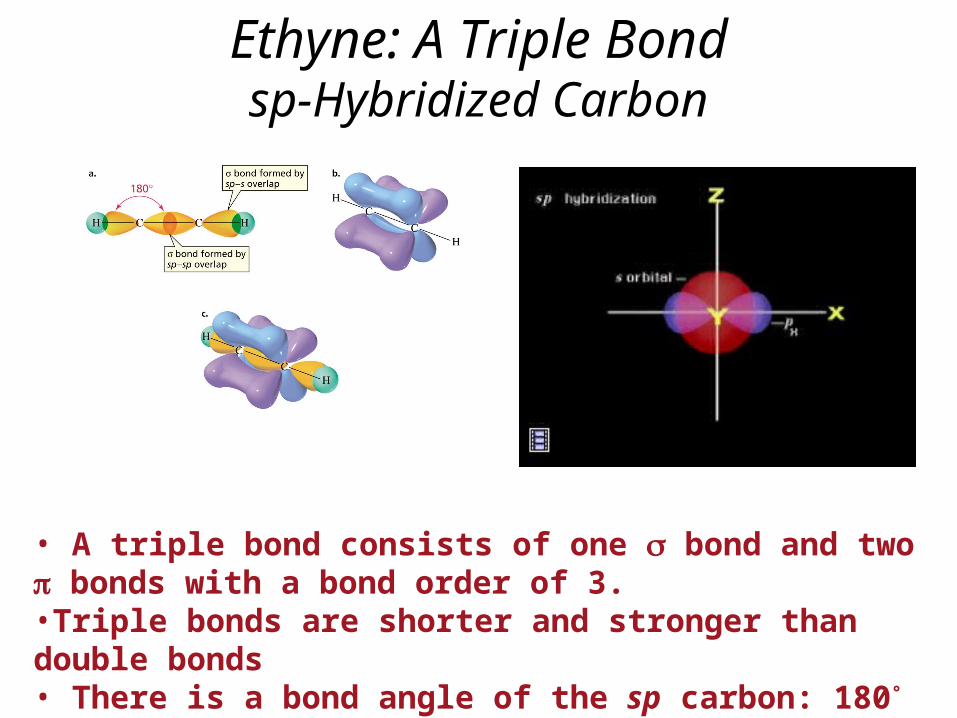
Ethyne: A Triple Bondsp-Hybridized Carbon
• A triple bond consists of one bond and two bonds with a bond order of 3.•Triple bonds are shorter and stronger than double bonds• There is a bond angle of the sp carbon: 180°
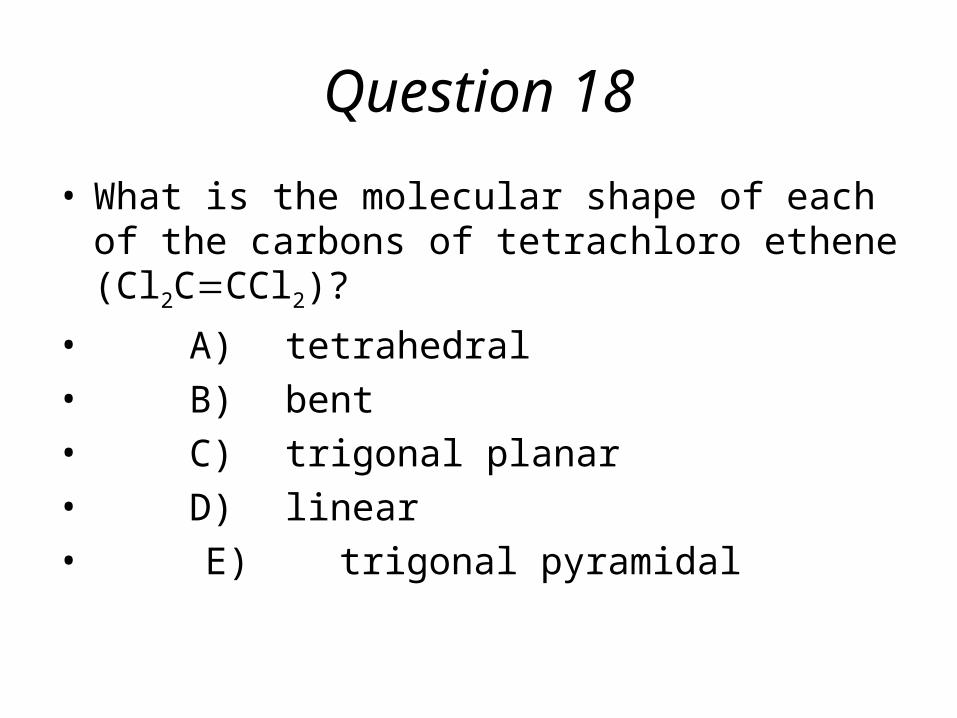
Question 18
• What is the molecular shape of each of the carbons of tetrachloro ethene (Cl2CCCl2)?
• A) tetrahedral• B) bent• C) trigonal planar• D) linear• E) trigonal pyramidal
http://chemconnections.org//organic/Movies Org Flash/hybridization.swf

Summary• A bond is weaker than a bond
• The greater the electron density in the region of orbital overlap, the stronger is the bond
• The more s character, the shorter and stronger is the bond
• The more s character, the larger is the bond angle

Reactive IntermediatesCarbocation

Reactive IntermediatesRadical
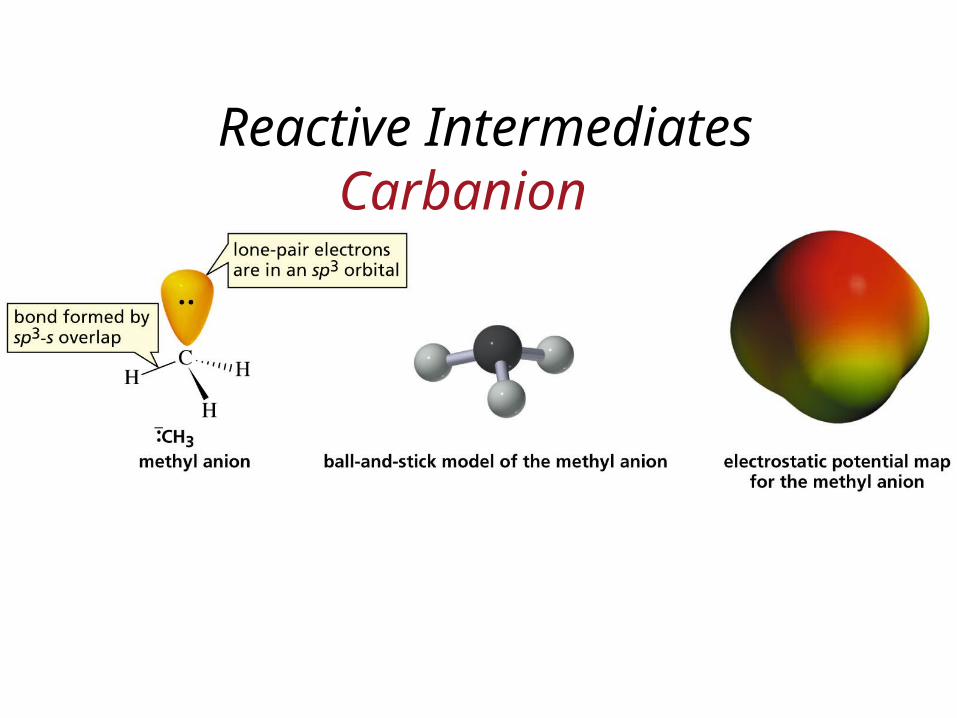
Reactive IntermediatesCarbanion
Related Documents