Dear Author, Here are the proofs of your article. • You can submit your corrections online, via e-mail or by fax. • For online submission please insert your corrections in the online correction form. Always indicate the line number to which the correction refers. • You can also insert your corrections in the proof PDF and email the annotated PDF. • For fax submission, please ensure that your corrections are clearly legible. Use a fine black pen and write the correction in the margin, not too close to the edge of the page. • Remember to note the journal title, article number, and your name when sending your response via e-mail or fax. • Check the metadata sheet to make sure that the header information, especially author names and the corresponding affiliations are correctly shown. • Check the questions that may have arisen during copy editing and insert your answers/ corrections. • Check that the text is complete and that all figures, tables and their legends are included. Also check the accuracy of special characters, equations, and electronic supplementary material if applicable. If necessary refer to the Edited manuscript. • The publication of inaccurate data such as dosages and units can have serious consequences. Please take particular care that all such details are correct. • Please do not make changes that involve only matters of style. We have generally introduced forms that follow the journal’s style. Substantial changes in content, e.g., new results, corrected values, title and authorship are not allowed without the approval of the responsible editor. In such a case, please contact the Editorial Office and return his/her consent together with the proof. • If we do not receive your corrections within 48 hours, we will send you a reminder. • Your article will be published Online First approximately one week after receipt of your corrected proofs. This is the official first publication citable with the DOI. Further changes are, therefore, not possible. • The printed version will follow in a forthcoming issue. Please note After online publication, subscribers (personal/institutional) to this journal will have access to the complete article via the DOI using the URL: http://dx.doi.org/[DOI]. If you would like to know when your article has been published online, take advantage of our free alert service. For registration and further information go to: http://www.link.springer.com. Due to the electronic nature of the procedure, the manuscript and the original figures will only be returned to you on special request. When you return your corrections, please inform us if you would like to have these documents returned.

Welcome message from author
This document is posted to help you gain knowledge. Please leave a comment to let me know what you think about it! Share it to your friends and learn new things together.
Transcript
Dear Author,
Here are the proofs of your article.
• You can submit your corrections online, via e-mail or by fax.
• For online submission please insert your corrections in the online correction form. Alwaysindicate the line number to which the correction refers.
• You can also insert your corrections in the proof PDF and email the annotated PDF.
• For fax submission, please ensure that your corrections are clearly legible. Use a fine blackpen and write the correction in the margin, not too close to the edge of the page.
• Remember to note the journal title, article number, and your name when sending yourresponse via e-mail or fax.
• Check the metadata sheet to make sure that the header information, especially author namesand the corresponding affiliations are correctly shown.
• Check the questions that may have arisen during copy editing and insert your answers/corrections.
• Check that the text is complete and that all figures, tables and their legends are included. Alsocheck the accuracy of special characters, equations, and electronic supplementary material ifapplicable. If necessary refer to the Edited manuscript.
• The publication of inaccurate data such as dosages and units can have serious consequences.Please take particular care that all such details are correct.
• Please do not make changes that involve only matters of style. We have generally introducedforms that follow the journal’s style.Substantial changes in content, e.g., new results, corrected values, title and authorship are notallowed without the approval of the responsible editor. In such a case, please contact theEditorial Office and return his/her consent together with the proof.
• If we do not receive your corrections within 48 hours, we will send you a reminder.
• Your article will be published Online First approximately one week after receipt of yourcorrected proofs. This is the official first publication citable with the DOI. Further changesare, therefore, not possible.
• The printed version will follow in a forthcoming issue.
Please note
After online publication, subscribers (personal/institutional) to this journal will have access to thecomplete article via the DOI using the URL: http://dx.doi.org/[DOI].If you would like to know when your article has been published online, take advantage of our freealert service. For registration and further information go to: http://www.link.springer.com.
Due to the electronic nature of the procedure, the manuscript and the original figures will only bereturned to you on special request. When you return your corrections, please inform us if you wouldlike to have these documents returned.
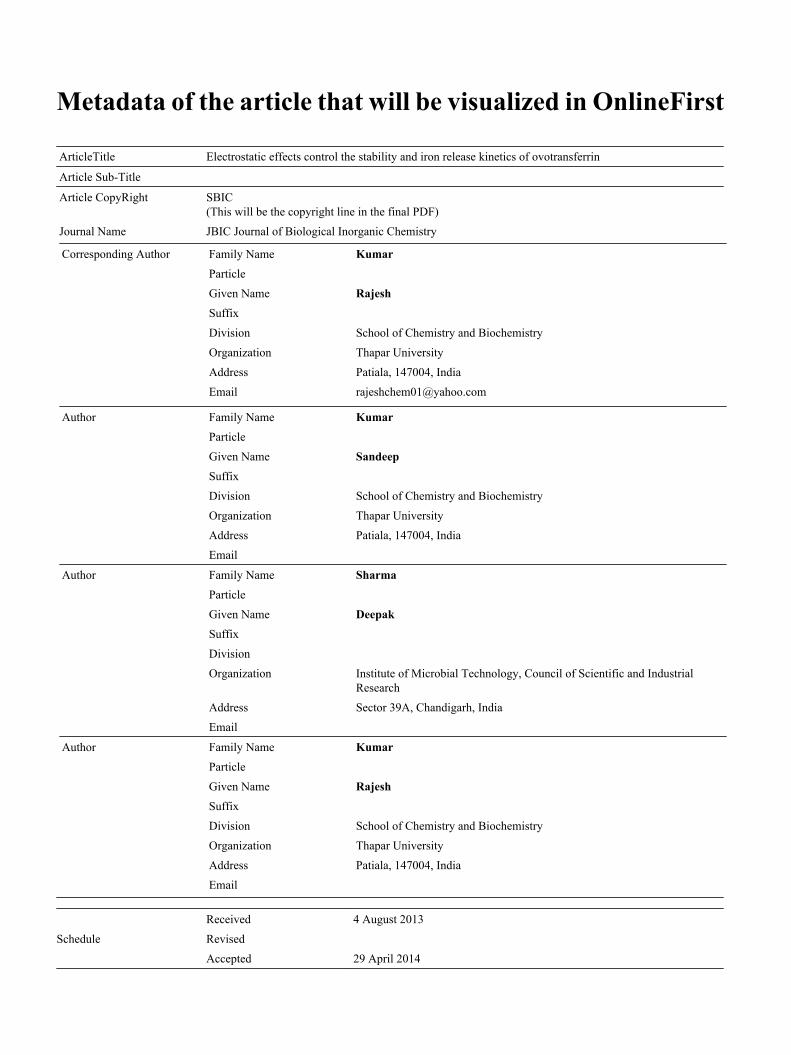
Metadata of the article that will be visualized in OnlineFirst
ArticleTitle Electrostatic effects control the stability and iron release kinetics of ovotransferrin
Article Sub-Title
Article CopyRight SBIC(This will be the copyright line in the final PDF)
Journal Name JBIC Journal of Biological Inorganic Chemistry
Corresponding Author Family Name KumarParticle
Given Name RajeshSuffix
Division School of Chemistry and Biochemistry
Organization Thapar University
Address Patiala, 147004, India
Email [email protected]
Author Family Name KumarParticle
Given Name SandeepSuffix
Division School of Chemistry and Biochemistry
Organization Thapar University
Address Patiala, 147004, India
Author Family Name SharmaParticle
Given Name DeepakSuffix
Division
Organization Institute of Microbial Technology, Council of Scientific and IndustrialResearch
Address Sector 39A, Chandigarh, India
Author Family Name KumarParticle
Given Name RajeshSuffix
Division School of Chemistry and Biochemistry
Organization Thapar University
Address Patiala, 147004, India
Schedule
Received 4 August 2013
Revised
Accepted 29 April 2014
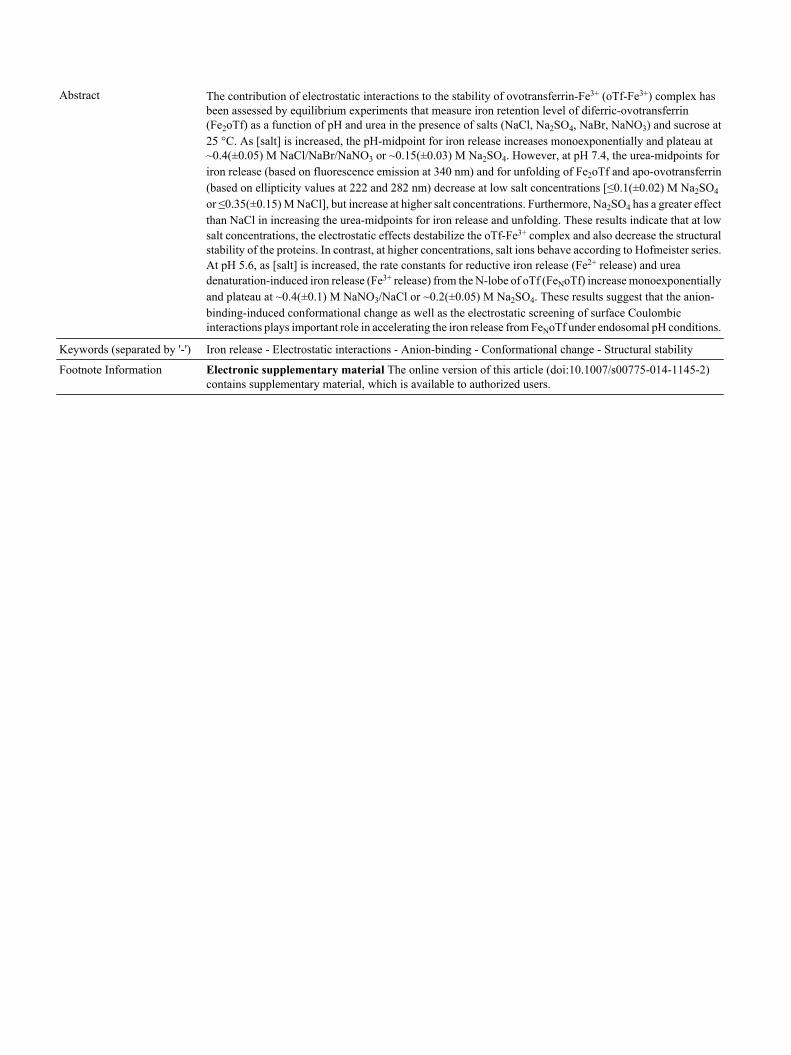
Abstract The contribution of electrostatic interactions to the stability of ovotransferrin-Fe3+ (oTf-Fe3+) complex hasbeen assessed by equilibrium experiments that measure iron retention level of diferric-ovotransferrin(Fe2oTf) as a function of pH and urea in the presence of salts (NaCl, Na2SO4, NaBr, NaNO3) and sucrose at25 °C. As [salt] is increased, the pH-midpoint for iron release increases monoexponentially and plateau at~0.4(±0.05) M NaCl/NaBr/NaNO3 or ~0.15(±0.03) M Na2SO4. However, at pH 7.4, the urea-midpoints foriron release (based on fluorescence emission at 340 nm) and for unfolding of Fe2oTf and apo-ovotransferrin(based on ellipticity values at 222 and 282 nm) decrease at low salt concentrations [≤0.1(±0.02) M Na2SO4
or ≤0.35(±0.15) M NaCl], but increase at higher salt concentrations. Furthermore, Na2SO4 has a greater effectthan NaCl in increasing the urea-midpoints for iron release and unfolding. These results indicate that at lowsalt concentrations, the electrostatic effects destabilize the oTf-Fe3+ complex and also decrease the structuralstability of the proteins. In contrast, at higher concentrations, salt ions behave according to Hofmeister series.At pH 5.6, as [salt] is increased, the rate constants for reductive iron release (Fe2+ release) and ureadenaturation-induced iron release (Fe3+ release) from the N-lobe of oTf (FeNoTf) increase monoexponentiallyand plateau at ~0.4(±0.1) M NaNO3/NaCl or ~0.2(±0.05) M Na2SO4. These results suggest that the anion-binding-induced conformational change as well as the electrostatic screening of surface Coulombicinteractions plays important role in accelerating the iron release from FeNoTf under endosomal pH conditions.
Keywords (separated by '-') Iron release - Electrostatic interactions - Anion-binding - Conformational change - Structural stability
Footnote Information Electronic supplementary material The online version of this article (doi:10.1007/s00775-014-1145-2)contains supplementary material, which is available to authorized users.

Metadata of the article that will be visualized in OnlineAlone
Electronic supplementarymaterial
Below is the link to the electronic supplementary material.MOESM1: Supplementary material 1 (PDF 57 kb).
UNCORRECTEDPROOF
ORIGINAL PAPER1
2 Electrostatic effects control the stability and iron release kinetics
3 of ovotransferrin
4 Sandeep Kumar • Deepak Sharma •
5 Rajesh Kumar • Rajesh Kumar
6 Received: 4 August 2013 /Accepted: 29 April 20147 � SBIC 2014
8 Abstract The contribution of electrostatic interactions to
9 the stability of ovotransferrin-Fe3? (oTf-Fe3?) complex
10 has been assessed by equilibrium experiments that measure
11 iron retention level of diferric-ovotransferrin (Fe2oTf) as a
12 function of pH and urea in the presence of salts (NaCl,
13 Na2SO4, NaBr, NaNO3) and sucrose at 25 �C. As [salt] is
14 increased, the pH-midpoint for iron release increases mo-
15 noexponentially and plateau at *0.4(±0.05) M NaCl/
16 NaBr/NaNO3 or *0.15(±0.03) M Na2SO4. However, at
17 pH 7.4, the urea-midpoints for iron release (based on
18 fluorescence emission at 340 nm) and for unfolding of
19 Fe2oTf and apo-ovotransferrin (based on ellipticity values
20 at 222 and 282 nm) decrease at low salt concentrations
21 [B0.1(±0.02) M Na2SO4 or B0.35(±0.15) M NaCl], but
22 increase at higher salt concentrations. Furthermore, Na2-23 SO4 has a greater effect than NaCl in increasing the urea-
24 midpoints for iron release and unfolding. These results
25 indicate that at low salt concentrations, the electrostatic
26 effects destabilize the oTf-Fe3? complex and also decrease
27 the structural stability of the proteins. In contrast, at higher
28 concentrations, salt ions behave according to Hofmeister
29 series. At pH 5.6, as [salt] is increased, the rate constants
30 for reductive iron release (Fe2? release) and urea dena-
31 turation-induced iron release (Fe3? release) from the
32N-lobe of oTf (FeNoTf) increase monoexponentially and
33plateau at*0.4(±0.1) M NaNO3/NaCl or*0.2(±0.05) M
34Na2SO4. These results suggest that the anion-binding-
35induced conformational change as well as the electrostatic
36screening of surface Coulombic interactions plays impor-
37tant role in accelerating the iron release from FeNoTf under
38endosomal pH conditions. 39
40Keywords Iron release � Electrostatic interactions �
41Anion-binding � Conformational change � Structural
42stability
43Introduction
44The stability of proteins is generally governed by nonco-
45valent interactions such as hydrophobic [1, 2], electrostatic
46[3–7], and hydrogen bonding [8, 9]. However, the relative
47contributions of these interactions to protein stability are
48not fully resolved. In particular, the role of ionic interac-
49tions in protein stability is relatively more complex [10].
50Buffer conditions such as pH and salt can have dramatic
51effect on the stability and biological functions of proteins.
52For example, the low pH triggers a large conformational
53change in transferrins (Tfs), which is a critical step for iron
54release in endosome [11–25]. In general, pH modulates the
55protein stability by altering the charges on ionizable groups
56in the proteins through protonation or deprotonation [26].
57Salt ions also modulate the stability of proteins [27, 28]. At
58low concentrations, salt ions affect the stability of proteins
59by altering the electrostatic (Debye-Huckel) screening of
60Coulombic interactions [9, 29, 30]. At relatively higher
61concentrations, salt ions follow the Hofmeister effect,
62which eventually depends on the nature of added ions and
63modulates the stability of proteins by increasing the surface
A1 Electronic supplementary material The online version of thisA2 article (doi:10.1007/s00775-014-1145-2) contains supplementaryA3 material, which is available to authorized users.
A4 S. Kumar � R. Kumar � R. Kumar (&)
A5 School of Chemistry and Biochemistry, Thapar University,
A6 Patiala 147004, India
A7 e-mail: [email protected]
A8 D. Sharma
A9 Institute of Microbial Technology, Council of Scientific
A10 and Industrial Research, Sector 39A, Chandigarh, India
AQ1
123Journal : Large 775 Dispatch : 12-5-2014 Pages : 16
Article No. : 1145h LE h TYPESET
MS Code : JBIC-13-08-00139 h CP h DISK4 4
J Biol Inorg Chem
DOI 10.1007/s00775-014-1145-2
Au
tho
r P
ro
of
UNCORRECTEDPROOF
64 tension of solvent that ultimately alters the hydrophobic
65 interactions [28, 31–34]. According to Hofmeister series, the
66 anions typically follow the order F-&HPO42-[ SO4
2-[
67 ICH3COO-[Cl-[NO3
-[Br-[ClO3
-[I-[ClO4
-[SCN-.
68 The species at the left of Cl- in this sequence are referred to
69 as kosmotropes (ordering of water structures and thus sta-
70 bilize the protein) and produce salting-out effect while those
71 at the right of Cl- are known as chaotropes (breaking of
72 water structure and thus destabilize the proteins) and produce
73 salting-in effects [28, 31–34].
74 The contributions of electrostatic and hydrophobic
75 interactions to the stability of proteins are generally
76 determined by measuring the unfolding transitions of pro-
77 teins as a function of salt concentration [5, 7, 35, 36].
78 Although the effect of salt concentrations on the stability of
79 proteins has been studied extensively [30, 35, 36], only few
80 studies measured the relative contributions of the electro-
81 static and hydrophobic interactions to the stability and
82 functional properties of proteins [30, 35]. The current study
83 provides this analysis for hen ovotransferrin (oTf), the iron
84 binding protein from egg white.
85 oTf is a member of the transferrin family of iron-binding
86 glycoproteins that also includes serum transferrin (sTf) and
87 milk lactoferrin (Lf) [14]. The affinity of Tfs for Fe3? is
88 extremely high (Ka * 1020 M-1) [37–40]. This high
89 affinity for Fe3? gives protection against iron-catalyzed
90 free radical formation and limits the bacterial growth. Tfs
91 can also bind non-ferrous metal ions [38, 41–46], few of
92 them are of therapeutic and diagnostic interest [38, 41–43].
93 sTf is primarily responsible for iron transport from bio-
94 logical fluids to cytosol by receptor-mediated endocytosis
95 [47] while oTf and Lf act as bacteriostatic agents [48]. Few
96 earlier in vitro studies have revealed that oTf also possesses
97 the cellular iron transport functions [49–51].
98 oTf has structural characteristics similar to that of hen
99 sTf [52]. This is presumably because these two proteins
100 derived from same gene differ only in the linked carbo-
101 hydrate groups [52]. Structurally, Tfs are bi-lobed proteins
102 with N- and C-terminal domains of approximately similar
103 size, and each domain can bind one iron atom synergisti-
104 cally with a carbonate anion [14, 48, 53]. These two
105 domains are connected by linker sequence [54, 55]. Upon
106 complex formation with iron, each domain of Tfs under-
107 goes a large-scale conformational change [56–60]. Car-
108 bonate (or bicarbonate) is the dominant synergistic anion
109 in vivo that plays a critical role in physiological release and
110 uptake of iron by Tfs [47, 61–67]. Increasing evidence
111 suggests that many non-synergistic anions (SO42-, Cl-,
112 NO3-, ClO4
-, etc.) which do not bind directly to iron but
113 bind to the protein [17, 68–73] also play an important role
114 in chelator-mediated iron release from Tfs [17, 72, 74–88].
115 However, the molecular mechanism by which these non-
116 synergistic anions modulate the chelator-mediated iron
117release from monoferric- and diferric-Tfs remains contro-
118versial [72, and reference there in].
119In the absence of chelators, iron release from monofer-
120ric- and diferric-Tfs can be stimulated by a number of
121factors that can operate individually or together. In vitro,
122these include the acid lability of the two sites resulting in
123iron release at low pH [78, 89], reduction of Fe3? to the
124much more weakly bound Fe2? [80, 90, 91], thermal
125denaturation of holoprotein that results in iron release
126above melting temperature [30], and chemical denaturation
127of holoprotein resulting in iron release above denaturation
128midpoint [92]. To assess the role of molecular interactions
129responsible for the oTf-Fe3? complex stabilization and
130structural stability of Fe2oTf, we have carried out the pH-
131and urea-denaturation equilibrium experiments for Fe2oTf
132in the absence of chelators as a function of salts (NaCl,
133NaNO3, NaBr, and Na2SO4) and sucrose concentration at
13425 �C. Interestingly, the low concentrations of salt
135[B0.1(±0.02) M Na2SO4 or B0.35(±0.15) M NaCl/
136NaNO3/NaBr] destabilize the oTf-Fe3? complex and also
137decrease the structural stability of Fe2oTf. The present
138work also reveals that the salt-mediated decreased stability
139of Fe2oTf appears to result from (i) the destabilization of
140oTf-Fe3? complex and (ii) the ionic screening of electro-
141static interactions.
142To understand the underlying mechanism by which
143noncovalent molecular interactions control the dynamics of
144iron release from Tfs, we have also studied the kinetics of
145Fe2? and Fe3? release from FeNoTf at pH 7.4 and pH 5.6 in
146the absence of chelators as a function of salt (NaCl,
147NaNO3, and Na2SO4) and sucrose concentration. At pH
1487.4, with increase in the salt concentration from 0.0 to
1491.0 M NaCl/NaNO3 or 0.5 M Na2SO4, the rate constants
150for reductive iron release (i.e., Fe2? release) and urea
151denaturation-induced iron release (i.e., Fe3? release) from
152FeNoTf increase initially when the salt concentration is low
153[B0.12(±0.05) M NaCl or Na2SO4], but decrease at higher
154salt concentrations. As salt concentration is increased, the
155rate constants for Fe2? and Fe3? release from FeNoTf
156increase mono-exponentially and plateau at*0.4(±0.1) M
157NaNO3/NaCl or *0.2(±0.05) M Na2SO4 at pH 5.6, indi-
158cating that the anion-binding-induced conformational
159change and electrostatic destabilization of FeNoTf complex
160by salt regulate the kinetics of iron release from FeNoTf
161under endosomal pH conditions.
162Materials and methods
163Egg white apo-oTf (C0755), salts (NaCl, NaNO3, NaBr,
164and Na2SO4), sucrose, NaOH, and salts of buffers 4-(2-
165Hydroxyethyl)-1-piperazineethanesulfonate (HEPES) and
1662-(N-mopholino) ethanesulfonate (MES) were purchased
J Biol Inorg Chem
123Journal : Large 775 Dispatch : 12-5-2014 Pages : 16
Article No. : 1145h LE h TYPESET
MS Code : JBIC-13-08-00139 h CP h DISK4 4
Au
tho
r P
ro
of
UNCORRECTEDPROOF
167 from Sigma. pH of the buffers and protein samples were
168 adjusted using concentrated NaOH or HCl solutions.
169 Preparation of Fe2oTf
170 Fe2oTf complex was prepared by well-known procedure
171 used earlier for diferric sTf [93–95]. Briefly, an iron ni-
172 trilotriacetate solution was prepared by dissolving nitrilo-
173 acetic acid (*100 lmol) and FeCl3�6H2O (*50 lmol) in
174 2 mL solution of 6 M HCl. pH of this solution was
175 adjusted to 4.0 with concentrated NaOH solution. This
176 solution was finally diluted up to 10 mL. Apo-oTf (80 mg,
177 1 lmol) was dissolved in 3 mL of buffer (50 mM HEPES,
178 pH 7.4, 20 mM NaHCO3). Protein solution was then
179 diluted up to 5 mL by adding the freshly prepared iron
180 nitrilotriacetate solution. Protein solution thus prepared
181 was incubated overnight at *37 �C. To remove the
182 unbound iron, protein solution was exchanged at least five
183 times with original buffer (50 mM HEPES, pH 7.4) using a
184 Centricon filter of 10 kDa molecular mass cut-off (Milli-
185 pore, Bedford, MA, USA). Iron saturation of oTf was
186 checked by urea-polyacrylamide gel electrophoresis. The
187 concentration of Fe2oTf was determined spectrophoto-
188 metrically on the basis of e465 nm = 5 9 103 M-1 cm-1
189 [37]. The percentage of protein iron saturation was above
190 95 %.
191 Preparation of FeNoTf
192 FeNoTf was prepared by a well-known procedure used
193 earlier for monoferric sTf [95, 96]. The perchlorate ion
194 enhances the rate of iron release from the C-lobe 260 times
195 more than the N-lobe of Tfs. Therefore, the concept of
196 selective release of iron from C-lobe of Fe2oTf is used to
197 prepare the FeNoTf. For this, Fe2oTf (250 lM) was incu-
198 bated at 37 �C for *2 h in 0.1 M HEPES buffer that also
199 contained 0.1 M EDTA and 2.7 M NaClO4. To remove the
200 EDTA and NaClO4 from protein solution, the protein
201 solution was exchanged at least five times with original
202 buffer (50 mM HEPES, pH 7.4) using a Centricon filter of
203 10 kDa molecular mass cut-off (Millipore, Bedford, MA,
204 USA). Iron saturation of oTf was checked by urea–poly-
205 acrylamide gel electrophoresis. The concentration of FeN-206 oTf was determined spectrophotometrically on the basis of
207 e465 nm = 2,150 M-1 cm-1 [93].
208 Measurement of iron release from Fe2oTf as a function
209 of pH
210 Solutions of Fe2oTf (*10 lM) were prepared in mixture
211 of buffers (0.02 M HEPES ? 0.02 M MES, pH*8.0–3.0)
212 that contained different concentrations of salt (NaCl,
213 NaNO3, NaBr, and Na2SO4) or sucrose. Before the data
214collections, the protein samples were incubated for*4 h at
21525 �C. pH of the protein samples were measured both
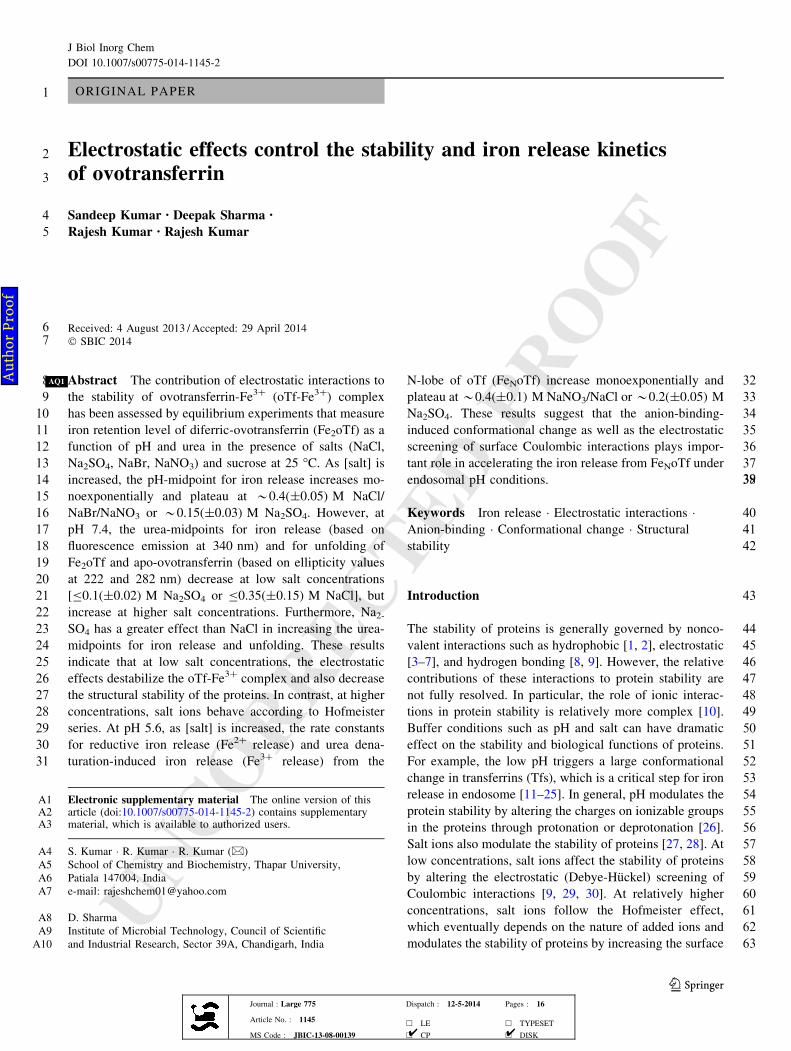
216before and after the experiments. The reported pH values
217are those determined after taking the data. The decrease in
218absorbance maximum at 465 nm and increase in intrinsic
219fluorescence emission intensity at 340 nm (excitation at
220280 nm) were used as the reliable markers for iron release
221from diferric-Tfs [21, 97–99]. Fluorescence emission
222spectra (320–410 nm) were collected on Perkin Elmer LS-
22355 spectrofluorometer, and visible absorbance spectra
224(390–710 nm) were collected on Shimadzu 2450-UV
225spectrophotometer. The pH equilibrium profiles for Fe2oTf
226were measured by monitoring changes in fluorescence
227emission at 340 nm (kex = 280 nm) and absorbance at
228465 nm. On the basis of fluorescence emission at 340 nm
229and absorbance at 465 nm, the fraction of iron released was
230estimated.
231Measurement of iron release from Fe2oTf as a function
232of urea
233Solutions of Fe2oTf (10 lM) were prepared in a buffer
234(0.05 M HEPES, pH 7.4 or 0.05 M MES, pH 5.8–5.4) that
235contained different concentrations of urea and a desired
236concentration of salt (NaCl, and Na2SO4) or sucrose. The
237denaturant concentration of Fe2oTf solution was measured
238before and after data acquisition using Abbe refractometer
239and found not to change within the uncertainty of the
240measurement. Before the data collection, the protein sam-
241ples were incubated for*5 h at 25 �C. The fraction of iron
242released from Fe2oTf by urea was estimated by their
243fluorescence emission (ex: 280 nm) at 340 nm or absor-
244bance at 465 nm.
245Unfolding of Fe2oTf and apo-oTf by urea
246Solutions of Fe2oTf or apo-oTf were prepared in a buffer
247[0.05 M HEPES (pH 7.4) or 0.05 M MES (pH 5.8–5.4)]
248that contained different concentrations of urea and a
249desired concentration of salt (NaCl, and Na2SO4) or
250sucrose. Prior to data collection, the protein samples were
251incubated for *5 h at 25 �C. To determine the effect of
252salts on the structural stability of Fe2oTf and apo-oTf, we
253have collected the urea dependent (0.0–11.0 M) far-UV
254(205–250, 1 mm pathlength) and near-UV (250–310,
2555 mm pathlength) CD spectra for Fe2oTf and apo-oTf in
256the presence of a desired concentration of salt (NaCl,
257Na2SO4) or sucrose at 25 �C. The final concentrations of
258Fe2oTf or apoTf for far-UV and near-UV CD were*5 and
259*10 lM, respectively. The fraction of unfolded protein
260(fD) was estimated from the far-UV (222 nm) and near-UV
261(282 nm) CD data.
J Biol Inorg Chem
123Journal : Large 775 Dispatch : 12-5-2014 Pages : 16
Article No. : 1145h LE h TYPESET
MS Code : JBIC-13-08-00139 h CP h DISK4 4
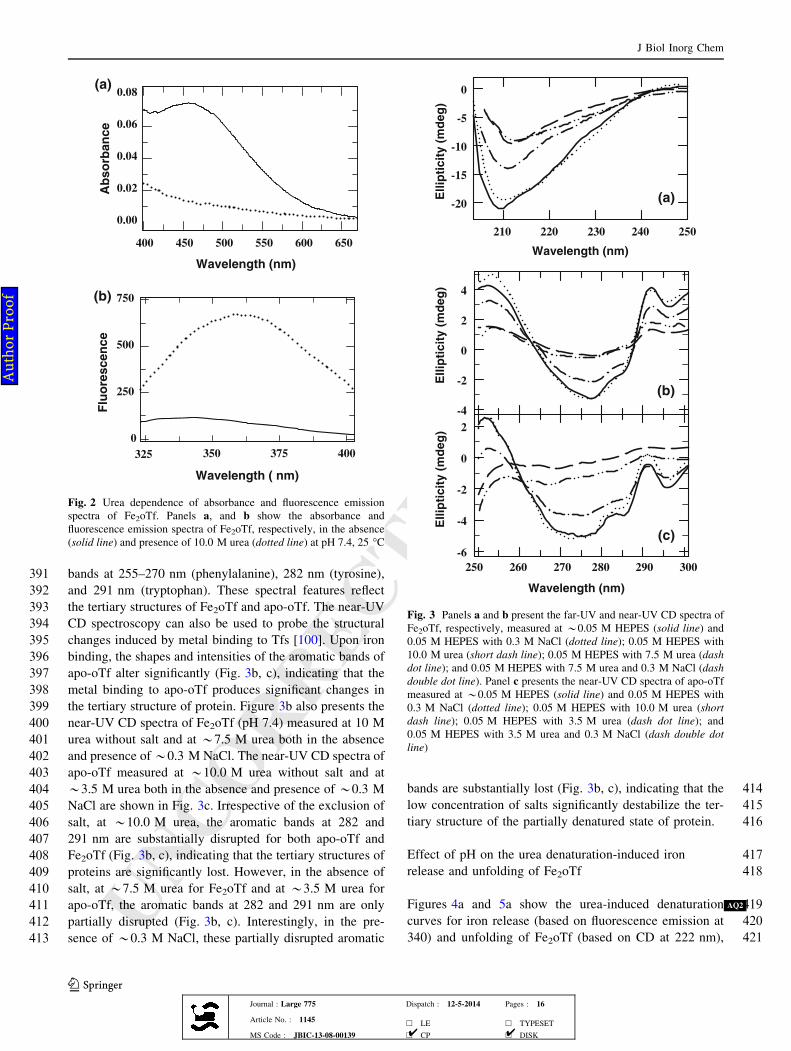
Au
tho
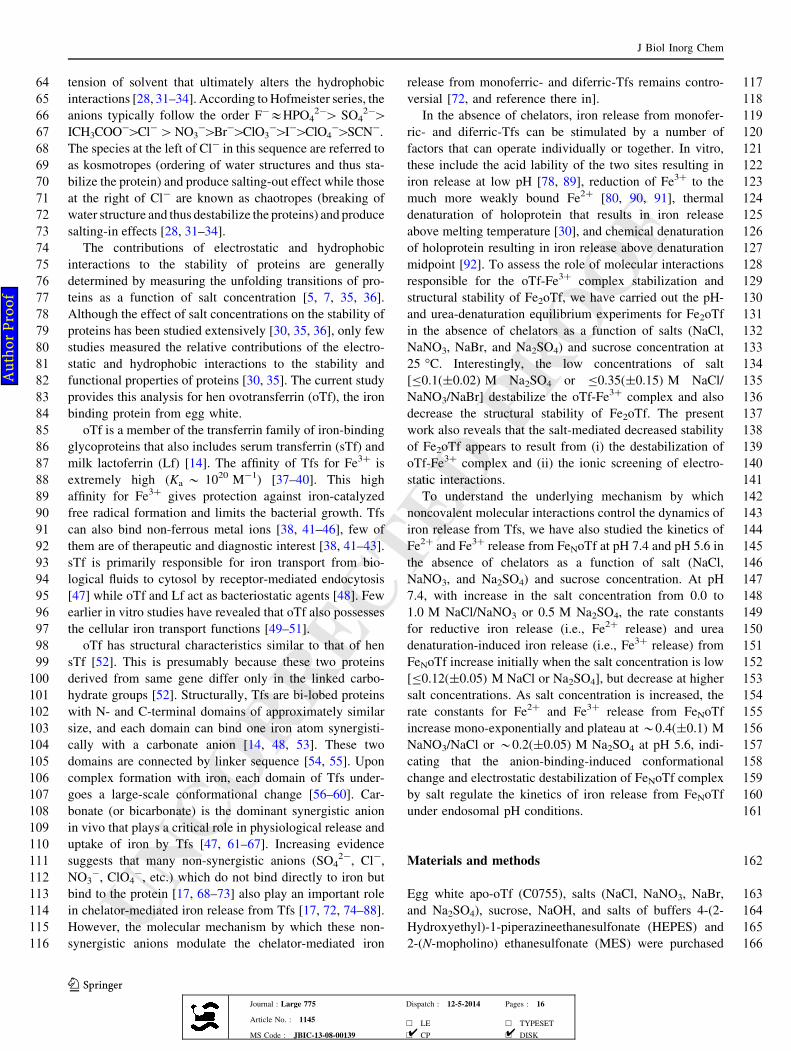
r P
ro
of

UNCORRECTEDPROOF
262 Kinetics of iron release from FeNoTf by urea
263 denaturation
264 When FeNoTf was incubated with 9.0 M urea at pH 7.4 or
265 6.0 M urea at pH 5.6, the absorbance at 465 nm decreased
266 rapidly [92]. The kinetics of urea denaturation-induced iron
267 release were was measured by monitoring the change in
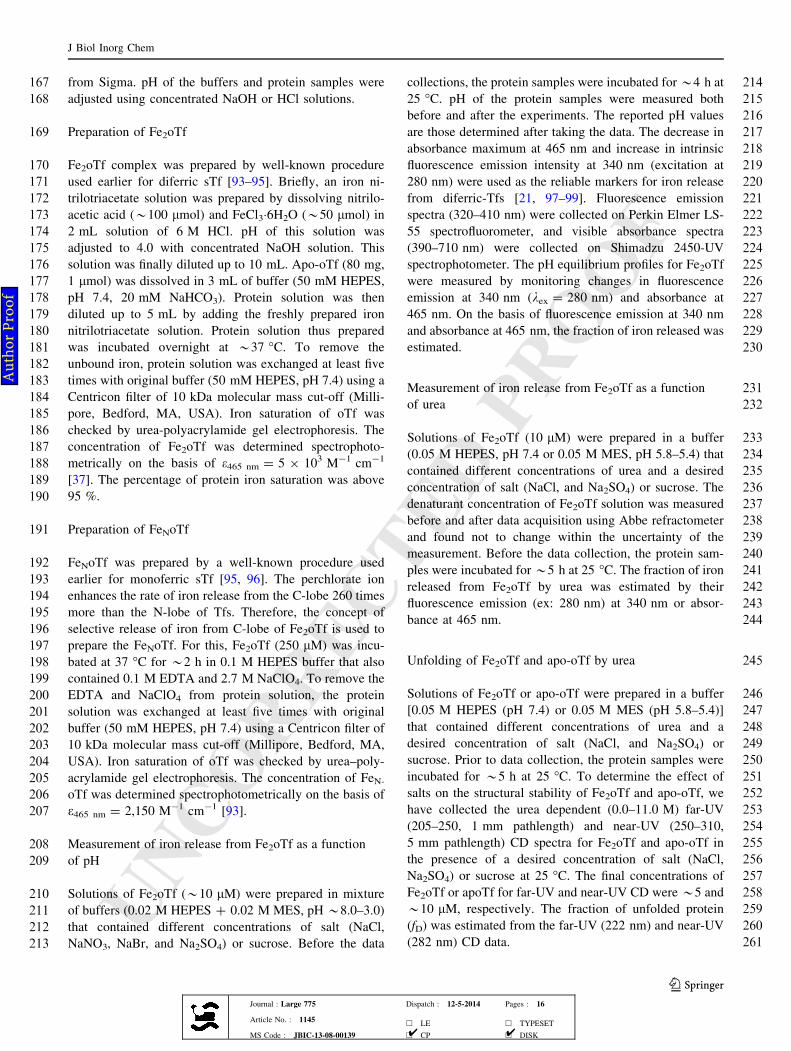
268 absorbance at 465 nm, 37 �C. For kinetic experiments at
269 pH 7.4, protein solution (40 lL, 110 lM, pH 7.4) was
270 mixed rapidly to HEPES buffer (0.05 M, 0.8 mL, pH 7.4)
271 that contained 9.0 M urea and a desired concentration of
272 salt (NaCl or Na2SO4) or sucrose. At pH 5.6, iron release
273 reaction is relatively faster; therefore, the kinetics of iron
274 release at this pH were measured by a Shimadzu 2450
275 spectrophotometer coupled with rapid kinetics stopped-
276 flow mixing accessory (applied photophysics RX 2000).
277 FeNoTf (pH 7.4) was placed in one syringe and the MES
278 buffer (0.05 M, pH 5.6) that contained 6.0 M urea and a
279 desired concentration of salt (NaCl or Na2SO4) or sucrose
280 was placed in other stopped flow syringe. For kinetic
281 experiments at pH 7.4 and pH 5.6, the final concentrations
282 of protein were *5.5 and *10 lM, respectively.
283 Kinetics of reductive release of iron from FeNoTf
284 by sodium dithionite
285 For kinetic experiments at pH 7.4, a small volume of
286 FeNoTf solution (40 lL, 110 lM, pH 7.4) was mixed
287 rapidly to a degassed HEPES buffer (0.05 M, 0.8 mL, pH
288 7.4) that contained 10 mM sodium dithionite, 0.25 mM
289 BPS, and a desired concentration of salt (NaNO3 or Na2-290 SO4) or sucrose. The kinetics of reductive iron release were
291 measured by Fe2?-BPS complex absorbance at 538 nm
292 [80, 91]. The kinetics of reductive iron release at pH 5.6
293 were measured by a Shimadzu 2450 spectrophotometer
294 coupled with rapid kinetics stopped-flow mixing accessory
295 because the reductive iron release reaction is relatively
296 faster at this pH. FeNoTf (pH 7.4) was placed in one syr-
297 inge and MES buffer (0.05 M, pH 5.5) that contained
298 sodium dithionite, BPS, and a desired concentration of salt
299 (NaNO3 or Na2SO4) or sucrose was placed in other stopped
300 flow syringe. The final concentrations of protein, sodium
301 dithionite, and BPS were *5 lM, *10 mM, and
302 *0.25 mM, respectively.
303 Results
304 pH dependence of the absorbance and fluorescence
305 emission spectra of Fe2oTf
306 At pH 7.4, the electronic absorption spectrum of Fe2oTf
307 shows a maximum at 465 nm, which indicates that iron is
308fully associated with protein (Fig. 1a). When pH is lowered
309from 7.4 to 3.5, the absorbance maximum at 465 nm is
310completely lost (Fig. 1a). This suggests that iron is fully
311released from both sites of Fe2oTf. Lowering the pH from
3127.4 to 3.5, the quenching of Trp fluorescence by bound
313Fe3? also diminishes (Fig. 1b), confirming that iron is fully
314released from both sites of Fe2oTf.
315Salt dependence of the pH-midpoint for iron release
316of Fe2oTf
317To determine the effect of salts or sucrose on the stability
318of oTf-Fe3? complex, the pH-titrations for Fe2oTf were
319obtained by monitoring fluorescence emission at 340 nm
320and absorbance at 465 nm in the presence of various
321concentrations of salt (NaCl, NaNO3, NaBr, Na2SO4) or
322sucrose at 25 �C. For brevity, we present the fluorescence-
323monitored pH titrations of Fe2oTf in the absence of addi-
324tive and in the presence of *0.15 and 0.5 M NaCl, 0.15
325and 0.5 M NaNO3, 0.15 M NaBr, 0.25 M Na2SO4, and 0.5
326and 1.0 M sucrose (Fig. 1c). As salt concentration is
327increased, the transition midpoint shifts towards the higher
328pH (Fig. 1c, d), which reveals that the salt reduces the
329stability of oTf-Fe3? complex. On the contrary, as sucrose
330concentration is increased, the transition midpoint shifts
331towards the lower pH (Fig. 1c), indicating that sucrose
332increases the stability of oTf-Fe3? complex.
333To determine the role of molecular interactions
334responsible for the stability of oTf-Fe3? complex, the pH
335profiles of Fe2oTf measured at various concentrations of
336salt (NaCl, NaNO3, NaBr, Na2SO4) or sucrose were fitted
337to Eq. (1) [30].
y ¼cf þ cu 10 Cm�pHð Þ
� �
1þ 10 Cm�pHð Þ
" #
ð1Þ
339339where cf and cu are the normalized absorbance or
340fluorescence signals for iron-loaded native state and
341iron-free acid-denatured state, respectively, and Cm is
342the pH midpoint where Fe2oTf complex lost its half of
343the metal ions. As salt concentration is increased, the
344Cm for iron release increases mono-exponentially and
345plateau at *0.4(±0.05) M NaCl/NaBr/NaNO3 or
346*0.15(±0.03) M Na2SO4. (Fig. 1d). On the contrary, as
347sucrose concentration is increased from 0.0 to 1.0 M,
348the Cm decreases by *0.4 unit (Fig. 1c). Figure 1d also
349shows that the increase in Cm for Fe2oTf is more
350pronounced for Na2SO4 and least for NaBr. The salt-
351induced increase in Cm for Fe2oTf typically follows the
352order Na2SO4[NaNO3[NaCl[NaBr. These findings
353indicate that Na2SO4 has a greater effect than that of
354NaBr/NaNO3/NaCl in destabilizing the oTf-Fe3?
355complex.
J Biol Inorg Chem
123Journal : Large 775 Dispatch : 12-5-2014 Pages : 16
Article No. : 1145h LE h TYPESET
MS Code : JBIC-13-08-00139 h CP h DISK4 4
Au
tho
r P
ro
of
UNCORRECTEDPROOF
356 Urea dependence of the absorbance and fluorescence
357 emission spectra of Fe2oTf
358 At pH 7.4, when urea concentration is increased from 0.0 to
359 10.0 M, the absorbance maximum at 465 nm in the
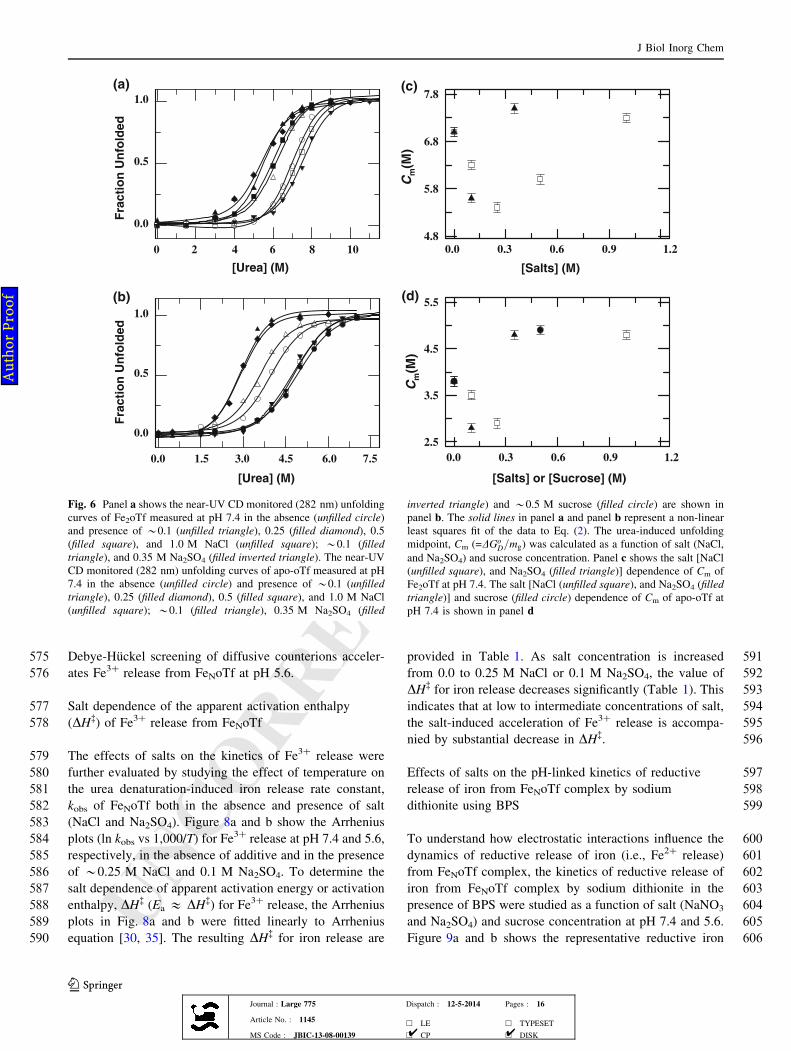
360 absorption spectrum of Fe2oTf is almost eliminated
361 (Fig. 2a), indicating that both sites of Fe2oTf have com-
362 pletely released their bound metal ions. At 10.0 M urea, the
363 quenching of Trp fluorescence by bound Fe3? is also
364 diminished (Fig. 2b), indicating that the iron is fully dis-
365 sociated from both sites of Fe2oTf complex.
366 Effects of salt on the secondary and tertiary structures
367 of Fe2oTf and apo-oTf
368 The far-UV CD spectra (200–250 nm) of native Fe2oTf
369 (pH 7.4) in the absence and presence of *0.3 M NaCl
370 shows the negative extrema at 208 nm and a shoulder
371 around 215–225 nm (Fig. 3a). These spectral features
372reflect the presence of secondary structural elements in the
373protein. Figure 3a also presents the far-UV CD spectra of
374Fe2oTf (pH 7.4) measured at *10.0 M urea without salt
375and at *7.5 M urea in the absence and presence of
376*0.3 M NaCl. Irrespective of the exclusion of salt, at
377*10.0 M urea, the negative extrema at 208 nm and a
378shoulder around 215–225 nm are substantially disrupted
379(Fig. 3a), indicating that the secondary structure of protein
380is significantly lost. However, in the absence of salt, at
381*7.5 M urea, the negative extrema at 208 nm and a
382shoulder around 215–225 nm are only partially disrupted
383(Fig. 3a). Interestingly, in the presence of *0.3 M NaCl,
384these partially disrupted peptide bands are substantially
385disrupted (Fig. 3a), indicating that the low concentrations
386of salt significantly destabilize the secondary structure of
387the partially denatured state of protein.
388The near-UV CD spectra (250–300 nm) of native Fe2-389oTf (Fig. 3b) and apo-oTf (Fig. 3c) in the absence and
390presence of*0.3 M NaCl show the three aromatic residue
pH
3 4 5 6 7 8
% I
ron
Re
ma
inin
g
0
50
100
[Salts] or [Sucrose] (M)
0.0 0.3 0.6 0.9 1.2
Cm
4.5
4.8
5.1
5.4
5.7
Wavelength (nm)
400 450 500 550 600 650 700
Ab
so
rba
nc
e
0.00
0.02
0.04
0.06
0.08
Wavelength ( nm)
310 335 360 385 410
Flu
ore
sc
en
ce
0
200
400
600
(a)
(b)
(c)
(d)
Fig. 1 pH dependence of iron release from Fe2oTf in the presence of
salts and sucrose. a Absorbance and b fluorescence emission spectra
of Fe2oTf [(solid line) 0.05 M HEPES, pH 7.4; (dotted line) 0.05 M
MES, pH 3.5]. c pH equilibrium profiles of Fe2oTf monitored by
fluorescence (ex: 280 nm). All experiments were performed at 25 �C:
(filled circle) no salt; (filled square) 0.15 M NaBr; (unfilled inverted
triangle) 0.15 M NaCl; (filled inverted triangle) 0.15 M NaNO3;
(filled triangle) 0. 5 M NaCl; (unfilled square) 0.5 M NaNO3;
(unfilled triangle) 0.25 M Na2SO4; (unfilled circle) 0.5 M and
(unfilled diamond) 1.0 M sucrose. The solid lines in panel c were
fitted according to Eq. (1). d The dependence of the pH-midpoint at
which half of the iron is released from Fe2oTf on [Salts] [(filled
circle) NaBr; (unfilled circle) NaCl; (filled square) NaNO3; (unfilled
square) Na2SO4] and [Sucrose] [(unfilled diamond) sucrose]. The
solid lines in panel d represent non-linear least squares fits of the data
to a single-exponential function
J Biol Inorg Chem
123Journal : Large 775 Dispatch : 12-5-2014 Pages : 16
Article No. : 1145h LE h TYPESET
MS Code : JBIC-13-08-00139 h CP h DISK4 4
Au
tho
r P
ro
of
UNCORRECTEDPROOF
391 bands at 255–270 nm (phenylalanine), 282 nm (tyrosine),
392 and 291 nm (tryptophan). These spectral features reflect
393 the tertiary structures of Fe2oTf and apo-oTf. The near-UV
394 CD spectroscopy can also be used to probe the structural
395 changes induced by metal binding to Tfs [100]. Upon iron
396 binding, the shapes and intensities of the aromatic bands of
397 apo-oTf alter significantly (Fig. 3b, c), indicating that the
398 metal binding to apo-oTf produces significant changes in
399 the tertiary structure of protein. Figure 3b also presents the
400 near-UV CD spectra of Fe2oTf (pH 7.4) measured at 10 M
401 urea without salt and at *7.5 M urea both in the absence
402 and presence of*0.3 M NaCl. The near-UV CD spectra of
403 apo-oTf measured at *10.0 M urea without salt and at
404 *3.5 M urea both in the absence and presence of*0.3 M
405 NaCl are shown in Fig. 3c. Irrespective of the exclusion of
406 salt, at *10.0 M urea, the aromatic bands at 282 and
407 291 nm are substantially disrupted for both apo-oTf and
408 Fe2oTf (Fig. 3b, c), indicating that the tertiary structures of
409 proteins are significantly lost. However, in the absence of
410 salt, at *7.5 M urea for Fe2oTf and at *3.5 M urea for
411 apo-oTf, the aromatic bands at 282 and 291 nm are only
412 partially disrupted (Fig. 3b, c). Interestingly, in the pre-
413 sence of *0.3 M NaCl, these partially disrupted aromatic
414bands are substantially lost (Fig. 3b, c), indicating that the
415low concentration of salts significantly destabilize the ter-
416tiary structure of the partially denatured state of protein.
417Effect of pH on the urea denaturation-induced iron
418release and unfolding of Fe2oTf
419Figures 4a and 5a show the urea-induced denaturation
420curves for iron release (based on fluorescence emission at
421340) and unfolding of Fe2oTf (based on CD at 222 nm),
Wavelength (nm)
400 450 500 550 600 650
Ab
so
rba
nc
e
0.00
0.02
0.04
0.06
0.08
Wavelength ( nm)
325 350 375 400
Flu
ore
sc
en
ce
0
250
500
750
(a)
(b)
Fig. 2 Urea dependence of absorbance and fluorescence emission
spectra of Fe2oTf. Panels a, and b show the absorbance and
fluorescence emission spectra of Fe2oTf, respectively, in the absence
(solid line) and presence of 10.0 M urea (dotted line) at pH 7.4, 25 �C
Wavelength (nm)
250 260 270 280 290 300
-6
-4
-2
0
2
-4
-2
0
2
4
Wavelength (nm)
210 220 230 240 250
Ell
ipti
cit
y (
md
eg
)
E
llip
tic
ity
(m
de
g)
Ell
ipti
cit
y (
md
eg
)
-20
-15
-10
-5
0
(a)
(b)
(c)
Fig. 3 Panels a and b present the far-UV and near-UV CD spectra of
Fe2oTf, respectively, measured at *0.05 M HEPES (solid line) and
0.05 M HEPES with 0.3 M NaCl (dotted line); 0.05 M HEPES with
10.0 M urea (short dash line); 0.05 M HEPES with 7.5 M urea (dash
dot line); and 0.05 M HEPES with 7.5 M urea and 0.3 M NaCl (dash
double dot line). Panel c presents the near-UV CD spectra of apo-oTf
measured at *0.05 M HEPES (solid line) and 0.05 M HEPES with
0.3 M NaCl (dotted line); 0.05 M HEPES with 10.0 M urea (short
dash line); 0.05 M HEPES with 3.5 M urea (dash dot line); and
0.05 M HEPES with 3.5 M urea and 0.3 M NaCl (dash double dot
line)
AQ2
J Biol Inorg Chem
123Journal : Large 775 Dispatch : 12-5-2014 Pages : 16
Article No. : 1145h LE h TYPESET
MS Code : JBIC-13-08-00139 h CP h DISK4 4
Au
tho
r P
ro
of
UNCORRECTEDPROOF
422 respectively, at pH 7.4, 5.8, 5.6, and 5.4. The normalized
423 urea-induced denaturation curves for the iron release and
424 unfolding of Fe2oTf collected at pH 7.4, 5.8, 5.6, and 5.4
425 (Figs. 4a, 5a) were fitted to Eq. (2) [101]:
Sobs ¼ðcf þ mf ½D�Þ þ ðcu þ mu½D�Þ exp
�DGoDþmg½D�
RT
� �
1þ exp�DGo
Dþmg½D�
RT
� � ;
ð2Þ
427427 where Sobs is the fluorescence or CD signals at given urea
428 concentration (D), cf and cu, and mf and mu represent
429 intercepts and slopes of iron loaded native and iron free
430 urea-denatured baselines, respectively, DGoD is the dena-
431 turation free energy in the absence of denaturant, and mg
432 is the surface area exposed by the solvent. The resulting
433 mg and DGoD for iron release and unfolding of Fe2oTf are
434 provided in Table S1 (Supporting Information). Although
435 the physical importance of the factor mg is not clearly
436understood, it is suggested to reflect the difference
437between the accessibility of surface areas of native and
438denatured states of the polypeptide chain for a given
439denaturant [102]. Decreasing the pH from 7.4 to 5.4, the
440mg values for iron release and unfolding of Fe2oTf
441become larger [Table S1 (Supporting Information)], sug-
442gesting that solvent exposed surface area increases upon
443iron release and unfolding at low pH. At each pH, the
444DGoD determined by far-UV CD is larger than the DGo
D
445measured by fluorescence [Table S1 (Supporting Infor-
446mation)]. This is presumably because Fe2oTf responds to
447increased urea concentration by means of a coupled pro-
448cess in which the urea-induced iron release precedes the
449unfolding reaction (Fe2oTf ? 2Fe3? ? apo-
450oTf ? unfolding). The far-UV CD monitored urea-dena-
451turation of Fe2oTf reflects this coupled process (iron
452release and unfolding) while the fluorescence or absor-
453bance (465 nm) monitored urea-denaturation of Fe2oTf
[Urea] (M)
Fra
cti
on
Iro
n R
ele
ased
0.0
0.5
1.0
[Urea] (M)
Fra
cti
on
Iro
n R
ele
ased
0.0
0.5
1.0
(a)
pH
5678
Cm
(M)
2.5
3.5
4.5
5.5
6.5
[Salts] or [Sucrose] (M)
0 2 4 6 8 10
0 2 4 6 8 10
0.0 0.4 0.8 1.2
Cm
(M)
4.5
5.5
6.5
7.5
(c)
(d) (b)
Fig. 4 a The pH dependence of the urea-induced release of iron from
Fe2oTf as evaluated from the change in fluorescence emission at
340 nm [(filled circle) pH 5.4; (unfilled triangle) pH 5.6; (filled
triangle) pH 5.8; and (unfilled circle) pH 7.4]. Panel b shows the
fluorescence-monitored (ex: 280 nm, em: 340 nm) urea dependence
of iron release from Fe2oTf at pH 7.4, in the absence (unfilled circle),
and presence of *0.1 (unfilled triangle), 0.5 (filled square), and
1.0 M NaCl (unfilled square); *0.1 (filled triangle), and 0.25 M
Na2SO4 (unfilled diamond); and *0.5 M sucrose (filled circle). The
solid lines in panels a and b represent a non-linear least squares fit of
the data to Eq. (2). The urea-induced iron release mid-point, Cm
(=DGoD=mg) was calculated as a function of pH, salt (NaCl, and
Na2SO4) and sucrose concentration. Panel c shows pH dependence
(filled square) of urea-induced iron release midpoint. Panel d shows
salt [NaCl (unfilled square), and Na2SO4 (filled triangle)] or sucrose
(filled circle) dependence of urea-induced iron release midpoint at pH
7.4
J Biol Inorg Chem
123Journal : Large 775 Dispatch : 12-5-2014 Pages : 16
Article No. : 1145h LE h TYPESET
MS Code : JBIC-13-08-00139 h CP h DISK4 4
Au
tho
r P
ro
of
UNCORRECTEDPROOF
454 reflects the iron release process of Fe2oTf. The urea mid-
455 points for iron release and unfolding (Cm = DGoD
�
mg)
456 were calculated as a function of pH. The plots of Cm for
457 iron release and unfolding of Fe2oTf as function of pH are
458 shown in Figs. 4d and 5d, respectively. Lowering the pH
459 from 7.4 to 5.4, the Cm values for both iron release and
460 unfolding decrease significantly (Figs. 4d, 5d), indicating
461 that the electrostatic interactions destabilize the oTf-Fe3?
462 complex and also decrease the structural stability of
463 Fe2oTf.
464Effects of salt and sucrose on urea denaturation-induced
465iron release from Fe2oTf and unfolding of Fe2oTf
466and apo-oTf
467Figure 4b shows the urea-denaturation curves for iron release
468(based on fluorescence emission at 340) from Fe2oTf at
469various concentrations of salt (NaCl and Na2SO4) and sucrose
470at pH 7.4. The far-UV CD (222 nm) monitored urea-induced
471unfolding curves of Fe2oTf and apo-oTf measured at various
472concentrations of salt (NaCl and Na2SO4) and sucrose at pH
[Urea] (M)
0.0
0.5
1.0 (a)
Fra
cti
on
Un
fold
ed
0.0
0.5
1.0
[Urea] (M)
Fra
cti
on
Un
fold
ed
0.0
0.5
1.0
(b)
(c)
pH
Cm
(M)
4.5
5.5
6.5
7.5
Cm
(M)
5
6
7
8
[Salts] or [Sucrose] (M)
0 2 4 6 8 10
0 2 4 6 8 10
5678
0.0 0.3 0.6 0.9 1.2
Cm
(M)
3.0
3.5
4.0
4.5
(d)
(e)
(f)
Fig. 5 a The pH dependence of the urea-induced unfolding of Fe2oTf
as evaluated from the change in far-UV CD at 222 nm [(filled circle)
pH 5.4; (unfilled triangle) pH 5.6; (filled triangle) pH 5.8; and
(unfilled circle) pH 7.4]. Panels b and c show the far-UV CD
monitored (222 nm) unfolding of Fe2oTf and apo-oTf, respectively, at
pH 7.4 in the absence (unfilled circle) and presence of*0.1 (unfilled
triangle), 0.5 (filled square), and 1.0 M NaCl (unfilled square);*0.1
(filled triangle), 0.25 (unfilled diamond), and 0.35 M Na2SO4 (filled
inverted triangle); and*0.5 M sucrose (filled circle). The solid lines
in panels a, b and c represent a non-linear least squares fit of the data
to Eq. (2). The urea-induced unfolding midpoint, Cm (=DGoD=mg) was
calculated as a function of pH, salt (NaCl, and Na2SO4) and sucrose
concentrations. Panel d shows pH dependence (filled square) of Cm.
Panels e and f show salt [NaCl (unfilled square), and Na2SO4 (filled
triangle)] and sucrose (filled circle) dependence of Cm of Fe2oTf and
apo-oTf, respectively, at pH 7.4
J Biol Inorg Chem
123Journal : Large 775 Dispatch : 12-5-2014 Pages : 16
Article No. : 1145h LE h TYPESET
MS Code : JBIC-13-08-00139 h CP h DISK4 4
Au
tho
r P
ro
of
UNCORRECTEDPROOF
473 7.4 are shown in Fig. 5b and c, respectively. Figure 6 shows
474 the near-UV CD (282 nm) monitored urea-induced unfolding
475 curves of Fe2oTf (Fig. 6a) and apo-oTf (Fig. 6b) measured at
476 various concentrations of salt (NaCl and Na2SO4) and sucrose
477 at pH 7.4. To determine the molecular interactions respon-
478 sible for the stabilization of oTf-Fe3? complex and structural
479 stability of Fe2oTf and apo-oTf, the urea-denaturation curves
480 collected at various concentrations of salts and sucrose for
481 iron release from Fe2oTf and unfolding of Fe2oTf and apo-
482 oTf were analyzed using Eq. (2) [101]. The resulting values
483 of DGoD and mg for iron release and unfolding are shown in
484 Table S2 and Table S3 (Supporting Information), respec-
485 tively. At each salt concentration, the DGoD for unfolding is
486 larger for Fe2oTf than the apo-oTf [Table S3 (Supporting
487 Information)], which suggests that the conformational sta-
488 bility of apo-oTf increases upon complex formation with iron.
489 At each salt concentration, the DGoD for unfolding of Fe2oTf
490 (based on ellipticity values at 222 and 282 nm) is also larger
491 than the DGoD measured for iron release (based on fluores-
492 cence emission at 340 nm). This finding further confirms that
493 the Fe2oTf responds to increased urea concentration by means
494 of a coupled process in which the urea-induced iron release
495 reaction occurs prior to the unfolding reaction. The urea mid-
496 points for iron release and unfolding (Cm = DGoD
�
mg) were
497 calculated as a function of salt (NaCl and Na2SO4) and
498 sucrose concentration [Table S2 and Table S3 (Supporting
499 Information)]. The plots of Cm for iron release of Fe2oTf as
500 function of salt and sucrose concentration are shown in
501 Fig. 4d. Figure 5e and f shows the plots of Cm for unfolding
502 of secondary structures of Fe2oTf and apo-Tf, respectively, as
503 function of salt and sucrose concentration. The plots of Cm for
504 unfolding of tertiary structures of Fe2oTf and apo-Tf as
505 function of salt and sucrose concentration are shown in
506 Fig. 6c and d, respectively. As salt concentration is increased,
507 the Cm values for iron release from Fe2oTf and unfolding of
508 Fe2oTf and apo-oTf decrease at low salt concentrations
509 [B0.1(±0.02) M Na2SO4 or B0.35(±0.15) M NaCl] but
510 increase at higher salt concentrations (Figs. 4d; 5e, f; 6c, d).
511 At higher concentrations, Na2SO4 has a greater effect than
512 that of NaCl in increasing the Cm for both iron release from
513 Fe2oTf and unfolding of Fe2oTf and apo-oTf (Figs. 4d; 5e, f;
514 6a, d), which indicates that at higher concentrations, salt ions
515 stabilize the oTf-Fe3? complex and also increase the struc-
516 tural stability of the proteins according to Hofmeister series
517 [28, 31–34].
518 Effects of salts and sucrose on the pH-linked kinetics
519 of urea denaturation induced iron release from FeNoTf
520 complex
521 To gain insight into the linkage of protein and active site
522 stability to the dynamics of Fe3? release, the kinetics of
523urea denaturation-induced Fe3? release from FeNoTf were
524studied as a function of salt (NaCl and Na2SO4) and
525sucrose concentration at pH 7.4 (Fig. 7a, c) and 5.6
526(Fig. 7b, d). Figure 7a and b shows the representative urea
527denaturation induced iron release kinetic traces of FeNoTf
528measured at pH 7.4 and 5.6, respectively, in the absence of
529salt at 37 �C. Both kinetic traces were fitted well in a
530mono-exponential decay function with rate constant, kobs,
531of *3.8 9 10-3 and 5.8 9 10-1 s-1 at pH 7.4 and 5.6,
532respectively. Clearly by decreasing the pH from 7.4 to 5.6,
533the kobs is increased by *150 fold [Table S4 (Supporting
534Information)]. At pH *7.4, with raising the concentration
535of NaCl from 0.0 to 0.25 M, kobs is increased by*1.5 fold
536[Fig. 7c and Table S4 (Supporting Information)]. On the
537contrary, with increasing the concentration of sucrose from
5380.0 to 0.5 M, kobs is decreased by*1.3 fold [Fig. 7c; Table
539S4 (Supporting Information)].
540Figure 7c and d shows the kobs vs [salts] or [sucrose]
541plots for the Fe3? release from FeNoTf complex at pH 7.4
542and 5.6, respectively. At pH 7.4, as salt concentration is
543increased, the kobs value increases at low salt concentration
544[B0.12(±0.03) M NaCl or Na2SO4] but decreases at higher
545salt concentrations [Fig. 7c; Table S4 (Supporting Infor-
546mation)]. This result is consistent with an earlier report that
547showed that the rate constant for iron release from the
548isolated N-lobe of human sTf by EDTA in the absence of
549urea increases at low salt concentrations (B0.3 M KCl) but
550decreases at higher salt concentrations [18]. Figure 7c also
551indicates that at higher salt concentrations, the extent of
552decrease in the kobs is more for Na2SO4 than that of NaCl.
553This result suggests that at higher concentrations (pH 7.4),
554the salt ions behave according to Hofmeister series [28, 31–
55534].
556At pH 5.6, as salt concentration is increased, the kobs557increases mono-exponentially and plateau at
558*0.4(±0.1) M NaCl or*0.2(±0.05) M Na2SO4 [Fig. 7d;
559Table S4 (Supporting Information)]. This result is consis-
560tent with an earlier report that showed that the rate constant
561for iron release from the N-lobe of human sTf at pH 5.6
562increases mono-exponentially with salt concentration [72].
563Figure 7d also indicates that at pH 5.6, the extent of
564increase in kobs is higher for Na2SO4 than that of NaCl.
565This suggests that Na2SO4 as compared to NaCl is more
566effective in accelerating iron release from FeNoTf.
567We have recently shown that at low to intermediate
568concentrations of salt (B0.35 M), an extended Debye-
569Huckel model can be used to explain the effect of ionic
570strength (I) on the rate of iron release from human serum
571diferric transferrin [30]. Inset of Fig. 7d shows the log kobs572vs I1/2/(1 ? I1/2) plot for FeNoTf at pH 5.6. Clearly, the log
573kobs increase linearly with I1/2/(1 ? I1/2), which indicates
574that at low to intermediate concentrations of salt, the
AQ3
J Biol Inorg Chem
123Journal : Large 775 Dispatch : 12-5-2014 Pages : 16
Article No. : 1145h LE h TYPESET
MS Code : JBIC-13-08-00139 h CP h DISK4 4
Au
tho
r P
ro
of
UNCORRECTEDPROOF
575 Debye-Huckel screening of diffusive counterions acceler-
576 ates Fe3? release from FeNoTf at pH 5.6.
577 Salt dependence of the apparent activation enthalpy
578 (DH�) of Fe3? release from FeNoTf
579 The effects of salts on the kinetics of Fe3? release were
580 further evaluated by studying the effect of temperature on
581 the urea denaturation-induced iron release rate constant,
582 kobs of FeNoTf both in the absence and presence of salt
583 (NaCl and Na2SO4). Figure 8a and b show the Arrhenius
584 plots (ln kobs vs 1,000/T) for Fe3? release at pH 7.4 and 5.6,
585 respectively, in the absence of additive and in the presence
586 of *0.25 M NaCl and 0.1 M Na2SO4. To determine the
587 salt dependence of apparent activation energy or activation
588 enthalpy, DH� (Ea & DH�) for Fe3? release, the Arrhenius
589 plots in Fig. 8a and b were fitted linearly to Arrhenius
590 equation [30, 35]. The resulting DH� for iron release are
591provided in Table 1. As salt concentration is increased
592from 0.0 to 0.25 M NaCl or 0.1 M Na2SO4, the value of
593DH� for iron release decreases significantly (Table 1). This
594indicates that at low to intermediate concentrations of salt,
595the salt-induced acceleration of Fe3? release is accompa-
596nied by substantial decrease in DH�.
597Effects of salts on the pH-linked kinetics of reductive
598release of iron from FeNoTf complex by sodium
599dithionite using BPS
600To understand how electrostatic interactions influence the
601dynamics of reductive release of iron (i.e., Fe2? release)
602from FeNoTf complex, the kinetics of reductive release of
603iron from FeNoTf complex by sodium dithionite in the
604presence of BPS were studied as a function of salt (NaNO3
605and Na2SO4) and sucrose concentration at pH 7.4 and 5.6.
606Figure 9a and b shows the representative reductive iron
[Urea] (M)
0 2 4 6 8 10
Fra
cti
on
Un
fold
ed
0.0
0.5
1.0
(a)
[Salts] (M)
0.0 0.3 0.6 0.9 1.2
0.0 0.3 0.6 0.9 1.2
4.8
5.8
6.8
7.8
[Salts] or [Sucrose] (M)
2.5
3.5
4.5
5.5
(c)
(d)
[Urea] (M)
0.0 1.5 3.0 4.5 6.0 7.5
Fra
cti
on
Un
fold
ed
0.0
0.5
1.0
(b)
Cm
(M)
Cm
(M)
Fig. 6 Panel a shows the near-UV CD monitored (282 nm) unfolding
curves of Fe2oTf measured at pH 7.4 in the absence (unfilled circle)
and presence of *0.1 (unfilled triangle), 0.25 (filled diamond), 0.5
(filled square), and 1.0 M NaCl (unfilled square); *0.1 (filled
triangle), and 0.35 M Na2SO4 (filled inverted triangle). The near-UV
CD monitored (282 nm) unfolding curves of apo-oTf measured at pH
7.4 in the absence (unfilled circle) and presence of *0.1 (unfilled
triangle), 0.25 (filled diamond), 0.5 (filled square), and 1.0 M NaCl
(unfilled square); *0.1 (filled triangle), 0.35 M Na2SO4 (filled
inverted triangle) and *0.5 M sucrose (filled circle) are shown in
panel b. The solid lines in panel a and panel b represent a non-linear
least squares fit of the data to Eq. (2). The urea-induced unfolding
midpoint, Cm (=DGoD=mg) was calculated as a function of salt (NaCl,
and Na2SO4) and sucrose concentration. Panel c shows the salt [NaCl
(unfilled square), and Na2SO4 (filled triangle)] dependence of Cm of
Fe2oTf at pH 7.4. The salt [NaCl (unfilled square), and Na2SO4 (filled
triangle)] and sucrose (filled circle) dependence of Cm of apo-oTf at
pH 7.4 is shown in panel d
J Biol Inorg Chem
123Journal : Large 775 Dispatch : 12-5-2014 Pages : 16
Article No. : 1145h LE h TYPESET
MS Code : JBIC-13-08-00139 h CP h DISK4 4
Au
tho
r P
ro
of
UNCORRECTEDPROOF
607 release kinetic traces of FeNoTf measured at pH 7.4 and
608 5.6, respectively, in the absence of salt at 25 �C. The
609 kinetics results of reductive iron release were well fitted to
610 a mono-exponential rise function with rate constants, kobs,
611 of *1.1 9 10-2 and 9.0 9 10-2 s-1 at pH 7.4 and 5.6,
612 respectively. Clearly, decreasing the pH from 7.4 to 5.6,
613 the kobs is increased by *8.2 fold [Table S5 (Supporting
614 Information)]. At pH 7.4, with increasing salt concentration
615 from 0.0 to 0.1 M NaNO3 or Na2SO4, kobs is increased by
616 *1.3 fold [Fig. 9c; Table S5 (Supporting Information)].
617 Figure 9c and d shows the kobs vs [salts] plots for Fe2?
618 release from FeNoTf complex at pH 7.4, and 5.6, respec-
619 tively. At pH 7.4, as salt concentration is increased from
620 0.0 to 1.0 M NaNO3 or 0.5 M Na2SO4, the kobs initially
621 increases at low salt concentrations [B0.1(±0.03) M
622 NaNO3 or Na2SO4] but decreases at higher salt concen-
623 trations [Fig. 9c; Table S5 (Supporting Information)]. The
624extent of decrease in kobs at higher salt concentrations is
625more for Na2SO4 than that of NaNO3. This finding suggests
626that at higher concentrations (pH 7.4), the salt ions behave
627according to Hofmeister series [28, 31–34].
628At pH 5.6, as salt concentration is increased, the kobs629increases mono-exponentially and level off at
630*0.4(±0.1) M NaNO3 or *0.2(±0.05) M Na2SO4
631[Fig. 9d; Table S5 (Supporting Information)]. Figure 9d
632also shows that at low to intermediate concentrations of salt
633(B0.2 M NaNO3 or Na2SO4), Na2SO4 as compared to
634NaNO3 is more effective in accelerating Fe2? release from
635FeNoTf. Inset of Fig. 9d represents the log kobs vs I1/2/
636(1 ? I1/2) plot for FeNoTf at pH 5.6. The log kobs increases
637linearly with I1/2/(1 ? I1/2), indicating that at low to
638intermediate concentrations of salt, the Debye-Huckel
639screening of diffusive counterions promotes the reductive
640release of iron from FeNoTf at pH 5.6.
Time (sec)
Ab
so
rba
nc
e (
46
5 n
m)
0.005
0.010
0.015
0.020
[Salts] or [Sucrose] (M)
ko
bs
(sec
-1)
0.002
0.004
0.006
(a) (c)
Time (sec)
Ab
so
rba
nc
e (
46
5 n
m)
0.00
0.02
0.04
0.06
[Salts] or [Sucrose] (M)
ko
bs
(sec
-1)
0.5
1.0
1.5
(b) (d)
I1/2/(1+I
1/2)
0.00.20.40.6
log
ko
bs (
sec
-1)
-0.2
0.0
0.2
0.4
0 400 800 1200 1600 0.0 0.4 0.8 1.2 1.6
0 10 20 30 40 50 0.0 0.4 0.8 1.2 1.6
Fig. 7 Kinetics of urea-induced iron release from FeNoTf at*37 �C
as monitored by the change in absorbance at 465 nm. Panels a and
b present single-phase iron release kinetic traces of FeNoTf in the
absence of salt at pH 7.4 and 5.6, respectively. The solid lines in
panels a and b show least-squares fit of the data to a single
exponential function. The resulting rate constants for iron release,
kobs, are plotted as a function of salt [NaCl (unfilled square), and
Na2SO4 (filled triangle)] and sucrose (filled circle) concentration in
panels c and d, respectively. The solid lines in panel c through data
have been drawn to guide the eye only. The solid lines in panel
d represent non-linear least squares fit of the data to a single-
exponential function. The dependences of log kobs on I1/2/(1 ? I1/2) at
pH 5.6 are also shown in the inset of panel d [NaCl (unfilled square),
and Na2SO4 (filled triangle)]. The solid line in the inset of panel
d represents linear least squares fits to the data
J Biol Inorg Chem
123Journal : Large 775 Dispatch : 12-5-2014 Pages : 16
Article No. : 1145h LE h TYPESET
MS Code : JBIC-13-08-00139 h CP h DISK4 4
Au
tho
r P
ro
of

UNCORRECTEDPROOF
641 Discussion
642 How could low concentrations of salt destabilize
643 the Fe2oTf and apo-oTf?
644 Salt ions could affect the stability of natively folded pro-
645 teins in a complex way. The Hofmeister series is often used
646 to define the effectiveness of salt ions in stabilizing the
647 proteins at higher concentrations ([0.5 M) [103]. How-
648 ever, at low concentrations (\0.3 M), salt ions can exhibit
649 either stabilizing or destabilizing effect which varies with
650 different proteins. For example, SO42- stabilizes native
651 Ribonuclease A [104], but destabilizes human sTf [30].
652 There is growing evidence that the specific interactions
653 between anions and protein surface affect protein stability
654 [30, 105, 106]. The current study presents direct
655experimental evidence that at low salt concentrations
656[B0.1(±0.02) M Na2SO4 or B0.35(±0.15) M NaCl], both
657NaCl and Na2SO4 destabilize the oTf-Fe3? complex and
658also decrease the structural stability of Fe2oTf and apo-oTf
659(Figs. 4d; 5e, f; 6c, d). Since Na2SO4 is a kosmotropic salt
660which generally has a stabilizing effect on proteins [104,
661106, 107], the destabilization of the oTf-Fe3? complex and
662decreased structural stability of Fe2oTf and apo-Tf by
663Na2SO4 are highly unusual. Few other examples are also
664available which showed that at low to intermediate con-
665centrations of Na2SO4 (\0.15 M), the ionic screening of
666electrostatic interactions can destabilize human sTf [30],
667human plasma lipoproteins [5, 6], human prion protein
668[36], and archaebacterial carboxypeptidase [35]. At higher
669salt concentrations [C0.1(±0.02) M Na2SO4 or
6700.35(±0.15) M NaCl], the destabilizing effect was pro-
671gressively reversed and salt ions acted as according to their
672ranking in the Hofmeister series (Figs. 4d, 5e, 6c).
673The decrease in the structural stability of apo-oTf
674[Figs. 5f, 6d; Table S3 (Supporting Information)] at low
675salt concentrations [B0.1(±0.02) M Na2SO4 or
6760.25(±0.05) M NaCl], suggests that the destabilization of
677Fe2oTf complex by salt is attributed to the salt-induced
678destabilization of oTf-Fe3? complex and weakening of
679Coulombic interactions at the protein surface. The current
680study provides several experimental supports that the salt-
681induced destabilization of Fe2oTf complex and apo-oTf are
682due to the ionic screening of electrostatic interactions.
683First, the salt concentration range (0.01–0.35 M) that
684destabilizes the Fe2oTf complex and apo-oTf (Figs. 4d; 5e,
685f; 6c, d), the effects of salt on macromolecular stability are
686governed by ionic screening. On the other hand, the spe-
687cific ion binding effects of salt often occurs at less than one
688millimolar concentrations [108] while the hydrophobic
689effect dominates at molar concentrations ([0.5 M) [4, 5, 9,
69029, 107]. The single exponential character of salt effect on
691the stability of oTf-Fe3? complex (Fig. 1d) is typical of the
692electrostatic screening by diffusive counterions (e.g., co-
693solute screening) [5, 29, 30]. Finally, the opposite effects of
694salt (destabilizing) and sucrose (stabilizing) on the stability
695of Fe2oTf and apo-oTf confirm that the hydrophobic effect
696is not the factor for the salt-induced destabilization of these
697proteins [Figs. 4d; 5e, f; 6d; Table S2, Table S3 (Sup-
698porting Information)].
699pH and anion-binding-induced conformational changes
700play a vital role in promoting iron release from Fe2oTf
701complex
702During the past few decades, several investigators have
703spurred great interest in understanding the role of pH and
704anion-binding-induced conformational changes that prompt
705iron release from the monoferric- and diferric-Tfs [11–25,
ln k
ob
s(s
ec
-1)
-6
-5
-4
[1000/T] (K-1)
3.15 3.20 3.25 3.30 3.35 3.40
ln k
ob
s(s
ec
-1)
-1.0
-0.5
0.0
0.5
(a)
(b)
Fig. 8 Arrhenius plots derived from the temperature dependence of
rate constant of urea-induced iron release from FeNoTf at pH 7.4 and
5.6 are shown in panels a and b, respectively [(unfilled circle), no
addition; (unfilled square), 0.25 M NaCl; and (filled triangle), 0.1 M
Na2SO4]. The activation enthalpy derived from linear least-squires
fitting to Arrhenius plots for kobs is summarized in Table 1
Table 1 Salt dependence of the activation enthalpy DH� (Ea = DH�)
of Fe3? release from FeNoTf.*
pH *7.4 pH *5.6
DH� DH�
Control 18.0 12.0
0.25 M NaCl 14.5 9.3
0.1 M Na2SO4 15.5 8.3
* The uncertainty of DH� values reported here is ±0.5 kcal mol-1
J Biol Inorg Chem
123Journal : Large 775 Dispatch : 12-5-2014 Pages : 16
Article No. : 1145h LE h TYPESET
MS Code : JBIC-13-08-00139 h CP h DISK4 4
Au
tho
r P
ro
of
UNCORRECTEDPROOF
706 30, 72, 74, 77, 80, 83]. Dewan et al. [15] suggested that the
707 charge repulsion and a conformational change resulting
708 from the protonation of the dilysine pair (Lys209-Lys301
709 located on the opposite domains of N-lobe) appear to be the
710 main driving force to trigger cleft opening of N-lobe at low
711 pH. A recent hydrogen/deuterium exchange study of
712 N-terminal lobe of human sTf in combination with mass
713 spectrometry suggested that at slightly acidic pH condi-
714 tions, holoprotein exists in open conformation [13]. Few
715 earlier site-directed mutagenesis studies of human sTf with
716 iron bound only to the N-lobe indicate that charge repul-
717 sion and a conformational change resulting from the pro-
718 tonation of the so-called dilysine pair (Lys206-Lys296) are
719 the main driving forces for anion-induced iron release
720 acceleration upon decrease in pH [17, 72, 83].
721 Kretchmar et al. [77] reported that the anion requirement
722 is a prerequisite for iron release from monoferric-Tf. The
723 anions requirement is also necessary for iron release from
724Fe3?-Tf-receptor complex [81], signifying the implications
725of some anions for the cellular iron release. Few earlier
726kinetic and spectroscopic studies revealed that the anion-
727binding-induced conformational change involves in salt-
728induced release of iron from the monoferric- and differic-
729Tfs [30, 68, 72, 80]. Recent anion-dependent fluorescence
730studies of diferric human sTf at low pH also provided
731direct evidence that the anion binding to the protein
732induces a structural or conformational change around one
733or more Trp residues near the iron binding site [30]. In an
734earlier study, Baldwin et al. [80] have argued that both
735conformational change and electrostatic interactions
736induced by ion binding to the protein prompt iron release
737from monoferric-Tfs. The current study showed that in the
738presence of salt, there is a considerable change in the slope
739of the Arrhenius plot (Fig. 8a, b), insofar this is due to
740anion-induced conformational change in the protein. Fur-
741thermore, the single exponential saturation effect of salt on
Time (sec)
0 100 200 300 400 500
Ab
so
rba
nc
e (
53
8 n
m)
0.00
0.02
0.04
[Salts] (M)
0.00 0.25 0.50 0.75 1.00
ko
bs (
sec
-1)
0.002
0.008
0.014
(a) (c)
Time (sec)
0 50 100
Ab
so
rba
nc
e (
53
8 n
m)
0.00
0.02
0.04
[Salts] (M)
0.0 0.2 0.4 0.6
ko
bs (
sec
-1)
0.05
0.10
0.15
0.20(b) (d)
I1/2/(1+I
1/2)
0.0 0.2 0.4 0.6
log
ko
bs (
se
c-1)
-1.0
-0.8
-0.6
Fig. 9 Kinetics of reductive release of iron from the FeNoTf complex
by sodium dithionite using BPS as monitored by the change in
absorbance at 538 nm. Panels a and b present single-phase reductive
iron release kinetic traces of FeNoTf in the absence of salt at pH 7.4
and 5.6, respectively. The solid lines in panels a and b show least-
squares fit of the data to a single exponential function. The resulting
rate constants for reductive iron release, kobs, are plotted as a function
of salt [NaNO3 (unfilled square), and Na2SO4 (filled triangle)]
concentration in panels c and d, respectively. The solid lines in panel
c through data have been drawn to guide the eye only. The solid lines
in panel d represent non-linear least squares fit of the data to a single-
exponential function. The dependences of log kobs on I1/2/(1 ? I1/2) at
pH 5.6 is also shown in the inset of panel d [NaNO3 (unfilled square)
and Na2SO4 (filled square)]. The solid line in the inset of panel
d represents linear least squares fits to the data
J Biol Inorg Chem
123Journal : Large 775 Dispatch : 12-5-2014 Pages : 16
Article No. : 1145h LE h TYPESET
MS Code : JBIC-13-08-00139 h CP h DISK4 4
Au
tho
r P
ro
of
UNCORRECTEDPROOF
742 the iron release rate constant at pH 5.6 (Figs. 7d, 9d)
743 confirms that anion-binding-induced conformational
744 change promotes Fe2? and Fe3? release from FeNoTf.
745 Electrostatic screening effect of electrolytes controls
746 the kinetics of iron release from FeNoTf
747 While the kinetics of iron release from the monoferric- and
748 diferric-Tfs have been studied as a function of salt con-
749 centration [17, 18, 30, 72, 74–88], few have been studied in
750 sufficient details to provide the mechanism by which the
751 salt ions influence the kinetics of iron release [30, 35].
752 Especially, the role played by electrostatic interactions in
753 controlling the kinetics of Fe2? and Fe3? release are not
754 clearly known. The current study gives several experi-
755 mental evidences which suggest that salt ions prompt Fe2?
756 and Fe3? release from FeNoTf complex through the ionic
757 screening effects (Figs. 7c, d; 9c, d). If salt-induced Fe2?
758 and Fe3? release from FeNoTf are due to the interference
759 with hydrophobic interactions, then kosmotropic salt (i.e.,
760 increase the macromolecular stability by strengthening the
761 hydrophobic interactions [31, 32, 34]) such as Na2SO4
762 should slow down the Fe2? and Fe3? release from FeNoTf
763 via strengthening the intramolecular hydrophobic interac-
764 tions. But, within the pH range of 7.4–5.6, the current
765 results reveal that at low salt concentrations
766 [B0.12(±0.05) M NaCl/NaNO3 or Na2SO4 (pH 7.4);
767 B0.4(±0.1) M NaNO3/NaCl or 0.2(±0.05) M Na2SO4 (pH
768 5.6)], all the salts examined (NaCl, NaNO3, and Na2SO4)
769 here promote Fe2? and Fe3? release from FeNoTf. The
770 current results also reveal that at higher salt concentrations
771 [C0.12(±0.05) M NaCl/NaNO3 or Na2SO4], the salt ions
772 retard the Fe2? and Fe3? release from FeNoTf at pH 7.4
773 (Figs. 7c, 9c), while they accelerate the Fe2? and Fe3?
774 release at pH 5.6 (Figs. 7d, 9d). At low to intermediate
775 concentrations (0.01–0.35 M), the effects of salt on protein
776 stability are generally attributed to ionic screening effect
777 [9, 29, 30]. On the other hand, the specific ion binding
778 effect of salt is generally apparent at millimolar concen-
779 trations [108] while hydrophobic effect occurs at molar
780 concentrations ([0.5 M) [4, 5, 9, 29, 30, 107]. In dilute to
781 moderately concentrated ionic solution, an extended
782 Debye-Huckel model can easily interpret the effect of ionic
783 strength on the rate of iron release from human serum
784 diferric transferrin [30]. At pH 5.6, the log kobs for Fe2?
785 and Fe3? release increases linearly with I1/2/(1 ? I
1/2)
786 (Insets of Figs. 7d and 9d), indicating that the Debye-
787 Huckel screening of diffusive counterions accelerates the
788 iron release from FeNoTf under endosomal pH conditions.
789 Finally, the opposite effects of salts and sucrose (i.e., salt
790 prompts iron release while sucrose inhibits it) confirm that
791 the acceleration of the iron release by salt is not due to the
792 hydrophobic effect.
793Both anion binding to KISAB sites and electrostatic
794screening effect of electrolytes control the kinetics
795of iron release from FeNoTf
796To emphasize the allosteric effect on iron release, Egan
797et al. [76, 77, 82, 86] proposed naming the sites to which
798nonsynergistic anions bind as ‘‘kinetically significant
799anion binding’’ or KISAB sites. It is widely accepted that
800the anions binding to KISAB sites influence the rate of
801iron release from Tfs [109, and references therein].
802However, the KISAB sites have not been well character-
803ized [109]. Few earlier studies have shown that multiple
804KISAB sites exist for each lobe of Tf [15, 17, 22, 72, 74,
80583, 109]. A recent report shows that Arg143 serves as an
806authentic KISAB site in the N-lobe of human sTf [74].
807While both electrostatic effect (Debye-Huckel screening
808of diffusive counterions) and anions binding to the KISAB
809sites influence the rates of iron release from FeNoTf, the
810extent of these two effects on rates of iron release will
811depend on the pH of reaction medium and the concen-
812tration of anions. The N-lobe is the first lobe to release
813iron [62], so it is to be noted that the concentration of
814anion has the greatest effect on iron release from the
815N-lobe [74]. At low salt concentrations and at pH 7.4,
816Debye-Huckel screening of diffusive counterions facili-
817tates the iron release from FeNoTf but under these con-
818ditions of pH and salt, anions binding to KISAB sites may
819have little effect on iron release because at neutral pH
820only weak interactions exist between the anions and KI-
821SAB sites [72]. At mildly acidic pH (pH *5.6), the
822anions’ binding strength to KISAB sites increases [72],
823which results in acceleration of iron release from N-lobe
824of Tfs [72]. The previous section has presented several
825lines of evidence which suggests that at pH 5.6, Debye-
826Huckel screening of diffusive counterions facilitates iron
827release from FeNoTf. So, at pH *5.6, it is likely that both
828anions binding to the KISAB sites and ionic screening of
829electrostatic interactions together facilitate the iron release
830from FeNoTf.
831Conclusions
832To assess the effects of salts and sucrose on the stabiliza-
833tion of oTf-Fe3? complex and structural stability of Fe2oTf,
834we have studied the Fe2oTf as a function of pH and urea in
835the presence salt (NaCl, Na2SO4, NaBr, and NaNO3) and
836sucrose. Interestingly, the low concentrations of salt
837destabilize the oTf-Fe3? complex and also decrease the
838structural stability of Fe2oTf. In contrast, the higher con-
839centrations of salt stabilize the oTf-Fe3? complex and also
840increase the structural stability of Fe2oTf. The current
841study reveals that the destabilization of Fe2oTf by salt
J Biol Inorg Chem
123Journal : Large 775 Dispatch : 12-5-2014 Pages : 16
Article No. : 1145h LE h TYPESET
MS Code : JBIC-13-08-00139 h CP h DISK4 4
Au
tho
r P
ro
of
UNCORRECTEDPROOF
842 results from both destabilization of oTf-Fe3? complex and
843 ionic screening of electrostatic interactions. At pH 7.4, the
844 low concentrations of salt (NaCl, NaNO3, and Na2SO4)
845 promote the Fe2? and Fe3? release from FeNoTf. At higher
846 concentrations, these salts inhibit the Fe2? and Fe3? release
847 and salt ions behave according to Hofmeister series. At pH
848 5.6, these salts also accelerate the Fe2? and Fe3? release
849 from FeNoTf. However, at pH 5.6, the salt-induced accel-
850 eration of Fe2? and Fe3? release is particularly pronounced
851 at low salt concentrations but is saturated at
852 *0.2(±0.05) M Na2SO4 or *0.4(±0.1) M NaNO3/NaCl,
853 which suggests that the Coulombic interactions play crucial
854 role in the accelerating the iron release from FeNoTf under
855 endosomal pH conditions. The current results also suggest
856 that there is a general effect from Debeye-Huckel screening
857 that operates in addition to the anion binding to KISAB or
858 any unrecognized sites in regulating the kinetics of iron
859 release from FeNoTf at pH *5.6.
860 Acknowledgments This work was supported by DST-SERC Fast861 Track Research Grant (to R.K., project No. SR/FT/CS-070/2009), a862 Ramalingaswami Re-entry Fellowship by DBT, India (to D.S., BT/863 RLF/RE-ENTRY-33-2010), and UGC major grant (to R.K., F. No.864 41-258/2012 (SR), Government of India.
865
866 References
867 1. Jaenicke R, Bohm G (1998) Curr Opin Struct Biol 8:738–748868 2. Pace CN (1995) Methods Enzymol 259:538–554869 3. Karshikoff A, Ladenstein R (2007) In: Uversky VN, Permyakov870 E (eds) Nova Biomedical Books, New York871 4. Perl D, Holtermann G, Schmid FX (2001) Biochemistry872 40:15501–15511873 5. Jayaraman S, Gantz DL, Gursky O (2006) Biochemistry874 45:4620–4628875 6. Benjwal S, Jayaraman S, Gursky O (2005) Biochemistry876 44:10218–10226877 7. Dominy BN, Perl D, Schmid FX, Brooks CL 3rd (2002) J Mol878 Biol 319:541–554879 8. Vogt G, Woell S, Argos P (1997) J Mol Biol 269:631–643880 9. Elcock AH, McCammon JA (1998) J Mol Biol 280:731–748881 10. Kohn WD, Kay CM, Hodges RS (1997) J Mol Biol882 267:1039–1052883 11. Lee DA, Goodfellow JM (1998) Biophys J 85:2747–2759884 12. Rinaldo D, Field MJ (2003) Biophys J 85:3485–3501885 13. Bobst CE, Zhang M, Kaltashov IA (2009) J Mol Biol886 388:954–967887 14. Aisen P, Listowsky I (1980) Annu Rev Biochem 49:357–393888 15. Dewan JC, Mikami B, Hirose M, Sacchettini JC (1993) Bio-889 chemistry 32:11963–11968890 16. MacGillivray RT, Moore SA, Chen J, Anderson BF, Baker H,891 Luo Y, Bewley M, Smith CA, Murphy ME, Wang Y, Mason892 AB, Woodworth RC, Brayer GD, Baker EN (1998) Biochem-893 istry 37:7919–7928894 17. He QY, Mason AB, Tam BM, MacGillivray RT, Woodworth895 RC (1999) Biochemistry 38:9704–9711896 18. Byrne SL, Chasteen ND, Steere AN, Mason AB (2010) J Mol897 Biol 396:130–140
89819. Steere AN, Byrne SL, Chasteen ND, Smith VC, MacGillivray899RT, Mason AB (2010) J Biol Inorg Chem 15:1341–135290020. James NG, Byrne SL, Steere AN, Smith VC, MacGillivray RT,901Mason AB (2009) Biochemistry 48:2858–286790221. James NG, Berger CL, Byrne SL, Smith VC, MacGillivray RT,903Mason AB (2007) Biochemistry 46:10603–1061190422. Halbrooks PJ, Giannetti AM, Klein JS, Bjorkman PJ, Larouche905JR, Smith VC, MacGillivray RT, Everse SJ, Mason AB (2005)906Biochemistry 44:15451–1546090723. Nurizzo D, Baker HM, He QY, MacGillivray RT, Mason AB,908Woodworth RC, Baker EN (2001) Biochemistry 40:1616–162390924. He QY, Mason AB, Tam BM, MacGillivray RT, Woodworth910RC (1999) Biochem J 344:881–88791125. Byrne SL, Mason AB (2009) J Biol Inorg Chem 14:771–78191226. Spencer DS, Xu K, Logan TM, Zhou HX (2005) J Mol Biol913351:219–23291427. Hofmeister F (1888) Arch Exp Pathol Pharmakol 24:247–26091528. Baldwin RL (1996) Biophys J 71:2056–206391629. Perez-Jimenez R, Godoy-Ruiz R, Ibarra-Molero B, Sanchez-917Ruiz JM (2004) Biophys J 86:2414–242991830. Kumar R, Mauk AG (2009) J Phys Chem B 113:12400–1240991931. Cacace MG, Landau EM, Ramsden JJ (1997) Q Rev Biophys92030:241–27792132. Von Hippel PH, Wong KY (1964) Science 145:577–58092233. Pegram LM, Record MT Jr (2008) J Phys Chem B923112:9428–943692434. Record MT Jr, Anderson CF, Lohman TM (1978) Q Rev Bio-925phys 11:103–17892635. Villa A, Zecca L, Fusi P, Colombo S, Tedeschi G, Tortora P927(1993) Biochem J 295:827–83192836. Apetri AC, Surewicz WK (2003) J Biol Chem 278:22187–2219292937. Aasa R, Malmstrom BG, Saltman P, Vanngard T (1963) Bio-930chim Biophys Acta 75:203–22293138. Sun H, Li H, Sadler PJ (1999) Chem Rev 99:2817–284293239. MacGillivray RTA, Mason AB (2002) In: Transferrin Temple-933ton DM (ed). Marcel Dekker, Inc., New York93440. He QY, Mason AB (2002) In: Templeton DM (ed). Marcel935Dekker, Inc., New York93641. Guo M, Sun H, McArdle HJ, Gambling L, Sadler PJ (2000)937Biochemistry 39:10023–1003393842. Tinoco AD, Valentine AM (2005) J Am Chem Soc939127:11218–1121994043. Tinoco AD, Incarvito CD, Valentine AM (2007) J Am Chem941Soc 129:3444–345494244. Hemadi M, Ha-Duong NT, Plantevin S, Vidaud C, El Hage943Chahine JM (2010) J Biol Inorg Chem 15:497–50494445. Chikh Z, Ha-Duong NT, Miquel G, El Hage Chahine JM (2007)945J Biol Inorg Chem 12:90–10094646. Zhong W, Parkinson JA, Guo M, Sadler PJ (2002) J Biol Inorg947Chem 7:589–59994847. Dautry-Varsat A, Ciechanover A, Lodish HF (1983) Proc Natl949Acad Sci USA 80:2258–226295048. Baker EN (1994) Adv Inorg Chem 41:389–46395149. Mason AB, Woodworth RC (1984) J Biol Chem 259:1866–187395250. Mason AB, Brown SA, Church WR (1987) J Biol Chem953262:9011–901595451. Mason AB, Woodworth RC, Oliver RW, Green BN, Lin LN,955Brandts JF, Savage KJ, Tam BM, MacGillivray RT (1996)956Biochem J 319:361–36895752. Thibodeau SN, Lee DC, Palmiter RD (1978) J Biol Chem958253:3771–377495953. Anderson BF, Baker HM, Norris GE, Rice DW, Baker EN960(1989) J Mol Biol 209:711–73496154. Baker EN, Lindley PF (1992) J Inorg Biochem 47:147–16096255. Haridas M, Anderson BF, Baker EN (1995) Acta Crystallogr D963Biol Crystallogr 51:629–646
AQ4
J Biol Inorg Chem
123Journal : Large 775 Dispatch : 12-5-2014 Pages : 16
Article No. : 1145h LE h TYPESET
MS Code : JBIC-13-08-00139 h CP h DISK4 4
Au
tho
r P
ro
of

UNCORRECTEDPROOF
964 56. Anderson BF, Baker HM, Norris GE, Rumball SV, Baker EN965 (1990) Nature 344:784–787966 57. Kurokawa H, Mikami B, Hirose M (1995) J Mol Biol967 254:196–207968 58. Kurokawa H, Dewan JC, Mikami B, Sacchettini J, Hirose M969 (1999) J Biol Chem 274:28445–28452970 59. Jeffrey PD, Bewley MC, MacGillivray RT, Mason AB, Wood-971 worth RC, Baker EN (1998) Biochemistry 37:13978–13996972 60. Sharma AK, Rajashankar KR, Yadav MP, Singh TP (1999) Acta973 Crystallogr Sect D55:1152–1157974 61. Thorstensen K, Romslo I (1990) Biochem J 271:1–9975 62. Hemadi M, Ha-Duong NT, El HageChahine JM (2006) J Mol976 Biol 358:1125–1136977 63. Schlabach MR, Bates GW (1975) J Biol Chem 25:2182–2188978 64. Campbell RF, Chasteen ND (1977) J Biol Chem 252:5996–6001979 65. Zweier JL, Wooten JB, Cohen JS (1981) Biochemistry980 20:3505–3510981 66. Aisen P, Leibma A, Pinkowitz RA, Pollack S (1973) Bio-982 chemistry 12:3679–3684983 67. Aisen P, Brown EB (1975) Prog Hematol 9:25–56984 68. Folajtar DA, Chasteen ND (1982) J Am Chem Soc985 104:5775–5780986 69. Bell JD, Brown JD, Kubal G, Sadler PJ (1988) Bio Chem Soc987 Trans 16:714–715988 70. Grady JK, Mason AB, Woodworth RC, Chasteen ND (1995)989 Biochem J 309:403–410990 71. Harris WR, Cafferty AM, Abdollahi S, Trankler K (1998)991 Biochim Biophys Acta 1383:197–210992 72. He QY, Mason AB, Nguyen V, MacGillivray RT, Woodworth993 RC (2000) Biochem J 350:909–915994 73. Wishnia A, Weber I, Warner RC (1961) J Am Chem Soc995 83:2071–2080996 74. Byrne SL, Steere AN, Chasteen ND, Mason AB (2010) Bio-997 chemistry 49:4200–4207998 75. Egan TJ, Ross DC, Purves LR, Adams PA (1992) Inorg Chem999 31:1994–1998
1000 76. Marques HM, Watson DL, Egan TJ (1991) Inorg Chem1001 30:3758–37621002 77. Kretchmar SA, Raymond KN (1988) Inorg Chem 27:1436–14411003 78. Williams J, Chasteen ND, Moreton K (1982) Biochem J1004 201:527–5321005 79. Harris WR, Bali PK (1988) Inorg Chem 27:2687–26911006 80. Baldwin DA, Egan TJ, Marques HM (1990) Biochim Biophys1007 Acta 1038:1–9
100881. Egan TJ, Zak O, Aisen P (1993) Biochemistry 32:8162–8167100982. Marques HM, Walton T, Egan TJ (1995) J Inorg Biochem101057:11–21101183. Zak O, Tam B, MacGillivray RT, Aisen P (1997) Biochemistry101236:11036–11043101384. Li Y, Harris WR (1998) Biochim Biophys Acta 1387:89–102101485. Marques HM, Egan TJ, Pattrick G (1990) S Afr J Sci 86:21–24101586. Muralidhara BK, Hirose M (2000) J Biol Chem1016275:12463–12469101787. Mizutani K, Muralidhara BK, Yamashita H, Tabata S, Mikami1018B, Hirose M (2001) J Biol Chem 276:35940–35946101988. Hamilton DH, Turcot I, Stintzi A, Raymond KN (2004) J Biol1020Inorg Chem 9:936–944102189. Mazurier J, Spik G (1980) Biochim Biophys Acta 629:399–408102290. Harris WR (1986) J Inorg Biochem 27:41–52102391. Kojima N, Bates GW (1979) J Biol Chem 254:8847–8854102492. Nakazato K, Yamamura T, Satake K (1988) J Biochem1025103:823–828102693. Bali PK, Harris WR (1990) Arch Biochem Biophys1027281:251–256102894. Turcot I, Stintzi A, Xu J, Raymond KN (2000) J Biol Inorg1029Chem 5:634–641103095. Hissen AHT, Moore MM (2005) J Biol Inorg Chem 10:211–220103196. Baldwin DA, de Sousa DM (1981) Biochem Biophys Res1032Commun 99:1101–1107103397. Lehrer SS (1969) J Biol Chem 244:3613–3617103498. Bali PK, Harris WR (1989) J Am Chem Soc 111:4457–4461103599. Halbrooks PJ, Mason AB, Adams TE, Briggs SK, Everse SJ1036(2004) J Mol Biol 339:217–2261037100. Zhang M, Gumerov DR, Kaltashov IA, Mason AB (2004) J Am1038Soc Mass Spectrom 15:1658–16641039101. Santoro MM, Bolen DW (1988) Biochemistry 27:8063–80681040102. Tanford C (1968) Adv Protein Chem 23:121–2821041103. Curtis RA, Lue L (2006) Chem Eng Sci 61:907–9231042104. Ramos CHI, Baldwin RL (2002) Protein Sci 11:1771–17781043105. Zhang Y, Cremer PS (2006) Curr Opin Chem Biol 10:658–6631044106. Timasheff SN (1993) Annu Rev Biophys Biomol Struct104522:67–971046107. Nishimura C, Uversky VN, Fink AL (2001) Biochemistry104740:2113–21281048108. van Asselt EJ, Dijkstra BW (1999) FEBS Lett 458:429–4351049109. Harris WR (2012) Biochim Biophys Acta 1820:348–361
J Biol Inorg Chem
123Journal : Large 775 Dispatch : 12-5-2014 Pages : 16
Article No. : 1145h LE h TYPESET
MS Code : JBIC-13-08-00139 h CP h DISK4 4
Au
tho
r P
ro
of
Journal : 775
Article : 1145 123the language of science
Author Query Form
Please ensure you fill out your response to the queries raised below and return this form along
with your corrections
Dear Author
During the process of typesetting your article, the following queries have arisen. Please check your typeset proof carefully
against the queries listed below and mark the necessary changes either directly on the proof/online grid or in the ‘Author’s
response’ area provided below
Query Details Required Author’s Response
AQ1 Please check and confirm the edit in the following sentence: The contribution of electrostatic interactionsto the stability of ovotransferrin-Fe3? (oTf-Fe3?) complex has been assessed by equilibriumexperiments that measure iron retention level of diferric-ovotransferrin (Fe2oTf) as a function of pHand urea in the presence of salts (NaCl, Na2SO4, NaBr, NaNO3) and sucrose at 25 �C
AQ2 Please confirm if both terms "urea-induced denaturation", and "urea denaturation-induced’ signifydifferent processes
AQ3 Please check and confirm the edit in the following sentence: This finding further confirms that the Fe2oTfresponds to increased urea concentration by means of a coupled process in which the urea-induced ironrelease reaction occurs prior to the unfolding reaction
AQ4 Please check and confirm the edit in the following sentence: However, at pH 5.6, the salt-inducedacceleration of Fe2? and Fe3? release is particularly pronounced at low salt concentrations but issaturated at *0.2(±0.05) M Na2SO4 or *0.4(±0.1) M NaNO3/NaCl, which suggests that theCoulombic interactions play crucial role in the accelerating the iron release from FeNoTf underendosomal pH conditions
Au
tho
r P
ro
of
Related Documents