Electrospun Micro- and Nanostructured Polymer Particles Jing Liu, Asif Rasheed, Hongming Dong, Wallace W. Carr, Mark D. Dadmun, Satish Kumar * Introduction Electrospinning is used for making nanometer- to micro- meter-diameter polymeric fibers [1–7] for a variety of applications. [8–11] Electrospinning at relatively low poly- mer concentrations results in particles rather than fibers. This particle-formation process can be termed as electro- spray. [12,13] For example, poly(methyl methacrylate) (PMMA)/ethyl acetate solution [14] forms particles of decreasing size with increasing voltage. Poly(vinylidene fluoride) (PVDF) [15] particles have been processed by electrospraying its N,N-dimethylformamide (DMF) solu- tion. It was concluded that the droplet size is controlled by the conductivity and flow rate of the solution. Silica nanocups have been produced by electrospinning poly (vinylpyrrolidone) (PVP) sol/gel solutions (50:50% mixture of ethanol and water) [12] followed by calcination. In our previous study, we reported PMMA particles with a cup- like [16] morphology. In this paper an attempt has been made to better understand various electrospun particle morphologies. PMMA was electrospun from seven differ- ent solvents and a series of poly[styrene-co-(4-vinylphe- nol)] (PSVPh) copolymers with varying vinyl phenol component were electrospun from 2-butanone (methyl ethyl ketone, MEK). Based on these studies, a qualitative relationship is discussed between the solvent properties and the electrospun particle morphologies. Full Paper J. Liu, A. Rasheed, H. Dong, W. W. Carr, S. Kumar School of Polymer, Textile & Fiber Engineering, Georgia Institute of Technology, Atlanta, GA 30332-0295, USA E-mail: [email protected] M. D. Dadmun Department of Chemistry, University of Tennessee, Knoxville, USA Electrospinning at relatively low polymer concentrations produces polymer particles rather than fibers. To study the relationship between solvent characteristics and particle morphologies, PMMA was electrospun from seven different solvents and PSVPh random copolymers were electrospun from solutions in MEK. High-speed photography was used to visual- ize the particle-formation process. Based on these studies, a qualitative relationship between the solvent properties and the electrospun particle morphologies is discussed. By tailoring the solution properties and electrospinning con- ditions, particles with different morphologies (porous polygonal particles, solid polygonal particles, hollow spheres, cups etc) can be pro- duced. 2390 Macromol. Chem. Phys. 2008, 209, 2390–2398 ß 2008 WILEY-VCH Verlag GmbH & Co. KGaA, Weinheim DOI: 10.1002/macp.200800396

Welcome message from author
This document is posted to help you gain knowledge. Please leave a comment to let me know what you think about it! Share it to your friends and learn new things together.
Transcript
Full Paper
2390
Electrospun Micro- and NanostructuredPolymer Particles
Jing Liu, Asif Rasheed, Hongming Dong, Wallace W. Carr, Mark D. Dadmun,Satish Kumar*
Electrospinning at relatively low polymer concentrations produces polymer particles ratherthan fibers. To study the relationship between solvent characteristics and particlemorphologies, PMMA was electrospun from seven different solvents and PSVPh randomcopolymers were electrospun from solutions inMEK. High-speed photographywas used to visual-ize the particle-formation process. Based on thesestudies, a qualitative relationship between thesolvent properties and the electrospun particlemorphologies is discussed. By tailoring thesolution properties and electrospinning con-ditions, particles with different morphologies(porous polygonal particles, solid polygonalparticles, hollow spheres, cups etc) can be pro-duced.
Introduction
Electrospinning is used for making nanometer- to micro-
meter-diameter polymeric fibers[1–7] for a variety of
applications.[8–11] Electrospinning at relatively low poly-
mer concentrations results in particles rather than fibers.
This particle-formation process can be termed as electro-
spray.[12,13] For example, poly(methyl methacrylate)
J. Liu, A. Rasheed, H. Dong, W. W. Carr, S. KumarSchool of Polymer, Textile & Fiber Engineering, Georgia Instituteof Technology,Atlanta, GA 30332-0295, USAE-mail: [email protected]. D. DadmunDepartment of Chemistry, University of Tennessee, Knoxville,USA
Macromol. Chem. Phys. 2008, 209, 2390–2398
� 2008 WILEY-VCH Verlag GmbH & Co. KGaA, Weinheim
(PMMA)/ethyl acetate solution[14] forms particles of
decreasing size with increasing voltage. Poly(vinylidene
fluoride) (PVDF)[15] particles have been processed by
electrospraying its N,N-dimethylformamide (DMF) solu-
tion. It was concluded that the droplet size is controlled by
the conductivity and flow rate of the solution. Silica
nanocups have been produced by electrospinning poly
(vinylpyrrolidone) (PVP) sol/gel solutions (50:50% mixture
of ethanol and water)[12] followed by calcination. In our
previous study, we reported PMMA particles with a cup-
like[16] morphology. In this paper an attempt has been
made to better understand various electrospun particle
morphologies. PMMA was electrospun from seven differ-
ent solvents and a series of poly[styrene-co-(4-vinylphe-
nol)] (PSVPh) copolymers with varying vinyl phenol
component were electrospun from 2-butanone (methyl
ethyl ketone, MEK). Based on these studies, a qualitative
relationship is discussed between the solvent properties
and the electrospun particle morphologies.
DOI: 10.1002/macp.200800396
Electrospun Micro- and Nanostructured Polymer Particles
Table 1. Vinyl phenol content measured by NMR spectroscopy,andMn, and polydispersity index of PSVPh copolymers, measuredby gel permeation chromatography (GPC).[17]
Copolymer
sample
Vinylphenol
contentMn Polydispersity
index
mol-% g �molS1
PSVPh0 0.0 94 000 1.6
PSVPh10 13.2 118 000 1.8
PSVPh20 19.0 108 000 1.9
PSVPh30 32.5 105 000 2.4
PSVPh40 42.0 116 900 2.2
Table 2. Solvents and PMMA solution concentrations used.
Experimental Part
PMMA (Mw �95 000–150000 g �mol�1) was obtained from Cyro
Industries. PSVPh random copolymers were synthesized by free-
radical polymerization.[17] The composition,molecularweight and
polydispersity index of the PSVPh copolymers are listed in Table 1.
All of the the solvents were purchased from Sigma-Aldrich Co.
Electrospinning was carried out in the horizontal mode in a
chemical hood with a flow rate of 2 mL �h�1 via an 18-gauge
stainless-steel needle (inner diameter¼0.84mm, length¼ 51mm)
at 22 kV; the distance between the needle tip and the grounded
aluminum-foil target was 10 cm. Scanning electron microscopy
was carried out on gold-coated samples in a LEO 1530 thermally
assisted field-emission gun scanning-electron microscope at
10 kV. High-speed photographs were taken using a CCD camera
(model: Photron FASTCAM-X 1280 PSI) with a speed of 1 000
frames per second (FPS). In order to obtain a sharp image on the
micrometer-scale field of view, a pulsed Cu-vapor laser (Oxford
Lasers), which emits green/yellow (510/578 nm) flash pulses with
pulse duration of about 25 ns, was used.
Solvent Solution concentration
wt.-%
nitromethane 2, 4, 6, 8, 10, 12, 14, 16, 18, 20
acrylonitrile 8
acetone 8
DMF 8
formic acid 8
methylene chloride (MC) 1, 8
THF 1, 8
Results and Discussion
PMMA Electrospinning
The solvents and PMMA solution concentrations used for
making the electrospun samples are given in Table 2. The
properties of the solvents used in electrospinning the
PMMA are listed in Table 3. Electrospinning of PMMA
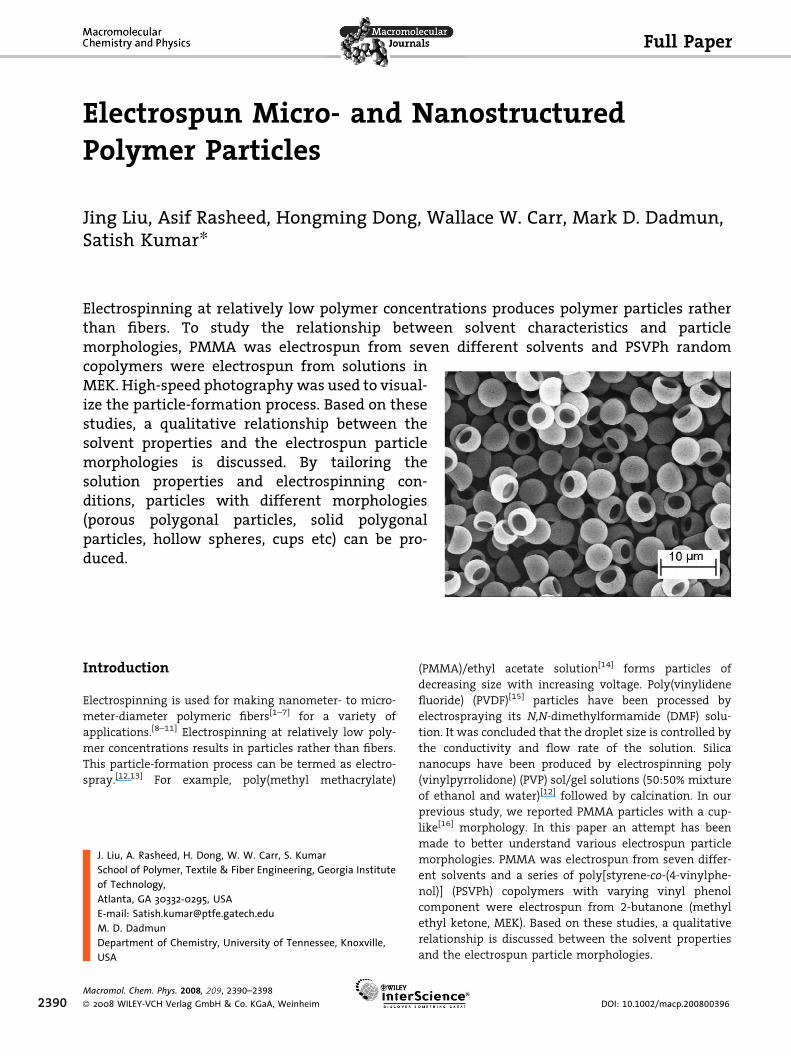
using nitromethane over a concentration range of 6 to 12
wt.-%, resulted in the formation of cups (Figure 1). The
relationship between the outer diameter of the cup and
solution concentration is plotted in Figure 2. In order to
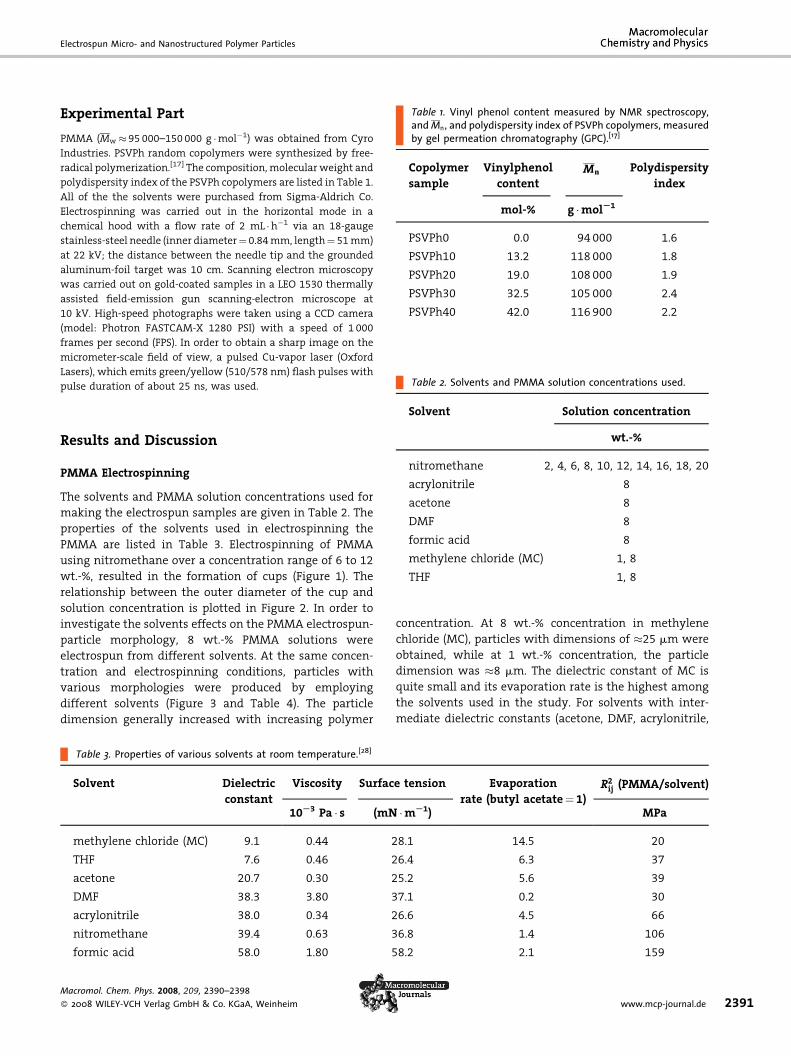
investigate the solvents effects on the PMMA electrospun-
particle morphology, 8 wt.-% PMMA solutions were
electrospun from different solvents. At the same concen-
tration and electrospinning conditions, particles with
various morphologies were produced by employing
different solvents (Figure 3 and Table 4). The particle
dimension generally increased with increasing polymer
Table 3. Properties of various solvents at room temperature.[28]
Solvent Dielectric
constant
Viscosity Surfac
10S3 Pa � s (mN
methylene chloride (MC) 9.1 0.44 2
THF 7.6 0.46 2
acetone 20.7 0.30 2
DMF 38.3 3.80 3
acrylonitrile 38.0 0.34 2
nitromethane 39.4 0.63 3
formic acid 58.0 1.80 5
Macromol. Chem. Phys. 2008, 209, 2390–2398
� 2008 WILEY-VCH Verlag GmbH & Co. KGaA, Weinheim
concentration. At 8 wt.-% concentration in methylene
chloride (MC), particles with dimensions of �25 mm were
obtained, while at 1 wt.-% concentration, the particle
dimension was �8 mm. The dielectric constant of MC is
quite small and its evaporation rate is the highest among
the solvents used in the study. For solvents with inter-
mediate dielectric constants (acetone, DMF, acrylonitrile,
e tension Evaporation
rate (butyl acetate¼ 1)R2ij (PMMA/solvent)
�mS1) MPa
8.1 14.5 20
6.4 6.3 37
5.2 5.6 39
7.1 0.2 30
6.6 4.5 66
6.8 1.4 106
8.2 2.1 159
www.mcp-journal.de 2391
J. Liu, A. Rasheed, H. Dong, W. W. Carr, M. D. Dadmun, S. Kumar
Figure 1. Cups electrospun from PMMA/nitromethane solutionsat different concentrations: (a) 6, (b) 8, (c) 10, and (d) 12 wt.-%. Thescale bar is 2 mm.
Figure 2. The diameter of electrospun cups as a function of thePMMA solution concentration in nitromethane.
Figure 3. Particles electrospun from PMMA solution (8 wt.-%) in diffemethylene chloride, (b) THF, (c) acetone, (d) DMF, (e) nitromethane, (formic acid. The scale bars of (a) and (b) are 10 mm, the others are 2
Table 4. The morphology and size of the electrospun PMMAparticles from different solvents at 8 wt.-% concentration.
Solvent Particle
morphology
Particle size
mm
methylene chloride porous polygonal �25
THF porous polygonal �40
acetone solid polygonal �3
DMF solid polygonal �2
acrylonitrile cup �5
nitromethane cup �4
formic Acid solid polygonal
with fibrous tails
�0.5–1
2392Macromol. Chem. Phys. 2008, 209, 2390–2398
� 2008 WILEY-VCH Verlag GmbH & Co. KGaA, Weinheim
or nitromethane), an 8 wt.-% polymer concentration
results in particles with dimensions of 2 to 6 mm. The
relationship between the PMMA particle size and the
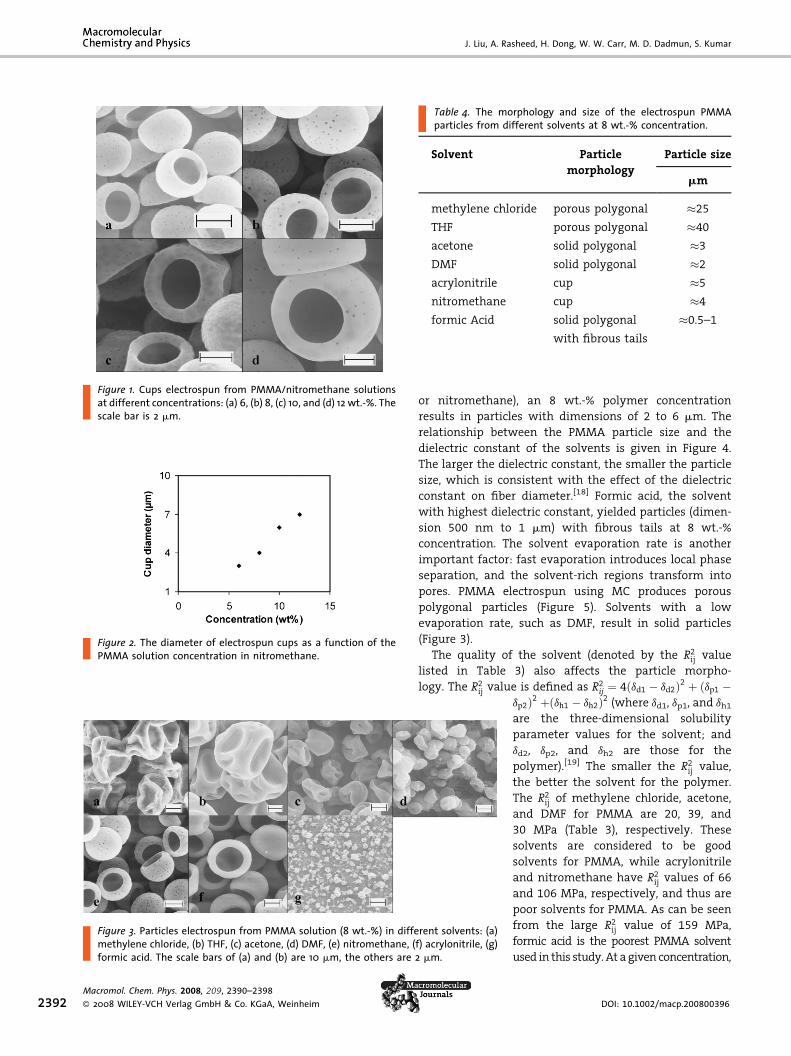
dielectric constant of the solvents is given in Figure 4.
The larger the dielectric constant, the smaller the particle
size, which is consistent with the effect of the dielectric
constant on fiber diameter.[18] Formic acid, the solvent
with highest dielectric constant, yielded particles (dimen-
sion 500 nm to 1 mm) with fibrous tails at 8 wt.-%
concentration. The solvent evaporation rate is another
important factor: fast evaporation introduces local phase
separation, and the solvent-rich regions transform into
pores. PMMA electrospun using MC produces porous
polygonal particles (Figure 5). Solvents with a low
evaporation rate, such as DMF, result in solid particles
(Figure 3).
The quality of the solvent (denoted by the R2ij value
listed in Table 3) also affects the particle morpho-
logy. The R2ij value is defined as R2
ij ¼ 4ðdd1 � dd2Þ2 þ ðdp1 �
rent solvents: (a)f) acrylonitrile, (g)mm.
dp2Þ2 þðdh1 � dh2Þ2 (where dd1, dp1, and dh1are the three-dimensional solubility
parameter values for the solvent; and
dd2, dp2, and dh2 are those for the
polymer).[19] The smaller the R2ij value,
the better the solvent for the polymer.
The R2ij of methylene chloride, acetone,
and DMF for PMMA are 20, 39, and
30 MPa (Table 3), respectively. These
solvents are considered to be good
solvents for PMMA, while acrylonitrile
and nitromethane have R2ij values of 66
and 106 MPa, respectively, and thus are
poor solvents for PMMA. As can be seen
from the large R2ij value of 159 MPa,
formic acid is the poorest PMMA solvent
used in this study.At a given concentration,
DOI: 10.1002/macp.200800396
Electrospun Micro- and Nanostructured Polymer Particles
Figure 4. PMMA particle size (electrospun from different solventsat 8 wt.-% concentration using the same electrospinning con-ditions) as a function of solvent dielectric constant.
Figure 5. Electrospun porous polygonal PMMA particles at 1 wt.-%concentration from (a) methylene chloride and (b) tetrahydro-furan.
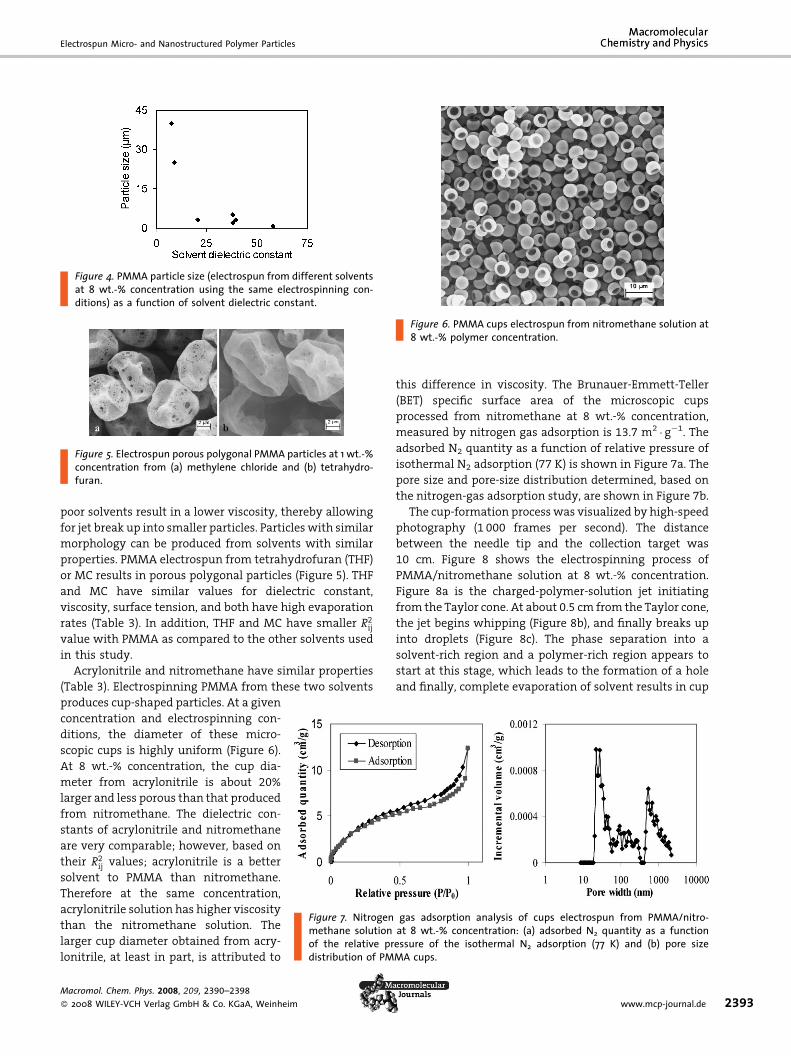
Figure 6. PMMA cups electrospun from nitromethane solution at8 wt.-% polymer concentration.
poor solvents result in a lower viscosity, thereby allowing
for jet break up into smaller particles. Particleswith similar
morphology can be produced from solvents with similar
properties. PMMA electrospun from tetrahydrofuran (THF)
or MC results in porous polygonal particles (Figure 5). THF
and MC have similar values for dielectric constant,
viscosity, surface tension, and both have high evaporation
rates (Table 3). In addition, THF and MC have smaller R2ij
value with PMMA as compared to the other solvents used
in this study.
Acrylonitrile and nitromethane have similar properties
(Table 3). Electrospinning PMMA from these two solvents
Figure 7. Nitrogen gas adsorption analysis of cups electrospun from PMMA/nitro-methane solution at 8 wt.-% concentration: (a) adsorbed N2 quantity as a functionof the relative pressure of the isothermal N2 adsorption (77 K) and (b) pore sizedistribution of PMMA cups.
produces cup-shaped particles. At a given
concentration and electrospinning con-
ditions, the diameter of these micro-
scopic cups is highly uniform (Figure 6).
At 8 wt.-% concentration, the cup dia-
meter from acrylonitrile is about 20%
larger and less porous than that produced
from nitromethane. The dielectric con-
stants of acrylonitrile and nitromethane
are very comparable; however, based on
their R2ij values; acrylonitrile is a better
solvent to PMMA than nitromethane.
Therefore at the same concentration,
acrylonitrile solution has higher viscosity
than the nitromethane solution. The
larger cup diameter obtained from acry-
lonitrile, at least in part, is attributed to
Macromol. Chem. Phys. 2008, 209, 2390–2398
� 2008 WILEY-VCH Verlag GmbH & Co. KGaA, Weinheim
this difference in viscosity. The Brunauer-Emmett-Teller
(BET) specific surface area of the microscopic cups
processed from nitromethane at 8 wt.-% concentration,
measured by nitrogen gas adsorption is 13.7 m2 � g�1. The
adsorbed N2 quantity as a function of relative pressure of
isothermal N2 adsorption (77 K) is shown in Figure 7a. The
pore size and pore-size distribution determined, based on
the nitrogen-gas adsorption study, are shown in Figure 7b.
The cup-formation processwas visualized by high-speed
photography (1 000 frames per second). The distance
between the needle tip and the collection target was
10 cm. Figure 8 shows the electrospinning process of
PMMA/nitromethane solution at 8 wt.-% concentration.
Figure 8a is the charged-polymer-solution jet initiating
from the Taylor cone. At about 0.5 cm from the Taylor cone,
the jet begins whipping (Figure 8b), and finally breaks up
into droplets (Figure 8c). The phase separation into a
solvent-rich region and a polymer-rich region appears to
start at this stage, which leads to the formation of a hole
and finally, complete evaporation of solvent results in cup
www.mcp-journal.de 2393
J. Liu, A. Rasheed, H. Dong, W. W. Carr, M. D. Dadmun, S. Kumar
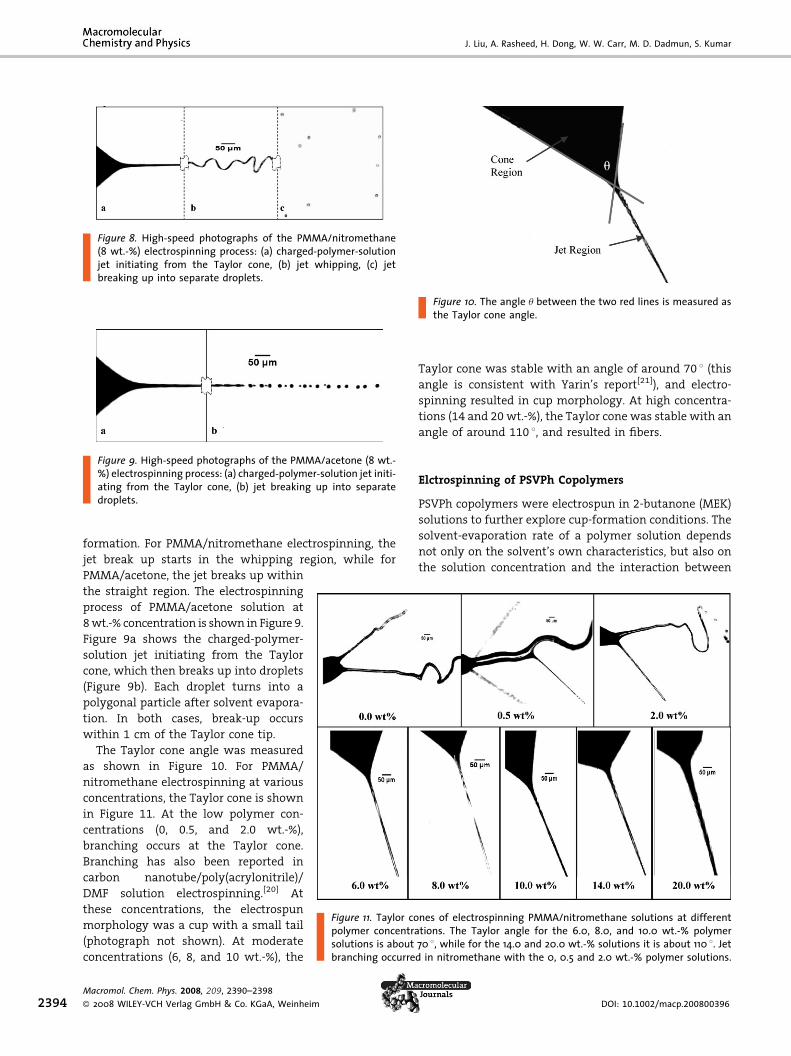
Figure 8. High-speed photographs of the PMMA/nitromethane(8 wt.-%) electrospinning process: (a) charged-polymer-solutionjet initiating from the Taylor cone, (b) jet whipping, (c) jetbreaking up into separate droplets.
Figure 9. High-speed photographs of the PMMA/acetone (8 wt.-%) electrospinning process: (a) charged-polymer-solution jet initi-ating from the Taylor cone, (b) jet breaking up into separatedroplets.
Figure 10. The angle u between the two red lines is measured asthe Taylor cone angle.
2394
formation. For PMMA/nitromethane electrospinning, the
jet break up starts in the whipping region, while for
Figure 11. Taylor cones of electrospinning PMMA/nitromethane solutions at differentpolymer concentrations. The Taylor angle for the 6.0, 8.0, and 10.0 wt.-% polymersolutions is about 70 8, while for the 14.0 and 20.0 wt.-% solutions it is about 110 8. Jetbranching occurred in nitromethane with the 0, 0.5 and 2.0 wt.-% polymer solutions.
PMMA/acetone, the jet breaks up within
the straight region. The electrospinning
process of PMMA/acetone solution at
8wt.-% concentration is shown in Figure 9.
Figure 9a shows the charged-polymer-
solution jet initiating from the Taylor
cone, which then breaks up into droplets
(Figure 9b). Each droplet turns into a
polygonal particle after solvent evapora-
tion. In both cases, break-up occurs
within 1 cm of the Taylor cone tip.
The Taylor cone angle was measured
as shown in Figure 10. For PMMA/
nitromethane electrospinning at various
concentrations, the Taylor cone is shown
in Figure 11. At the low polymer con-
centrations (0, 0.5, and 2.0 wt.-%),
branching occurs at the Taylor cone.
Branching has also been reported in
carbon nanotube/poly(acrylonitrile)/
DMF solution electrospinning.[20] At
these concentrations, the electrospun
morphology was a cup with a small tail
(photograph not shown). At moderate
concentrations (6, 8, and 10 wt.-%), the
Macromol. Chem. Phys. 2008, 209, 2390–2398
� 2008 WILEY-VCH Verlag GmbH & Co. KGaA, Weinheim
Taylor cone was stable with an angle of around 70 8 (thisangle is consistent with Yarin’s report[21]), and electro-
spinning resulted in cup morphology. At high concentra-
tions (14 and 20 wt.-%), the Taylor cone was stable with an
angle of around 110 8, and resulted in fibers.
Elctrospinning of PSVPh Copolymers
PSVPh copolymers were electrospun in 2-butanone (MEK)
solutions to further explore cup-formation conditions. The
solvent-evaporation rate of a polymer solution depends
not only on the solvent’s own characteristics, but also on
the solution concentration and the interaction between
DOI: 10.1002/macp.200800396

Electrospun Micro- and Nanostructured Polymer Particles
Table 5. Three-dimensional solubility parameters of the PSVPhcopolymers and R2ij between the copolymers and MEK.
PSVPh copolymer dd dp dh R2ij
MPa0.5 MPa0.5 MPa0.5 MPa
PSVPh0 18.05 1.12 0.00 104.8
PSVPh10 17.82 1.58 1.76 79.5
PSVPh20 17.72 1.78 2.54 70.5
PSVPh30 17.48 2.24 4.34 55.0
PSVPh40 17.32 2.57 5.61 48.5
MEK 16.00 9.00 5.10 0.0
the polymer and the solvent. With increasing concentra-
tion, the solvent is surrounded by more and more polymer
molecules, which slows down the solvent evaporation.
In cases where hydrogen bonding or other specific
interactions exist between the polymer and the solvent,
the solvent evaporation is further hindered.
The three-dimensional solubility parameters of the PSVPh
copolymers were calculated by the group-contribution
methods using the following equations:[22] dd ¼P
FdiV ,
dp ¼
ffiffiffiffiffiffiffiffiffiffiffiPF2pi
q
V , dh ¼ffiffiffiffiffiffiffiffiffiffiffiP
EhiV
q(Fd: dispersion component force;
Fp: polar component force; Eh: hydrogen-bond component
Figure 12. Electrospinning of PSVPh0/MEK solution with increasingPSVPh0: (a) 1.0, (b) 2.0, (c) 4.0, (d) 6.0, and (e) 8.0 wt.-%. ElectrospinMEK solution, with increasing concentration of PSVPh20: (f) 1.0, (g) 2and (j) 8.0 wt.-%. Electrospinning of PSVPh40/MEK solution, with intration of PSVPh40: (k) 1.0, (l) 2.0, (m) 4.0, (n) 6.0, and (o) 8.0wt.-%. The
Macromol. Chem. Phys. 2008, 209, 2390–2398
� 2008 WILEY-VCH Verlag GmbH & Co. KGaA, Weinheim
energy; V: molar volume), and are listed in Table 5. The
calculated values of the three-dimensional solubility
parameter for polystyrene (PSVPH0) based on the group
contribution method are dd¼ 18.05 (MPa)0.5, dp¼ 1.12
(MPa)0.5, and dh¼ 0.00 (MPa)0.5, while the corresponding
experimental values for polystyrene are 21.3 (MPa)0.5, 5.8
(MPa)0.5, and 4.3 (MPa)0.5. Although there is significant
difference between calculated and experimental solubi-
lity-parameter values,[23,24] the trendwith increasing vinyl
phenol component leading to the changes in the solubility
parameters can bemeaningfully used to assess the relative
solubility of various copolymers in MEK. With increasing
vinyl phenol, the value of R2ij between the PSVPh copolymer
andMEK decreases. This is consistent with dissolution rate
and suggests that MEK becomes a better solvent for the
copolymer containing a larger vinyl phenol component.
We think that increasing amount of hydrogen bonds
between the –OH group in the copolymer and the –CO
group in MEK plays a role here.
Figure 12(a–e) shows that the particle morphology
changes from porous hollow spheres to deformed
cups with increasing concentration of PSVPh0 in
MEK. Figure 12(f–j) shows that the particle morpho-
logy changes from hollow porous spheres to cups
with increasing concentration of PSVPh20 in MEK.
Figure 12(k–o) shows that morphology changes from
hollow spheres to beaded fibers to bead-free fibers with
concentration ofning of PSVPh20/.0, (h) 4.0, (i) 6.0,creasing concen-scale bar is 2mm.
increasing PSVPh40 concentration in
MEK. These morphology changes result
from two factors: (1) for one specific
copolymer, the MEK-evaporation rate
decreases with increasing polymer con-
centration; (2) based on the R2ij calcula-
tion, MEK is a relatively poor solvent for
PSVPh0, PSVPh10 and PSVPh20, while it
is a relatively good solvent for PSVPh30
and PSVPh40. Therefore, at the same
polymer concentrations, the solvent
evaporation rate decreases from PSVPh0
to PSVPh40. PSVPh10 and PSVPh20 have
similar morphology changes with
increasing polymer concentration.
PSVPh30 and PSVPh40 have comparable
morphology changes with increasing
concentration. Fibers were produced
for PSVPh30/MEK or PSVPh40/MEK
solutions at concentrations above
6 wt.-%. Due to hydrogen-bond satura-
tion between the polymer and the
solvent at a certain critical vinyl phenol
content,[25] there is no obvious electro-
spun morphology difference between
PSVPh30 and PSVPh40 at the same
concentration.
www.mcp-journal.de 2395
J. Liu, A. Rasheed, H. Dong, W. W. Carr, M. D. Dadmun, S. Kumar
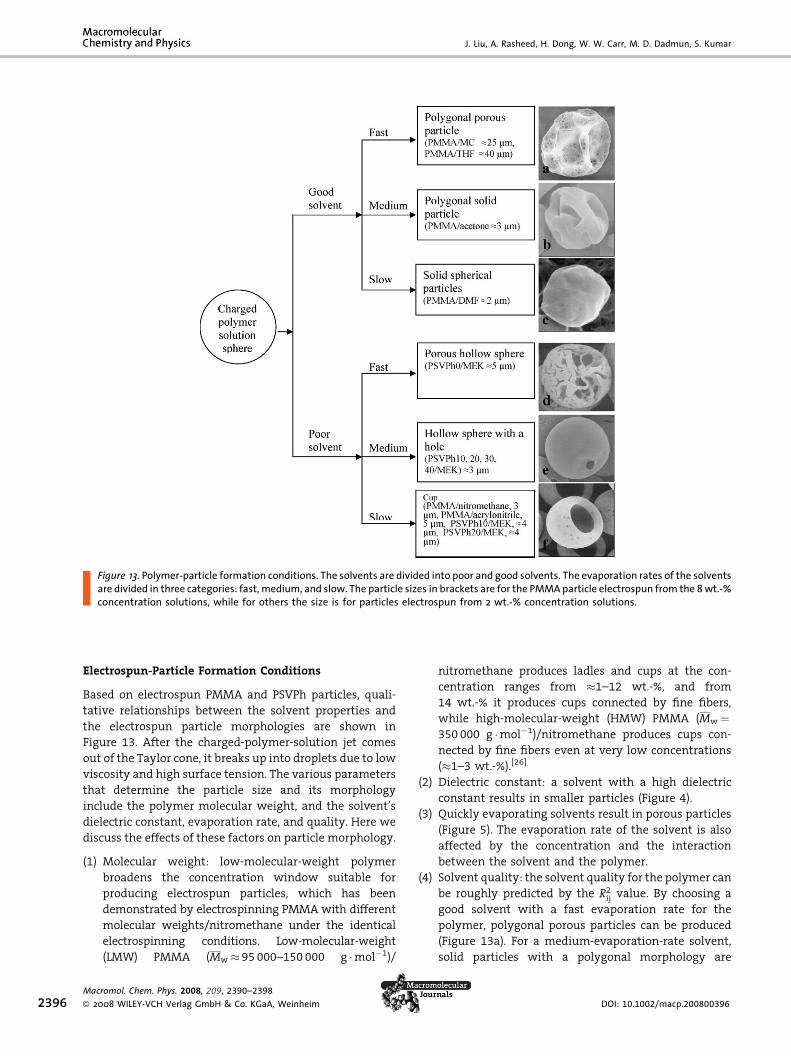
Figure 13. Polymer-particle formation conditions. The solvents are divided into poor and good solvents. The evaporation rates of the solventsare divided in three categories: fast, medium, and slow. The particle sizes in brackets are for the PMMAparticle electrospun from the 8wt.-%concentration solutions, while for others the size is for particles electrospun from 2 wt.-% concentration solutions.
2396
Electrospun-Particle Formation Conditions
Based on electrospun PMMA and PSVPh particles, quali-
tative relationships between the solvent properties and
the electrospun particle morphologies are shown in
Figure 13. After the charged-polymer-solution jet comes
out of the Taylor cone, it breaks up into droplets due to low
viscosity and high surface tension. The various parameters
that determine the particle size and its morphology
include the polymer molecular weight, and the solvent’s
dielectric constant, evaporation rate, and quality. Here we
discuss the effects of these factors on particle morphology.
(1) M
Mac
� 20
olecular weight: low-molecular-weight polymer
broadens the concentration window suitable for
producing electrospun particles, which has been
demonstrated by electrospinning PMMA with different
molecular weights/nitromethane under the identical
electrospinning conditions. Low-molecular-weight
(LMW) PMMA (Mw � 95 000–150 000 g �mol�1)/
romol. Chem. Phys. 2008, 209, 2390–2398
08 WILEY-VCH Verlag GmbH & Co. KGaA, Weinheim
nitromethane produces ladles and cups at the con-
centration ranges from �1–12 wt.-%, and from
14 wt.-% it produces cups connected by fine fibers,
while high-molecular-weight (HMW) PMMA (Mw ¼350000 g �mol�1)/nitromethane produces cups con-
nected by fine fibers even at very low concentrations
(�1–3 wt.-%).[26]
(2) D
ielectric constant: a solvent with a high dielectricconstant results in smaller particles (Figure 4).
(3) Q
uickly evaporating solvents result in porous particles(Figure 5). The evaporation rate of the solvent is also
affected by the concentration and the interaction
between the solvent and the polymer.
(4) S
olvent quality: the solvent quality for the polymer canbe roughly predicted by the R2ij value. By choosing a
good solvent with a fast evaporation rate for the
polymer, polygonal porous particles can be produced
(Figure 13a). For a medium-evaporation-rate solvent,
solid particles with a polygonal morphology are
DOI: 10.1002/macp.200800396

Electrospun Micro- and Nanostructured Polymer Particles
Figure 14. PMMA particles electrospun from methylene chlorideat 1 wt.-% concentration: the solution was maintained at roomtemperature while the temperature of the target wasmaintainedat about 5 8C.
Mac
� 20
formed (Figure 13b). For a solvent with a slow
evaporation rate, solid near-spherical particles
(Figure 13c) were obtained. When a poor solvent is
used for the polymer, porous hollow spheres are
produced for solvents with a fast evaporation rate
(Figure 13d). For a solvent with a medium evaporation
rate, hollow spheres with openmouths (Figure 13e) are
processed. For a poor solvent with a slow evaporation
rate, cups (Figure 13f) are obtained.
Cups can be produced by adjusting the electrospinning
conditions. Hollow porous spheres (Figure 12a) from
PSVPh0/MEK change into deformed cups (Figure 12e) by
increasing the solution concentration. The change in
morphology is attributed to hindered solvent evaporation
caused by the increase in concentration. PSVPh20/MEK
results in hollow spheres with an opening (Figure 12e)
at 4 wt.-%, while cups (Figure 12f) are formed at 8 wt.-%
solution concentration. The solvent evaporation is slowed
down by the presence of more hydrogen bonds and the
increased concentration, making the solution meet the
cup-formation requirements. The PMMA/MC solution
has an upper critical solution temperature behavior.[27]
At low temperature, MC might become a poor solvent for
PMMA and also the decreased temperature retards the
evaporation rate. PMMA cups are obtained by electrospin-
ning PMMA/MC solution at low temperature (5 8C)(Figure 14). By choosing the proper solvent and by tailoring
the electrospinning conditions, the polymer particle
morphology can be tailored.
Conclusion
Electrospinning produces particles of various morpholo-
gies at relatively low polymer concentrations. Microscopic
PMMA polymer cups were produced from electrospinning
in nitromethane or acrylonitrile solutions. High-speed
romol. Chem. Phys. 2008, 209, 2390–2398
08 WILEY-VCH Verlag GmbH & Co. KGaA, Weinheim
photographs can visualize the particle formation process.
In order to further explore cup-formation conditions,
PSVPh random copolymers were electrospun from solu-
tions in MEK. Cups were obtained from PSVPh10 and
PSVPh20, while PSVPh30 and PSVPh40 resulted in beaded
fibers at the same concentration and the same electro-
spinning conditions. Based on the PMMA and PSVPh
electrospun particles, the qualitative relationship between
the solvent properties and the morphology of the
electrospun particles is shown. The electrospinning para-
meters determine the particlemorphology. By tailoring the
solution properties and the electrospinning conditions, the
particlemorphology can be controlled based on the desired
application.
Acknowledgements: This work was supported by the Air ForceOffice of Scientific Research. Chongfu Zhou’s assistance for thesurface area measurements and Tong Wang’s experimentalassistance in electrospinning are gratefully acknowledged.
Received: July 30, 2008; Revised: September 12, 2008; Accepted:September 15, 2008; DOI: 10.1002/macp.200800396
Keywords: cups; electrospinning; high-speed photography; mor-phology; poly(methyl methacrylate) (PMMA); poly[styrene-co-(4-vinyl phenol)] (PSVPh) copolymer
[1] M. Bognitzki, W. Czado, T. Frese, A. Schaper, M. Hellwig, M.Steinhart, A. Greiner, J. H. Wendorff, Adv. Mater. 2001, 13, 70.
[2] H. Fong,W. D. Liu, C. S.Wang, R. A. Vaia, Polymer 2002, 43, 775.[3] P. Gupta, C. Elkins, T. E. Long, G. L. Wilkes, Polymer 2005, 46,
4799.[4] T. Wang, S. Kumar, J. Appl. Polym. Sci. 2006, 102, 1023.[5] J. Liu, T.Wang, T. Uchida, S. Kumar, J. Appl. Polym. Sci. 2005, 96,
1992.[6] P. Dayal, J. Liu, S. Kumar, T. Kyu, Macromolecules 2007, 40,
7689.[7] X. Li, C. Yao, F. Sun, T. Song, Y. Li, Y. Pu, J. Appl. Polym. Sci. 2007,
107, 3756.[8] Y. Kima, V. K. Haftelb, S. Kumar, R. V. Bellamkonda, Bioma-
terials 2008, 29, 3117.[9] Y. K. Luu, K. Kim, B. S. Hsiao, B. Chu, M. Hadjiargyrou,
J. Controlled Release 2003, 89, 341.[10] J. T. McCann, J. I. L. Chen, D. Li, Z. G. Ye, Y. A. Xia, Chem. Phys.
Lett. 2006, 424, 162.[11] X. H. Zong, H. Bien, C. Y. Chung, L. H. Yin, D. F. Fang, B. S. Hsiao,
B. Chu, E. Entcheva, Biomaterials 2005, 26, 5330.[12] P. B. Deotare, J. Kameoka, Nanotechnology 2006, 17, 1380.[13] L. Y. Yeo, Z. Gagnon, H. C. Chang, Biomaterials 2005, 26, 6122.[14] G. Kim, J. Park, H. Han, J. Colloid Interface Sci. 2006, 299,
593.[15] I. B. Rietveld, K. Kobayashi, H. Yamada, K. Matsushige,
J. Colloid Interface Sci. 2006, 298, 639.[16] J. Liu, S. Kumar, Polymer 2005, 46, 3211.
www.mcp-journal.de 2397
J. Liu, A. Rasheed, H. Dong, W. W. Carr, M. D. Dadmun, S. Kumar
2398
[17] A. Rasheed, H. G. Chae, S. Kumar, M. D. Dadmun, Polymer2006, 47, 4734.
[18] W. K. Son, J. H. Youk, T. S. Lee, W. H. Park, Polymer 2004, 45,2959.
[19] J. Brandrup, E. H. Immergut, E. A. Grulke, A. Abe, D. R. Bloch,‘‘PolymerHandbook’’, JohnWiley& Sons, Inc., NewYork 1999.
[20] T. Wang, PhD Thesis, Georgia Institute of Technology, Atlanta2007.
[21] A. L. Yarin, S. Koombhongse, D. H. Reneker, J. Appl. Phys. 2001,90, 4836.
Macromol. Chem. Phys. 2008, 209, 2390–2398
� 2008 WILEY-VCH Verlag GmbH & Co. KGaA, Weinheim
[22] D.W. Van Krevelen, ‘‘Properties of Polymers’’, Elsevier Science,Oxford 1990, p. 212.
[23] L. A. Utracki, R. Simha, Polym. Int. 2004, 53, 279.[24] P. Choi, Macromol. Rapid Commun. 2002, 23, 484.[25] S. Viswanathan, M. D. Dadmun, Macromolecules 2003, 36,
3196.[26] J. Liu, S. Kumar, unpublished results.[27] P. Dayal, T. Kyu, J. Appl. Phys. 2006, 100, 043152.[28] I. M. Smallwood, ‘‘Handbook of Organic Solvent Properties’’,
Halsted Press, New York 1996.
DOI: 10.1002/macp.200800396
Related Documents


