Plant, Cell and Environment (2003) 26 , 1505–1514 © 2003 Blackwell Publishing Ltd 1505 26?15051514 Original Article Blue light sensory sites in etiolated dicotyledon seedlings O. K. Babourina et al. Correspondence: Sergey Shabala. Fax: + 61 362262642; e-mail: [email protected] Electrophysiological localization of blue light sensory sites in etiolated dicotyledon seedlings O. K. BABOURINA 1 , I. A. NEWMAN 1 & S. N. SHABALA 2 1 School of Mathematics and Physics and 2 School of Agricultural Science, University of Tasmania, GPO Box 252–21, Hobart, Tas 7001, Australia ABSTRACT Changes induced by blue light (BL) in ion fluxes and pH in etiolated seedlings of dicotyledons ( Cucumis sativus L., Phaseolus lunatus L., Pisum sativum L.) were studied using a non-invasive ion-selective microelectrode technique (MIFE). BL induced significant Ca 2 + uptake within the first 5 min after onset in upper parts of the whole cucumber seedling. To locate the sites of the BL perception, studies on excised segments were performed. The data obtained demonstrated that the observed Ca 2 + uptake is associated with the very top of the hypocotyl hook of cucumber and butter bean, and with the whole epicotyl of pea, although the response was stronger for the upper parts of the epi- cotyl. Addition of Gd 3 + and La 3 + into the bathing solution completely prevented Ca 2 + influx, implicating the involve- ment of Ca 2 + channels in the regulation of Ca 2 + transport during BL exposure. BL-induced changes in H + and Ca 2 + fluxes were not likely to be linked to the one mechanism, as they were separated spatially and pharmacologically. Key-words : Cucumis ; blue light; Ca 2 + H + pH. Abbreviations : BL, blue light. INTRODUCTION Studies on plant responses to BL have always raised ques- tions about the location of the perception sites and signal transduction components. For phototropism, it is generally agreed that in etiolated seedlings of monocotyledons the main location of molecules responsible for phototropism is in the tips of coleoptiles (Briggs & Huala 1999). For dicot- yledons this issue remains unclear, with some controversy in the literature. Although early research suggested that in dicotyledon species the phototropic stimulus is perceived primarily by the leaves and cotyledons (Shibaoka & Yamaki 1959; Lam & Leopold 1966), subsequent studies on de-etiolated mung bean, cucumber and sunflower seedlings indicated that the primary zone of phototropic perception is the stem (Brennan, Gunckel & Frenkel 1976; Shuttle- worth & Black 1977). To locate unambiguously the sites of BL perception for a given response (e.g. bending or growth inhibition), it is necessary to locate the sites of the relevant photoreceptor molecules and also the sites of initial biochemical or elec- trophysiological changes linked to the response. Proteins which can be autophosphorylated under BL illumination and which have molecular masses of approxi- mately 120 kDa were found in different dicotyledon plants. In pea and Arabidopsis seedlings they have been found in epicotyls and whole seedlings (Short et al . 1994; Huala et al . 1997). In Arabidopsis plants this protein was characterized as phototropin 1 (Huala et al . 1997). Recently Sakamoto & Briggs (2002) have found PHOT1 to be expressed strongly in the apical hook of etiolated Arabidopsis seedlings. In addition to phototropic bending, other responses to BL include stimulation of cotyledon expansion and inhibi- tion of hypocotyl growth (Blum, Neff & Van Volkenburgh 1994; Cashmore et al . 1999). Cashmore et al . (1999) showed that the growth of Arabidopsis cry1 mutants was not inhib- ited over a long time-scale, attributing control over the extension growth to CRY1 functioning. Information on CRY1 location is ambivalent however. On the one hand immunological staining demonstrated that CRY1 is distrib- uted in the whole seedling and mature plant (Ahmad & Cashmore 1993). On the other hand, transient shrinking of protoplasts under BL exposure, which seems to be CRY1 dependent, was shown to be restricted to the upper part of the hypocotyl and the epicotyl (Wang & Iino 1998). Blum et al . (1994) also argued that CRY1 must be located outside the cotyledon, affecting cotyledon expansion in intact plants via intracellular communication. To our knowledge, the only published attempt at electro- physiological localization of BL perception was made by Spalding & Cosgrove (1989), who observed the quantita- tively lesser responses in surface potential changes for the basal region of the cucumber hypocotyl. Recently we found that BL increased net Ca 2 + uptake in etiolated Arabidopsis seedlings (Babourina, Newman & Shabala 2002). This response was identified in the cotyledon of the intact seed- ling and in the upper part of the hypocotyl of decapitated seedlings. However, it was unclear whether Ca 2 + uptake observed at the cotyledon was a result of BL signal percep- tion by the cotyledon itself or by signal transmission from the hypocotyl. To answer this question we have now used larger dicotyledon species, allowing the cuticle to be

Welcome message from author
This document is posted to help you gain knowledge. Please leave a comment to let me know what you think about it! Share it to your friends and learn new things together.
Transcript
Plant, Cell and Environment
(2003)
26
, 1505–1514
© 2003 Blackwell Publishing Ltd
1505
Blackwell Science, LtdOxford, UKPCEPlant, Cell and Environment0016-8025Blackwell Science Ltd 2003? 2003
26?15051514Original Article
Blue light sensory sites in etiolated dicotyledon seedlingsO. K. Babourina
et al.
Correspondence: Sergey Shabala. Fax:
+
61 362262642; e-mail:[email protected]
Electrophysiological localization of blue light sensory sites in etiolated dicotyledon seedlings
O. K. BABOURINA
1
, I. A. NEWMAN
1
& S. N. SHABALA
2
1
School of Mathematics and Physics and
2
School of Agricultural Science, University of Tasmania, GPO Box 252–21, Hobart, Tas 7001, Australia
ABSTRACT
Changes induced by blue light (BL) in ion fluxes and pH inetiolated seedlings of dicotyledons (
Cucumis sativus
L.,
Phaseolus lunatus
L.,
Pisum sativum
L.) were studiedusing a non-invasive ion-selective microelectrode technique(MIFE). BL induced significant Ca
2
+
uptake within the first5 min after onset in upper parts of the whole cucumberseedling. To locate the sites of the BL perception, studieson excised segments were performed. The data obtaineddemonstrated that the observed Ca
2
+
uptake is associatedwith the very top of the hypocotyl hook of cucumber andbutter bean, and with the whole epicotyl of pea, althoughthe response was stronger for the upper parts of the epi-cotyl. Addition of Gd
3
+
and La
3
+
into the bathing solutioncompletely prevented Ca
2
+
influx, implicating the involve-ment of Ca
2
+
channels in the regulation of Ca
2
+
transportduring BL exposure. BL-induced changes in H
+
and Ca
2
+
fluxes were not likely to be linked to the one mechanism,as they were separated spatially and pharmacologically.
Key-words
:
Cucumis
; blue light; Ca
2
+
H
+
pH.
Abbreviations
: BL, blue light.
INTRODUCTION
Studies on plant responses to BL have always raised ques-tions about the location of the perception sites and signaltransduction components. For phototropism, it is generallyagreed that in etiolated seedlings of monocotyledons themain location of molecules responsible for phototropism isin the tips of coleoptiles (Briggs & Huala 1999). For dicot-yledons this issue remains unclear, with some controversyin the literature. Although early research suggested that indicotyledon species the phototropic stimulus is perceivedprimarily by the leaves and cotyledons (Shibaoka &Yamaki 1959; Lam & Leopold 1966), subsequent studies onde-etiolated mung bean, cucumber and sunflower seedlingsindicated that the primary zone of phototropic perceptionis the stem (Brennan, Gunckel & Frenkel 1976; Shuttle-worth & Black 1977).
To locate unambiguously the sites of BL perception fora given response (e.g. bending or growth inhibition), it isnecessary to locate the sites of the relevant photoreceptormolecules and also the sites of initial biochemical or elec-trophysiological changes linked to the response.
Proteins which can be autophosphorylated under BLillumination and which have molecular masses of approxi-mately 120 kDa were found in different dicotyledon plants.In pea and
Arabidopsis
seedlings they have been found inepicotyls and whole seedlings (Short
et al
. 1994; Huala
et al
.1997). In
Arabidopsis
plants this protein was characterizedas phototropin 1 (Huala
et al
. 1997). Recently Sakamoto &Briggs (2002) have found PHOT1 to be expressed stronglyin the apical hook of etiolated
Arabidopsis
seedlings.In addition to phototropic bending, other responses to
BL include stimulation of cotyledon expansion and inhibi-tion of hypocotyl growth (Blum, Neff & Van Volkenburgh1994; Cashmore
et al
. 1999). Cashmore
et al
. (1999) showedthat the growth of
Arabidopsis cry1
mutants was not inhib-ited over a long time-scale, attributing control over theextension growth to
CRY1
functioning. Information onCRY1 location is ambivalent however. On the one handimmunological staining demonstrated that CRY1 is distrib-uted in the whole seedling and mature plant (Ahmad &Cashmore 1993). On the other hand, transient shrinking ofprotoplasts under BL exposure, which seems to be CRY1dependent, was shown to be restricted to the upper part ofthe hypocotyl and the epicotyl (Wang & Iino 1998). Blum
et al
. (1994) also argued that CRY1 must be located outsidethe cotyledon, affecting cotyledon expansion in intactplants via intracellular communication.
To our knowledge, the only published attempt at electro-physiological localization of BL perception was made bySpalding & Cosgrove (1989), who observed the quantita-tively lesser responses in surface potential changes for thebasal region of the cucumber hypocotyl. Recently we foundthat BL increased net Ca
2
+
uptake in etiolated
Arabidopsis
seedlings (Babourina, Newman & Shabala 2002). Thisresponse was identified in the cotyledon of the intact seed-ling and in the upper part of the hypocotyl of decapitatedseedlings. However, it was unclear whether Ca
2
+
uptakeobserved at the cotyledon was a result of BL signal percep-tion by the cotyledon itself or by signal transmission fromthe hypocotyl. To answer this question we have now usedlarger dicotyledon species, allowing the cuticle to be
1506
O. K. Babourina
et al
.
© 2003 Blackwell Publishing Ltd,
Plant, Cell and Environment,
26,
1505–1514
removed from the hook without damaging the parenchyma.We have used several segments of the hypocotyl and havedistinguished between epidermis and parenchyma.
We have measured Ca
2
+
and H
+
fluxes and pH for severalexcised segments and tissues of etiolated seedlings ofcucumber, butter beans and peas to address two majorissues: (a) whether other dicotyledon plants under BL alsoshow a Ca
2
+
uptake as we found for
Arabidopsis
seedlings;and (b) in which part of the seedling is that uptakestrongest.
MATERIALS AND METHODS
Plant material and growth conditions
Seeds of cucumber (
Cucumis sativus
L., cv Marketer), but-ter beans (
Phaseolus lunatus
L.) peas (
Pisum sativum
L.)(all from Hollander Imports, Hobart, Tasmania, Australia)were planted in jars on 0.8% (w/v) agar made up in 200
m
M
KCl
+
100
m
M
CaCl
2
solution, placed in complete darknessat 22
±
2
∞
C for 2–4 d. For most experiments the cucumber,pea and butter bean seedlings were used when the shootshad reached 5–6 cm.
For whole plant measurements shown in Fig. 2, cucumberplants of 2 cm hypocotyl height were used. The plants wereplaced in the experimental chamber after a cut, 2–3 mmlong and 0.5 mm deep, was made on the top of the hook to
overcome the blocking effect of the cuticle on ion fluxes.Similar cuts were made for excised hook measurementsshown in Fig. 3.
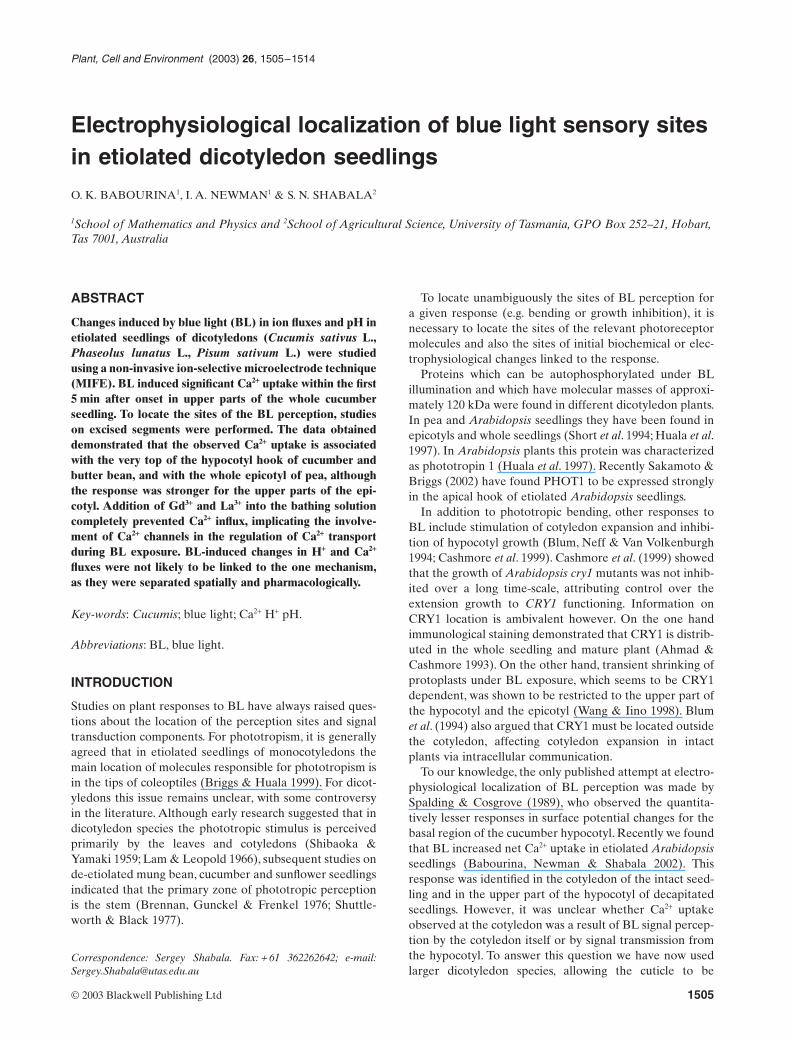
For studies on excised segments, seedlings were cut trans-versely at the positions indicated by dashed lines in Fig. 1.Excised segments of the plants or epidermal and parenchy-mal tissues were fixed vertically in the measuring chambersusing silicone tube sections for support and fluxes weremeasured at the top cut surface of the segments.
Ion fluxes were measured from the epidermal and paren-chymal tissues from the BL illumination side in 200
m
M
KCl
+
100
m
M
CaCl
2
solution. Epidermal strips were peeledby fine tweezers.
As green light cannot be used in ‘blue light’ studies,because in many plants it also induces phototropism (Stein-itz, Ren & Poff 1985), all handling procedures were per-formed under red light of 2.4
m
mol m
-
2
s
-
1
. The light source,and also the microscope light, was incandescent with a redplastic filter. The chamber was then placed on the micro-scope for which the microscope light intensity was0.9
m
mol m
-
2
s
-
1
at the tissue position. Measurementsstarted at least 60 min later to allow for recovery fromwounding.
In all experiments, the source of monochromatic(468 nm) BL was a QBEAM projector, an array of BL-emitting light emitting diodes (LED) (Quantum Devices,Inc., Barneveld, WI, USA). In most experiments, thestandard treatment given was 15 mmol m
-
2
(10 min of25
m
mol m
-
2
s
-
1
BL).
Ion flux measurements
Details of ion-selective microelectrode fabrication and cal-ibration have been given previously (Shabala, Newman &Morris 1997). Commercially available ionophore cocktails(LIX) were used (Fluka catalog numbers 95297 for hydro-gen; 21048 for calcium). Both LIX are highly specific to themeasured ion under our experimental conditions. The the-ory of measurements using the MIFE
®
system (Universityof Tasmania, Hobart, Australia) has also been given in areview (Newman 2001).
Net H
+
and Ca
2
+
fluxes were measured simultaneouslyfor 20–30 min prior to BL treatment. Then the BL pulsewas applied and measurements continued for at least30 min.
Three to 11 seedlings were measured for each plant part,species and treatment. In some figures, representativeexamples are shown to illustrate the form of ion fluxresponse kinetics as well as their variability. Statisticalinformation on the magnitudes of ion flux and pH changesis presented in Fig. 4, where
D
is calculated as the maximumchange in fluxes or pH from before BL onset to duringillumination. When pH drift was significant during thattime, as is normal for living tissue and plants, the lineartrend was removed from the data by using the
SANTIS
pack-age (University of Aachen, Germany) prior to calculating
D
. Significance of difference between means was tested byStudent’s
t
test.
Figure 1.
Diagrams of seedlings showing places where cuts were made (dashed lines) across cucumbers and beans (left) and in peas (right). Arrows indicate the cut surfaces that were measured, and the numbers identify the position on hypocotyl or epicotyl.

Blue light sensory sites in etiolated dicotyledon seedlings
1507
© 2003 Blackwell Publishing Ltd,
Plant, Cell and Environment,
26,
1505–1514
Growth measurements
In a further set of experiments, growth rates of segments ofintact seedlings were measured before and after exposureto BL. Plants were grown in either soil or agar until theyreached the required size. Then appropriate segments weremarked by a 0.1 mm water-based, water resistant ‘Artline’marker (Shachihata, Nagoya, Japan), two in each zoneindicated in Fig. 1. The distance between marks was mea-sured. After 4 h of dark or BL treatment, the distancebetween marks was measured again, and the relative elon-gation rate of each segment was calculated for the dark andthe BL period.
RESULTS
Ion fluxes for the whole plant, excised segments and differ-ent types of tissue were compared in cucumber, which wasthe most convenient plant for handling in all procedures.To our knowledge no such reports are available in theliterature. Figure 2 shows kinetics of Ca
2
+
and H
+
fluxes andpH measured simultaneously from the hook region of thewhole cucumber seedling. BL onset induced rapid net Ca
2
+
influx. The maximum influx of about 10 nmol m
-
2
s
-
1
occurred at 3–4 min from the start of BL, and was similarto Ca
2
+
flux values observed for decapitated
Arabidopsis
seedlings (Babourina
et al
. 2002). The Ca
2
+
flux changeswere accompanied by multiphasic changes in H
+
fluxes andpH.
Rapid BL-induced net Ca
2
+
influx in the excised hookregion was also found for all other species measured(Fig. 3). It also peaked 3–4 min after illumination started,and complex multiphasic H
+
flux and pH changes followedBL onset (Fig. 3).
To determine the most responsive part of etiolatedseedlings we measured segments excised from seedlingsas indicated in Fig. 1. In cucumber and bean Ca
2
+
influxwas most pronounced in the upper parts of hypocotylsand in the upper part of cotyledons when the hook wasunfolded: it was observed both for the hook area and forthe upper part of the hypocotyl when it was cut justbelow the hook (Fig. 4). If cotyledons were cut from aplant with a well-developed hook, no Ca
2
+
flux responsewas observed for those cotyledons. Below the top quarterof the hypocotyl, Ca
2
+
influx was small or absent. In peasthe Ca
2
+
influx was also most pronounced in the upper
Figure 2.
Net Ca
2
+
, H
+
fluxes (influx positive) and pH changes measured from whole cucumber seedlings in response to BL of 15 mmol m
-
2
(given as a 10 min illumination from 5 min). Microelec-trodes were placed at the top of the hook: position 2 in Fig. 1. Each point rep-resents the ion flux averaged over the subsequent 30 s interval. Representative error bars are SEM (
n
=
4).

1508
O. K. Babourina
et al
.
© 2003 Blackwell Publishing Ltd,
Plant, Cell and Environment,
26,
1505–1514
part of the epicotyl and hook. However, segments to halfway down the epicotyl also responded, although at alesser magnitude.
Growth measurements matched the ion flux data in allspecies studied. The maximum dark growth rates wereobserved in zones 2 and 3 (Fig. 5), the same zones showingthe highest BL-induced Ca
2
+
influx (Fig. 4). Blue light treat-
ment for 4 h significantly suppressed growth of all segmentsin all three species studied (Fig. 5).
The H
+
fluxes and pH changes in response to BL weregenerally very variable and multiphasic (Figs 3 & 6). Forpea epicotyl segments H
+
influx was more pronouncedthan for cucumber and beans (Fig. 4). All three speciesexhibited H
+
efflux in the upper part of the root. In cotyle-
Figure 3.
Typical examples of changes in net Ca
2
+
, H
+
fluxes (influx positive) and pH at 5 s intervals for the isolated hook seg-ment from one plant each of cucumber, pea and bean. The light treatment (15 mmol m
-
2
) was given between 5 and 15 min. Microelectrodes were placed at position 2 in Fig. 1, where a small cut had been made by a blade.

Blue light sensory sites in etiolated dicotyledon seedlings
1509
© 2003 Blackwell Publishing Ltd,
Plant, Cell and Environment,
26,
1505–1514
dons/leaves when they were cut from unhooked plants, inhooks and in the upper-most parts of the hypocotyl/epico-tyls, pH rose towards alkaline values in response to BL.An apparent inconsistency between pH and H
+
fluxchanges suggested possible changes in CO
2
diffusion inresponse to BL treatment (Shabala & Newman 1999) orthe transport of another substance (e.g. a weak acid) thatcan change pH but does not contribute to membrane H
+
flux.Having established the location for the most pronounced
Ca
2
+
response, we performed experiments to compare epi-dermal and parenchymal tissues for both ions. In thecucumber hook changes in ion fluxes and pH are stronger
for parenchyma than for the epidermal strip (Fig. 6). Mag-nitude of Ca
2
+
flux for parenchyma was nearly the same asfor the whole plant, the excised hook and the upper partof the hypocotyl (Figs 3 & 4). Although epidermal tissueresponded similarly to parenchyma, it was with a smallermagnitude, for pH and both measured ion fluxes.
Because the MIFE technique measures net ion fluxes,they do not show whether BL exposure activates inwardCa
2
+ currents or inactivates outward currents. Pharmaco-logical studies with the Ca2+ channel blockers La3+ andGd3+ suggest that BL activates Ca2+
in channels rather thaninactivates outward transporters. One hour pretreatmentin 1 mM LaCl3 or 500 mM GdCl3 solutions completely
Figure 4. Histograms for D-values for maximum changes in Ca2+, H+ fluxes and pH during BL exposure for data as shown in Fig. 3. Numbers on the x-axis corre-spond to the segments shown in Fig. 1. Error bars are SEM (n = 4–9).

1510 O. K. Babourina et al.
© 2003 Blackwell Publishing Ltd, Plant, Cell and Environment, 26, 1505–1514
blocked Ca2+ influx, whereas 100 mM LaCl3 failed to do so(Fig. 7).
DISCUSSION
Ca2++++ involvement in BL responses
It has been known for some time that Ca2+ is involved inthe BL responses of plants. Some indication of direct Ca2+
involvement in the phototropic response has beenobtained by confocal imaging. Unilateral white lightcaused a rise in [Ca2+]cyt in the shaded side of maize coleop-tiles. The increased [Ca2+]cyt was observed in both epider-mal and cortical peripheral regions of apical parts ofcoleoptiles and it stabilized 15 min after illumination(Gehring et al. 1990). Inhibition of stem elongation incucumber seedlings by BL required Ca2+ in the externalsolution and was prevented if Ca2+ was chelated by ethyl-ene glycol-BIS(2-aminoethylether-N,N,N¢,N¢-tetraaceticacid (Shinkle & Jones 1988). Calmodulin inhibitors couldblock 65% of the effect of BL irradiation on surface pHchanges (Elzenga, Staal & Prins 1997, 2000).
Generally, it is difficult to link a specific BL response tochanges in [Ca2+]cyt because of the abundance of processesmediated by BL and the abundance of processes involving[Ca2+]cyt. One clue was given in recent papers in which it hasbeen established that (i) phot1 mutation is responsible fora reduced rise in [Ca2+]cyt (Baum et al. 1999); (ii) phot1mutation affects Ca2+ transport from the apoplast (Babou-rina et al. 2002). Initially, PHOT1 was isolated and charac-terized as a gene responsible only for the bending response(Huala et al. 1997). However, evidence emerged later aboutits participation in other processes. Among physiologicalresponses that distinguish phototropin mutants from wild
types are their lack of chloroplast re-orientation in cotyle-dons (Sakai et al. 2001), lack of growth inhibition immedi-ately after BL illumination (Folta & Spalding 2001) andinhibition of stomatal opening (Kinoshita et al. 2001). Allthese processes can require changes in [Ca2+]cyt at somestage: (i) chloroplast movement in response to BL treat-ment requires an increase in [Ca2+]cyt, and is blocked byantagonists of calcium homeostasis (Tlalka & Fricker1999); (ii) prompt growth inhibition that normally occursin etiolated seedlings, seems to be linked with re-orienta-tion of the polar growth axis, which also requires, at somestage, changes in [Ca2+]cyt (Cove 2000); (iii) stomatal open-ing/closing is also under control of [Ca2+]cyt (Irving, Gehring& Parish 1992; Grabov & Blatt 1999). Therefore, althoughit does not seem that changes in [Ca2+]cyt are essential forautophosphorylation of BL receptor molecules themselves,because that happens in a Ca2+-independent manner (Shortet al. 1994; Raya & de la Vara 2001), it can be argued thatCa2+ influx is needed at some subsequent step of thePHOT1 signal transduction pathway. The exact processcontrolled by this influx is still to be revealed. Our pharma-cological experiments (Fig. 7) suggest that at least part ofthis process is mediated by Ca2+ channels, although BL-induced down-regulation of Ca2+-ATPase cannot be com-pletely ruled out.
In a whole-cell patch clamp study on Arabidopsis meso-phyll protoplasts, Stoelzle et al. (2003) have shown that BLactivates plasma membrane Ca2+ channels. The activationwas found to be absent from a phot1 phot2 mutant but waspresent in a cry mutant. Our work strongly endorses theconclusion of Stoelzle et al. (2003) that ‘blue light triggerscalcium fluxes via the phototropin-activated calcium-permeable channel’.
Figure 5. Relative elongation (% increase from initial length) of various segments (in nomenclature of Fig. 1) after 4 h of darkness (control) or of blue light treatment. Data are means ± SEM(n = 5–8).
Blue light sensory sites in etiolated dicotyledon seedlings 1511
© 2003 Blackwell Publishing Ltd, Plant, Cell and Environment, 26, 1505–1514
Different signal pathways are responsible for BL-induced changes in Ca2++++ and H++++ fluxes
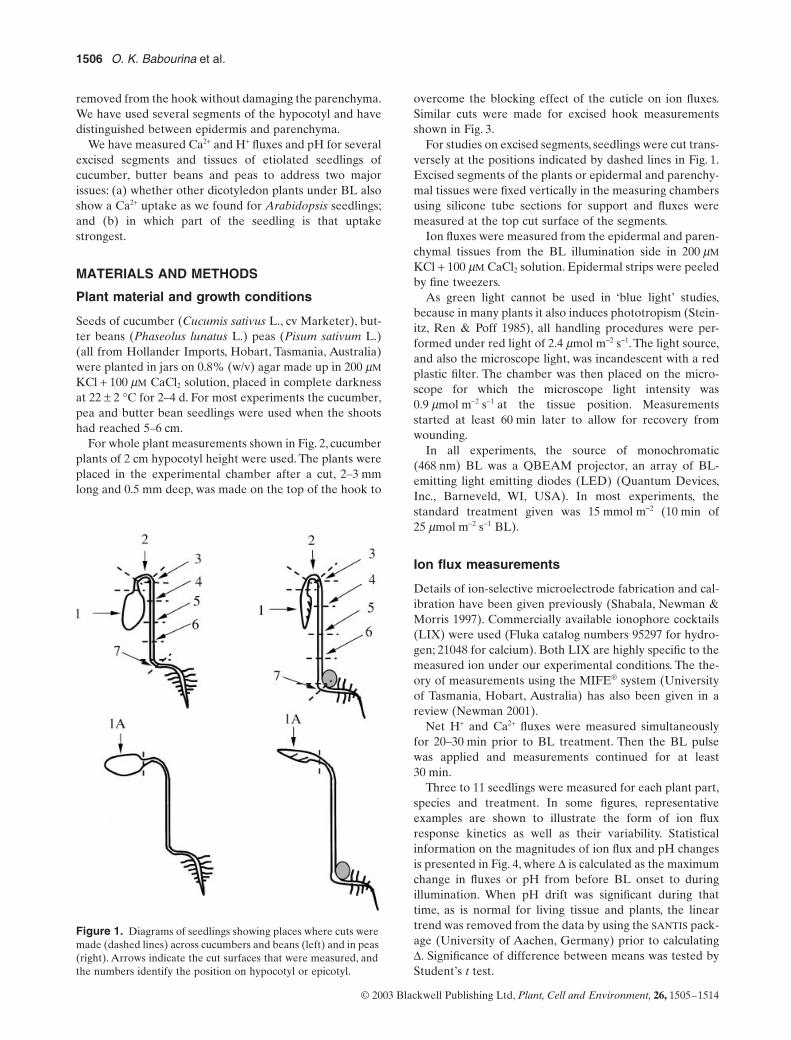
Blue light-induced changes in H+ and Ca2+ fluxes are notlinked. First, we could separate them spatially: Ca2+ influxis restricted to the hook or uppermost region of all threespecies (Fig. 3), whereas changes in H+ fluxes and pH wereobserved in all parts studied, including the roots. Second,in pharmacological experiments, channel blockers pre-vented Ca2+ from entering the tissue, whereas H+ still
responded to BL (Fig. 7). We also found this kind of inde-pendence of H+ and Ca2+ kinetics for Arabidopsis seedlings(Babourina et al. 2002). Moreover, that work showed thatH+ and pH changes are not linked with PHOT1 andPHOT2 BL signal pathways. Thus the changes observed forlower parts of the hypocotyl and the upper part of the root(Fig. 4) should be linked with other BL signal pathways.
Current candidates for control of H+ and pH changesduring BL exposure include cryptochromes (Cashmoreet al. 1999), RPT2 (Sakai et al. 2000) and a ‘probable light
Figure 6. The effect of BL on net Ca2+, H+ fluxes and pH changes measured from epi-dermis and parenchyma isolated from the hook region of cucumber seedlings. Epider-mal strips and parenchymal tissue were placed in a vertical position. Representative error bars are SEM (n = 4–6).

1512 O. K. Babourina et al.
© 2003 Blackwell Publishing Ltd, Plant, Cell and Environment, 26, 1505–1514
receptor’ from beet root plasma membranes (Raya & de laVara 2001). Cryptochromes CRY1 and CRY2 were foundthroughout the whole seedling and mature plant (Ahmad& Cashmore 1993). However, cry1 mutants exhibit BL-induced changes of H+ fluxes and pH similar to wild type(Babourina, unpublished); thus the CRY1 pathway can beexcluded.
What is the physiological role of BL-induced H+ flux andpH changes? BL treatment for 4 h significantly suppressedhypocotyl growth (Fig. 5). Alkalinization of the bath solu-tion occurred within a few minutes after BL onset (Fig. 2),especially around the fast-growing parts of hypocotyl/epi-cotyl (Fig. 4). That is consistent with the acid-growth theory(Cleland et al. 1991; Rayle & Cleland 1992; Van Volken-
Figure 7. Typical examples (one out of three or four) of BL-induced ion flux kinetics from excised cucumber hooks after pretreatment with La3+ and Gd3+. Isolated hooks were placed into bathing solution with indicated concentrations of LaCl3 or GdCl3 for 1 h, the subse-quent procedure was the same as in experiments shown in Fig. 3.
Blue light sensory sites in etiolated dicotyledon seedlings 1513
© 2003 Blackwell Publishing Ltd, Plant, Cell and Environment, 26, 1505–1514
burgh 1999; Cosgrove 2000). As early as 1981 Cosgroveshowed that BL rapidly suppresses growth in a variety ofcultivated species (Cosgrove 1981). The short lag period(20–70 s) that he reported, is consistent with our data(Fig. 3) and supports the suggestion that BL-induced alka-linization of the apoplast down-regulates the activity ofexpansins (Cosgrove 2000) and therefore reduces cell wallexpansion (Spalding & Cosgrove 1992).
Tissue/organ distribution of sensory sites involved in BL-induced Ca2++++ influx
It was expected that pea seedlings would respond in a sim-ilar way to Arabidopsis, because a 120 kDa protein havingability to autophosphorylate during BL treatment has beenpurified from pea stems (Short et al. 1994). However, unlikedicotyledon plants having developed hypocotyls, the tissuelocation of this response was not limited to the hook area(Fig. 4).
Studying tissue distribution, Long & Iino 2001 found thatboth epidermal and parenchymal cells showed a protoplastshrinking/swelling response to BL illumination. Our dataalso show a clear response for parenchyma, but the partic-ipation of epidermal cells in Ca2+ uptake during BL expo-sure is less certain – there was possible ‘contamination’ byparenchymal cells during epidermal strip preparation.
As noted above, there is controversy for some dicotyle-don species over whether cotyledons or hypocotyls are thesites of BL perception and signal transduction. In ourexperiments we found changes in H+ fluxes in all parts ofthe seedlings, including the upper part of the root, whereasCa2+ influx occurred only in the uppermost parts of seed-lings (Fig. 4). Ca2+ influx was observed in cotyledons fromunhooked plants but was not found in cotyledons isolatedfrom plants with well-developed hooks (Fig. 4) in which thecotyledons are located much lower. These observationslead us to suggest a non-permanent organ location of theBL signal perception and transduction pathways that leadto Ca2+ influx. In seedlings with a developed hypocotyl(cucumber and beans), we think that the perception/trans-duction sites involved in this pathway are dependent on thedistance from the top of the seedling rather than beingrestricted to a specific organ, hypocotyl versus cotyledon.
The range of studies on Arabidopsis phototropinmutants, the molecular characterization of the phototro-pins, the observations on phototropin-activated Ca2+ chan-nels, and the work presented here all combine to form arobust picture of early events in the important group of BLresponses comprising phototropism, stomatal movementand chloroplast re-orientation.
ACKNOWLEDGMENTS
This work was supported by Australian Research Councilgrants to S.S. (A00001144) and I.N. (A00105708). Theauthors are grateful to Luis Gonzales de la Vara for readingthe manuscript and making valuable comments.
REFERENCES
Ahmad M. & Cashmore A.R. (1993) HY4 gene of A. thalianaencodes a protein with characteristics of a blue-light photore-ceptor. Nature 366, 162–166.
Babourina O., Newman I.A. & Shabala S. (2002) Blue lightinduced kinetics of H+ and Ca2+ fluxes in etiolated wild type andphototropin-mutant Arabidopsis seedlings. Proceedings of theNational Academy of Sciences of the USA 99, 2433–2438.
Baum G., Long J.C., Jenkins G.I. & Trewavas A.J. (1999) Stimu-lation of the blue light phototropic receptor NPH1 causes atransient increase in cytosolic Ca2+. Proceedings of the NationalAcademy of Sciences of the USA 96, 13554–13559.
Blum D.E., Neff M.M. & Van Volkenburgh E. (1994) Light-stimulated cotyledon expansion in the blu3 and hy4 mutants ofArabidopsis thaliana. Plant Physiology 105, 1433–1436.
Brennan T., Gunckel J.E. & Frenkel C. (1976) Stem sensitivity andethylene involvement in phototropism of mung bean. PlantPhysiology 57, 286–289.
Briggs W.R. & Huala E. (1999) Blue-light photoreceptors inhigher plants. Annual Review of Cell and Developmental Biol-ogy 15, 33–62.
Cashmore A.R., Jarillo J.A., Wu Y.-J. & Liu D. (1999) Crypto-chromes: blue light receptors for plants and animals. Science 284,759–765.
Cleland R.E., Buckley G., Nowbar S., Lew N.M., Stinemetz C.,Evans M.L. & Rayle D.L. (1991) The ph profile for acid-inducedelongation of coleoptile and epicotyl sections is consistent withthe acid-growth theory. Planta 186, 70–74.
Cosgrove D.J. (1981) Rapid suppression of growth by blue light.Occurrence, time course, and general characteristics. PlantPhysiology 67, 584–590.
Cosgrove D.J. (2000) Expansive growth of plant cell walls. PlantPhysiology and Biochemistry 38, 109–124.
Cove D.J. (2000) The generation and modification of cell polarity.Journal of Experimental Botany 346, 831–838.
Elzenga J.T.M., Staal M. & Prins H.B.A. (1997) Calcium-calmodulin signalling is involved in light-induced acidificationby epidermal leaf cells of pea, Pisum sativum L. Journal ofExperimental Botany 48, 2055–2061.
Elzenga J.T.M., Staal M. & Prins H.B.A. (2000) Modulation byphytochrome of the blue light-induced extracellular acidificationby leaf epidermal cells of pea (Pisum sativum L.): a kineticanalysis. Plant Journal 25, 377–389.
Folta K.M. & Spalding E.P. (2001) Unexpected roles for crypto-chrome 2 and phototropin revealed by high-resolution analysisof blue light-mediated hypocotyl growth inhibition. Plant Jour-nal 26, 471–478.
Gehring C.A., Williams D.A., Cody S.H. & Parish R.W. (1990)Phototropism and geotropism in maize coleoptiles are spatiallycorrelated with increases in cytosolic free calcium. Nature 345,528–530.
Grabov A. & Blatt M. (1999) A steep dependence of inward-rectifying potassium channels on cytosolic free calcium concen-tration increase evoked by hyperpolarisation in guard cells.Plant Physiology 119, 277–287.
Huala E., Oeller P.W., Liscum E., Han I.S., Larsen E. & BriggsW.R. (1997) Arabidopsis NPH1: a protein kinase with a putativeredox-sensing domain. Science 278, 2120–2123.
Irving H.R., Gehring C. & Parish R. (1992) Changes in cytosolicpH and calcium of guard cells precede stomatal movements.Proceedings of the National Academy of Sciences of the USA 89,1790–1794.
Kinoshita T., Doi M., Suetsugu N., Kagawa T., Wada M. & Shi-mazaki K.-I. (2001) phot1 and phot2 mediate blue light regula-tion of stomatal opening. Nature 414, 656–660.

1514 O. K. Babourina et al.
© 2003 Blackwell Publishing Ltd, Plant, Cell and Environment, 26, 1505–1514
Lam S. & Leopold A.C. (1966) Role of leaves in phototropism.Plant Physiology 41, 847–851.
Long C. & Iino M. (2001) Light-dependent osmoregulation in peastem protoplasts. Photoreceptors, tissue specificity, ion relation-ships, and physiological implications. Plant Physiology 125,1854–1869.
Newman I.A. (2001) Ion transport in roots: measurement of fluxesusing ion-selective microelectrodes to characterize transporterfunction. Plant, Cell and Environment 24, 1–14.
Raya J.C. & Gonzalez de la Vara L.E. (2001) Purification andcharacterization of a probable light receptor with kinase activityfrom beet root plasma membranes. Planta 213, 802–810.
Rayle D.L. & Cleland R.E. (1992) The acid growth theory ofauxin-induced cell elongation is alive and well. Plant Physiology99, 1271–1274.
Sakai T., Kagawa T., Kasahara M., Swartz T.E., Christie J.M.,Briggs W.R., Wada M. & Okada K. (2001) Arabidopsis nph1and npl1: blue light receptors that mediate both phototropismand chloroplast relocation. Proceedings of the National Academyof Sciences of the USA 98, 6969–6974.
Sakai T., Wada T., Ishiguro S. & Okada K (2000) RPT2: a signaltransducer of the phototropic response in Arabidopsis. PlantCell 12, 225–236.
Sakamoto K. & Briggs W.R. (2002) Cellular and subcellular local-ization of phototropin 1. Plant Cell 14, 1723–1735.
Shabala S.N. & Newman I.A. (1999) Light-induced changes inhydrogen, calcium, potassium, and chloride ion fluxes and con-centration from mesophyll and epidermal tissues of bean leaves.Understanding the ionic basis of light-induced bioelectrogene-sis. Plant Physiology 119, 1115–1124.
Shabala S.N., Newman I.A. & Morris J. (1997) Oscillations in H+
and Ca2+ ion fluxes around the elongation region of corn rootsand effects of external pH. Plant Physiology 113, 111–118.
Shibaoka H. & Yamaki T. (1959) Studies on the growth movementof sunflower plant. Scientific Papers of the College of GeneralEducation, University of Tokyo 9, 105–126.
Shinkle J.R. & Jones R.L. (1988) Inhibition of stem elongation inCucumis seedlings by blue light requires calcium. Plant Physiol-ogy 86, 960–966.
Short T.W., Porst M., Palmer J., Fernbach E. & Briggs W.R. (1994)Blue light induces phosphorylation at seryl residues on a pea(Pisum sativum L.) plasma membrane protein. Plant Physiology104, 1317–1324.
Shuttleworth J.E. & Black M. (1977) The role of cotyledonsin phototropism of de-etiolated seedlings. Planta 135, 51–55.
Spalding E.P. & Cosgrove D.J. (1989) Large plasma-membranedepolarization precedes rapid blue-light-induced growth inhibi-tion in cucumber. Planta 178, 407–410.
Spalding E.P. & Cosgrove D.J. (1992) Mechanism of blue-light-induced plasma-membrane depolarization in etiolated cucum-ber hypocotyls. Planta 188, 199–205.
Steinitz B., Ren Z. & Poff K. (1985) Blue and green light-inducedphototropism in Arabidopsis thaliana and Lactuca sativa L.seedlings. Plant Physiology 77, 248–251.
Stoelzle S., Kagawa T., Wada M., Hedrich R. & Dietrich P. (2003)Blue light activates calcium-permeable channels in Arabidopsismesophyll cells via the phototropin signalling pathway. Proceed-ings of the National Academy of Sciences of the USA 100, 1456–1461.
Tlalka M. & Fricker M. (1999) The role of calcium in blue-light-dependent chloroplast movement in Lemna trisulca L. PlantJournal 20, 461–473.
Van Volkenburgh E. (1999) Leaf expansion – an integrating plantbehaviour. Plant, Cell and Environment 22, 1463–1473.
Wang X. & Iino M. (1998) Interaction of cryptochrome 1, phyto-chrome, and ion fluxes in blue-light-induced shrinking of Ara-bidopsis hypocotyl protoplasts. Plant Physiology 117, 1265–1279.
Received 4 March 2003; received in revised form 9 April 2003;accepted for publication 4May 2003
Related Documents