Electrophysiological evidence of abnormal activation of the cerebral network of involuntary attention in alcoholism Maria Dolores Polo a,b , Carles Escera a, * , Elena Yago a , Kimmo Alho c , Antoni Gual d , Carles Grau a a Neurodynamics Laboratory, Department of Psychiatry and Clinical Psychobiology, University of Barcelona, P. Vall d’Hebron 171, 08035 Barcelona, Spain b The Burden Neurological Institute, Frenchay Park Road, Bristol BS16 1JB, UK c Cognitive Brain Research Unit and General Psychology Division, Department of Psychology, University of Helsinki, Helsinki, Finland d Alcoholism Unit of the Generalitat de Catalunya, Hospital Clinic de Barcelona, Barcelona, Spain Accepted 15 October 2002 Abstract Objective: Increased distractibility is a common impairment in alcoholism, but objective evidence has remained elusive. Here, a task designed to investigate with event-related brain potentials (ERPs) the neural mechanism underlying distraction was used to show abnormal involuntary orienting of attention in chronic alcoholism. Methods: Fifteen alcoholics and 17 matched healthy controls were instructed to ignore auditory stimuli while concentrating in the discrimination of immediately following visual stimuli. The auditory sequences contained repetitive standard tones occasionally replaced by deviant tones of slightly higher frequency, or by complex novel sounds. Results: Deviant tones and novel sounds distracted visual performance, i.e. increased reaction time to visual stimuli, similarly in patients and controls. Compared to controls, however, alcoholics showed ERP abnormalities, i.e. enhanced P3a amplitudes over the left frontal region, and a positive posterior deflection instead of the frontally distributed reorienting negativity (RON). Conclusions: The enhanced P3a to novelty and subsequent positive wave instead of RON in alcoholics suggests encoding into working memory of task-irrelevant auditory events and provides neurophysiological markers of impaired involuntary attention mechanisms in chronic alcoholism. q 2002 Elsevier Science Ireland Ltd. All rights reserved. Keywords: Alcoholism; Event-related brain potential; Involuntary attention switching; Mismatch negativity; P3a; Reorienting negativity 1. Introduction Chronic alcohol abuse has been related to structural (Carlen et al., 1981; Gurling et al., 1986; Jernigan et al., 1991; Pfefferbaum et al., 1997), functional (Gilman et al., 1990; Nicola ´s et al., 1993; Adams et al., 1993; Dao-Castel- lana et al., 1998), and cognitive brain damage. Moreover, most of these alcohol-related effects have been found consistently in the frontal lobes, suggesting that this brain region is particularly susceptible to the toxic effects of etha- nol (Gurling et al., 1986; Gilman et al., 1990; Nicola ´s et al., 1993; Adams et al., 1993; Kril et al., 1997; Pfefferbaum et al., 1997; Dao-Castellana et al., 1998). Neuropsychological results also support this notion, as poor performance in tasks thought to be served by the frontal cortex, such as planning, categorizing, flexible thinking and inhibitory control, has been found in abstinent chronic alcoholics (Nicola ´s et al., 1993; Adams et al., 1993; Dao-Castellana et al., 1998). Event-related brain potential (ERP) studies in chronic alcoholics have provided evidence that the effects of alcohol on the central nervous system (CNS) may extend from controlled (Patterson et al., 1987; Porjesz et al., 1988; Pfef- ferbaum et al., 1991; Cadaveira et al., 1991; Realmuto et al., 1993) to preattentive stages of information processing. Among them, the mismatch negativity (MMN) component of the ERPs reflects an automatic stimulus-change detector mechanism, which is activated when a stream of repetitive sounds is interrupted by a deviant sound even when atten- tion is directed elsewhere (Na ¨a ¨ta ¨nen et al., 1978; Sams et al., 1985; Paavilainen et al., 1989; Sharma et al., 1993; Sasaki et al., 2000; see also Cheour et al., 2000), during sleep (Loewy et al., 1996; Atienza et al., 2001) and in coma- tose patients (Kane et al., 1993). Previous studies investigat- ing the MMN in chronic alcoholics (Kathmann et al., 1995; Pekkonen et al., 1998; Ahveninen et al., 1999; Polo et al., 1999; Grau et al., 2001) have led to partially inconsistent results, likely because of methodological differences (Polo et al., 1999; see also Ahveninen et al., 2000a for a review). Clinical Neurophysiology 114 (2003) 134–146 1388-2457/02/$ - see front matter q 2002 Elsevier Science Ireland Ltd. All rights reserved. PII: S1388-2457(02)00336-X www.elsevier.com/locate/clinph CLINPH 1067 * Corresponding author. Tel.: 134-93-312-5048; fax: 134-93-403-4424. E-mail address: [email protected] (C. Escera).

Welcome message from author
This document is posted to help you gain knowledge. Please leave a comment to let me know what you think about it! Share it to your friends and learn new things together.
Transcript
Electrophysiological evidence of abnormal activation of the cerebralnetwork of involuntary attention in alcoholism
Maria Dolores Poloa,b, Carles Esceraa,*, Elena Yagoa, Kimmo Alhoc, Antoni Guald, Carles Graua
aNeurodynamics Laboratory, Department of Psychiatry and Clinical Psychobiology, University of Barcelona, P. Vall d’Hebron 171, 08035 Barcelona, SpainbThe Burden Neurological Institute, Frenchay Park Road, Bristol BS16 1JB, UK
cCognitive Brain Research Unit and General Psychology Division, Department of Psychology, University of Helsinki, Helsinki, FinlanddAlcoholism Unit of the Generalitat de Catalunya, Hospital Clinic de Barcelona, Barcelona, Spain
Accepted 15 October 2002
Abstract
Objective: Increased distractibility is a common impairment in alcoholism, but objective evidence has remained elusive. Here, a task
designed to investigate with event-related brain potentials (ERPs) the neural mechanism underlying distraction was used to show abnormal
involuntary orienting of attention in chronic alcoholism.
Methods: Fifteen alcoholics and 17 matched healthy controls were instructed to ignore auditory stimuli while concentrating in the
discrimination of immediately following visual stimuli. The auditory sequences contained repetitive standard tones occasionally replaced
by deviant tones of slightly higher frequency, or by complex novel sounds.
Results: Deviant tones and novel sounds distracted visual performance, i.e. increased reaction time to visual stimuli, similarly in patients
and controls. Compared to controls, however, alcoholics showed ERP abnormalities, i.e. enhanced P3a amplitudes over the left frontal
region, and a positive posterior deflection instead of the frontally distributed reorienting negativity (RON).
Conclusions: The enhanced P3a to novelty and subsequent positive wave instead of RON in alcoholics suggests encoding into working
memory of task-irrelevant auditory events and provides neurophysiological markers of impaired involuntary attention mechanisms in chronic
alcoholism. q 2002 Elsevier Science Ireland Ltd. All rights reserved.
Keywords: Alcoholism; Event-related brain potential; Involuntary attention switching; Mismatch negativity; P3a; Reorienting negativity
1. Introduction
Chronic alcohol abuse has been related to structural
(Carlen et al., 1981; Gurling et al., 1986; Jernigan et al.,
1991; Pfefferbaum et al., 1997), functional (Gilman et al.,
1990; Nicolas et al., 1993; Adams et al., 1993; Dao-Castel-
lana et al., 1998), and cognitive brain damage. Moreover,
most of these alcohol-related effects have been found
consistently in the frontal lobes, suggesting that this brain
region is particularly susceptible to the toxic effects of etha-
nol (Gurling et al., 1986; Gilman et al., 1990; Nicolas et al.,
1993; Adams et al., 1993; Kril et al., 1997; Pfefferbaum et
al., 1997; Dao-Castellana et al., 1998). Neuropsychological
results also support this notion, as poor performance in tasks
thought to be served by the frontal cortex, such as planning,
categorizing, flexible thinking and inhibitory control, has
been found in abstinent chronic alcoholics (Nicolas et al.,
1993; Adams et al., 1993; Dao-Castellana et al., 1998).
Event-related brain potential (ERP) studies in chronic
alcoholics have provided evidence that the effects of alcohol
on the central nervous system (CNS) may extend from
controlled (Patterson et al., 1987; Porjesz et al., 1988; Pfef-
ferbaum et al., 1991; Cadaveira et al., 1991; Realmuto et al.,
1993) to preattentive stages of information processing.
Among them, the mismatch negativity (MMN) component
of the ERPs reflects an automatic stimulus-change detector
mechanism, which is activated when a stream of repetitive
sounds is interrupted by a deviant sound even when atten-
tion is directed elsewhere (Naatanen et al., 1978; Sams et
al., 1985; Paavilainen et al., 1989; Sharma et al., 1993;
Sasaki et al., 2000; see also Cheour et al., 2000), during
sleep (Loewy et al., 1996; Atienza et al., 2001) and in coma-
tose patients (Kane et al., 1993). Previous studies investigat-
ing the MMN in chronic alcoholics (Kathmann et al., 1995;
Pekkonen et al., 1998; Ahveninen et al., 1999; Polo et al.,
1999; Grau et al., 2001) have led to partially inconsistent
results, likely because of methodological differences (Polo
et al., 1999; see also Ahveninen et al., 2000a for a review).
Clinical Neurophysiology 114 (2003) 134–146
1388-2457/02/$ - see front matter q 2002 Elsevier Science Ireland Ltd. All rights reserved.
PII: S1388-2457(02)00336-X
www.elsevier.com/locate/clinph
CLINPH 1067
* Corresponding author. Tel.: 134-93-312-5048; fax: 134-93-403-4424.
E-mail address: [email protected] (C. Escera).
For example, Kathmann et al. (1995) reported a delay in the
latency of MMN in chronic alcoholics, whereas Pekkonen et
al. (1998) found similar amplitudes and latencies of the
magnetic counterpart of MMN (MMNm) in alcoholic and
their respective control subjects. Consistently, our recent
work showed similar amplitudes (Polo et al., 1999; Grau
et al., 2001) and latencies (Polo et al., 1999) of MMN in
middle-aged chronic alcoholics and in their age-matched
controls. Taken together, these results suggest preserved
automatic stimulus-change detection, as indexed by the
MMN, in middle-aged abstinent chronic alcoholics. Other
studies, however, have shown a significant enhancement
(Ahveninen et al., 1999, 2000b) and acceleration (Ahveni-
nen et al., 1999) of MMN in abstinent alcoholics, possibly
due, as stated by these authors, to the CNS hyperexcitability
associated with alcohol withdrawal, as their alcoholics had
been abstinent for a relatively short period (1–6 weeks).
MMN is mainly generated in the supratemporal auditory
cortices (Csepe et al., 1987, 1992; Javitt et al., 1992; Halg-
ren et al., 1995; see Alho, 1995; Escera et al., 2000a for
reviews), and it is partially contributed by an additional
frontal source (Giard et al., 1990; Molnar et al., 1995;
Deouell et al., 1998; Rinne et al., 2000; Yago et al.,
2001), which may reflect a signal to trigger a shift of atten-
tion towards the initially unattended stimuli (Naatanen,
1992). This is supported by recent studies showing
increased reaction times and number of errors to imperative
stimuli of a discrimination task linked to MMN-eliciting
stimuli (Schroger, 1996; Alho et al., 1997; Escera et al.,
1998, 2001, 2002; Ahveninen et al., 2000b; Yago et al.,
2001; see Escera et al., 2000a for a review). The functional
role of MMN in involuntary orienting of attention is also
supported by the fact that P3a, an ERP component asso-
ciated with the orienting response (Courchesne et al.,
1975; Squires et al., 1975; Knight, 1984; Knight and
Scabini, 1998; Woods et al., 1992; Katayama and Polich,
1996; Escera et al., 1998, 2000a), often appears following
the MMN (Naatanen, 1992; Sasaki et al., 2000). Contribu-
tions to P3a arise from a widely distributed cerebral
network, including the auditory (Halgren et al., 1995;
Alho et al., 1998), prefrontal (Knight, 1984; Yamaguchi
and Knight, 1991) and parietal cortices (Halgren et al.,
1995), and the hippocampus (Knight, 1996). Recent
evidence indicates that P3a in response to widely deviant
novel sounds is a composite response with at least two
different subcomponents: an early one (circa 230 ms) of
centro-parietal scalp distribution (eP3a), and a later one
(circa 315 ms) with a more frontal scalp distribution
(lP3a) (Escera et al., 1998, 2000a, 2001). To date, reduced
amplitudes (Realmuto et al., 1993; Rodrıguez-Holguın et
al., 1999; Hada et al., 2000) and delayed latencies (Biggins
et al., 1995) of P3a have been found in alcoholics with
respect to matched controls. These studies suggest an alco-
hol-induced dysfunction of the involuntary orienting of
attention mechanisms indexed by P3a, though the results
are not conclusive.
As important as orienting of attention involuntarily
towards change and novelty can be, task performance
requires reorienting of attention back to the original activity
after temporary distraction. Recent studies suggest that this
reorienting of the attention is reflected in a late negative
ERP component, the reorienting negativity (RON), appear-
ing after the P3a (Schroger and Wolff, 1998). RON is gener-
ated over frontocentral scalp areas at approximately 400–
600 ms after irrelevant stimulus changes leading to distrac-
tion (Schroger and Wolff, 1998; Schroger et al., 2000; Berti
and Schroger, 2001; Escera et al., 2001). Recently, impaired
reorienting of attention has been proposed to explain the
increased number of errors showed by a group of alcoholics,
with respect to their matched-controls, in their responses to
auditory stimuli of a forced-choice RT task that were linked
to MMN-eliciting stimuli (Ahveninen et al., 2000b).
However, this study failed to demonstrate a statistically
significant attenuation of the RON in the alcoholic subjects.
In summary, MMN, P3a, and RON appear as promising
tools to ascertain the neurophysiological basis of involun-
tary attention and distraction, and to evaluate their func-
tional integrity in clinical populations. With this purpose,
we recorded MMN and P3a to unexpected task-irrelevant
auditory changes, and P3a and RON to novel sounds preced-
ing visual stimuli requiring a motor response, in a group of
abstinent chronic alcoholics and their aged-matched
controls. The distracting effect of the irrelevant auditory
events over the visual task was also assessed by means of
reaction times (RT) and performance accuracy measures
(Escera et al., 1998, 2000a, 2001). Our hypothesis was
that if the neural mechanisms involved in the detection
and orienting of attention towards unexpected changes in
the unattended acoustic environment were impaired by
chronic alcohol abuse, then alcoholic patients should
display abnormal MMN, P3a, and/or RON. As a result,
poorer performance on the visual task would be also
expected in the patients, as a behavioural measure of
increased distractibility in chronic alcoholism.
2. Materials and methods
2.1. Subjects
Table 1 summarizes demographic and clinical character-
istics of participants. Fifteen chronic alcoholics and 17
healthy age-matched controls who drank less than 210 g/
week of alcohol signed an informed consent and were
rewarded for their participation. The study was conducted
with the approval of the Ethical Committee of the Univer-
sity of Barcelona and of the Alcoholism Unit of the Gener-
alitat de Catalunya’s authorities, where the alcoholic
subjects were outpatients undergoing treatment for alcohol
dependence (DSM-IV). All subjects were right-handed
(Edinburgh Handedness Inventory, Oldfield, 1971) males
with auditory hearing thresholds below 60 dB SPL (at 700
M.D. Polo et al. / Clinical Neurophysiology 114 (2003) 134–146 135
Hz), and normal or corrected-to-normal vision. Previous
history of severe organic disease, neurologic or psychiatric
disorder, or other substance abuse (except tobacco) (DSM-
IV) were exclusion criteria for participation. At the time of
examination, alcoholics were in a withdrawal period of at
least 4 weeks, and all subjects had been free of medication
for the previous 72 h (including disulfiram). To control
drug-free status during the treatment, periodic follow-up
interviews with their clinician and recurrent (1–5 per
week) urine drug (alcohol, cannabis, benzodiazepines,
opiates, amphetamines, and cocaine) screen analyses were
performed in alcoholics. On the day of testing, all subjects
underwent a breathalyzer test (Breathalyzer model RBT IV;
Intoximeters Inc., St. Louis, MO, USA) to ensure that they
were free of alcohol. Control subjects were recruited among
patient friends and with notices posted in the University of
Barcelona campus. All subjects were questioned about alco-
hol and other drugs use, and medical and psychiatric
histories for themselves and first- and second-degree rela-
tives in an interview with a trained psychologist. Control
subjects had significantly more education than alcoholics
(tð30Þ ¼ 22:5, P , 0:02, Table 1), but this variable was
not significantly correlated with any of the ERP measures.
Score in the self-answered Beck Depression Inventory
(BDI; Beck et al., 1961) confirmed that the affective mood
of the alcoholic and control subjects had been similar in the
week previous to the experiment.
2.2. Stimuli and procedure
Subjects sat in an armchair, in a sound-attenuated, dimly
illuminated, and electrically shielded room. Ten blocks with
200 stimulus-pairs (trials) each were presented to the
subjects. Each trial consisted of an auditory stimulus
followed after 300 ms (onset-to-onset) by a visual stimulus.
The inter-pair interval (onset-to-onset) was 1.5 s (Fig. 1).
The auditory stimuli were standard tones (80%), deviant
tones (10%), or novel sounds (10%) delivered in a random
order with the constraint that each deviant-tone and novel-
sound trial was preceded by at least one standard-tone trial.
The standard and deviant stimuli were pure tones of 600 Hz
and 514 or 700 Hz (50% each), respectively, and the novel
sounds were 60 environmental complex sounds, such as
those produced by an electric drill, hammer, telephone ring-
ing, etc. All auditory stimuli were presented binaurally
through headphones with a duration of 200 ms (including
rise/fall times of 10 ms) and an intensity of 75 dB SPL. Each
different novel sound occurred only once within a stimulus
block, and was presented no more than twice or 3 times in
the whole experiment. The visual stimuli were white capital
letters (A, E, J, P, R, S, U, Y) or digits (2–9) displayed
during 200 ms, in random order, at the centre of a black
PC computer screen located 1.5 m from the subject, with
respective vertical and horizontal angles of 1.38 and 0.88.
Subjects were instructed to look at a fixation cross on the
centre of the screen, and to use the index and middle fingers
of their right hand to press one of two buttons on a response
panel according to whether they saw a letter or a digit, as
fast and accurately as possible. The order of fingers was
counterbalanced, with half of the subjects using the index
finger to respond to the letters. Instructions were also given
to ignore the auditory stimulation, and to avoid excessive
blinking and body movements. Each block lasted 5 min, and
short breaks were given between blocks.
Before the recordings, each subject underwent a training
session consisting of two blocks with 200 visual stimuli in
which the auditory stimulation had been omitted. All
subjects included in the statistical analyses reached at
least a hit rate of 80% in the training.
M.D. Polo et al. / Clinical Neurophysiology 114 (2003) 134–146136
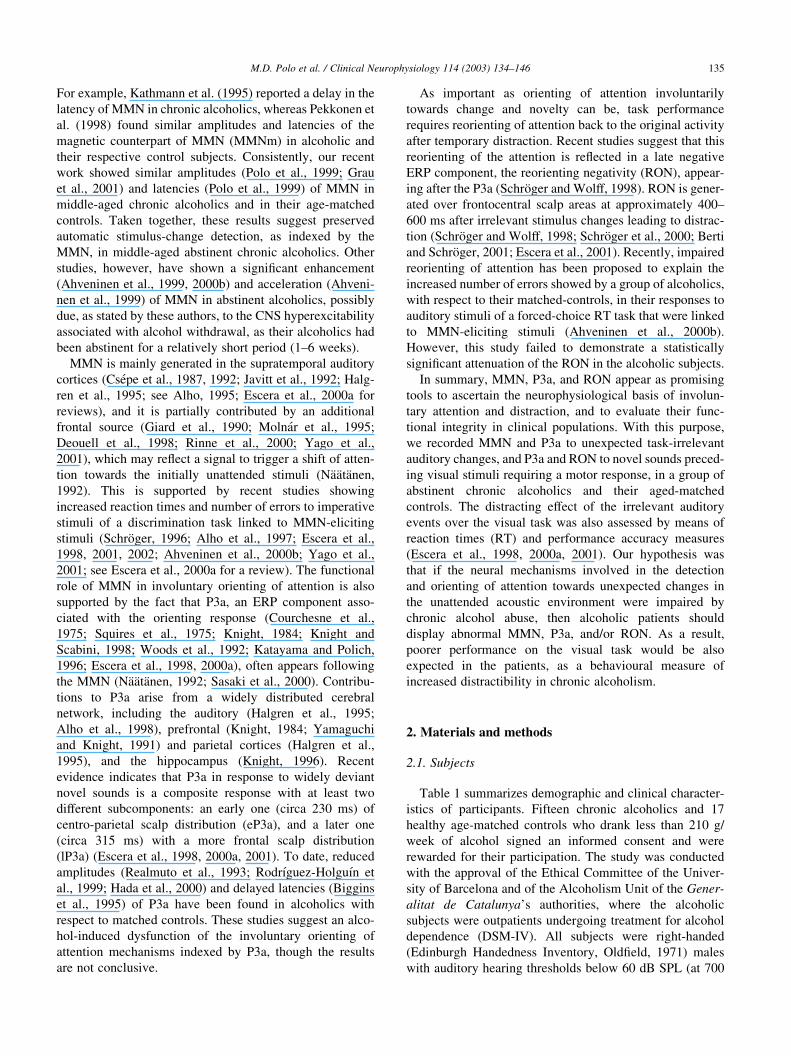
Fig. 1. Experimental design. Pairs of stimuli, consisting of an auditory
stimulus (A) followed at 300 ms (onset-to-onset) by a visual stimulus
(V), were delivered with an inter-pair interval of 1500 ms. A behavioural
response was required within 1100 ms interval after each visual stimuli.
Table 1
Mean, standard deviation (SD), and range for demographic and clinical information
Variable Alcoholics (n ¼ 15) Controls (n ¼ 17)
Mean (SD) Range Mean (SD) Range
Age (years) 42.0 (9.2) 25–56 39.3 (10.8) 20–57
Education (years)a 9.5 (2.2) 5–15 11.6 (2.3) 9–16
Drinking onset age (years) 16.6 (2.8) 10–22 16.4 (2.2) 13–21
Drinking per week (g)a 1081.3 (659.3) 300–2380 85.0 (59.6) 10–210
Dependence onset age (years) 30.4 (9.2) 18–47 Not applicable
Dependence length (years) 11.6 (7.2) 4–27 Not applicable
Withdrawal (weeks) 10.5 (5.7) 4–21 Not applicable
Number of treatment attempts 1.3 (0.4) 1–2 Not applicable
Beck Depression Inventory 4.4 (3.2) 0–12 4.1 (3.8) 0–12
a P , 0:05.
2.3. ERP recording
The electroencephalogram (EEG, bandpass 0.1–100 Hz)
was continuously digitized (sampling rate, 500 Hz) by a
Synamps amplifier (NeuroScan Inc.), from 18 electrodes
(Fp1, Fp2, F7, F3, Fz, F4, F8, T3, C3, Cz, C4, T4, T5, P3,
Pz, P4, T6, Oz) placed according to the International 10–20
system (Jasper, 1958) and 10 additional electrodes: FC1
(halfway between Cz and F3), FT3 (halfway between F3
and T3), CP1 (halfway between Cz and P3), TP3 (halfway
between T3 and P3), IM1 (70% of the distance from the
preauricular point to the inion), and the homonymous posi-
tions over the right hemisphere, all inserted in a cap (Elec-
trocap Inc.). Activity at the left and right-mastoids (M1 and
M2, respectively) was recorded by electrodes placed at a
distance of 40% from the left and right pre-auricular points
to the inion (Fig. 2A). Horizontal ocular movements and
blinks were recorded from electrodes placed at the outer
canthus (HEOG) and suborbital ridge (VEOG) of the right
eye, respectively. An electrode attached to the tip of the
nose served as reference for the EEG and EOG recordings.
Impedance remained below 10 KV during the whole record-
ing session. Epochs with EEG or EOG changes exceeding
^100 mV, as well as the first 5 epochs of each block, were
excluded automatically from averaging. For each subject,
ERPs were averaged off-line according to the type of audi-
tory stimulus, and digitally bandpass filtered between 0.5
and 30 Hz. The epoch was 1300 ms, including 100 ms
prestimulus baseline. A minimum of 100 responses in the
average for each type of auditory stimulus was required for
each subject because of signal-to-noise concerns. The ERPs
of two alcoholics and one control that did not meet this
criterion were excluded from further analysis.
2.4. Data analysis
All ERP amplitudes were measured against the mean
amplitude of the 100 ms prestimulus baseline. Latencies
were measured from auditory stimulus onset. ERP compo-
nents detection and measurement were performed automa-
tically at each electrode using the peak detection algorithm
of the Scan software package (Neuroscan Inc.). For each
subject, the auditory N1 and P2 were identified as the largest
negative/positive deflection within 70–150 ms and 150–250
ms latency windows, respectively, and their peak amplitude
and latency measured in the ERPs to the standard (N1, P2),
deviant (N1), and novel (N1) sounds. The MMN peak was
identified as the largest negative deflection within 100–200
ms latency window of the difference waveform obtained by
subtracting the ERPs to standard tones from those to deviant
tones, and the mean amplitude in this interval was measured
for statistical analysis. For the P3a elicited by the deviant
tones, the mean amplitude within the 200–250 ms and 250–
300 ms latency windows was measured in the deviant minus
standard difference waveform. In response to novel sounds,
the P3a had two consecutive phases, and therefore the mean
amplitude of the early (eP3a) and late (lP3a) phases was
measured in the difference waveform obtained by subtract-
ing the ERPs to standard tones from those to novel sounds,
in the respective latency windows of 200–300 ms and 300–
400 ms. Following the P3a to novel sounds, a frontal nega-
tivity, possibly the RON, was observed in the novel minus
M.D. Polo et al. / Clinical Neurophysiology 114 (2003) 134–146 137
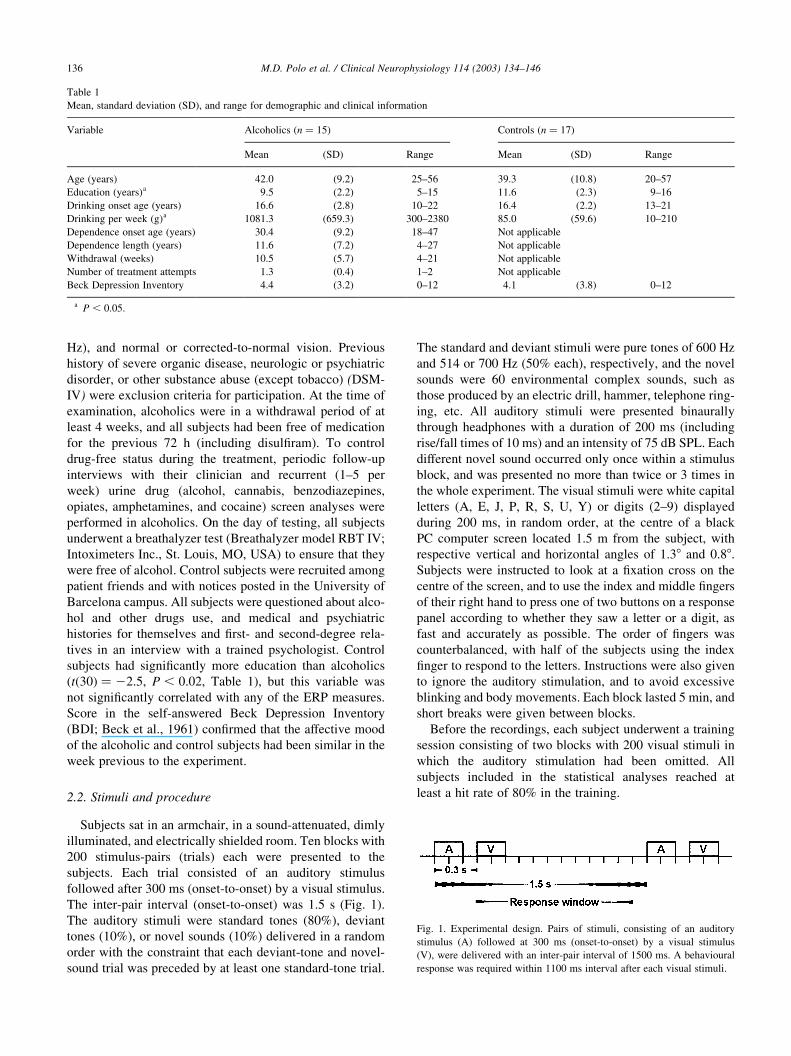
Fig. 2. (A) Distribution over the scalp of the 30 electrodes used in the electroencephalogram (EEG) recordings. (B) Grand-average waveforms of N1 and P2
event-related brain potentials (ERPs) elicited by the standard tones in the control and alcoholic groups at midline electrodes.
standard difference waveform in the control group. In
contrast, a late positive peak was found at the concomitant
latency range in the alcoholics. To analyse this group differ-
ence, the mean amplitude within 500–600 ms latency
window in the novel minus standard difference waveform,
as well as in the ERP waveform elicited by the standard tone
and the novel sounds, was measured.
For the performance analysis, the responses to the visual
stimuli were recorded separately according to whether the
visual stimulus was preceded by a standard tone, by a devi-
ant tone, or by a novel sound. Pressing the correct button
within 1100 ms interval after the visual stimulus onset (Fig.
1) was regarded as a hit, and the average reaction time (RT,
in milliseconds) was computed for these trials. An incorrect
button press during this interval was classified as an error,
and a trial with no response was classified as a miss. Hit,
error and miss rates, and mean RT for hits were computed
across letters and numbers.
2.5. Statistical analyses
Group comparisons of the demographic and clinical data,
the amplitude and latency of N1 and P2 elicited by the
standard tones at Cz, the latency of MMN in the deviant
minus standard difference waveform at Fz, and all post hoc
analyses were performed with paired t tests. Univariate
analyses of variance (ANOVA) for repeated measures
with group as the between-subject factor and laterality
(F3-C3-P3/Fz-Cz-Pz/F4-C4-P4) and frontality (F3-Fz-F4/
C3-Cz-C4/P3-Pz-P4) as within-subject factors were
performed for MMN and P3a to the deviant tones, and
RON to novel sounds. For the RON component, an addi-
tional ANOVA including stimulus (standard/novel) as an
extra within-subject factor was performed. For the analysis
of novel P3a scalp-distributions, a subcomponent (eP3a/
lP3a) within-subject factor was added, and the ERP ampli-
tudes were normalized to prevent genuine differences in
scalp distribution from being washed out by amplitude
differences among electrodes. This normalization was
done by dividing the amplitude at each electrode by the
square root of the sum of the squared amplitudes at the
selected electrodes (McCarthy and Wood, 1985). The
scalp distribution analysis of the P3a elicited to novel
sounds also included the electrodes F7, F8, T3, T4, T5,
and T6.
Performance data analyses were carried out by means of
ANOVAs with group as the between-subject factor and
stimulus (standard/deviant/novel) as the within-subject
factor. For all statistical analysis, and when appropriate,
Greenhouse-Geisser corrections were applied, and the
corrected P values along with the original degrees of free-
dom (df1 and df2) and the epsilon factor (1 ) are reported.
Pearson correlations were performed to examine the rela-
tionship between ERPs and education in each group, and
dependence length and withdrawal from alcohol in the
patient group. For all analyses, differences and correlations
were considered significant only if they exceeded the level
of P , 0:05.
3. Results
3.1. Performance data
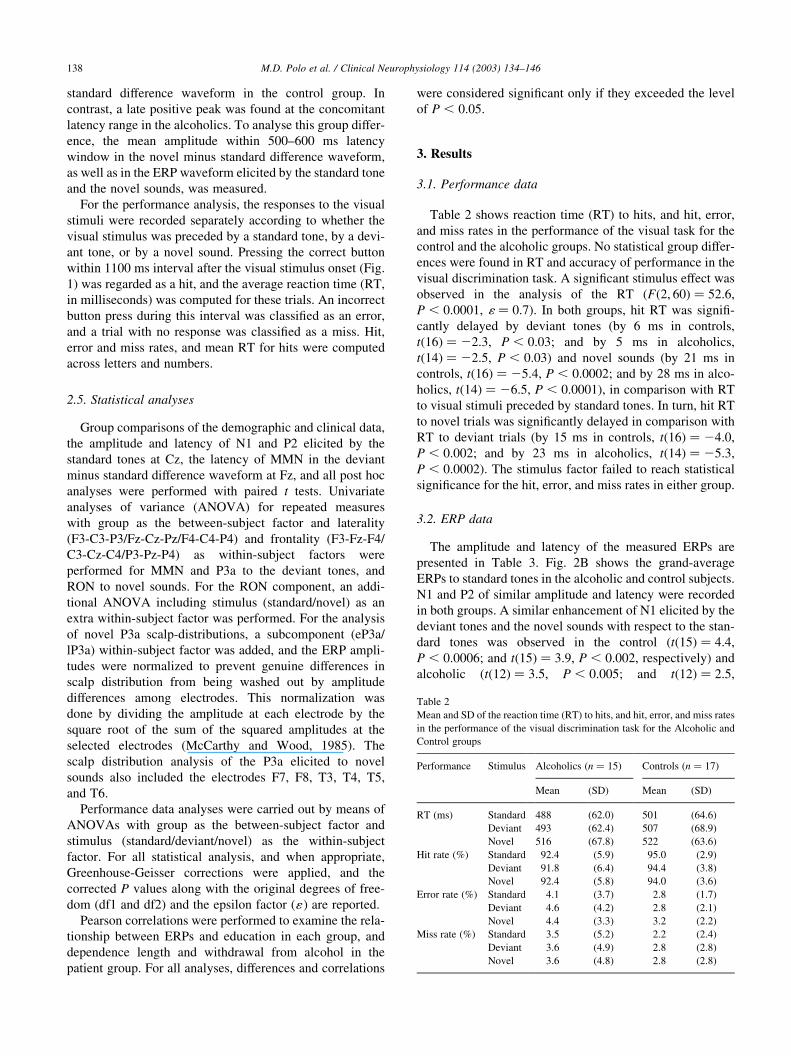
Table 2 shows reaction time (RT) to hits, and hit, error,
and miss rates in the performance of the visual task for the
control and the alcoholic groups. No statistical group differ-
ences were found in RT and accuracy of performance in the
visual discrimination task. A significant stimulus effect was
observed in the analysis of the RT (Fð2; 60Þ ¼ 52:6,
P , 0:0001, 1 ¼ 0:7). In both groups, hit RT was signifi-
cantly delayed by deviant tones (by 6 ms in controls,
tð16Þ ¼ 22:3, P , 0:03; and by 5 ms in alcoholics,
tð14Þ ¼ 22:5, P , 0:03) and novel sounds (by 21 ms in
controls, tð16Þ ¼ 25:4, P , 0:0002; and by 28 ms in alco-
holics, tð14Þ ¼ 26:5, P , 0:0001), in comparison with RT
to visual stimuli preceded by standard tones. In turn, hit RT
to novel trials was significantly delayed in comparison with
RT to deviant trials (by 15 ms in controls, tð16Þ ¼ 24:0,
P , 0:002; and by 23 ms in alcoholics, tð14Þ ¼ 25:3,
P , 0:0002). The stimulus factor failed to reach statistical
significance for the hit, error, and miss rates in either group.
3.2. ERP data
The amplitude and latency of the measured ERPs are
presented in Table 3. Fig. 2B shows the grand-average
ERPs to standard tones in the alcoholic and control subjects.
N1 and P2 of similar amplitude and latency were recorded
in both groups. A similar enhancement of N1 elicited by the
deviant tones and the novel sounds with respect to the stan-
dard tones was observed in the control (tð15Þ ¼ 4:4,
P , 0:0006; and tð15Þ ¼ 3:9, P , 0:002, respectively) and
alcoholic (tð12Þ ¼ 3:5, P , 0:005; and tð12Þ ¼ 2:5,
M.D. Polo et al. / Clinical Neurophysiology 114 (2003) 134–146138
Table 2
Mean and SD of the reaction time (RT) to hits, and hit, error, and miss rates
in the performance of the visual discrimination task for the Alcoholic and
Control groups
Performance Stimulus Alcoholics (n ¼ 15) Controls (n ¼ 17)
Mean (SD) Mean (SD)
RT (ms) Standard 488 (62.0) 501 (64.6)
Deviant 493 (62.4) 507 (68.9)
Novel 516 (67.8) 522 (63.6)
Hit rate (%) Standard 92.4 (5.9) 95.0 (2.9)
Deviant 91.8 (6.4) 94.4 (3.8)
Novel 92.4 (5.8) 94.0 (3.6)
Error rate (%) Standard 4.1 (3.7) 2.8 (1.7)
Deviant 4.6 (4.2) 2.8 (2.1)
Novel 4.4 (3.3) 3.2 (2.2)
Miss rate (%) Standard 3.5 (5.2) 2.2 (2.4)
Deviant 3.6 (4.9) 2.8 (2.8)
Novel 3.6 (4.8) 2.8 (2.8)
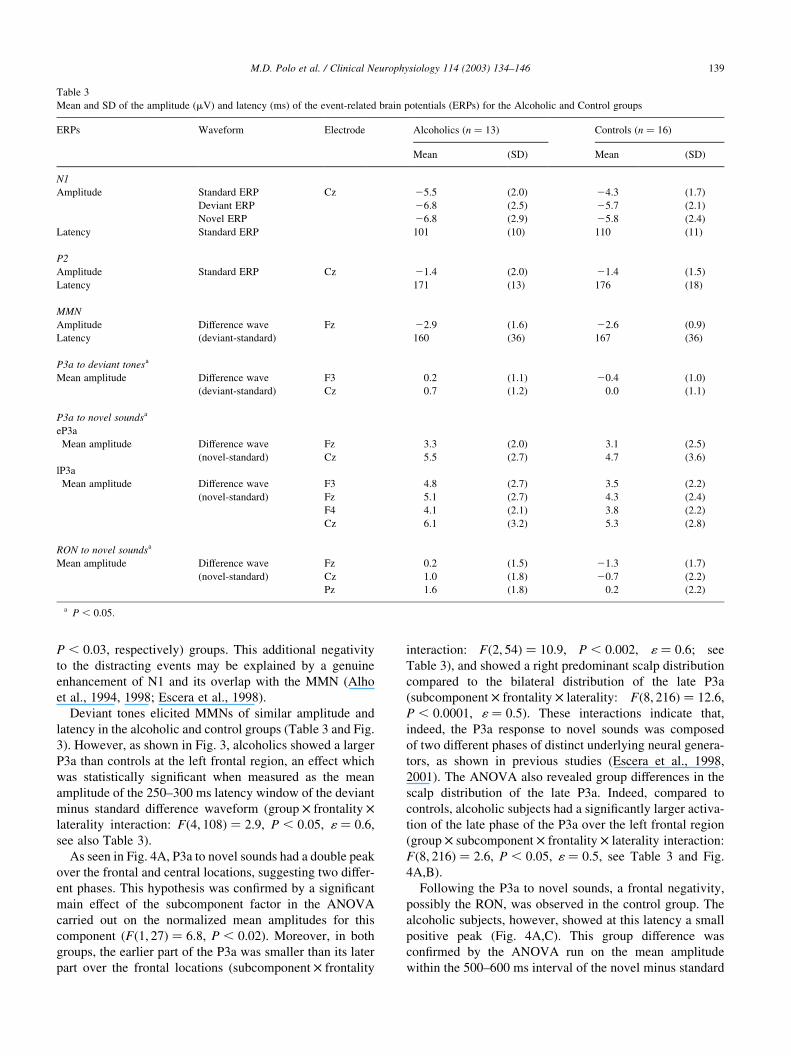
P , 0:03, respectively) groups. This additional negativity
to the distracting events may be explained by a genuine
enhancement of N1 and its overlap with the MMN (Alho
et al., 1994, 1998; Escera et al., 1998).
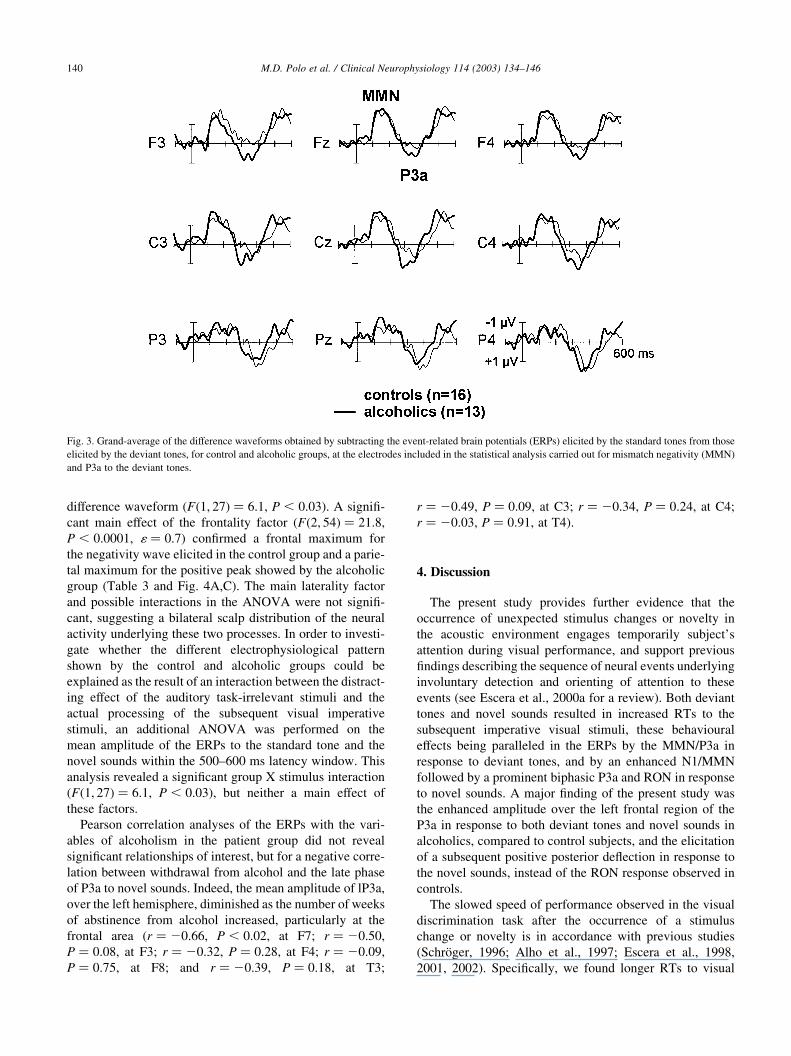
Deviant tones elicited MMNs of similar amplitude and
latency in the alcoholic and control groups (Table 3 and Fig.
3). However, as shown in Fig. 3, alcoholics showed a larger
P3a than controls at the left frontal region, an effect which
was statistically significant when measured as the mean
amplitude of the 250–300 ms latency window of the deviant
minus standard difference waveform (group £ frontality £
laterality interaction: Fð4; 108Þ ¼ 2:9, P , 0:05, 1 ¼ 0:6,
see also Table 3).
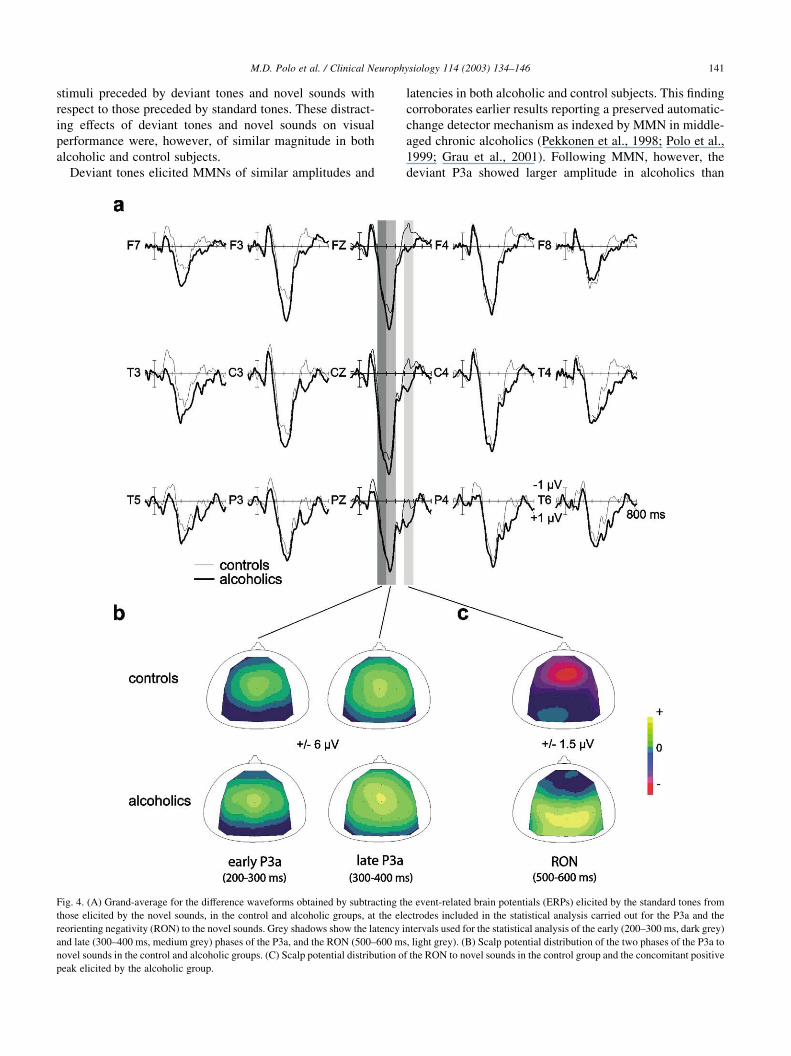
As seen in Fig. 4A, P3a to novel sounds had a double peak
over the frontal and central locations, suggesting two differ-
ent phases. This hypothesis was confirmed by a significant
main effect of the subcomponent factor in the ANOVA
carried out on the normalized mean amplitudes for this
component (Fð1; 27Þ ¼ 6:8, P , 0:02). Moreover, in both
groups, the earlier part of the P3a was smaller than its later
part over the frontal locations (subcomponent £ frontality
interaction: Fð2; 54Þ ¼ 10:9, P , 0:002, 1 ¼ 0:6; see
Table 3), and showed a right predominant scalp distribution
compared to the bilateral distribution of the late P3a
(subcomponent £ frontality £ laterality: Fð8; 216Þ ¼ 12:6,
P , 0:0001, 1 ¼ 0:5). These interactions indicate that,
indeed, the P3a response to novel sounds was composed
of two different phases of distinct underlying neural genera-
tors, as shown in previous studies (Escera et al., 1998,
2001). The ANOVA also revealed group differences in the
scalp distribution of the late P3a. Indeed, compared to
controls, alcoholic subjects had a significantly larger activa-
tion of the late phase of the P3a over the left frontal region
(group £ subcomponent £ frontality £ laterality interaction:
Fð8; 216Þ ¼ 2:6, P , 0:05, 1 ¼ 0:5, see Table 3 and Fig.
4A,B).
Following the P3a to novel sounds, a frontal negativity,
possibly the RON, was observed in the control group. The
alcoholic subjects, however, showed at this latency a small
positive peak (Fig. 4A,C). This group difference was
confirmed by the ANOVA run on the mean amplitude
within the 500–600 ms interval of the novel minus standard
M.D. Polo et al. / Clinical Neurophysiology 114 (2003) 134–146 139
Table 3
Mean and SD of the amplitude (mV) and latency (ms) of the event-related brain potentials (ERPs) for the Alcoholic and Control groups
ERPs Waveform Electrode Alcoholics (n ¼ 13) Controls (n ¼ 16)
Mean (SD) Mean (SD)
N1
Amplitude Standard ERP Cz 25.5 (2.0) 24.3 (1.7)
Deviant ERP 26.8 (2.5) 25.7 (2.1)
Novel ERP 26.8 (2.9) 25.8 (2.4)
Latency Standard ERP 101 (10) 110 (11)
P2
Amplitude Standard ERP Cz 21.4 (2.0) 21.4 (1.5)
Latency 171 (13) 176 (18)
MMN
Amplitude Difference wave Fz 22.9 (1.6) 22.6 (0.9)
Latency (deviant-standard) 160 (36) 167 (36)
P3a to deviant tonesa
Mean amplitude Difference wave F3 0.2 (1.1) 20.4 (1.0)
(deviant-standard) Cz 0.7 (1.2) 0.0 (1.1)
P3a to novel soundsa
eP3a
Mean amplitude Difference wave Fz 3.3 (2.0) 3.1 (2.5)
(novel-standard) Cz 5.5 (2.7) 4.7 (3.6)
lP3a
Mean amplitude Difference wave F3 4.8 (2.7) 3.5 (2.2)
(novel-standard) Fz 5.1 (2.7) 4.3 (2.4)
F4 4.1 (2.1) 3.8 (2.2)
Cz 6.1 (3.2) 5.3 (2.8)
RON to novel soundsa
Mean amplitude Difference wave Fz 0.2 (1.5) 21.3 (1.7)
(novel-standard) Cz 1.0 (1.8) 20.7 (2.2)
Pz 1.6 (1.8) 0.2 (2.2)
a P , 0:05.
difference waveform (Fð1; 27Þ ¼ 6:1, P , 0:03). A signifi-
cant main effect of the frontality factor (Fð2; 54Þ ¼ 21:8,
P , 0:0001, 1 ¼ 0:7) confirmed a frontal maximum for
the negativity wave elicited in the control group and a parie-
tal maximum for the positive peak showed by the alcoholic
group (Table 3 and Fig. 4A,C). The main laterality factor
and possible interactions in the ANOVA were not signifi-
cant, suggesting a bilateral scalp distribution of the neural
activity underlying these two processes. In order to investi-
gate whether the different electrophysiological pattern
shown by the control and alcoholic groups could be
explained as the result of an interaction between the distract-
ing effect of the auditory task-irrelevant stimuli and the
actual processing of the subsequent visual imperative
stimuli, an additional ANOVA was performed on the
mean amplitude of the ERPs to the standard tone and the
novel sounds within the 500–600 ms latency window. This
analysis revealed a significant group X stimulus interaction
(Fð1; 27Þ ¼ 6:1, P , 0:03), but neither a main effect of
these factors.
Pearson correlation analyses of the ERPs with the vari-
ables of alcoholism in the patient group did not reveal
significant relationships of interest, but for a negative corre-
lation between withdrawal from alcohol and the late phase
of P3a to novel sounds. Indeed, the mean amplitude of lP3a,
over the left hemisphere, diminished as the number of weeks
of abstinence from alcohol increased, particularly at the
frontal area (r ¼ 20:66, P , 0:02, at F7; r ¼ 20:50,
P ¼ 0:08, at F3; r ¼ 20:32, P ¼ 0:28, at F4; r ¼ 20:09,
P ¼ 0:75, at F8; and r ¼ 20:39, P ¼ 0:18, at T3;
r ¼ 20:49, P ¼ 0:09, at C3; r ¼ 20:34, P ¼ 0:24, at C4;
r ¼ 20:03, P ¼ 0:91, at T4).
4. Discussion
The present study provides further evidence that the
occurrence of unexpected stimulus changes or novelty in
the acoustic environment engages temporarily subject’s
attention during visual performance, and support previous
findings describing the sequence of neural events underlying
involuntary detection and orienting of attention to these
events (see Escera et al., 2000a for a review). Both deviant
tones and novel sounds resulted in increased RTs to the
subsequent imperative visual stimuli, these behavioural
effects being paralleled in the ERPs by the MMN/P3a in
response to deviant tones, and by an enhanced N1/MMN
followed by a prominent biphasic P3a and RON in response
to novel sounds. A major finding of the present study was
the enhanced amplitude over the left frontal region of the
P3a in response to both deviant tones and novel sounds in
alcoholics, compared to control subjects, and the elicitation
of a subsequent positive posterior deflection in response to
the novel sounds, instead of the RON response observed in
controls.
The slowed speed of performance observed in the visual
discrimination task after the occurrence of a stimulus
change or novelty is in accordance with previous studies
(Schroger, 1996; Alho et al., 1997; Escera et al., 1998,
2001, 2002). Specifically, we found longer RTs to visual
M.D. Polo et al. / Clinical Neurophysiology 114 (2003) 134–146140
Fig. 3. Grand-average of the difference waveforms obtained by subtracting the event-related brain potentials (ERPs) elicited by the standard tones from those
elicited by the deviant tones, for control and alcoholic groups, at the electrodes included in the statistical analysis carried out for mismatch negativity (MMN)
and P3a to the deviant tones.
stimuli preceded by deviant tones and novel sounds with
respect to those preceded by standard tones. These distract-
ing effects of deviant tones and novel sounds on visual
performance were, however, of similar magnitude in both
alcoholic and control subjects.
Deviant tones elicited MMNs of similar amplitudes and
latencies in both alcoholic and control subjects. This finding
corroborates earlier results reporting a preserved automatic-
change detector mechanism as indexed by MMN in middle-
aged chronic alcoholics (Pekkonen et al., 1998; Polo et al.,
1999; Grau et al., 2001). Following MMN, however, the
deviant P3a showed larger amplitude in alcoholics than
M.D. Polo et al. / Clinical Neurophysiology 114 (2003) 134–146 141
Fig. 4. (A) Grand-average for the difference waveforms obtained by subtracting the event-related brain potentials (ERPs) elicited by the standard tones from
those elicited by the novel sounds, in the control and alcoholic groups, at the electrodes included in the statistical analysis carried out for the P3a and the
reorienting negativity (RON) to the novel sounds. Grey shadows show the latency intervals used for the statistical analysis of the early (200–300 ms, dark grey)
and late (300–400 ms, medium grey) phases of the P3a, and the RON (500–600 ms, light grey). (B) Scalp potential distribution of the two phases of the P3a to
novel sounds in the control and alcoholic groups. (C) Scalp potential distribution of the RON to novel sounds in the control group and the concomitant positive
peak elicited by the alcoholic group.
controls, particularly over the left frontal scalp, suggesting
that deviant tones caused a stronger orienting of the atten-
tion among the formers.
In response to novel sounds, chronic alcoholics and
control subjects elicited a larger P3a. In both groups, this
novelty P3a had two different subcomponents, an early one
(eP3a) at 200–300 ms with a central scalp distribution, and a
late one (lP3a) appearing at 300–400 ms with a more frontal
scalp distribution, in agreement with previous findings
(Escera et al., 1998, 2001). However, alcoholic subjects
showed a left predominant distribution over the frontal
regions of their late P3a, contrasting with the bilateral
scalp distribution observed in controls, suggesting an abnor-
mal (augmented) activation of this cerebral region in the
generation of the lP3a. Several studies have documented
the involvement of the left prefrontal region in the encoding
into memory of novel events (Demb et al., 1995), even in
the absence of awareness (Berns et al., 1997). Moreover, a
recent study has shown increased activity in the left prefron-
tal cortex of alcoholic subjects, compared to social drinkers,
in response to alcohol beverage picture cues exposure
(George et al., 2001). This result suggests enhanced atten-
tion to alcohol cues in alcoholic subjects, possibly due to the
higher emotional relevance of those cues among these
subjects. In this framework, the enhancement of the late
P3a to novel sounds found in our study suggests that the
alcoholics were attributing a greater significance and allo-
cating more attentional resources to the novel, distracting
sounds than the control subjects.
Following the P3a to novel sounds, a different pattern of
electrophysiological activity was observed in the 500–600
ms latency range between the alcoholics and controls. In the
control group, a frontal negative wave, the Reorienting
Negativity (RON), was elicited, possibly reflecting the
process of returning attention back to task-relevant stimula-
tion after temporary distraction (Schroger and Wolff, 1998;
Schroger et al., 2000; Berti and Schroger, 2001; Escera et
al., 2001). In contrast, alcoholic subjects showed a small
parietal positive response instead, although the absence of
a identifiable RON response in alcoholics does not necessa-
rily mean that the process was fully abolished in these
subjects, as they did not show any impairment on the visual
task performance. This late positivity observed in alcoholics
could correspond to the P32 described by Friedman et al.
(1993), and therefore may be reflecting a deeper processing
of the novel sounds in alcoholics than in controls. Indeed,
Friedman et al. (1993) found a parietally distributed positive
deflection appearing at 500–600 ms after irrelevant novel
sounds in healthy subjects, and proposed that it may reflect
the encoding into working memory of stimuli that, although
irrelevant for the current task performance were able to
catch the subject’s attention (Friedman et al., 1993; Fabiani
and Friedman, 1995). In fact, the neural generators of P32
may correspond to those underlying the generation of P3b
(Cycowicz and Friedman, 1997), an ERP signal thought to
reflect working memory updating (Donchin and Coles,
1988). The similarities in the latency and scalp distribution
of the late positivity elicited in our alcoholics in response to
novel sounds, and those of the P32 described by Friedman
and collaborators, lead us to suggest that the two responses
may reflect a common neural process. It could be argued
that the effects observed at this latency range (500–600 ms
post-distractor, i.e. 200–300 post-imperative stimulus), may
have arisen from an altered processing of the visual stimuli
or from an interaction between the distraction and the actual
processing of the visual imperative stimuli. Nevertheless,
there are at least two lines of findings that militate against
this argument. First, in a previous study, we showed that the
scalp distribution of the RON response, obtained in a similar
paradigm to that used here, differed from that of the N2 and
P3b elicited to the visual target, indicating different under-
lying processes (Escera et al., 2001). Moreover, in the
present study, a statistical comparison of the ERP elicited
by the standard tone and the novel sounds within the 500–
600 ms latency window did not reveal any group differ-
ences, as it would have been expected if the alcoholics
had processed the visual stimuli in a different way than
the controls. On another hand, as the amount of distraction
associated with the novel sounds was larger than that asso-
ciated to the repetitive tone, a main stimulus effect would be
predicted if the ERPs observed at the above interval were
the result of an interaction between distraction and the
processing of the visual stimuli. However, this prediction
was not confirmed by the statistical analysis.
Taken together, these results -i.e. the enhanced left frontal
late P3a and the parietal positivity replacing in alcoholics
the RON observed in controls, lead us to speculate that our
alcoholic subjects were encoding the novel sounds into
working memory, possibly as a result of a disinhibition of
a frontal executive mechanism. This proposal is based on
several arguments. First, post-mortem and neuroimaging
studies indicate a profound sensitivity of the frontal lobes
to the neurotoxic effects of alcohol (Gurling et al., 1986;
Gilman et al., 1990; Nicolas et al., 1993; Adams et al., 1993;
Kril et al., 1997; Pfefferbaum et al., 1997; Dao-Castellana et
al., 1998). In the second place, it is well known that the
frontal lobe plays a crucial role in the control of the attention
(Fuster, 1989), exerting a modulatory influence in the inhi-
bition of irrelevant inputs (Knight, 1984). Indeed, the inabil-
ity to inhibit the frontal neural network activated
involuntarily by changes in the acoustic background has
been proposed by Ahveninen et al. (2000b) as a possible
interpretation for the enhanced frontal MMN subcomponent
these authors found in recently detoxified alcoholics. More-
over, specific metabolic abnormalities in the left dorsolat-
eral prefrontal cortex of chronic alcoholics without overt
neurological complications have been reported (Dao-
Castellana et al., 1998), and abnormal metabolism and corti-
cal atrophy in the frontal lobes have been found to correlate
with poor performance in tests of attention and executive
functions thought to be served by the frontal brain regions
(Nicolas et al., 1993; Adams et al., 1993; Dao-Castellana et
M.D. Polo et al. / Clinical Neurophysiology 114 (2003) 134–146142
al., 1998). Thereby, it has been suggested that frontal
dysfunction may account for some of the alcohol-related
neuropsychological and behavioural deficits, even in alco-
holics without obvious clinical signs of neurological
damage (Dao-Castellana et al., 1998). Neuropsychological
assessments of alcoholics very often indicate impairment of
‘frontal lobe’ skills such as the ability to inhibit inadequate
responses, categorize and flexible thinking (Parsons et al.,
1972; Tarter, 1976; Nicolas et al., 1993; Dao-Castellana et
al., 1998). Therefore, it seems justified to suggest that the
abnormal (augmented) activation of the left frontal late P3a
in response to irrelevant stimuli during the performance of a
discrimination task, which were likely encoded subse-
quently into working memory, could be a possible explana-
tion for the difficulty shown by chronic alcoholics to inhibit
inadequate responses to novel stimuli in everyday life situa-
tions.
There is evidence that chronic consumption of alcohol
leads to increased number of the excitatory N-methyl-d-
aspartate (NMDA) glutamate receptor in the frontal cortex
(Freund and Anderson, 1996). This up-regulation results in
neuronal hyperexcitability during abstinence episodes, and
may constitute a primary neurochemical mechanism for
chronic alcohol-induced brain damage (Freund and Ander-
son, 1996; see Fadda and Rossetti, 1998 for a review). Like-
wise, reduced GABAA-BZD receptor sites in frontal cortex
have been reported in chronic alcoholics (Freund and
Ballinger, 1988; Gilman et al., 1996), even after 3 months
of abstinence (Lingford-Hughes et al., 1998). Thereby, it is
feasible to argue that the augmented frontal P3a shown by
our alcoholic subjects in response to the novel sounds might
have been subserved by an increased neuroexcitability after
alcohol withdrawal. Direct evidence of the role that the
neurotransmitters glutamate and GABA play in the neural
network subserving attentional processes comes from
animal research (Montero et al., 2001; Burk and Sarter,
2001). In addition, we found that the amplitude of the late
phase of the novelty P3a diminished as the withdrawal
period of the alcoholics became longer, this relationship
being particularly strong over the left frontal area. This
result gives further support to the hypothesis that the abnor-
mal activation of the left frontal area shown by our abstinent
chronic alcoholics reflects an alcohol-induced effect and
suggests that it might revert with prolonged abstinence.
The enhanced P3a found in the alcoholics in the present
study is, nevertheless, in conflict with previous studies
showing reduced amplitudes of this ERP component in
chronic alcoholism (Realmuto et al., 1993; Rodrıguez-
Holguın et al., 1999; Hada et al., 2000). The different result
between the present and previous studies may have resulted
from stimulus and task differences. Indeed, in one of these
studies, irrelevant standard and deviant (20%) tones were
presented to the subjects while reading a magazine of their
choice (Realmuto et al., 1993). In other studies, a visual
(Rodrıguez-Holguın et al., 1999) or auditory (Hada et al.,
2000) 3-stimulus oddball task was used, with the subjects
being required to give a motor response to infrequent target
stimuli (10%) which were highly similar to standard (80%)
stimuli, and to ignore clearly different infrequent non-target
stimuli (10%). There is evidence that the degree of atten-
tional orienting to infrequent task-irrelevant stimuli is
related to the magnitude of their deviance (Escera et al.,
1998; Schroger et al., 2000) and to the stimulus context
(Katayama and Polich, 1998; Jeon and Polich, 2001), and
that this is reflected in P3a amplitude. Moreover, it has been
claimed that the P3a wave elicited by different types of
infrequent task-irrelevant stimuli (i.e. infrequent stimuli in
a passive condition, physically novel stimuli, or infrequent-
nontarget stimuli in a 3-item or more oddball task) may not
necessarily reflect an identical and unique processing opera-
tion (see Katayama and Polich, 1998). Therefore, methodo-
logical differences between these studies make difficult the
comparison of results.
The enhanced P3a observed in the alcoholics gives
support to the study’s hypothesis predicting an abnormal
orienting of attention to unexpected changes in the unat-
tended acoustic environment as result of chronic exposure
of the brain to alcohol. However, the neurophysiological
findings were not paralleled by the behavioural data. It
has been suggested that some patients with physiological
impairment may compensate for this by increasing mental
effort to maintain ‘normal’ performance during limited time
periods (Veltman et al., 1996), particularly in challenging
situations, like in an experimental setting. Thus, they may
perform normally in neuropsychological or behavioural
tasks, but suffer remarkable attention difficulties in everyday
life. Therefore, P3a and the other ERP responses examined
in the present study may provide a more direct index for
assessing distractibility than neuropsychological and beha-
vioural measures, and a sensitive marker of alcohol-related
effects on frontal cortex function. If that, ERPs might
provide an additional tool for the diagnosis and monitoring
of attentional difficulties, since they have been found to be
rather stable (Pekkonen et al., 1995; Escera and Grau, 1996;
Escera et al., 2000b; Joutsiniemi et al., 1997; Fabiani et al.,
1998; Tervaniemi et al., 1999; Schroger et al., 2000). Never-
theless, more research aimed to assess the individual replic-
ability and variability of these measures is needed before
they can be introduced in routine clinical practice.
Acknowledgements
This study was supported by BIOMED-2 contract
BMH4-CT96-0819-COBRAIN of the European Union,
grant UE96-0038 from the Spanish Ministry of Science
and Technology, and grants SGR1999-00264 and
1998XT-00046/2000XT-00021 from the Generalitat de
Catalunya. The authors thank Intoximeter Inc. and Rasfer
S.A. for lending us the RBT IV breathalyzer model used,
and Maria Jose Corral for her assistance in the subject’s
recruitment and the preparation of the paper illustrations.
M.D. Polo et al. / Clinical Neurophysiology 114 (2003) 134–146 143
References
Adams KM, Gilman S, Koeppe RA, Kluin KJ, Brunberg JA, Dede D,
Berent S, Kroll PD. Neuropsychological deficits are correlated with
frontal hypometabolism in positron emission tomography studies of
older alcoholic patients. Alcohol Clin Exp Res 1993;17:205–210.
Ahveninen J, Jaaskelainen IP, Pekkonen E, Hallberg A, Hietanen M,
Makela R, Naatanen R, Sillanaukee P. Suppression of mismatch nega-
tivity by backward masking predicts impaired working-memory perfor-
mance in alcoholics. Alcohol Clin Exp Res 1999;23:1507–1514.
Ahveninen J, Escera C, Polo MD, Grau C, Jaaskelainen IP. Acute and
chronic effects of alcohol on preattentive auditory processing as
reflected by mismatch negativity. Audiol Neurootol 2000a;5:303–311.
Ahveninen J, Jaaskelainen IP, Pekkonen E, Hallberg A, Hietanen M, Naata-
nen R, Schroger E, Sillanaukee P. Increased distractibility by task-irre-
levant sound changes in abstinent alcoholics. Alcohol Clin Exp Res
2000b;24:1850–1854.
Alho K. Cerebral generators of mismatch negativity (MMN) and its
magnetic counterpart (MMNm) elicited by sound changes. Ear Hear
1995;16:38–51.
Alho K, Woods DL, Algazi A, Knight RT, Naatanen R. Lesions of frontal
cortex diminish the auditory mismatch negativity. Electroenceph clin
Neurophysiol 1994;91:353–362.
Alho K, Escera C, Dıaz R, Yago E, Serra JM. Effects of involuntary audi-
tory attention on visual task performance and brain activity. Neurore-
port 1997;8:3233–3237.
Alho K, Winkler I, Escera C, Huotilainen M, Virtanen J, Jaaskelainen IP,
Pekkonen E, Ilmoniemi RJ. Processing of novel sounds and frequency
changes in the human auditory cortex: magnetoencephalographic
recordings. Psychophysiology 1998;35:211–224.
Atienza M, Cantero JL, Escera C. Auditory information processing during
human sleep as revealed by event-related brain potentials. Clin Neuro-
physiol 2001;112:2031–2045.
Beck AT, Ward CH, Mendelson M, Mock J, Erbaugh J. An inventory for
measuring depression. Arch Gen Psychiat 1961;4:561–571.
Berns GS, Cohen JD, Mintun MA. Brain regions responsive to novelty in
the absence of awareness. Science 1997;276:1272–1275.
Berti S, Schroger E. A comparison of auditory and visual distraction effects:
behavioural and event-related indices. Cogn Brain Res 2001;10:265–
273.
Biggins CA, MacKay S, Poole N, Fein G. Delayed P3a in abstinent elderly
male chronic alcoholics. Alcohol Clin Exp Res 1995;19:1032–1042.
Burk JA, Sarter M. Dissociation between the attentional functions mediated
via basal forebrain cholinergic and gabaergic neurons. Neuroscience
2001;105:899–909.
Cadaveira F, Grau C, Roso M, Sanchez-Turet M. Multimodality explora-
tion of event-related potentials in chronic alcoholics. Alcohol Clin Exp
Res 1991;15:607–611.
Carlen PL, Wilkinson DA, Wortzman G, Holgate R, Cordingley J, Lee MA,
Huszar L, Moddel G, Singh R, Kiraly L, Rankin JG. Cerebral atrophy
and functional deficits in alcoholics without clinically apparent liver
disease. Neurology 1981;31:377–385.
Cheour M, Leppanen PHT, Kraus N. Mismatch negativity (MMN) as a tool
for investigating auditory discrimination and sensory memory in infants
and children. Clin Neurophysiol 2000;111:4–16.
Courchesne E, Hillyard SA, Galambos R. Stimulus novelty, task relevance
and the visual evoked potential in man. Electroenceph clin Neurophy-
siol 1975;39:131–143.
Csepe V, Karmos G, Molnar M. Evoked potential correlates of stimulus
deviance during wakefulness and sleep in cat: animal model of
mismatch negativity. Electroenceph clin Neurophysiol 1987;66:571–
578.
Csepe V, Pantev C, Hoke M, Hampson S, Ross B. Evoked magnetic
responses of the human auditory cortex to minor pitch changes: locali-
zation of the mismatch field. Electroenceph clin Neurophysiol
1992;84:538–548.
Cycowicz YM, Friedman D. A developmental study of the effect of
temporal order on the ERPs elicited by novel environmental sounds.
Electroenceph clin Neurophysiol 1997;103:304–318.
Dao-Castellana MH, Samson T, Legault F, Martinot JL, Aubin HJ, Crouzel
C, Feldman L, Barrucand D, Rancurel G, Feline A, Syrota A. Frontal
dysfunction in neurologically normal chronic alcoholic subjects: meta-
bolic and neuropsychological findings. Psychol Med 1998;28:1039–
1048.
Demb JB, Desmond JE, Wagner AD, Vaidya CJ, Glover GH, Gabrieli JD.
Semantic encoding and retrieval in the left inferior prefrontal cortex: a
functional MRI study of task difficulty and process specificity. J
Neurosci 1995;15:5870–5878.
Deouell LY, Bentin S, Giard MH. Mismatch negativity in dichotic listen-
ing: evidence for interhemispheric differences and multiple generators.
Psychophysiology 1998;35:355–365.
Donchin E, Coles MGH. Is the P300 component a manifestation of context
updating? Behav Brain Sci 1988;11:357–374.
Escera C, Grau C. Short-term replicability of the mismatch negativity.
Electroenceph clin Neurophysiol 1996;100:549–554.
Escera C, Alho K, Winkler I, Naatanen R. Neural mechanisms of involun-
tary attention to acoustic novelty and change. J Cogn Neurosci
1998;10:590–604.
Escera C, Alho K, Schroger E, Winkler I. Involuntary attention and distract-
ibility as evaluated with event-related brain potentials. Audiol Neuroo-
tol 2000a;5:151–166.
Escera C, Yago E, Polo MD, Grau C. The individual replicability of
mismatch negativity at short and long inter-stimulus intervals. Clin
Neurophysiol 2000b;111:546–551.
Escera C, Yago E, Alho K. Electric responses reveal the temporal dynamics
of brain events during involuntary attention switching. Eur J Neurosci
2001;14:877–883.
Escera C, Corral MJ, Yago E. An electrophysiological and behavioral
investigation of involuntary attention towards auditory frequency, dura-
tion and intensity changes. Cogn Brain Res 2002;14:325–332.
Fabiani M, Friedman D. Changes in brain activity patterns in aging: the
novelty oddball. Psychophysiology 1995;32:579–594.
Fabiani M, Friedman D, Cheng JC. Individual differences in P3 scalp
distribution in older adults, and their relationship to frontal lobe func-
tion. Psychophysiology 1998;35:698–708.
Fadda F, Rossetti ZL. Chronic ethanol consumption: from neuroadaptation
to neurodegeneration. Prog Neurobiol 1998;56:385–431.
Freund G, Anderson KJ. Glutamate receptors in the frontal cortex of alco-
holics. Alcohol Clin Exp Res 1996;20:1165–1172.
Freund G, Ballinger WE. Decrease of benzodiazepine receptors in frontal
cortex of alcoholics. Alcohol 1988;5:275–282.
Friedman D, Simpson G, Hamberger M. Age-related changes in scalp
topography to novel and target stimuli. Psychophysiology
1993;30:383–396.
Fuster J. The prefrontal cortex: anatomy, physiology, and neuropsychology
of the frontal lobe, New York: Raven, 1989.
George MA, Anton RF, Bloomer C, Teneback C, Drobes DJ, Lorberbaum
JP, Nahas Z, Vincent DJ. Activation of prefrontal cortex and anterior
thalamus in alcoholic subjects on exposure to alcohol-specific cues.
Arch Gen Psychiat 2001;58:345–352.
Giard MH, Perrin F, Pernier J, Bouchet P. Brain generators implicated in
the processing of auditory stimulus deviance: a topographic event-
related potential study. Psychophysiology 1990;27:627–640.
Gilman S, Adams K, Koeppe RA, Berent S, Kluin KJ, Modell JG, Kroll P,
Brunberg JA. Cerebellar and frontal hypometabolism in alcoholic cere-
bellar degeneration studied with positron emission tomography. Ann
Neurol 1990;28:775–785.
Gilman S, Koeppe RA, Adams K, Johnson-Greene D, Junck L, Kluin KJ,
Brunberg J, Martorello S, Lohman M. Positron emission tomographic
studies of cerebral benzodiazepine-receptor binding in chronic alco-
holics. Ann Neurol 1996;40:163–171.
Grau C, Polo MD, Yago E, Gual A, Escera C. Auditory sensory memory as
M.D. Polo et al. / Clinical Neurophysiology 114 (2003) 134–146144
indicated by mismatch negativity in chronic alcoholism. Clin Neuro-
physiol 2001;112:728–731.
Gurling HMD, Murray RM, Ron MA. Increased brain radiodensity in alco-
holism. A co-twin control study. Arch Gen Psychiatry 1986;43:764–
767.
Hada M, Porjesz B, Begleiter H, Polich J. Auditory P3a assessment of male
alcoholics. Biol Psychiatry 2000;48:276–286.
Halgren E, Baudena P, Clarke JM, Heit G, Liegeois C, Chauvel P, Musolino
A. Intracerebral potentials to rare target and distractors auditory and
visual stimuli. I. Superior temporal plane and parietal lobe. Electroen-
ceph clin Neurophysiol 1995;94:191–220.
Jasper HH. The ten-twenty electrode system of the International Federation.
Electroenceph clin Neurophysiol 1958;10:371–375.
Javitt DC, Shroeder CE, Steinschneider M, Arezzo JC, Vaughan Jr HG.
Demonstration of mismatch negativity in the monkey. Electroenceph
clin Neurophysiol 1992;83:87–90.
Jeon YW, Polich J. P3a from a passive visual stimulus task. Clin Neuro-
physiol 2001;112:2202–2208.
Jernigan TL, Butters N, Di Traglia G, Schafer K, Smith T, Irwin M, Grant I,
Schuckit M, Cermak LS. Reduced cerebral grey matter observed in
alcoholics using magnetic resonance imaging. Alcohol Clin Exp Res
1991;15:418–427.
Joutsiniemi SL, Ilvonen T, Sinkkonen J, Huotilainen M, Tervaniemi M,
Lehtokoski A, Rinne T, Naatanen R. The mismatch negativity for dura-
tion decrement of auditory stimuli in healthy subjects. Electroenceph
clin Neurophysiol 1997;108:154–159.
Kane NM, Curry SH, Butler SR, Cummins BH. Electrophysiological indi-
cators of awakening from coma. Lancet 1993;341:688.
Kathmann N, Wagner M, Rendtorff N, Engel R. Delayed peak latency of
the mismatch negativity in schizophrenics and alcoholics. Biol Psychia-
try 1995;37:754–757.
Katayama J, Polich J. P300, probability, and the three-tone paradigm. Elec-
troenceph clin Neurophysiol 1996;100:555–562.
Katayama J, Polich J. Stimulus context determines P3a and P3b. Psycho-
physiology 1998;35:23–33.
Knight RT. Decreased response to novel stimuli after prefrontal lesions in
man. Electroenceph clin Neurophysiol 1984;59:9–20.
Knight RT. Contribution of human hippocampal region to novelty detec-
tion. Nature 1996;383:256–259.
Knight RT, Scabini D. Anatomic bases of event-related potentials and their
relationship to novelty detection in humans. Electroenceph clin Neuro-
physiol 1998;15:3–13.
Kril JJ, Halliday GM, Svoboda MD, Cartwright H. The cerebral cortex is
damaged in chronic alcoholics. Neuroscience 1997;79:983–998.
Lingford-Hughes AR, Acton PD, Gacinovic S, Suckling J, Busatto GF,
Boddington SJ, Bullmore E, Woodruff PW, Costa DC, Pilowsky LS,
Ell PJ, Marshall EJ, Kerwin RW. Reduced level of GABA-benzodia-
zepine receptor in alcohol dependency in the absence of grey matter
atrophy. Br J Psychiatry 1998;173:116–122.
Loewy DH, Campbell KB, Bastien C. The mismatch negativity to
frequency deviant stimuli during natural sleep. Electroenceph clin
Neurophysiol 1996;98:493–501.
McCarthy G, Wood CC. Scalp-distributions of event-related potentials: an
ambiguity associated with analysis of variance models. Electroenceph
clin Neurophysiol 1985;62:203–208.
Molnar M, Skinner JE, Csepe V, Winkler I, Karmos G. Correlation dimen-
sion changes accompanying the occurrence of mismatch negativity and
the P3a event-related potential component. Electroenceph clin Neuro-
physiol 1995;95:118–126.
Montero VM, Wright LS, Siegel F. Increased glutamate, GABA and gluta-
mine in lateral geniculate nucleus but not in medial geniculate nucleus
caused by visual attention to novelty. Brain Res 2001;916:152–158.
Naatanen R. Attention and brain function, Hillsdale, NJ: Lawrence
Erlbaum, 1992.
Naatanen R, Gaillard AWK, Mantysalo S. Early selective-attention effect
on evoked potential reinterpreted. Acta Psychol 1978;42:313–329.
Nicolas JM, Catafau AM, Estruch R, Lomena FJ, Salamero M, Herranz R,
Monforte R, Cardenal C, Urbano-Marquez A. Regional cerebral blood
flow-SPECT in chronic alcoholism: relation to neuropsychological test-
ing. J Nucl Med 1993;34:1452–1459.
Oldfield RC. The assessment and analysis of handedness: the Edinburgh
Inventory. Neuropsychologia 1971;9:97–113.
Paavilainen P, Karlsson ML, Reinikainen K, Naatanen R. Mismatch nega-
tivity to change in spatial location of an auditory stimulus. Electroen-
ceph clin Neurophysiol 1989;78:464–479.
Parsons OA, Tarter RE, Edelberg R. Altered motor control in chronic
alcoholics. J Abnorm Psychol 1972;80:308–314.
Patterson BW, Williams HL, McLean GA, Smith LT, Schaeffer KW. Alco-
holism and family history of alcoholism: effects on visual and auditory
event-related potentials. Alcohol 1987;4:265–274.
Pekkonen E, Rinne T, Naatanen R. Variability and replicability of the
mismatch negativity. Electroenceph clin Neurophysiol 1995;87:321–
325.
Pekkonen E, Ahveninen J, Jaaskelainen IP, Seppa K, Naatanen R, Silla-
naukee P. Selective acceleration of auditory processing in chronic alco-
holics during abstinence. Alcohol Clin Exp Res 1998;22:605–609.
Pfefferbaum A, Lim KO, Zipursky RB, Mathalon D. Event-related poten-
tials in alcoholic men: P3 amplitude reflects family history but not
alcohol consumption. Alcohol Clin Exp Res 1991;15:39–50.
Pfefferbaum A, Sullivan EV, Mathalon DH, Lim KO. Frontal lobe volume
loss observed with magnetic resonance imaging in older chronic alco-
holics. Alcohol Clin Exp Res 1997;21:521–529.
Polo MD, Escera C, Gual A, Grau C. Mismatch negativity and auditory
sensory memory in chronic alcoholics. Alcohol Clin Exp Res
1999;23:1744–1750.
Porjesz B, Begleiter H, Rawlings R, Eckardt M. Auditory recovery function
and P3 in abstinent alcoholics. Alcohol Alcohol 1988;23:A41.
Realmuto G, Begleiter H, Odencratz J, Porjesz B. Event-related potential
evidence of dysfunction in autonomic processing in abstinent alco-
holics. Biol Psychiatry 1993;33:594–601.
Rinne T, Alho K, Ilmoniemi RJ, Virtanen J, Naatanen R. Separate time
behaviors of the temporal and frontal mismatch negativity sources.
Neuroimage 2000;12:14–19.
Rodrıguez-Holguın S, Porjesz B, Chorlian DB, Polich J, Begleiter H. Visual
P3a in male alcoholics and controls. Alcohol Clin Exp Res
1999;23:582–591.
Sams M, Paavilainen P, Alho K, Naatanen R. Auditory frequency discri-
mination and event-related potentials. Electroenceph clin Neurophysiol
1985;62:437–448.
Sasaki T, Campbell KB, Bazana PG, Stelmack RM. Individual differences
in mismatch negativity measures of involuntary attention shift. Clin
Neurophysiol 2000;111:1553–1560.
Schroger E. A neural mechanism for involuntary attention shifts to changes
in auditory stimulation. J Cogn Neurosci 1996;8:527–539.
Schroger E, Wolff C. Attentional orienting and reorienting is indicated by
human event-related brain potentials. Neuroreport 1998;9:3355–3358.
Schroger E, Giard MH, Wolff C. Auditory distraction: event-related poten-
tial and behavioral indices. Clin Neurophysiol 2000;111:1450–1460.
Sharma A, Kraus N, McGee T, Carrell T, Nicol T. Acoustic versus phonetic
representation of speech as reflected by the mismatch negativity event-
related potential. Electroenceph clin Neurophysiol 1993;88:64–71.
Squires NK, Squires KC, Hillyard SA. Two varieties of long-latency posi-
tive waves evoked by unpredictable auditory stimuli. Electroenceph
clin Neurophysiol 1975;38:387–401.
Tarter RE. Neuropsychological investigations of alcoholism. In: Goldstein
G, Neuringer C, editors. Empirical studies of alcoholism, Cambridge,
MA: Ballinger, 1976. p. 231.
Tervaniemi M, Lehtokoski A, Sinkkonen J, Virtanen J, Ilmoniemi R,
Naatanen R. Test-retest reliability of mismatch negativity for duration,
frequency and intensity changes. Clin Neurophysiol 1999;110:1388–
1393.
Veltman JC, Brouwer WH, Van Zomeren AH, Van Wolffelaar PC. Central
executive aspects of attention in subacute severe and very severe closed
M.D. Polo et al. / Clinical Neurophysiology 114 (2003) 134–146 145

head injury patients: planning, inhibition, flexibility, and divided atten-
tion. Neuropsychology 1996;10:357–367.
Woods DL, Alho K, Algazi A. Intermodal selective attention/I/Effects on
event-related potentials to lateralized auditory and visual stimuli. Elec-
troenceph clin Neurophysiol 1992;82:341–355.
Yago E, Escera C, Alho K, Giard MH. Cerebral mechanisms underlying
orienting of attention towards auditory frequency changes. Neuroreport
2001;12:2583–2587.
Yamaguchi S, Knight RT. P300 generation by novel somatosensory stimuli.
Electroenceph clin Neurophysiol 1991;78:50–55.
M.D. Polo et al. / Clinical Neurophysiology 114 (2003) 134–146146
Related Documents


