FACULTY OF ELECTRICAL ENGINEERING UNIVERSITY OF BANJA LUKA VOLUME 6, NUMBER 2, ECEMBER 20 2 1 D 1 ELECTRONICS

Welcome message from author
This document is posted to help you gain knowledge. Please leave a comment to let me know what you think about it! Share it to your friends and learn new things together.
Transcript

FACULTY OF ELECTRICAL ENGINEERING
UNIVERSITY OF BANJA LUKA
VOLUME 6, NUMBER 2, ECEMBER 20 21 D 1
ELECTRONICS

F A C U L T Y O F E L E C T R I C A L E N G I N E E R I N G U N I V E R S I T Y O F B A N J A L U K A Address: Patre 5, 78000 Banja Luka, Bosnia and Herzegovina Phone: +387 51 211824 Fax: +387 51 211408
E L E C T R O N I C S Web: www.electronics.etfbl.net E-mail: [email protected]
Editor-in-Chief: Branko L. Dokić, Ph. D.
Faculty of Electrical Engineering University of Banja Luka, Bosnia and Herzegovina E-mail: [email protected]
International Editorial Board: • Goce Arsov, St. Cyril and Methodius University, Skopje, Republic of Macedonia • Petar Biljanović, University of Zagreb, Croatia • Milorad Božić, University of Banja Luka, Bosnia and Herzegovina • Đemal Kolonić, University of Banja Luka, Bosnia and Herzegovina • Vladimir Katić, University of Novi Sad, Serbia • Vančo Litovski, University of Niš, Serbia • Danilo Mandić, Imperial College, London, United Kingdom • Vojin Oklobdžija, University of Texas at Austin, USA • Zorica Pantić, Wentworth Institute of Technology, Boston, USA • Aleksandra Smiljanić, University of Belgrade, Serbia • Slobodan Vukosavić, University of Belgrade, Serbia • Volker Zerbe, Technical University of Ilmenau, Germany • Mark Zwoliński, University of Southampton, United Kingdom • Deška Markova, Technical University of Gabrovo • Chakresh Kumar, Galgotias College of Engineering and Technology, Greater Noida, India
Secretary: Mladen Knežić, M.Sc. E-mail: [email protected]
Željko Ivanović, M.Sc. E-mail: [email protected]
Publisher: Faculty of Electrical Engineering University of Banja Luka, Bosnia and Herzegovina Address: Patre 5, 78000 Banja Luka, Bosnia and Herzegovina Phone: + 387 51 211824 Fax: + 387 51 211408 Web: www.etfbl.net
Number of printed copies: 100

ELECTRONICS, VOL. 16, NO. 2, DECEMBER 2012
DOI: 10.7251/ELS1216120V
120
Abstract—Sustainable growth in energy consumption requires
transition to clean and green energy sources and energy systems. Environment friendly and renewable energy systems deal with electrical energy and rely on efficient electrical power converters. High power electronics is the key technology to deal with the next generation of electrical energy systems. The door to future breakthroughs in high power electronics is opened by major improvement in semiconductor power devices and their packaging technologies. New materials allow for much higher junction temperatures and higher operating voltages. Most importantly, advanced power semiconductor devices and novel converter topology open the possibility to increase the energy efficiency of power conversion and reduce the amount of heat. Although the waste heat created by high power converters can be put to use by adding on to heating systems, this option is not always available and the conversion losses are mostly wasted. At the same time, wasted heat is a form of pollution that threatens the environment. Another task for high power converters is efficient harvesting of renewable energy sources, such as the wind energy and the sun. Intermittent in nature, they pose a difficult task to power converter topology and controls. Eventually, high power converters are entering power distribution and transmission networks. With their quick reaction, with fast communication between the grid nodes and with advanced controllability of high power converters, a number of innovations can be introduced, facilitating the power system control and allowing for optimizations and loss reduction. Coined smart grid, this solution comprises two key elements, and these are intelligent controls and large static power converters. At virtually no cost, smart grids allow for a better utilization of available resources and it enlarges the stable operating range of the transmission systems. Therefore, it is of interest to review the future trends in designing high power converters.
Index Terms—Energy efficiency, high power electronics, high power converters, renewables.
I. INTRODUCTION OWER converters include electric motors and generators, which perform electromechanical conversion, and also
static power converters, power electronic devices that perform DC/DC Conversion (chopper), DC/AC conversion (inverters),
Manuscript received 30 November 2012. Accepted for publication 10
December 2012. Some results of this paper were presented at the 16th International Symposium Power Electronics, Novi Sad, Serbia, October 26-28, 2011.
S. N. Vukosavić is with the University of Belgrade, Electrical Engineering Faculty, Belgrade, Serbia (e-mail: [email protected]).
AC/DC conversion (rectifiers) and AC/AC conversion (cycloconverters). Recent demands increase the required voltage level, rated power, efficiency and functionality of static power converters. From the consumer side, there are requirements for electronic speed control of electric motors in consumer devices, with the goal to achieve savings in energy, copper and iron, as well as to increase functionality and introduce advances diagnostics and sensing. Power converters are used to control power in lighting, heat sources, fans and other consumer devices. From the power source side, new topologies of power converters and new types of electric machines are used in production, transmission and distribution of electrical energy. Power inverters rated hundreds of kilowatts or several megawatts are used to facilitate the grid connection of generators and sources that use tidal, wave, wind, solar, geothermal energy and other forms of renewable energy.
New applications of electrical machines and static power converters require a different approach to conceiving and designing conversion systems and its components. A word on electrical machines, where conventional use of motors and generators was to establish grid connection and engage the operation at line frequency. Most recent applications of electrical machines involves the connection to the primary source (grid) through a static power converter that serves as the energy interface and fine-tunes the voltage and current waveforms supplied to electrical machine. The static power converter placed between the grid and the machine adapts the nature and form of voltages and currents in a way that increases energy efficiency and allows usage of motor (generator) with less copper and iron. This new approach to interfacing the grid and electrical machines opened the door to designing novel kinds and types of electric machines that cannot operate from the mains, such as the SR motors. The converter systems for use of tidal energy, wave and wind power require generators designed for a very low speed and high values of electromagnetic torque. On the other hand, generators connected to the gas turbines, as well as the motors in some electrical vehicles are spinning faster than 20,000 rpm. In these applications, it is necessary to design and apply the static power converters that provide the interface between low speed (or high speed) machine and the mains or grid. With electrical machines operating at extremely high speed, it is necessary to use new types of ferromagnetic materials that
Designing Energy Conversion Systems for the Next Decade
Slobodan N. Vukosavić
P
ELECTRONICS, VOL. 16, NO. 2, DECEMBER 2012 121
can operate in regimes B>1 T f> 1 kHz. In addition, it is necessary to find new forms of magnetic circuits to achieve the desired characteristics and to reduce losses in the conversion. Finally, the applications with low-speed generators should be designed for a reduced volume and reduced inertia of the rotor.
Parallel to the development of new types of electric machines, it is necessary to make a breakthrough in the field of power converters. Most current controlled PWM inverters, rectifiers, choppers and AC/AC converters with conventional topologies have relatively high dV/dt and di/dt, which leads to isolation stress, accelerated aging, reduced reliability, high losses and problems with EMI and EMC. It is therefore necessary to develop converter topologies that mitigate the stresses, reduce losses and prolong life expectancy. In the power transmission systems and distribution there is a need for new power semiconductor switches and converter topologies ready to work with power levels in excess to several tens of MW and with voltages of several tens of kV. These characteristics are required from grid-side converters that provide interface to wind generators and solar power plants. The same characteristics are also required from static compensators of reactive power. Even larger power and voltage ratings are encountered in high voltage DC power transmission.
This paper discusses the need for develop advanced electromechanical and static converters and discusses the features and solutions that should be reached. The arguments that go in favor of intensifying scientific research in this area and increasing investments are numerous. Amongst them, rapid depletion of resources, problems with pollution and degradation of the environment, and, indirectly, growing problems of health, education and security. There are also issues that could negatively affect the pace of further development, such as the tendency of governments, regulatory bodies and companies to focus on short-term goals.
II. IMMEDIATE CHALLENGES
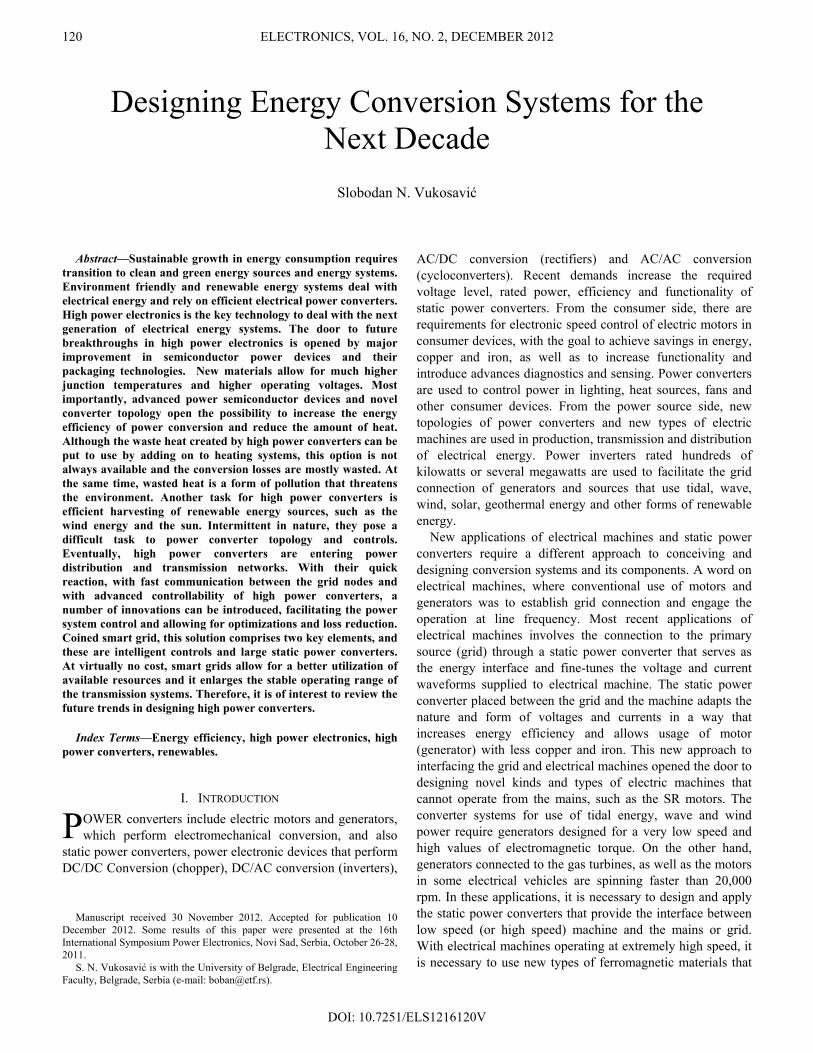
Several applications require novel approach to designing static power converters and electrical machines. In the field of electrical vehicles, it is necessary to design electronically controlled speed controlled and position controlled systems for electrically assisted vehicles and their main and auxiliary functions. The operation involves elevated temperatures, large mechanical stress, increase reliability and long life expectancy. What is also required is a compact, low cost, low weigh, high efficiency traction system for hybrid electric vehicles and zero emission vehicles. The traction system comprises power electronic devices, advanced traction motors, energy storage devices, and endotermic devices hooked to electrical generators. One of hot applications is KERS, Kinetic Energy Recovery System, device that assists the vehicles with endotermic motors. The role of KERS is to get enabled during braking intervals. It should acquire the kinetic energy of the braking vehicle and convert it into electrical energy by means of a high speed generator. The energy should be stored in super capacitor or in a battery back. Later on, during acceleration periods, the acquired energy can be advantageously used to boost the acceleration. At first used only in sports vehicles, KERS system enters the arena of commercial vehicles. Proper design requires an advanced electrical machine and high efficiency static power converter.
The concept that nowadays catches attention of investors is V2G-G2V. It has to do with hybrid and electrical vehicles with battery pack aboard. The use of V2G concept is in providing a low cost energy accumulation alternative to electric power transmission and distribution utilities. Namely, one of main problems in efficient use of renewable energy today is a feeble capability of the grid to accumulate the energy. It is well known that the energy production has to meet the demand without exception. Any imbalance of the two can be alleviated only by means of energy accumulation. With excessive production that cannot be put down quickly, the energy can be stored for future use. A sudden step of the demand that cannot be followed by an adequate increase in production is a problem that can be solved by drawing
Fig. 1. V2G (Vehicle to grid) system.
ELECTRONICS, VOL. 16, NO. 2, DECEMBER 2012 122
accumulated energy from the energy storage device or system. Traditional storage solutions involve reversible hydro power plants and these are rather costly. The use of renewables such as the wind or sun power plants introduce another source of variable power, uncorrelated to the demand. This emphasizes the need for energy accumulation in the system. V2G concept provides a low cost accumulator.
In return for a lower cost of electrical energy or other benefits, power utilities can straighten a number of contracts with owners of electrical vehicles that employ battery packs on board. What is technically required is that chargers of these traction batteries have a communication device that receives remote commands from power utility control center. Most of such vehicles stay parked and connected to the grid for extended periods of time, said periods being considerably longer than the time needed to charge the battery. In most cases, expected time when the user will have the need to use the vehicle is known in advance. Therefore, in the case of an immediate energy demand, the power utility controls can issue a remote command that puts a required number of battery chargers in “discharge” mode. In this mode, accumulated energy is going to be pumped into the grid. Later on, having dealt with the demand, the batteries can be recharged again.
Another requirement imposed on power electronic devices is the need to increase the bandwidth of high performance servo drives. This can be done by reducing the control cycle time and, therefore, reducing the PWM period. An increase PWM frequency contributes to commutation power losses in power semiconductor switches. Therefore, a number of topologies is been under consideration, aiming to provide commutations with reduced losses, such as the resonant or quasi-resonant DC link topologies and similar.
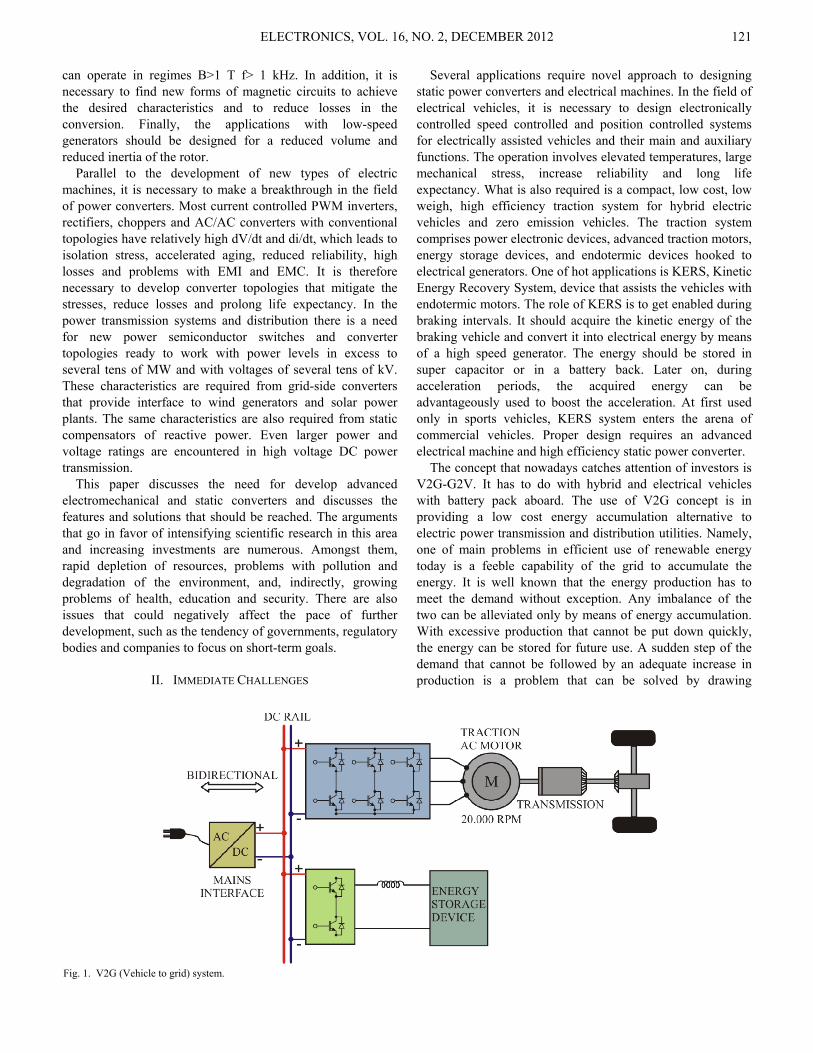
Grid-interface power converters are mostly three phase inverters that interface the mains and deliver the power obtained from the intermediate DC link circuit. Depending on the power rating, grid inverters can be conventional three-phase two-level IGBT bridges, or, for larger voltage and power ratings, multilevel inverters which provide quasi-sinusoidal waveforms with reduced switching frequency. The DC-link power is obtained by exploiting tidal energy, wind energy, solar energy, geothermal energy and similar. With tidal and wind energy, the source is mechanical power which is converter to electrical energy by means of a electrical machine. Another inverter is used between the electrical machine terminals and the DC-link circuit (see Fig. 2) to
provide the power interface. Namely, the current waveforms of the generator are shaped so as to reach the operation point with maximum efficiency. Rather stringent regulations when it comes to total harmonic distortion of the line current and parasitic DC component of the line current pose a difficult task to designers.
III. LONG TERM CHALLENGES Considering the fact that energy related problems becomes
the key issue worldwide, it is likely that the importance of power conversion and power electronics will grow further. Energy issues are closely related to environmental issues. Besides notorious air pollution problems related to coal-fired thermal power plants, radiation leakage coming from nuclear power plants and side effects of hydro power, it is widely accepted that the waste heat itself presents one of major pollution constituents. Considering electrical power, the heat arises from power losses in electrical generators, transformers, transmission lines, as well as from consumer devices that run on electrical power. Even nowadays, a vast majority of electrical motors in use are single phase AC motors, renown for their low efficiency. At the same time, almost any kind of consumption of electrical energy ends in heat. Considering lighting, a large part of input power is turned into heat due to a low efficiency of light sources. Eventually, even the most of light produced by electrical light sources eventually turns into heat. Apparently, electrical motors do not produce heat but mechanical work. Yet, all of this mechanical work is eventually dissipated into heat due to motion resistances. As a consequence, the average temperature of heavily inhabited places, such as the large cities, goes well above the ambient. Satellite IR images of EU countries show warm spots above all the major cities. Due to thermal pollution, in most of Germany, these warm spots are merging.
One of the tools at the disposal of engineers eager to reduce the waste heat generation by improving efficiency is distributed power generation. This future trend provides the ability to accommodate a number of renewable energy sources, and it has potential to improve the energy efficiency in transmission and distribution of electrical power, offering at the same time increased levels of power system capability, reliability and security. Distributed power generation is essentially based on disseminated a vast number of efficient, remotely controllable power converters. Power converters are the key element as they provide an interface to many
Fig. 2. Grid side inverter.
ELECTRONICS, VOL. 16, NO. 2, DECEMBER 2012 123
distributed energy sources such as solar and wind power, tidal and geothermal, fuel cell units and micro turbines.
Up to now, development of large power, high voltage power converters for distributed power systems has been rather sluggish. The reasons for that are numerous. Amongst others, most key governments are favoring near term goals over long term goals. Therefore, they tend to give a lower priority to the energy issues and environmental issues. The consequences of inactivity in solving these issues have the time constants that are (have been) longer than the time interval of 4-5 years being in focus of decision makers. At the same time, there has been lots of confusion regarding the climate changes and whether we are experiencing global warming or global cooling. Yet, large amounts of exact measurements and conditions are rather disturbing. East Russia is 3-4 degrees warmer on an average, boosting the snow and ice melting, increasing the fresh water income into northern seas and decreasing salinity. This weakens the "motor" that moves the north Atlantic current. With reduced heat transfer from Mexican gulf to northern Europe, the former gets warmer and generates more devastating storms, while the later gets colder. Exact satellite measurements show the peak recorded loss in Arctic ice, reaching three times the surface of Serbia per week. It has to be noted at this point that eventual melting of Greenland and West Arctic shelf would increase the see level by 12m. There are numerous indicators of adverse environmental changes spread around the globe. Large lakes, such as Aral, have virtually disappeared. Mighty rivers such as Colorado get consumed by water supply needs to such an extent that in critical months they virtually do not get to the sea. On an average, there is more rain and less snow, leading to periodic flooding and fresh water shortages. Augmented flood and draught extremes degrade the Earth surface. The overall surface of fertile soil has been in permanent increase, only to experience a decline in past decades. As a consequence, there are less crops and less forests. With disappearing forests, CO2 absorption is reduced, making the greenhouse effect more severe. Elevated temperatures contribute to crops failures and forests decline. Namely, the key process of photo-syntheses descend at 35 degrees centigrade and stops at 40 degrees. Therefore, in many regions, many plants, bacteria and animals are disappearing. In 10 years, crop reduction of 15% in 10 years is registered in China, notwithstanding advances in crops cultivation measures. With an increased request for crops used in bio-diesel production, humans and cars virtually compete for grain.
Water and crops shortages increase the health problems and produce political stress. There is an increased risk of conflicts for resources. Principal world powers are aware of an imminent exhaustion of resources such as water, air, food, oil and coal. Developed countries tend to alleviate the problem temporarily by increased exploitation of the resources in the third world countries. To secure the availability and control the prices of key resources, developed countries need to get or force a formal consent of local authorities. This goal is easier
to achieve with a decreased awareness of local population. On the long run, this approach leads to an increased gap between poor and reach, between north and south, between east and west. Failing health and education in poor countries leads to unrest and terrorism, impeding eventually the exploitation of resources and their secure transfer to developed countries. Increased number of conflicts and reduced standard of living gives a rise to a lack of tolerance between racial, ethnical and religious groups, narrowing the space for discussions and agreements, and worsening the original problems. Recent phenomena of massive market failures and even failing states can be attributed to problems mentioned above. A number of economic specialists identify the failure of existing "invisible hand" economical model as the key factor to current hardships. Yet, it is reasonable to conclude that no economic model can resolve the energy and environmental problems without a strenuous technical effort with practical solutions. Power electronic is not the key to all the problems, but it can surely serve as one of important tools for dealing with such problems.
The goals that can be achieved by devising advances in power electronics are numerous. They include energy saving in efficient appliances, efficient electrical loads and devices in commercial sector and residential sector, such as "banning the bulb" and low voltage DC house installations. At the same time, power electronics helps adopting and implementing energy efficient production technologies, the use of lighter and quicker industrial robots and manipulators, and advanced use of electrical drives in vehicles and transportation systems. The goals are also reducing the losses in power generation, transmission and distribution, redesigning power distribution at home & office, and reducing the losses in electrical drives, which consume more than 2/3 of electrical energy in developed countries. Reducing consumption of fossil fuels is achieved by harvesting green and renewable energy sources, such as solar, geothermal, tidal, hydro, wind, wave and others. In areas where natural gas is readily available and fed to consumers, distributed generation comprising micro turbines provides an alternative, distributed and well controlled source of electrical energy, increasing in such way the overall efficiency and reducing the power losses.
Another challenge is design of 21th century electrical machines. Unlike conventional, line frequency machines, modern generators and motors are fed from static power converters and they cover a very wide range of speeds and operating frequencies. Their design requires the use of new ferromagnetic materials that operate with low losses even at B = 1 T and f = 20 kHz. The operation at elevated frequencies requires new ways of designing and manufacturing the windings. Vast number of applications require new types of machines, such as SRM, BPM, SunREl and linear machines. New machine designs require new cooling methods and systems. The key factor appears to be the machine-converter integration and an integrated machine-converter design and optimization.

ELECTRONICS, VOL. 16, NO. 2, DECEMBER 2012 124
IV. CONCLUSION Environment friendly and renewable energy systems deal
with electrical energy and rely on efficient electrical power converters. High power electronics is the key technology to deal with the next generation of electrical energy systems. New materials allow for much higher junction temperatures and higher operating voltages. Advanced power semiconductor devices and novel converter topology open the possibility to increase the energy efficiency of power conversion and reduce the amount of heat. Important task for high power converters is efficient harvesting of new energy sources, such as the wind energy and the sun. Intermittent in nature, they pose a difficult task to power converter topology and controls. Eventually, high power converters are entering power distribution and transmission networks. Smart grid solution comprises two key elements, and these are intelligent controls and large static power converters. At virtually no cost, smart grids allow for a better utilization of available
resources and it enlarges the stable operating range of the transmission systems. This review of future trends in designing high power converters indicates the principal direction and goals for research, development and design in power electronics.
REFERENCES [1] T.A. Lipo, "Recent progress in the Development of Solid State AC
Motor Drives", IEEE Trans. on Power Electronics, vol. PE3, No 2, April 1988, pp. 105-117.
[2] B.K. Bose, “Power electronics and AC drives”, Prentice Hall, 1986. [3] Asymmetrical 6/2 SR drive, ACORN - European Washer Project,
Emerson Electric Co, Electronic Speed Control Division, St. Louis U.S.A., 1988.
[4] V. Stefanović, D. Borojević, Current Problems in Industrial Drives, in Proc. of the 8th Conference Energetska elektronika - Ee'95, Novi Sad, Serbia, Yugoslavia, 1995.
[5] A. Nabae, I. Takahashi, H. Akagi, “A New Neutral-Point-Clamped PWM Inverter”, IEEE Trans. Ind. Applications, vol. IA-17, No. 5, pp. 518-523, Sep./Oct. 1981.

ELECTRONICS, VOL. 16, NO. 2, DECEMBER 2012
DOI: 10.7251/ELS1216125C
125
Abstract—This paper proposes a Cyber Physical Approach
(CPS) to power electronics (PE) education where all aspects of PE technology from circuit topology to the implementation of real time control code on a microprocessor are dealt with as an inseparable whole, and only the system complexity is increased during the course of instruction. This approach is now made practical thanks to the affordable and unrestricted access to high-power PE laboratory infrastructure (PE laboratory in a box) in the form of high-fidelity digital PE emulators with 1s calculation time step and latency.
Index Terms—Cyber physical systems, hybrid systems, hardware-in-the-loop, power electronics education.
I. INTRODUCTION YBER physical systems (CPS) or the computer augmented physical systems range from the miniscule-
scale e.g. hearing aid to very-large-scale e.g. the national power grid [1]. At the same time they may well be the largest and fastest growing class of manmade systems with inexhaustible potential for further development.
The power grid, which is the largest CPS system (or any many made systems), is currently undergoing a massive transformation from vertically integrated to open-access, decentralized, market driven, dynamical system [2]-[4]. To make things more interesting the distributed renewable power generation assets, the deregulation, and the increased number of smart power electronics devices are all simultaneously and from different directions reshaping the grid [5].
In all this development power electronics (PE) is playing the role of enabling technology, providing means for precise and reliable power flow control between the grid and the majority of its distributed sources and loads as well as between parts of the grid itself through wider use of flexible-ac-transmission (FACTS) PE devices [6]-[8].
Manuscript received 30 November 2012. Accepted for publication 10
December 2012. Some results of this paper were presented at the 16th International Symposium Power Electronics, Novi Sad, Serbia, October 26 28, 2011.
N. Čelanović, S. Grabić, Z. Ivanović and M. Vekić are with the Typhoon HIL, Inc. Cambridge, USA, Baden, Switzerland, Novi Sad, Serbia.
V. Katić is with Faculty of Technical Sciences, University of Novi Sad, Novi Sad, Serbia (e-mail: [email protected]).
I. Čelanović is with the Massachusetts Institute of Technology, Cambridge Massachusetts, USA.
Clearly, all this development calls for new tools and methodologies that can support all the massive new development currently under way in various aspects of the smart grid.
A. Power Electronics Hybrid Systems Switched circuits in power electronics exhibit pronounced
hybrid systems behavior because they are best described by a set of discrete states with the associated continuous dynamics, where the controller reaches its control objectives by choosing among the discrete states [9]. Because there is a large number of discrete states (and even larger number of transitions) even for relatively small power electronics systems the exact analysis and understanding of the system is difficult. This is also the reason why the commonly taught techniques for analysis, control and simulation of PE systems involve considerable approximations which limit their accuracy.
Typically, the switching circuit is averaged, and than linearized around the operating point which makes the circuit manageable but neglects the important circuit dynamics as well as the circuit’s nonlinear behavior. The control synthesis is accomplished by means of linear control techniques, and finally the resulting system’s performance is evaluated on the switched circuit simulation and on the hardware models.
B. Limited Access To High-Power PE Infrastructure Limits the Quality of PE Education The common limiting factor in all smart grid education in
general and PE in particular is the limited access to PE hardware (particularly high-power hardware), or preferably the real-time emulation facilities with sufficient time resolution: for medium to high power PE systems the time resolution of 1μs or less is required [10].
The simulation packages like Mathworks’s SimPowerSystems (and others) behavioral models of power hardware are rather accurate in all but the time domain. In other words, they cannot be connected directly to the real time controller, and operated in real time.
Thanks to the automatic code generation technology like Mathworks’s Real-Time Workshop it is now possible to generate the micro controller C-code from Simulink which is an admirable step forward in the process of control algorithms code generation. Still, the microcontrollers architectures are far from powerful enough to emulate the power electronics hardware by means of automatic code generation [11].
As the digital controllers are an integral part of the PE CPS
Cyber Physical Systems Approach to Power Electronics Education
Nikola Čelanović, Ivan Čelanović, Stevan Grabić, Vladimir Katić, Zoran Ivanović, and Marko Vekić
C
ELECTRONICS, VOL. 16, NO. 2, DECEMBER 2012 126
systems it is important that they become an integral part of the PE education at all levels and to a much higher degree than is presently the case. Still, before that can be done access to high-power PE laboratory facilities must be made available at a massive scale, and at the fraction of the cost.
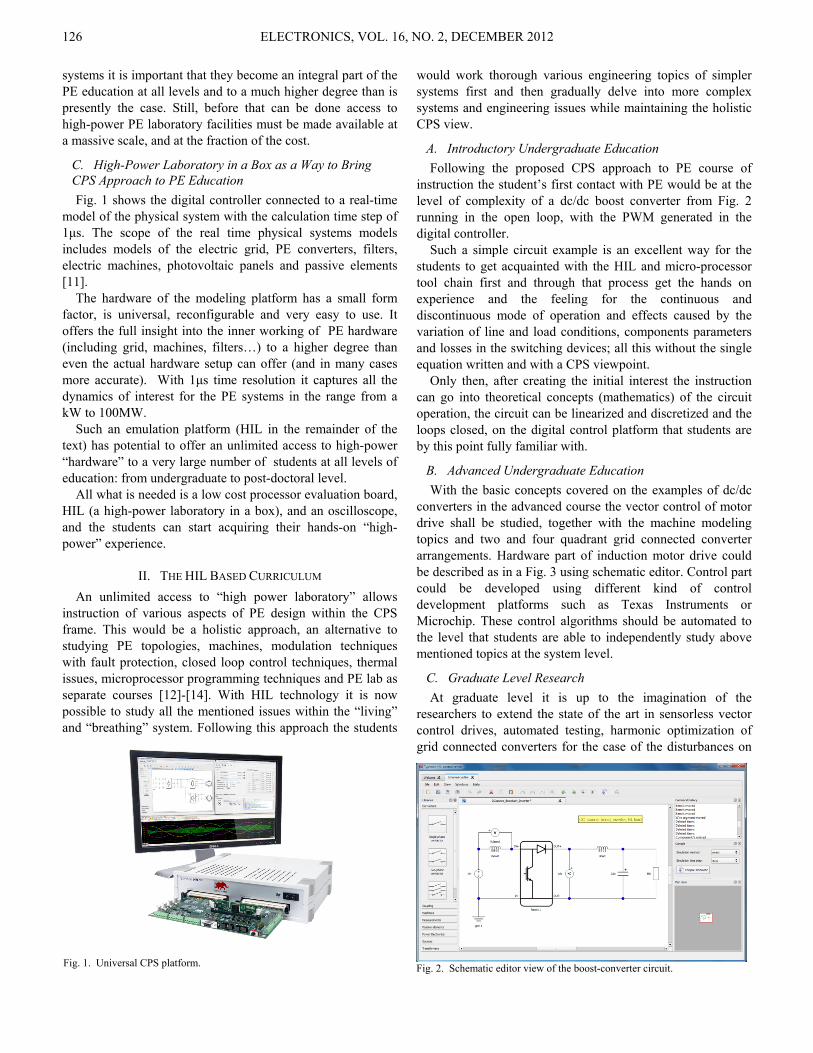
C. High-Power Laboratory in a Box as a Way to Bring CPS Approach to PE Education Fig. 1 shows the digital controller connected to a real-time
model of the physical system with the calculation time step of 1μs. The scope of the real time physical systems models includes models of the electric grid, PE converters, filters, electric machines, photovoltaic panels and passive elements [11].
The hardware of the modeling platform has a small form factor, is universal, reconfigurable and very easy to use. It offers the full insight into the inner working of PE hardware (including grid, machines, filters…) to a higher degree than even the actual hardware setup can offer (and in many cases more accurate). With 1μs time resolution it captures all the dynamics of interest for the PE systems in the range from a kW to 100MW.
Such an emulation platform (HIL in the remainder of the text) has potential to offer an unlimited access to high-power “hardware” to a very large number of students at all levels of education: from undergraduate to post-doctoral level.
All what is needed is a low cost processor evaluation board, HIL (a high-power laboratory in a box), and an oscilloscope, and the students can start acquiring their hands-on “high-power” experience.
II. THE HIL BASED CURRICULUM An unlimited access to “high power laboratory” allows
instruction of various aspects of PE design within the CPS frame. This would be a holistic approach, an alternative to studying PE topologies, machines, modulation techniques with fault protection, closed loop control techniques, thermal issues, microprocessor programming techniques and PE lab as separate courses [12]-[14]. With HIL technology it is now possible to study all the mentioned issues within the “living” and “breathing” system. Following this approach the students
would work thorough various engineering topics of simpler systems first and then gradually delve into more complex systems and engineering issues while maintaining the holistic CPS view.
A. Introductory Undergraduate Education Following the proposed CPS approach to PE course of
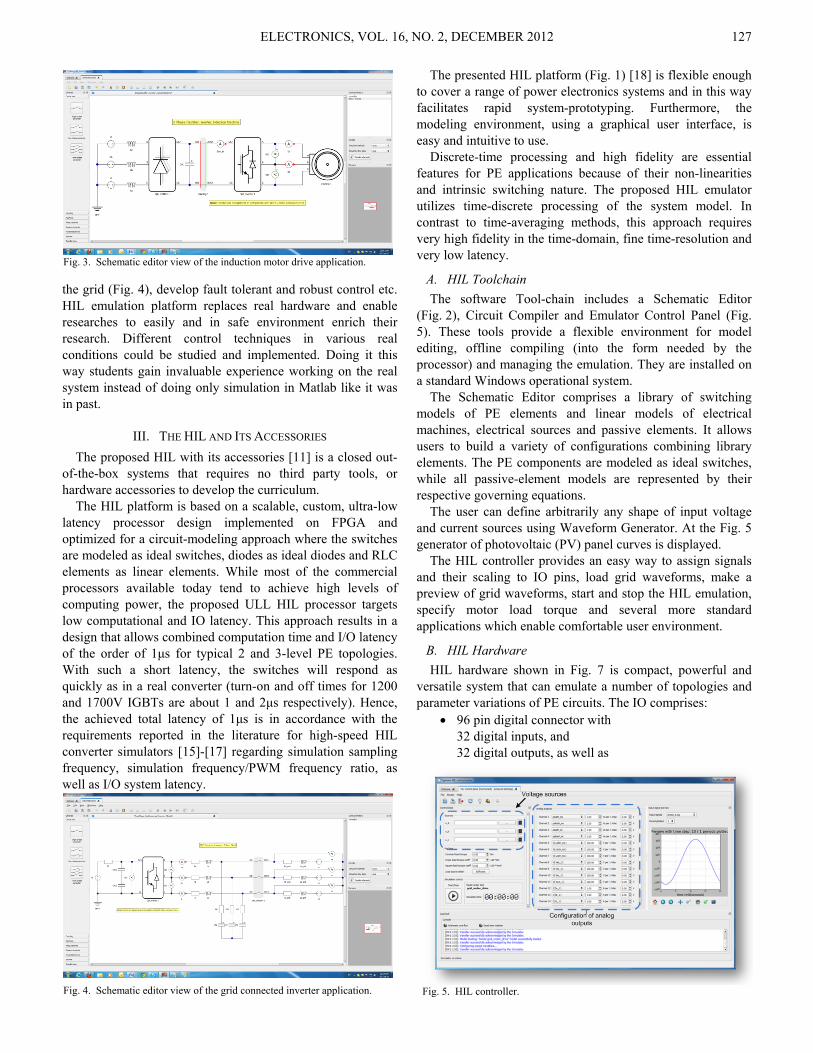
instruction the student’s first contact with PE would be at the level of complexity of a dc/dc boost converter from Fig. 2 running in the open loop, with the PWM generated in the digital controller.
Such a simple circuit example is an excellent way for the students to get acquainted with the HIL and micro-processor tool chain first and through that process get the hands on experience and the feeling for the continuous and discontinuous mode of operation and effects caused by the variation of line and load conditions, components parameters and losses in the switching devices; all this without the single equation written and with a CPS viewpoint.
Only then, after creating the initial interest the instruction can go into theoretical concepts (mathematics) of the circuit operation, the circuit can be linearized and discretized and the loops closed, on the digital control platform that students are by this point fully familiar with.
B. Advanced Undergraduate Education With the basic concepts covered on the examples of dc/dc
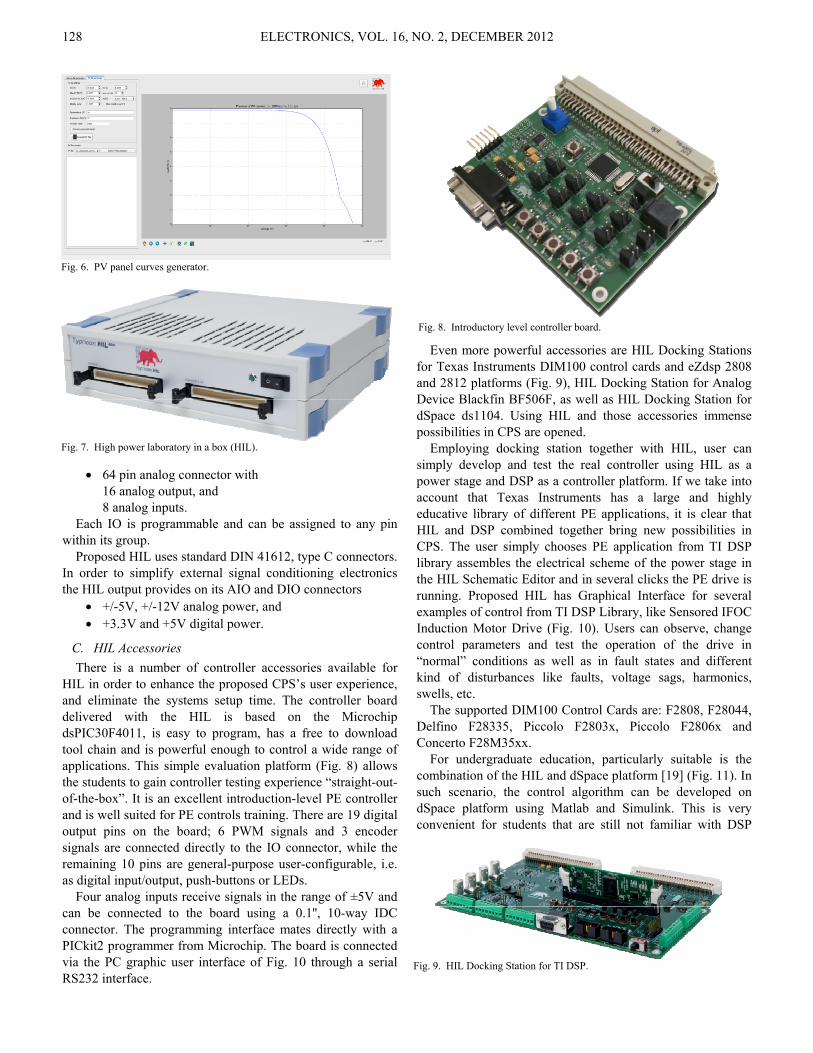
converters in the advanced course the vector control of motor drive shall be studied, together with the machine modeling topics and two and four quadrant grid connected converter arrangements. Hardware part of induction motor drive could be described as in a Fig. 3 using schematic editor. Control part could be developed using different kind of control development platforms such as Texas Instruments or Microchip. These control algorithms should be automated to the level that students are able to independently study above mentioned topics at the system level.
C. Graduate Level Research At graduate level it is up to the imagination of the
researchers to extend the state of the art in sensorless vector control drives, automated testing, harmonic optimization of grid connected converters for the case of the disturbances on
Fig. 1. Universal CPS platform.
Fig. 2. Schematic editor view of the boost-converter circuit.
ELECTRONICS, VOL. 16, NO. 2, DECEMBER 2012 127
the grid (Fig. 4), develop fault tolerant and robust control etc. HIL emulation platform replaces real hardware and enable researches to easily and in safe environment enrich their research. Different control techniques in various real conditions could be studied and implemented. Doing it this way students gain invaluable experience working on the real system instead of doing only simulation in Matlab like it was in past.
III. THE HIL AND ITS ACCESSORIES The proposed HIL with its accessories [11] is a closed out-
of-the-box systems that requires no third party tools, or hardware accessories to develop the curriculum.
The HIL platform is based on a scalable, custom, ultra-low latency processor design implemented on FPGA and optimized for a circuit-modeling approach where the switches are modeled as ideal switches, diodes as ideal diodes and RLC elements as linear elements. While most of the commercial processors available today tend to achieve high levels of computing power, the proposed ULL HIL processor targets low computational and IO latency. This approach results in a design that allows combined computation time and I/O latency of the order of 1μs for typical 2 and 3-level PE topologies. With such a short latency, the switches will respond as quickly as in a real converter (turn-on and off times for 1200 and 1700V IGBTs are about 1 and 2μs respectively). Hence, the achieved total latency of 1μs is in accordance with the requirements reported in the literature for high-speed HIL converter simulators [15]-[17] regarding simulation sampling frequency, simulation frequency/PWM frequency ratio, as well as I/O system latency.
The presented HIL platform (Fig. 1) [18] is flexible enough to cover a range of power electronics systems and in this way facilitates rapid system-prototyping. Furthermore, the modeling environment, using a graphical user interface, is easy and intuitive to use.
Discrete-time processing and high fidelity are essential features for PE applications because of their non-linearities and intrinsic switching nature. The proposed HIL emulator utilizes time-discrete processing of the system model. In contrast to time-averaging methods, this approach requires very high fidelity in the time-domain, fine time-resolution and very low latency.
A. HIL Toolchain The software Tool-chain includes a Schematic Editor
(Fig. 2), Circuit Compiler and Emulator Control Panel (Fig. 5). These tools provide a flexible environment for model editing, offline compiling (into the form needed by the processor) and managing the emulation. They are installed on a standard Windows operational system.
The Schematic Editor comprises a library of switching models of PE elements and linear models of electrical machines, electrical sources and passive elements. It allows users to build a variety of configurations combining library elements. The PE components are modeled as ideal switches, while all passive-element models are represented by their respective governing equations.
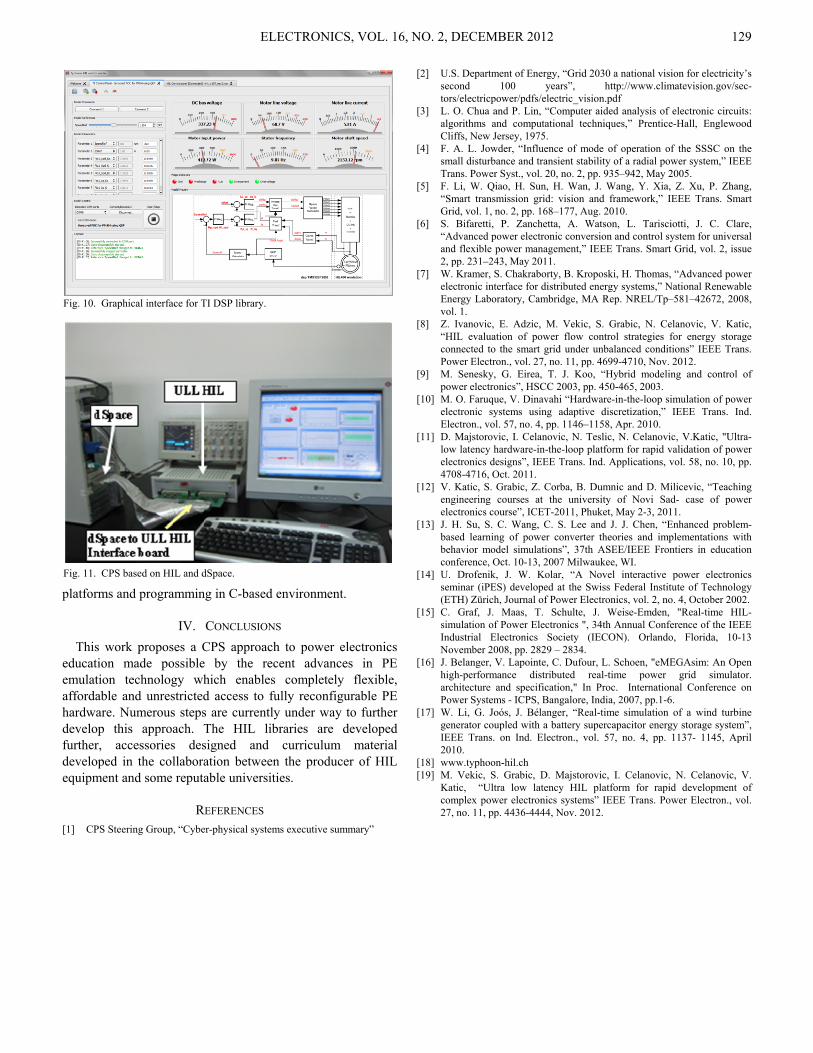
The user can define arbitrarily any shape of input voltage and current sources using Waveform Generator. At the Fig. 5 generator of photovoltaic (PV) panel curves is displayed.
The HIL controller provides an easy way to assign signals and their scaling to IO pins, load grid waveforms, make a preview of grid waveforms, start and stop the HIL emulation, specify motor load torque and several more standard applications which enable comfortable user environment.
B. HIL Hardware HIL hardware shown in Fig. 7 is compact, powerful and
versatile system that can emulate a number of topologies and parameter variations of PE circuits. The IO comprises:
• 96 pin digital connector with 32 digital inputs, and 32 digital outputs, as well as
Fig. 3. Schematic editor view of the induction motor drive application.
Fig. 4. Schematic editor view of the grid connected inverter application. Fig. 5. HIL controller.
ELECTRONICS, VOL. 16, NO. 2, DECEMBER 2012 128
• 64 pin analog connector with 16 analog output, and 8 analog inputs. Each IO is programmable and can be assigned to any pin
within its group. Proposed HIL uses standard DIN 41612, type C connectors.
In order to simplify external signal conditioning electronics the HIL output provides on its AIO and DIO connectors
• +/-5V, +/-12V analog power, and • +3.3V and +5V digital power.
C. HIL Accessories There is a number of controller accessories available for
HIL in order to enhance the proposed CPS’s user experience, and eliminate the systems setup time. The controller board delivered with the HIL is based on the Microchip dsPIC30F4011, is easy to program, has a free to download tool chain and is powerful enough to control a wide range of applications. This simple evaluation platform (Fig. 8) allows the students to gain controller testing experience “straight-out-of-the-box”. It is an excellent introduction-level PE controller and is well suited for PE controls training. There are 19 digital output pins on the board; 6 PWM signals and 3 encoder signals are connected directly to the IO connector, while the remaining 10 pins are general-purpose user-configurable, i.e. as digital input/output, push-buttons or LEDs.
Four analog inputs receive signals in the range of ±5V and can be connected to the board using a 0.1'', 10-way IDC connector. The programming interface mates directly with a PICkit2 programmer from Microchip. The board is connected via the PC graphic user interface of Fig. 10 through a serial RS232 interface.
Even more powerful accessories are HIL Docking Stations for Texas Instruments DIM100 control cards and eZdsp 2808 and 2812 platforms (Fig. 9), HIL Docking Station for Analog Device Blackfin BF506F, as well as HIL Docking Station for dSpace ds1104. Using HIL and those accessories immense possibilities in CPS are opened.
Employing docking station together with HIL, user can simply develop and test the real controller using HIL as a power stage and DSP as a controller platform. If we take into account that Texas Instruments has a large and highly educative library of different PE applications, it is clear that HIL and DSP combined together bring new possibilities in CPS. The user simply chooses PE application from TI DSP library assembles the electrical scheme of the power stage in the HIL Schematic Editor and in several clicks the PE drive is running. Proposed HIL has Graphical Interface for several examples of control from TI DSP Library, like Sensored IFOC Induction Motor Drive (Fig. 10). Users can observe, change control parameters and test the operation of the drive in “normal” conditions as well as in fault states and different kind of disturbances like faults, voltage sags, harmonics, swells, etc.
The supported DIM100 Control Cards are: F2808, F28044, Delfino F28335, Piccolo F2803x, Piccolo F2806x and Concerto F28M35xx.
For undergraduate education, particularly suitable is the combination of the HIL and dSpace platform [19] (Fig. 11). In such scenario, the control algorithm can be developed on dSpace platform using Matlab and Simulink. This is very convenient for students that are still not familiar with DSP
Fig. 6. PV panel curves generator.
Fig. 7. High power laboratory in a box (HIL).
Fig. 8. Introductory level controller board.
Fig. 9. HIL Docking Station for TI DSP.
ELECTRONICS, VOL. 16, NO. 2, DECEMBER 2012 129
platforms and programming in C-based environment.
IV. CONCLUSIONS This work proposes a CPS approach to power electronics
education made possible by the recent advances in PE emulation technology which enables completely flexible, affordable and unrestricted access to fully reconfigurable PE hardware. Numerous steps are currently under way to further develop this approach. The HIL libraries are developed further, accessories designed and curriculum material developed in the collaboration between the producer of HIL equipment and some reputable universities.
REFERENCES [1] CPS Steering Group, “Cyber-physical systems executive summary”
[2] U.S. Department of Energy, “Grid 2030 a national vision for electricity’s second 100 years”, http://www.climatevision.gov/sec-tors/electricpower/pdfs/electric_vision.pdf
[3] L. O. Chua and P. Lin, “Computer aided analysis of electronic circuits: algorithms and computational techniques,” Prentice-Hall, Englewood Cliffs, New Jersey, 1975.
[4] F. A. L. Jowder, “Influence of mode of operation of the SSSC on the small disturbance and transient stability of a radial power system,” IEEE Trans. Power Syst., vol. 20, no. 2, pp. 935–942, May 2005.
[5] F. Li, W. Qiao, H. Sun, H. Wan, J. Wang, Y. Xia, Z. Xu, P. Zhang, “Smart transmission grid: vision and framework,” IEEE Trans. Smart Grid, vol. 1, no. 2, pp. 168–177, Aug. 2010.
[6] S. Bifaretti, P. Zanchetta, A. Watson, L. Tarisciotti, J. C. Clare, “Advanced power electronic conversion and control system for universal and flexible power management,” IEEE Trans. Smart Grid, vol. 2, issue 2, pp. 231–243, May 2011.
[7] W. Kramer, S. Chakraborty, B. Kroposki, H. Thomas, “Advanced power electronic interface for distributed energy systems,” National Renewable Energy Laboratory, Cambridge, MA Rep. NREL/Tp–581–42672, 2008, vol. 1.
[8] Z. Ivanovic, E. Adzic, M. Vekic, S. Grabic, N. Celanovic, V. Katic, “HIL evaluation of power flow control strategies for energy storage connected to the smart grid under unbalanced conditions” IEEE Trans. Power Electron., vol. 27, no. 11, pp. 4699-4710, Nov. 2012.
[9] M. Senesky, G. Eirea, T. J. Koo, “Hybrid modeling and control of power electronics”, HSCC 2003, pp. 450-465, 2003.
[10] M. O. Faruque, V. Dinavahi “Hardware-in-the-loop simulation of power electronic systems using adaptive discretization,” IEEE Trans. Ind. Electron., vol. 57, no. 4, pp. 1146–1158, Apr. 2010.
[11] D. Majstorovic, I. Celanovic, N. Teslic, N. Celanovic, V.Katic, "Ultra-low latency hardware-in-the-loop platform for rapid validation of power electronics designs”, IEEE Trans. Ind. Applications, vol. 58, no. 10, pp. 4708-4716, Oct. 2011.
[12] V. Katic, S. Grabic, Z. Corba, B. Dumnic and D. Milicevic, “Teaching engineering courses at the university of Novi Sad- case of power electronics course”, ICET-2011, Phuket, May 2-3, 2011.
[13] J. H. Su, S. C. Wang, C. S. Lee and J. J. Chen, “Enhanced problem-based learning of power converter theories and implementations with behavior model simulations”, 37th ASEE/IEEE Frontiers in education conference, Oct. 10-13, 2007 Milwaukee, WI.
[14] U. Drofenik, J. W. Kolar, “A Novel interactive power electronics seminar (iPES) developed at the Swiss Federal Institute of Technology (ETH) Zürich, Journal of Power Electronics, vol. 2, no. 4, October 2002.
[15] C. Graf, J. Maas, T. Schulte, J. Weise-Emden, "Real-time HIL-simulation of Power Electronics ", 34th Annual Conference of the IEEE Industrial Electronics Society (IECON). Orlando, Florida, 10-13 November 2008, pp. 2829 – 2834.
[16] J. Belanger, V. Lapointe, C. Dufour, L. Schoen, "eMEGAsim: An Open high-performance distributed real-time power grid simulator. architecture and specification," In Proc. International Conference on Power Systems - ICPS, Bangalore, India, 2007, pp.1-6.
[17] W. Li, G. Joós, J. Bélanger, “Real-time simulation of a wind turbine generator coupled with a battery supercapacitor energy storage system”, IEEE Trans. on Ind. Electron., vol. 57, no. 4, pp. 1137- 1145, April 2010.
[18] www.typhoon-hil.ch [19] M. Vekic, S. Grabic, D. Majstorovic, I. Celanovic, N. Celanovic, V.
Katic, “Ultra low latency HIL platform for rapid development of complex power electronics systems” IEEE Trans. Power Electron., vol. 27, no. 11, pp. 4436-4444, Nov. 2012.
Fig. 10. Graphical interface for TI DSP library.
Fig. 11. CPS based on HIL and dSpace.
ELECTRONICS, VOL. 16, NO. 2, DECEMBER 2012
DOI: 10.7251/ELS1216130S
130
Abstract—Hardware-in-the-loop simulation is today a
standard method for testing electronic equipment in the automotive industry. Since electric drives and power electronic devices are more and more important in automotive applications, these kinds of systems have to be integrated into the hardware-in-the-loop simulation. Power converters and electric drives are used in many different applications in vehicles today (hybrid electric or electric powertrain, electric steering systems, DC-DC converters, etc.). The wide range of applications, topologies, and power levels results in various different approaches and solutions for hardware-in-the-loop testing. This paper gives an overview of hardware-in-the-loop simulation of power electronics and electric drives in the automotive industry. The currently available technologies are described and future challenges are outlined.
Index Terms—Automotive Applications, HIL Simulation, Real-time Simulation.
I. INTRODUCTION OWER electronic devices are becoming increasingly important in automotive applications, due to electric
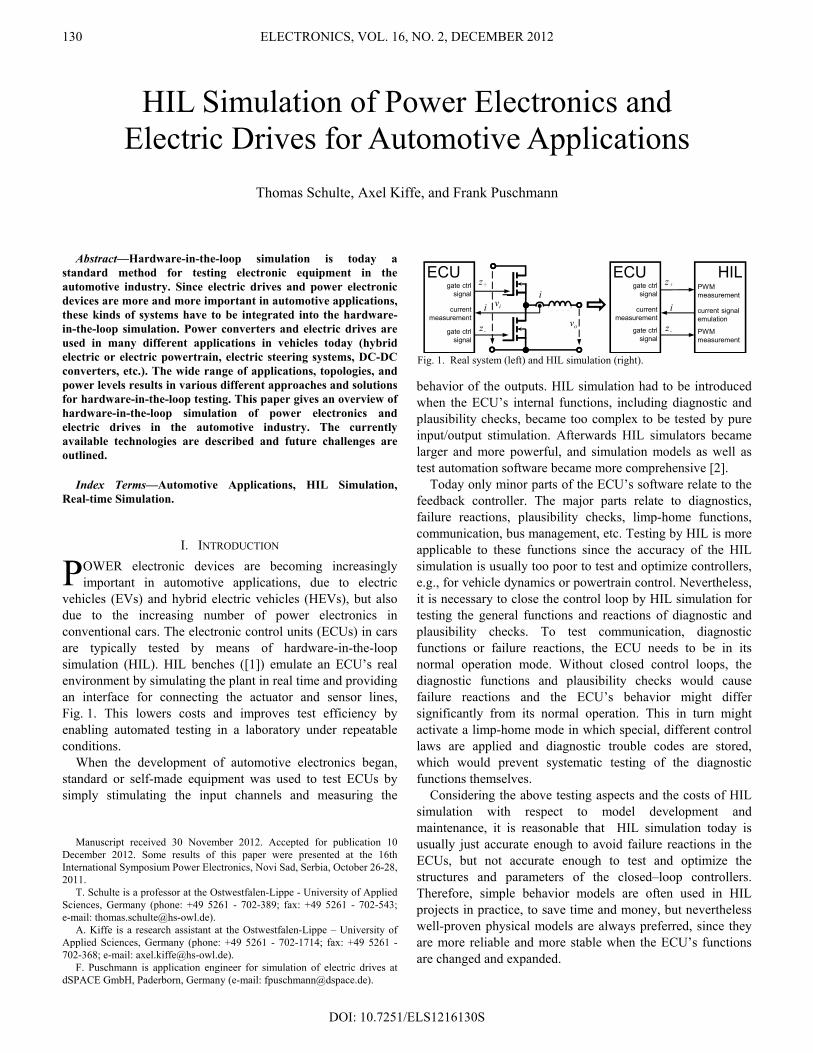
vehicles (EVs) and hybrid electric vehicles (HEVs), but also due to the increasing number of power electronics in conventional cars. The electronic control units (ECUs) in cars are typically tested by means of hardware-in-the-loop simulation (HIL). HIL benches ([1]) emulate an ECU’s real environment by simulating the plant in real time and providing an interface for connecting the actuator and sensor lines, Fig. 1. This lowers costs and improves test efficiency by enabling automated testing in a laboratory under repeatable conditions.
When the development of automotive electronics began, standard or self-made equipment was used to test ECUs by simply stimulating the input channels and measuring the
Manuscript received 30 November 2012. Accepted for publication 10
December 2012. Some results of this paper were presented at the 16th International Symposium Power Electronics, Novi Sad, Serbia, October 26-28, 2011.
T. Schulte is a professor at the Ostwestfalen-Lippe - University of Applied Sciences, Germany (phone: +49 5261 - 702-389; fax: +49 5261 - 702-543; e-mail: [email protected]).
A. Kiffe is a research assistant at the Ostwestfalen-Lippe – University of Applied Sciences, Germany (phone: +49 5261 - 702-1714; fax: +49 5261 - 702-368; e-mail: [email protected]).
F. Puschmann is application engineer for simulation of electric drives at dSPACE GmbH, Paderborn, Germany (e-mail: [email protected]).
behavior of the outputs. HIL simulation had to be introduced when the ECU’s internal functions, including diagnostic and plausibility checks, became too complex to be tested by pure input/output stimulation. Afterwards HIL simulators became larger and more powerful, and simulation models as well as test automation software became more comprehensive [2].
Today only minor parts of the ECU’s software relate to the feedback controller. The major parts relate to diagnostics, failure reactions, plausibility checks, limp-home functions, communication, bus management, etc. Testing by HIL is more applicable to these functions since the accuracy of the HIL simulation is usually too poor to test and optimize controllers, e.g., for vehicle dynamics or powertrain control. Nevertheless, it is necessary to close the control loop by HIL simulation for testing the general functions and reactions of diagnostic and plausibility checks. To test communication, diagnostic functions or failure reactions, the ECU needs to be in its normal operation mode. Without closed control loops, the diagnostic functions and plausibility checks would cause failure reactions and the ECU’s behavior might differ significantly from its normal operation. This in turn might activate a limp-home mode in which special, different control laws are applied and diagnostic trouble codes are stored, which would prevent systematic testing of the diagnostic functions themselves.
Considering the above testing aspects and the costs of HIL simulation with respect to model development and maintenance, it is reasonable that HIL simulation today is usually just accurate enough to avoid failure reactions in the ECUs, but not accurate enough to test and optimize the structures and parameters of the closed–loop controllers. Therefore, simple behavior models are often used in HIL projects in practice, to save time and money, but nevertheless well-proven physical models are always preferred, since they are more reliable and more stable when the ECU’s functions are changed and expanded.
HIL Simulation of Power Electronics and Electric Drives for Automotive Applications
Thomas Schulte, Axel Kiffe, and Frank Puschmann
P
ovi iv
ECUgate ctrl
signal
current measurement
gate ctrl signal
i+z
-z
i
ECUgate ctrl
signal
current measurement
gate ctrl signal
+z
-z
HILPWM measurement
current signal emulation
PWM measurement
Fig. 1. Real system (left) and HIL simulation (right).
ELECTRONICS, VOL. 16, NO. 2, DECEMBER 2012 131
II. HIL SIMULATION FOR POWER ELECTRONICS AND ELECTRIC DRIVES
HIL simulation for electric drives has been done for many years now, e.g. [3]. In automotive HIL simulation, it became more and more important from about 2004 onwards, due to the increasing development efforts for hybrid-electric vehicles. Today, controlled electric drives are used for a large variety of different important and safety-critical systems in modern vehicles. They can be found in hybrid-electric or electric powertrains as well as in electric steering systems or gear box actuation. Most of these applications have in common that they incorporate a complex distributed control system (hardware and software) comprising several ECUs and having significant requirements with respect to reliability and safety. HIL testing is therefore an obvious choice, and many different solutions have been presented, [4].
Depending on the test purpose, the HIL benches could be large, incorporating several real-time processors (multi-processor system) if all ECUs need to be connected. Nevertheless, HIL simulation for an electric drive or power electronics is usually the most ambitious task within the overall setup, since there are two major differences compared to other systems which are typically incorporated in HIL simulations. First, the dynamics of the electric domain are much higher, which results in special requirements on the real-time system and the model. Second, the controlled electric power is much higher (up to hundreds of kW), which influences the interface between the ECU and HIL simulator.
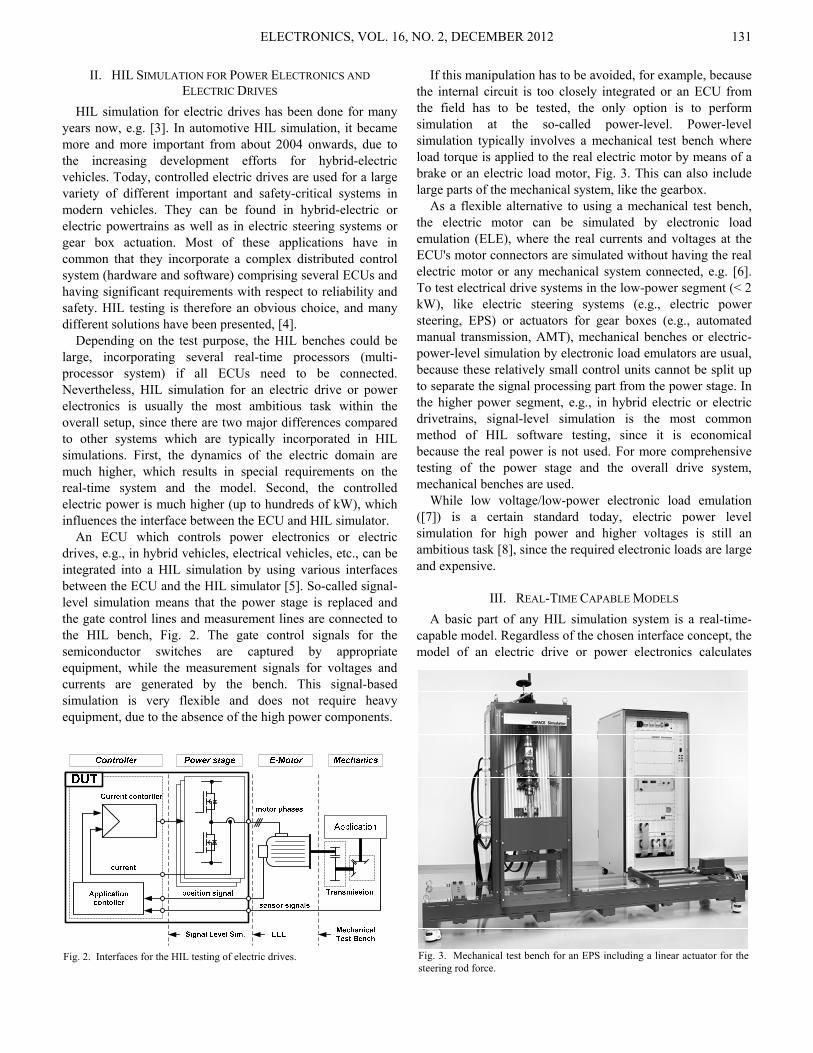
An ECU which controls power electronics or electric drives, e.g., in hybrid vehicles, electrical vehicles, etc., can be integrated into a HIL simulation by using various interfaces between the ECU and the HIL simulator [5]. So-called signal-level simulation means that the power stage is replaced and the gate control lines and measurement lines are connected to the HIL bench, Fig. 2. The gate control signals for the semiconductor switches are captured by appropriate equipment, while the measurement signals for voltages and currents are generated by the bench. This signal-based simulation is very flexible and does not require heavy equipment, due to the absence of the high power components.
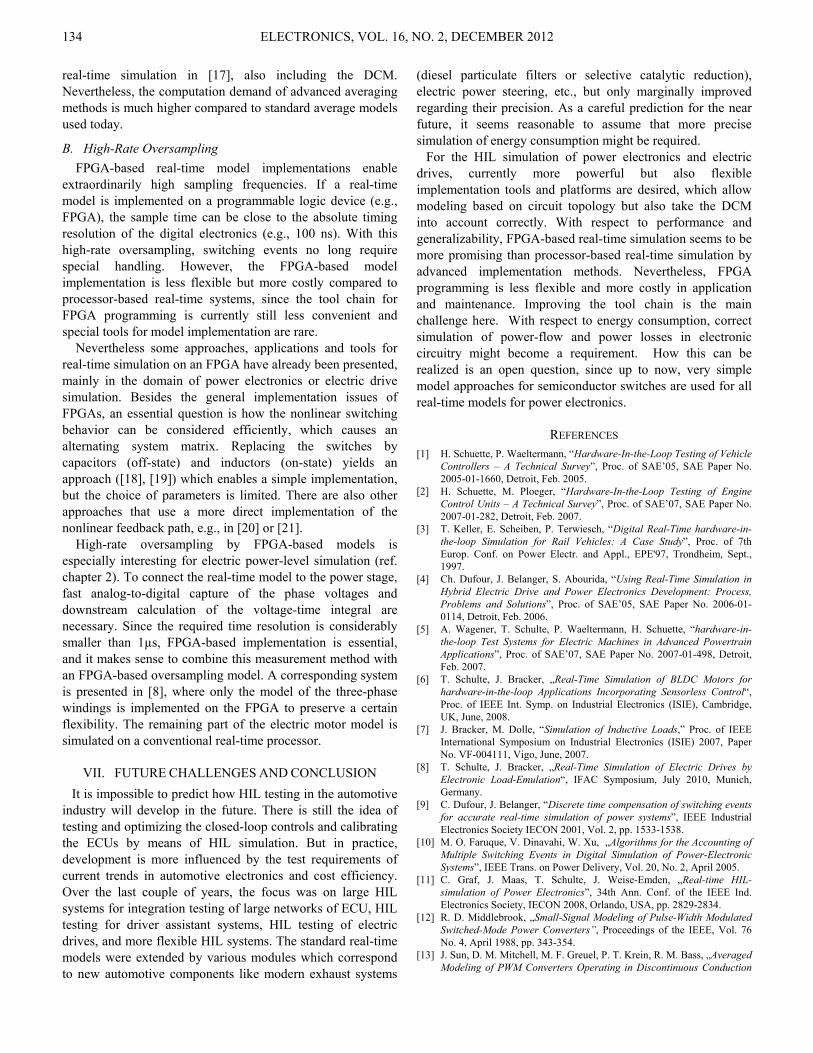
If this manipulation has to be avoided, for example, because the internal circuit is too closely integrated or an ECU from the field has to be tested, the only option is to perform simulation at the so-called power-level. Power-level simulation typically involves a mechanical test bench where load torque is applied to the real electric motor by means of a brake or an electric load motor, Fig. 3. This can also include large parts of the mechanical system, like the gearbox.
As a flexible alternative to using a mechanical test bench, the electric motor can be simulated by electronic load emulation (ELE), where the real currents and voltages at the ECU's motor connectors are simulated without having the real electric motor or any mechanical system connected, e.g. [6]. To test electrical drive systems in the low-power segment (< 2 kW), like electric steering systems (e.g., electric power steering, EPS) or actuators for gear boxes (e.g., automated manual transmission, AMT), mechanical benches or electric-power-level simulation by electronic load emulators are usual, because these relatively small control units cannot be split up to separate the signal processing part from the power stage. In the higher power segment, e.g., in hybrid electric or electric drivetrains, signal-level simulation is the most common method of HIL software testing, since it is economical because the real power is not used. For more comprehensive testing of the power stage and the overall drive system, mechanical benches are used.
While low voltage/low-power electronic load emulation ([7]) is a certain standard today, electric power level simulation for high power and higher voltages is still an ambitious task [8], since the required electronic loads are large and expensive.
III. REAL-TIME CAPABLE MODELS A basic part of any HIL simulation system is a real-time-
capable model. Regardless of the chosen interface concept, the model of an electric drive or power electronics calculates
Fig. 2. Interfaces for the HIL testing of electric drives. Fig. 3. Mechanical test bench for an EPS including a linear actuator for the steering rod force.

ELECTRONICS, VOL. 16, NO. 2, DECEMBER 2012 132
voltages, currents and torque from the control signals (gate driver signals). The development of real-time-capable models of power electronic circuits or electric drives is still an ambitious task. The approaches can be classified by different aspects, but the sampling strategy and the handling of discontinuities are significant criteria anyway.
IV. SAMPLING STRATEGIES Digital controllers for electric motors measure currents and
voltages and calculate the control algorithms one or two times a switching period by utilizing a pulse-synchronous measurement. Therefore in a HIL simulation it is generally sufficient to update the output signals to the controller by using the same rate as the control algorithm itself [5]. Two different sampling strategies are presented below.
A. Low-Rate Synchronous Sampling When the electric circuit or drive model runs at the same
sampling frequency as the controller, it needs to be executed synchronously to the control algorithms or PWM period ST to avoid subharmonic beats, see Fig. 4a. This requires a synchronization mechanism for the HIL simulation, e.g., based on a phase-locked loop [5]. The simulation accuracy and stability can be critical in some cases, due to a delay of at least one sample step in providing the output values. The synchronization itself could be instable if the switching frequency is varied. Anyway, the low-rate synchronous
sampling strategy fails in some cases, e.g., in current mode control.
B. Asynchronous Oversampling If the model is executed considerably faster than the PWM
switching and the corresponding control loop (oversampling, Fig. 4b) with an oversampling factor of 10 or higher, the simulation behaves quasi-continuously. Synchronization is not necessary and the delay in providing output values to the controller is considerably smaller. The accuracy and stability of the real-time simulation are significantly increased.
The main advantage of the low-rate synchronous sampling strategy is its lower computation demand. The improvement of accuracy and stability by asynchronous oversampling is dearly bought by a considerably higher computation demand. Assuming a switching frequency of 20 kHz, the sample time of the model should be at least 5 µs or less. Considering the switching frequencies of today’s power electronics, a model implementation based on an FPGA (field-programmable gate array) is the only solution.
V. HANDLING DISCONTINUITIES Discontinuities in electrical systems are caused by any kind
of switches, mainly semiconductors like diodes or transistors. In HIL simulation, two different types of switching events can be distinguished. The first type are the model’s internal switching events, which depend on the model’s internal current or voltage values. An example is a diode which changes the conduction state. The second type are external switching events, which occur when semiconductor devices like transistors are switched by external drive signals (input signal of the HIL simulation).
Real-time simulation usually requires a fixed step size which does not allow classic zero-crossing detection algorithms. However, it is not sufficient to consider the instantaneous states of the switches at the sample points, because with a state-of-the-art real-time processor, the step size T cannot be sufficiently reduced to obtain an appropriate timing resolution for switching events and accurate simulation results. Special measures are required to consider switching events via additional information obtained by signal preprocessing with higher timing resolution than the step size of the simulation algorithm itself. Otherwise the simulation could be inaccurate or even instable.
Well-proven approaches for real-time simulation are known for the continuous conduction mode (CCM) of the power electronics, where standard averaging methods can be used by just capturing external switching events, measured by timing evaluation. The quantities are then averaged, neglecting the behavior of currents and voltages during a sample period T . The equation for averaging periodic quantities )(tx is as follows:
( )∫⋅=T
dttxT
x0
1 (1)
where T is the sampling period. This is the standard method
t
( ) ( )tvti ,sample points for control unit
calculation time for model
a) Low‐rate Synchronous Sampling:
t
( ) ( )tvti ,( )tv
b) Asynchronous Oversampling:
( )ti
simulate currentreal current
( )ti
( )tv
Fig. 4. Different sampling strategies: The figure shows the principle voltageand current waveforms (simulated and real) obtained by the two samplingstrategies for an inductive load driven by a pulse-wise voltage.

ELECTRONICS, VOL. 16, NO. 2, DECEMBER 2012 133
for the HIL simulation of electric drives today, and does not adequately take into account the discontinuous conduction mode (DCM), where internal switching events are essential.
Nevertheless, the DCM is a normal operating mode for many power electronic topologies (e.g., forward converter, BLDC motor). Moreover, the DCM occurs in many failure cases in power electronics which are normally operated in CCM (e.g., gate driver failure). Unfortunately, there is still a lack of efficient and reliable approaches for simulating power electronic circuits operated in the DCM in real time. Some candidates will be presented in the following section.
VI. COMPENSATION METHODS An obvious approach to handling discontinuities is to split
up a sample step T into a period before and after the switching event. These two subperiods, where different model topologies are valid, can then be simulated separately. External switching events, forced by control signals, can be captured by appropriate I/O timing hardware or calculated from simulated control signals. Switching events that depend on state variables can be calculated, e.g., by interpolation, as shown in Fig. 5. The state variables x can be recalculated from the determined switching time, using the new model topology. A significant increase in execution time can be avoided by utilizing asynchronous but constant sample steps and simple interpolation and extrapolation mechanisms [9].
Various algorithms are known which differ in the details of their interpolation and extrapolation strategies [10]. However, only one switching event can be considered for each sample step. Otherwise the sample step has to be divided into several subperiods, which usually does not meet the real-time requirement. Moreover, the approach requires a certain oversampling for appropriate simulation results [11], and it can be concluded that compensation methods are only suitable for low switching frequencies.
A. Advanced Averaging Methods Different averaging methods are known for power
electronics where the dynamics caused by switching are
abstracted by averaging all state variables over a switching period ST . For HIL simulation, the averaging can also be applied over a sampling period T , which might be smaller in the case of oversampling. A well-known approach is the state-space-averaging method (SPAM) [12], in which averaged system matrix are used by applying
( ) ( ) uBBxAAx ⋅⋅+⋅+⋅⋅+⋅= 22112211 dddddtd (2)
where iA , iB are the system matrices for the different segments of the switching period ST and id is their corresponding on-state ratio. SPAM is a promising candidate for use in HIL simulation in general, because unlike other methods, it can easily be applied to different power electronic topologies by generalized algorithms. Nevertheless, the standard SPAM does not consider the DCM, see Fig. 6. A first approach to including the DCM in SPAM was presented in [13], where a correction measure was derived from the physical constraints. In [14] the correction measure was derived more mathematically, yielding correction matrices iW by which the DCM can be considered more systematically for different topologies:
( )( )( )( ) uBBB
xWAWAWAx
⋅−−+++
⋅−−++=
2132211
2133222111
1
1
dddd
dddddtd
. (3)
Although in principle, this modified SPAM allows the DCM to be considered efficiently and with an acceptable computation demand, the segmentation of the interval needs to be known, Fig. 6. While period 1d (on-state ratio) is determined by capturing the corresponding external control signal, 2d (diode conduction ratio) need to be calculated. Up to now, no efficient method is known which can be generalized for use with arbitrary topologies. The above disadvantage can be avoided by the discrete state-space-averaging method (dSPAM) first presented in [15] and extended to the DCM in [16]. The dSPAM was applied to
t
( )tx
1−kt
asynchronous stepextrapolation
kt 1+kt
( )tx2
( )tx1
interpolatedvalues due to theswitching event
BA C D E
Fig. 5. Compensation method: Normal calculation step A to C. Interpolationof event B. Second asynchronous step B to D and extrapolation to E.
t
sT
( )tiL
11
11
,,,
DCBA
STk ⋅ ( ) STddk ⋅++ 21 ( ) STk ⋅+1
STd ⋅2STd ⋅1
22
22
,,,
DCBA
33
33
,,,
DCBA
( ) STdk ⋅+ 1
Fig. 6. Segmentation of the switching period Ts.
ELECTRONICS, VOL. 16, NO. 2, DECEMBER 2012 134
real-time simulation in [17], also including the DCM. Nevertheless, the computation demand of advanced averaging methods is much higher compared to standard average models used today.
B. High-Rate Oversampling FPGA-based real-time model implementations enable
extraordinarily high sampling frequencies. If a real-time model is implemented on a programmable logic device (e.g., FPGA), the sample time can be close to the absolute timing resolution of the digital electronics (e.g., 100 ns). With this high-rate oversampling, switching events no long require special handling. However, the FPGA-based model implementation is less flexible but more costly compared to processor-based real-time systems, since the tool chain for FPGA programming is currently still less convenient and special tools for model implementation are rare.
Nevertheless some approaches, applications and tools for real-time simulation on an FPGA have already been presented, mainly in the domain of power electronics or electric drive simulation. Besides the general implementation issues of FPGAs, an essential question is how the nonlinear switching behavior can be considered efficiently, which causes an alternating system matrix. Replacing the switches by capacitors (off-state) and inductors (on-state) yields an approach ([18], [19]) which enables a simple implementation, but the choice of parameters is limited. There are also other approaches that use a more direct implementation of the nonlinear feedback path, e.g., in [20] or [21].
High-rate oversampling by FPGA-based models is especially interesting for electric power-level simulation (ref. chapter 2). To connect the real-time model to the power stage, fast analog-to-digital capture of the phase voltages and downstream calculation of the voltage-time integral are necessary. Since the required time resolution is considerably smaller than 1µs, FPGA-based implementation is essential, and it makes sense to combine this measurement method with an FPGA-based oversampling model. A corresponding system is presented in [8], where only the model of the three-phase windings is implemented on the FPGA to preserve a certain flexibility. The remaining part of the electric motor model is simulated on a conventional real-time processor.
VII. FUTURE CHALLENGES AND CONCLUSION It is impossible to predict how HIL testing in the automotive
industry will develop in the future. There is still the idea of testing and optimizing the closed-loop controls and calibrating the ECUs by means of HIL simulation. But in practice, development is more influenced by the test requirements of current trends in automotive electronics and cost efficiency. Over the last couple of years, the focus was on large HIL systems for integration testing of large networks of ECU, HIL testing for driver assistant systems, HIL testing of electric drives, and more flexible HIL systems. The standard real-time models were extended by various modules which correspond to new automotive components like modern exhaust systems
(diesel particulate filters or selective catalytic reduction), electric power steering, etc., but only marginally improved regarding their precision. As a careful prediction for the near future, it seems reasonable to assume that more precise simulation of energy consumption might be required.
For the HIL simulation of power electronics and electric drives, currently more powerful but also flexible implementation tools and platforms are desired, which allow modeling based on circuit topology but also take the DCM into account correctly. With respect to performance and generalizability, FPGA-based real-time simulation seems to be more promising than processor-based real-time simulation by advanced implementation methods. Nevertheless, FPGA programming is less flexible and more costly in application and maintenance. Improving the tool chain is the main challenge here. With respect to energy consumption, correct simulation of power-flow and power losses in electronic circuitry might become a requirement. How this can be realized is an open question, since up to now, very simple model approaches for semiconductor switches are used for all real-time models for power electronics.
REFERENCES [1] H. Schuette, P. Waeltermann, “Hardware-In-the-Loop Testing of Vehicle
Controllers – A Technical Survey”, Proc. of SAE’05, SAE Paper No. 2005-01-1660, Detroit, Feb. 2005.
[2] H. Schuette, M. Ploeger, “Hardware-In-the-Loop Testing of Engine Control Units – A Technical Survey”, Proc. of SAE’07, SAE Paper No. 2007-01-282, Detroit, Feb. 2007.
[3] T. Keller, E. Scheiben, P. Terwiesch, “Digital Real-Time hardware-in-the-loop Simulation for Rail Vehicles: A Case Study”, Proc. of 7th Europ. Conf. on Power Electr. and Appl., EPE'97, Trondheim, Sept., 1997.
[4] Ch. Dufour, J. Belanger, S. Abourida, “Using Real-Time Simulation in Hybrid Electric Drive and Power Electronics Development: Process, Problems and Solutions”, Proc. of SAE’05, SAE Paper No. 2006-01-0114, Detroit, Feb. 2006.
[5] A. Wagener, T. Schulte, P. Waeltermann, H. Schuette, “hardware-in-the-loop Test Systems for Electric Machines in Advanced Powertrain Applications”, Proc. of SAE’07, SAE Paper No. 2007-01-498, Detroit, Feb. 2007.
[6] T. Schulte, J. Bracker, „Real-Time Simulation of BLDC Motors for hardware-in-the-loop Applications Incorporating Sensorless Control“, Proc. of IEEE Int. Symp. on Industrial Electronics (ISIE), Cambridge, UK, June, 2008.
[7] J. Bracker, M. Dolle, “Simulation of Inductive Loads,” Proc. of IEEE International Symposium on Industrial Electronics (ISIE) 2007, Paper No. VF-004111, Vigo, June, 2007.
[8] T. Schulte, J. Bracker, „Real-Time Simulation of Electric Drives by Electronic Load-Emulation“, IFAC Symposium, July 2010, Munich, Germany.
[9] C. Dufour, J. Belanger, “Discrete time compensation of switching events for accurate real-time simulation of power systems”, IEEE Industrial Electronics Society IECON 2001, Vol. 2, pp. 1533-1538.
[10] M. O. Faruque, V. Dinavahi, W. Xu, „Algorithms for the Accounting of Multiple Switching Events in Digital Simulation of Power-Electronic Systems”, IEEE Trans. on Power Delivery, Vol. 20, No. 2, April 2005.
[11] C. Graf, J. Maas, T. Schulte, J. Weise-Emden, „Real-time HIL-simulation of Power Electronics”, 34th Ann. Conf. of the IEEE Ind. Electronics Society, IECON 2008, Orlando, USA, pp. 2829-2834.
[12] R. D. Middlebrook, „Small-Signal Modeling of Pulse-Width Modulated Switched-Mode Power Converters”, Proceedings of the IEEE, Vol. 76 No. 4, April 1988, pp. 343-354.
[13] J. Sun, D. M. Mitchell, M. F. Greuel, P. T. Krein, R. M. Bass, „Averaged Modeling of PWM Converters Operating in Discontinuous Conduction

ELECTRONICS, VOL. 16, NO. 2, DECEMBER 2012 135
Mode”, IEEE Transaction on Power Electronics, Vol. 16, No. 4, July 2001, pp. 482-492.
[14] A. Davoudi, J. Jatskevich, „Parasitics Realization in State-Space Average-Value Modeling of PWM DC-DC Converters Using an Equal Area Method”, IEEE Transactions on Circuits and Systems, Vol. 75, No. 9; September 2007, pp. 1960-1967.
[15] M. S. Al-Numay, “A New Discrete-Time Simulation Method for Switched Systems Using Averaging”, International Journal of Modelling and Simulation, vol. 21, no. 4, 2001.
[16] M. S. Al-Numay, “Discrete-Time Model for PWM Converters in Discontinuous Conduction Mode”, 12th International Power Electronics and Motion Control Conference, 2006.
[17] A. Kiffe, S. Geng, T. Schulte, J. Maas, „Real-Time Simulation of Power Electronic Circuits based on Discrete Averaging Method“, Ann. Conf. of IEEE Ind. Electr. Society, IECON 2011, Melbourne, Australia.
[18] M. Matar, M. Abdel-Rahman, A.-M. Soliman, „FPGA-Based Real-Time Digital Simulation”, International Conference on Power Systems Transients, 2005.
[19] T. O. Bachir, C. Dufour, J. P. David, J. Belanger, J. Mahseredjian, „Reconfigurable Floating-Point Engines for the Real-Time Simulation of PECs: A High-Speed PMSM Drive Case Study”, ELECTRIMACS 2011, June, 2011, Cergy-Pontoise, France.
[20] J. C. G. Pimentel, „Implementation of Simulation Algorithms in FPGA for Real Time Simulation of Electrical Networks with Power Electronics Devices”, IEEE International Conference on Reconfigurable Computing and FPGA’s, 2006.
[21] D. Majstorovic, Z. Pele, A. Kovacevic, N. Celanovic, „Computer based emulation of power electronics hardware”, IEEE Eastern European Conference on the Engineering of Computer Based Systems, 2009.
ELECTRONICS, VOL. 16, NO. 2, DECEMBER 2012
DOI: 10.7251/ELS1216136B
136
Abstract—Hynets, for Hybrid (living-artificial) Networks, are
an efficient and adaptable experimental support to explore the dynamics and the adaptation process of biological systems. We present in this paper an innovative platform performing a real-time closed-loop between a cultured network (e.g. neurons) and an artificial processing (e.g. software processing or a robotic interface). The system gathers bioware, hardware, and software components and ensures the closed-loop data processing in less than 50 µs. We describe also a methodology that may help to standardize the description of some experiments. This method is associated to a full custom Graphical User Interface. We detail here the system choices, components, and performances.
Index Terms—Bioelectronics, Closed loop systems, Real-time data processing, Hybrid (living-artificial) networks, MEA (MultiElectrode Arrays), in vitro cell culturing.
I. INTRODUCTION IOELECTRONICS is the discipline resulting from the convergence of biology and electronics. It includes the
design and use of electronics for biology and medicine. Medicine is a strong driver for bioelectronics as illustrated by devices such as: neural stimulators [1], brain stimulators [2], cochlear implants [3], neuromuscular reanimation [4], brain-machine interface [5]. Other devices are under investigation by a very active research community: retinal prostheses [6], cognitive prostheses [7], and detection of insulin need [8].
We focus here on Hybrid Networks (Hynet). Hynets are real-time closed-loop hybrid systems that embody living and artificial elements. “Closed-loop” means that there is a two-way communication between those parts, and that each one receives controlling inputs from the other. “Real-time” means that this communication is fast enough to avoid any serious break on the data flow (losing or delaying).
Hynets are unique platforms for integrative biology investigations. Electronics circuitry in Hynets can emulate a functional neural network embodied inside a living network to form a unique hybrid network, as long as real-time
Manuscript received 10 June 2012. Received in revised form 16 December
2012. Accepted for publication 17 December 2012. This work was supported by the European Union, through the projects Neurobit (IST–2001-33564) and Facets (FP6-2004-IST-FETPI 15879).
G. Bontorin, C. Lopez and Sylvie Renaud are with the IMS Laboratory, University of Bordeaux, UMR 5218 CNRS, Bordeaux, France (e-mail: [email protected]). A. Garenne and G. Le Masson are with INSERM-E358, University of Bordeaux, 146 rue Léo Saignat, F-33076 Bordeaux, France.
communication is ensured between the artificial and the living parts. By controlling the circuitry configuration and parameters, researchers can study the functionality and activity patterns of the hybrid neural network as a whole, or characterize the living part. As detailed in the last section of the paper, our system is intended to be used for the study of plasticity in living neural networks, the influence of electromagnetic fields on the connectivity of neural networks and the characterization of electrical activity in electrogenic cells and islets in the pancreas.
In all bioelectronics systems, the developer has to define specifications related to both biological and electronics fields. Concerning biology, options are: in vivo or in vitro experiments, acute slice or dissociate cultures, and intracellular or extracellular interfaces. On the electronics point of view, rough implementation categories are: software or hardware, discrete components or integrated circuits (IC), and digital or analog data processing. Regarding the literature examples (Table I), we can see that almost all possible combinations of these choices, both in Electronics and Biology, are under investigation ([7, 9-18]).
Quantitative comparison of our system performances with the literature ([7, 9-18]) is however difficult: no standard exists to characterize it, and technical characteristics of experimental platforms are not always specified in publications. Our paper presents a precise and constrained evaluation of our system’s design. It adds to [19], which was focused mostly on the hardware, a detailed description of the software and a template format to standardize the experiment description.
In this paper, we detail each choice and the consequent constituting blocks of our closed-loop in section II. Section III presents the detailed data flow, with the methodology we intend to promote standardization in experimental the description of experiments. Section IV describes time performances. This takes us to discuss the achievement and the uses of Hynet (section V).
II. HYNET CHOICES AND PARTS The two parts, artificial and living, of the hybrid network
(Hynet) communicate in bidirectional mode with each other: each provides outputs and receives controlling inputs from the other. The hardware and software parts of the artificial system run the bioware data acquisition, its processing, and the
Design of a Bioelectronics Hybrid System in Real Time and in Closed Loop
Guilherme Bontorin, André Garenne, Colin Lopez, Gwendal Le Masson, and Sylvie Renaud
B
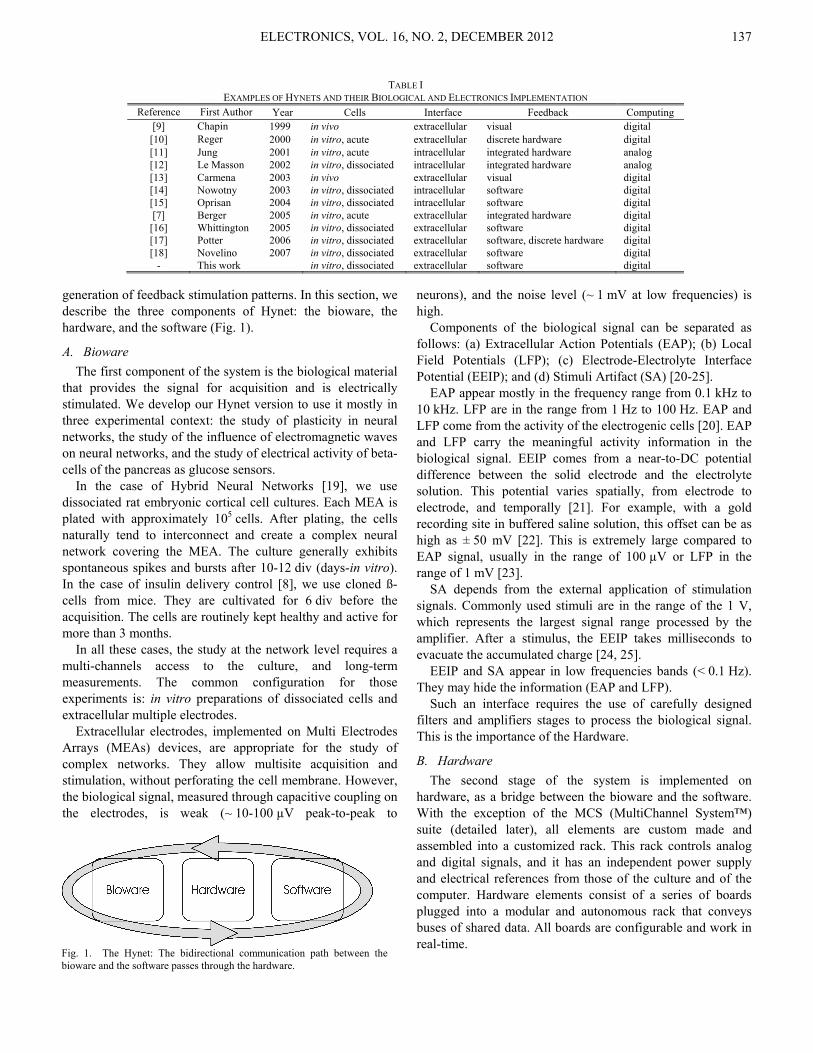
ELECTRONICS, VOL. 16, NO. 2, DECEMBER 2012 137
generation of feedback stimulation patterns. In this section, we describe the three components of Hynet: the bioware, the hardware, and the software (Fig. 1).
A. Bioware The first component of the system is the biological material
that provides the signal for acquisition and is electrically stimulated. We develop our Hynet version to use it mostly in three experimental context: the study of plasticity in neural networks, the study of the influence of electromagnetic waves on neural networks, and the study of electrical activity of beta-cells of the pancreas as glucose sensors.
In the case of Hybrid Neural Networks [19], we use dissociated rat embryonic cortical cell cultures. Each MEA is plated with approximately 105 cells. After plating, the cells naturally tend to interconnect and create a complex neural network covering the MEA. The culture generally exhibits spontaneous spikes and bursts after 10-12 div (days-in vitro). In the case of insulin delivery control [8], we use cloned ß-cells from mice. They are cultivated for 6 div before the acquisition. The cells are routinely kept healthy and active for more than 3 months.
In all these cases, the study at the network level requires a multi-channels access to the culture, and long-term measurements. The common configuration for those experiments is: in vitro preparations of dissociated cells and extracellular multiple electrodes.
Extracellular electrodes, implemented on Multi Electrodes Arrays (MEAs) devices, are appropriate for the study of complex networks. They allow multisite acquisition and stimulation, without perforating the cell membrane. However, the biological signal, measured through capacitive coupling on the electrodes, is weak (~ 10-100 µV peak-to-peak to
neurons), and the noise level (~ 1 mV at low frequencies) is high.
Components of the biological signal can be separated as follows: (a) Extracellular Action Potentials (EAP); (b) Local Field Potentials (LFP); (c) Electrode-Electrolyte Interface Potential (EEIP); and (d) Stimuli Artifact (SA) [20-25].
EAP appear mostly in the frequency range from 0.1 kHz to 10 kHz. LFP are in the range from 1 Hz to 100 Hz. EAP and LFP come from the activity of the electrogenic cells [20]. EAP and LFP carry the meaningful activity information in the biological signal. EEIP comes from a near-to-DC potential difference between the solid electrode and the electrolyte solution. This potential varies spatially, from electrode to electrode, and temporally [21]. For example, with a gold recording site in buffered saline solution, this offset can be as high as ± 50 mV [22]. This is extremely large compared to EAP signal, usually in the range of 100 µV or LFP in the range of 1 mV [23].
SA depends from the external application of stimulation signals. Commonly used stimuli are in the range of the 1 V, which represents the largest signal range processed by the amplifier. After a stimulus, the EEIP takes milliseconds to evacuate the accumulated charge [24, 25].
EEIP and SA appear in low frequencies bands (< 0.1 Hz). They may hide the information (EAP and LFP).
Such an interface requires the use of carefully designed filters and amplifiers stages to process the biological signal. This is the importance of the Hardware.
B. Hardware The second stage of the system is implemented on
hardware, as a bridge between the bioware and the software. With the exception of the MCS (MultiChannel System™) suite (detailed later), all elements are custom made and assembled into a customized rack. This rack controls analog and digital signals, and it has an independent power supply and electrical references from those of the culture and of the computer. Hardware elements consist of a series of boards plugged into a modular and autonomous rack that conveys buses of shared data. All boards are configurable and work in real-time.
TABLE I EXAMPLES OF HYNETS AND THEIR BIOLOGICAL AND ELECTRONICS IMPLEMENTATION
Reference First Author Year Cells Interface Feedback Computing [9] Chapin 1999 in vivo extracellular visual digital
[10] Reger 2000 in vitro, acute extracellular discrete hardware digital [11] Jung 2001 in vitro, acute intracellular integrated hardware analog [12] Le Masson 2002 in vitro, dissociated intracellular integrated hardware analog [13] Carmena 2003 in vivo extracellular visual digital [14] Nowotny 2003 in vitro, dissociated intracellular software digital [15] Oprisan 2004 in vitro, dissociated intracellular software digital [7] Berger 2005 in vitro, acute extracellular integrated hardware digital
[16] Whittington 2005 in vitro, dissociated extracellular software digital [17] Potter 2006 in vitro, dissociated extracellular software, discrete hardware digital [18] Novelino 2007 in vitro, dissociated extracellular software digital
- This work in vitro, dissociated extracellular software digital
Fig. 1. The Hynet: The bidirectional communication path between the bioware and the software passes through the hardware.
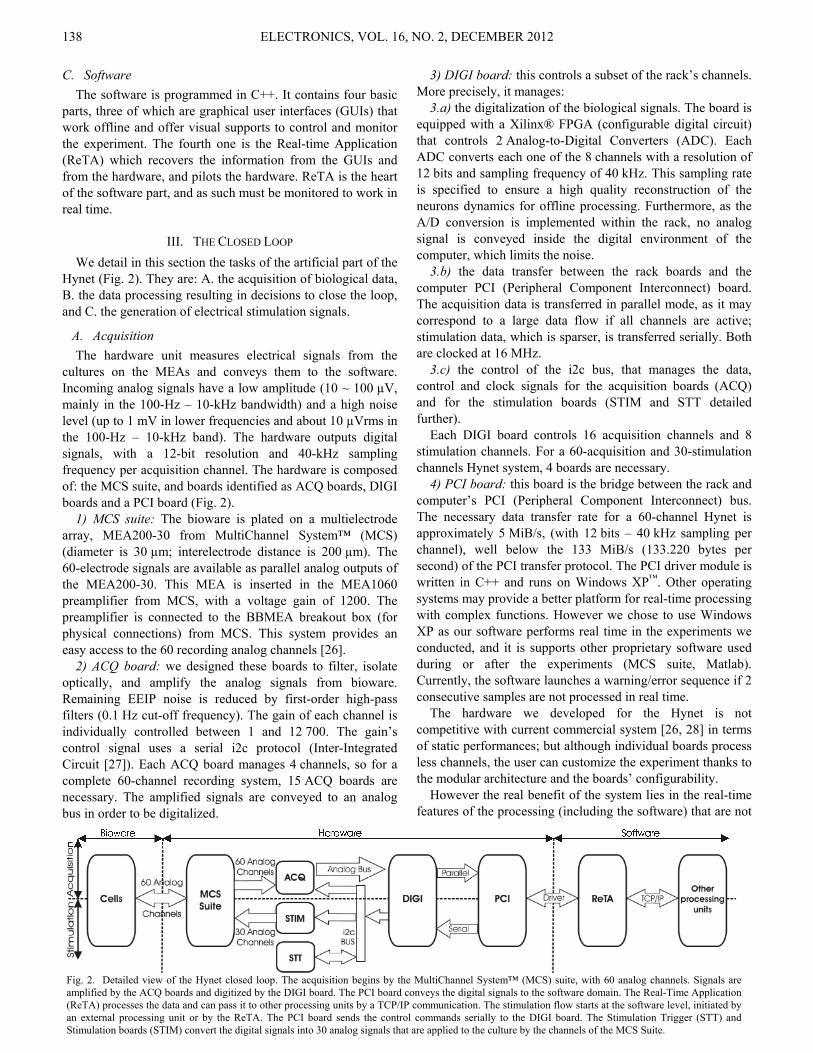
ELECTRONICS, VOL. 16, NO. 2, DECEMBER 2012 138
C. Software The software is programmed in C++. It contains four basic
parts, three of which are graphical user interfaces (GUIs) that work offline and offer visual supports to control and monitor the experiment. The fourth one is the Real-time Application (ReTA) which recovers the information from the GUIs and from the hardware, and pilots the hardware. ReTA is the heart of the software part, and as such must be monitored to work in real time.
III. THE CLOSED LOOP We detail in this section the tasks of the artificial part of the
Hynet (Fig. 2). They are: A. the acquisition of biological data, B. the data processing resulting in decisions to close the loop, and C. the generation of electrical stimulation signals.
A. Acquisition The hardware unit measures electrical signals from the
cultures on the MEAs and conveys them to the software. Incoming analog signals have a low amplitude (10 ~ 100 µV, mainly in the 100-Hz – 10-kHz bandwidth) and a high noise level (up to 1 mV in lower frequencies and about 10 µVrms in the 100-Hz – 10-kHz band). The hardware outputs digital signals, with a 12-bit resolution and 40-kHz sampling frequency per acquisition channel. The hardware is composed of: the MCS suite, and boards identified as ACQ boards, DIGI boards and a PCI board (Fig. 2).
1) MCS suite: The bioware is plated on a multielectrode array, MEA200-30 from MultiChannel System™ (MCS) (diameter is 30 µm; interelectrode distance is 200 µm). The 60-electrode signals are available as parallel analog outputs of the MEA200-30. This MEA is inserted in the MEA1060 preamplifier from MCS, with a voltage gain of 1200. The preamplifier is connected to the BBMEA breakout box (for physical connections) from MCS. This system provides an easy access to the 60 recording analog channels [26].
2) ACQ board: we designed these boards to filter, isolate optically, and amplify the analog signals from bioware. Remaining EEIP noise is reduced by first-order high-pass filters (0.1 Hz cut-off frequency). The gain of each channel is individually controlled between 1 and 12 700. The gain’s control signal uses a serial i2c protocol (Inter-Integrated Circuit [27]). Each ACQ board manages 4 channels, so for a complete 60-channel recording system, 15 ACQ boards are necessary. The amplified signals are conveyed to an analog bus in order to be digitalized.
3) DIGI board: this controls a subset of the rack’s channels. More precisely, it manages:
3.a) the digitalization of the biological signals. The board is equipped with a Xilinx® FPGA (configurable digital circuit) that controls 2 Analog-to-Digital Converters (ADC). Each ADC converts each one of the 8 channels with a resolution of 12 bits and sampling frequency of 40 kHz. This sampling rate is specified to ensure a high quality reconstruction of the neurons dynamics for offline processing. Furthermore, as the A/D conversion is implemented within the rack, no analog signal is conveyed inside the digital environment of the computer, which limits the noise.
3.b) the data transfer between the rack boards and the computer PCI (Peripheral Component Interconnect) board. The acquisition data is transferred in parallel mode, as it may correspond to a large data flow if all channels are active; stimulation data, which is sparser, is transferred serially. Both are clocked at 16 MHz.
3.c) the control of the i2c bus, that manages the data, control and clock signals for the acquisition boards (ACQ) and for the stimulation boards (STIM and STT detailed further).
Each DIGI board controls 16 acquisition channels and 8 stimulation channels. For a 60-acquisition and 30-stimulation channels Hynet system, 4 boards are necessary.
4) PCI board: this board is the bridge between the rack and computer’s PCI (Peripheral Component Interconnect) bus. The necessary data transfer rate for a 60-channel Hynet is approximately 5 MiB/s, (with 12 bits – 40 kHz sampling per channel), well below the 133 MiB/s (133.220 bytes per second) of the PCI transfer protocol. The PCI driver module is written in C++ and runs on Windows XP™. Other operating systems may provide a better platform for real-time processing with complex functions. However we chose to use Windows XP as our software performs real time in the experiments we conducted, and it is supports other proprietary software used during or after the experiments (MCS suite, Matlab). Currently, the software launches a warning/error sequence if 2 consecutive samples are not processed in real time.
The hardware we developed for the Hynet is not competitive with current commercial system [26, 28] in terms of static performances; but although individual boards process less channels, the user can customize the experiment thanks to the modular architecture and the boards’ configurability.
However the real benefit of the system lies in the real-time features of the processing (including the software) that are not
Fig. 2. Detailed view of the Hynet closed loop. The acquisition begins by the MultiChannel System™ (MCS) suite, with 60 analog channels. Signals are amplified by the ACQ boards and digitized by the DIGI board. The PCI board conveys the digital signals to the software domain. The Real-Time Application (ReTA) processes the data and can pass it to other processing units by a TCP/IP communication. The stimulation flow starts at the software level, initiated by an external processing unit or by the ReTA. The PCI board sends the control commands serially to the DIGI board. The Stimulation Trigger (STT) and Stimulation boards (STIM) convert the digital signals into 30 analog signals that are applied to the culture by the channels of the MCS Suite.

ELECTRONICS, VOL. 16, NO. 2, DECEMBER 2012 139
present in commercial systems. The biological signals are available to the software, which
is designed as a Real-Time Application (ReTA). Its functions are:
1) Raw signal monitoring: data from 60 channels can be displayed in real time on the computer screen (Fig. 3.A). A zoomed view can also be selected for a single channel (Fig. 3.C).
2) Events detection: three types of patterns are extracted from the raw neural data: spikes, bursts, and stimulus artifacts.
A spike is a short electrical depolarization of a cell membrane. Extracellular spikes often reach amplitudes of 50 µVeil (equivalent input level). After hardware processing, noise amplitudes are estimated to be about 15 µVeil. Thanks to this level difference between spikes and noise, spikes can be detected by thresholding the signal, but the optimum threshold AC and DC may differ over the channels or even evolve over time.
ReTA presents two techniques to set the threshold. The first one is to define it as a fixed voltage value, defined by the user (for example by looking at the monitored signal). The second
use the standard deviation (SD) of the signal as an estimation of the noise. The threshold is defined as a multiple (n) of SD. “n” is normally set in between 3 and 5, in order to avoid spike detection errors (false negative or false positive detection).
In order to present less than 1 ‰ of false positive decisions (the system interprets noise as a spike), “n” is usually set to be larger than 3. The maximum value is 5, after which the false negative decisions (true spikes are not detected) are too frequent. SD is continuously updated on line.
For our application, a “burst” is a pattern of N spikes on the same channel in a temporal window of duration W. For example, if a channel has three or more spikes (N = 3) in less than 10 ms (W = 10), this event is considered to be a burst. Both values, N and W, are programmable by the user before the experiment.
To implement burst detection, we create at the start of the experiment a circular buffer for each channel where a burst detection is required. Taking into account the sampling frequency (f) of the acquisition, the number of elements of a buffer is (W.f). After each acquisition sampling, the buffer is updated; depending on the values of the first element and the new element, the total number of spikes (S) is changed; the first element is overwritten by the new element; and the pointers of last and first elements are increased. If the total number of spikes in the buffer reaches the number of spikes in
a burst (S ≥ N), a burst is validated for the current timestamp. Stimulus artifacts are detected by a simple thresholding
method. Biologically effective stimulations generate artifacts that saturate the acquisition channel. Consequently, the
Fig. 3. Real-time monitoring of neural bursting activities induced by stimulations. (A) 60 raw signals in 1-second windows. (B) Bursts detection figure on the 60 channels; white: no burst detected; grey: burst detected within the last 0.25 s. (C) A zoomed view of one channel. We highlighted the stimulus and evoked burst. (D) Inter-Spike Interval (ISI) and (E) Post-Stimulus Timing Histogram (PSTH) for one channel. IFR stands for Instantaneous Firing Rates, IBI stands for Inter-Burst intervals; IFR and IBI are not presented here.
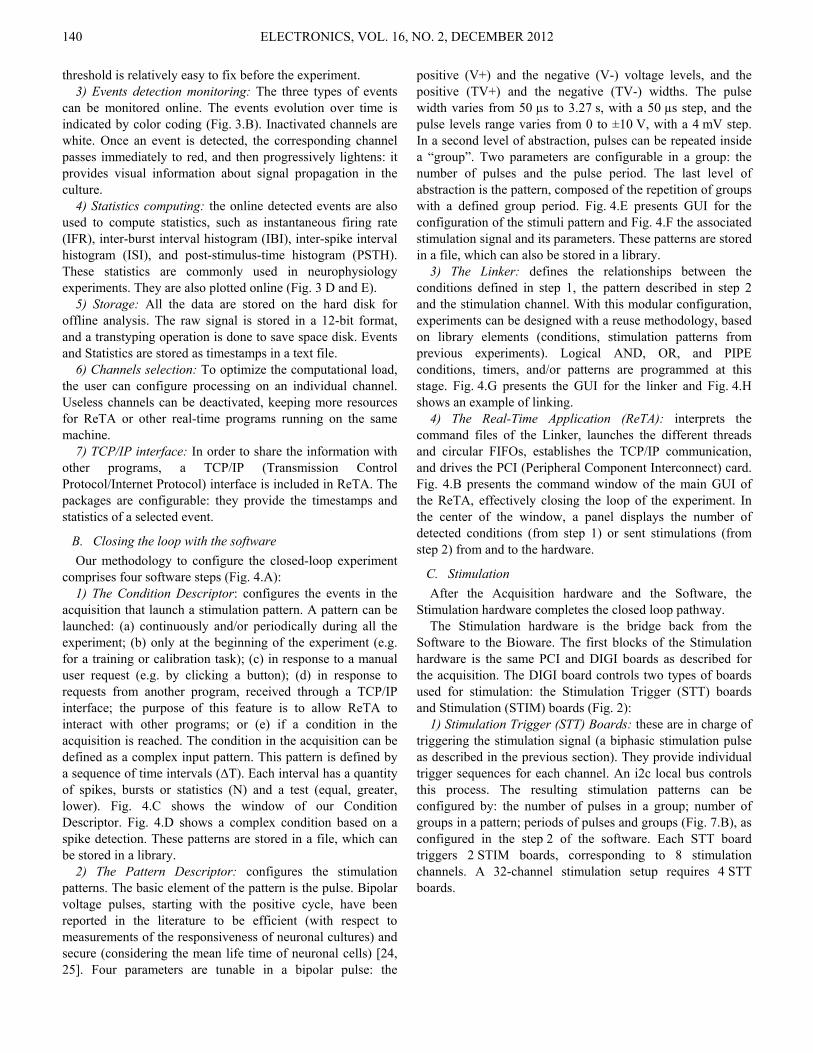
ELECTRONICS, VOL. 16, NO. 2, DECEMBER 2012 140
threshold is relatively easy to fix before the experiment. 3) Events detection monitoring: The three types of events
can be monitored online. The events evolution over time is indicated by color coding (Fig. 3.B). Inactivated channels are white. Once an event is detected, the corresponding channel passes immediately to red, and then progressively lightens: it provides visual information about signal propagation in the culture.
4) Statistics computing: the online detected events are also used to compute statistics, such as instantaneous firing rate (IFR), inter-burst interval histogram (IBI), inter-spike interval histogram (ISI), and post-stimulus-time histogram (PSTH). These statistics are commonly used in neurophysiology experiments. They are also plotted online (Fig. 3 D and E).
5) Storage: All the data are stored on the hard disk for offline analysis. The raw signal is stored in a 12-bit format, and a transtyping operation is done to save space disk. Events and Statistics are stored as timestamps in a text file.
6) Channels selection: To optimize the computational load, the user can configure processing on an individual channel. Useless channels can be deactivated, keeping more resources for ReTA or other real-time programs running on the same machine.
7) TCP/IP interface: In order to share the information with other programs, a TCP/IP (Transmission Control Protocol/Internet Protocol) interface is included in ReTA. The packages are configurable: they provide the timestamps and statistics of a selected event.
B. Closing the loop with the software Our methodology to configure the closed-loop experiment
comprises four software steps (Fig. 4.A): 1) The Condition Descriptor: configures the events in the
acquisition that launch a stimulation pattern. A pattern can be launched: (a) continuously and/or periodically during all the experiment; (b) only at the beginning of the experiment (e.g. for a training or calibration task); (c) in response to a manual user request (e.g. by clicking a button); (d) in response to requests from another program, received through a TCP/IP interface; the purpose of this feature is to allow ReTA to interact with other programs; or (e) if a condition in the acquisition is reached. The condition in the acquisition can be defined as a complex input pattern. This pattern is defined by a sequence of time intervals (∆T). Each interval has a quantity of spikes, bursts or statistics (N) and a test (equal, greater, lower). Fig. 4.C shows the window of our Condition Descriptor. Fig. 4.D shows a complex condition based on a spike detection. These patterns are stored in a file, which can be stored in a library.
2) The Pattern Descriptor: configures the stimulation patterns. The basic element of the pattern is the pulse. Bipolar voltage pulses, starting with the positive cycle, have been reported in the literature to be efficient (with respect to measurements of the responsiveness of neuronal cultures) and secure (considering the mean life time of neuronal cells) [24, 25]. Four parameters are tunable in a bipolar pulse: the
positive (V+) and the negative (V-) voltage levels, and the positive (TV+) and the negative (TV-) widths. The pulse width varies from 50 µs to 3.27 s, with a 50 µs step, and the pulse levels range varies from 0 to ±10 V, with a 4 mV step. In a second level of abstraction, pulses can be repeated inside a “group”. Two parameters are configurable in a group: the number of pulses and the pulse period. The last level of abstraction is the pattern, composed of the repetition of groups with a defined group period. Fig. 4.E presents GUI for the configuration of the stimuli pattern and Fig. 4.F the associated stimulation signal and its parameters. These patterns are stored in a file, which can also be stored in a library.
3) The Linker: defines the relationships between the conditions defined in step 1, the pattern described in step 2 and the stimulation channel. With this modular configuration, experiments can be designed with a reuse methodology, based on library elements (conditions, stimulation patterns from previous experiments). Logical AND, OR, and PIPE conditions, timers, and/or patterns are programmed at this stage. Fig. 4.G presents the GUI for the linker and Fig. 4.H shows an example of linking.
4) The Real-Time Application (ReTA): interprets the command files of the Linker, launches the different threads and circular FIFOs, establishes the TCP/IP communication, and drives the PCI (Peripheral Component Interconnect) card. Fig. 4.B presents the command window of the main GUI of the ReTA, effectively closing the loop of the experiment. In the center of the window, a panel displays the number of detected conditions (from step 1) or sent stimulations (from step 2) from and to the hardware.
C. Stimulation After the Acquisition hardware and the Software, the
Stimulation hardware completes the closed loop pathway. The Stimulation hardware is the bridge back from the
Software to the Bioware. The first blocks of the Stimulation hardware is the same PCI and DIGI boards as described for the acquisition. The DIGI board controls two types of boards used for stimulation: the Stimulation Trigger (STT) boards and Stimulation (STIM) boards (Fig. 2):
1) Stimulation Trigger (STT) Boards: these are in charge of triggering the stimulation signal (a biphasic stimulation pulse as described in the previous section). They provide individual trigger sequences for each channel. An i2c local bus controls this process. The resulting stimulation patterns can be configured by: the number of pulses in a group; number of groups in a pattern; periods of pulses and groups (Fig. 7.B), as configured in the step 2 of the software. Each STT board triggers 2 STIM boards, corresponding to 8 stimulation channels. A 32-channel stimulation setup requires 4 STT boards.
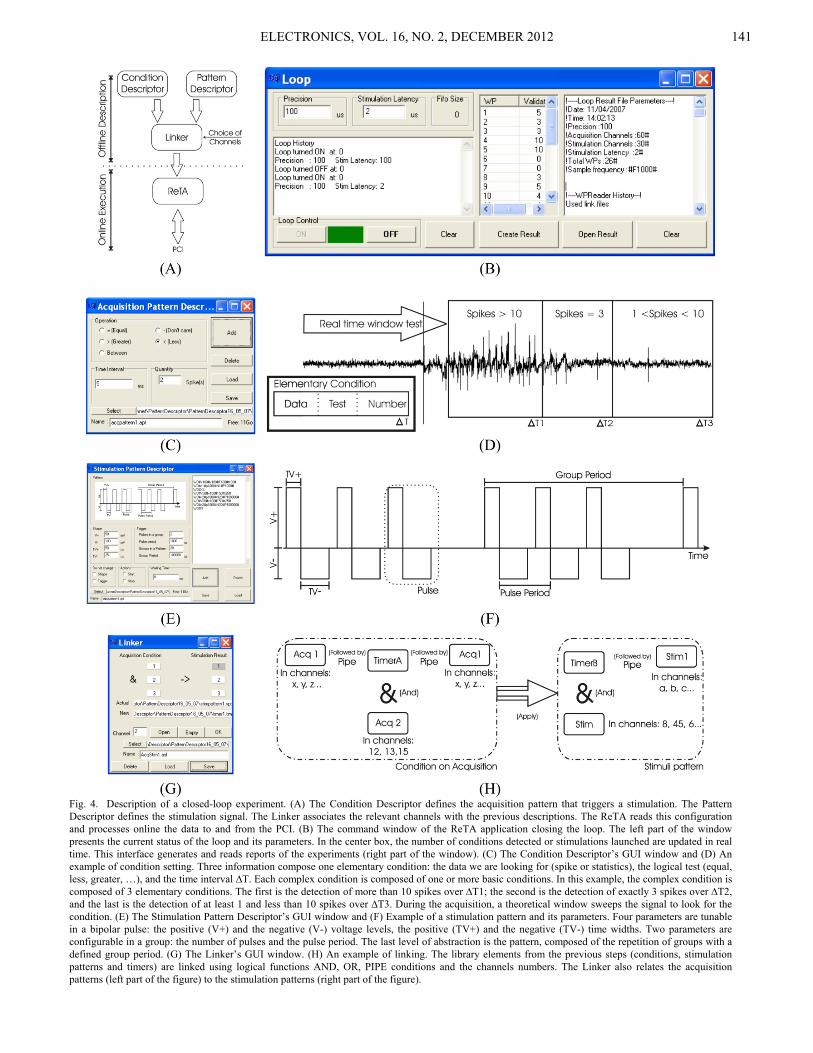
ELECTRONICS, VOL. 16, NO. 2, DECEMBER 2012 141
Fig. 4. Description of a closed-loop experiment. (A) The Condition Descriptor defines the acquisition pattern that triggers a stimulation. The Pattern Descriptor defines the stimulation signal. The Linker associates the relevant channels with the previous descriptions. The ReTA reads this configuration and processes online the data to and from the PCI. (B) The command window of the ReTA application closing the loop. The left part of the window presents the current status of the loop and its parameters. In the center box, the number of conditions detected or stimulations launched are updated in real time. This interface generates and reads reports of the experiments (right part of the window). (C) The Condition Descriptor’s GUI window and (D) An example of condition setting. Three information compose one elementary condition: the data we are looking for (spike or statistics), the logical test (equal, less, greater, …), and the time interval ∆T. Each complex condition is composed of one or more basic conditions. In this example, the complex condition is composed of 3 elementary conditions. The first is the detection of more than 10 spikes over ∆T1; the second is the detection of exactly 3 spikes over ∆T2, and the last is the detection of at least 1 and less than 10 spikes over ∆T3. During the acquisition, a theoretical window sweeps the signal to look for the condition. (E) The Stimulation Pattern Descriptor’s GUI window and (F) Example of a stimulation pattern and its parameters. Four parameters are tunable in a bipolar pulse: the positive (V+) and the negative (V-) voltage levels, the positive (TV+) and the negative (TV-) time widths. Two parameters are configurable in a group: the number of pulses and the pulse period. The last level of abstraction is the pattern, composed of the repetition of groups with a defined group period. (G) The Linker’s GUI window. (H) An example of linking. The library elements from the previous steps (conditions, stimulation patterns and timers) are linked using logical functions AND, OR, PIPE conditions and the channels numbers. The Linker also relates the acquisition patterns (left part of the figure) to the stimulation patterns (right part of the figure).
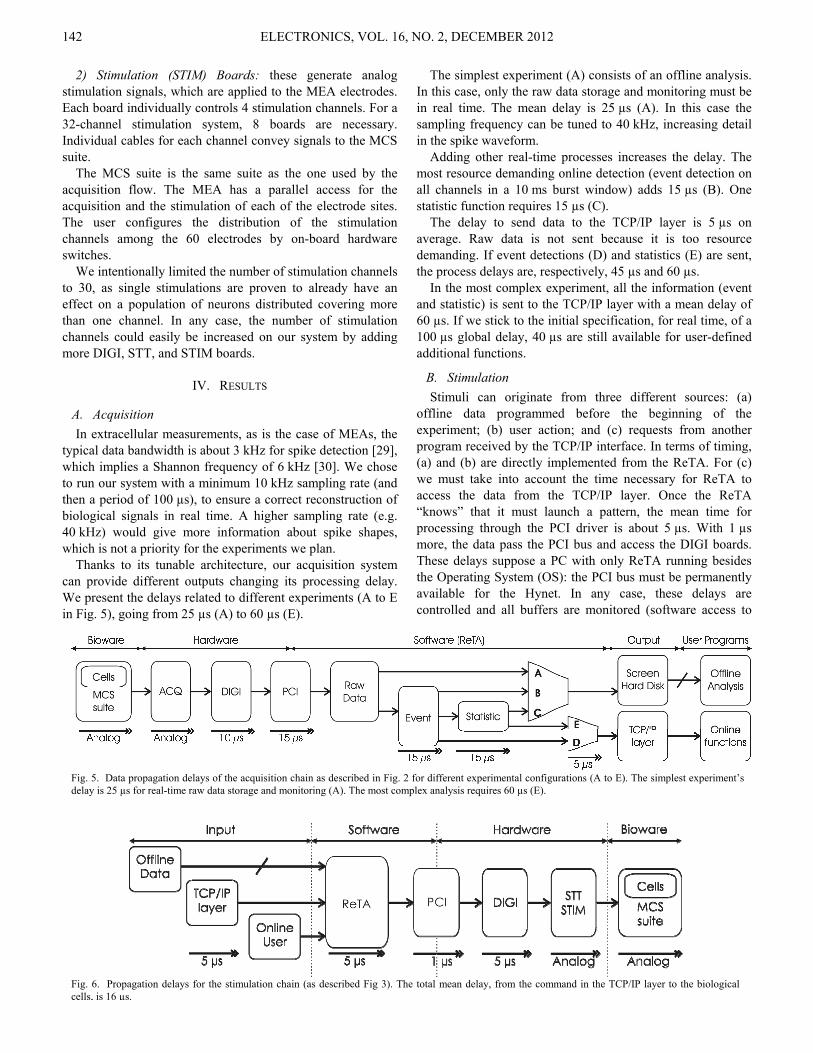
ELECTRONICS, VOL. 16, NO. 2, DECEMBER 2012 142
2) Stimulation (STIM) Boards: these generate analog stimulation signals, which are applied to the MEA electrodes. Each board individually controls 4 stimulation channels. For a 32-channel stimulation system, 8 boards are necessary. Individual cables for each channel convey signals to the MCS suite.
The MCS suite is the same suite as the one used by the acquisition flow. The MEA has a parallel access for the acquisition and the stimulation of each of the electrode sites. The user configures the distribution of the stimulation channels among the 60 electrodes by on-board hardware switches.
We intentionally limited the number of stimulation channels to 30, as single stimulations are proven to already have an effect on a population of neurons distributed covering more than one channel. In any case, the number of stimulation channels could easily be increased on our system by adding more DIGI, STT, and STIM boards.
IV. RESULTS
A. Acquisition In extracellular measurements, as is the case of MEAs, the
typical data bandwidth is about 3 kHz for spike detection [29], which implies a Shannon frequency of 6 kHz [30]. We chose to run our system with a minimum 10 kHz sampling rate (and then a period of 100 µs), to ensure a correct reconstruction of biological signals in real time. A higher sampling rate (e.g. 40 kHz) would give more information about spike shapes, which is not a priority for the experiments we plan.
Thanks to its tunable architecture, our acquisition system can provide different outputs changing its processing delay. We present the delays related to different experiments (A to E in Fig. 5), going from 25 µs (A) to 60 µs (E).
The simplest experiment (A) consists of an offline analysis. In this case, only the raw data storage and monitoring must be in real time. The mean delay is 25 µs (A). In this case the sampling frequency can be tuned to 40 kHz, increasing detail in the spike waveform.
Adding other real-time processes increases the delay. The most resource demanding online detection (event detection on all channels in a 10 ms burst window) adds 15 µs (B). One statistic function requires 15 µs (C).
The delay to send data to the TCP/IP layer is 5 µs on average. Raw data is not sent because it is too resource demanding. If event detections (D) and statistics (E) are sent, the process delays are, respectively, 45 µs and 60 µs.
In the most complex experiment, all the information (event and statistic) is sent to the TCP/IP layer with a mean delay of 60 µs. If we stick to the initial specification, for real time, of a 100 µs global delay, 40 µs are still available for user-defined additional functions.
B. Stimulation Stimuli can originate from three different sources: (a)
offline data programmed before the beginning of the experiment; (b) user action; and (c) requests from another program received by the TCP/IP interface. In terms of timing, (a) and (b) are directly implemented from the ReTA. For (c) we must take into account the time necessary for ReTA to access the data from the TCP/IP layer. Once the ReTA “knows” that it must launch a pattern, the mean time for processing through the PCI driver is about 5 µs. With 1 µs more, the data pass the PCI bus and access the DIGI boards. These delays suppose a PC with only ReTA running besides the Operating System (OS): the PCI bus must be permanently available for the Hynet. In any case, these delays are controlled and all buffers are monitored (software access to
Fig. 6. Propagation delays for the stimulation chain (as described Fig 3). The total mean delay, from the command in the TCP/IP layer to the biological cells, is 16 µs.
Fig. 5. Data propagation delays of the acquisition chain as described in Fig. 2 for different experimental configurations (A to E). The simplest experiment’s delay is 25 µs for real-time raw data storage and monitoring (A). The most complex analysis requires 60 µs (E).
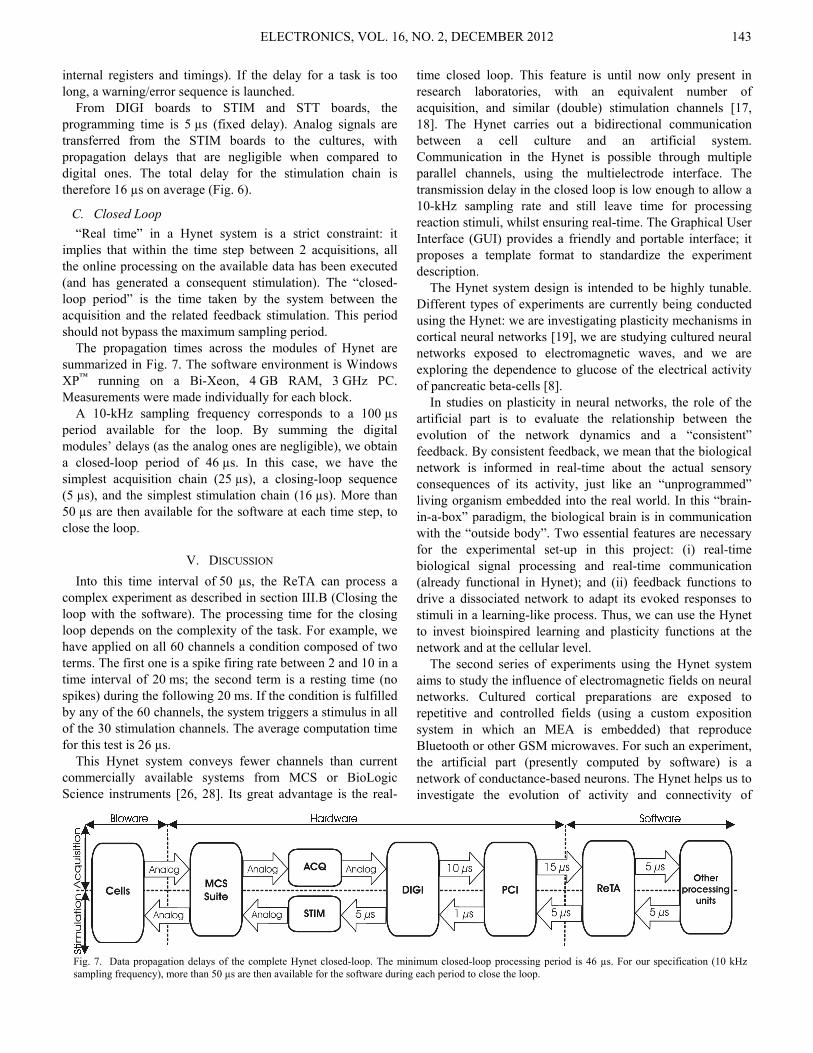
ELECTRONICS, VOL. 16, NO. 2, DECEMBER 2012 143
internal registers and timings). If the delay for a task is too long, a warning/error sequence is launched.
From DIGI boards to STIM and STT boards, the programming time is 5 µs (fixed delay). Analog signals are transferred from the STIM boards to the cultures, with propagation delays that are negligible when compared to digital ones. The total delay for the stimulation chain is therefore 16 µs on average (Fig. 6).
C. Closed Loop “Real time” in a Hynet system is a strict constraint: it
implies that within the time step between 2 acquisitions, all the online processing on the available data has been executed (and has generated a consequent stimulation). The “closed-loop period” is the time taken by the system between the acquisition and the related feedback stimulation. This period should not bypass the maximum sampling period.
The propagation times across the modules of Hynet are summarized in Fig. 7. The software environment is Windows XP™ running on a Bi-Xeon, 4 GB RAM, 3 GHz PC. Measurements were made individually for each block.
A 10-kHz sampling frequency corresponds to a 100 µs period available for the loop. By summing the digital modules’ delays (as the analog ones are negligible), we obtain a closed-loop period of 46 µs. In this case, we have the simplest acquisition chain (25 µs), a closing-loop sequence (5 µs), and the simplest stimulation chain (16 µs). More than 50 µs are then available for the software at each time step, to close the loop.
V. DISCUSSION Into this time interval of 50 µs, the ReTA can process a
complex experiment as described in section III.B (Closing the loop with the software). The processing time for the closing loop depends on the complexity of the task. For example, we have applied on all 60 channels a condition composed of two terms. The first one is a spike firing rate between 2 and 10 in a time interval of 20 ms; the second term is a resting time (no spikes) during the following 20 ms. If the condition is fulfilled by any of the 60 channels, the system triggers a stimulus in all of the 30 stimulation channels. The average computation time for this test is 26 µs.
This Hynet system conveys fewer channels than current commercially available systems from MCS or BioLogic Science instruments [26, 28]. Its great advantage is the real-
time closed loop. This feature is until now only present in research laboratories, with an equivalent number of acquisition, and similar (double) stimulation channels [17, 18]. The Hynet carries out a bidirectional communication between a cell culture and an artificial system. Communication in the Hynet is possible through multiple parallel channels, using the multielectrode interface. The transmission delay in the closed loop is low enough to allow a 10-kHz sampling rate and still leave time for processing reaction stimuli, whilst ensuring real-time. The Graphical User Interface (GUI) provides a friendly and portable interface; it proposes a template format to standardize the experiment description.
The Hynet system design is intended to be highly tunable. Different types of experiments are currently being conducted using the Hynet: we are investigating plasticity mechanisms in cortical neural networks [19], we are studying cultured neural networks exposed to electromagnetic waves, and we are exploring the dependence to glucose of the electrical activity of pancreatic beta-cells [8].
In studies on plasticity in neural networks, the role of the artificial part is to evaluate the relationship between the evolution of the network dynamics and a “consistent” feedback. By consistent feedback, we mean that the biological network is informed in real-time about the actual sensory consequences of its activity, just like an “unprogrammed” living organism embedded into the real world. In this “brain-in-a-box” paradigm, the biological brain is in communication with the “outside body”. Two essential features are necessary for the experimental set-up in this project: (i) real-time biological signal processing and real-time communication (already functional in Hynet); and (ii) feedback functions to drive a dissociated network to adapt its evoked responses to stimuli in a learning-like process. Thus, we can use the Hynet to invest bioinspired learning and plasticity functions at the network and at the cellular level.
The second series of experiments using the Hynet system aims to study the influence of electromagnetic fields on neural networks. Cultured cortical preparations are exposed to repetitive and controlled fields (using a custom exposition system in which an MEA is embedded) that reproduce Bluetooth or other GSM microwaves. For such an experiment, the artificial part (presently computed by software) is a network of conductance-based neurons. The Hynet helps us to investigate the evolution of activity and connectivity of
Fig. 7. Data propagation delays of the complete Hynet closed-loop. The minimum closed-loop processing period is 46 µs. For our specification (10 kHz sampling frequency), more than 50 µs are then available for the software during each period to close the loop.
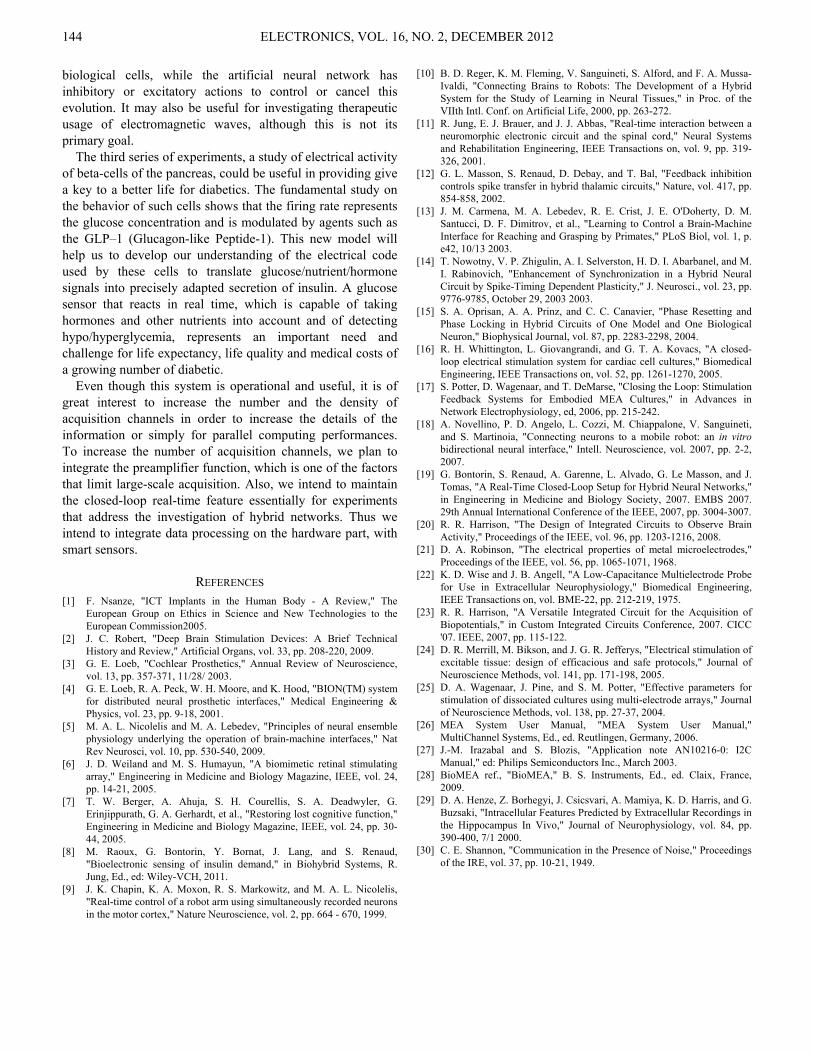
ELECTRONICS, VOL. 16, NO. 2, DECEMBER 2012 144
biological cells, while the artificial neural network has inhibitory or excitatory actions to control or cancel this evolution. It may also be useful for investigating therapeutic usage of electromagnetic waves, although this is not its primary goal.
The third series of experiments, a study of electrical activity of beta-cells of the pancreas, could be useful in providing give a key to a better life for diabetics. The fundamental study on the behavior of such cells shows that the firing rate represents the glucose concentration and is modulated by agents such as the GLP–1 (Glucagon-like Peptide-1). This new model will help us to develop our understanding of the electrical code used by these cells to translate glucose/nutrient/hormone signals into precisely adapted secretion of insulin. A glucose sensor that reacts in real time, which is capable of taking hormones and other nutrients into account and of detecting hypo/hyperglycemia, represents an important need and challenge for life expectancy, life quality and medical costs of a growing number of diabetic.
Even though this system is operational and useful, it is of great interest to increase the number and the density of acquisition channels in order to increase the details of the information or simply for parallel computing performances. To increase the number of acquisition channels, we plan to integrate the preamplifier function, which is one of the factors that limit large-scale acquisition. Also, we intend to maintain the closed-loop real-time feature essentially for experiments that address the investigation of hybrid networks. Thus we intend to integrate data processing on the hardware part, with smart sensors.
REFERENCES [1] F. Nsanze, "ICT Implants in the Human Body - A Review," The
European Group on Ethics in Science and New Technologies to the European Commission2005.
[2] J. C. Robert, "Deep Brain Stimulation Devices: A Brief Technical History and Review," Artificial Organs, vol. 33, pp. 208-220, 2009.
[3] G. E. Loeb, "Cochlear Prosthetics," Annual Review of Neuroscience, vol. 13, pp. 357-371, 11/28/ 2003.
[4] G. E. Loeb, R. A. Peck, W. H. Moore, and K. Hood, "BION(TM) system for distributed neural prosthetic interfaces," Medical Engineering & Physics, vol. 23, pp. 9-18, 2001.
[5] M. A. L. Nicolelis and M. A. Lebedev, "Principles of neural ensemble physiology underlying the operation of brain-machine interfaces," Nat Rev Neurosci, vol. 10, pp. 530-540, 2009.
[6] J. D. Weiland and M. S. Humayun, "A biomimetic retinal stimulating array," Engineering in Medicine and Biology Magazine, IEEE, vol. 24, pp. 14-21, 2005.
[7] T. W. Berger, A. Ahuja, S. H. Courellis, S. A. Deadwyler, G. Erinjippurath, G. A. Gerhardt, et al., "Restoring lost cognitive function," Engineering in Medicine and Biology Magazine, IEEE, vol. 24, pp. 30-44, 2005.
[8] M. Raoux, G. Bontorin, Y. Bornat, J. Lang, and S. Renaud, "Bioelectronic sensing of insulin demand," in Biohybrid Systems, R. Jung, Ed., ed: Wiley-VCH, 2011.
[9] J. K. Chapin, K. A. Moxon, R. S. Markowitz, and M. A. L. Nicolelis, "Real-time control of a robot arm using simultaneously recorded neurons in the motor cortex," Nature Neuroscience, vol. 2, pp. 664 - 670, 1999.
[10] B. D. Reger, K. M. Fleming, V. Sanguineti, S. Alford, and F. A. Mussa-Ivaldi, "Connecting Brains to Robots: The Development of a Hybrid System for the Study of Learning in Neural Tissues," in Proc. of the VIIth Intl. Conf. on Artificial Life, 2000, pp. 263-272.
[11] R. Jung, E. J. Brauer, and J. J. Abbas, "Real-time interaction between a neuromorphic electronic circuit and the spinal cord," Neural Systems and Rehabilitation Engineering, IEEE Transactions on, vol. 9, pp. 319-326, 2001.
[12] G. L. Masson, S. Renaud, D. Debay, and T. Bal, "Feedback inhibition controls spike transfer in hybrid thalamic circuits," Nature, vol. 417, pp. 854-858, 2002.
[13] J. M. Carmena, M. A. Lebedev, R. E. Crist, J. E. O'Doherty, D. M. Santucci, D. F. Dimitrov, et al., "Learning to Control a Brain-Machine Interface for Reaching and Grasping by Primates," PLoS Biol, vol. 1, p. e42, 10/13 2003.
[14] T. Nowotny, V. P. Zhigulin, A. I. Selverston, H. D. I. Abarbanel, and M. I. Rabinovich, "Enhancement of Synchronization in a Hybrid Neural Circuit by Spike-Timing Dependent Plasticity," J. Neurosci., vol. 23, pp. 9776-9785, October 29, 2003 2003.
[15] S. A. Oprisan, A. A. Prinz, and C. C. Canavier, "Phase Resetting and Phase Locking in Hybrid Circuits of One Model and One Biological Neuron," Biophysical Journal, vol. 87, pp. 2283-2298, 2004.
[16] R. H. Whittington, L. Giovangrandi, and G. T. A. Kovacs, "A closed-loop electrical stimulation system for cardiac cell cultures," Biomedical Engineering, IEEE Transactions on, vol. 52, pp. 1261-1270, 2005.
[17] S. Potter, D. Wagenaar, and T. DeMarse, "Closing the Loop: Stimulation Feedback Systems for Embodied MEA Cultures," in Advances in Network Electrophysiology, ed, 2006, pp. 215-242.
[18] A. Novellino, P. D. Angelo, L. Cozzi, M. Chiappalone, V. Sanguineti, and S. Martinoia, "Connecting neurons to a mobile robot: an in vitro bidirectional neural interface," Intell. Neuroscience, vol. 2007, pp. 2-2, 2007.
[19] G. Bontorin, S. Renaud, A. Garenne, L. Alvado, G. Le Masson, and J. Tomas, "A Real-Time Closed-Loop Setup for Hybrid Neural Networks," in Engineering in Medicine and Biology Society, 2007. EMBS 2007. 29th Annual International Conference of the IEEE, 2007, pp. 3004-3007.
[20] R. R. Harrison, "The Design of Integrated Circuits to Observe Brain Activity," Proceedings of the IEEE, vol. 96, pp. 1203-1216, 2008.
[21] D. A. Robinson, "The electrical properties of metal microelectrodes," Proceedings of the IEEE, vol. 56, pp. 1065-1071, 1968.
[22] K. D. Wise and J. B. Angell, "A Low-Capacitance Multielectrode Probe for Use in Extracellular Neurophysiology," Biomedical Engineering, IEEE Transactions on, vol. BME-22, pp. 212-219, 1975.
[23] R. R. Harrison, "A Versatile Integrated Circuit for the Acquisition of Biopotentials," in Custom Integrated Circuits Conference, 2007. CICC '07. IEEE, 2007, pp. 115-122.
[24] D. R. Merrill, M. Bikson, and J. G. R. Jefferys, "Electrical stimulation of excitable tissue: design of efficacious and safe protocols," Journal of Neuroscience Methods, vol. 141, pp. 171-198, 2005.
[25] D. A. Wagenaar, J. Pine, and S. M. Potter, "Effective parameters for stimulation of dissociated cultures using multi-electrode arrays," Journal of Neuroscience Methods, vol. 138, pp. 27-37, 2004.
[26] MEA System User Manual, "MEA System User Manual," MultiChannel Systems, Ed., ed. Reutlingen, Germany, 2006.
[27] J.-M. Irazabal and S. Blozis, "Application note AN10216-0: I2C Manual," ed: Philips Semiconductors Inc., March 2003.
[28] BioMEA ref., "BioMEA," B. S. Instruments, Ed., ed. Claix, France, 2009.
[29] D. A. Henze, Z. Borhegyi, J. Csicsvari, A. Mamiya, K. D. Harris, and G. Buzsaki, "Intracellular Features Predicted by Extracellular Recordings in the Hippocampus In Vivo," Journal of Neurophysiology, vol. 84, pp. 390-400, 7/1 2000.
[30] C. E. Shannon, "Communication in the Presence of Noise," Proceedings of the IRE, vol. 37, pp. 10-21, 1949.

ELECTRONICS, VOL. 16, NO. 2, DECEMBER 2012
DOI: 10.7251/ELS1216145R
145
Abstract—This paper employs the multiple scales method and
chaos theory for analyzing chaotic behavior of the voltage transformer (VT) with linear core loss model. It is shown that ferroresonance phenomenon in VTs can be classified as chaotic dynamics, including a sequence of bifurcations such as period doubling bifurcation (PDB), saddle node bifurcation (SNB), Hopf Bifurcation (HB) and chaos. Bifurcation diagrams and phase plane diagrams are drawn using a continuation method for linear core loss model and lyapunov exponents are obtained using the multiple scales method. At first an overview of the subject in the literature is provided. Then, ferroresonance phenomenon is introduced and its various types in a VT are simulated. Finally the effects of ferroresonance suppression circuit on stabilizing these oscillations are studied. The proposed approach is implemented using MATLAB, and simulation results are presented. The results show connecting the ferroresonance suppression circuit to the system configuration, causes great controlling effect on ferroresonance overvoltage.
Index Terms—Ferroresonance oscillation, stabilizing, chaos control, voltage transformer, new ferroresonance suppression circuit.
I. INTRODUCTION ERRORESONANCE is typically initiated by saturable magnetizing inductance of a transformer and capacitance
of the distribution cable or transmission line connected to the transformer. In most practical situations, ferroresonance results in dominant currents, but in some operating “mode”, may cause significant high value distorted winding voltage waveform, which is typically referred to as ferroresonance. For example, when circuit breaker between the main and reserve busbars is opened, ferroresonance can occur in voltage transformer connected to the reserve busbar. Ferroresonance generates overvoltages, overcurrents and finally chaos with different frequencies in power system. Magnetic core of transformers is nonlinear, resulting in variable inductance,
Manuscript received 1 August 2012. Received in revised form 5 December
2012. Accepted for publication 9 December 2012. H. Radmanesh is with the Electrical Engineering Department, Islamic Azad
University, Takestan Branch, Takestan, Iran and Electrical Engineering Department, Amirkabir University of Technology, Tehran, Iran (phone: +98-21-88212072; fax: +98-21-88212072; e-mail: [email protected]). S. H. Fathi is with the Electrical Engineering Department, Amirkabir University of Technology, Tehran, Iran.
while the line capacitance and grading capacitance of the circuit breaker are constant [1]. Therefore, unlike the ordinary resonance, Ferroresonance has multiple fixed points, which loose and regain their stability due to changes in the system parameters. This behavior depends, not only on the frequency, but also on the amplitude of the source voltage, initial conditions and core losses [2]. Although methods such as harmonics balance can be use for analyzing nonlinear differential equations, but solving these equations leads to a set of complex algebraic equations [3]. Thus, it is often preferred to use other methods to solve nonlinear dynamic equations; one of which is the bifurcation theory [4], [5]. Bifurcation theory enables us to describe and analyze qualitative properties of solutions (fixed points) when system parameters change. Evaluation of route to chaos in VT, considering linear core loss, circuit breaker model complexity and damping effects of the system has been carried out in [6], [7]. Early interest to the problem returns to 1907, when it was shown that the use of series capacitors for voltage regulation could cause ferroresonance in distribution systems [8]. Ferroresonance behavior of a 275 kV potential transformer, fed from a sinusoidal supply via circuit breaker grading capacitance, has been studied in [9]. The potential transformer ferroresonance from an energy transfer point of view has been presented in [10]. A systematic method for suppressing ferroresonance at neutral-grounded substations has been studied in [11]. A sensitivity study on power transformer ferroresonance in a 400 kV double circuit line has been performed in [12]. The impact of the transformer core hysteresis on the stability domain of ferroresonance modes has been studied in [13]. A new modeling of transformers enabling more accurate simulation of slow transients than the existing models in Simulink/MATLAB is presented in [14]. Controlling ferroresonance oscillations in potential transformer, considering nonlinear core losses and the circuit breaker shunt resistance effect, has been investigated in [15]. Impacts of hysteresis and magnetic couplings on the stability domain of ferroresonance in asymmetric three-phase three-leg transformers have been investigated in [17]. In this paper, a newly developed and accurate time-domain transformer model, capable of simulating dynamic and transient operating conditions is implemented. Using multiple scales method, lyapunov exponents are obtained and the attraction behavior in route to chaos is analyzed by chaos theory. However, the
Stabilizing Ferroresonance Oscillations in Voltage Transformers Using Limiter Circuit
Hamid Radmanesh and Seyed Hamid Fathi
F

ELECTRONICS, VOL. 16, NO. 2, DECEMBER 2012 146
effect of scaling method and suppression circuits on ferroresonance oscillations in VT has not been studied yet. In this paper, it is shown that the system is greatly affected by ferroresonance suppression circuit. The presence of the suggested limiter results in clamping of ferroresonance overvoltage. Using this method results in improving the voltage waveform and, consequently, protecting insulations, fuses and switchgears against high voltages. In this study, MATLAB program is employed to simulate the system and plot the related phase plane and bifurcation diagrams. The results of case study indicate that bifurcation occurs and the system states lead to chaos in the absence of ferroresonance limiter. The presence of the proposed suppression circuit, however, causes to clamp the ferroresonance oscillations and successfully decreases the chaotic region.
II. MODELING OF SYSTEM INCLUDING VOLTAGE TRANSFORMER
The Fig. 1 shows single line circuit diagram of the power system at a 275 kV substation. VT is isolated from sections of bus bars by disconnectors. Ferroresonance conditions may occur upon closure of disconnector DS1 with circuit breaker (CB) and DS2 open, leading to a system fault and failure in the VT's primary winding [15] and [18].
Fig. 1.Single line diagram of the power system including VT.
Fig. 2 shows the basic ferroresonance equivalent circuit
used in this analysis. Resistor R represents the transformer core losses. In [15] and [18] accurate model for magnetization curve of the core, considering hysteresis, has been introduced, but in the present paper the nonlinear transformer magnetization curve is modeled by a single valued seventh order polynomial [15] and [18].
Cseries
Cshunt R Ltrans V
i Cser
iR
iLi Cshunt
E
Fig. 2. Reduced equivalent ferroresonance circuit of the power system.
In Fig. 2, E is the power system rms phase voltage, Cseries is the total grading capacitance of circuit breaker and Cshunt is the equivalent line-to-earth and line-to-line capacitance of the arrangement. The resistor R represents the transformer core losses. In the peak current range, the flux-current characteristic becomes highly nonlinear. Here, λ-I characteristic of the voltage transformer is modeled, as in [3], by the polynomial
7i a bλ λ= + (1) where, a=3.14, b=0.41 and λ=Nφ (N is the coil turns of the transformer). The polynomial order of seven and the value of coefficients in equation (1) are obtained by dick and Watson [16], for the best fit of the saturation region to the true magnetization characteristic. It was found that for a fairly accurate representation of the saturation characteristics of a VT core, the exponent q may acquire a value of 7 [16]. Fig. 3 shows simulation of this iron core characteristic ( i−ϕ ) for q=7.
-20 -15 -10 -5 0 5 10 15 20-2
-1
0
1
2
Current (perunit)
Flux
Lin
kage
(per
unit)
Fig. 3. Flux- current characteristic of the transformer core.
-100 -80 -60 -40 -20 0 20 40 60 80 100
-3
-2
-1
0
1
2
3
H
B
Fig. 4. Hysteresis loop of the transformer core.
The basic ferroresonance circuit as shown in Fig. 2 is
analyzed by differential equations. Because of the nonlinear nature of the transformer magnetizing characteristics, the behavior of the system is more sensitive to change in system parameters and initial conditions [15]. A small change in the value of the system voltage, capacitance or losses may cause to dramatic changes in its behavior. A more suitable mathematical approach for studying ferroresonance and other nonlinear phenomena is provided by nonlinear dynamic methods. Nonlinear dynamical analysis of the equivalent circuit by applying KVL and KCL results in the following equations:
2 sin( )e E tω= (2)
Ldvdtλ
= (3)

ELECTRONICS, VOL. 16, NO. 2, DECEMBER 2012 147
( ) ( ) 2
2
7
2 cos.
1 1 ( ). . .
series shunt
series
series series
C C dE tC dt
d a bR C dt C
λωω
λ λ λω ω
+= +
+ +
(4)
State space formulation is done by selecting λ and VL as the state variables x1 and x2, respectively. For simplification, some new parameters are defined as bellows:
( )1
series shuntC Cε =
+ (5)
1R
μ = (6)
( )2seriesK C Eω= (7)
Substituting in (4), the following equation is obtained:
( )1 1 1 1 cosqX aX bX X Kε με ε θ+ + + = (8)
where ε is a small positive parameter, μ is the damping coefficient and is a positive parameter, Kε is amplitude of voltage source and ω is the frequency of voltage source. State equations are formed as follows:
1 2X X= (9)
( )2 1 1 2 cosqX aX bX X Kε εμ ε θ= − + − + (10)
If state equations are considered as (11) X AX BU= + (11)
where X and U are state variables and system inputs vectors and A and B represent coefficients matrices, thus:
1 1
22
1
0 1
0 0 0( )
0 0
q
X XX
a XX
X U tb K
ε εμ
ε ε
⎡ ⎤ ⎡ ⎤⎡ ⎤= = +⎢ ⎥ ⎢ ⎥⎢ ⎥− −⎣ ⎦⎢ ⎥ ⎣ ⎦⎣ ⎦
⎡ ⎤⎡ ⎤ ⎡ ⎤+⎢ ⎥⎢ ⎥ ⎢ ⎥− ⎢ ⎥⎣ ⎦ ⎣ ⎦⎣ ⎦
(12)
where ( ) cosU t tω= . The fixed or equilibrium points are defined as the vanishing
of the vector field; that is: 0X = (13)
For the initial conditions, we have:
(0) 0.0; (0) 2ldvdtλλ = = = (14)
At an equilibrium point, since the right-hand side term of (11) becomes zero, its stability is dominated by the
eigenvalues of the Jacobean fJx
∂=
∂ evaluated at fixed point.
Multiple scales method can be used as simplification method for stability and bifurcation analysis [20]. By using the multiple scales method one obtains a first order approximation for the solution of (8) as:
( ) ( )1 cosX h t oω γ ε= − + (15) The parameters a, μ and k are independent of ε. Further, the
frequency of system is such that
1ω εδ= + (16) where δ is named external detuning. By using the multiple scales method, we seek for the first order uniform expansion of (8) in the form:
( ) ( ) ( )1 1,0 0 1 1,1 0 1; , , ...X t X T T X T Tε ε= + + (17)
where T = t0 and T1 =εT0. In term of T1 the time derivative becomes:
20 1 2 ...d D D D
dtε ε= + + + (18)
Substituting (17) and (18) into (8), and equating coefficient of the similar powers of ε, we obtain:
( )0 20 1,0: 0O D Xε = (19)
( ) 20 1,1 1 0 1,0 0 1,0 1,1 0: 2 cosqO D X D D X D X bX K tε μ ω+ + + =
(20) The solution of Eq. (20) can be expressed as:
( )1,0 1 0 0X A T T A= + (21) Substituting (21) in (20):
1
2 50 1,1 1,1 1,1 2
2q i TKD X aX bX A A e ccμ′+ + = − − + + (22)
where cc is complex conjugate of preceding terms and the prime indicates the derivation with respect to T1. Using (8) in eliminating the lead to secular terms in X1,1 from (19), we obtain:
1
52 02
i TKA A eμ′ − + = (23)
If A is defined in the polar form, we have ( )
2
12
i TA e β δα += where ,α β are functions of 1T , by separating
real and imaginary parts in (20): ( ) ( ) ( ) ( )
1 1 11
1 02 2
i T i T i T i Tke i e e eβ δ β δ β δ δα α β δ α+ + ++ + + − =
(24) From (24), we obtain (25) and (26):
1cos sin sin cos 02
α β αβ β αδ β α β′ ′− − + = (25)
1sin cos cos sin 02
α β αβ β αδ β α β′ ′− − + = (26)
Multiplying sin β− in (25) and cos β in (26) we have:
sin 02kαβ αδ β′ + + = (27)
With multiplying cos β in (27) and sin β in (28) we have: 1 cos 02 2
kα α β′ − = (28)
Setting 0α′ = and 0β ′ = in (27) and (28) we find that their fixed points are given by:
0 0sin 02kα δ β+ = (29)
0 01 cos 02 2
kα β− = (30)
Squaring and adding (29) and (30) yield the frequency

ELECTRONICS, VOL. 16, NO. 2, DECEMBER 2012 148
response equation: 2 2 2
0 01 14 4
kα δ α+ = (31)
The stability of the fixed points depends on eigenvalues of Jacobean matrix which are given in (32).
2
1 sin2 2
sin cos22
k
Ak k
β
β βα
⎡ ⎤⎢ ⎥⎢ ⎥=⎢ ⎥−⎢ ⎥⎣ ⎦
(32)
Determinant of [ ]I Aλ − yields eigenvalues: 2
2 22cos cos sin 0
2 4 4k k kλ β λ β βα α α
⎛ ⎞+ − − =⎜ ⎟⎝ ⎠
(33)
Where λ is eigenvalue. Substituting the polar form of A into (18) and substituting result into (19), we find that, to first approximation 1X is given by:
( )1 cos ...X tα ω β= + + (34)
If 0 12
kαβ αδ
α α
= −⎧⎪= → ⎨ ′ = −⎪⎩
(35)
For nontrivial solutions, 0α ≠ and its follows from (35) that:
1 0 1 0,T T t tβ δ β ε β εδ β= − + = → = − + (36) Substituting (36) into (34), we find that to the first
approximation, the free oscillations of (36) are given by: ( )1 0 0cos ...X tα ω β= + + (37)
Where α is given by (35) which has the normal form of a supercritical pitchfork bifurcation. Equation of eigenvalue is as follows:
2 20
1 1 1 02 2 4
λ α λ δ⎛ ⎞+ − − − =⎜ ⎟⎝ ⎠
(38)
We obtain first order approximation of (8) by multiple scale method and by using the chaos theory we discuss its stability. For more details about chaos theory see [19] and [20]. Table I shows the base values used in the analysis; and the parameters’ value resulting in two possible types of ferroresonance are given in Table II.
TABLE I
BASE VALUES OF THE SYSTEM USED FOR SIMULATION
Base value of voltage 275 / 3 KV Base value of volt-amperes 100 VA Base angular Frequency 2π50 rad/sec
TABLE II PARAMETERS’ VALUE USED IN SIMULATION [9]
Parameters Cshunt
(nf) Cseries (nf)
Rcore (MΩ)
RFLR (MΩ)
ω (rad/sec)
E (KV)
First case 0.19 0.5 225 2 314 275 Second case 0.1 3 1900 2 314 275
III. DESCRIPTION OF SYSTEM WITH FERRORESONANCE SUPPRESSION CIRCUIT
Power system including ferroresonance suppression circuit
is shown in Fig. 5.
E
Cseries
Cshunt Rcore Ltrans V
iiCsh
Ferroresonance limiter Circuit
SW1 SW2
Fig. 5. (a) System equivalent circuit when ferroresonance suppression circuit is connected.
+
Gain
DecisionBox
VL
Vref
SW1 pulse
SW2 pulse
-
Fig. 5. (b) Switching process diagram.
The primary purpose of inserting ferroresonance limiter between the neutral point of the transformer and the earth is to limit the ferroresonance overvoltage and overcurrent. Low impedance earthing is conventionally defined as impedance that limits the prospective ferroresonance current to the full load current of the transformer. The value of the impedance required is easily calculated to a reasonable approximation by dividing the rated phase voltage by the rated phase current of the transformer. The ferroresonance limiter impedance is conventionally achieved using resistors rather than inductors, to limit the tendency for the fault arc to persist due to the inductive started energy. The suggested ferroresonance limiter consists of a compact circuit including one resistor, power electronic switches and control circuit. This circuit is placed in the grounding path of the voltage transformer. During normal operation the resistor is bypassed, while at ferroresonance occurrence, it is inserted into the circuit via power electronic switches, activated by control circuit. Regarding the above explanation, in Fig. 5 (a), RFLR is the ferroresonance limiter resistance. The power electronic switches need proper switching pulses, in order to connect and disconnect the ferroresonance limiter resistance to the grounding point of the transformer. Fig. 5 (b) shows the switching process diagram with one decision box. Vref is adjusted between 0.9-1.2 pu of the source voltage and this reference voltage is compared with the measurement voltage on the transformer coil. When reference and measurement voltages are equal, then the decision box generates a pulse for SW1, otherwise, this circuit activates the second switch. To protect the power electronic switches against overvoltages, the step down transformer is
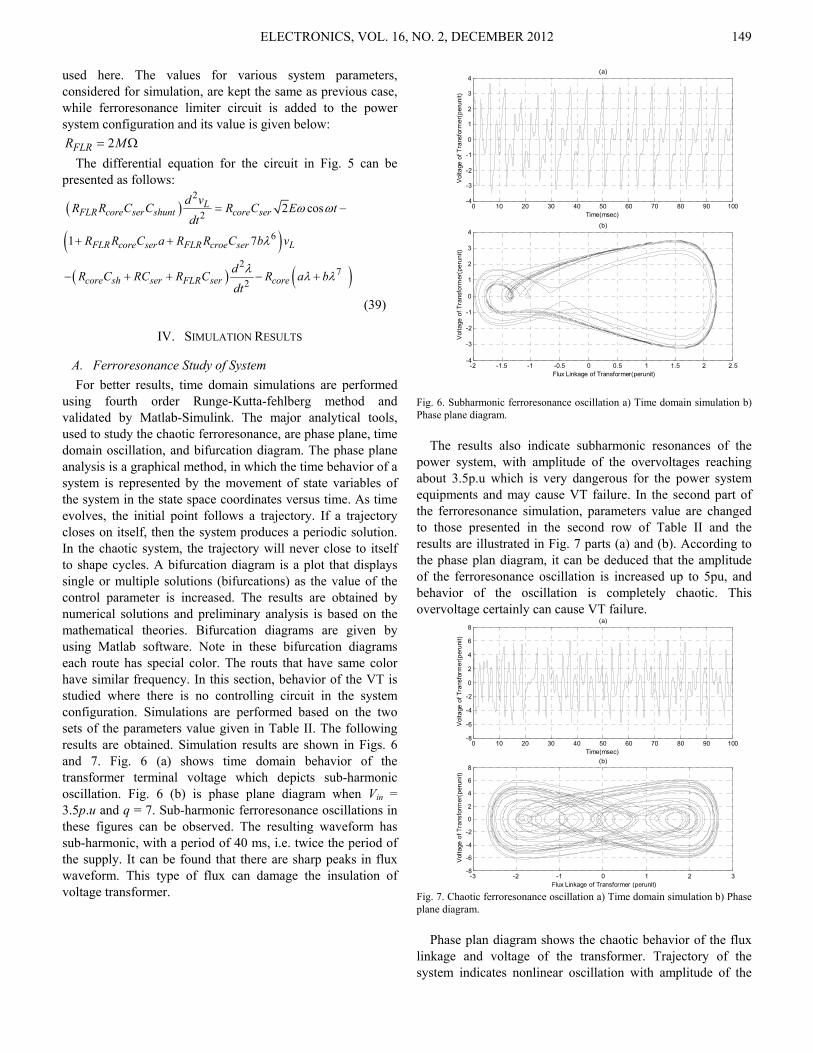
ELECTRONICS, VOL. 16, NO. 2, DECEMBER 2012 149
used here. The values for various system parameters, considered for simulation, are kept the same as previous case, while ferroresonance limiter circuit is added to the power system configuration and its value is given below:
2FLRR M= Ω The differential equation for the circuit in Fig. 5 can be
presented as follows:
( )
( )( ) ( )
2
2
6
27
2
2 cos
1 7
LFLR core ser shunt core ser
FLR core ser FLR croe ser L
core sh ser FLR ser core
d vR R C C R C E t
dt
R R C a R R C b v
dR C RC R C R a bdt
ω ω
λ
λ λ λ
= −
+ +
− + + − +
(39)
IV. SIMULATION RESULTS
A. Ferroresonance Study of System For better results, time domain simulations are performed
using fourth order Runge-Kutta-fehlberg method and validated by Matlab-Simulink. The major analytical tools, used to study the chaotic ferroresonance, are phase plane, time domain oscillation, and bifurcation diagram. The phase plane analysis is a graphical method, in which the time behavior of a system is represented by the movement of state variables of the system in the state space coordinates versus time. As time evolves, the initial point follows a trajectory. If a trajectory closes on itself, then the system produces a periodic solution. In the chaotic system, the trajectory will never close to itself to shape cycles. A bifurcation diagram is a plot that displays single or multiple solutions (bifurcations) as the value of the control parameter is increased. The results are obtained by numerical solutions and preliminary analysis is based on the mathematical theories. Bifurcation diagrams are given by using Matlab software. Note in these bifurcation diagrams each route has special color. The routs that have same color have similar frequency. In this section, behavior of the VT is studied where there is no controlling circuit in the system configuration. Simulations are performed based on the two sets of the parameters value given in Table II. The following results are obtained. Simulation results are shown in Figs. 6 and 7. Fig. 6 (a) shows time domain behavior of the transformer terminal voltage which depicts sub-harmonic oscillation. Fig. 6 (b) is phase plane diagram when Vin = 3.5p.u and q = 7. Sub-harmonic ferroresonance oscillations in these figures can be observed. The resulting waveform has sub-harmonic, with a period of 40 ms, i.e. twice the period of the supply. It can be found that there are sharp peaks in flux waveform. This type of flux can damage the insulation of voltage transformer.
0 10 20 30 40 50 60 70 80 90 100-4
-3
-2
-1
0
1
2
3
4
Time(msec)
Vol
tage
of T
rans
form
er(p
erun
it)
(a)
-2 -1.5 -1 -0.5 0 0.5 1 1.5 2 2.5-4
-3
-2
-1
0
1
2
3
4
Flux Linkage of Transformer(perunit)
Vol
tage
of T
rans
form
er(p
erun
it)
(b)
Fig. 6. Subharmonic ferroresonance oscillation a) Time domain simulation b) Phase plane diagram.
The results also indicate subharmonic resonances of the
power system, with amplitude of the overvoltages reaching about 3.5p.u which is very dangerous for the power system equipments and may cause VT failure. In the second part of the ferroresonance simulation, parameters value are changed to those presented in the second row of Table II and the results are illustrated in Fig. 7 parts (a) and (b). According to the phase plan diagram, it can be deduced that the amplitude of the ferroresonance oscillation is increased up to 5pu, and behavior of the oscillation is completely chaotic. This overvoltage certainly can cause VT failure.
0 10 20 30 40 50 60 70 80 90 100-8
-6
-4
-2
0
2
4
6
8
Time(msec)
Vol
tage
of T
rans
form
er(p
erun
it)
(a)
-3 -2 -1 0 1 2 3-8
-6
-4
-2
0
2
4
6
8
Flux Linkage of Transformer (perunit)
Vol
tage
of T
rans
form
er(p
erun
it)
(b)
Fig. 7. Chaotic ferroresonance oscillation a) Time domain simulation b) Phase plane diagram.
Phase plan diagram shows the chaotic behavior of the flux
linkage and voltage of the transformer. Trajectory of the system indicates nonlinear oscillation with amplitude of the
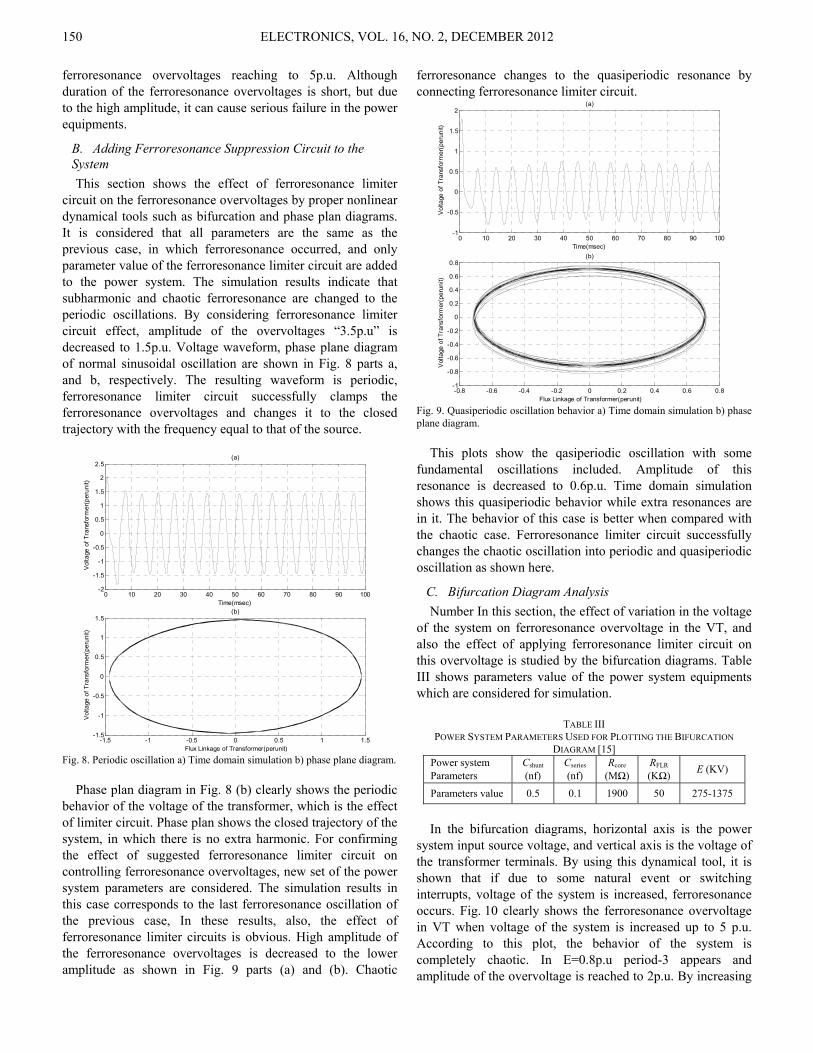
ELECTRONICS, VOL. 16, NO. 2, DECEMBER 2012 150
ferroresonance overvoltages reaching to 5p.u. Although duration of the ferroresonance overvoltages is short, but due to the high amplitude, it can cause serious failure in the power equipments.
B. Adding Ferroresonance Suppression Circuit to the System This section shows the effect of ferroresonance limiter
circuit on the ferroresonance overvoltages by proper nonlinear dynamical tools such as bifurcation and phase plan diagrams. It is considered that all parameters are the same as the previous case, in which ferroresonance occurred, and only parameter value of the ferroresonance limiter circuit are added to the power system. The simulation results indicate that subharmonic and chaotic ferroresonance are changed to the periodic oscillations. By considering ferroresonance limiter circuit effect, amplitude of the overvoltages “3.5p.u” is decreased to 1.5p.u. Voltage waveform, phase plane diagram of normal sinusoidal oscillation are shown in Fig. 8 parts a, and b, respectively. The resulting waveform is periodic, ferroresonance limiter circuit successfully clamps the ferroresonance overvoltages and changes it to the closed trajectory with the frequency equal to that of the source.
0 10 20 30 40 50 60 70 80 90 100-2
-1.5
-1
-0.5
0
0.5
1
1.5
2
2.5
Time(msec)
Vol
tage
of T
rans
form
er(p
erun
it)
(a)
-1.5 -1 -0.5 0 0.5 1 1.5-1.5
-1
-0.5
0
0.5
1
1.5
Flux Linkage of Transformer(perunit)
Vol
tage
of T
rans
form
er(p
erun
it)
(b)
Fig. 8. Periodic oscillation a) Time domain simulation b) phase plane diagram.
Phase plan diagram in Fig. 8 (b) clearly shows the periodic
behavior of the voltage of the transformer, which is the effect of limiter circuit. Phase plan shows the closed trajectory of the system, in which there is no extra harmonic. For confirming the effect of suggested ferroresonance limiter circuit on controlling ferroresonance overvoltages, new set of the power system parameters are considered. The simulation results in this case corresponds to the last ferroresonance oscillation of the previous case, In these results, also, the effect of ferroresonance limiter circuits is obvious. High amplitude of the ferroresonance overvoltages is decreased to the lower amplitude as shown in Fig. 9 parts (a) and (b). Chaotic
ferroresonance changes to the quasiperiodic resonance by connecting ferroresonance limiter circuit.
0 10 20 30 40 50 60 70 80 90 100-1
-0.5
0
0.5
1
1.5
2
Time(msec)
Vol
tage
of T
rans
form
er(p
erun
it)
(a)
-0.8 -0.6 -0.4 -0.2 0 0.2 0.4 0.6 0.8-1
-0.8
-0.6
-0.4
-0.2
0
0.2
0.4
0.6
0.8
Flux Linkage of Transformer(perunit)
Vol
tage
of T
rans
form
er(p
erun
it)
(b)
Fig. 9. Quasiperiodic oscillation behavior a) Time domain simulation b) phase plane diagram.
This plots show the qasiperiodic oscillation with some fundamental oscillations included. Amplitude of this resonance is decreased to 0.6p.u. Time domain simulation shows this quasiperiodic behavior while extra resonances are in it. The behavior of this case is better when compared with the chaotic case. Ferroresonance limiter circuit successfully changes the chaotic oscillation into periodic and quasiperiodic oscillation as shown here.
C. Bifurcation Diagram Analysis Number In this section, the effect of variation in the voltage
of the system on ferroresonance overvoltage in the VT, and also the effect of applying ferroresonance limiter circuit on this overvoltage is studied by the bifurcation diagrams. Table III shows parameters value of the power system equipments which are considered for simulation.
TABLE III
POWER SYSTEM PARAMETERS USED FOR PLOTTING THE BIFURCATION DIAGRAM [15]
Power system Parameters
Cshunt (nf)
Cseries (nf)
Rcore (MΩ)
RFLR
(KΩ) E (KV)
Parameters value 0.5 0.1 1900 50 275-1375
In the bifurcation diagrams, horizontal axis is the power
system input source voltage, and vertical axis is the voltage of the transformer terminals. By using this dynamical tool, it is shown that if due to some natural event or switching interrupts, voltage of the system is increased, ferroresonance occurs. Fig. 10 clearly shows the ferroresonance overvoltage in VT when voltage of the system is increased up to 5 p.u. According to this plot, the behavior of the system is completely chaotic. In E=0.8p.u period-3 appears and amplitude of the overvoltage is reached to 2p.u. By increasing

ELECTRONICS, VOL. 16, NO. 2, DECEMBER 2012 151
the source voltage, at E=2 p.u period doubling starts, and by PDB logic, system behavior goes into the chaotic region. For finding the beginning point of the chaotic region Lyapunov exponent is used. In this plot, effect of the variation in the input voltage on ferroresonance occurring is shown by the Lyapunov exponent. If the exponent remains below zero line, its oscillation have a periodic behavior, otherwise it has a chaotic behavior. According to this explanation, ferroresonance is controlled by connecting ferroresonance limiter and this exponent stays below zero line all the region. This means ferroresonance limiter successfully causes to control ferroresonance phenomena.
0 1 2 3 4 50
0.5
1
1.5
2
2.5
3
Input voltage(perunit), control parameter
Vol
tage
of T
rans
form
er(p
erun
it)
(a)
period-3
period-1periodic windows
periodic windows
0 0.5 1 1.5 2 2.5 3 3.5 4 4.5 50
0.1
0.2
0.3
0.4
0.5
0.6
0.7
0.8
0.9
Input voltage(perunit), control parameter
Vol
tage
of T
rans
form
er(p
erun
it)
(b)
Fig. 10. Bifurcation diagram (a) chaotic behavior without controlling circuit, (b) periodic behavior causes by ferroresonance limiter circuit.
1 1.5 2 2.5 3 3.5 4 4.5 5-2.5
-2
-1.5
-1
-0.5
0
0.5
1
Input voltage(perunit)
Lyap
unov
exp
onen
t
(a)
1 1.5 2 2.5 3 3.5 4 4.5 5-3.5
-3
-2.5
-2
-1.5
-1
-0.5
0
0.5
Input voltage(perunit)
Lyap
unov
exp
onen
t
(b)
Fig. 11. Lyapunov exponent (a) without limiter effect, (b) when limiter circuit is added.
In part (a) and (b) of Fig. 11, ferroresonance condition and effect of the ferroresonance limiter on controlling nonlinear oscillation is shown via Lyapunov exponent. In the last part of the simulation, system behavior is shown by different set of the system parameters as shown in Table III. Effect of ferroresonance limiter circuit on decreasing ferroresonance over voltages is clearly obvious. In this plot, amplitude of the oscillation is limited to 0.9p.u, and chaotic ferroresonance is changed to the period-1 oscillation.
V. CONCLUSION In this paper, chaotic ferroresonance oscillations of voltage
transformer with considering linear core loss model have been described. Bifurcation and chaos analysis has been introduced and different types of bifurcation for ferroresonance phenomena have been observed using multiple scales method. Lyapunov exponents for different fix points in bifurcation diagrams have been obtained. It was shown that chaos occurs in voltage transformer from a sequence of PDB. It was found that nonlinear magnetization curve has a great influence on bifurcation diagrams and domains of ferroresonance occurrence. Linear core loss model has been used in dynamics equations. Border collision where system becomes suddenly chaotic in bifurcation diagram has been shown. In phase plane diagrams period-n windows have been observed. For fixed points periodic and non-periodic solution and also type of bifurcation are gained. It was shown that for some reasons chaotic ferroresonance can appear causing voltage transformer failure. By connecting the ferroresonance limiter circuit to the transformer ferroresonance phenomena is greatly affected. The presence of the ferroresonance limiter circuit results in clamping the ferroresonance overvoltages in the studied system. The ferroresonance limiter circuit successfully suppresses the chaotic behaviour of the system. Consequently, the system shows less sensitivity to initial conditions and amplitude of the chaotic ferroresonance is controlled successfully.
REFERENCES [1] A. Rezaei-Zare, M. Sanaye-Pasand, H. Mohseni, Sh. Farhangi, R.
Iravani, “Analysis of Ferroresonance Modes in Power Transformers Using Preisach-Type Hysteretic Magnetizing Inductance”, IEEE Transaction on Power Delivery, vol. 22, no. 2, pp. 919-928, 2007.
[2] A. Ben-Tal, D. Shein, S. Zissu, “Studying ferroresonance in actual power systems by bifurcation diagram”, Electric Power Systems Research, vol. 49, pp. 175-183, 1999.
[3] S. Mozaffari, M. Sameti and A. C. Soudack, “Effect of initial conditions on chaotic ferroresonance in power transformers”, IEE Proc., Gen., Trans and Dist., vol. 144, pp. 456-460, 1997.
[4] R. Seydel, From Equilibrium to Chaos, Elsevier, New York, 1988. [5] Hamid Radmanesh, G.B. Gharehpetian, "Ferroresonance Suppression in
Power Transformers using Chaos Theory", International Journal of Electrical Power and Energy Systems, Volume 45, Issue 1, Pages 1–9, February 2013.
[6] S.K. Chakravarthy, C.V. Nayar, “Series ferroresonance in power systems”, Electr. Power Energy Syst. Vol. 17, no. 4, pp. 267-274, 1995.
[7] Rezaei-Zare, A.; Iravani, R.; Sanaye-Pasand, M.; "Impacts of transformercore hysteresis formation on stability domain of ferroresonance modes," IEEE Transactions on Power Delivery, Vol.24, No.1, pp.177-186, Jan. 2009.

ELECTRONICS, VOL. 16, NO. 2, DECEMBER 2012 152
[8] J. Bethenod, "On the transformer and resonance," The Electric Eclairae, Nov. 30, pp. 289-296, 1907.
[9] Emin, Z.; Al Zahawi, B.A.T.; Tong, Y.K.; , "Voltage transformer ferroresonance in 275 kV substation,", 1999. Eleventh International Symposium on High Voltage Engineering, Vol.1, No.2, pp.283-286, 1999.
[10] Andrei, R.G.; Halley, B.R.; , "Voltage transformer ferroresonance from an energy transfer standpoint," IEEE Transactions on Power Delivery, Vol.4, No.3, pp.1773-1778, Jul 1989.
[11] Yunge Li; Wei Shi; Rui Qin; Jilin Yang; , "A systematical method for suppressing ferroresonance at neutral-grounded substations," IEEE Transactions on Power Delivery, Vl.18, No.3, pp. 1009- 1014, July 2003.
[12] Charalambous, C.; Wang, Z.D.; Osborne, M.; Jarman, P.; "Sensitivity studies on power transformer ferroresonance of a 400 kV double circuit," IET journal of Generation, Transmission & Distribution, Vol.2, No.2, pp.159-166, March 2008.
[13] Rezaei-Zare, A.; Iravani, R.; Sanaye-Pasand, M.; , "Impacts of Transformer Core Hysteresis Formation on Stability Domain of Ferroresonance Modes," Power Delivery, IEEE Transactions on , vol.24, no.1, pp.177-186, Jan. 2009.
[14] Khorasani, P.G.; Deihimi, A.; , "A new modeling of Matlab transformer for accurate simulation of ferroresonance," Power Engineering, Energy
and Electrical Drives, International Conference on POWERENG 2009, pp.529-534, 18-20, March 2009.
[15] H. Radmanesh, M. Rostami, "Effect of circuit breaker shunt resistance on chaotic ferroresonance in voltage transformer," Advances in Electrical and Computer Engineering, Vol. 10, No. 3, pp. 71-77, 2010.
[16] DICK, E.P., and WATSON, W.: ‘Transformer models for transient studies based on field measurements’, IEEE Trans., PAS-100, pp. 409417, 1981.
[17] Moses, P.S.; Masoum, M.A.S.; Toliyat, H.A.;” Impacts of Hysteresis and Magnetic Couplings on the Stability Domain of Ferroresonance in Asymmetric Three-Phase Three-Leg Transformers”, IEEE Transactions on Energy Conversion, Vol. 26, No. 2, pp. 581 - 592, May2011.
[18] Emin, Z.; Al Zahawi, B.A.T.; Yu Kwong Tong; Ugur, M.; , "Quantification of the chaotic behavior of ferroresonance voltage transformer circuits," Circuits and Systems I: Fundamental Theory and Applications, IEEE Transactions on , vol.48, no.6, pp.757-760, Jun 2001.
[19] A. Ben-Tal, V. Kirk, G. Wake, “Banded Chaos in Power Systems”, IEEE Transactions on Power Delivery, vol. 16, no. 1, Jan. 2001.
[20] A. H. Nayfeh, APPLIED NONLINEAR DYNAMICS Analytical, Computational and Experimental Methods, WILEY-VCH Verlag GmbH& Co. KGaA, 2004.
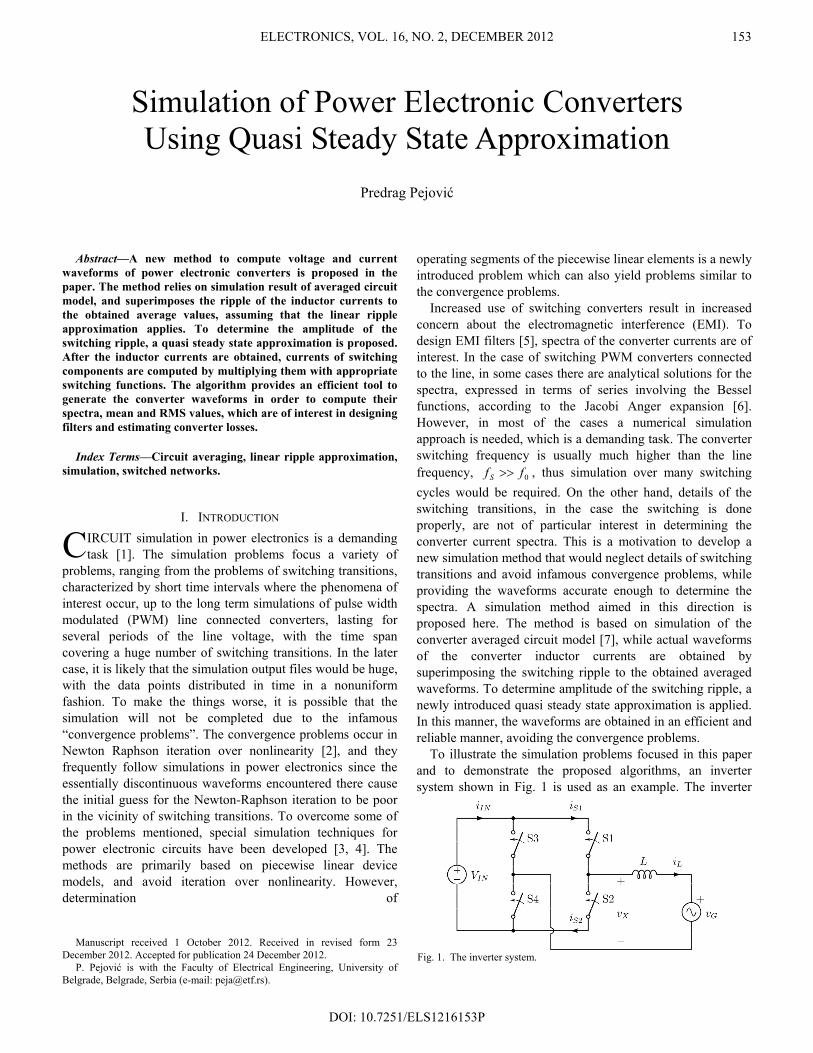
ELECTRONICS, VOL. 16, NO. 2, DECEMBER 2012
DOI: 10.7251/ELS1216153P
153
Abstract—A new method to compute voltage and current
waveforms of power electronic converters is proposed in the paper. The method relies on simulation result of averaged circuit model, and superimposes the ripple of the inductor currents to the obtained average values, assuming that the linear ripple approximation applies. To determine the amplitude of the switching ripple, a quasi steady state approximation is proposed. After the inductor currents are obtained, currents of switching components are computed by multiplying them with appropriate switching functions. The algorithm provides an efficient tool to generate the converter waveforms in order to compute their spectra, mean and RMS values, which are of interest in designing filters and estimating converter losses.
Index Terms—Circuit averaging, linear ripple approximation, simulation, switched networks.
I. INTRODUCTION IRCUIT simulation in power electronics is a demanding task [1]. The simulation problems focus a variety of
problems, ranging from the problems of switching transitions, characterized by short time intervals where the phenomena of interest occur, up to the long term simulations of pulse width modulated (PWM) line connected converters, lasting for several periods of the line voltage, with the time span covering a huge number of switching transitions. In the later case, it is likely that the simulation output files would be huge, with the data points distributed in time in a nonuniform fashion. To make the things worse, it is possible that the simulation will not be completed due to the infamous “convergence problems”. The convergence problems occur in Newton Raphson iteration over nonlinearity [2], and they frequently follow simulations in power electronics since the essentially discontinuous waveforms encountered there cause the initial guess for the Newton-Raphson iteration to be poor in the vicinity of switching transitions. To overcome some of the problems mentioned, special simulation techniques for power electronic circuits have been developed [3, 4]. The methods are primarily based on piecewise linear device models, and avoid iteration over nonlinearity. However, determination of
Manuscript received 1 October 2012. Received in revised form 23
December 2012. Accepted for publication 24 December 2012. P. Pejović is with the Faculty of Electrical Engineering, University of
Belgrade, Belgrade, Serbia (e-mail: [email protected]).
operating segments of the piecewise linear elements is a newly introduced problem which can also yield problems similar to the convergence problems.
Increased use of switching converters result in increased concern about the electromagnetic interference (EMI). To design EMI filters [5], spectra of the converter currents are of interest. In the case of switching PWM converters connected to the line, in some cases there are analytical solutions for the spectra, expressed in terms of series involving the Bessel functions, according to the Jacobi Anger expansion [6]. However, in most of the cases a numerical simulation approach is needed, which is a demanding task. The converter switching frequency is usually much higher than the line frequency, 0ff S >> , thus simulation over many switching cycles would be required. On the other hand, details of the switching transitions, in the case the switching is done properly, are not of particular interest in determining the converter current spectra. This is a motivation to develop a new simulation method that would neglect details of switching transitions and avoid infamous convergence problems, while providing the waveforms accurate enough to determine the spectra. A simulation method aimed in this direction is proposed here. The method is based on simulation of the converter averaged circuit model [7], while actual waveforms of the converter inductor currents are obtained by superimposing the switching ripple to the obtained averaged waveforms. To determine amplitude of the switching ripple, a newly introduced quasi steady state approximation is applied. In this manner, the waveforms are obtained in an efficient and reliable manner, avoiding the convergence problems.
To illustrate the simulation problems focused in this paper and to demonstrate the proposed algorithms, an inverter system shown in Fig. 1 is used as an example. The inverter
Simulation of Power Electronic Converters Using Quasi Steady State Approximation
Predrag Pejović
C
Fig. 1. The inverter system.

ELECTRONICS, VOL. 16, NO. 2, DECEMBER 2012 154
system should supply an AC voltage source ( )tVv mG 0cos ω= (1)
with the current whose average over the switching period is ( )tIi mL 0cos ω= . (2)
In the examples analyzed in this paper, it is assumed that V2230=mV , Hz5020 ×= πω , and that the current is
programmed such that A20=mI . To achieve this, the inverter is operated with the constant switching frequency of
kHz20=Sf , with an appropriate duty ratio function ( )td , to be determined by the averaged circuit analysis. The input voltage is assumed constant, V450=INV , and the coupling inductor is assumed to have 1.4 mHL = . Each of the switches in the inverter is built using a unidirectional controlled switch and an antiparallel diode, as depicted in Fig. 2. The current of the switch Ski consists of the controlled switch current SkSi and the diode current SkDi according to
SkDSkSSk iii −= . (3) The simulation problem is to determine the waveforms of
Li , INi aiming their spectra, as well as to determine the waveforms of Ski , SkSi , and SkDi for 4,3,2,1∈k aiming their average and RMS values to estimate the converter losses.
II. THE AVERAGED CIRCUIT MODEL The first step in obtaining the desired solution is to solve
the averaged circuit. In the example focused in this paper, this step will be performed analytically and manually. However, solving the averaged circuit can also be performed applying numerical methods. This step is not a difficult numerical problem, because the differential equations that characterize averaged circuits are smooth since all of the averaged voltages and currents are continuous in time.
To inject the current Li into the stiff voltage source Gv as specified by (2), the average of the inverter output voltage over switching period should be
( ) ( )tILtVdtidLvv mmL
GX 000 sincos ωωω −=+= . (4)
This is achieved by the inverter switching with the duty ratio
( ) ( )⎟⎟⎠
⎞⎜⎜⎝
⎛+=
IN
X
Vtvtd 1
21 . (5)
Waveforms of Gv , dtidLv LL = , and Xv are shown in Fig. 3, illustrating that the average voltage across the inductor is significantly lower than the surrounding voltages. This is important for the approximations that are going to be used in subsequent analyses.
III. LINEAR RIPPLE APPROXIMATION The first assumption required by the proposed method is
that the linear ripple approximation applies. Focusing to a switching interval STt <<0 , SS fT 1= , the linear ripple approximation assumes that the inductor voltage over the interval is a constant 1LV during SdTt <<0 , and another constant 2LV during SS TtdT << . Under these assumptions, the inductor current ripple is a piecewise linear function of time. It will also be assumed that 01 >LV and 02 <LV . The linear ripple approximation is used to analyze switching converters in steady state, where ( ) ( )0LSL iTi = . In that case, the amplitude of the inductor current ripple is given by
dfL
ViS
LL 2
11 =Δ (6)
or
'2
22 d
fLVi
S
LL −=Δ (7)
which provides the same 21 LLL iii Δ=Δ=Δ in the converter steady state operation, since according to the volt second balance
0'21 =+ dVdV LL . (8)
IV. QUASI STEADY STATE APPROXIMATION Purpose of the quasi steady state approximation is to
determine envelope of the inductor current while the inductor is not in the steady state operation over the switching interval, i.e. ( ) ( )0LSL iTi ≠ . Assuming that the inductor operation is not far from the steady state, amplitude of the inductor current ripple could be computed using (6) or (7). In the example circuit of Fig. 1, for the given set of parameters amplitudes of
Fig. 2. The switch structure.
Fig. 3. Averaged voltages in the circuit.

ELECTRONICS, VOL. 16, NO. 2, DECEMBER 2012 155
the inductor current ripple 1LiΔ computed using (6) and 2LiΔ computed using (7) are presented in Fig. 4. There is not a big difference between the waveforms, but still there is a difference. The difference could be computed as
Lfv
LfdVdViii
S
L
S
LLLLL 22
'2121 =
+=Δ−Δ=ΔΔ (9)
which fits to the waveform of the difference shown in Fig. 4. This indicates that having Lv low in comparison to the surrounding voltages is essential for application of the quasi steady state approximation, as already indicated.
To compromise between the two predictions of the inductor current ripple amplitude in the non steady state conditions, the average of the predictions is proposed, resulting in
LfdVdVi
S
LLL 4
'21 −=Δ . (10)
This formula for the inductor current ripple amplitude constitutes the quasi steady state approximation. In the case of the example circuit of Fig. 1, the formula provides the envelope of the inductor current as depicted in Fig. 5.
V. CONSTRUCTION OF THE CURRENT WAVEFORMS The methods introduced this far are aimed to construct the
waveforms of the converter currents. Essential waveform to
be constructed is the waveform of the inductor current. The other waveforms are constructed applying the obtained inductor current waveform and appropriate switching functions.
To construct the inductor current waveform, the switching ripple prototype function ( )d,lr τ (lr stands for “linear ripple”) depicted in Fig. 6 is applied, and the inductor current is obtained as
( ) ( ) ( ) ( )( )tdttititi LLL ,lr×Δ+= (11)
where ( )tiL and ( )td are obtained as a result of the averaged circuit analysis, while ( )tiLΔ is obtained applying the quasi steady state approximation proposed in this paper, in (10).
After the inductor current waveform is obtained, waveforms of the switch currents are constructed applying switching functions ( )d,d1τ and ( ) ( )dd ,d11,d0 ττ −= defined in a similar manner as ( )d,lr τ , as depicted in Figs. 7 and 8. Application of the switching functions to construct the waveforms of 1Si and 2Si results in
( ) ( ) ( )( )tdttiti LS ,d11 ×= (12) and
( ) ( ) ( )( )tdttiti LS ,d02 ×= . (13) It should be noted here that functions ( )d,d1τ and ( )d,d0 τ take only values 0 or 1, which should be used to reduce the computational burden.
Functions ( )d,lr τ , ( )d,d1τ , ( )d,d0 τ are introduced here in an intuitive fashion, by their diagrams for 75.0=d shown in Figs. 6–8. Since the functions are piecewise linear, it is not a difficult task to obtain their analytical description, which is necessary for the software implementation, but avoided here due to the space limitations.
To separate the switch current to the controlled switch current and the antiparallel diode current, according to Fig. 2, the Heaviside function is applied to model the additional switching. For S1, the controlled switch current is obtained as
( ) ( ) ( )( )tititi SSSS 111 h×= (14) while the diode current is obtained as
( ) ( ) ( )( )tititi SSDS 111 h −×−= . (15) The same technique is applied for the remaining switches of the inverter.
To determine the inverter input current, it is convenient to define an additional switching function, named d-selector function
( ) ( ) ( )ddd ,d0,d1,ds τττ −= (16) shown in Fig. 9. This reduces construction of ( )tiIN to
( ) ( ) ( )( )tdttiti LIN ,ds×= . (17)
VI. SIMULATION RESULTS To illustrate the proposed algorithm and to fulfill the
simulation requirements specified in the Introduction, the example circuit of Fig. 1 is simulated, i.e. waveforms of Li ,
Fig. 4. Amplitude of the inductor current ripple.
Fig. 5. Envelope of the inductor current.
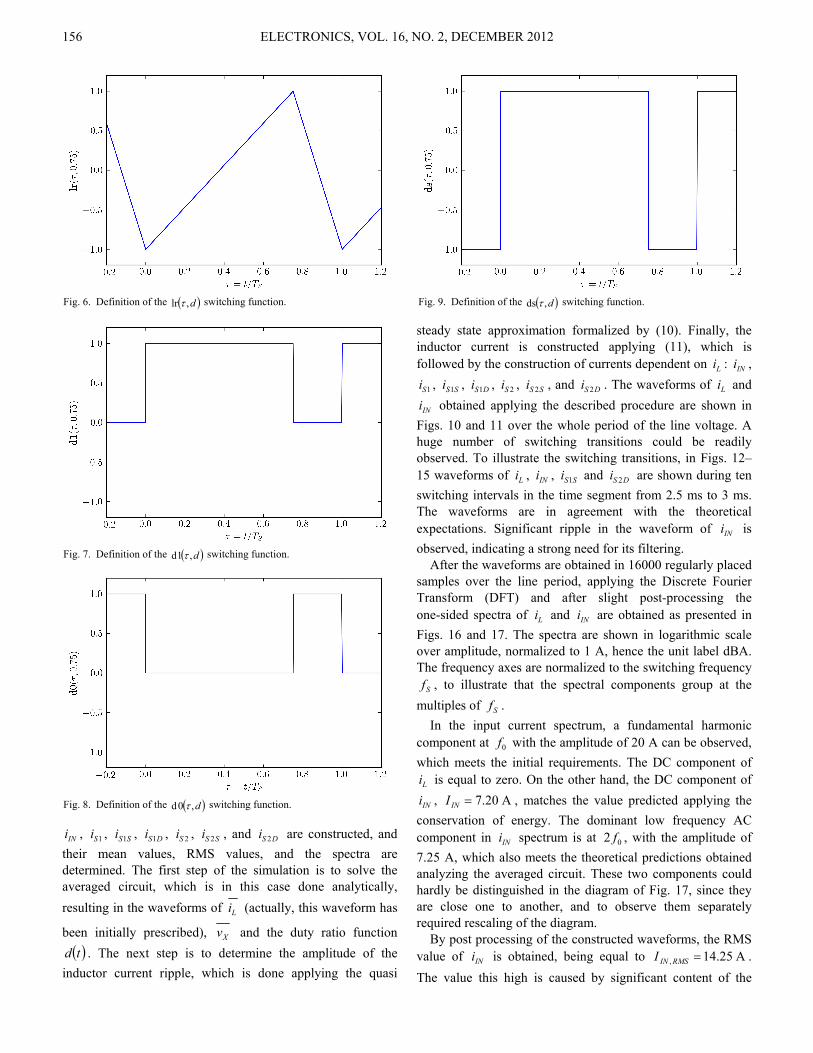
ELECTRONICS, VOL. 16, NO. 2, DECEMBER 2012 156
INi , 1Si , SSi 1 , DSi 1 , 2Si , SSi 2 , and DSi 2 are constructed, and their mean values, RMS values, and the spectra are determined. The first step of the simulation is to solve the averaged circuit, which is in this case done analytically, resulting in the waveforms of Li (actually, this waveform has
been initially prescribed), Xv and the duty ratio function ( )td . The next step is to determine the amplitude of the
inductor current ripple, which is done applying the quasi
steady state approximation formalized by (10). Finally, the inductor current is constructed applying (11), which is followed by the construction of currents dependent on Li : INi ,
1Si , SSi 1 , DSi 1 , 2Si , SSi 2 , and DSi 2 . The waveforms of Li and
INi obtained applying the described procedure are shown in Figs. 10 and 11 over the whole period of the line voltage. A huge number of switching transitions could be readily observed. To illustrate the switching transitions, in Figs. 12–15 waveforms of Li , INi , SSi 1 and DSi 2 are shown during ten switching intervals in the time segment from 2.5 ms to 3 ms. The waveforms are in agreement with the theoretical expectations. Significant ripple in the waveform of INi is observed, indicating a strong need for its filtering.
After the waveforms are obtained in 16000 regularly placed samples over the line period, applying the Discrete Fourier Transform (DFT) and after slight post-processing the one-sided spectra of Li and INi are obtained as presented in Figs. 16 and 17. The spectra are shown in logarithmic scale over amplitude, normalized to 1 A, hence the unit label dBA. The frequency axes are normalized to the switching frequency
Sf , to illustrate that the spectral components group at the multiples of Sf .
In the input current spectrum, a fundamental harmonic component at 0f with the amplitude of 20 A can be observed, which meets the initial requirements. The DC component of
Li is equal to zero. On the other hand, the DC component of
INi , A20.7=INI , matches the value predicted applying the conservation of energy. The dominant low frequency AC component in INi spectrum is at 02 f , with the amplitude of 7.25 A, which also meets the theoretical predictions obtained analyzing the averaged circuit. These two components could hardly be distinguished in the diagram of Fig. 17, since they are close one to another, and to observe them separately required rescaling of the diagram.
By post processing of the constructed waveforms, the RMS value of INi is obtained, being equal to A14.25, =RMSINI . The value this high is caused by significant content of the
Fig. 6. Definition of the ( )d,lr τ switching function.
Fig. 7. Definition of the ( )d,1d τ switching function.
Fig. 8. Definition of the ( )d,0d τ switching function.
Fig. 9. Definition of the ( )d,ds τ switching function.

ELECTRONICS, VOL. 16, NO. 2, DECEMBER 2012 157
higher order harmonics. On the other hand, the RMS value of Li , A2514, .I RMSL = is negligibly higher than the RMS value
of its first harmonic of 14.14 A. Comparing the spectra of Figs. 16 and 17, it can be concluded that INi is much more polluted with the higher order harmonics than the waveform of Li .
Finally, the average and the RMS values of SSi 1 , DSi 1 , 2Si ,
SSi 2 , and DSi 2 are obtained as A05.51 =SSI , A45.11 =DSI , A96.42 =SSI , A36.12 =DSI , while A07.9,1 =RMSSSI ,
A56.41 =RMSDSI , A99.82 =RMSSSI , A38.42 =RMSDSI . This enables us to estimate losses in the switching elements, and concludes the circuit analysis according to the initially stated requirements.
The simulation results are obtained by a program written in Python programming language [8], in PyLab environment, relying entirely on free software tools. The PyLab environment is chosen since it provides a comfortable access to NumPy and SciPy packages, that were used to provide array type objects and to perform numerical computations, like the Discrete Fourier Transform. Besides that, the PyLab environment provides a comfortable access to matplotlib package, which was used to plot the graphs shown in Figs. 3–
17. The numerical simulation without generating the plots was completed in 2.09 s on a PC computer equipped with Intel Q8200 processor run at 2.33 GHz under Ubuntu 12.04 operating system. However, to perform the simulation, to
Fig. 10. Simulation, waveform of Li , full period.
Fig. 11. Simulation, waveform of INi , full period.
Fig. 12. Simulation, constructed waveform of Li .
Fig. 13. Simulation, constructed waveform of INi .
Fig. 14. Simulation, constructed waveform of 1Si .
Fig. 15. Simulation, constructed waveform of 2Si .

ELECTRONICS, VOL. 16, NO. 2, DECEMBER 2012 158
generate the plots with LaTeX lettering, and to store them with 600 dpi resolution, took 19 s, indicating that the most of the runtime is spent on generating the graphs. Comparison to conventional simulation tools, like SPICE derivatives, naturally arises. However, it is not possible to perform a fair comparison, since the proposed simulation algorithm does not provide information about details of switching transitions, which generates the most of the computational burden in the conventional tools. Overall impression is that the simulation is much faster and much easier to perform, void of convergence problems, but the simulation result is different in the level of details provided. On the other hand, details of switching transitions provided by the conventional simulation tools rely
on accurate component models that are not always available, which questions validity and meaning of the detailed simulation.
VII. CONCLUSIONS In this paper, a novel method for simulation of switching
power converters is proposed. The method is aimed to determine spectra of the converter currents and their mean and RMS values in cases where details of switching transitions are not of interest. Waveforms of the converter currents are constructed starting from the average currents of the inductors, superimposing the ripple waveforms to the average values in order to obtain the instantaneous value waveforms. Validity of the linear ripple approximation is assumed. To compute the ripple amplitude, the newly introduced quasi steady state approximation is applied. Waveforms of the currents of the switching components are treated as dependent, and obtained from the currents of the inductors applying appropriate switching functions. The resulting algorithm is numerically efficient and void of convergence problems. The output waveforms are obtained in the form of regularly sampled signals, suitable for the Fourier analysis. The method is intended to be applied for EMI filter design.
REFERENCES [1] D. Maksimović, A. M. Stanković, V. J. Thottuvelil, G. C. Verghese,
“Modeling and simulation of power electronic converters,” Proceedings of the IEEE, vol. 89, no. 6, pp. 898–912, June 2001.
[2] A. Vladimirescu, The SPICE Book, John Wiley, 1994. [3] P. Pejović, D. Maksimović, “A new algorithm for simulation of power
electronic systems using piecewise-linear device models,” IEEE Transactions on Power Electronics, vol. 10, no. 3, pp. 340–348, May 1995.
[4] D. Li, R. Tymerski, and T. Ninomiya, “PECS—An efficient solution for simulating switched networks with nonlinear elements,” IEEE Transactions on Industrial Electronics, vol. 48, no. 2, pp. 367–376, April 2001.
[5] R. W. Erickson, D. Maksimović, Fundamentals of Power Electronics, 2nd ed. Norwell, MA: Kluwer Academic, 2001.
[6] B. P. McGrath, D. G. Holmes, “An Analytical Technique for the Determination of Spectral Components of Multilevel Carrier-Based PWM Methods,” IEEE Transactions on Industrial Electronics, vol. 49, no. 4, pp. 847–857, August 2002.
[7] A. Davoudi, J. Jatskevich, T. De Rybel, “Numerical state-space average-value modeling of PWM DC-DC converters operating in DCM and CCM,” IEEE Transactions on Power Electronics, vol. 21, no. 4., pp. 1003–1012, July 2006.
[8] H. P. Langtangen, A Primer on Scientific Programming with Python, Berlin: Springer, 2009.
Fig. 16. Simulation, spectrum of Li .
Fig. 17. Simulation, spectrum of INi .

Editorial objectives
In the journal ”Electronics”, the scientific papers from different fields of electronics and electrical engineering in the broadest sense are published. Main topics are electronics, automatics, telecommunications, computer techniques, power engineering, nuclear and medical electronics, analysis and synthesis of electronic circuits and systems, new technologies and materials in electronics etc. The main emphasis of papers should be on methods and new techniques, or the application of existing techniques in a novel way.
The reviewing process
Each manuscript submitted is subjected to the following review procedures:
It is reviewed by the editor for general suitability for this publication;
If it is judged suitable, two reviewers are selected and a double-blind review process takes place;
Based on the recommendations of the reviewers, the editor then decides whether the particular paper should be accepted as it is, revised or rejected.
Submissions Process
The manuscripts are to be delivered to the editor by e-mail: [email protected]. Manuscripts have to be prepared in accordance with the instructions given in the template for paper
preparation that can be found on the journal’s web page (www.electronics.etfbl.net). Authors should note that proofs are not supplied prior to publication and ensure that the paper
submitted is complete and in its final form.
Copyright
Articles submitted to the journal should be original contributions and should not be under consideration for any other publication at the same time. Authors submitting articles for publication warrant that the work is not an infringement of any existing copyright and will indemnify the publisher against any breach of such warranty. For ease of dissemination and to ensure proper policing of use, papers and contributions become the legal copyright of the publisher unless otherwise agreed.
Instruction for Authors

ISSN 1450 -5843
UDK 621.38
ELECTRONICS, VOL. 16, NO. 2, DECEMBER 2012
SPECIAL SECTION ON 16th INTERNATIONAL SYMPOSIUM ON POWER ELECTRONICS – EE2011 (PART 2)
DESIGNING ENERGY CONVERSION SYSTEMS FOR THE NEXT DECADE .................................................................................................................. 120 Slobodan N. Vukosavić
CYBER PHYSICAL SYSTEMS APPROACH TO POWER ELECTRONICS EDUCATION .............................................................................................. 125 Nikola Čelanović, Ivan Čelanović, Stevan Grabić, Vladimir Katić, Zoran Ivanović, and Marko Vekić
HIL SIMULATION OF POWER ELECTRONICS AND ELECTRIC DRIVES FOR AUTOMOTIVE APPLICATIONS .............................................. 130 Thomas Schulte, Axel Kiffe, and Frank Puschmann
PAPERS
DESIGN OF A BIOELECTRONICS HYBRID SYSTEM IN REAL TIME AND IN CLOSED LOOP ............................................................................... 136 Guilherme Bontorin, André Garenne, Colin Lopez, Gwendal Le Masson, and Sylvie Renaud
STABILIZING FERRORESONANCE OSCILLATIONS IN VOLTAGE TRANSFORMERS USING LIMITER CIRCUIT ......................................... 145 Hamid Radmanesh and Seyed Hamid Fathi
SIMULATION OF POWER ELECTRONIC CONVERTERS USING QUASI STEADY STATE APPROXIMATION ................................................... 153 Predrag Pejović
Related Documents