Electronic Waste Recycling Programs in the United States: A Comparative Analysis Mandy Knudtson Capstone Project Required for Completion of Graduation Master of Arts Policy Studies Interdisciplinary Arts and Sciences University of Washington Bothell June 9, 2014

Welcome message from author
This document is posted to help you gain knowledge. Please leave a comment to let me know what you think about it! Share it to your friends and learn new things together.
Transcript
Electronic Waste Recycling Programs in the United States:
A Comparative Analysis
Mandy Knudtson
Capstone Project Required for Completion of Graduation
Master of Arts Policy Studies
Interdisciplinary Arts and Sciences
University of Washington Bothell
June 9, 2014
Electronic Waste Policies
1
Abstract
Proper recycling of electronic waste (e-waste) allows reuse of finite resources and prevents toxic
materials in e-waste from causing harm to humans and the environment. The United States is the
only, Organization for Economic Co-operation and Development (OECD) country without
national e-waste recycling policies. Currently, 25 States have e-waste recycling policies, and 19
impose landfill disposal bans. Without federal regulations, laws differ from state-to-state, making
it difficult to control and measure outcomes. This analysis applies a framework to compare three
different types of state e-waste policy program models including: 1) Extended Producer
Responsibility (EPR); 2) Consumer-based Advanced Recovery Fee (ARF); and an 3) electronic
recycling education program. Program success was measured by the amount of e-waste recycled
by weight and product category per capita (volume); the number of permanent collection sites;
the number of collection events; who bares the costs (convenience); and if rewards or penalties
are established, (incentives) to encourage recycling. This analysis suggests convenience, cost and
incentives are the main contributing factors to program success and increasing recycling
volumes. This analysis also identifies the need for consistent reporting of e-waste data in all
states to provide greater transparency, and more accurate and consistent data regarding the
amount of e-waste recycled. Furthermore, policies at the federal level are needed to address
trans-boundary movement of e-waste across state lines.
KEY WORDS: comparative analysis, electronic waste, e-waste, e-waste policies, program
evaluation
Electronic Waste Policies
2
Electronic Waste Recycling Programs in the United States:
A Comparative Analysis
Introduction
Electronic waste (e-waste) is one of the fastest growing solid wastes streams in the
United States. In 2012, over 426 million units of electronics were purchased by U.S. consumers,
which was 17 percent of all electronics produced worldwide. This was an increase of 84.8
million units in two years. Most American households have an average of 24 electronic devices,
with the average lifecycle, including primary and secondary users, being 5 to 13 years (U.S.
EPA, 2014b, p. 61). In 2000, 1.9 million tons of e-waste was generated, and only 10 percent was
recycled. By 2012, the amount of e-waste generated increased to 3.4 million tons with 29 percent
recycled. What happens to the rest? If e-waste is not recycled, it is stockpiled, put in landfills,
incinerated or exported to developing countries (ETBC, 2013b). All of these alternatives can lead
to negative impacts on human health and the environment.
Electronics contain valuable finite resources such as: copper, gold, aluminum and rare
earth minerals. Failing to retrieve and reuse these resources leads to an increase in demand for
mining raw minerals from the earth. Mining causes a negative impact on the environment due to
the high volumes of waste it produces, and the intense energy required to extract the metals from
ore. For example, to produce one ton of aluminum, 20 to 30 tons of ore is dumped as waste.
Additionally, the smelting and processing of all these materials releases carbon dioxide into the
atmosphere and contributes to the increase of greenhouse gases (Rainforest Relief, 2014).
When e-waste is put in a landfill, not only are finite resources lost, but there is risk of
toxic material leaching overtime and contaminating soil and ground water. Globally, many
Electronic Waste Policies
3
electronics are recognized as hazardous electronic waste (HEW). These HEWs include metals
such as: lead, mercury, cadmium, beryllium and other problematic components such as:
polyvinyl chloride (PVC) and brominated flame retardants (BFRs), which are carcinogenic when
incinerated. Heavy metal exposure can lead to acute symptoms such as coughs, nausea and
headaches (see Appendix A), as well as serious chronic conditions including: neuropathy, cancer
and death (CDC, 2013).
Estimates indicate more than 50 percent of toxic e-waste, not recycled in the U.S., is
illegally transported to developing countries, including: Africa, China and India, to be recycled
in primitive recycling villages (ETBC, 2011). In places like, Guiyu, China, poor people earning
less than 20 U.S. dollars per day, break down hazardous electronics to extract the valuable finite
resources, exposing themselves and their children to hazardous heavy metals, which also leach
into ground water contaminating wells and nearby rivers (The Wasteland, 2008).
In 1989, at a United Nations conference in Basel Switzerland, global inequity of
hazardous waste was addressed when 179 countries, including the U.S. signed a treaty stating no
hazardous waste would be exported from developed nations to developing nations. By 1992, all
of the countries accept for Afghanistan, Haiti and the U.S. ratified the Basel Treaty into law
(Basel, 2013). Not only has the U.S. still not ratified the Basel Treaty, but there are minimal e-
waste policies, which only pertain to Cathode Ray Tubes1 (CTRs) (U.S. EPA, 2013).
Without federal regulations, it is left to each state to create policies, generate funds and
manage programs (U.S.EPA, 2014b). Currently, 25 U.S. States have some type of e-waste
policy, and 19 have banned hazardous e-waste from being put in solid waste landfills (see
Appendix B). Because states don’t currently prevent hazardous e-waste from crossing state
Electronic Waste Policies
4
lines, or regulate international exports of e-waste, how successful are these policies? For
instance, what prevents hazardous CRTs full of lead from being transported to landfills in one of
the 31 states with no regulations against putting e-waste in a landfill (ERCC, 2013)?
Stone Castle Recycling in Parowan, Utah, USA, is an example of what can happen when
policies are not good enough. Stone Castle had been collecting e-waste to “recycle”, but instead
stockpiled large amounts outside their facility. On March 3, 2014, over 300 cardboard Gaylord
boxes (4 x 4 cubic feet) full of old console TVs, CRT monitors and other electronics, turned into
a toxic inferno. The fire released carcinogenic chemicals into the atmosphere, and left residual
heavy metals on the ground (BAN, 2014). Stone Castle is a recycler listed on Utah’s Department
of Environmental Quality website (Utah DEQ, 2014).
Inconsistent state policies or lack of policies, lead to inadequate reporting and control of e-
waste. This analysis set out to identify best practices to inform states how to overcome
challenges, and develop optimal program infrastructures to eliminate putting e-waste in landfills,
incinerators, using prison labor or illegal export.
Five programs were evaluated to determine how much e-waste was recycled per capita. It
was then compared to the number of collection sites and events, as well as if there were
incentives (penalties or rewards) to recycle. Discovering best practices, to encourage reuse and
recycling of covered electronic devices (CEDs) domestically, may lead to less e-waste lost to
landfills or illegal export (ERCC, 2010).
This analysis compares the three types of state e-waste policies in the U.S. including: 1)
Consumer-based Advanced Recovery Fee (ARF) system, which requires consumers to pay for
future recycling costs at point-of sale (Calrecycle, 2014a); 2) Extended Producer Responsibility
(EPR), which places the burden on the manufacturer to cover costs to recycle CEDs at end-of-
Electronic Waste Policies
5
life; and 3) Utah’s electronic recycling education program, that requires manufactures to provide
consumer education about where and how to properly recycle CEDs (Utah DEQ, 2013). State
recycling programs differ in multiple ways, such as: 1) which electronic products are included in
the program; 2) which entities are covered (e.g. households, businesses etc…); 3) who pays for
the recycling; and 4) what documentation is required and how is it reported.
The two main questions of this analysis are: 1) What policies have been developed in the
U.S. to divert e-waste from landfills, incinerators and illegal export to and enable reuse of finite
materials?; and 2) How effective are these state policies? To address these questions, this
analysis compared rules that involved CEDs in each program; rules for program “actors”; and
rules that regulate e-waste disposal and recycling processes.
The subsequent sections of this paper are organized as follows. First, relevant papers from
recycling literature are reviewed to justify analysis framework and modeling choices. Next, there
is a review of datasets and methodology. Then, the analytical framework and research design are
discussed. Finally, the results, conclusions and suggestions for future work are shared.
Literature Review
Recycling electronics effectively is a challenge facing the U.S, and currently the burden
is on each individual state. A number of articles and studies discuss the problems with e-waste,
and challenges the recycling industry stakeholder’s face. There are several articles that analyze
recycling policies and best practices within North America and Europe. The Extended Producer
Responsibility (EPR) is the most common program model; therefore multiple articles have been
reviewed on that topic.
Problems with E-waste
Electronic Waste Policies
6
E-waste is a growing problem, (Bhutta, M.K.S, et al., 2011) as the volume increases, so
does the toxic waste. The absence of federal policies in the U.S., and non-cohesive state policies,
has led to more e-waste being dumped in solid waste landfills or being exported illegally.
Planned obsolescence, which is designing electronic devices to wear out quicker, magnifies the
e-waste problem (Meigs, 2012).
The Federal EPA concurs; e-waste is a global problem that negatively impacts human
health and the environmental and exporting e-waste is a “lost opportunity to recover valuable
resources” (Adrian, 2013). However, simply acknowledging the issue fails, to prevent illegal
exports of hazardous e-waste from shipping to developing countries or being dumped in landfills
(Adrian, 2013).
In an EPA report, Daniel Gallo shared the EPAs role in e-waste management, it
included the following: 1) creating incentives for greener products; 2) federal government to lead
by example; 3) placing emphasis on safe and effective management of e-waste in the U.S.; and
4) U.S. to reduce harm from exports of e-waste to developing countries (Gallo, 2013, p 16).
E-Waste Industry Challenges
It’s problematic for manufactures to create and maintain take-back programs that are in
alignment with all of the different state policies (Greenemeir, 2009). A factor challenging state e-
waste policies, is the potential impact neighboring states without policies may have, especially in
regards to landfilling electronics that are difficult and costly to recycle (Bhutta, M.K.S., et
al.,2011). When costs to recycle electronics meet or surpass the material value, motivation to
recycle decreases. This challenge was addressed by Milovantseva and Saphores (2013a) in their
study that explored preferences of U.S. households for disposing of their e-waste. They surveyed
3,159 respondents, using a multinomial logit model, to find out what consumers did with
Electronic Waste Policies
7
electronics when landfill bans were imposed. The category options included: “Recycle”, “Trash”,
“Reuse” and “Store.” They suggested consumers were more likely to “recycle” smaller devices,
such as mobile phones, and “store” larger items, such as televisions, when there was a ban on
putting electronics in landfills. They also suggested convenience was a factor, as it is easier to
store a TV, versus hauling it to a recycler, and possibly having to pay a fee to recycle it.
In contrast, the Electronics Take Back Coalition (ETBC,2011) has found landfill bans
lead to an increase in e-waste recycling in most states. For instance, in January, 2006 Maine
started an e-waste recycling program and collected 1,292,202 pounds of e-waste in six months.
After the landfill ban went into effect on July 1, 2006, the amount of e-waste collected in the
next six months, more than doubled at 2,869,372 pounds (ETBC, 2011).
Policies and Best Practices
A study conducted at the Georgia Institute of Technology showed individual producer
responsibility, (IPR) versus collective producer responsibility, (CPR) was more effective at
creating an incentive for producers to manufacturer products that last longer, are easier to recycle
and are less toxic. The CPR models are based on manufactures paying a percent of all electronics
sold, regardless of brand. This creates a “free-rider” situation, because product types are not
differentiated, and companies that produce electronics that reach end of life sooner, and are more
costly to recycle, benefit from producers that are making their products last longer and are less
costly to recycle (Atasu and Subramanian, 2012).
The Electronics Recycling Coordination Clearing house (ERCC) collaborated with the
Product Stewardship Institute, (PSI) and multiple recycling industry stakeholders, to identify
performance measures to compare e-waste programs (ERCC, 2010).
Producer Responsibility
Electronic Waste Policies
8
Many papers explore Extended Producer Responsibility (EPR), because it is a common
model. Characteristics of EPRs include: manufacturers are responsible for the cost of recycling
e-waste; manufacturers are required to organize collection sites and events; annual recycling
quotas for manufacturers must be met; and there are often penalties for short falls. Kiddee’s
study suggests EPR may not be adequate alone, but when combined with other tools (e.g.
Lifecycle Assessment, Material Flow Analysis and Multi Criteria Analysis) many issue may be
resolved. Kiddee also suggested limited federal involvement in state policies contributes to
limited abilities to effectively recover e-waste in take-back programs (Kiddee, 2013).
Nash and Boso’s key finding showed EPR models create conflicts between producers and
waste collectors, because producers are only obligated to ensure end-of-life electronics are
recycled, and generally have no incentive to encourage production of less toxic, or easier to
recycle electronics (Nash and Boso, 2013). Mayor and Butler (2013) found EPR models often
lead to negative behaviors such as stockpiling of e-waste, because collectors and processors are
required to accept all CEDS when registered in the program. There can be an unequal
distribution of devices, which vary in levels of toxicity and complexity to recycle. Since
reimbursements are based on CEDs weight and not type, it can put some processors at a
disadvantage.
Competition in the U.S. market inhibits cooperation between brand owners regarding
collective take-back programs (Hickle, 2013). Hickle suggests some companies are “free riders”
and are not fulfilling their financial obligations. The e-waste programs need to emphasis
recycling goals, standards that focus on consumer convenience for collecting CEDs, and impose
enforcement mechanisms to decrease the number of “free riders.” Atasu and Subramanian (2011)
had similar findings with collective product return programs. They found, because some
Electronic Waste Policies
9
manufacturers would benefit from others, it would demotivate other companies and prevent them
from reaching or surpassing their recycling goals.
Methodology
To evaluate the five e-waste recycling programs, Calrecycle, E-Cycle, E-Cycle Oregon,
E-Cycle Washington, E-Cycle Wisconsin and Utah, the comparative analysis research design
was based on Robert Yin’s (2014) methodology. Following Yin’s method, the first step was to
identify similarities and differences in programs. The goal was to analyses a few programs that
would be representative of all 25 state programs. The next step was to create a strategy with a
matrix of categories and place program attributes into the categories. This was followed by
creating tables to examine information and identify available data. Finally, by working with the
data from the ground up, as directed by Yin, patterns were identified (Yin, 2014 p. 133-137). The
data was then compared to established performance measures used in other analysis.
Data used in this analysis came from governmental agencies and regulators, including:
the California State EPA and the Calrecycle Program (Calrecycle.2014a); the Washington State
Department of Ecology and the E-Cycle Washington Program (E-Cycle Washington, 2013); the
Wisconsin’s Department of Natural Resources (WI- DNR, 2013) and the E-Cycle Wisconsin
Program; the United States Environmental Protection Agency (U.S. EPA, 2014a); the Utah
Department of Environmental Quality (Utah DEQ, 2014); the Databases from Electronics
Recycling Cooperation Clearinghouse, (ERCC, 2013); the Electronic Take Back Coalition
(ETBC, 2013a), and the National Center for Manufacturing Sciences (NCMS, 2013).
Best practices for measuring performance, and comparing state electronic recycling
programs, were developed through a collaborative effort of the National Center for Electronics
Recycling (NCER), the Product Stewardship Institute (PSI), and the Electronics Recycling
Electronic Waste Policies
10
Clearing House (ERCC). Performance measures, to determine best practices for this analysis,
were drawn from a rich body of literature, which analyzed similar e-waste policies and programs.
Analytical Framework
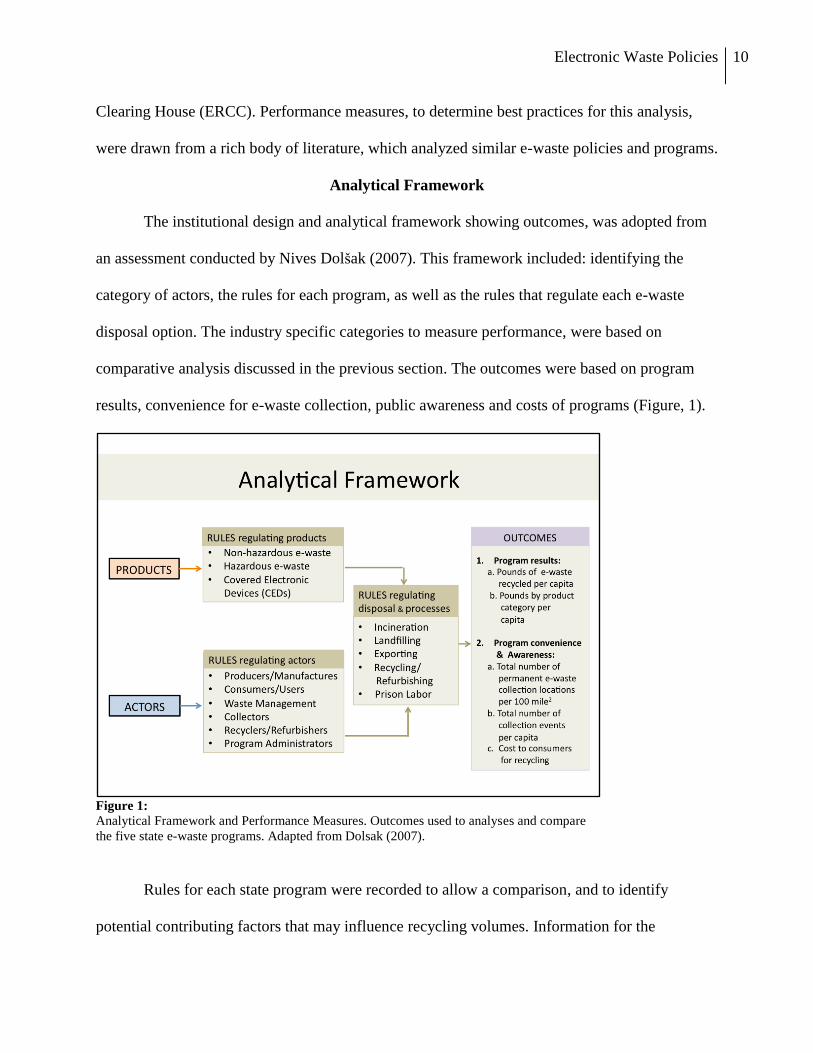
The institutional design and analytical framework showing outcomes, was adopted from
an assessment conducted by Nives Dolšak (2007). This framework included: identifying the
category of actors, the rules for each program, as well as the rules that regulate each e-waste
disposal option. The industry specific categories to measure performance, were based on
comparative analysis discussed in the previous section. The outcomes were based on program
results, convenience for e-waste collection, public awareness and costs of programs (Figure, 1).
Figure 1:
Analytical Framework and Performance Measures. Outcomes used to analyses and compare
the five state e-waste programs. Adapted from Dolsak (2007).
Rules for each state program were recorded to allow a comparison, and to identify
potential contributing factors that may influence recycling volumes. Information for the
Electronic Waste Policies
11
following categories was collected: covered electronic devices, covered entities (e-g. households,
businesses etc…), funding source, incentives, penalties, rules for actors, as well as rules
regarding-waste and prison labor, landfills, and incineration.
Program convenience and awareness were based on: the total number of permanent e-
waste collection locations per 100 square miles; the total number of collection events; and if
there is a cost to consumers to drop off CEDs ERCC, 2013). It is predicted that more collection
sites and collection events, will lead to higher levels of convenience for consumers, who will
then be more prone to drop off e-waste for recycling (Bhutta, M.K.S., et al, 2011). It was
recorded whether or not the consumer is required to pay a fee to drop of e-waste, or if it is free,
as this may influence the amount of e-waste recycled, and be a factor in the consumer’s
participation in the program (Bhutta, M.K.S., et al, 2011). If a the number of collection sites
were less than .25/100 square miles it was coded as low; if greater than or equal to .26 and less
than .35/100 square miles, it was coded as moderate; and if greater than .36/100 square miles it
was coded as high. This range was based on the number of collections sites, divided by 100
square miles and compared to the population in each state2.
The amount of CEDs collected in pounds per capita in 2012 was calculated for each
program. If pounds per capita were less than 3.0 it was coded as low; if greater than or equal to
3.1, and less than 6.0, it was coded as moderate; and if greater than .6.1 it was coded as high. The
pounds per capita, number of collection sites, and collection sites per square mile, were used to
determine which programs were most successful in 2012. Success is considered being coded as
high or high-to-moderate.
The two main categories identified to measure performance of state e-waste policies are:
program results, and program convenience and awareness. The NCER, ERCC and PSI
Electronic Waste Policies
12
recommended key principles to follow when analyzing and evaluating the success of e-waste
programs. Additional performance measures should include the following principles: relevance
to industry, quality of data, ease of use, program transparency, accessibility, and adoptability
(ERCC, 2010).
There were several data limitations faced with this analysis. First, the three EPR
programs, base their fees charged to manufactures, on e-waste that is either sold or recycled in
the state. If a CED is sold in one state, and counted as a market share, but is recycled in another
state program, and counted as a return share, the manufacturer may pay twice for the same CED.
Second, there are no interstate commerce laws to prevent e-waste from moving between states,
which makes it difficult to prevent e-waste from going from a state with e-waste landfill laws,
into the landfill of a state without e-waste landfill laws. This may lead to recyclers collecting a
fee for CEDs, and then sending them to a neighboring state’s landfill. Third, manufactures may
become unmotivated to surpass, or reach quotas due to “free riders.” Finally, because e-waste
programs have a variety of covered electronics and covered entities, it is challenging to make
equitable comparisons between programs.
Comparative Analysis of Five E-waste Programs in the United States
Calrecycle Program Overview
In 2003, the Electronic Waste Recycling Act (EWRA) was signed into law in California,
and amended on September 24, 2004 (SB 50, 2004, Sher). The Calrecycle Program was launched
January 1, 2005, and was the first U.S. state to establish an e-waste recycling program. The two
main objectives of the EWRA included: limiting the amount of toxic substances in electronic
devices sold in California; and establishing a funding mechanism to cover recycling costs for
covered electronic devices (CEDs) at end-of-life (Calrecycle, 2013).
Electronic Waste Policies
13
California is the only state to implement the Advanced Recovery Fee System (ARF) for
electronic products. The program funding comes from a fee charged to consumers at point-of-
sale for CEDs. Two state agencies are program administrators, the Public Trust Account (PTA),
and the Board of Equalization (BOE), appointed by the California EPA. The role of the PTA is
to collect fees from retailers, process requests from registered recyclers and collectors, and
provide reimbursement for their services (Calrecycle, 2012).
To be an approved handler of e-waste, collectors and recyclers must notify the
Department of Toxic Substance Control (DTSC) and submit an application to the California
Integrated Waste Management Board (CIWMB). The DTSC defines e-waste as any electronic
device that contains toxic substances. However, all devices that contain toxic substances are not
considered CEDs in the Calrecycle program (DTSC, 2013). If an electronic device is not part of
the Calrecycle program, but contains toxic material, it is still not allowed to be put in the trash,
because California has a ban against hazardous e-waste going into landfills (DTSC, 2013).
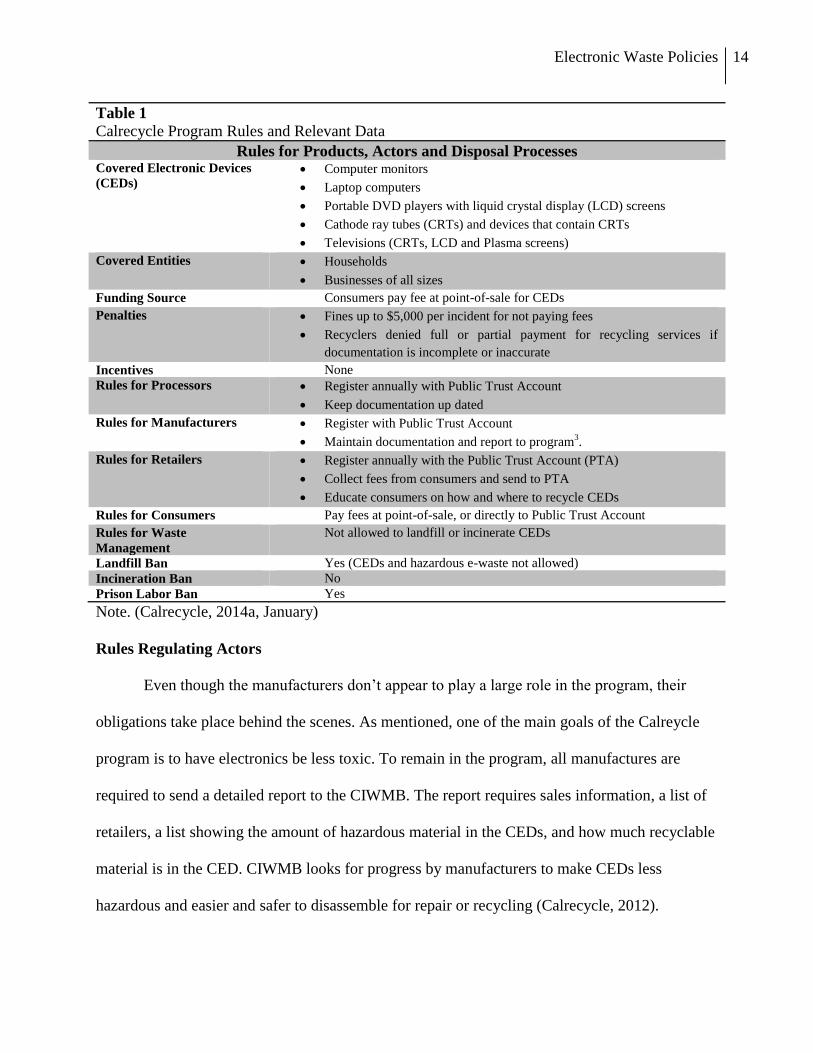
Rules Regulating Products
All CEDs must have a permanent label attached, to identify the manufactures brand.
Retail stores are only allowed to sell CEDs from manufacturers that are registered annually with
the Calrecycle program, and have a brand label attached. As mentioned, consumers are required
to pay the fee at time of purchase. If a CED is purchased on-line, or out of state, the law still
requires consumers to send the fee to the PTA. Currently, the fee is between $3 and $5 per CED,
depending on screen size. The penalty for not paying could be up to $5000 per incident. Covered
entities in the program include households and businesses of all sizes. Therefore, large
companies could be subject to very large fines if not compliant. See Table 1 for CEDs and other
program rules (Calrecycle, 2014b).
Electronic Waste Policies
14
Table 1
Calrecycle Program Rules and Relevant Data
Rules for Products, Actors and Disposal Processes Covered Electronic Devices
(CEDs)
Computer monitors
Laptop computers
Portable DVD players with liquid crystal display (LCD) screens
Cathode ray tubes (CRTs) and devices that contain CRTs
Televisions (CRTs, LCD and Plasma screens)
Covered Entities
Households
Businesses of all sizes
Funding Source Consumers pay fee at point-of-sale for CEDs
Penalties Fines up to $5,000 per incident for not paying fees
Recyclers denied full or partial payment for recycling services if
documentation is incomplete or inaccurate
Incentives None
Rules for Processors Register annually with Public Trust Account
Keep documentation up dated
Rules for Manufacturers Register with Public Trust Account
Maintain documentation and report to program3.
Rules for Retailers Register annually with the Public Trust Account (PTA)
Collect fees from consumers and send to PTA
Educate consumers on how and where to recycle CEDs
Rules for Consumers Pay fees at point-of-sale, or directly to Public Trust Account
Rules for Waste
Management
Not allowed to landfill or incinerate CEDs
Landfill Ban Yes (CEDs and hazardous e-waste not allowed)
Incineration Ban No
Prison Labor Ban Yes
Note. (Calrecycle, 2014a, January)
Rules Regulating Actors
Even though the manufacturers don’t appear to play a large role in the program, their
obligations take place behind the scenes. As mentioned, one of the main goals of the Calreycle
program is to have electronics be less toxic. To remain in the program, all manufactures are
required to send a detailed report to the CIWMB. The report requires sales information, a list of
retailers, a list showing the amount of hazardous material in the CEDs, and how much recyclable
material is in the CED. CIWMB looks for progress by manufacturers to make CEDs less
hazardous and easier and safer to disassemble for repair or recycling (Calrecycle, 2012).
Electronic Waste Policies
15
Recyclers, refurbishers and collectors must all register annually with the DTSC, as well
as submit documentation to the PTA to get reimbursed for recycling CEDs. If documentation is
inaccurate or incomplete, the PTA can withhold all, or part, of the recyclers or collectors
reimbursement. Processors and collectors are not allowed to charge households or businesses for
recycling of CEDs, since they have pre-paid for that service. Non-CEDs may be subject to a fee,
but that is up to each business (Calrecycle, 2014b)
Rules Regulating Disposal and Processes
The program administrators of Calrecycle have the authority to suspend or revoke
recyclers from participating in the program. The reasons include: improper management of
hazardous materials detected by the DTSC during a site inspection; not conforming to DTSC
policies; failing to notify Calrecycle of changes to application, or partaking in prohibited
activities such as landfilling hazardous e-waste, using prison labor or creating fraudulent reports
(Calrecycle, 2012).
In 2006, California implemented a statewide ban against landfilling hazardous e-waste.
All consumers including: households, large and small businesses and government agencies are
expected to participate in the Calrecycle program. Since the fees are collected up front, and the
consumers aren’t allowed to dispose of e-waste in landfills, there is an incentive to take end-of-
life devices to collectors and processors.
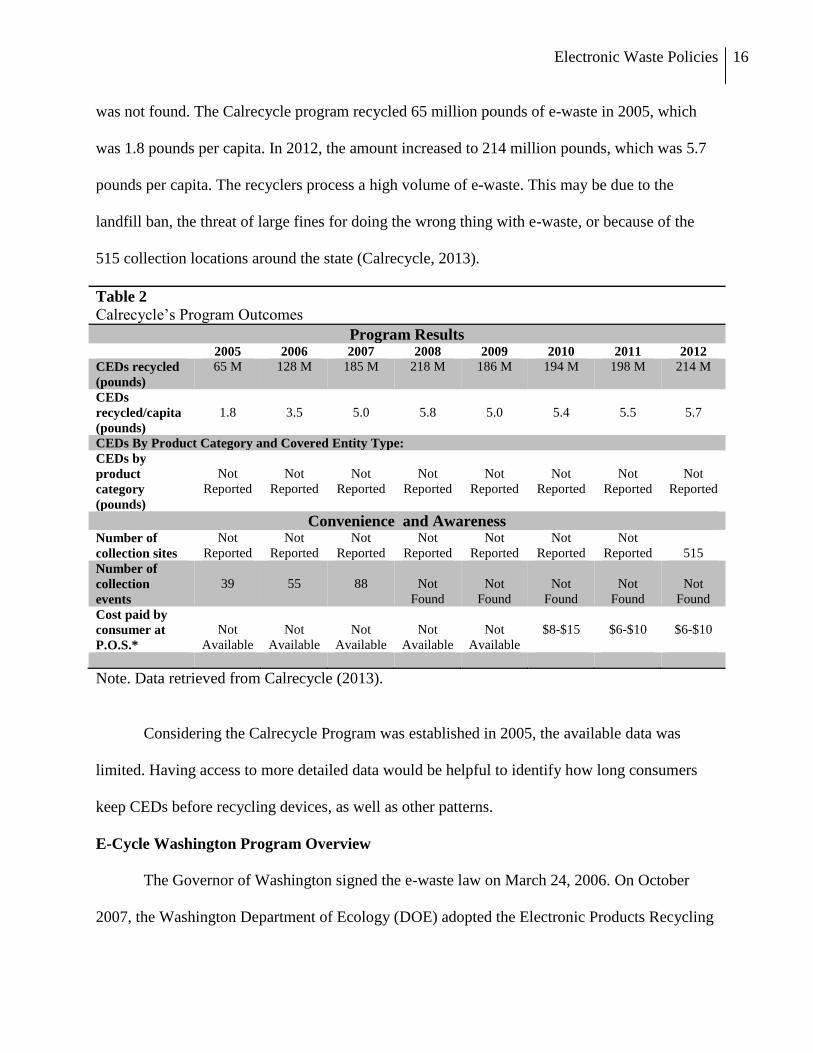
Calrecycle Program Outcomes
The California e-waste program is diligent in reporting the overall volume of CEDs
recycled, and pounds per capita, however a detailed list of CEDs by product category was not
available (see Table 2). Consistent data was also not found for the number of collection events
and permanent sites. There is a current list of collection locations, but the historical information
Electronic Waste Policies
16
was not found. The Calrecycle program recycled 65 million pounds of e-waste in 2005, which
was 1.8 pounds per capita. In 2012, the amount increased to 214 million pounds, which was 5.7
pounds per capita. The recyclers process a high volume of e-waste. This may be due to the
landfill ban, the threat of large fines for doing the wrong thing with e-waste, or because of the
515 collection locations around the state (Calrecycle, 2013).
Table 2
Calrecycle’s Program Outcomes
Program Results 2005 2006 2007 2008 2009 2010 2011 2012
CEDs recycled
(pounds)
65 M 128 M 185 M 218 M 186 M 194 M 198 M 214 M
CEDs
recycled/capita
(pounds)
1.8
3.5
5.0
5.8
5.0
5.4
5.5
5.7
CEDs By Product Category and Covered Entity Type:
CEDs by
product
category
(pounds)
Not
Reported
Not
Reported
Not
Reported
Not
Reported
Not
Reported
Not
Reported
Not
Reported
Not
Reported
Convenience and Awareness Number of
collection sites
Not
Reported
Not
Reported
Not
Reported
Not
Reported
Not
Reported
Not
Reported
Not
Reported
515
Number of
collection
events
39
55
88
Not
Found
Not
Found
Not
Found
Not
Found
Not
Found
Cost paid by
consumer at
P.O.S.*
Not
Available
Not
Available
Not
Available
Not
Available
Not
Available
$8-$15
$6-$10
$6-$10
Note. Data retrieved from Calrecycle (2013).
Considering the Calrecycle Program was established in 2005, the available data was
limited. Having access to more detailed data would be helpful to identify how long consumers
keep CEDs before recycling devices, as well as other patterns.
E-Cycle Washington Program Overview
The Governor of Washington signed the e-waste law on March 24, 2006. On October
2007, the Washington Department of Ecology (DOE) adopted the Electronic Products Recycling
Electronic Waste Policies
17
Program – “WAC 173-900” E-Cycle Washington. The program policies are based on an
Extended Producer Responsibility (EPR) model, and the Return Share principle. The Return
Share is based on how many pounds of CEDs are returned for recycling, then an estimated
percent is attributed to manufacturers, based on the amount of CEDs sold in previous three years.
The manufacturers must also pay a percentage of “orphan” CEDs. Orphans are electronic devices
where the manufacturer (brand owner) is no longer in business or could not be identified (ECY,
2014).
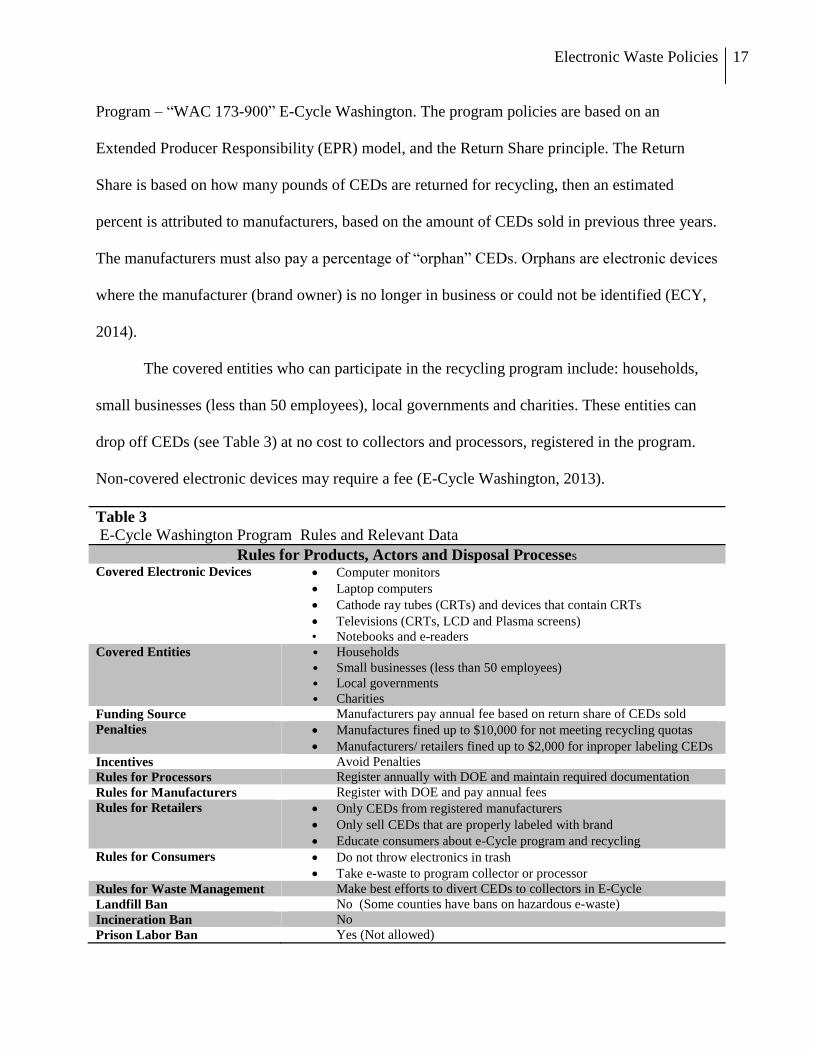
The covered entities who can participate in the recycling program include: households,
small businesses (less than 50 employees), local governments and charities. These entities can
drop off CEDs (see Table 3) at no cost to collectors and processors, registered in the program.
Non-covered electronic devices may require a fee (E-Cycle Washington, 2013).
Table 3
E-Cycle Washington Program Rules and Relevant Data
Rules for Products, Actors and Disposal Processes
Covered Electronic Devices Computer monitors
Laptop computers
Cathode ray tubes (CRTs) and devices that contain CRTs
Televisions (CRTs, LCD and Plasma screens)
• Notebooks and e-readers
Covered Entities • Households
• Small businesses (less than 50 employees)
• Local governments
• Charities
Funding Source Manufacturers pay annual fee based on return share of CEDs sold
Penalties Manufactures fined up to $10,000 for not meeting recycling quotas
Manufacturers/ retailers fined up to $2,000 for inproper labeling CEDs
Incentives Avoid Penalties
Rules for Processors Register annually with DOE and maintain required documentation
Rules for Manufacturers Register with DOE and pay annual fees
Rules for Retailers Only CEDs from registered manufacturers
Only sell CEDs that are properly labeled with brand
Educate consumers about e-Cycle program and recycling
Rules for Consumers Do not throw electronics in trash
Take e-waste to program collector or processor
Rules for Waste Management Make best efforts to divert CEDs to collectors in E-Cycle
Landfill Ban No (Some counties have bans on hazardous e-waste)
Incineration Ban No
Prison Labor Ban Yes (Not allowed)
Electronic Waste Policies
18
Note. Data retrieved from E-Cycle WA (ECY, 2014)
Rules Regulating Products
CEDs that are not part of the E-Cycle Washington program may or may not contain
hazardous waste. However, all electronics contain finite resources that need to be retrieved
versus lost to a landfill. Almost all electronics contain flame retardants, which are carcinogenic
when burned, which is often done in open air pits in Africa and China (The Wasteland, 2008), or
even in the U.S, which was the case at Stone Castle Recycling in Utah (BAN, 2014). Washington
doesn’t currently have a statewide ban on putting non-CEDs in landfills, but recycling should be
considered strongly as the option (ERCC, 2013).
Rules Regulating Actors
Rules for the manufacturers require they register with Washington’s Department of
Ecology (DOE), and pay an annual fee based on a return share system. Companies pay between
$7 and $37,217 annually depending on how many CEDs of their brand are purchased in
Washington. The fees cover future recycling of the CEDs. The manufacturers must also ensure
CEDs are recycled by promoting collection events and collector programs, which are referred to
as collection sites. If recycling quotas for the manufacturers are not met, the DOE can administer
a fine up to $10,000. The fines are incentives to ensure companies actively promote consumers
to recycle electronics, especially the CEDs (Till, 2007).
Rules for recyclers, refurbishers and collectors require submitting documentation and
reports to the DOE annually. These reports include itemized list of CEDs by volume to help
determine the return share. These reports are combined with reports from the retail stores, and
the DOE calculates each manufacturers return share percent, and sends a fine to companies that
didn’t meet the quota (E-Cycle WA, 2007).
Electronic Waste Policies
19
There are no specific rules for consumers, but they are expected to do their part by taking
end-of-life electronics to a program collector or processor. Manufacturers complain because they
can’t force people to recycle CEDs, or prevent them from putting CEDs in a landfill (Till, 2007).
Since there are no statewide landfill bans in Washington, there may be less motivation to recycle
compared to states with landfill bans.
Rules Regulating Disposal and Processes
As mentioned, putting e-waste in landfills in Washington is not prohibited, nor is
incineration or prison labor. This study was not able to determine if collectors or recyclers, not in
the E-Cycle WA program, use these methods of disposal. It would be a good test if a landfill bam
is implemented, to see if it would cause a spike in the volume of e-waste recycled.
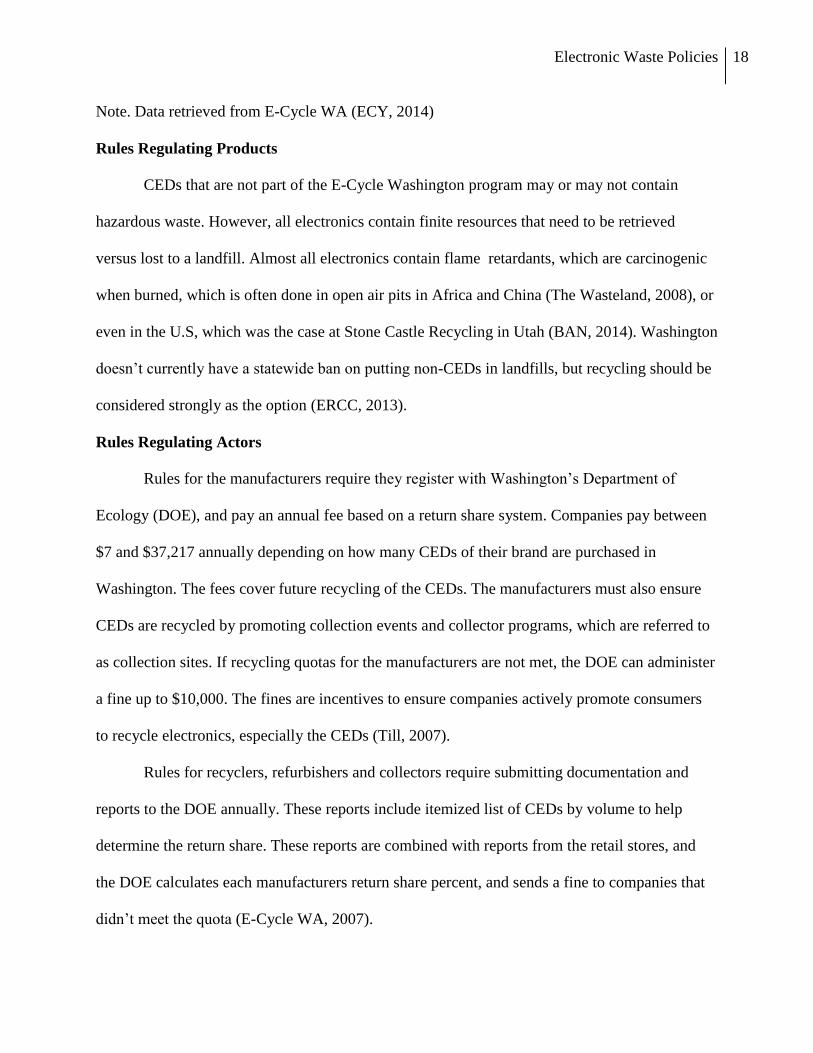
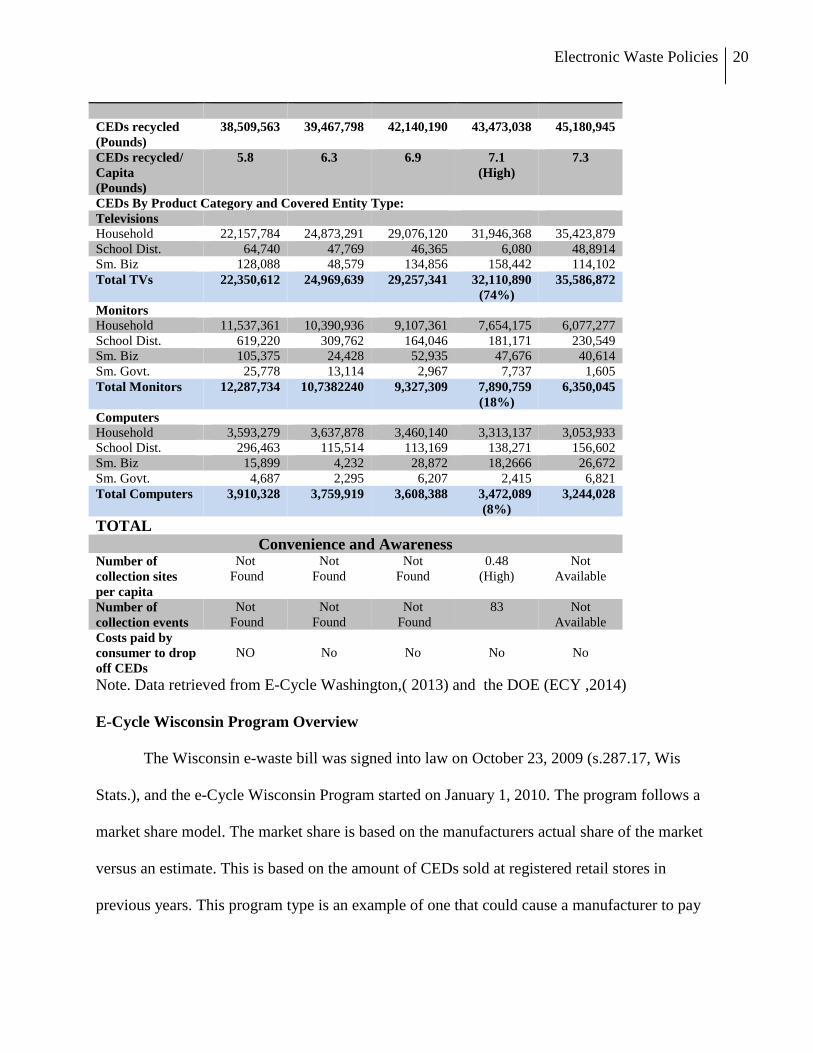
E-Cycle Washington’s Program Outcomes
Since the program started, there has been a 17% increase in the amount of CEDs
collected for recycling (Table 4). The pounds per capita collected went from 5.8 pounds in 2009
to 7.3 in 2013. The CEDs are reported by category, with the following percentage distribution of
devices recycled in 2012: televisions were 74 percent of CEDs recycled, monitors were 18
percent, and computers were 8 percent. Based on findings from Milovantseva and Saphones
(2013), consumers may be more likely to recycle their CEDs, such as televisions that don’t
contain memory and private information, (e.g social security numbers and bank information,).
Also, devices with personal data are more likely to get stored versus recycled. Manufacturers in
the program conducted 83 collection events in 2012, and there were 332 permanent collection
sites (.48/mile2).
Table 4
E-Cycle Washington’s Program Outcomes
Program Results 2009 2010 2011 2012 2013
Electronic Waste Policies
20
CEDs recycled
(Pounds)
38,509,563 39,467,798 42,140,190 43,473,038 45,180,945
CEDs recycled/
Capita
(Pounds)
5.8 6.3
6.9 7.1
(High)
7.3
CEDs By Product Category and Covered Entity Type:
Televisions
Household 22,157,784 24,873,291 29,076,120 31,946,368 35,423,879
School Dist. 64,740 47,769 46,365 6,080 48,8914
Sm. Biz 128,088 48,579 134,856 158,442 114,102
Total TVs 22,350,612 24,969,639 29,257,341 32,110,890
(74%)
35,586,872
Monitors
Household 11,537,361 10,390,936 9,107,361 7,654,175 6,077,277
School Dist. 619,220 309,762 164,046 181,171 230,549
Sm. Biz 105,375 24,428 52,935 47,676 40,614
Sm. Govt. 25,778 13,114 2,967 7,737 1,605
Total Monitors 12,287,734 10,7382240 9,327,309 7,890,759
(18%)
6,350,045
Computers
Household 3,593,279 3,637,878 3,460,140 3,313,137 3,053,933
School Dist. 296,463 115,514 113,169 138,271 156,602
Sm. Biz 15,899 4,232 28,872 18,2666 26,672
Sm. Govt. 4,687 2,295 6,207 2,415 6,821
Total Computers 3,910,328 3,759,919 3,608,388 3,472,089
(8%)
3,244,028
TOTAL
Convenience and Awareness Number of
collection sites
per capita
Not
Found
Not
Found
Not
Found
0.48
(High)
Not
Available
Number of
collection events
Not
Found
Not
Found
Not
Found
83 Not
Available
Costs paid by
consumer to drop
off CEDs
NO
No
No
No
No
Note. Data retrieved from E-Cycle Washington,( 2013) and the DOE (ECY ,2014)
E-Cycle Wisconsin Program Overview
The Wisconsin e-waste bill was signed into law on October 23, 2009 (s.287.17, Wis
Stats.), and the e-Cycle Wisconsin Program started on January 1, 2010. The program follows a
market share model. The market share is based on the manufacturers actual share of the market
versus an estimate. This is based on the amount of CEDs sold at registered retail stores in
previous years. This program type is an example of one that could cause a manufacturer to pay
Electronic Waste Policies
21
for CEDs to get recycled more than one time, if the devices are taken to another state after being
purchased in Wisconsin.
The state policy includes a ban on putting e-waste in landfills. The main goals of the
program have been to keep CEDs out of landfills, improve recycling convenience for consumers,
place the burden of recycling costs on the producers, decrease administrative costs for the state
agencies, and increase recycling jobs (WI-DNR, 2013).
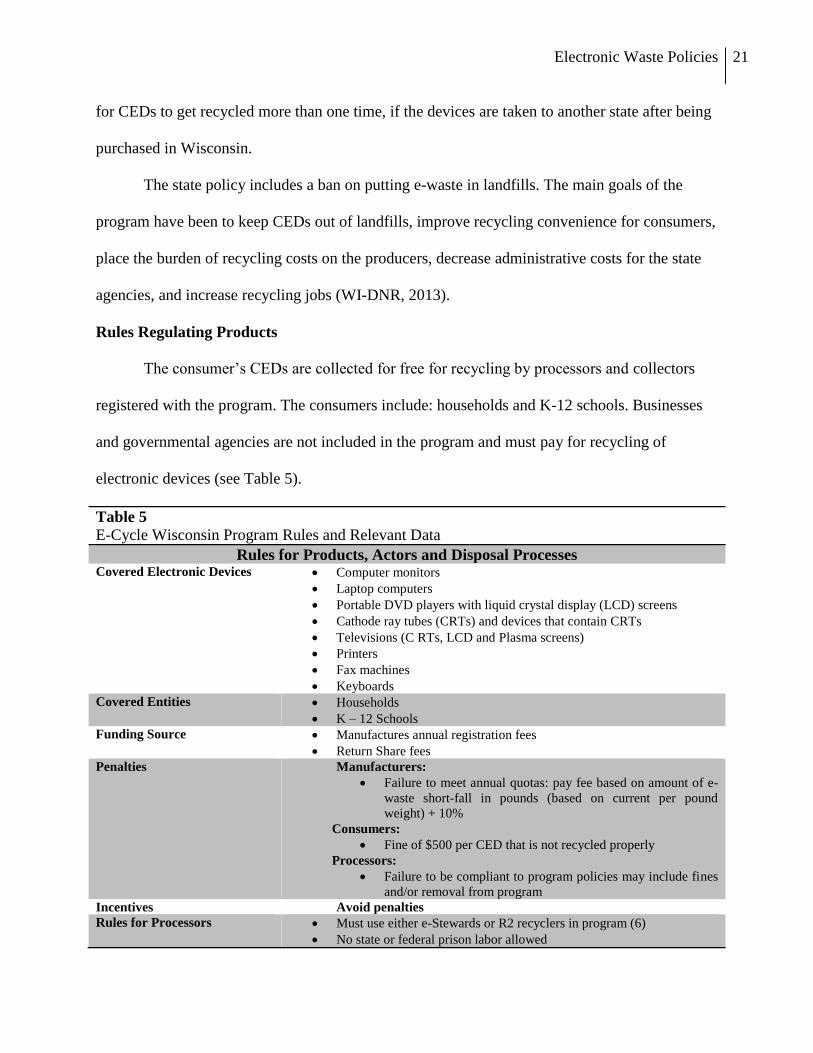
Rules Regulating Products
The consumer’s CEDs are collected for free for recycling by processors and collectors
registered with the program. The consumers include: households and K-12 schools. Businesses
and governmental agencies are not included in the program and must pay for recycling of
electronic devices (see Table 5).
Table 5
E-Cycle Wisconsin Program Rules and Relevant Data
Rules for Products, Actors and Disposal Processes Covered Electronic Devices Computer monitors
Laptop computers
Portable DVD players with liquid crystal display (LCD) screens
Cathode ray tubes (CRTs) and devices that contain CRTs
Televisions (C RTs, LCD and Plasma screens)
Printers
Fax machines
Keyboards
Covered Entities Households
K – 12 Schools
Funding Source Manufactures annual registration fees
Return Share fees
Penalties Manufacturers:
Failure to meet annual quotas: pay fee based on amount of e-
waste short-fall in pounds (based on current per pound
weight) + 10%
Consumers:
Fine of $500 per CED that is not recycled properly
Processors:
Failure to be compliant to program policies may include fines
and/or removal from program
Incentives Avoid penalties
Rules for Processors Must use either e-Stewards or R2 recyclers in program (6)
No state or federal prison labor allowed
Electronic Waste Policies
22
Rules for Manufacturers Register annually with program administration
Pay annual fees
Maintain documentation
Attach brand labels on all CEDs
Rules for Retailers Only sell CEDs of manufacturers registered in program
Ensure brand labels are on CEDs
Educate consumers about recycling CEDs at end-of-life
Rules for Consumers Recycle all CEDs with processors in program
Do not put e-waste in trash
Rules for Waste Management Do not put CEDs in landfill
Landfill Ban Yes (Hazardous e-waste not allowed)
Incinerator Ban No
Prison Labor Ban Yes (Not allowed)
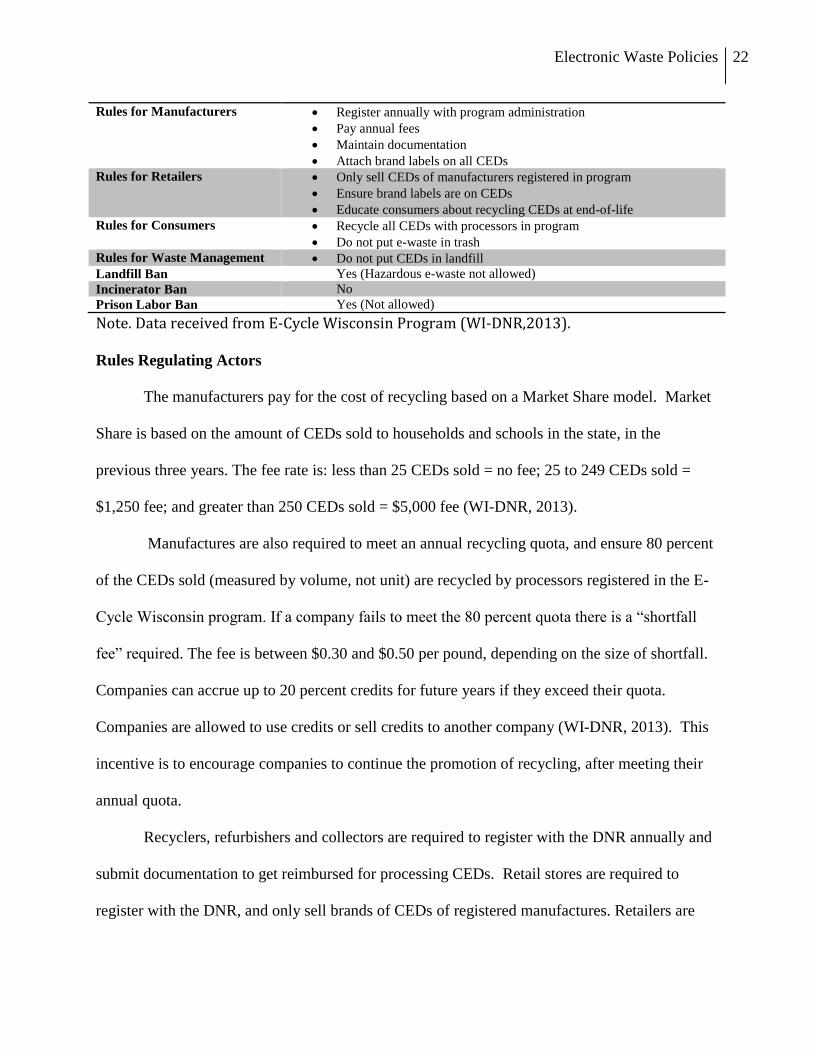
Note. Data received from E-Cycle Wisconsin Program (WI-DNR,2013).
Rules Regulating Actors
The manufacturers pay for the cost of recycling based on a Market Share model. Market
Share is based on the amount of CEDs sold to households and schools in the state, in the
previous three years. The fee rate is: less than 25 CEDs sold = no fee; 25 to 249 CEDs sold =
$1,250 fee; and greater than 250 CEDs sold = $5,000 fee (WI-DNR, 2013).
Manufactures are also required to meet an annual recycling quota, and ensure 80 percent
of the CEDs sold (measured by volume, not unit) are recycled by processors registered in the E-
Cycle Wisconsin program. If a company fails to meet the 80 percent quota there is a “shortfall
fee” required. The fee is between $0.30 and $0.50 per pound, depending on the size of shortfall.
Companies can accrue up to 20 percent credits for future years if they exceed their quota.
Companies are allowed to use credits or sell credits to another company (WI-DNR, 2013). This
incentive is to encourage companies to continue the promotion of recycling, after meeting their
annual quota.
Recyclers, refurbishers and collectors are required to register with the DNR annually and
submit documentation to get reimbursed for processing CEDs. Retail stores are required to
register with the DNR, and only sell brands of CEDs of registered manufactures. Retailers are
Electronic Waste Policies
23
also required to educate consumers regarding the landfill and incineration bans, as well as where
and how to recycle CEDs at the products end-of-life.
Wisconsin is one of the 19 states with a ban against putting e-waste in landfills; therefore
it is illegal for consumers to throw old electronics in the trash. Consumers are often required to
pay collectors when CEDs are dropped off. The cost ranges from $5 to $40, depending on the
size of the device. Some collectors charge 15 to 25 cents per pound versus a flat fee (WI –DNR,
2013).
Rules Regulating Disposal and Processes
Wisconsin has a ban against putting hazardous e-waste in landfills, but there is not an
incineration ban.
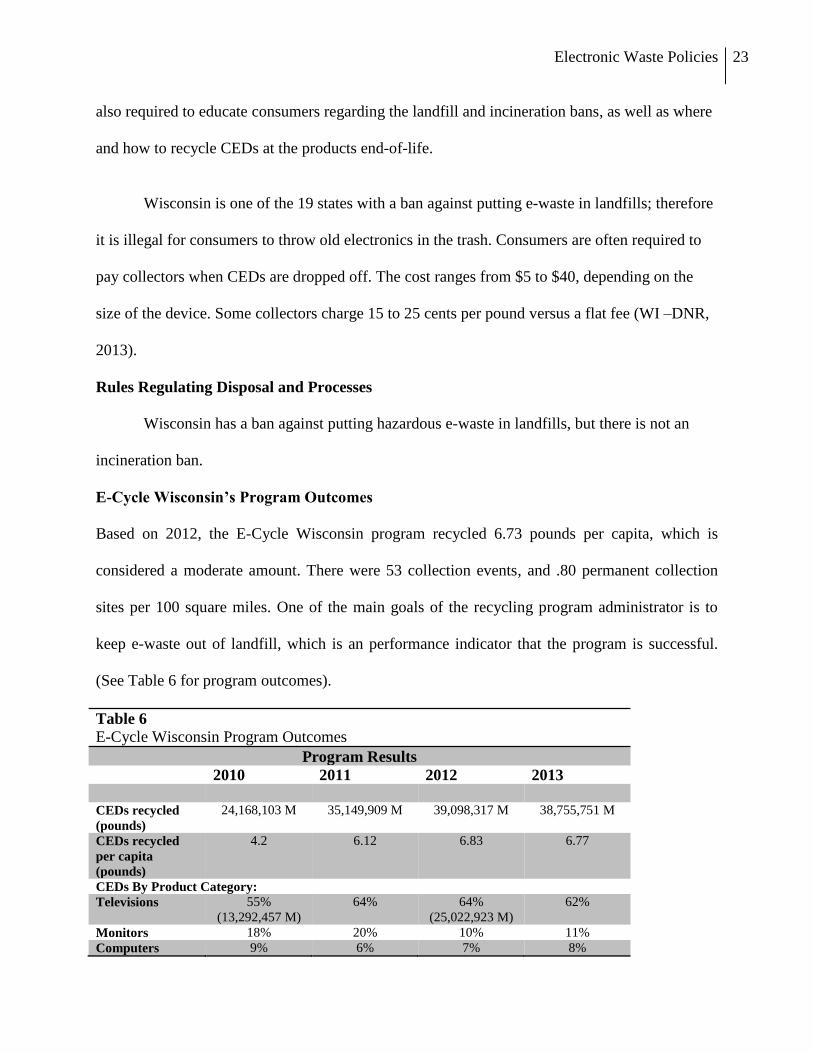
E-Cycle Wisconsin’s Program Outcomes
Based on 2012, the E-Cycle Wisconsin program recycled 6.73 pounds per capita, which is
considered a moderate amount. There were 53 collection events, and .80 permanent collection
sites per 100 square miles. One of the main goals of the recycling program administrator is to
keep e-waste out of landfill, which is an performance indicator that the program is successful.
(See Table 6 for program outcomes).
Table 6
E-Cycle Wisconsin Program Outcomes
Program Results
2010 2011 2012 2013
CEDs recycled
(pounds)
24,168,103 M 35,149,909 M 39,098,317 M 38,755,751 M
CEDs recycled
per capita
(pounds)
4.2 6.12 6.83 6.77
CEDs By Product Category:
Televisions 55%
(13,292,457 M)
64% 64%
(25,022,923 M)
62%
Monitors 18% 20% 10% 11%
Computers 9% 6% 7% 8%
Electronic Waste Policies
24
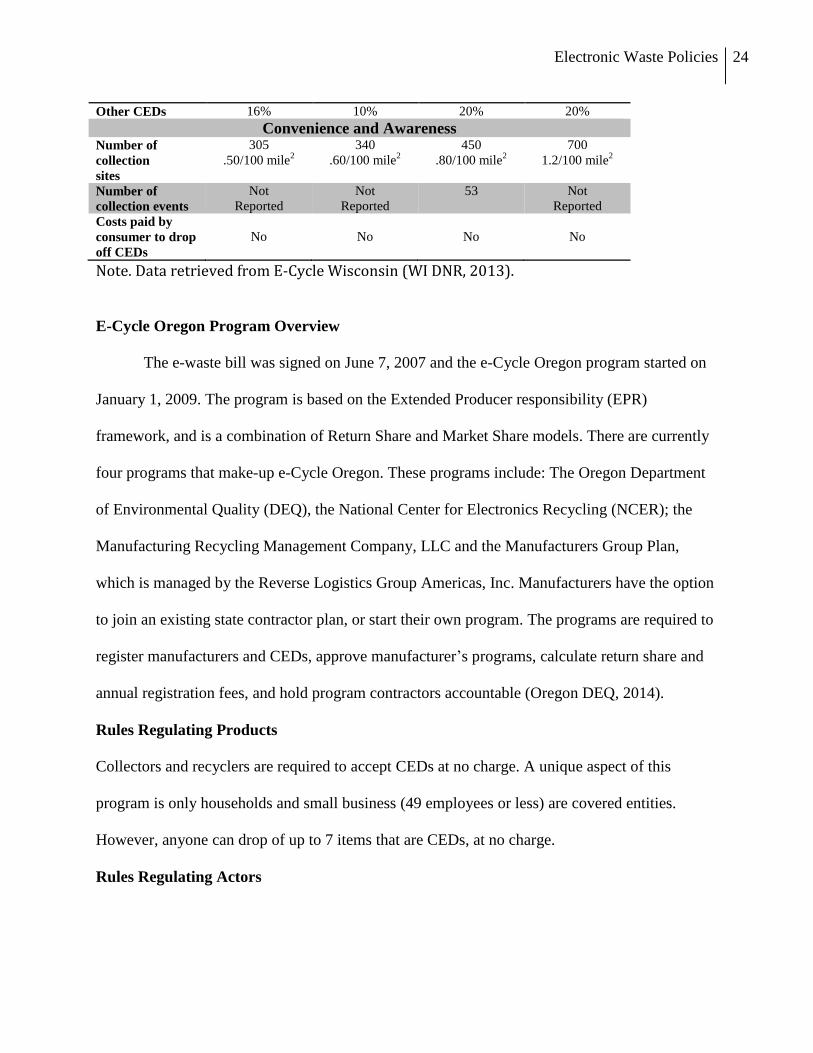
Other CEDs 16% 10% 20% 20%
Convenience and Awareness Number of
collection
sites
305
.50/100 mile2
340
.60/100 mile2
450
.80/100 mile2
700
1.2/100 mile2
Number of
collection events
Not
Reported
Not
Reported
53 Not
Reported
Costs paid by
consumer to drop
off CEDs
No
No
No
No
Note. Data retrieved from E-Cycle Wisconsin (WI DNR, 2013).
E-Cycle Oregon Program Overview
The e-waste bill was signed on June 7, 2007 and the e-Cycle Oregon program started on
January 1, 2009. The program is based on the Extended Producer responsibility (EPR)
framework, and is a combination of Return Share and Market Share models. There are currently
four programs that make-up e-Cycle Oregon. These programs include: The Oregon Department
of Environmental Quality (DEQ), the National Center for Electronics Recycling (NCER); the
Manufacturing Recycling Management Company, LLC and the Manufacturers Group Plan,
which is managed by the Reverse Logistics Group Americas, Inc. Manufacturers have the option
to join an existing state contractor plan, or start their own program. The programs are required to
register manufacturers and CEDs, approve manufacturer’s programs, calculate return share and
annual registration fees, and hold program contractors accountable (Oregon DEQ, 2014).
Rules Regulating Products
Collectors and recyclers are required to accept CEDs at no charge. A unique aspect of this
program is only households and small business (49 employees or less) are covered entities.
However, anyone can drop of up to 7 items that are CEDs, at no charge.
Rules Regulating Actors
Electronic Waste Policies
25
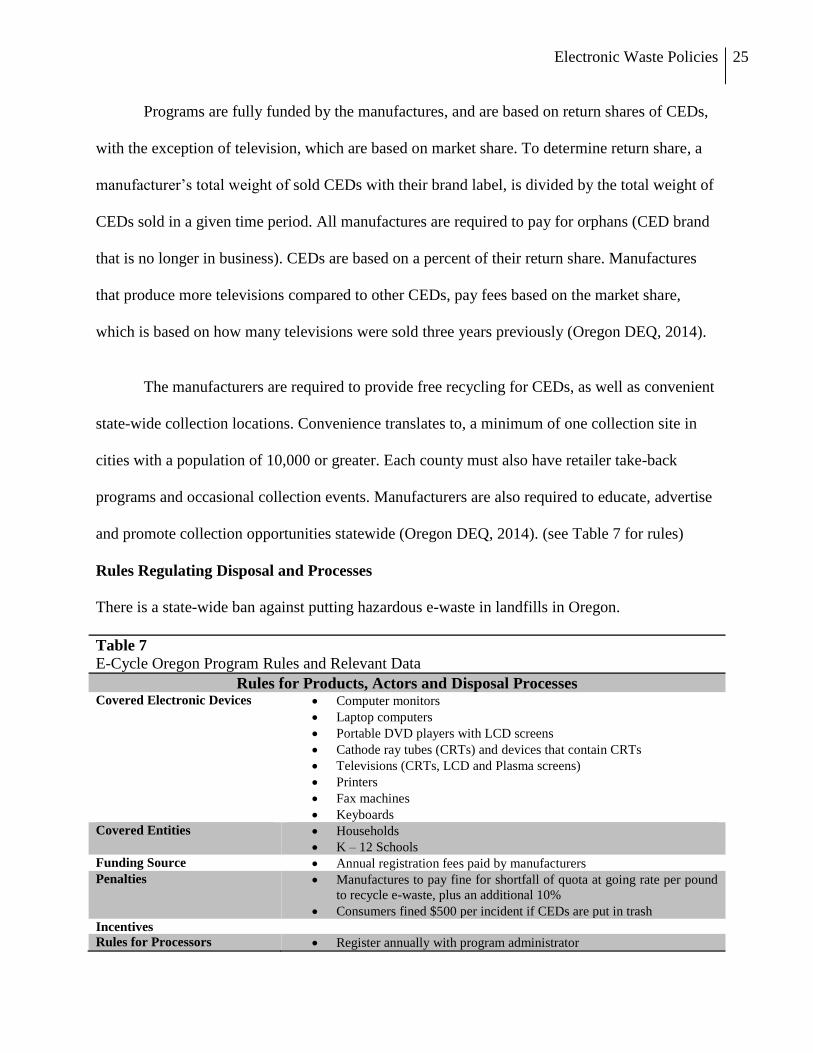
Programs are fully funded by the manufactures, and are based on return shares of CEDs,
with the exception of television, which are based on market share. To determine return share, a
manufacturer’s total weight of sold CEDs with their brand label, is divided by the total weight of
CEDs sold in a given time period. All manufactures are required to pay for orphans (CED brand
that is no longer in business). CEDs are based on a percent of their return share. Manufactures
that produce more televisions compared to other CEDs, pay fees based on the market share,
which is based on how many televisions were sold three years previously (Oregon DEQ, 2014).
The manufacturers are required to provide free recycling for CEDs, as well as convenient
state-wide collection locations. Convenience translates to, a minimum of one collection site in
cities with a population of 10,000 or greater. Each county must also have retailer take-back
programs and occasional collection events. Manufacturers are also required to educate, advertise
and promote collection opportunities statewide (Oregon DEQ, 2014). (see Table 7 for rules)
Rules Regulating Disposal and Processes
There is a state-wide ban against putting hazardous e-waste in landfills in Oregon.
Table 7
E-Cycle Oregon Program Rules and Relevant Data
Rules for Products, Actors and Disposal Processes Covered Electronic Devices Computer monitors
Laptop computers
Portable DVD players with LCD screens
Cathode ray tubes (CRTs) and devices that contain CRTs
Televisions (CRTs, LCD and Plasma screens)
Printers
Fax machines
Keyboards
Covered Entities Households
K – 12 Schools
Funding Source Annual registration fees paid by manufacturers
Penalties Manufactures to pay fine for shortfall of quota at going rate per pound
to recycle e-waste, plus an additional 10%
Consumers fined $500 per incident if CEDs are put in trash
Incentives
Rules for Processors Register annually with program administrator
Electronic Waste Policies
26
Maintain accurate documentation
Collect CEDs with no charge to covered entities
Rules for Manufacturers Register annually with program administrator
Maintain accurate documentation
Pay annual fees based on return and market share
Brand labels must be on all CEDs
Rules for Retailers Only sell CEDs of manufacturers registered in program
Ensure brand labels are on CEDs
Educate customers about recycling CEDs through program
Rules for Consumers Recycle all CEDs with processors in processors in program
Do not throw CEDs in trash
Rules for Waste Management Do not put CEDs in landfill
Landfill Ban Yes
Incinerator Ban No
Prison Labor Ban No (Allowed)
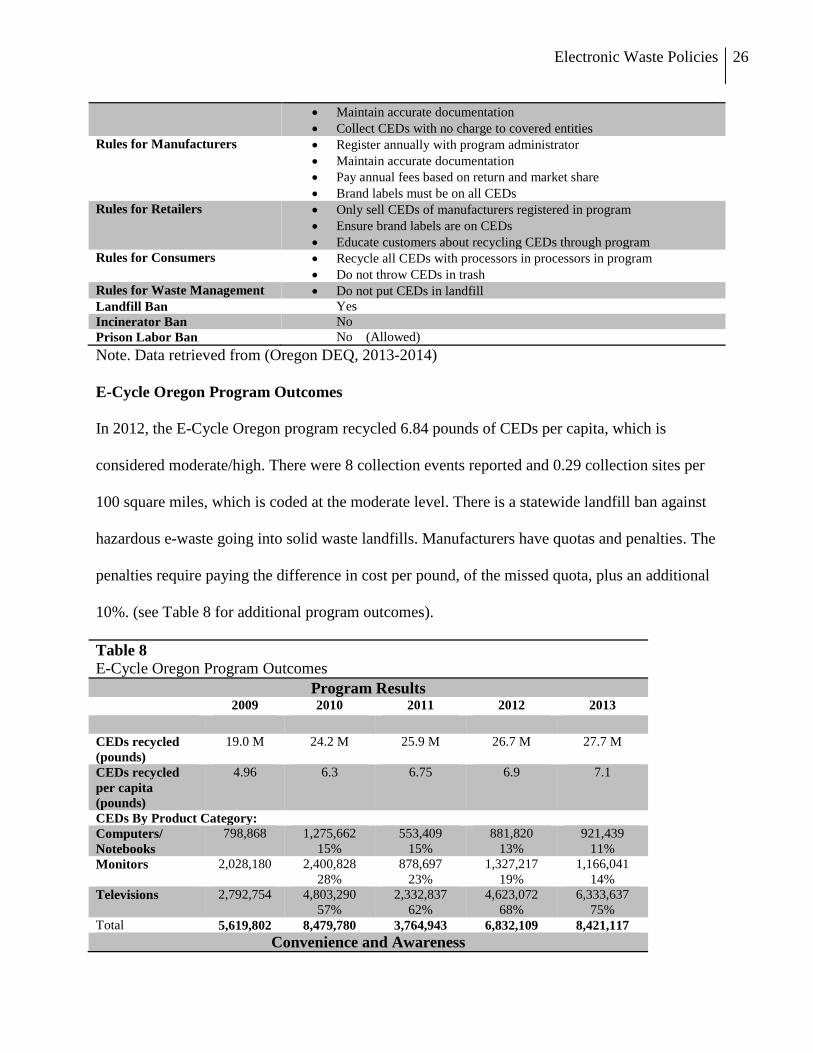
Note. Data retrieved from (Oregon DEQ, 2013-2014)
E-Cycle Oregon Program Outcomes
In 2012, the E-Cycle Oregon program recycled 6.84 pounds of CEDs per capita, which is
considered moderate/high. There were 8 collection events reported and 0.29 collection sites per
100 square miles, which is coded at the moderate level. There is a statewide landfill ban against
hazardous e-waste going into solid waste landfills. Manufacturers have quotas and penalties. The
penalties require paying the difference in cost per pound, of the missed quota, plus an additional
10%. (see Table 8 for additional program outcomes).
Table 8
E-Cycle Oregon Program Outcomes
Program Results
2009 2010 2011 2012 2013
CEDs recycled
(pounds)
19.0 M 24.2 M 25.9 M 26.7 M 27.7 M
CEDs recycled
per capita
(pounds)
4.96
6.3 6.75 6.9 7.1
CEDs By Product Category:
Computers/
Notebooks
798,868 1,275,662
15%
553,409
15%
881,820
13%
921,439
11%
Monitors 2,028,180 2,400,828
28%
878,697
23%
1,327,217
19%
1,166,041
14%
Televisions 2,792,754 4,803,290
57%
2,332,837
62%
4,623,072
68%
6,333,637
75%
Total 5,619,802 8,479,780 3,764,943 6,832,109 8,421,117
Convenience and Awareness
Electronic Waste Policies
27
Number of
collection sites
220 240 230 282 301
Number of
collection events
22 17 13 8 18
Costs paid by
consumer to drop
off CEDs
Not for
CEDs
Not for
CEDs
Not for
CEDs
Not for
CEDs
Not for
CEDs
Note. Net pounds collected by Oregon SCP 2009-2013. The data is from Oregon
E-Cycles Biennial Report (Oregon E-Cycle, 2013).
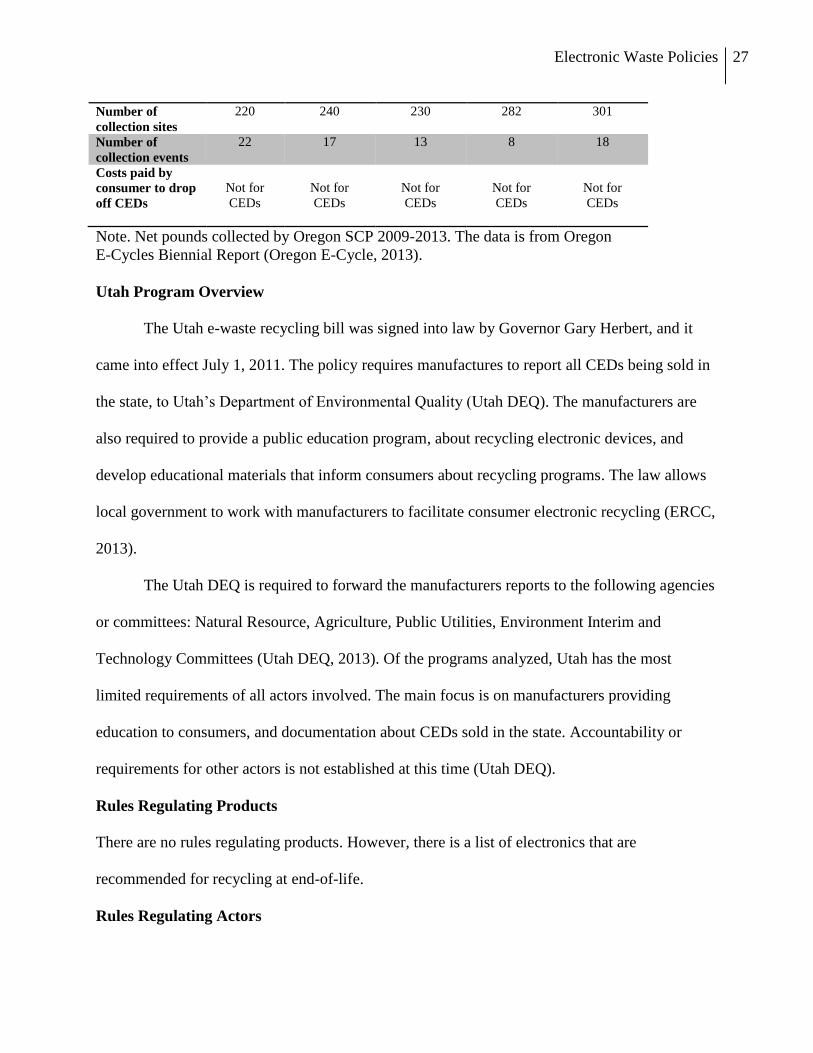
Utah Program Overview
The Utah e-waste recycling bill was signed into law by Governor Gary Herbert, and it
came into effect July 1, 2011. The policy requires manufactures to report all CEDs being sold in
the state, to Utah’s Department of Environmental Quality (Utah DEQ). The manufacturers are
also required to provide a public education program, about recycling electronic devices, and
develop educational materials that inform consumers about recycling programs. The law allows
local government to work with manufacturers to facilitate consumer electronic recycling (ERCC,
2013).
The Utah DEQ is required to forward the manufacturers reports to the following agencies
or committees: Natural Resource, Agriculture, Public Utilities, Environment Interim and
Technology Committees (Utah DEQ, 2013). Of the programs analyzed, Utah has the most
limited requirements of all actors involved. The main focus is on manufacturers providing
education to consumers, and documentation about CEDs sold in the state. Accountability or
requirements for other actors is not established at this time (Utah DEQ).
Rules Regulating Products
There are no rules regulating products. However, there is a list of electronics that are
recommended for recycling at end-of-life.
Rules Regulating Actors
Electronic Waste Policies
28
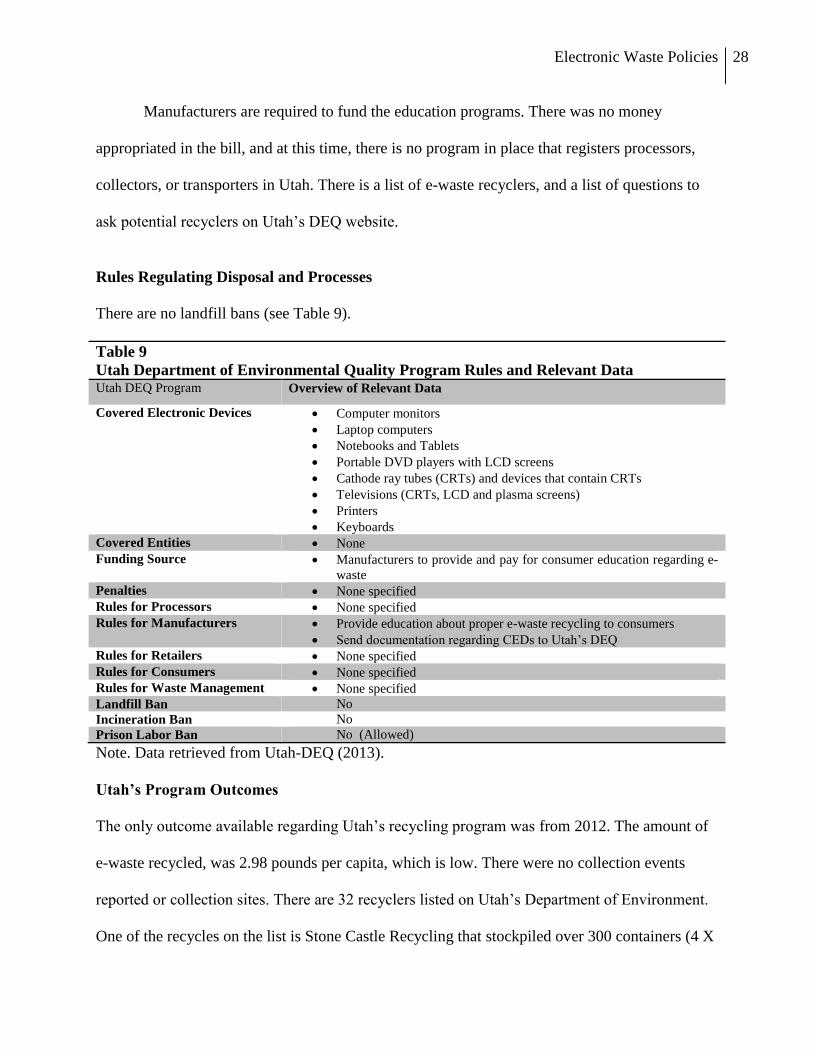
Manufacturers are required to fund the education programs. There was no money
appropriated in the bill, and at this time, there is no program in place that registers processors,
collectors, or transporters in Utah. There is a list of e-waste recyclers, and a list of questions to
ask potential recyclers on Utah’s DEQ website.
Rules Regulating Disposal and Processes
There are no landfill bans (see Table 9).
Table 9
Utah Department of Environmental Quality Program Rules and Relevant Data Utah DEQ Program Overview of Relevant Data
Covered Electronic Devices Computer monitors
Laptop computers
Notebooks and Tablets
Portable DVD players with LCD screens
Cathode ray tubes (CRTs) and devices that contain CRTs
Televisions (CRTs, LCD and plasma screens)
Printers
Keyboards
Covered Entities None
Funding Source Manufacturers to provide and pay for consumer education regarding e-
waste
Penalties None specified
Rules for Processors None specified
Rules for Manufacturers Provide education about proper e-waste recycling to consumers
Send documentation regarding CEDs to Utah’s DEQ
Rules for Retailers None specified
Rules for Consumers None specified
Rules for Waste Management None specified
Landfill Ban No
Incineration Ban No
Prison Labor Ban No (Allowed)
Note. Data retrieved from Utah-DEQ (2013).
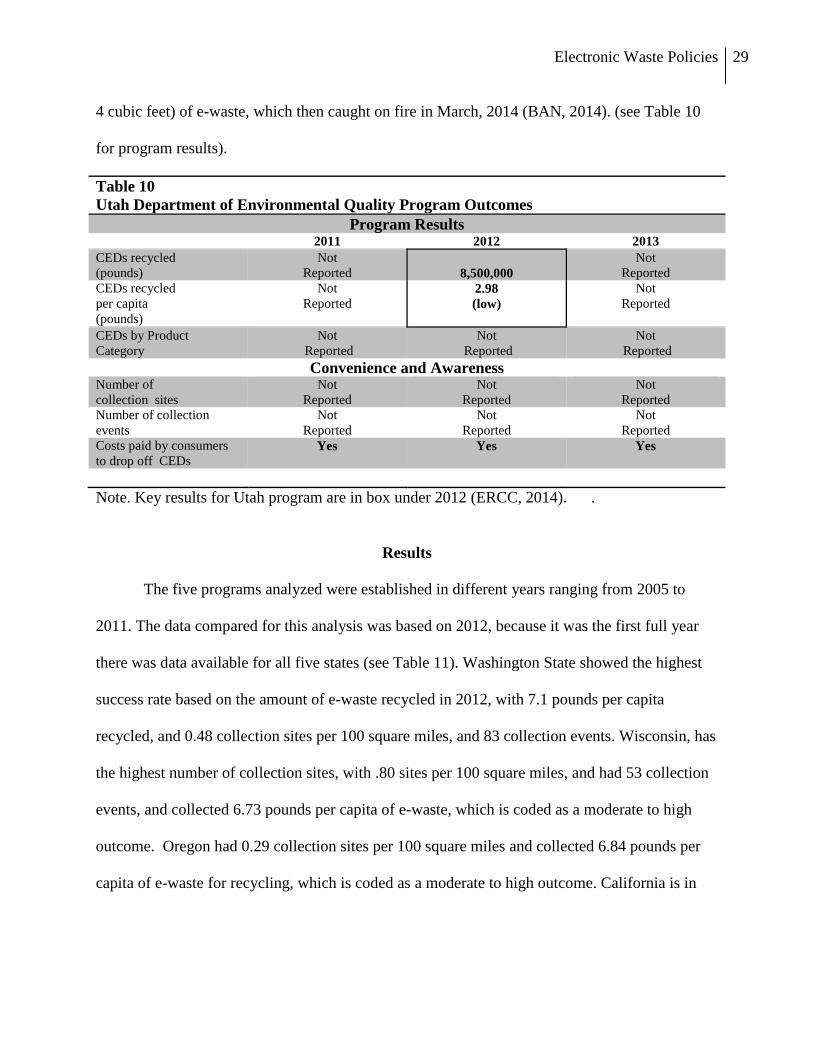
Utah’s Program Outcomes
The only outcome available regarding Utah’s recycling program was from 2012. The amount of
e-waste recycled, was 2.98 pounds per capita, which is low. There were no collection events
reported or collection sites. There are 32 recyclers listed on Utah’s Department of Environment.
One of the recycles on the list is Stone Castle Recycling that stockpiled over 300 containers (4 X
Electronic Waste Policies
29
4 cubic feet) of e-waste, which then caught on fire in March, 2014 (BAN, 2014). (see Table 10
for program results).
Table 10
Utah Department of Environmental Quality Program Outcomes
Program Results 2011 2012 2013
CEDs recycled
(pounds)
Not
Reported
8,500,000
Not
Reported
CEDs recycled
per capita
(pounds)
Not
Reported
2.98
(low)
Not
Reported
CEDs by Product
Category
Not
Reported
Not
Reported
Not
Reported
Convenience and Awareness Number of
collection sites
Not
Reported
Not
Reported
Not
Reported
Number of collection
events
Not
Reported
Not
Reported
Not
Reported
Costs paid by consumers
to drop off CEDs Yes Yes Yes
Note. Key results for Utah program are in box under 2012 (ERCC, 2014). .
Results
The five programs analyzed were established in different years ranging from 2005 to
2011. The data compared for this analysis was based on 2012, because it was the first full year
there was data available for all five states (see Table 11). Washington State showed the highest
success rate based on the amount of e-waste recycled in 2012, with 7.1 pounds per capita
recycled, and 0.48 collection sites per 100 square miles, and 83 collection events. Wisconsin, has
the highest number of collection sites, with .80 sites per 100 square miles, and had 53 collection
events, and collected 6.73 pounds per capita of e-waste, which is coded as a moderate to high
outcome. Oregon had 0.29 collection sites per 100 square miles and collected 6.84 pounds per
capita of e-waste for recycling, which is coded as a moderate to high outcome. California is in
Electronic Waste Policies
30
the moderate range for all outcomes, and Utah was the least successful with only 2.98 pounds per
capita of e-waste recycled.
Table 11
Outcomes and findings of comparison analysis of e-waste programs.
Washington also had the most permanent collection locations per square mile, which
suggests convenience may be a motivating factor for consumers to recycle their e-waste. All
state programs analyzed, except for Utah, included “households” as covered entities who are
allowed to participate in programs, and drop off CEDs for free. Only California and Utah have
no quotas for manufacturers to meet, regarding the amount of CEDs that are recycled. This
suggests quotas and penalties may be a contributing factor to why Washington had the highest
Electronic Waste Policies
31
amount of CEDs recycled, and Oregon (6.84 pounds per capita) and Wisconsin (6.73 pounds per
capita) were in second and third place for amount of CEDs recycled.
Conclusions
The outcomes of this analysis suggest that a higher number of collection sites per 100 square
miles, correlates with a higher amount of e-waste recycled per capita, which suggests
convenience is a contributing factor for consumers to recycle their e-waste. The outcomes also
suggest, programs with a higher number of CEDs collected for free, also had a higher amount of
e-waste recycled, which suggest that cost is a factor for consumers.
In states, where there are monetary penalties for manufacturers, when they don’t meet
quotas, there was a higher amount of e-waste recycled per capita. Positive incentives didn’t
appear to influence program success. For example, Wisconsin has an incentive if the quota is
met, they get up to 20% surplus recycling volume, which can rollover to the next year, or can be
sold to another manufacturer (ETBC, 2013). Washington and Oregon don’t have that incentive,
and they both had higher volumes of e-waste recycled per capita. However, Washington and
Oregon do have penalties if they don’t reach their quotas. A contributing factor to this difference
may be the “free rider” issues suggested by Hickle (2013), and Atasu and Subramanian (2011).
Since the sample size is small, additional analysis of other programs will be needed.
Furthermore, based on this analysis, it was not conclusive if landfill bans impact the
amount of e-waste recycled. Washington had the highest amount of e-waste recycled per capita,
and there is no landfill ban. California, Oregon and Wisconsin have bans against putting e-waste
in landfills, but they all scored moderate.
Electronic Waste Policies
32
Future Study
Plans for future study include, applying this analytical structure, performance measures
and outcomes to more states with policies and programs. This will allow a larger sample and
increase confidence in the results. It would be beneficial in future work to conduct surveys with
recycling program administrators to gather more in depth details and program data, which is not
posted on websites. It would also be beneficial to conduct consumer surveys to identify the level
of program awareness. Another valuable category would be to compare the number of jobs, in
relation to the amount of e-waste recycled. It is obvious that there are multiple contributing
factors to the performance of e-cycle programs. Further investigation and evaluations will be
beneficial for current and potentially new state recycling programs.
Electronic Waste Policies
33
About the Author
Mandy Knudtson is a graduate student at the University of Washington, Bothell, and is a
candidate for a Master of Arts and Policy Studies (MAPS). Mandy’s focus is environmental
policy, specifically state, federal and international policies regarding electronic waste. Mandy
works in Seattle, WA at the Basel Action Network (BAN), an international, non-profit
organization, focused on the prevention of hazardous e-waste from being exported to developing
countries. Mandy is the e-Stewards Business Director of the international e-waste certification
program known as the e-Stewards Standard.
Electronic Waste Policies
34
References
Adrian, S. (2013, May 13). Cleaning up electronic waste (e-waste). U.S. Environmental
Protection Agency (EPA). Retrieved on September 13, 2013, from
http://www.epa.gov/international/toxics/ewaste/
Atasu, A. and Subramanian, R. (2012, November/December). Extended producer responsibility
For e-waste: individual or collective producer responsibility? Production and Operations
Management. 21 (6) 1042-1059. Retrieved from
http://web.b.ebscohost.com.offcampus.lib.washington.edu/ehost/pdfviewer/pdfviewer?vi
d=3&sid=84c613e0-36d7-4475-aa8f-e7f9896d7a90%40sessionmgr111&hid=114
BAN. (2014, March 19). Electronic waste nightmare in Utah revealed. Retrieved April 30, 2014,
from http://www.ban.org/files/reports/Stone_Castle_Recycling_LLC_Comp.pdf
Basel Convention. (2013). www.basel.int. Retrieved December 30, 2013, from
http://www.basel.int/TheConvention/Overview/TextoftheConvention/tabid/1275/Default.
aspx
Bhutta, M.K.S., Omar, A., and Yang, X. (2011, April5). Electronic waste: A growing concern in
today’s environment.Economic Research International. Hindawi Publishing Corporation.
2011 (474230) 1-8. Retrieved from http://www.hindawi.com/journals/ecri/2011/474230/
Calrecycle (2012, June). Update on California’s covered electronic waste recycling program.
Retrieved on October 30, 2013 from
http://www.calrecycle.ca.gov/electronics/CEW/ProgramStats.pdf
Calrecycle. (2013). Electronic Waste Recycling Act of 2003: Covered Electronic Waste Payment
System (SB 20/SB 50) Electronic Product Management. www.calrecycler.ca.gov.
Retrieved on January 27, 2014, from http://www.calrecycle.ca.gov/Electronics/Act2003/
Calrecycle. (2014a). Ca.gov. http://www.calrecycle.ca.gov/default.asp
Calrecycle. (2014b, January 10). Calrecycle 2012 Enforcement Report. (p. 34-36). Retrieved on
January 13, 2014, from
http://www.calrecycle.ca.gov/Publications/Documents/1485/20141485.pdf
CDC. (2013). Center for Disease Control. www.cdc.gov.
Dolšak, N. (2007). An assessment of tradable permits for common-pool resources. Review of
Policy Research, 24 (6): 541-565.
DTSC. (2014). Department of Toxic Substance Control, California. http://www.dtsc.ca.gov/
Ecy. (2014). Department of Ecology State of Washington. http://www.ecy.wa.gov/
Electronic Waste Policies
35
E-Cycle Washington. (2007, November). Environmentally sound management and performance
standards for direct processors: Washington State electronic product recycling program.
Department of Ecology State of Washington. Retrieved from
http://www.ecy.wa.gov/programs/swfa/eproductrecycle/docs/PreferredPerformanceStdsF
inal2007.pdf
E-Cycle Wisconsin (2011, April). E-Cycle Wisconsin 2010 report. Retrieved on January 3, 2014
from http://dnr.wi.gov/files/PDF/pubs/wa/WA1529.pdf
E-Cycle Wisconsin (2011, December) E-Cycle Wisconsin program year 2 results. Retrieved on
January 3, 2014 from http://dnr.wi.gov/files/PDF/pubs/wa/WA1559.pdf
E-Cycle Washington (2013). E-Cycle Washington Standard Plan 2009-2013 Annual Reports –
workbook format. Retrieved on January 3, 2014, from
http://www.ecy.wa.gov/programs/swfa/eproductrecycle/
ERCC. Electronic Recycling Coordination Clearinghouse. (2010, September) ERCC Best
practices for measuring the performance of state electronics recycling programs.
Retrieved on November 11, 2013 from
http://www.ecycleclearinghouse.org/documents/ERCC%20Best%20Practices%20for%20
Performance%20Measures%20FINAL.pdf
ERCC. Electronics Recycling Coordination Clearinghouse. (2013). States with landfill bans.
Retrieved on January 13, 2014 from
http://www.ecycleclearinghouse.org/Content.aspx?pageid=58
ERCC. (2014). Latest per capita data on electronic recycling programs. Retrieved on January 27,
2014, from http://www.ecycleclearinghouse.org/Content.aspx?pageid=59
ETBC. (2009, November 13). Comparison of state e-waste laws. Electronics Take Back
Coalition Retrieved on December 3, 2013, from http://www.electronicstakeback.com/wp-
content/uploads/Detailed%20State%20Law%20Comparison%20ALL
ETBC. (2011, September 27). States where you can’t throw away e-waste into the trash.
Electronic TakeBack Coalition Retrieved on November 17, 2013 from
http://www.electronicstakeback.com/wp-content/uploads/Disposal_Ban_Bills.pdf
ETBC. (2013a, August 19) How much e-waste is collected in states with electronics recycling
laws? Electronics Take Back Coalition. Retrieved on September 27, 2013 from
http://www.electronicstakeback.com/wp-
content/uploads/Collection_Volumes_by_State.pdf
ETBC.(2013b, September 25). Facts and figures on e-waste and recycling. Electronics Take
Electronic Waste Policies
36
Back Collision Retrieved on December 22, 2013from
http://www.electronicstakeback.com/wp-
content/uploads/Facts_and_Figures_on_EWaste_and_Recycling.pdf
Gallo, D.T. (2013, July 15). Broad view of e-waste management policies in the U.S. Global E-
Waste Management (GEM) Network Workshop. U.S. Environmental Protection Agency.
(EPA) Retrieved on September 17, 2013 from
http://www.epa.gov/international/regions/Asia/taiwan/iemn-pdfs/overview.pdf
Greenemeir, L. (2009, October 29). U.S. lags behind world with its patchwork approach to
curbing e-waste. Scientific American. Retrieved on January 27, 2014, from
http://www.scientificamerican.com/article/electronic-waste-control/
Hickle, G.T. (2013, March 19). Comparative analysis of extended producer responsibility policy
in the United States and Canada. Journal of Industrial Ecology. 17 (2) 249-261.
Retrieved on September 27, 2013 from
http://onlinelibrary.wiley.com.offcampus.lib.washington.edu/doi/10.1111/jiec.12020/full
Kiddee, P., Naidu, R., Wong, M.H. (2013, May). Electronic waste management approaches: An
overview. Waste Management. 33 (5) 1237-1250. Retrieved on September 27, 2013 from
http://www.sciencedirect.com.offcampus.lib.washington.edu/science/article/pii/S0956053
X13000147
Mayers, K. and Butler, S. (2013, March) Producer responsibility organizations development and
opperations. Journal of Industrial Ecology. 17 (2) 277-289. Retrieved on September 17,
2013 from
http://onlinelibrary.wiley.com.offcampus.lib.washington.edu/doi/10.1111/jiec.12021/pdf
Meigs, D. (2012, October, 5). Smartphones, foolish waste. China Daily. Retrieved on January 27,
2014, from http://www.chinadaily.com.cn/hkedition/2012-10/05/content_15797059.htm.
Milovantseva, N., Saphones, J.D. (2013, July 30). E-waste bans and U.S. households’
preferences for disposing of their e-waste. Journal of Environmental Management. 124 8-
16. Retrieved on September 17, 2013 from
http://www.sciencedirect.com.offcampus.lib.washington.edu/science/article/pii/S0301479
713001722
Milovantseva, N., Saphones, J.D. (2013, March). Time bomb or hidden treasure? Characteristics
of junk TVs and of the US households who store them. Waste Management. 33 (3) 519-
529. Retrieved on September 17, 2013 from
http://www.sciencedirect.com.offcampus.lib.washington.edu/science/article/pii/S0956053
X12003200
Nash, J. and Bosso, C. (2013, April) Extended producer responsibility in the United States: Full
speed ahead? Journal of Industrial Ecology. 17 (2) 175-185. Retrieved on September 27,
2013 from
Electronic Waste Policies
37
http://onlinelibrary.wiley.com.offcampus.lib.washington.edu/doi/10.1111/j.1530-
9290.2012.00572.x/abstract
NCER. National Center for Electronics Recycling. (2010).
http://www.electronicsrecycling.org/public/
NCMS. (2013). Electronic waste state resource locator. National Center for Manufacturing
Sciences. www.ncms.org. Retrieved from http://www.envcap.org/statetools/ewaste/
Oregon E-Cycles (2009-2013). Net pounds collected by Oregon SCP. (5 Reports)
www.ElectronicRecyclking.org Retrieved on February 1, 2014, from
http://www.electronicsrecycling.org/oregon/public/contentpage.aspx?pageid=4
Oregon DEQ. (2012, January, 28). Recap to Support Additional Comment on Fee Rule Concepts
Retrieved on January 4, 2014 from
http://www.deq.state.or.us/lq/ecycle/pubs/ECyclesRMAdvCommRecap120128.pdf
Oregon DEQ. (2014, January). Oregon e-cycles biennial report. State of Oregon Department of
Environmental Quality. Retrieved from
http://www.deq.state.or.us/lq/pubs/docs/ORECyclesBiennialReportLeg2014.pdf
Puckett, J. (2013, June 17). The five fatal flaws: A concise critique of the R2:2013 Standard.
Basel Action Network. Retrieved on March 15, 2014 from
http://ban.org/Library/FiveFundamentalFlawFinal.pdf
Rainforest Relief. (2014). Retrieved on February 28, 2014from
http://www.rainforestrelief.org/What_to_Avoid_and_Alternatives/Aluminum.html
Seltenrich, N. (2013, August, 28). Incineration versus recycling: in Europe, a debate over trash.
E360 Environment. Retrieved on February 17, 2014 from
http://e360.yale.edu/feature/incineration_versus_recycling__in_europe_a_debateoover_tr
ash/2686/
The Wasteland. (2008, November). “ CBS, 60 Minutes. Prod. Solly Granatstein. Host Scott
Pelley. CBS Television. 9 Nov. 2008. Web. 28 Feb. 2012.
Till, D. (2007, November 7). Washington State electronics waste recycling rules go into effect.
Retrieved on February 2, 2014, from http://www.martenlaw.com/newsletter/20071107-
wash-e-waste-rules.
U.S. EPA. (2011, July 20). National strategy for electronics stewardship. Retrieved on
September 2, 2013 from
http://www.epa.gov/wastes/conserve/materials/ecycling/taskforce/docs/strategy.pdf
U.S.EPA.(2013, September 9). Environmental Protection Agency. FAQ: Regulations for used
Electronic Waste Policies
38
Cathode Ray Tubes CRTs and CRT glass. Retrieved on January 13, 2014 from
http://www.epa.gov/epawaste/hazard/recycling/electron/crt-faq.htm
U.S. EPA (2014a). http://www.epa.gov/
U.S.EPA. Environmental Protection Agency (2014b). Managing electronic wastes and e-cycling.
Retrieved on January 13, 2014 from http://www.epa.gov/region4/rcra/ecycling.htm
U.S.EPA. Environmental Protection Agency. (2014c, February). Municipal solid waste
generation, recycling, and disposal in the United States. Retrieved on January 15, 2014
from http://www.epa.gov/wastes/nonhaz/municipal/pubs/2012_msw_dat_tbls.pdf
Utah DEQ. (2013). Department of Environmental Quality. Utah electronic e-waste education
program. Retrieved on November 1, 2013, from
http://www.deq.utah.gov/Pollution_Prevention/electronics.htm
Utah DEQ. (2014) Utah Department of Environmental Quality. http://www.deq.utah.gov/
WI-DNR. (2013, December). E-Cycle Wisconsin 2013 Report. Wisconsin Department of Natural
Resources (DNR). Retrieved on Febraury 21, 2014, from
http://dnr.wi.gov/files/pdf/pubs/wa/wa1672.pdf
Yin R.K. (2014). Case study research: Design and methods (5th ed.). Thousand Oaks, CA. Sage
Publications.
Electronic Waste Policies
39
Footnotes
1. Rules applied to CRTs include: 1) Intact CRTs require notification sent to EPA 60 days
prior to export; 2) Broken CRTs require consent from importing country and notification
sent to EPA 60 days prior to shipment; 3) Processed CRT glass documentation must how
glass is being sent to lead smelter or CRT glass maker: and 4) No stockpiling of CRT
glass for longer than one year (U.S., EPA, 2013).
2. Note: Population density compared to collection locations was not considered.
.
Electronic Waste Policies
40
Appendix A
Table 12
Health Impacts From Exposure to Heavy Metals *HEWs Types of Exposure Acute Symptoms Chronic Symptoms Toxic
Concentration
Beryllium Inhalation
Skin contact
Cough
Shortness of
breath
Fatigue
Weight loss
Fever
Rash
Lung cancer
Skin bumps
Poor wound healing
>2 mg/m3
Cadmium Inhalation Pneumonitis Lung cancer
Kidney damage
15μg/d
L
(blood)
Lead Inhalation
Ingestion
Skin contact
Nausea
Vomiting
Headache
Seizures
Encephalopathy
Anemia
Abdominal pain
Nephropathy
foot-drop/wrist-
drop
5 μg/dL
(Blood)
Mercury Inhalation
Skin contact
Nausea
Vomiting
Fever
diarrhea
Nausea
Metallic taste
Gingivo-stomatitis
Tremor
Neurasthenia
Nephrotic syndrome
Hypersensitivity
(Pink disease)
10 ug/L (whole
blood); 20 μg/dL
(24-h urine)
Note. Toxic materials found in some electronic devices, and the health issues caused by
prolonged exposure when handled unsafely. * Hazardous Electronic Waste (HEWs) Information
from the Center of Disease Control (CDC, 2014).
Electronic Waste Policies
41
Appendix B
Table 13
U.S States with Landfill Bans
State Tracked Electronics Banned
From Landfill
Additional Items Effective
Date
Arkansas Computer and Electronic Equipment 1-1-2010
California Desktop, Laptops, CRT TV, CRT
Monitor, Flat Panel TVs, Flat Panel
Monitors, Printers
Cash Registers,
Peripherals, Telephones,
Answering Machines,
Radios, Stereos
Equipment, Tape
Players/Recorders,
Phonographs, Video
Cassette Players, CD
Players, Calculators and
some appliances
2/1/2006
Colorado Computers, peripherals, Printers, Fax
Machines, DVD/VCR, Any >
4”screens Video Display Device
including:
Computer Monitors, Laptop
Computers (incl. Netbooks,
Ultrabooks, etc), Tablets, E-Readers,
TVs
7-1-2013
Connecticut Desktops, Laptops, CRT TV, CRT
Monitors, Flat Panel TVs, Flat Panel
Monitors
1-1-2011
Illinois Desktops, Laptops, CRT TV, CRT
Monitors, Flat Panel TVs, Flat Panel
Monitors, Printers
1-1-2012
Indiana Desktops, Laptops, CRT TV, CRT
Monitors, Flat Panel TVs, Flat Panel
Monitors
Fax, DVD, VCR,
Computer Peripherals
1-1-2011
Maine CRT TVs, CRT Monitors Mercury added products
including mercury-added
lamps
7-20-2006
Massachusetts CRT TVs, CRT Monitors 4-1-2000
Minnesota CRT TVs, CRT Monitors 7-1-2006
New Hampshire Laptops, CRT TVs, CRT Monitors,
Flat Panel TVs, Flat Panel Monitors
7-1-2007
New Jersey Desktops, Laptops, CRT TV, CRT
Monitors, Flat Panel TVs, Flat Panel
Monitors
1-1-2001
New York Desktops, Laptops, CRT TV, CRT
Monitors, Flat Panel TVs, Flat Panel
Monitors
Keyboard, Mice 1-1-2012
North Carolina Desktops, Laptops, CRT TV, CRT
Monitors, Flat Panel TVs, Flat Panel
Monitors
Keyboard, Mice 1-1-2012
Oregon Desktops, Laptops, CRT TV, CRT
Monitors, Flat Panel TVs, Flat Panel
Monitors
1-1-2010
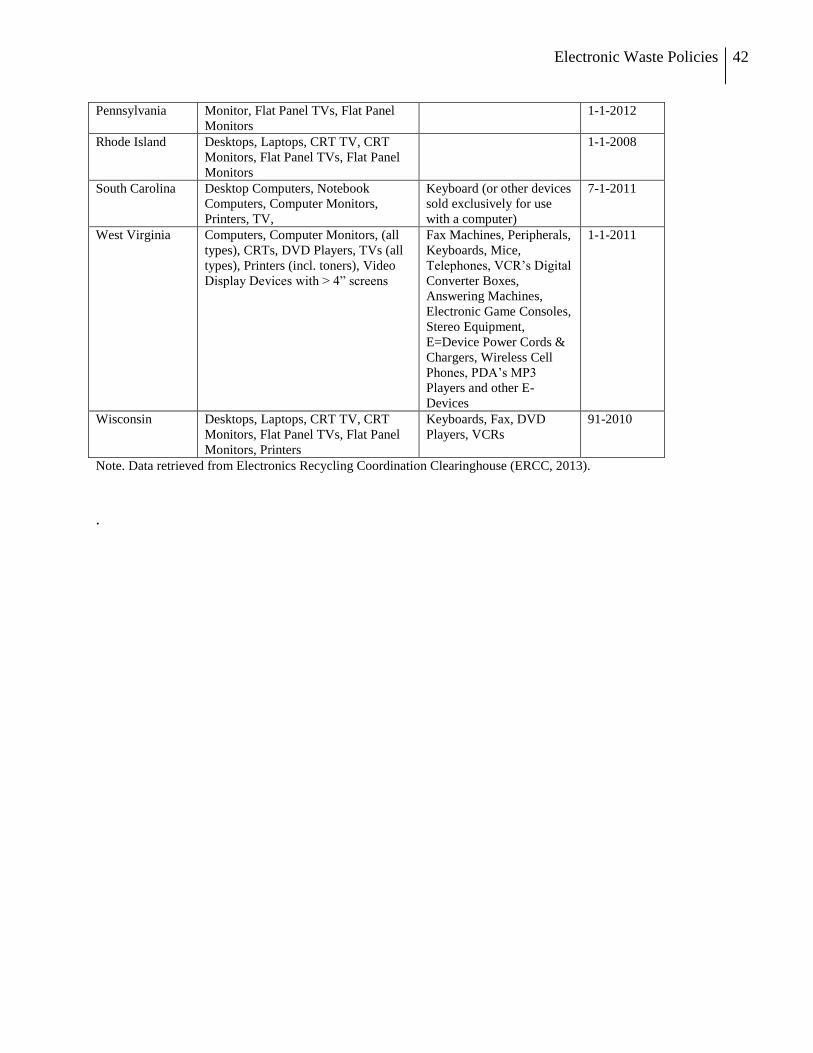
Electronic Waste Policies
42
Pennsylvania Monitor, Flat Panel TVs, Flat Panel
Monitors
1-1-2012
Rhode Island Desktops, Laptops, CRT TV, CRT
Monitors, Flat Panel TVs, Flat Panel
Monitors
1-1-2008
South Carolina Desktop Computers, Notebook
Computers, Computer Monitors,
Printers, TV,
Keyboard (or other devices
sold exclusively for use
with a computer)
7-1-2011
West Virginia Computers, Computer Monitors, (all
types), CRTs, DVD Players, TVs (all
types), Printers (incl. toners), Video
Display Devices with > 4” screens
Fax Machines, Peripherals,
Keyboards, Mice,
Telephones, VCR’s Digital
Converter Boxes,
Answering Machines,
Electronic Game Consoles,
Stereo Equipment,
E=Device Power Cords &
Chargers, Wireless Cell
Phones, PDA’s MP3
Players and other E-
Devices
1-1-2011
Wisconsin Desktops, Laptops, CRT TV, CRT
Monitors, Flat Panel TVs, Flat Panel
Monitors, Printers
Keyboards, Fax, DVD
Players, VCRs
91-2010
Note. Data retrieved from Electronics Recycling Coordination Clearinghouse (ERCC, 2013).
.
Related Documents