Electronic Survey Methodology: A Case Study in Reaching Hard-to-Involve Internet Users Dorine Andrews Communication, Culture and Technology Program Georgetown University Blair Nonnecke Computing & Information Science University of Guelph Jennifer Preece Information Systems Management Department University of Maryland, Baltimore County Using the Internet to conduct quantitative research presents challenges not found in conventional research. Paper-based survey quality criteria cannot be completely adapted to electronic formats. Electronic surveys have distinctive technological, de- mographic, and response characteristics that affect their design, use, and implemen- tation. Survey design, participant privacy and confidentiality, sampling and subject solicitation, distribution methods and response rates, and survey piloting are critical methodological components that must be addressed. In this article, quality criteria for electronic survey design and use based on an in- vestigation of recent electronic survey literature are presented. The application of these criteria to reach a hard-to-involve online population—nonpublic participants of online communities (also known as “lurkers”)—and survey them on their community participation, a topic not salient to the purpose of their online communities is demon- strated in a case study. The results show that a hard-to-reach audience can be reached using the quality criteria that are most important for reaching these types of audi- ences. The results suggest how the use of some criteria may conflict and what re- searchers may experience when conducting electronic surveys in an online culture in which people are not tolerant of intrusions into online lives. INTERNATIONAL JOURNAL OF HUMAN–COMPUTER INTERACTION, 16(2), 185–210 Copyright © 2003, Lawrence Erlbaum Associates, Inc. Dorine Andrews is currently at the School of Information Arts and Technologies, University of Balti- more. Requests for reprints should be sent to Dorine Andrews, 2640 North Calvert Street, Baltimore, MD 21218. E-mail: [email protected]

Welcome message from author
This document is posted to help you gain knowledge. Please leave a comment to let me know what you think about it! Share it to your friends and learn new things together.
Transcript

Electronic Survey Methodology: A Case Study inReaching Hard-to-Involve Internet Users
Dorine AndrewsCommunication, Culture and Technology Program
Georgetown University
Blair NonneckeComputing & Information Science
University of Guelph
Jennifer PreeceInformation Systems Management Department
University of Maryland, Baltimore County
Using the Internet to conduct quantitative research presents challenges not found inconventional research. Paper-based survey quality criteria cannot be completelyadapted to electronic formats. Electronic surveys have distinctive technological, de-mographic, and response characteristics that affect their design, use, and implemen-tation. Survey design, participant privacy and confidentiality, sampling and subjectsolicitation, distribution methods and response rates, and survey piloting are criticalmethodological components that must be addressed.
In this article, quality criteria for electronic survey design and use based on an in-vestigation of recent electronic survey literature are presented. The application ofthese criteria to reach a hard-to-involve online population—nonpublic participants ofonline communities (also known as “lurkers”)—and survey them on their communityparticipation, a topic not salient to the purpose of their online communities is demon-strated in a case study. The results show that a hard-to-reach audience can be reachedusing the quality criteria that are most important for reaching these types of audi-ences. The results suggest how the use of some criteria may conflict and what re-searchers may experience when conducting electronic surveys in an online culture inwhich people are not tolerant of intrusions into online lives.
INTERNATIONAL JOURNAL OF HUMAN–COMPUTER INTERACTION, 16(2), 185–210Copyright © 2003, Lawrence Erlbaum Associates, Inc.
Dorine Andrews is currently at the School of Information Arts and Technologies, University of Balti-more.
Requests for reprints should be sent to Dorine Andrews, 2640 North Calvert Street, Baltimore,MD 21218. E-mail: [email protected]

1. INTRODUCTION
Some knowledge concerning the design and use of paper-based surveys does translateinto electronic formats. However, electronic surveys have distinctive technological, de-mographic, and response rate characteristics that affect their design, distribution, andresponse rates (Sohn, 2001). In this article, we present the results of a comprehensiveinvestigation into the nature of electronic surveys and current methodological ap-proaches. Quality criteria across five important methodological components are ex-plored. These include survey design, participant privacy and confidentiality, samplingand participant selection, distribution and response management, and survey pilot-ing. This is followed with a case study of an online community participation surveythat informs how these quality criteria can be applied to a survey designed to reach apopulation of hard-to-involve Internet users—nonpublic participants in online com-munities—people who do not interact with other members by posting messages andreplies in the public spaces of their communities.
2. ELECTRONIC SURVEY LITERATURE REVIEW
Surveys are imperfect vehicles for collecting data. They require participants to re-call past behavior that can be more accurately captured through observation(Schwarz, 1999). For example, online consumers consistently overestimate theamount they purchase online by as much as 55% (ComScore, 2001). Additionally,survey questions bias participant judgments and answers (Schwarz, 1999). An al-ternative is to combine observations, focus groups, individual interviews, ande-mail, and Web-based, postal, or random digital dial telephone surveys can im-prove response quality (Rogers, 1987; Sudweeks & Simoff as cited in Jones, 1999;Smith, 1997) and sample representativeness significantly (Yun & Trumbo, 2000).This is costly. Electronic surveys provide a way to conduct studies when it is im-practical or financially unfeasible to access certain populations (Couper, 2000;Sheehan & Hoy, 1999; Weible & Wallace, 1998), and they are very cost effective, asthe costs per response decrease as sample size increases (Watt, 1999).
2.1. The Nature of Electronic Surveys
Electronic surveys are increasingly common (Lazar & Preece, 1999) and resultsfrom electronic surveys can be the same as postal survey content results, with theadvantages of speedy distribution and response cycles (Slaughter, Norman, &Schneiderman, 1995; Taylor, 2000; Yun & Trumbo, 2000).
Text-based e-mail electronic surveys have existed since 1986 and Web-based sur-veys since the early 1990s (Kehoe & Pitkow, 1996; Kiesler & Sproull, 1986). The dif-ferences between the two have been reduced now that e-mail is multimedia capa-ble. However, there are several important differences. Web-based surveys allowautomatic verification and survey response capture in databases. Copyrited soft-ware applications such as Survey Wiz, Factor Wiz, QUIS, Survey Pro, Survey Said,Zoomerang, Survey Monky, and WebSurveyor eliminate manual construction and
186 Andrews, Nonnecke, Preece

administrative challenges (Birnbaum, 2000; McCoy & Marks, 2001). However,Web-based surveys do not provide e-mail’s “push” affordance and must be inte-grated with it to create the “pull” effect to bring people to the survey.
2.2. Survey Design
Table 1 summarizes criteria for quality electronic survey design gleaned from re-cent electronic survey studies. The different capabilities of e-mail and Web-basedsoftware may inhibit implementing all of these design criteria.
For example, participants could alter an e-mail or word-processed survey(Witmer, Colman, & Katzman, 1999) until very recently with new Acrobat® PDFform software. Further, e-mail surveys can be confusing to participants due to par-ticipants’ own e-mail or word-processing software (Sheehan & Hoy, 1999).
Many paper-based survey design principles apply to electronic surveys(Dillman, 2000; Oppenheim, 1992; Preece, Rogers, & Sharp, 2002; Witmer et al.,1999). Technology does not limit either the use of open-ended questions or allforms of structured questions (Andrews, Preece, & Turoff, 2001; Bachmann &Elfrink, 1996; Kiesler & Sproull, 1986; Loke & Gilbert, 1995; Schaefer & Dillman,1998). Textual options, format controls, and graphics include links, radio buttons,check box selections, defaults, and menus (Preece et al., 2002). Images, animation,and color can enhance survey presentation (Yun & Trumbo, 2000) but may increasedownload time and affect answers (Couper, Traugott, & Lamias, 2001). However,attrition (dropout) rates may increase when there are too many open-ended ques-tions, multiple answers in a single open-ended question (Crawford, Couper, &Lamais, 2001), questions arranged in tables or inconsistently formatted, or ques-tions that are required rather than optional (Knapp & Heidingsfelder, 1999). Also,
Electronic Survey Methodology 187
Table 1: Survey Design Quality Criteria
Supports multiple platforms and browsers/e-mail clients (Yun & Trumbo, 2000)Controls for browser settings (Yun & Trumbo, 2000)Detects multiple submissions automatically (Yun & Trumbo, 2000)Presents questions in a logical or adaptive manner, for example, provides control of when and how
questions are displayed (Kehoe & Pitkow, 1996; Norman, Friedman, Norman, & Stevenson, 2001)Allows saving responses before completion (Smith, 1997)Collects open-ended or quantified-option responses (Bachmann & Elfrink, 1996; Kiesler & Sproull,
1986; Loke & Gilbert, 1995; Schaefer & Dillman, 1998; Yun & Trumbo, 2000)Provides automatic feedback with completion (Smith, 1997)Uses paper questionnaire design principles (Dillman, 2000; Oppenheim, 1992; Preece, Rogers &
Sharp, 2002; Witmer, Colman, & Katzman, 1999)Provides automatic transfer of responses to a database (Kehoe & Pitkow, 1996; McCoy & Marks, 2001;
Smith, 1997)Prevents survey alteration (Witmer et al., 1999)Provides response control and economical displays (Preece et al., 2002; Stanton, 1998)Provides for links to definitions, menus, button and check box options, animation, sound, graphics
options, and so forth (Preece et al., 2002; Yun & Trumbo, 2000)Does not require familiarity with survey presentation software (Sheehan & Hoy, 1999)Displays appear quickly to participant (Couper, Traugott, & Lamias, 2001)Tracks response source of response failure (Paolo, Bonamino, Gibson, Patridge, & Kallail, 2000)

variations in e-mail software, browser settings, survey software, and participantskills can increase response error and lead to higher attrition rates (Dillman, 2000;Dillman, Totora, Conradt, & Bowker, 1998).
2.3. Participant Privacy and Confidentiality
Table 2 summarizes electronic privacy and confidentiality quality criteria.Internet flexibility and the ease with which false identities can be created exacer-
bate trust and confidentiality issues and can render survey results unreliable (Cho& LaRose, 1999). There are four possible types of electronic survey privacy and con-fidentiality infringements: (a) physical (unsolicited requests), (b) informational(personal information control), (c) psychological (personal choice control), and (d)interactional (relationship control) privacy infringements (Cho & LaRose, 1999).For example, prenotification e-mail and follow-up notes can be considered to berude, unsolicited “spam” (Schillewaert, Langerak, & Duhamel, 1998; Swoboda etal., 1997). Informational privacy may be violated when participants are not allowedto control conditions of release, use, retention, and disposal of personal data, andprivacy is breached when sampling lists are culled from nonpublic online commu-nities and automated mailing lists (Cho & LaRose, 1999). Psychological andinteractional privacy protection can be violated when individuals are not allowedto preview the survey (Burgoon et al., 1989) or because communities are sources for
188 Andrews, Nonnecke, Preece
Table 2: Privacy & Confidentiality Quality Criteriaa
Participants can designate conditions of release, use, retention and disposal of personal dataSample only from public e-mail lists, online communities and automated mailing listsSend invitations and surveys separatelyCollect data through Web pagesProvide multiple response optionsUse “re-mailers” to ensure anonymityDo not troll through observationDo not use “cookies”Do not use links from personalized sitesProvide disclosuresProvide third party privacy certificationUse credible domainsUse encryption for sensitive materialUse hypertext links for long disclosuresDisclose sampling proceduresObtain community leader consentProvide survey results to respondentsUse self-selected user identifications and passwords (option)Provide “rather not say” response option (Kehoe & Pitkow, 1996)Allow people to “opt-in” (Yun & Trumbo, 2000)Establish credibility quickly through subject lines and opening statements (Yun & Trumbo, 2000)Guarantee that no one will see one’s personal data, not anonymity as researchers will know who the
participants are, and explain the method for maintaining confidentiality (Sheehan & Hoy, 1999)
aCho and LaRose (1999), except where noted.

emotional support and entering them is thus perceived as an invasion (Cho &LaRose, 1999). Additionally, the lack of anonymity may not affect response rates(Couper, 2000), or it may be important to response rates (Kiesler & Sproull, 1986).These conflicting findings may be the result of survey topic subject matter differ-ences or the 13 years of Internet experience.
In summary, building sufficient trust for people to participate in surveys re-quires some level of survey transparency, recognized credibility of researchers, anddistribution procedures that attempt not to offend or intrude inappropriately.
2.4. Sampling and Participant Selection
Many large-scale telephone and paper surveys establish representativeness andgenralizability using random digit dialing (J. B. Horrigan, personal communica-tion, September 22, 2002). Others use the General Social Survey or other nationalcensus data (Neustadl & Robinson, 2002; Robson, 1993). For electronic surveys, theproblem is that the nature of the Internet prevents random sampling (Kehoe &Pitkow, 1996) and nonresponse rate tracking (Kehoe, Pitkow, & Morton, 1997). Ta-ble 3 summarizes electronic survey quality criteria.
The lack of Internet central registries prevents researchers from identifying allthe members of an online population along with multiple e-mail addresses for thesame person and invalid or inactive e-mail addresses. Electronic survey selection islimited to nonrandom and probabilistic sampling (Couper, 2000; Dillman, 2000;Kehoe, Pitkow, & Morton, 1997; Schaefer & Dillman, 1998; Swoboda et al., 1997;Yun & Trumbo, 2000).
Sampling options. The sampling frame and selection technique must becarefully defined and customized to suit the needs of the particular electronic sur-vey. Table 4 shows several methods, but there is no “guaranteed” online samplingmethod (Couper, 2000).
With the self-selection sampling option, participation invitations are posted atmultiple online locations or distributed through offline media. There is no randomsample. With Internet user volunteer panels, user participants self-select by sub-mitting demographic information and then participate in various surveys by invi-tation only based on demographics. Researchers have more participant informa-tion but not a random sample.
The sampling options using probability-based methods require knowledge ofthe sampling frame and recruitment process to permit nonresponse source mea-surements. The sample can be restricted to those with Web access or can be broader
Electronic Survey Methodology 189
Table 3: Sample and Participant Selection Quality Criteria
Recognize that online population results are not generalizable to offline populationsRecognize that clear identification of complete online populations continues to be impracticalMake study one of a series of indicative studies that uses random sampling within artificially defined
sampling frames

if a mixed mode (e.g., paper and electronic) is used. However, mixed-mode surveysraise issues of measurement equivalence.
Intercept surveys target visitors at a particular Web site, asking every nth visitor toparticipate, similar to an election exit poll. Invitation presentation timing problemsmayincreasenonresponse.With thesamplingoption, list-basedsampling,everyoneon a list is sent an invitation to increase coverage. However, this approach does notaddress nonresponses. With prerecruited Internet user panels, panel members arerecruited using probability sampling methods such as random digital dialing. Here,nonresponse can occur at any stage of the recruitment and survey process. The lastsampling method, probability samples of full populations, requires that participantsbe provided with the PCs and Internet access necessary to participate. Couper (2000)suggested this approach does allow generalization and generates high participationresponse rates, but recruitment response rates are very low.
Online versus offline demographic sampling issues. Size and demo-graphic estimates of the online population are not consistent and differences be-tween online and offline populations affect the ability to generalize to the total popu-lationfromanonlinepopulation.Thosewhoparticipate inelectronicsurveysmaybemore experienced, more intense Internet users and have stronger Internet skills thanthose who do not participate (Kehoe & Pitkow, 1997). They may be predominatelymale, younger, and from households with fairly high incomes (Sheehan & Hoy, 1999;Sohn, 2001) and be more White and less African American and Hispanic than thegeneral population (Witte, Amoroso, & Howard, 2000). However, the Internet usermale–female gap has disappeared (NUA, 2001), whereas economics, age, and eth-nicity continue to produce significant gaps between online and offline populations(Yun & Trumbo, 2000; Zhang, 2000).
Sampling adjustments. Oversampling adjustments may reduce the chancesof systematic population segment exclusion (Kehoe & Pitkow, 1996; Smith, 1997).However, probability estimates must be calculated by comparing the sample(postsurvey) to benchmarks such as official government statistics with similar de-mographic data (Kehoe & Pitkow, 1996; Witte et al., 2000). Also, Internet serviceproviders access policies, e-mail filtering, and increasing volumes of e-mail is de-
190 Andrews, Nonnecke, Preece
Table 4: Sampling Options for Electronic Surveysa
Non-probabilistic methods:1. Self-selection (p. 478)2. Volunteer panels of Internet users (p. 482)
Probability-based methods3. Intercept (p. 485)4. List-based, high-coverage (p. 485)5. Mixed-mode design with choice of completion method (p. 486)6. Prerecruited panels of Internet users (p. 487)7. Probability samples of full populations (p. 488)
aAs described in Couper, 2000.

creasing unsolicited e-mail survey responses (Sheehan & Hoy, 1999). Others havesuggested sensitivity analysis to determine weighting adjustments across sub-groups; however, differences in online and offline populations corrupt this analysis(Witte et al., 2000).
The alternative. The alternative is to build knowledge through studies thatprovide results that may be indicative of similar populations. In this approach, ran-dom sampling to select participants is contained within an artificially boundedsampling frame that is not the complete population under study (Coomber, 1997;Yun & Trumbo, 2000).
2.5. Distribution Methods and Response Rate Management
Today’s online populations are less cohesive and less interested in participating insurveysnotsalient to their interests (Cho&LaRose,1999;Sheehan,2001).Thismakesattainingresponseratesforsomestudiesmorechallengingformanysurveytopics.
Although the definition of a valid response depends on the survey topic andcontext, Bosnjak and Tuten (2001) suggested valid responses may include (a) acomplete response—all questions are answered and the survey is submitted; (b) aunit response—all questions in some but not all survey sections are answered, andthe survey is submitted; and/or (c) a partial item response—only some questionsare answered, and the survey is submitted. When the survey is never submitted,nonresponses (read the invitation) and attritions (dropouts while taking the sur-vey) are indistinguishable. Table 5 summarizes criteria to encourage quality (highresponse) rates.
With surveys in which the sample frame is known, response rates can be calcu-lated. E-mail response rates of 20% or lower are not uncommon (Witmer et al.,1999), and although rates exceeding 70% have been recorded, they are attributed toparticipation in work group cohesiveness (Walsh, Kiesler, Sproull, & Hess, 1992).Web-based surveys using unsolicited e-mail invitations is significantly higher thanunsolicited e-mail-based surveys significantly only in participation; however,nonresponse problems are continually encountered (Smith, 1997). Also, electronicsurvey responses are faster than postal surveys without significant impacts on sur-vey response rates (Sheehan & Hoy, 1999; Sheehan & McMillan, 1999; Yun &Trumbo, 2000). Therefore, the question becomes, what design and distributiontechniques affect response rates most for electronic surveys?
Survey design features affecting response rates. Shorter questionnairesdo not necessarily produce higher response rates (Sheehan, 2001; Witmer et al. ascited in Jones, 1999). Cash incentives can increase the number of responses twice asmuch as altruistic motives (Tuten, Bosnjak, & Bandilla, 2000); however, they mayintroduce a systematic bias (Kehoe & Pitkow, 1997). Perceptions of the effort re-quired to complete a survey may affect response rates. Those who were told a sur-vey would take less time, those receiving an automated (embedded) password,
Electronic Survey Methodology 191

and those who received more frequent reminders were all more likely to accept aninvitation to participate but not more likely to complete the survey (Crawford et al.,2001). Also, ambiguous characters in passwords (e.g., 1 [the number one] or l [orthe letter l]) lower response rates (Couper et al., 2001).
Placing demographics data requests at the end of a survey may (Frick,Bachtinger, & Reips, 1999) or may not (Dillman, 2000; Oppenheim, 1992) affect re-sponse rates. Differences may be due to the fact that paper surveys can be fully in-spected before they are completed, thus eliminating surprise. Only single-pageWeb-based surveys provide for such inspection.
Distribution procedures affecting response rates. Surveys presented in asingle e-mail containing both an invitation and the survey are likely to cause highnonresponse rates (Cho & LaRose, 1999; Mehta & Sivadas, 1995; Sheehan, 2001;Witmer et al., 1999). Response rates are higher when a short, prenotification invita-tion e-mail introduces the coming e-mail survey and provides “opt-in” or“opt-out” options to participate (Sheehan, 2001; Sheehan & Hoy, 1999; Witmer etal., 1999). Follow-up reminder e-mails appear to spike participation (Sheehan &Hoy, 1999; Smith, 1997). To increase response rates up to 70%, more sophisticatedapproaches integrate online and offline invitations and reminders beginning withan invitation postal letter, then a paper survey and an e-mail survey with aWeb-based version URL option, followed with reminder postcards (Yun & Trumbo,2000). Notification placement and mix targeted to the specific audience such as ad-vertisements in journals increase response rates also (Pereira, Bruera, & Quan,2001). However, response rates are not affected by varying the interval time peri-ods between reminders (Couper et al., 2001).
192 Andrews, Nonnecke, Preece
Table 5: Response Rate Quality Criteria
The survey has been tested across many platforms to avoid technical breakdowns (Sheehan &McMillian, 1999; Watt, 1999).
The survey is salient to participants’ interests (Sheehan & McMillan, 1999; Watt, 1999).There is no systematic judgment by the survey population (Kehoe & Pitkow, 1996; Sheehan, 2001).Privacy and confidentiality are assured (Couper, 2000)Participants can inspect entire survey before taking the survey (Crawford et al., 2001)Personal (demographic) data is requested first, not last (Frick, Bachtinger, & Reips, 1999)Financial incentives are offered (e.g., lottery prizes, coupons or discounts; Frick et al., 1999; Cho &
LaRose, 1999; Couper, 2000; Kehoe, Pitkow, & Morton, 1997)Automated (embedded) passwords that have no ambiguous characters in passwords are used
(Crawford et al., 2001)A multistep invitation and survey presentation process is used (Cho & LaRose, 1999; Mehta &
Sivadas, 1995; Sheehan, 2001; Witmer, Colman, & Katzman, 1999)Estimated time to complete the survey and periodic reminders to complete the survey are provided
(Crawford et al., 2001)An appropriate subject line in the invitation, e-mail address of sender and sender’s name are used
(Sheehan, 2001)Multiple ways to contact and invite participation are part of the distribution strategy (Sheehan, 2001;
Pereira, Bruera, & Quan, 2001)The survey is customized to the target population—invitation language, type of notification media,
and follow-up process (Sheehan, 2001)

Other affects on response rates. Last, response rates are affected by partic-ipants’ ability to answer (e.g., perform complex mental tasks, make judgments)and their motivation (e.g., topic salience, belief in usefulness of questionnaire;Krosnick, 1999).
2.6. Survey Piloting
“Survey piloting is the process of conceptualizing and re-conceptualizing the keyaims of the study and making preparations for the fieldwork and analysis so that nottoo much will go wrong and nothing will have been left out” (Oppenheim, 1992, p.64). Inattention to detail in question development and distribution procedures de-feats quality (Table 6). Question bias introduced through closed questions, skewedfrequency scales, reference periods, and rating scales, and leading questions andquestion placement can be uncovered in piloting (Krosnick, 1999; Schwarz, 1999).Significant structural problems can be revealed as when Witte et al. (2000) foundtheir very long survey needed modularlization and procedure restructure.
The survey pilot process. Using a multistage testing process that integratesan array of different testing techniques and a four-stage process is recommended (Fig-ure 1; Dillman, 2000; Oppenheim, 1992; Preece et al., 1994; Schwarz & Sudman, 1996).
In Stage 1, a review by knowledgeable analysts ensure question completeness, ef-ficiency, relevancy, scale, and format appropriateness. Heuristic review is a usefultechnique. In Stage 2, “typical” participants take the survey using a “think-aloud”protocol while developers observe and follow-up with retrospective interviews.Survey language, question interpretation consistency, logical question sequencing,and survey “look and feel” are evaluated. In Stage 3, a small study emulates all the
Electronic Survey Methodology 193
Table 6: Frequent Survey Structure Detail Errors Discovered in Survey Pilot Testinga
Demographic data requests that are inappropriate for the surveyOverlapping question scales (e.g., 1 to 3, 3 to 6) or selection optionsQuestions that few or no one answersToo many questions that highly correlateToo many open-ended questionsOpen-ended questions that do not provide useful informationIncorrect defaults (hidden or revealed)Small text boxes that do not scrollAmbiguous wordingBias in question/answer wordingInconsistent terminologyNonorthogonal or overlapping categoriesSpecialist terms or technical vocabulary not familiar to the target populationAnswers that cannot be undoneInsufficient space for open-ended question answersInconsistent wording and spelling errorsInaccurate or missing instructionsInaccurate time to complete estimates
aCrawford et al. (2001); Dillman (2000); Krosnick (1999); Preece, Rogers & Sharp (2002); Schwarz (1999).

procedures proposed by the main study. In Stage 4, one last check is done to catch ty-pos and errors inadvertently introduced during the last revision process.
Predicting response rates. Piloting can reveal undeliverable e-mail, de-clined, and completed survey rates, which are all useful for estimating the amountof oversampling required (Sheehan & Hoy, 1999). Survey log files can measure re-sponse rates at the question level to identify question problems if each question ison a separate Web page (Bosnjak & Tuten, 2001; McCoy & Marks, 2001).
In summary, a conscientious and complete piloting of the survey instrument,distribution process, and response and attrition behavior creates a high-qualityelectronic survey.
2.7. Overview Summary
It appears that Web-based surveys are the most appropriate format for surveyswhen research costs are a constraint, timeliness is important, and the nature of theresearch requires it. However, this method presents both technical and administra-tive challenges that do not exist with traditional postal or text-based e-mail sur-veys. Piloting is required to perfect the survey, sampling, survey distribution, andestimate response rates.
3. ONLINE PARTICIPATION CASE STUDY
The following case study applies the electronic survey criteria to reach a hard-to-in-volve population of Internet users—online community nonpublic participants(also known as lurkers)—and the issues encountered. The results show that the cri-teria, when properly applied, generate strong response rates.
194 Andrews, Nonnecke, Preece
FIGURE 1 Survey pilot pro-cess.

3.1. Overview
A study into the nature of participation in online communities was undertaken tofollow up on previous studies, the first (Nonnecke & Preece, 2000) which exploredwhy people lurk using a small, qualitative, face-to-face interview methodology.The results revealed 79 potential reasons for lurking, which were grouped into fourcategories: member characteristics, group characteristics, membership life cyclestage, and external constraints. A preliminary “gratification” model was devel-oped, and Nonnecke and Preece concluded that lurking is a strategic activity. Thesecond study (Nonnecke, 2000), a quantitative e-mail logging study, showed thatlurking levels varied among different types of online communities and were not atthe 90% levels often discussed. Our study explores why some people post and oth-ers only read (lurk) and the reasons for the behavior using a quantitative study thatcuts across a diverse population of online communities.
3.2. Participants
This study was carefully designed to attract nonpublic (lurking) participants aswell as public (posting) participants in a diverse set of online communities, aslurkers are likely not to post to a survey. Privacy and anonymity were issues for thesurvey design, as follow-up interviews with a subset of survey participants mightbe needed. Also, topic salience was an issue. Online community participation is oflittle interest to most people.
Using the sampling and participant selection quality criteria (Table 3), we knewgeneralizable results to all online community participation was not possible. Studyresults could only be considered indicative of what may be found in other onlinecommunity populations.
Given this assumption, we chose a diverse cross section of online communitiesusing an artificially constructed sampling frame from which a stratified randomsample was drawn. We chose the nonprobabilistic sampling option of self-selection(Table 4).
This study was limited to asynchronous online communities to match previouswork. There were many different portal and nonportal resources (i.e., MSN®, Ya-hoo!®, Catalist®, Talkcity, Google®, Altavista®, and http://www.tile.net/lists) fromwhich to choose the sampling frame. Because previous research (Nonnecke, 2000)clearly demonstrated that different types of online communities have differentlurker characteristics, a heterogeneous online community resource, MSN onlinecommunities service, was selected, as it has 16 online community categories at thehighest level of MSN’s community hierarchy. Also, MSN online communities ser-vice lists community membership numbers and provides counts for the communi-ties in each category and subcategories.
Twenty-five percent of the MSN group categories were selected using a randomnumber generator to narrow the sampling frame. The categories selected were (a)health and wellness, (b) government, (c) sports and recreation, and (d) organiza-tions. This population was further defined with the criteria that a selected commu-
Electronic Survey Methodology 195

nity must have a critical mass of at least 50 members, be open to public participa-tion, and have an active online community having 4 to 5 people posting within thepast 90 days. A total of 1,304 online communities were identified. The frame wasthen stratified so that each category could be proportionally sampled (Table 7).
The qualifying communities within each category were numbered sequentially (1to n). To attain a 95% confidence level that the sample results were generalizable tothe sampling frame, 371 online communities were surveyed to attain a confidencelevel just over 4% (4.31%; Creative Research Systems, 2001). In the actuality, 375 com-munities accepted the original invitation.
3.3. Apparatus—Survey Instrument
The survey was designed to implement as many of the quality criteria (Tables 1through 5) as possible. It had a professional, simple layout using a straightforwardnavigation strategy and kept graphics and color to a minimum to keep downloadingtime as short as possible (http://oracle.ifsm.umbc.edu/preecesurvey/). Cold Fu-sion®, Microsoft Access®, and HTML were used to develop the survey, as other soft-ware mentioned in the literature review was not accessible as yet. The software sup-ported multiple platforms and browsers, multiple opportunities for savingrespondent answers, coded and open-ended responses, an immediate “thank-you”feedback on survey completion, and detected multiple submissions. If a multiplesubmission was detected, a gently worded error message was sent to the participant:“It appears you have already completed a survey for this online community. Pleasecontact the survey administrator at the link below to investigate the problem.”
The survey contained 12 demographic items, 28 primary coded questions inte-grated with 20 secondary coded and open-ended questions. An introduction pageand an informed consent page preceded these questions.
The purpose of the survey introduction page (Figure 2) was to create a trustingrelationship with survey participants by establishing our authority and credibilityas researchers, repeating the survey purpose first explained in the invitation post-ing, offering a nonfinancial incentive—a report of the results—guaranteeing confi-dentiality and privacy, providing access to us via e-mail, and explaining the sam-pling methodology. It also provided a third-party guarantee of the survey’sauthenticity and credibility by stating the University of Maryland’s InstitutionalReview Board (IRB) approval and providing a link to the IRB Web site. If an IRBhad not been available, they could have referred to their professional association
196 Andrews, Nonnecke, Preece
Table 7: Stratified Sampling Frame
Category No. Groups Meeting Criteria Frame Proportion (%) Sample
Health and wellness 435 33 122Government 139 11 41Sports/recreation 531 41 152Organizations 199 15 56Total 1,304 100 371
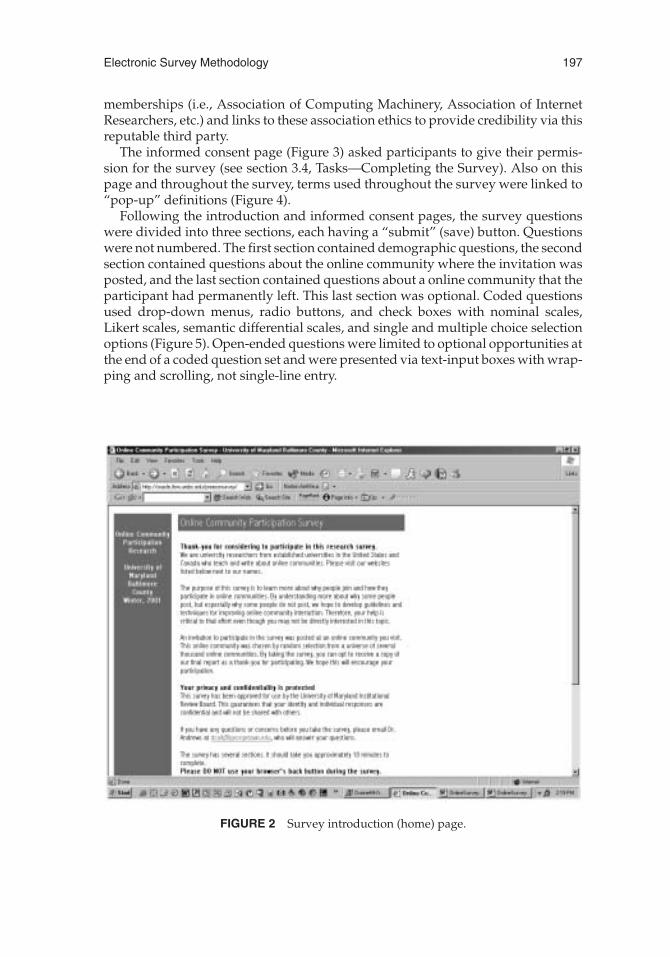
memberships (i.e., Association of Computing Machinery, Association of InternetResearchers, etc.) and links to these association ethics to provide credibility via thisreputable third party.
The informed consent page (Figure 3) asked participants to give their permis-sion for the survey (see section 3.4, Tasks—Completing the Survey). Also on thispage and throughout the survey, terms used throughout the survey were linked to“pop-up” definitions (Figure 4).
Following the introduction and informed consent pages, the survey questionswere divided into three sections, each having a “submit” (save) button. Questionswere not numbered. The first section contained demographic questions, the secondsection contained questions about the online community where the invitation wasposted, and the last section contained questions about a online community that theparticipant had permanently left. This last section was optional. Coded questionsused drop-down menus, radio buttons, and check boxes with nominal scales,Likert scales, semantic differential scales, and single and multiple choice selectionoptions (Figure 5). Open-ended questions were limited to optional opportunities atthe end of a coded question set and were presented via text-input boxes with wrap-ping and scrolling, not single-line entry.
Electronic Survey Methodology 197
FIGURE 2 Survey introduction (home) page.

3.4. Tasks—Completing the Survey
Survey participants were asked to complete tasks in the survey on entering the in-formed consent page after reading the introduction page. They included optionallyproviding an e-mail address, entering the URL address or online community namewhere they learned of the survey, opting out of permission to collect data and/or
198 Andrews, Nonnecke, Preece
FIGURE 3 Survey informed consent page.
FIGURE 4 Survey pop-up definition example.

permission for a follow-up interview, stating their age qualifications, and pressingthe submit button to continue with the survey.
On the demographic page of the survey using coded questions, participantswere asked to specify age within a range and select gender, Internet experience,work/career situation, work environment, and education level from lists of op-tions; describe their online community experience and activity; enter their activityvolume in text boxes; and press the submit button and continue with the survey.
The survey’s second section presented survey questions to participants. Theywere asked to “focus on the online group/community where you found the surveyinvitation” to answer questions about their participation in that particular onlinecommunity and press the submit button and continue with the survey.
The third section of the survey asked participants to “focus on an onlinegroup/community that you have permanently left.” If they had never perma-nently left an online group/community, they linked to the end of the survey. If theyhad left a community, they were asked to enter the URL or name of the communitythey had permanently left, answer questions about their participation in the onlinecommunity they had left, and press the submit button.
Last, participants were presented with a thank you screen verifying responserecording.
3.5. Procedures—Conducting the Survey
The survey invitation was posted as a message on public online communities. Mul-tiple contact and invitation methods, as recommended in the quality criteria in Ta-
Electronic Survey Methodology 199
FIGURE 5 Examples of the questions used in the survey.

ble 5, were not used, as we hoped to calculate some type of response rate at thecommunity category and community level. Direct e-mail to each member wouldhave allowed nonresponse tracking but was considered overly intrusive (Table 2).Also, the invitation was posted without community owner/moderator permissionunless online community policies directly required owner/moderator permissionto post a message that was not directly “on topic.” This procedure was adopted as aresult of pilot testing (see section 3.6, Experimental Design—Conducting the PilotTest). The invitation posting was a shortened version of the survey introductionpage. It was introduced with a short note from the research fellow (Figure 6). Afterreading the invitation, online community members ignored the post or self-se-lected to take the survey by clicking on the survey URL.
Two follow-up reminder invitations were posted 1 week apart to each onlinecommunity. All inquiry e-mail, whether sent as a reply to the posting or sent to thesurvey “Webmaster” was responded to within 24 hr. Even those e-mails that werestatements rather than questions received recognition from us.
An unexpected procedural posting problem arose during the survey. To post toMSN communities, an individual must have a hotmail account. Each account islimited to 50 online communities. Therefore, multiple e-mail accounts were re-quired to post to all online communities. Other online community populationsmay not have this limitation; however, it should be addressed in the survey proce-dure design.
One small technical problem occurred when the first invitation was posted. Thesurvey had been moved to a new server and we were not notified until an e-mailwas received asking why the link was not working. This was repaired within anhour before other invitations were posted.
3.6. Experimental Design—Conducting the Pilot Test
The four stage pilot process as defined in the literature overview (Figure 1) was fol-lowed to refine and finalize the survey and its distribution method and to estimateresponse levels.
Stage 1—Colleague test. In Stage 1, four rounds of question drafting and se-quencing were required and a prototype was developed.
Question language proved more challenging than first anticipated. Shorter sen-tences are better for reading on the screen, as people do not read Web pages, theyscan them, looking for key words and phrases (Nielsen, 2000). Therefore, surveyquestions and instructions became briefer as the prototype was reviewed. For ex-ample, the original statement, “This second set of questions is similar to the firstset, but focus on an online group which you have permanently left and no longerconsider yourself to be a member of,” became “The questions below pertain to anonline group you have permanently left.” There was a constant struggle to main-tain the balance between brevity, friendly tone, and accurate description.
The research regarding question length is somewhat contradictory; however, weassumed that the less salient the topic, the less tolerance participants would have
200 Andrews, Nonnecke, Preece

for completing the survey. Therefore, we eliminated all redundant questions. Thefirst draft of the survey had over 50 primary questions; at the end of this first stage,it had been reduced by about 25%. By the end of the entire piloting process, therewere only 28 primary questions across Sections 2 and 3.
Stage 2—Cognitive test. Stage2differedfromthepilot testingqualitycriteriainthat itconsistedof twoparts,not justone.First, severalparticipantsnot involvedinthe research completed a usability test. Each read the invitation as if it were posted totheir online community and completed the survey using think-aloud protocols withretrospective interviews.Thisresultedinfurther languagesimplificationonboththeinvitation and survey questions, changes in sequencing, and feedback on the lookand feel of the survey. For example, following a human–computer interaction princi-ple to provide a Gestalt-like framework (Shneiderman, 1998), the 79 items of the pre-liminary model were structured into four groups using the category names as head-ings. However, from this first Stage 2 test, it was clear that constant scrolling up anddown the screen was required to view all items. The list was too long. As a result,items considered duplicative were removed, similar items were placed together ingroupsof threeandfour,andallcategoryheadingswereremoved, leavingagroupedlist of 15 to 20 items depending on the question. An open-ended question, “Please re-port any other reasons you might have,” was added at the end of the listing, whichnow fit a small screen display.
After the prototype was updated once again, an invitation to review the surveywas placed on an Internet researchers automated mailing list. Over 50 Internet re-
Electronic Survey Methodology 201
FIGURE 6 Survey invitationposting.

searchers completed the survey and 15 people provided e-mail feedback to varyingdegrees of detail. This expert testing revealed privacy and confidentiality concerns,numerous recommendations for question wording, inconsistencies among ques-tions, and a need to eliminate several questions. For example, the confidentialityguarantee language was clarified and reiterated several times on the introductionand permission pages. In addition, the invitation was shortened, the subject line re-fined, and the privacy and confidentiality statement was moved forward and setoff with white space. Headings were added so that those who scanned the invita-tion instead of reading it would “get the same message” as reading the complete in-troduction. The researcher e-mail address was also changed from a short abbrevi-ated name to a full name.
Stage 3—Live test. In Stage 3, the sampling procedure, the survey, and theinvitation procedure were fully tested. Twenty online communities were selectedfrom MSN online communities outside the four sampling frame categories. Atten-tion was paid to select a diverse range of communities, which met all the sample se-lection criteria (size range, activity, and public access). Membership size rangedfrom 59 to 7,859 for a total potential participant response volume of 17,221 people.The original invitation posting procedure of requesting permission to post wasabandoned after 10 requests to post went unanswered. The piloting continued bydirectly posting to the online communities after joining the community as required.No group “kicked out” the post. A second invitation was posted 1 week later.
Eighty-four survey responses were gathered from the 20 boards. Of those re-sponses, 14 (14.3%) were considered invalid because the participants did not pro-vide any information on whether they posted or did not post to the online commu-nity. However, for the valid responses, 6.9% said they never posted (also known as“super lurkers”), 34.7% infrequently posted (”lurkers”), 20.8% posted weekly(“posters”), and 37.5% said they were daily posters (“super posters”). These resultsencouraged us to believe that online community nonpublic participants can be en-ticed to participate in a survey.
This piloting also provided other important feedback. First, the date the surveywas submitted was added and captured automatically to provide a way to analyzeresponse volume to invitations and follow-ups. Second, in an attempt to measurenonresponse rates, the survey captured the name of the online community auto-matically using the “URLfrom” HTML capability as well as having the participantenter it. However, the URL placed in the URLfrom field was related to the post, notjust the online community; therefore, we knew for the results that each communityhad to be identified and clarified manually. In many cases, there was no reference,as participants copied the survey URL into a browser address field or had left thesource field blank.
Stage 4—Cleanup. With final grammar and format checks completed, thefirst invitations were posted March 19, 2002, and the last post was completed May14, 2002. The reason for staggered postings is described following.
202 Andrews, Nonnecke, Preece

3.7. Experimental Design—Administering the Full Study
The process of posting invitations to online communities began by generating aset of random numbers equal to the number of samples to be drawn from a cate-gory (e.g, 122 numbers were generated for the health and wellness category). Theinitial invitation (Figure 6) was posted, then 1 week later a reminder was posted,and then 1 week after that a third and last reminder was posted following thequality criteria in Table 5. When a discussion board rejected an invitation posting(the posting was kicked off), then another random number was generated, andthe process of posting was initiated with the newly selected community. Ques-tion results were analyzed using Kruskal–Wallis nonparametric tests because thedata were categorical and not from a normalized distribution across the sampleframe.
3.8. Results—Full Study
The survey invitation was successfully posted to 375 randomly selected MSN on-line communities with membership totaling 77,582 (Table 8). Eighteen (4.5%) of theonline communities rejected the invitation outright (first posting) requiring addi-tional sample to be drawn to replace these rejections. Three additional groups re-jected a follow-up invitation. These were included in the 375, as online communitymembers had an opportunity to read and respond to the initial invitation.
Community intolerance. In this study, 16 of the 18 first rejections (89%) camefrom the sports and recreation category. This category also had the highest numberof replies to the invitations (55%) but represented only 41% of the surveyed onlinecommunities and 12% of the potential survey participants. In addition, about halfof the 41 survey e-mail inquiries and most of the 107 invitation posting replies fromthis group were neutral or negative comments, and several events reinforced theimpression of this category of communities’ lack of tolerance. The survey serverwas “hacked” twice, presumably in response to the survey invitation, and fromtime to time we received unsolicited e-mail offers, some of which were porno-graphic in content or aggressive in tone.
Electronic Survey Methodology 203
Table 8: Survey Results Summary
Category Groups Selected Kicked Offa Groups Surveyed Members Repliesb
Health and wellness 123 0 123 36,024 26Government 41 0 41 15,176 20Sports/recreation 170 16 154 9,323 59Organizations 59 2 57 17,059 2Total 393 18 375 77,582 107
a3 additional removals on second or third invitation posting after 1st week. bReplies to invitationposts (not e-mails from members).

Response rates. A total of 1,743 responses were submitted, equaling 2.3% ofthe sample frame member population (77,582), an average of 4.6 responses per on-line community, or a response rate of 21% from the 375 online communities. Also,555 (31.8%) responses proved to be invalid, leaving 1,188 (68%) valid surveys foritem analysis (Table 9).
To be valid, a participant must have given permission, been at least 18 years ofage, and answered the question on posting behavior for the online communitywhere the invitation was posted. Seventy percent of the responses were eliminatedbecause one or more of these criteria were not met. Another 29.9% were completelyempty records, meaning that almost 30% of the participants read but did not partic-ipate in the survey. These records were removed.
People who participated are interested in the results. Despite the fact thatthe survey was not salient to the sampled online communities, 96% of those who didcomplete the survey requested a copy of the survey and supplied their e-mail ad-dress for this reason.
Shared characteristics. Participants completing this survey had characteris-ticssimilar tobutnotexactly likethosereportedinotherInternetsurveys(Table10).
They were educated like other survey participants, but 12% more women thanmen completed the survey. The majority of survey participants were between theages of 30 and 49, with neither young nor old participants dominating the partici-pation; 81.7% of the participants were nonstudents. Two thirds of the survey partic-ipants were employed full-time or self-employed or worked part-time (66.6%);55.5% worked out of their home or a traditional office. Like other survey partici-pants, in terms of their Internet experience, this survey’s participants overwhelm-ingly were experienced people who had been online three or more years usinge-mail and joining online communities.
Nonpublic participants. From the beginning, there was concern as to whetheror not people who do not post in an online community would be willing to partici-pate in a survey study. As seen in Figure 7, it appears that contrary to this concern,18.6% of participants reported that they “never post to the online community,” andanother 48.9% reported only “occasional posting.” Only 32.5% actively participatedon a weekly or daily basis. Over two thirds of this sampling frame was publicly inac-tive or rarely active in their online communities.
204 Andrews, Nonnecke, Preece
Table 9: Survey Record Validation Summary
Invalid Records No Permission No Posting Behaviora Empty Not 18+ Total
No. records removed 81 254 166 54 555Percent removed 14.6 45.7 29.9 9.7 100Total percent 4.6 14.5 9.5 3.1 31.8
Note. N = 1,743. There were 1,188 valid records.aMust have posting behavior for current online community where invitation was found.

4. DISCUSSION AND CONCLUSION
4.1. Hard-To-Involve Online Users Can Be Reached
Although the results of this study cannot be generalized to the total online commu-nity population, it appears that it is possible to coax nonpublic participants intopublicly participating in an online survey. The quality criteria for survey designand use, when customized to the requirements of the particular research situation,were found to be effective. Some people will be interested and then back out, as oc-
Electronic Survey Methodology 205
Table 10: Participant Characteristics
Characteristic %
EducationHigh school 21Some college 42College graduate 37
GenderFemale 56Male 44
Age< 20 4.820 to 29 18.630 to 39 24.740 to 49 25.850 to 59 19.360+ 6.6
Work typeRetired 12Full-time 43.1Self-employed 12.3Part-time 11.1Not working 21.4
Work styleAt home 16.2Employer office 39.3Non-office 44.5
Student statusNonstudent 81.7Student 18.3
Use online groupsNo 6.9Yes 93.1
Use e-mailNo 1.8Yes 98.2
Online experienceLess than 1 year 11.61 to 2 years 17.93+ years 70.5
Note. N = 1,188.

curred in this study (e.g., 30% submitted the survey but did not answer any ques-tions), but it appears a sizable number are reachable.
If this case study is indicative of what researchers will encounter when conduct-ing research across a diverse online population, it appears that they can expect lowresponse rates and a certain level of intolerance to the intrusion of the study on thepart of some types of communities. In this community participation study, the lowresponse rates of 2.5% of the sampling frame individuals or 21% of the communi-ties may be due to the fact that the topic was not salient or the posted membershipfigures may not be representative of the actual number of members. However, forthose online active or nonpublic participants who do choose to participate in re-search, they will most likely be interested in seeing the survey results no matterwhat the topic of study.
4.2. Protect Researchers Without Damaging Survey Credibility
After the 2-month survey period, we concluded that we had been somewhat naïve.The kind of intolerance and resulting attacks on the research server provide a cau-tionary warning to researchers. They raise the question of whether researchersshould identify themselves and welcome inquiries as the quality criteria in Table 2suggest. Perhaps creating a central e-mail address, separate from all individual re-searcher e-mails, is a more effective way of providing access to researchers. Thismay affect researcher credibility but would provide some level of protection fromabusive comments. Additionally, because the survey server was infected with a vi-rus and was also hacked, it is important to provide strong firewall security.
206 Andrews, Nonnecke, Preece
FIGURE 7 Posting activity.

4.3. The Quality Criteria for Electronic Surveys Provide Choices
We did not implement all the recommended criteria for quality electronic surveysbut did implement those that made sense for the research objectives, context, andcontent of this study. As discussed previously, the survey succeeded in reaching asignificant portion of a hard-to-involve population—nonpublic online communityparticipants. From the case study experience, the most important criteria contribut-ing to survey success appeared to be the following:
• For design, all the criteria in Table 1 except adaptive question presentation,which was not used.
• For privacy and confidentiality, in Table 2, the criteria of full disclosure ofstudy purpose and sampling procedures, those items that help to establish re-searcher credibility, and the promise of confidentiality and not requiring identifica-tion, although as mentioned earlier, compromises may be needed to protect re-searchers from unpleasant, unsolicited e-mail.
• For encouraging high response rates, in Table 5 the multistep invitation andsurvey presentation process. Most important, we responded to all inquiries rapidlyand in detail. This led to moderators allowing the invitation to remain posted at theonline community.
Could response rates have been higher? We are not sure. The topic of onlinecommunity participation is in itself not salient to most people and therefore will re-main a stumbling block to higher participation. Perhaps a shorter survey may haveincreased participation. Additionally, the bad link discovery after the first invita-tion posting may have thwarted a few participants. This was repaired before theother 374 communities were contacted; therefore, its impact was minor.
4.4. Piloting Is Essential
It was quite enlightening to see the evolution of the survey instrument and distri-bution procedure through the piloting process. The testing was invaluable. Thequality of the survey improved dramatically at each stage of the process. The Stage2 think-aloud protocol testing while we watched people read the invitation andcomplete the survey was most informative. That, combined with the second Stage 2expert testing, resulted in the most significant and beneficial changes and helpedus let go of what we initially considered “good” language, question formatting,and overall structure for the survey.
We can expect that studies across diverse populations of online communitieswill continue to become more difficult as communities become more protective oftheir spaces. This study was neither a commercial study nor a marketing ploy, yet itwas rejected by almost 5% of the communities. It is doubtful whether responserates above 20% can be reached, as this study has demonstrated. However, this casestudy demonstrates that even studies designed to reach hard-to-involve partici-pants can be successful.
Electronic Survey Methodology 207

REFERENCES
Andrews, D., Preece, J., & Turoff, M. (2001, January). A conceptual framework for demographicgroups resistant to online community interaction. Paper presented at the HICSS 2001 Confer-ence, Honolulu, HI.
Bachmann, D., & Elfrink, J. (1996). Tracking the progress of email versus snail-mail. Mar-keting Research, 8(2), 31–35.
Birnbaum, M. H. (2000). Surveywiz and factorwiz: Javascript web pages that make htmlforms for research on the internet. Behavior Research Methods, Instruments and Computers,32, 339–346.
Brosnjak, M., & Tuten, T. (2001). Classifying response behavior in web-based surveys. Journalof Computer Mediated Communication, 6(1). Retrieved August 10, 2001, fromhttp://www.ascusc.org/jcmc/vol6/issue3/bosnjak.html
Burgoon, J. K., Parrott, R., LePoire, B. A., Kelly, D. L., Walther, J. B., & Perry, D. (1989). Main-taining and restoring privacy through communication in different types of relationships.Journal of Social and Personal Relationships, 6, 131–158.
Cho, H., & LaRose, R. (1999). Privacy issues in internet surveys. Social Science Computer Re-view, 17, 421–434.
ComScore. (2001, January 16). ComScore networks study reveals inaccuracies in consumers’ abilityto accurately recall their on-line buying behavior and offers new solution. Retrieved September17, 2002, from http://www.comscore.com/news/pr_comscore_study.htm
Coomber, R. (1997). Using the internet for survey research. Sociological Research Online, 2(2),14–23.
Couper, M. P. (2000). Web-based surveys: A review of issues and approaches. Public OpinionQuarterly, 64, 464–494.
Couper, M. P., Traugott, M. W., & Lamias, M. J. (2001). Web survey design and administra-tion. Public Opinion Quarterly, 65, 230–253.
Crawford, S., Couper, M., & Lamias, M. (2001). Web surveys: Perceptions of burden. SocialScience Computer Review (Nonnecke, 2000), 19(2), 146–162.
Creative Research Systems. (2001). Sample size calculator. Retrieved September 17, 2002, fromhttp://www.surveysystem.com/sscalc.htm
Dillman, D. A. (2000.) Mail and web-based survey: The tailored design method. New York: Wiley.Dillman, D., Totora, R. D., Conradt, J., & Bowker, D. (1998, November). Influence of plain ver-
sus fancy design on response rates for web-based surveys. Paper presented at the annual meet-ing of the American Statistical Association, Dallas, TX.
Frick, A., Bachtinger, M. T., & Reips, U.-D. (1999). Financial incentives, personal informationand drop-out rates in online studies. Current Internet Science. Retrieved August 22, 2003,from http://www.dgof.de/tband99/pdfs/i_p/knapdf
Jones, S. (1999). Doing Internet research. Thousand Oaks, CA: Sage.Kehoe, C. M., & Pitkow, J. E. (1996). Surveying the territory: GVU’s five www user surveys.
The World Wide Web Journal, 1(3), 77–84.Kehoe, C. M., Pitkow, J. E., & Morton, K. (1997). Eighth www user survey. Retrieved September
17, 2002, from http://www.gvu.gatech.edu/user_surveys/survey-1997-10Kiesler, S., & Sproull, L. S. (1986). Response effects in the electronic survey. Public Opinion
Quarterly, 50, 402–413.Knapp, F., & Heidingsfelder, M. (1999). Drop out analysis: The effect of research design. Cur-
rent Internet Science. Retrieved August 22, 2003, fromhttp://www.dgof.de/tband99/pdfs/i_p/knapp.pdf
Krosnick, J. A. (1999). Survey research. Annual Reviews: Psychology, 50, 537–567.Lazar, J., & Preece, J. (1999). Designing and implementing web-based surveys. Journal of
Computer Information Systems, 39(4), 63–67.
208 Andrews, Nonnecke, Preece

Loke, S. D., & Gilbert, B. O. (1995). Method of psychological assessment, self disclosure, andexperiential differences: A study of computer, questionnaire and interview assessmentformats. Journal of Social Behavior and Personality, 10, 255–263.
McCoy, S., & Marks, P. V., Jr. (2001, August). Using electronic surveys to collect data: Experiencesfrom the field. Paper presented at the AMCIS conference, Boston, MA.
Mehta, R., & Sivadas, E. (1995). Comparing response rates and response content in mail ver-sus electronic mail surveys. Journal of the Market Research Society, 17, 429–440.
Neustadl, A., & Robinson, J. (2002, September) Social contact differences among internet us-ers and nonusers in the general social survey. IT & Society, 1(1). Retrieved September 17,2002, from http://www.stanford.edu/group/siqss/itandsociety/Vol01–1-A06-Neustadtl-Robinson.pdf
Nielsen, J. (2000). Designing web usability. Indianapolis, IN: New Riders.Nonnecke, B. (2000). Lurkers in email-based discussion lists. Unpublished dissertation, South
Bank University, London.Nonnecke, B., & Preece, J. (2000, April). Lurker demographics: Counting the silent. Paper pre-
sented at the CHI 2000 Conference on Human Factors in Computing Systems, TheHague, Holland.
Norman, K. L., Friedman, Z., Norman, K., & Stevenson, R. (2001). Navigational issues in the de-sign of online self-administered questionnaires. Behaviour & Information Technology, 20, 37–45.
NUA. (2001). Women now outnumber men on the internet. Retrieved September 17, 2002, fromhttp://www.nua.ie/surveys/index.cgi?f=VS&art_id=905356873&rel=true
Oppenheim, A. N. (1992). Questionnaire design, interviewing and attitude measurement. NewYork: Pinter Publishers.
Paolo, A. M., Bonamino, G. A., Gibson, C., Patridge, T., & Kallail, K. (2000). Response ratecomparisons of e-mail and mail-distributed student evaluations. Teaching and Learning inMedicine, 12, 81–84.
Pereira, J., Bruera, E., & Quan, H. (2001). Palliative care on the net: An electronic survey ofhealth care professionals. Journal of Palliative Care, 17, 41–45.
Preece, J., Rogers, Y., & Sharp, S. (2002). Interaction design: Beyond human-computer interaction.New York: Wiley.
Robson, C. (1993). Real world research. Oxford, England: Blackwell.Rogers, E. (1987, February). Progress, problems and prospects for network research: Investigating
relationships in the age of electronic communication technologies. Paper presented at the Sun-belt Social Networks Conference, Clearwater Beach, FL.
Schaefer, D. R., & Dillman, D. A. (1998). Development of standard e-mail methodology: Re-sults of an experiment. Public Opinion Quarterly, 62, 378–397.
Schillewaert, N., Langerak, F., & Duhamel, T. (1998). Non-probability sampling for wwwsurveys: A comparison of methods. Journal of the Market Research Society, 4, 307–313.
Schwarz, N. (1999). Self-reports: How the questions shape the answers. American Psycholo-gist, 54, 93–105.
Schwarz, N., & Sudman, S. (1996). Answering questions: Methodology for determining cognitiveand communicative processes in survey research. San Francisco: Jossey-Bass.
Sheehan, K. B. (2001). E-mail survey response rates: A review. Journal of Computer MediatedCommunication, 6(2). Retrieved August 23, 2003, fromhttp://www.ascuse.org/jcmc/vol6/issue2/sheehan.html
Sheehan, K. B., & Hoy, M. B. (1999). Using e-mail to survey internet users in the UnitedStates: Methodology and assessment. Journal of Computer Mediated Communication, 4(3).Retrieved August 23, 2003, from http://www.ascuse.org/jcmc/vol4/is-sue3/sheehan.html
Sheehan, K. B., & McMillan, S. J. (1999). Response variation in e-mail surveys: An explora-tion. Journal of Advertising Research, 39(4), 45–54.
Electronic Survey Methodology 209

Shniederman, B. (1998). Designing the user interface: Strategies for effective human–computer in-teraction. Reading, MA: Addision-Wesley.
Slaughter, L., Norman, K. L., & Shneiderman, B. (1995, March). Assessing users’ subjective sat-isfaction with the information system for youth services (ISYS). Paper presented at the VA TechProceedings of Third Annual Mid-Atlantic Human Factors Conference, Blacksburg, VA.
Smith, C. B. (1997). Casting the net: Surveying an internet population. Journal of ComputerMediated Communication. Retrieved August 23, 2003, fromhttp://www.ascuse.org/jcmc/vol3/issue1/smith.html
Sohn, C. (2001). Validity of web-based survey in IS related research as an alternate to mail survey.Paper presented at the Seventh Americas Conference on Information Systems, Boston,MA.
Stanton, J. M. (1998). An empirical assessment of data collection using the internet. PersonnelPsychology, 51, 709–726.
Taylor, H. (2000). Does internet research work? Comparing electronic survey results withtelephone survey. International Journal of Market Research, 42(1), 51–63.
Tuten, T. L., Bosnjak, M., & Brandilla, W. (2000). Banner–advertised web-based surveys. Mar-keting Research, 11(4), 17–21.
Walsh, J. P., Kiesler, S., Sproull, L. S., & Hess, B. W. (1992). Self-selected and randomly se-lected respondents in a computer network survey. Public Opinion Quarterly, 56, 241–244.
Watt, J. H. (1999). Internet systems for evaluation research. In G. Gay & T. L. Bennington(Eds.), Information technologies in evaluation: Social, moral epistemological and practical impli-cations (pp. 23–44). San Francisco: Josey-Bass.
Weible, R., & Wallace, J. (1998). The impact of the internet on data collection. Marketing Re-search, 10(3), 19–23.
Witmer, D. F., Colman, R. W., & Katzman, S. L. (1999). From paper-and-pencil toscreen-and-keyboard. In S. Jones (Ed.), Doing internet research: Critical issues and methodsfor examining the net (pp. 145–162). Thousand Oaks, CA: Sage.
Witte, J. C., Amoroso, L. M., & Howard, P. E. N. (2000). Research methodology—Method andrepresentation in internet-based survey tools—Mobility, community, and cultural iden-tity in survey 2000. Social Science Computer Review, 18, 179–195.
Yun, G. W., & Trumbo, C. W. (2000). Comparative response to a survey executed by post,e-mail, & web form. Journal of Computer Mediated Communication, 6(1). Retrieved August23, 2003, from http://www.ascuse.org/jcmc/vol6/issue1/yun.html
Zhang, Y. (2000). Using the internet for survey research: A case study. Journal of the AmericanSociety for Information Science, 51, 57–68.
210 Andrews, Nonnecke, Preece

Related Documents