E E l l e e c c t t r r o o n n i i c c M M o o n n i i t t o o r r i i n n g g i i n n C C a a n n a a d d a a James Bonta Suzanne Wallace-Capretta Jennifer Rooney Solicitor General Canada May 1999 This report is also available on the Solicitor General Canada’s Internet Site http://www.sgc.gc.ca

Welcome message from author
This document is posted to help you gain knowledge. Please leave a comment to let me know what you think about it! Share it to your friends and learn new things together.
Transcript

EElleeccttrroonniicc MMoonniittoorriinngg
iinn CCaannaaddaa
James Bonta Suzanne Wallace-Capretta
Jennifer Rooney
Solicitor General Canada
May 1999
This report is also available on the Solicitor General Canada’s Internet Site http://www.sgc.gc.ca

Public Works and Government Services Canada 1999 Cat No. JS4-1/1999-01 ISBN 0-662-64255-4

Electronic Monitoring in Canada
ACKNOWLEDGEMENTS A number of people deserve recognition for their contribution toward the successful completion of this evaluation project. Without their on-going cooperation this report would not have been possible. First, our thanks to Diana Doherty, Tyson Sawchuck and Nadina Ouaida who were the principal research contractors in this project. From British Columbia, we would like to extend our appreciation to Brian Mason, Jim Cairns, Robert Watts, Tim Trytten, Karen Abrahamson, Matt Lang, Mark Coleman, Doug Godfrey, Dudley Mathieson, Al Riou and the staff from the EMP offices and Correctional Centres. As well, we would like to express our appreciation to Terry Lang, Rhonda Everson, Dana Wilkins, Bonnie Boulding, Carol Fiedelleck, Peter Guenther, Palmer Svaren, Wanita Koczka, Eileen Gorman, Karen Rust and the staff from Saskatchewan Community Corrections offices and Correctional Centres. Thanks to Marvin McNutt, Wanda Lundrigan, John Scoville, Mary Ennis, George Head, Bernardus Stroomer, Tom Mahoney as well as, the Probation, Institution and LRP staff in Newfoundland. Finally, thanks to Kevin McAnoy for his help coding the recidivism data.
(I)

Electronic Monitoring in Canada
(II)
Electronic Monitoring in Canada
TABLE OF CONTENTS
ACKNOWLEDGEMENTS......................................................................................................I
EXECUTIVE SUMMARY .................................................................................................... V
CHAPTER I. INTRODUCTION............................................................................................. 1
The Promise of Technology for Effective Offender Supervision..................................1 Does EM Widen the Net? ..............................................................................................3 Does EM Reduce Recidivism? ......................................................................................5 A Cost-Effective Alternative? .......................................................................................7 The Role of Treatment ...................................................................................................9
CHAPTER II. THE THREE PROVINCIAL EM PROGRAMS .............................................. 11
Data Collection Methodology......................................................................................11 Newfoundland: Highlights from the Interim Report (April, 1998) .............................14 Saskatchewan: Highlights from the Interim Report (January, 1998) ..........................17 British Columbia: Highlights from the Interim Report (April, 1997) .........................19
CHAPTER III. CLIENT SELECTION AND PROGRAM PROCESSES ................................... 21
The EM Offenders .......................................................................................................22 Program Processes .......................................................................................................26
CHAPTER IV. PROGRAM EFFECTIVENESS..................................................................... 39
What Factors Relate to Program Success? ..................................................................39 Recidivism ...................................................................................................................42 The Effectiveness of Sanctions: EM vs Probation vs Prison.......................................46 The Newfoundland Treatment Program ......................................................................49
CHAPTER V. GENERAL SUMMARY AND CONCLUSIONS ................................................ 53
REFERENCES................................................................................................................... 55
(III)

Electronic Monitoring in Canada
(IV)
Electronic Monitoring in Canada
EXECUTIVE SUMMARY Electronic monitoring (EM) is a relatively recent innovation intended to enhance
compliance with house arrest. Offenders are placed under community supervision with
the condition that they stay in their homes with some exceptions to attend work or other
legitimate activities. Electronic monitoring equipment, often in the form of bracelets
worn about the ankle, emit signals to a computer within the correctional agency ensuring
knowledge about the offender’s whereabouts. The goals of electronic monitoring
programs vary. Some programs seek a less costly diversion of offenders from
imprisonment and others look to reduce the risk of re-offending.
EM programs were first established in the United States in the 1980s and their use
has spread to other countries around the world. In Canada, EM programs are in operation
in four provinces. The present evaluation focused on EM in three provinces: British
Columbia (B.C.), Saskatchewan and Newfoundland. Although the three provinces used
similar equipment, how the programs operated varied across location. Two of the
programs (B.C. and Newfoundland) are corrections based, selecting sentenced inmates
from area prisons. The EM program in Saskatchewan is court based where the judge
places offenders on probation with a condition of electronic monitoring. Differences also
exist in terms of supervision and treatment requirements. EM offenders in B.C. are
supervised by institutional correctional officers while probation officers provide the
supervision in the other provinces. In Newfoundland, EM offenders are required to attend
an intensive treatment program offered in the community.
(V)
Electronic Monitoring in Canada
Many of the evaluations reported in the literature are plagued by the lack of
adequate comparison groups and controls for offender risk and needs. As a result, there is
evidence suggesting that many EM programs widen the correctional net. That is, they
target relatively low risk offenders who would function well without the additional
controls imposed by EM. The present evaluation not only used comparison groups of
inmates and probationers, but also introduced controls for offender risk. Thus, we were in
a position to investigate the impact of EM, and treatment, on offender recidivism.
Whether the EM program was corrections or court based, there was no
relationship to program completion. Successful completion of EM ranged from 86% to
89% across the three provinces. Although the general type of EM program was not
important in terms of program completion, it did have an effect on how offenders and
staff viewed EM. Offenders who were supervised by probation officers had more
favourable views of the staff than the offenders supervised by correctional officers. EM
offenders from all three sites also felt that EM benefited them and that the program would
prevent them from returning to crime. On the other hand, staff was quite sceptical of the
program and its impact on offenders.
The longer term impact of EM was evaluated using one year, post-conviction
information. Comparisons with inmates and probationers, after controlling for offender
risk and needs, found that EM had no effect on recidivism. That is, the recidivism rates
were comparable for all three groups. Considering that the EM offenders and
probationers had similar recidivism rates, the results support the conclusion that EM
programs tend to have a net-widening effect. The one potential benefit of EM was that it
(VI)
Electronic Monitoring in Canada
appeared to enhance attendance in treatment. In Newfoundland, offenders who were on
EM were more likely to stay in treatment than probationers without an EM condition.
The general offender rehabilitation literature strongly suggests that structured,
cognitive-behavioural rehabilitation programs are effective in reducing recidivism. The
compulsory treatment program required for EM offenders in Newfoundland was
independently evaluated and found to be a promising treatment program. An effect for
treatment was found when considering the risk levels of the offenders. That is, for the
higher risk offenders who received treatment the recidivism rate was 31.6%. For the high
risk offenders who did not receive treatment that rate was 51.1%.
There are two general findings that have important implications for policy and
practice. First, we found no evidence that EM has a more significant impact on
recidivism than the less intrusive, and less costly, correctional measure of probation.
Thus, the “value added” of EM programs appears limited. Second, cognitive-behavioural
treatment programming targeting higher risk offenders (not necessarily the highest risk)
was associated with significant reductions in offender recidivism. Continued support of
treatment programs for higher risk offenders, perhaps married with EM to increase
treatment attendance, is suggested.
(VII)

Electronic Monitoring in Canada
(VIII)
Electronic Monitoring in Canada
CHAPTER I. INTRODUCTION During the 1980s and early 1990s, like many countries, Canada experienced
significant prison population growth. Between 1989 and 1995, the prison population
grew by 22% in federal penitentiaries and 12% in provincial prisons (Canada, 1996).
Internationally, Canada imprisons 129 individuals per 100,000 population. Although this
rate is less than that of the United States (645/100,000), it is higher than the rates found
in many European countries. For example, the incarceration rate in Norway was 84 per
100,000 in 1996 (Canada, 1998). Concerns over high incarceration rates and their
associated costs have spurred many governments to seek ways to decrease prison
populations or at least manage their growth.
Numerous suggestions have been made, and tried, in attempts to manage
correctional population growth. They range from decriminalising certain acts to
noncarceral sentencing options. Over the past two decades, governments have intensified
their search for effective alternatives to incarceration. One relatively recent innovation
has been the electronic monitoring of offenders in the community.
The Promise of Technology for Effective Offender Supervision
The first report of the use of electronic monitoring in the supervision of an
offender was in 1984. Apparently inspired by a Spiderman cartoon, Judge Jack Love
from New Mexico ordered the placement of an electronic device on the ankle of an
offender to ensure his whereabouts (Fox, 1987). Essentially, electronic monitoring (EM)
began as a method to enforce house arrest because it permitted the monitoring of the
(1)
Electronic Monitoring in Canada
offender from a remote location. Today, the technology allows a number of options for
monitoring the offender. A computer can dial the telephone in an offender’s home at
random intervals in order to confirm his/her location. An alarm can sound if the offender
strays out of range from the base unit in the home. Video cameras can be mounted near
the telephone to verify visual contact and offenders can even provide breathalyser tests to
ensure compliance with drug and alcohol abstinence conditions. The role of the private
sector in providing the technology and the inherent competition for business will
undoubtedly bring new possibilities.
Early uses of EM were limited to the monitoring and supervision of probationers.
However, by 1989 probationers represented only one-quarter of the clientele. The
majority of offenders in EM programs were inmates for whom EM offered a less costly
sanction than incarceration. The use of EM has grown significantly. A 1989 U.S. survey
(Renzema & Skelton, 1990) found 37 states using EM with 6,490 offenders on the
program on any given day. The United Kingdom and other European countries have also
introduced EM (Mortimer & May, 1997).
The first Canadian use of EM was in British Columbia (British Columbia
Corrections Branch, 1995). It began as a pilot program in Vancouver (1987) and it was
intended to provide a less costly alternative to incarceration for selected offenders. By
1992, EM was available throughout the province except in the most sparsely populated
areas. In 1996, the EM program managed 300 offenders on an average day. Early reports
of the program suggested that it produced a cost savings (compared to incarceration) and
that it provided a number of benefits to the offender (Mainprize, 1992, 1995).
(2)
Electronic Monitoring in Canada
Undoubtedly, the British Columbia experience influenced other provinces. EM
programs were introduced in Saskatchewan in 1990 and Newfoundland in 1994. The
Yukon Territory has EM as an option, but it has never been used. More recently Ontario
introduced an EM program in 1996. Ontario had earlier experimented with EM in 1989
but abandoned the program partly because an evaluation found it not to be cost-effective.
Does EM Widen the Net?
The original intention of EM was to enforce house arrest. Gradually it became a
community-based alternative to incarceration. That is, offenders who would normally be
imprisoned could instead be placed into an EM program. One of the major issues in any
alternative to incarceration program is the possibility that the offenders given the “new”
alternative would have received a community sanction were it not for the program
(Nuffield, 1997). Consequently, the alternative sanction would not represent a true
alternative. Rather, it would actually increase the costs of corrections.
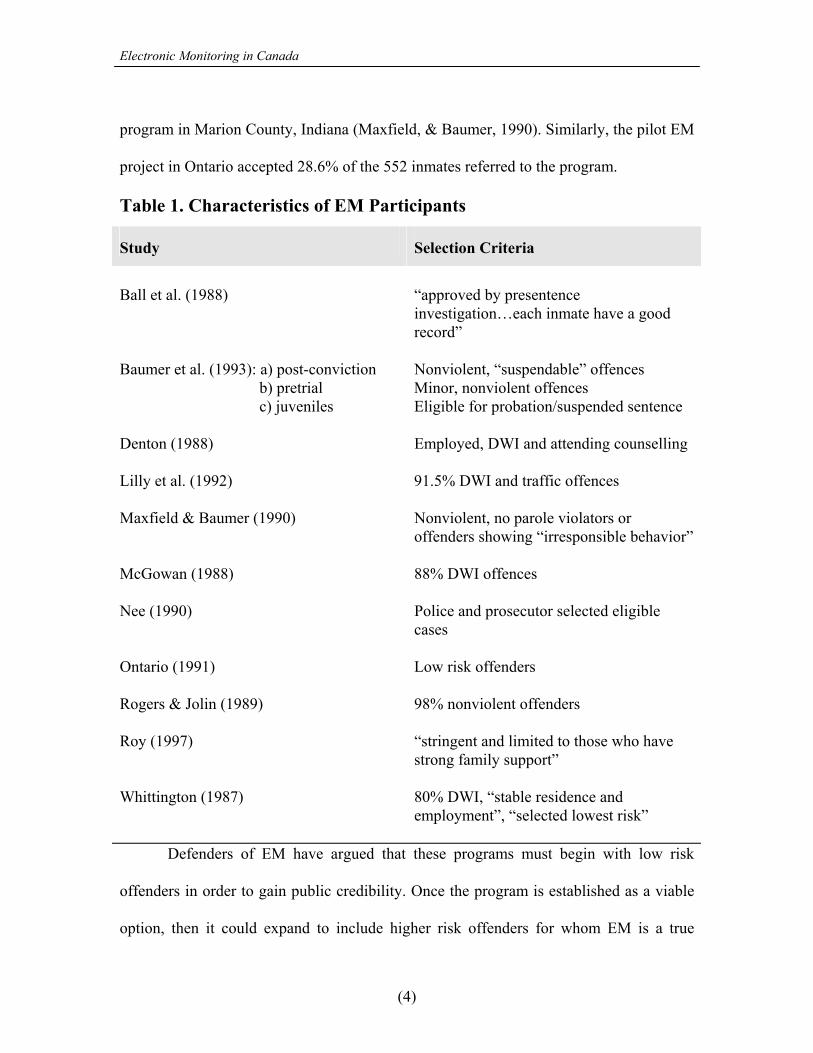
A cursory review of the characteristics of offenders and program eligibility
criteria reveals a portrait of an alternative program that seems to target relatively low risk
offenders (see Table 1). Most programs exclude offenders who have a record of violence,
which is understandable considering public sentiment. However, there are additional and
sometimes, stringent screening criteria. For example, some programs deal almost
exclusively with offenders convicted of impaired driving offences (Lilly et al., 1992;
McGowan, 1988). The eligibility criteria often screen out from EM programs many
offenders. For example, of 1,088 referrals, only 216 (19.9%) were accepted into the EM
(3)
Electronic Monitoring in Canada
program in Marion County, Indiana (Maxfield, & Baumer, 1990). Similarly, the pilot EM
project in Ontario accepted 28.6% of the 552 inmates referred to the program.
Table 1. Characteristics of EM Participants
Study Selection Criteria
Ball et al. (1988) “approved by presentence
investigation…each inmate have a good record”
Baumer et al. (1993): a) post-conviction Nonviolent, “suspendable” offences b) pretrial Minor, nonviolent offences c) juveniles Eligible for probation/suspended sentence Denton (1988) Employed, DWI and attending counselling Lilly et al. (1992) 91.5% DWI and traffic offences Maxfield & Baumer (1990) Nonviolent, no parole violators or
offenders showing “irresponsible behavior” McGowan (1988) 88% DWI offences Nee (1990) Police and prosecutor selected eligible
cases Ontario (1991) Low risk offenders Rogers & Jolin (1989) 98% nonviolent offenders Roy (1997) “stringent and limited to those who have
strong family support” Whittington (1987) 80% DWI, “stable residence and
employment”, “selected lowest risk” Defenders of EM have argued that these programs must begin with low risk
offenders in order to gain public credibility. Once the program is established as a viable
option, then it could expand to include higher risk offenders for whom EM is a true
(4)
Electronic Monitoring in Canada
alternative to incarceration. The evidence on changes in offender profile with time is
unconvincing. To illustrate, Pride, Inc. is one of the largest and longest running EM
programs in the world. Lilly, Ball, Curry and McMullen (1993) examined changes in the
types of offenders who went through the program over a seven year period. There was a
decrease in the proportion of DWI offenders (from 67.4% to 53.7%), but this was offset
by an increase in offenders convicted of driving under suspension (24.5% to 53.7%).
Overall, traffic and liquor offenders comprised 94.2% of the EM participants at the
beginning of the program and 91.7% seven years later.
To summarise, the prevalence of low risk offenders in the EM programs described
in the literature suggest a net-widening effect. There is very little evidence that EM has
provided a true alternative to incarceration. If this is true in the general case, then these
findings also have implications for the cost-effectiveness issue discussed later in this
report.
Does EM Reduce Recidivism?
As with most criminal justice sanctions, there is the expectation that a reduction
in re-offending will occur. Evaluating the impact of EM programs on recidivism has
been extremely problematic. First of all, to the best of our knowledge, there are only
three studies that approximate an experimental methodology with random assignment
(Cullen, Wright, & Applegate, 1996). Secondly, there are very few evaluations with
appropriate comparison groups. The majority of reports on EM are limited to descriptions
of outcome without any comparison groups. The results from these reports are difficult to
(5)
Electronic Monitoring in Canada
interpret since so many of the programs deal with low risk offenders (Table 1). Thus, the
high program completion and low recidivism rates reported by these studies may simply
reflect the low risk nature of the offenders and not the impact of the program –
Petersilia’s (1988) “cream puff” factor.
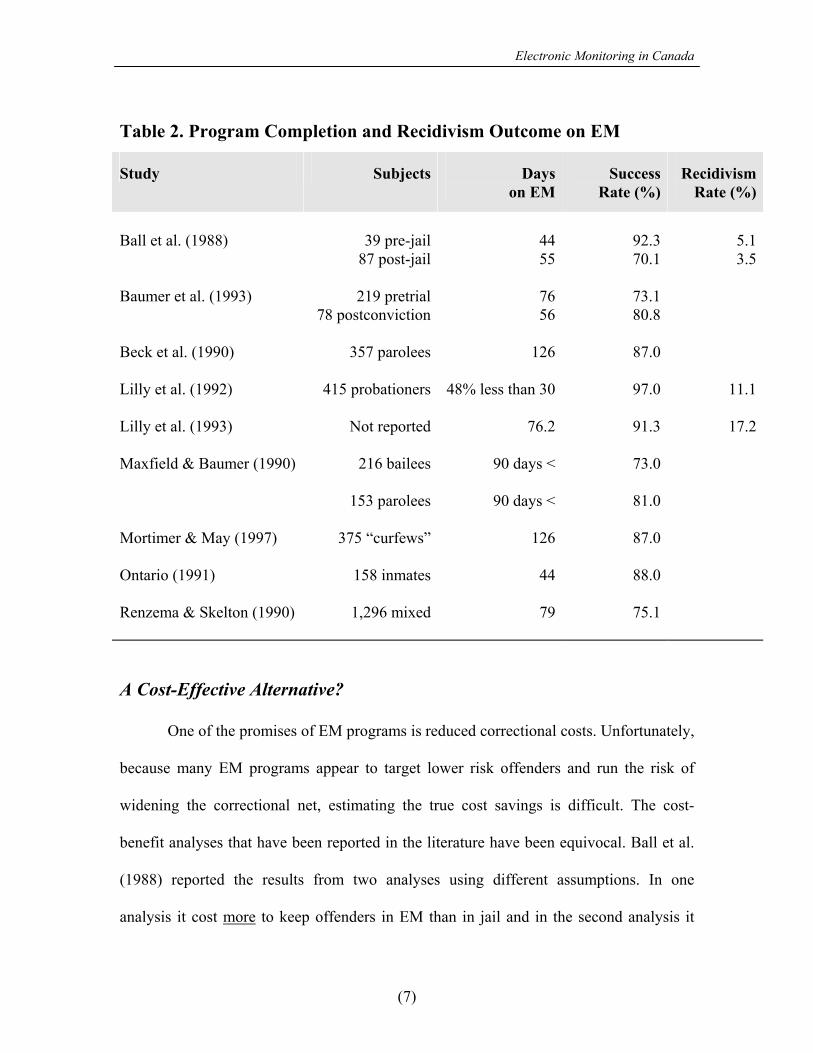
Table 2 presents the results of studies that report any outcome data. We are quite
generous here, including studies that have questionable comparisons and outcome
measures. Unfortunately, with respect to the recidivism results, none of the studies
specified the length of follow-up preventing any meaningful interpretation of this
information. This summary sketch serves to highlight the poor methodological quality of
most EM evaluations. The table also highlights another major problem with interpreting
the success of EM. It is the problem of short program duration. In most EM programs, the
offenders participate for periods of less than three months. For example, McGowan
(1988) found an average stay of 36 days in EM. In the Pride program (Lilly et al., 1992),
78% of the offenders were serving sentences of less than three months. Such short stays
increase the likelihood that even higher risk offenders may complete the program without
incident. Thus, for a number of reasons, the high program success rates are misleading
and difficult to interpret.
(6)
Electronic Monitoring in Canada
Table 2. Program Completion and Recidivism Outcome on EM
Study Subjects Dayson EM
SuccessRate (%)
RecidivismRate (%)
Ball et al. (1988) 39 pre-jail 44 92.3 5.1 87 post-jail 55 70.1 3.5 Baumer et al. (1993) 219 pretrial 76 73.1 78 postconviction 56 80.8 Beck et al. (1990) 357 parolees 126 87.0 Lilly et al. (1992) 415 probationers 48% less than 30 97.0 11.1 Lilly et al. (1993) Not reported 76.2 91.3 17.2 Maxfield & Baumer (1990) 216 bailees 90 days < 73.0 153 parolees 90 days < 81.0 Mortimer & May (1997) 375 “curfews” 126 87.0 Ontario (1991) 158 inmates 44 88.0 Renzema & Skelton (1990) 1,296 mixed 79 75.1
A Cost-Effective Alternative?
One of the promises of EM programs is reduced correctional costs. Unfortunately,
because many EM programs appear to target lower risk offenders and run the risk of
widening the correctional net, estimating the true cost savings is difficult. The cost-
benefit analyses that have been reported in the literature have been equivocal. Ball et al.
(1988) reported the results from two analyses using different assumptions. In one
analysis it cost more to keep offenders in EM than in jail and in the second analysis it
(7)
Electronic Monitoring in Canada
cost less. The Ontario pilot project cost $216,000 more than incarceration (Ontario,
1991). Mainprize (1992) observed that the original plans for the British Columbia
program called for five officers to supervise 150 offenders. However, the Vancouver
pilot project had five officers supervising 25 offenders. It was estimated that a province
wide implementation to supervise 175 offenders would require 44 additional officers.
A serious problem with many cost-effectiveness analyses is the calculation of the
per diem incarceration costs. The typical estimate is based upon the costs of staffing,
meals, clothing and other services. Thus, the “cost” for incarcerating an offender often
exceeds $100 per day. However, once an institution is staffed and operating, the cost for
incarcerating an additional individual drops dramatically. Staff salaries account for the
majority of the expenses in operating an institution. Once staffing costs are fixed, any
additional costs are limited to food, clothing and services. These added costs may
amount to only a fraction of the average annual costs. Only if new facilities are not
constructed or existing ones closed, can significant cost savings be realised.
Related to the potential cost-savings is the impact of EM on incarcerated
populations. To produce significant cost-savings, EM programs must impact on the size
of the custodial population (Lilly, 1992). In many studies, the proportion of offenders in
EM programs to the prison population has been typically too small to have an impact.
The stringent eligibility criteria for many programs limit the potential for EM to have an
influence on the imprisoned population. Sometimes, even the voluntary nature of the
programs has led to bizarre situations. For example, in an evaluation of a program in
Kentucky, some offenders refused EM knowing that they would be released early
because of overcrowding in the jail (Ball et al., 1988).
(8)
Electronic Monitoring in Canada
The possibility that EM may not offer an inexpensive alternative is evidenced by
the widespread use of user fees in the United States. Approximately two-thirds of EM
programs in America require offenders to contribute financially to the programs. Slightly
more than half of the programs charged between $100 and $300 in monthly fees rising as
high as $450. In Kentucky, monthly fees were calculated based upon a maximum of
“25% of the offender’s net weekly household income” (Ball et al., 1988, p. 82). Although
most jurisdictions have policies that may waive the fees, it is unclear as to how often fees
are waived.
Most importantly, arguments for the cost-effectiveness of EM programs are
usually based upon comparisons to incarcerated offenders. Without controls for offender
risk, such comparisons misinform policy-makers and the public. If significant proportions
of EM participants are low risk offenders (recall Table 1), it is possible for these
offenders to conduct themselves successfully in the community without the additional
controls imposed by EM. Therefore, a more appropriate comparison may be probationers,
or at the very least, inmates who are matched on offender risk level to the EM
participants.
The Role of Treatment
For most intermediate sanctions, offender treatment services have been rarely
considered (Cullen et al., 1996). In the case of EM, the problem of providing treatment is
compounded by a number of factors. First, because EM is a method for ensuring house
arrest, the movement of offenders is restricted. This can create obstacles in taking
(9)
Electronic Monitoring in Canada
advantage of available treatment programs. For example, Nee (1990) found that over
50% of the offenders in their EM program were confined to their houses for over 16
hours per day.
Also mitigating against the delivery of treatment services are the conflicting
thoughts about how EM programs control criminal behaviour. Two views are typically
presented. The most frequent opinion is that EM is a deterrent. Like any other sanction,
punishment controls the behaviour and therefore, offender treatment is not necessary. The
second view, advocated by Ball and Lilly (1986) is that EM is actually rehabilitative. By
being forced to stay at home and supposedly out of trouble, the offender is able to
“internalize incentives for good behavior”. Other than isolating offenders from criminal
associates, it is difficult to see how being at home in some sort of quiet reflection will
help resolve such typical offender problems as substance abuse and unemployment.
In summary, treatment programming is rarely a feature of EM. The reasons for
this state of affairs are many. The fact remains that there is no compelling evidence from
the EM literature or the general literature that correctional sanctions without a direct
service component will lead to lowered recidivism (Cullen et al., 1996; Gendreau, Cullen
& Bonta, 1994). Rather, some reviews of the literature suggest that sanctions by
themselves are associated with increased recidivism (Andrews & Bonta, 1998).
(10)
Electronic Monitoring in Canada
CHAPTER II. THE THREE PROVINCIAL EM PROGRAMS Three provinces participated in the evaluation of their EM programs: British
Columbia (B.C.), Saskatchewan, and Newfoundland. Although all three programs used
very similar equipment (ankle bracelets with centralised computer monitoring), they
differed in client targeting and program operation. The variation in EM programs made it
possible to evaluate whether the type of client, how they were supervised, and the
correctional context were important for the effectiveness of EM supervision. In order to
document these variations, an extensive range of information was collected and interim
reports for each province were completed. The interim reports did not combine
information across provinces nor did they include recidivism information. This section
summarises the general methodology and findings from the interim reports.
Data Collection Methodology
Standardised procedures and data collection instruments were applied across all
three sites. The offenders and staff completed a number of questionnaires (copies of the
questionnaires are available upon request). For the offenders, there were three sets of
questionnaires. The first questionnaire, called the Self-Report Questionnaire (SRQ),
asked offenders about their criminal history and personal-social situation. Where
possible, the information was verified with official records. Information from the 78 item
SRQ was used to calculate risk-need scores for the Level of Service Inventory – Revised
(LSI-R; Andrews & Bonta, 1995) and the Manitoba Risk-Needs classification instrument
(Bonta, Parkinson, Pang, Barkwell, & Wallace-Capretta, 1994). Both of these risk-needs
(11)
Electronic Monitoring in Canada
instruments have demonstrated empirical validity in the risk-needs classification of
offenders. Motiuk, Motiuk and Bonta (1992) have also shown that reliable offender risk-
needs information can be derived from the paper and pencil SRQ. The calculation of
offender LSI-R and Manitoba Risk-Needs scores permitted an empirically based
assessment of the risk and needs level of offenders under supervision. With this
information, we were in a position to evaluate whether EM had an effect on recidivism
after controlling for offender risk-needs scores.
The second questionnaire asked offenders to describe their views of the EM
program (e.g., what were the benefits of the program, whether it caused them hardships,
etc.). The third set of questions asked about the offenders’ relationship and their views
regarding the supervising officers. The supervising staff completed a parallel set of
questionnaires on how they saw the program and their views of the offenders’
performance on the program. Participation was voluntary and the information was for
research purposes only. Compliance rates were relatively high. For example, for the SRQ
compliance rates ranged from 73.2% in B.C. to nearly 100% in Newfoundland. Offenders
returned their questionnaires in sealed envelopes that were collected by research staff.
The offenders completed the SRQ at the beginning of EM placement. The remaining two
questionnaires concerning the program were completed by the offenders and the officers
at the end of the placement. Whenever possible, offenders who violated EM conditions
and were returned to prison completed the “exit” questionnaires in prison.
Offenders also agreed to have their correctional and program files reviewed by
research staff. Some of the file review information was used to corroborate the SRQ and
provide additional information about the offenders and their program experience. Except
(12)
Electronic Monitoring in Canada
for Saskatchewan, where a small sample of female offenders participated (n = 26), all the
EM offenders were males. The present report is based on only the 262 male offenders.
For each provincial site, a prison comparison sample was constructed (total sample size
of 240). Efforts were made to select the inmates using the EM eligibility criteria from the
particular province. The inmates completed the SRQ only and they gave permission to
have their files reviewed. In Newfoundland and Saskatchewan, information on 30
probationers (without EM supervision) was collected. All sets of questionnaires, with
slight modifications, were given to the probationers.
Finally, the EM program in Newfoundland required the offenders to attend an
intensive and highly structured treatment program. This program received an independent
assessment as to how closely the treatment program followed the principles of effective
offender rehabilitation. The participants in the treatment program also completed a
questionnaire concerning their views of treatment and their counsellors.
Data collection began in late 1995 and, in the case of Newfoundland, continued to
September 1997. Post-program recidivism information was gathered from the R.C.M.P.’s
Criminal History records as well as provincial records (court and correctional).
Recidivism was defined as a reconviction within one year of program completion. During
the course of conducting the post-program follow-up, we found that 25 offenders from
B.C. had changed their original group status from the prison comparison sample to the
EM program. Part way through the project, the province implemented a recruitment drive
for the EM program and 25 inmates from the original prison comparison group were
subsequently placed into EM. As a result, we re-assigned these 25 offenders into the EM
group for this report. Thus, only SRQ and some file information were available for these
(13)

Electronic Monitoring in Canada
offenders explaining some of our missing data. The interim report on the program in B.C.
did not account for this shift in group membership. Therefore, the results comparing EM
offenders with the prison comparison group reported in the interim report no longer
apply.
The final group membership for all three provinces is shown in Table 3.
Newfoundland had the smallest EM program, and with the mandatory treatment
requirement, yielded the fewest number of subjects. The probation samples from
Newfoundland and Saskatchewan were small and the results from these comparisons
should be interpreted with caution.
Table 3. Group Membership by Province
Group
Province EM Probation Prison
Newfoundland 56 17 100
British Columbia 125 - 75
Saskatchewan 81 13 65
Total 262 30 240
Newfoundland: Highlights from the Interim Report (April, 1998)
The EM program in Newfoundland was established in November 1994. When the
study began, EM was limited to the city of St. John’s. EM in Newfoundland is a
corrections based program. Nonviolent offenders, of moderate risk to re-offend, were
drawn from the local prison and placed on temporary absences with an electronic
(14)
Electronic Monitoring in Canada
monitoring condition. (Low risk offenders were given temporary absences without EM).
In addition to EM surveillance, the program participants were required to participate in
the Learning Resources Program (LRP) provided by the John Howard Society of
Newfoundland. The LRP is an intensive treatment program offering nine hours per week
of group, cognitive-behavioural programming. The major treatment targets are substance
abuse and anger management. Individual counselling related to employment and other
personal needs are provided in addition to the group programs.
The Newfoundland program was the smallest of the three provinces and it had
difficulty filling the groups offered by the LRP. As a result, the treatment program was
also opened to offenders under regular probation orders. A small sample of 17 male
probationers volunteered to participate in the research.
In March 1996, Dr. Paul Gendreau from the University of New Brunswick
conducted an independent assessment of the LRP using the Correctional Programs
Assessment Inventory (CPAI). The CPAI (Gendreau & Andrews, 1996) is a structured
approach to evaluating how well a program corresponds with what is known about
effective offender rehabilitation. In the absence of direct information about a program’s
impact on recidivism, the CPAI provides an estimate as to how successful the program
may be in reducing recidivism. Programs are assessed along a number of categories (e.g.,
client assessment, staff characteristics, etc.) identified by research to be associated with
reduced recidivism. The results of the assessment of the LRP placed the program in the
top 10% of 230 programs evaluated using the CPAI. Thus, there was reason to believe
that the programming aspects of the LRP were reasonable and potentially effective.
(15)
Electronic Monitoring in Canada
Fifty-six male offenders were placed in the EM program and all but two attended
the LRP (these two offenders were fully employed and therefore, they were not available
to attend treatment). Slightly more than half (56.3%) of the offenders fell in the medium
and high classification ranges of the LSI-R. Consequently, the EM program did not
appear to have a significant net-widening effect and the program was relatively
successful in targeting those offenders that it was designed to manage. Despite the fact
that most participants in the EM program were moderate to high risk, successful program
completion rates were high. EM offenders averaged 72 days in the program and 87.5%
completed the program without committing a new offence or a serious breach of
conditions. This completion rate was significantly higher than for the probationers who
attended the LRP (52.9%; χ2 = 7.09, p < .01). Although the probation sample size was
quite small (n = 17), the results suggested that the additional requirements of EM and
perhaps the threat of a return to prison for non-cooperation ensured that the EM offenders
completed the program.
Upon leaving the program, offenders, probation and treatment staff completed
questionnaires on their views of EM and the LRP. The offenders did not find EM very
disruptive to their lives and 86.2% of them thought that the EM program would keep
them away from crime (only 10-15% of the staff felt that EM would have a long-term
effect on recidivism). Similarly, when asked about the lasting effects of treatment, 14%
of the probation officers thought that treatment would be effective in avoiding recidivism.
Surprisingly, only 20% of the LRP staff thought that treatment would reduce recidivism.
(16)
Electronic Monitoring in Canada
These pessimistic estimates by staff may reflect the relative newness of the programs
(both EM and LRP) and uncertainty about their impact.
Finally, offenders gave very favourable ratings to probation and treatment staff.
Slightly more than 70% of the offenders rated their probation officer as “interested in
helping me”. Eighty per cent of the offenders endorsed this statement when asked about
their treatment staff. Two-thirds of the offenders felt that the treatment staff “gave me
real help” (only 37.5% of the offenders felt this way about their probation officers). In
summary, the EM program, together with the LRP, were viewed as a beneficial
experience by the offenders.
Saskatchewan: Highlights from the Interim Report (January, 1998)
The EM program in Saskatchewan is court based. That is, the Court places
offenders on intensive probation with a condition of electronic monitoring. Although
probation sentences can last up to three years, the EM condition usually does not last
longer than six months. EM began as a pilot project in 1990 and by 1996, EM was
available to the courts across the province. At the time of the study, the Saskatchewan
EM program was the second largest in the country. There were approximately 90
offenders in the program on any given day.
Data were collected on 81 male and 26 female offenders sentenced to the program
in three sites (Regina, Saskatoon and Prince Albert). Also available to the courts was an
Intensive Probation Supervision (IPS) program, which was very similar to the EM
program. Placement into the two programs was at the discretion of the Court, supervision
(17)
Electronic Monitoring in Canada
was conducted by probation officers, and in both programs the supervision was more
intensive than traditional probation. The major difference was that one program included
EM. As a result, information was also collected on a small sample of 16 IPS offenders
(13 males and 3 females).
The IPS offenders scored higher on the risk-needs scales than offenders in the EM
program. This finding was surprising because we expected the EM offenders, who were
under more restrictions, to represent a higher risk group of offenders. In addition, nearly
30% of the EM offenders were classified low risk by the LSI-R and the Manitoba Risk-
Needs scale. Together, these two findings led to the conclusion that in Saskatchewan, EM
widened the correctional net. To lend further support to this conclusion, we found
program success rates did not improve with the electronic monitoring option. The
findings, although not statistically significant, actually went in the opposite direction.
Probationers without electronic monitoring showed higher success rates than probationers
in the EM program (93.8% vs 84.0%).
There was some evidence, however, that EM successfully targeted subgroups of
moderate risk offenders. Saskatchewan has Canada’s highest incarceration rate of
Aboriginal offenders. One of the goals of the EM program in the province is to target
Aboriginal and female offenders and provide them with an alternative to incarceration. In
this regard, a significant proportion of EM participants was of Aboriginal origin and they
tended to be higher risk than the non-Aboriginal offenders in the program. Thus, the EM
program appeared to function as an alternative to incarceration for Aboriginal offenders.
Similar findings were found with the female offenders in the EM program. The women
(18)
Electronic Monitoring in Canada
scored higher on the risk-needs scales than the men suggesting that were it not for the
EM program, these women would likely have been incarcerated.
On average, the probationers under electronic surveillance spent 20 weeks in the
program and were seen weekly by their supervising officer. When the EM participants
were asked about the program and their supervising probation officer, the responses were
generally positive. Over ninety per cent (92.6%) of the offenders described their
probation officers as providing “real help” and 88.6% said that they felt their probation
officer understood their problems. Finally, the offenders were more optimistic that the
program would help them to avoid further crime than the probation officers (85.4% vs
40.6%).
British Columbia: Highlights from the Interim Report (April, 1997)
British Columbia was the first province to establish an electronic monitoring
program (1987) and it has become the largest program in Canada. The average daily
count on the program often exceeded 300 offenders. The program is corrections based.
However, unlike the EM program in Saskatchewan and Newfoundland, there is no
particular effort to target moderate risk offenders or to require treatment attendance. The
criteria for participation are: a) minimum risk to the community, b) nonviolent, and c) no
more than four months remaining in his/her sentence.
One hundred male offenders participated in the study (this number increases to
125 as we explained earlier in this report). The offenders all came from the Fraser region
and were fairly representative of EM offenders across the province. As the eligibility
(19)
Electronic Monitoring in Canada
criteria for the EM program were quite restrictive, the possibility of a net-widening effect
was increased. Thus, it was not surprising to find some evidence to support a conclusion
of a net-widening effect. Approximately 25% of the EM participants were classified
minimum risk offenders and the average length of time in the program was the shortest of
all three provinces: 37.3 days (n = 125). Although the successful program completion
rate was high (89.3%), the relatively low risk sample and short stay on the program could
explain this finding.
Unlike the EM programs in Newfoundland and Saskatchewan, the supervising
staff in British Columbia was re-assigned to community supervision duties from their
positions within prisons. That is, most EM supervisors were correctional officers rather
than probation officers. The supervising staff was quite pessimistic about the crime
control benefits of the EM program. Only 8% of staff felt that the program would prevent
future crime. Offenders, on the other hand, were more optimistic of the crime prevention
benefits of EM with 59.8% saying that they were unlikely to commit further crime.
Added to this was the finding that 53.6% of the offenders reported that their supervising
officers did not provide any “real help”.
(20)
Electronic Monitoring in Canada
CHAPTER III. CLIENT SELECTION AND PROGRAM PROCESSES The interim reports focused on the preliminary findings specific to the province
where the program operated. Only cursory, across province comparisons were made. A
few comparisons were made to the probationers but none to the inmate samples. These
comparisons are important to evaluate EM relative to other forms of correctional control.
Finally, one year post-program recidivism information became available. The present
report combines the data across sites and includes an analysis of the impact of EM on
recidivism. Therefore, we are in a better position to evaluate the relative merits of the
different EM programs.
All three programs shared electronic surveillance as a method for supervising
offenders in the community, but they also had some unique features. Although there may
have been some unmeasured influences specific to a site, the major differences among
sites allowed us to address some of the following questions:
Does net-widening occur?
Does it matter whether the offenders are referred from corrections or the
courts?
What is the effect of using probation officers as opposed to correctional
officers for supervising EM offenders?
Does treatment add value to the EM program?
Does EM have an effect on recidivism after the monitoring stops?
Answers to these questions are presented in this report.
(21)
Electronic Monitoring in Canada
The EM Offenders
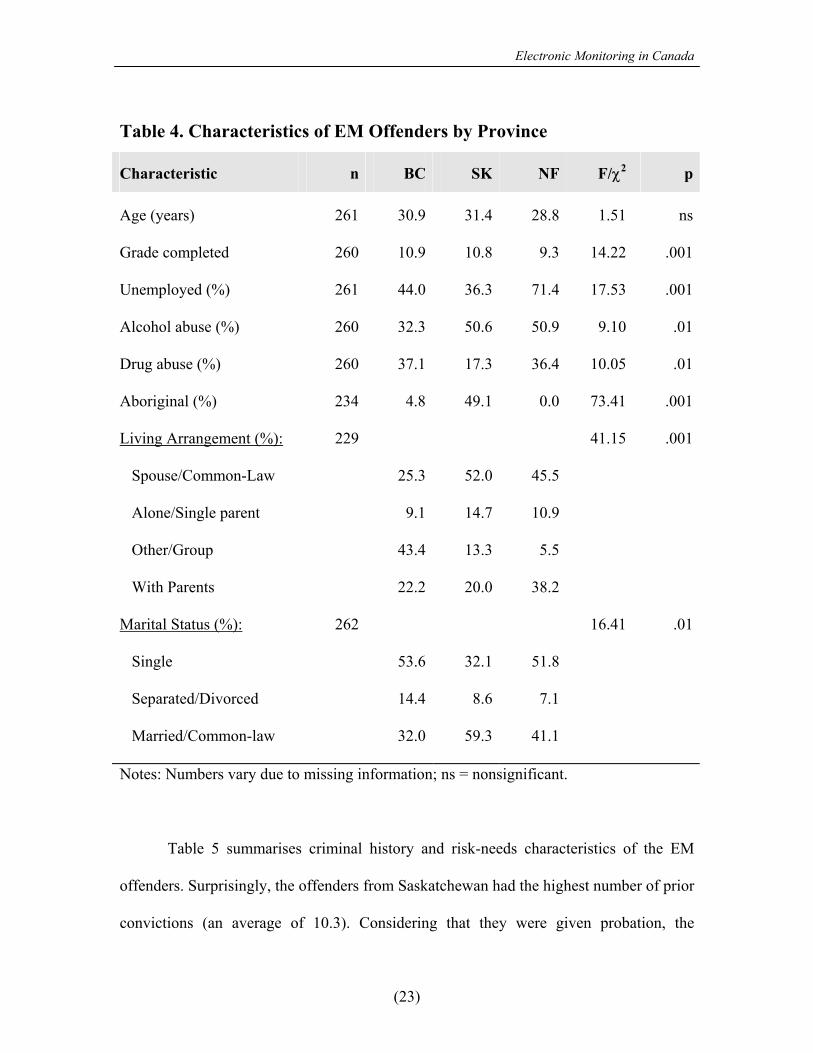
Information was collected on 262 offenders who participated in the EM programs
from the three provinces. There was considerable variability in the personal-demographic
characteristics of the EM offenders across the three provinces (Table 4). The offenders
from Newfoundland showed the lowest levels of social achievement and relatively high
levels of substance abuse. Their unemployment rate was 71.4% and the average grade
completed in school was 9.3. Half of the offenders in the Newfoundland program
reported problems with alcohol abuse and 36.4% had a current drug abuse problem. The
EM participants from Saskatchewan had the lowest rates of drug abuse (17.3%) and most
were married or living common-law (59.3%). Moreover, 49.1% of the offenders for
whom we had ethnicity information were of Aboriginal origins (including Métis).
(22)
Electronic Monitoring in Canada
Table 4. Characteristics of EM Offenders by Province
Characteristic n BC SK NF F/χ2 p
Age (years) 261 30.9 31.4 28.8 1.51 ns
Grade completed 260 10.9 10.8 9.3 14.22 .001
Unemployed (%) 261 44.0 36.3 71.4 17.53 .001
Alcohol abuse (%) 260 32.3 50.6 50.9 9.10 .01
Drug abuse (%) 260 37.1 17.3 36.4 10.05 .01
Aboriginal (%) 234 4.8 49.1 0.0 73.41 .001
Living Arrangement (%): 229 41.15 .001
Spouse/Common-Law 25.3 52.0 45.5
Alone/Single parent 9.1 14.7 10.9
Other/Group 43.4 13.3 5.5
With Parents 22.2 20.0 38.2
Marital Status (%): 262 16.41 .01
Single 53.6 32.1 51.8
Separated/Divorced 14.4 8.6 7.1
Married/Common-law 32.0 59.3 41.1
Notes: Numbers vary due to missing information; ns = nonsignificant.
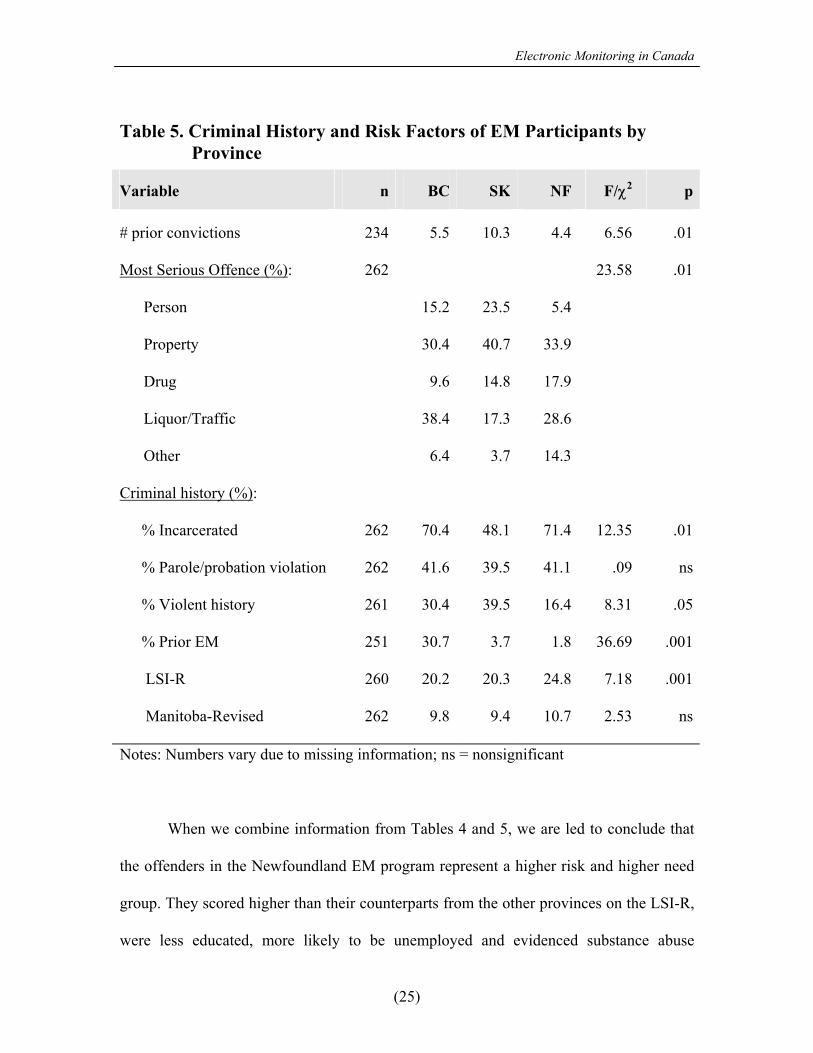
Table 5 summarises criminal history and risk-needs characteristics of the EM
offenders. Surprisingly, the offenders from Saskatchewan had the highest number of prior
convictions (an average of 10.3). Considering that they were given probation, the
(23)
Electronic Monitoring in Canada
condition of EM may have been viewed as an added control needed to deal with these
offenders in the community rather than in prison. It is also possible that the offenders
who were in the EM program in Saskatchewan may have had a less serious criminal
history. For example, the Saskatchewan EM participants had the fewest number of prior
incarcerations (48.1%). With respect to the type of offence committed, the B.C. offenders
showed the highest rates of liquor/traffic offences (38.4%) whereas the offenders in
Newfoundland demonstrated the lowest rates of crimes against person (5.4%).
Interestingly, three out of ten (30.7%) offenders in the B.C. program had been in the
electronic monitoring program before.
The most important finding shown in Table 5 is that the offenders in the
Newfoundland EM program were higher risk, as measured by the LSI-R, than the
offenders from the other two provinces. The results from the Revised Manitoba Risk-
Needs instrument, although in the expected direction, did not differentiate the three
groups at a statistically significant level. The reason for this is probably because the
Manitoba classification instrument has a smaller range of scores (0 – 22) than the LSI-R
(0 – 54) and therefore, it is less capable of making finer distinctions among groups.
(24)
Electronic Monitoring in Canada
Table 5. Criminal History and Risk Factors of EM Participants by Province
Variable n BC SK NF F/χ2 p
# prior convictions 234 5.5 10.3 4.4 6.56 .01
Most Serious Offence (%): 262 23.58 .01
Person 15.2 23.5 5.4
Property 30.4 40.7 33.9
Drug 9.6 14.8 17.9
Liquor/Traffic 38.4 17.3 28.6
Other 6.4 3.7 14.3
Criminal history (%):
% Incarcerated 262 70.4 48.1 71.4 12.35 .01
% Parole/probation violation 262 41.6 39.5 41.1 .09 ns
% Violent history 261 30.4 39.5 16.4 8.31 .05
% Prior EM 251 30.7 3.7 1.8 36.69 .001
LSI-R 260 20.2 20.3 24.8 7.18 .001
Manitoba-Revised 262 9.8 9.4 10.7 2.53 ns
Notes: Numbers vary due to missing information; ns = nonsignificant
When we combine information from Tables 4 and 5, we are led to conclude that
the offenders in the Newfoundland EM program represent a higher risk and higher need
group. They scored higher than their counterparts from the other provinces on the LSI-R,
were less educated, more likely to be unemployed and evidenced substance abuse
(25)
Electronic Monitoring in Canada
problems at least equal to offenders from the other two provinces. At the other end of the
spectrum, EM participants in B.C. appeared to be the lowest risk group of EM offenders.
Their similarities to the Saskatchewan group (similar risk-needs scores, age, grade, and
employment status) raise the possibility that a non-custodial alternative would have been
sufficient for many of these offenders. This possibility is explored further later in this
report.
Program Processes
The three EM programs investigated in this study had some very fundamental
differences in their operation. Two programs (B.C. and Newfoundland) were corrections
based and one was court based (Saskatchewan). In Saskatchewan and Newfoundland, the
EM offenders were supervised by probation officers and in B.C. they were supervised by
correctional officers assigned to work in the community. The Newfoundland program
specifically targeted moderate risk offenders and required the offenders to attend a
structured, intensive treatment program. The average length of time that the offender was
in the program also varied across provinces. The offenders in Saskatchewan had the
longest time in EM (139.3 days), followed by Newfoundland (71.6 days) and B.C. (37.3
days; F (2, 254) = 151.91, p < .001). All of these factors, along with others, can
influence the experiences of offenders and how they and staff viewed the program. In
turn, these program processes and “consumer” perceptions can potentially impact on
program outcome.
(26)
Electronic Monitoring in Canada
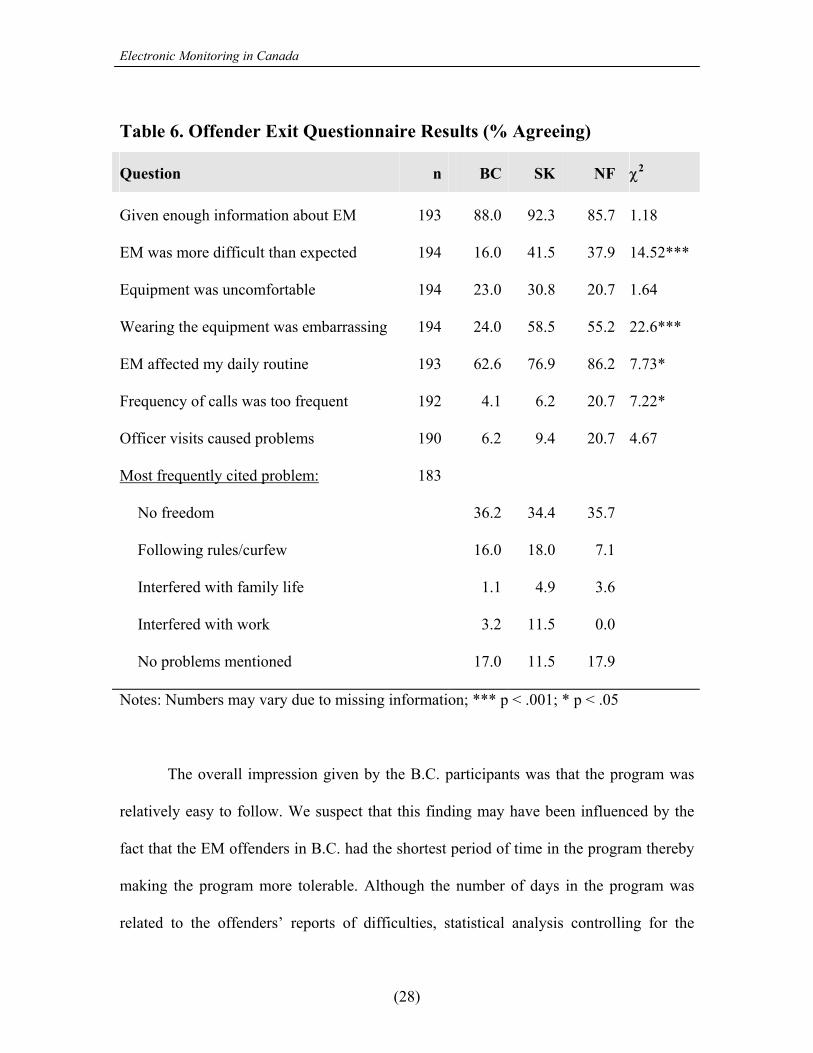
Offenders’ Views of EM. Upon completion of electronic monitoring, or if failed
and imprisoned, the offenders were asked to complete a series of questions asking them
about the program. The results from the exit questionnaires are shown in Table 6. In
general, the offenders who participated in the EM programs reported that they were given
sufficient information about EM prior to their placement. When questions were asked
about the inconveniences caused by the program, offenders from B.C. reported the least
amount of dissatisfaction. Only 16% found EM to be more difficult than expected,
considerably less than in the other provinces (41.5% in Saskatchewan and 37.9% in
Newfoundland). The B.C. participants also reported less embarrassment with wearing the
equipment and fewer disruptions in daily routines.
(27)
Electronic Monitoring in Canada
Table 6. Offender Exit Questionnaire Results (% Agreeing)
Question n BC SK NF χ2
Given enough information about EM 193 88.0 92.3 85.7 1.18
EM was more difficult than expected 194 16.0 41.5 37.9 14.52***
Equipment was uncomfortable 194 23.0 30.8 20.7 1.64
Wearing the equipment was embarrassing 194 24.0 58.5 55.2 22.6***
EM affected my daily routine 193 62.6 76.9 86.2 7.73*
Frequency of calls was too frequent 192 4.1 6.2 20.7 7.22*
Officer visits caused problems 190 6.2 9.4 20.7 4.67
Most frequently cited problem: 183
No freedom 36.2 34.4 35.7
Following rules/curfew 16.0 18.0 7.1
Interfered with family life 1.1 4.9 3.6
Interfered with work 3.2 11.5 0.0
No problems mentioned 17.0 11.5 17.9
Notes: Numbers may vary due to missing information; *** p < .001; * p < .05
The overall impression given by the B.C. participants was that the program was
relatively easy to follow. We suspect that this finding may have been influenced by the
fact that the EM offenders in B.C. had the shortest period of time in the program thereby
making the program more tolerable. Although the number of days in the program was
related to the offenders’ reports of difficulties, statistical analysis controlling for the
(28)
Electronic Monitoring in Canada
length of time in the program still found the B.C. offenders reporting the fewest problems
with EM.
EM programs are often thought to provide benefits beyond cost savings for
institutions. The vast majority of the offenders reported positive attitudes toward the EM
program. When given the statement “electronic monitoring was a fair program for me”,
90.1% agreed (responses ranged from 84.6% in Saskatchewan to 94.9% in B.C.). In
addition, 90.6% reported that EM was a “good correctional program” and 85.7% said that
they would recommend the program to other offenders.
Almost all of the EM participants (95.3%) saw personal benefits resulting from
their participation. The offenders were asked to rate various advantages of the program.
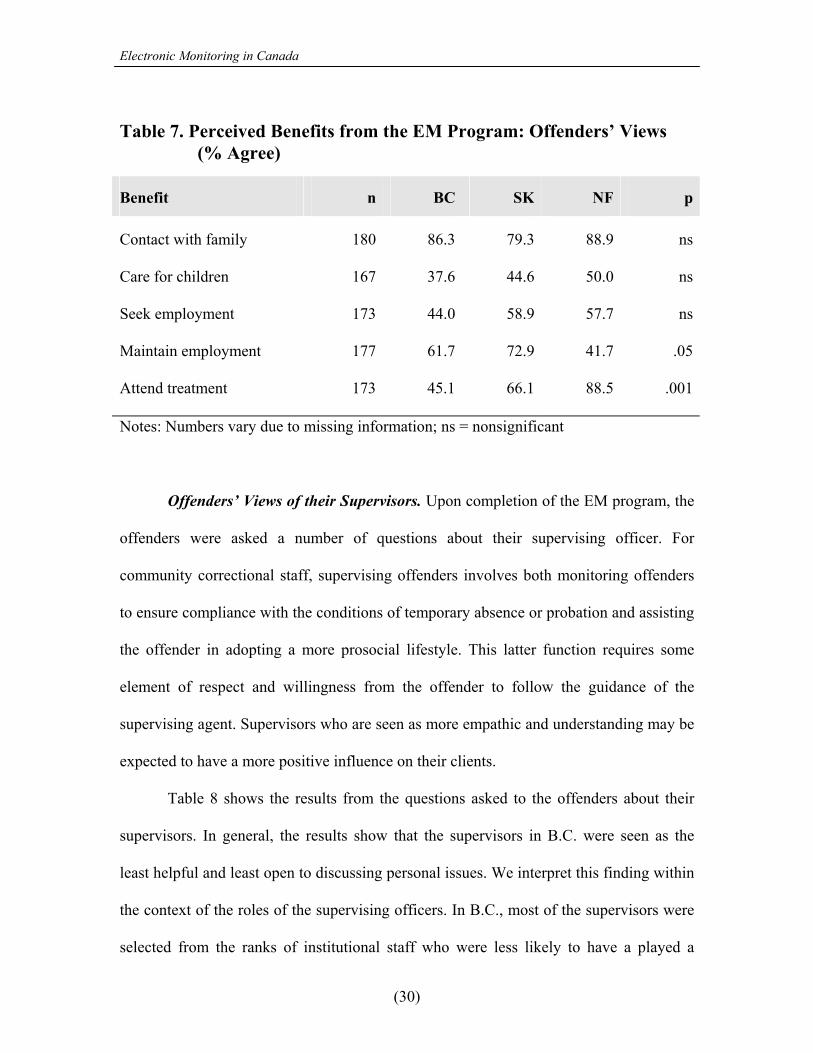
The results are shown in Table 7. Maintaining contact with the family was the most
frequently endorsed benefit from the program regardless of where the program was
given. From the offenders’ perspective this was seen as more important than employment
related activities. Between province differences were found with respect to maintaining
employment and attending treatment. Offenders from the Newfoundland program were
less concerned about EM allowing them to maintain employment compared to the
offenders from the other provinces. This however, may be due partly to the high
unemployment rates for the Newfoundland participants and the fact that the EM program
required attendance at the LRP. As shown in Table 7, the offenders in the Newfoundland
program rated attending treatment as a far more important benefit of the program than did
the offenders in B.C. and Saskatchewan.
(29)
Electronic Monitoring in Canada
Table 7. Perceived Benefits from the EM Program: Offenders’ Views (% Agree)
Benefit n BC SK NF p
Contact with family 180 86.3 79.3 88.9 ns
Care for children 167 37.6 44.6 50.0 ns
Seek employment 173 44.0 58.9 57.7 ns
Maintain employment 177 61.7 72.9 41.7 .05
Attend treatment 173 45.1 66.1 88.5 .001
Notes: Numbers vary due to missing information; ns = nonsignificant
Offenders’ Views of their Supervisors. Upon completion of the EM program, the
offenders were asked a number of questions about their supervising officer. For
community correctional staff, supervising offenders involves both monitoring offenders
to ensure compliance with the conditions of temporary absence or probation and assisting
the offender in adopting a more prosocial lifestyle. This latter function requires some
element of respect and willingness from the offender to follow the guidance of the
supervising agent. Supervisors who are seen as more empathic and understanding may be
expected to have a more positive influence on their clients.
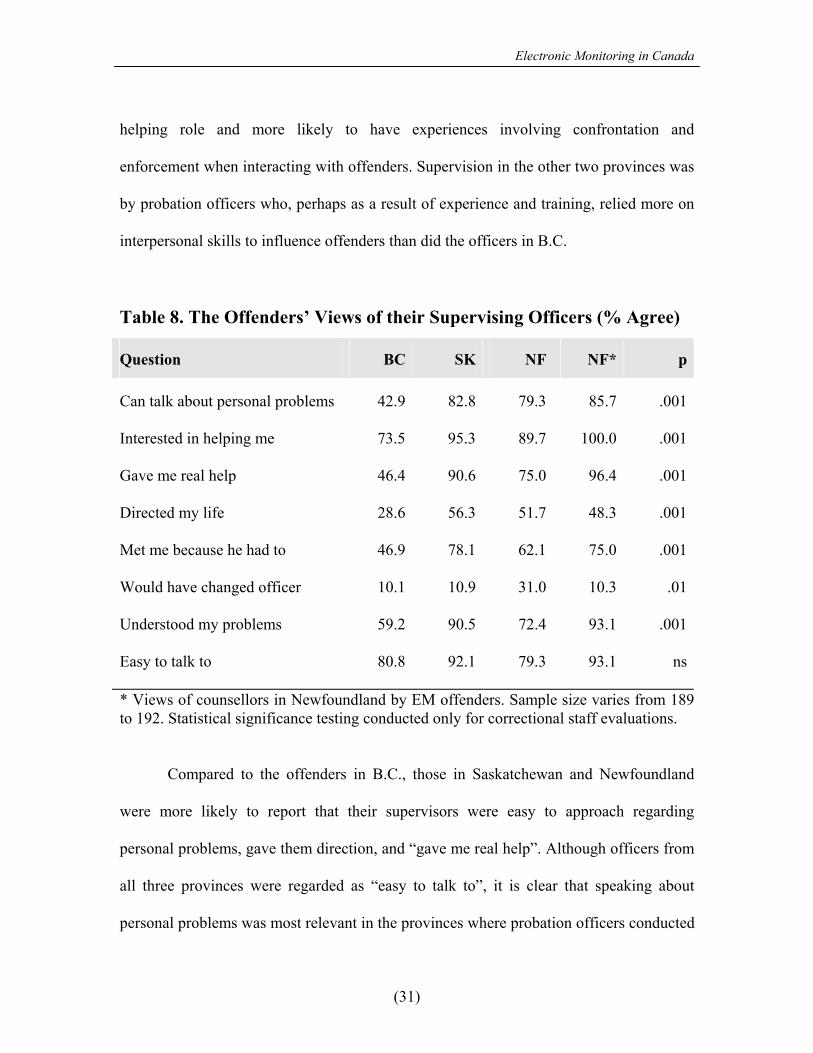
Table 8 shows the results from the questions asked to the offenders about their
supervisors. In general, the results show that the supervisors in B.C. were seen as the
least helpful and least open to discussing personal issues. We interpret this finding within
the context of the roles of the supervising officers. In B.C., most of the supervisors were
selected from the ranks of institutional staff who were less likely to have a played a
(30)
Electronic Monitoring in Canada
helping role and more likely to have experiences involving confrontation and
enforcement when interacting with offenders. Supervision in the other two provinces was
by probation officers who, perhaps as a result of experience and training, relied more on
interpersonal skills to influence offenders than did the officers in B.C.
Table 8. The Offenders’ Views of their Supervising Officers (% Agree)
Question BC SK NF NF* p
Can talk about personal problems 42.9 82.8 79.3 85.7 .001
Interested in helping me 73.5 95.3 89.7 100.0 .001
Gave me real help 46.4 90.6 75.0 96.4 .001
Directed my life 28.6 56.3 51.7 48.3 .001
Met me because he had to 46.9 78.1 62.1 75.0 .001
Would have changed officer 10.1 10.9 31.0 10.3 .01
Understood my problems 59.2 90.5 72.4 93.1 .001
Easy to talk to 80.8 92.1 79.3 93.1 ns
* Views of counsellors in Newfoundland by EM offenders. Sample size varies from 189 to 192. Statistical significance testing conducted only for correctional staff evaluations. Compared to the offenders in B.C., those in Saskatchewan and Newfoundland
were more likely to report that their supervisors were easy to approach regarding
personal problems, gave them direction, and “gave me real help”. Although officers from
all three provinces were regarded as “easy to talk to”, it is clear that speaking about
personal problems was most relevant in the provinces where probation officers conducted
(31)
Electronic Monitoring in Canada
the supervision. An unusual finding was that 31% of the EM offenders in Newfoundland
would have changed officers if they could. Unfortunately, we did not ask the offenders
why they wanted to change officers.
The EM offenders in Newfoundland also had significant contact with treatment
personnel. The offenders were asked similar questions about their counsellors and they
gave highly favourable evaluations (see Table 8). More detailed analysis of the EM
offenders in the Newfoundland treatment program is presented shortly.
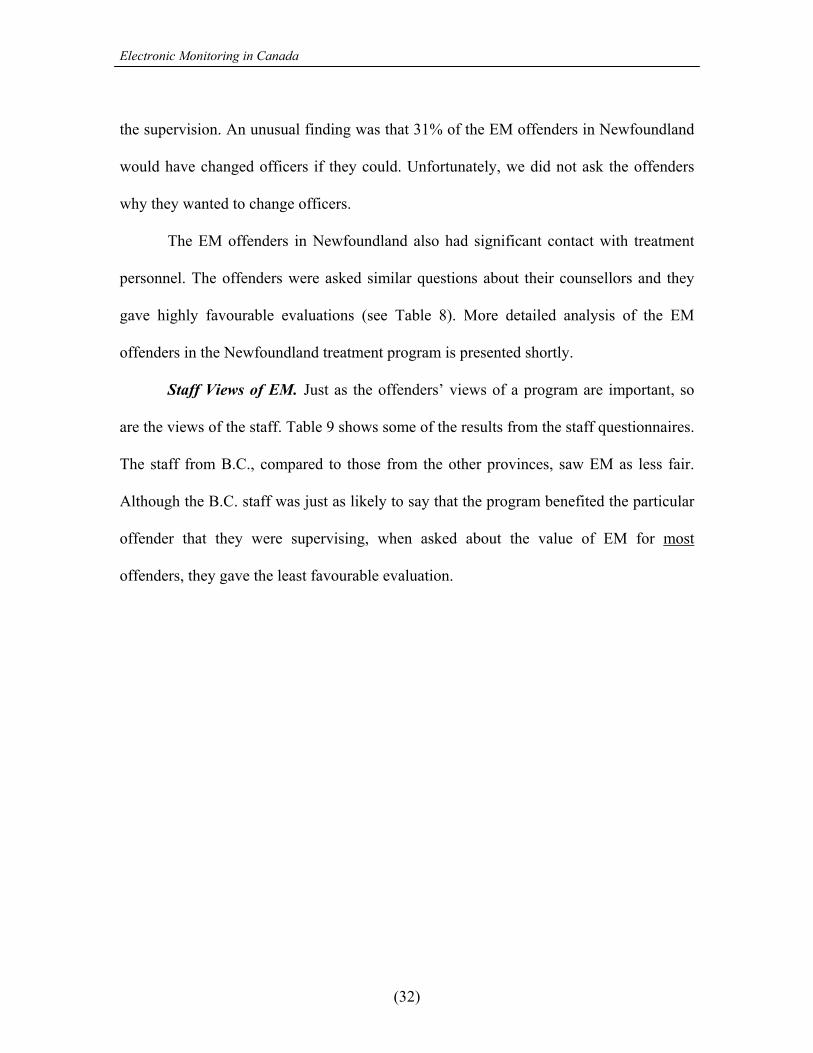
Staff Views of EM. Just as the offenders’ views of a program are important, so
are the views of the staff. Table 9 shows some of the results from the staff questionnaires.
The staff from B.C., compared to those from the other provinces, saw EM as less fair.
Although the B.C. staff was just as likely to say that the program benefited the particular
offender that they were supervising, when asked about the value of EM for most
offenders, they gave the least favourable evaluation.
(32)
Electronic Monitoring in Canada
Table 9. Staff Views of the EM Program (% Agree)
Question n BC SK NF p
For the Offender:
EM is a fair program: Yes 234 73.7 82.3 94.6 .01
No opinion 15.2 6.3 1.8
No 11.1 11.4 3.6
EM benefited the offender: Yes 232 83.0 82.7 82.4 ns
No 17.0 17.3 17.6
In general: * (n) (10) (3) (14)
EM is useful for offenders 70.0 100.0 78.6
Could be implemented with other offenders 50.0 66.7 85.7
* Staff sample size for general questions were too low for statistical testing (n = 27). ns = nonsignificant
Perceptions of EM as Crime Control. Both the EM participants and the
supervising staff was asked whether they thought the program had any crime control
function. Views were elicited on the perceived impact for the participating individual
offender and for offenders in general. The results are displayed in Table 10. The B.C.
offenders were the least likely to perceive EM as having a crime control function for
themselves either while in the program or after completion. When asked whether the
program would control crime for most offenders while in the program, there were no
differences among the participants from the three provinces. However, the B.C.
participants were the most sceptical about the impact of EM for most offenders after
(33)
Electronic Monitoring in Canada
completion of the program. Only 31.9% of the B.C. offenders agreed with the statement
that EM would prevent most offenders from committing crimes after program
completion. In Saskatchewan, 58.3% of offenders and 65.4% of the offenders from
Newfoundland thought that EM would prevent future crime for most offenders (χ2 =
19.82, df = 2, p < .001).
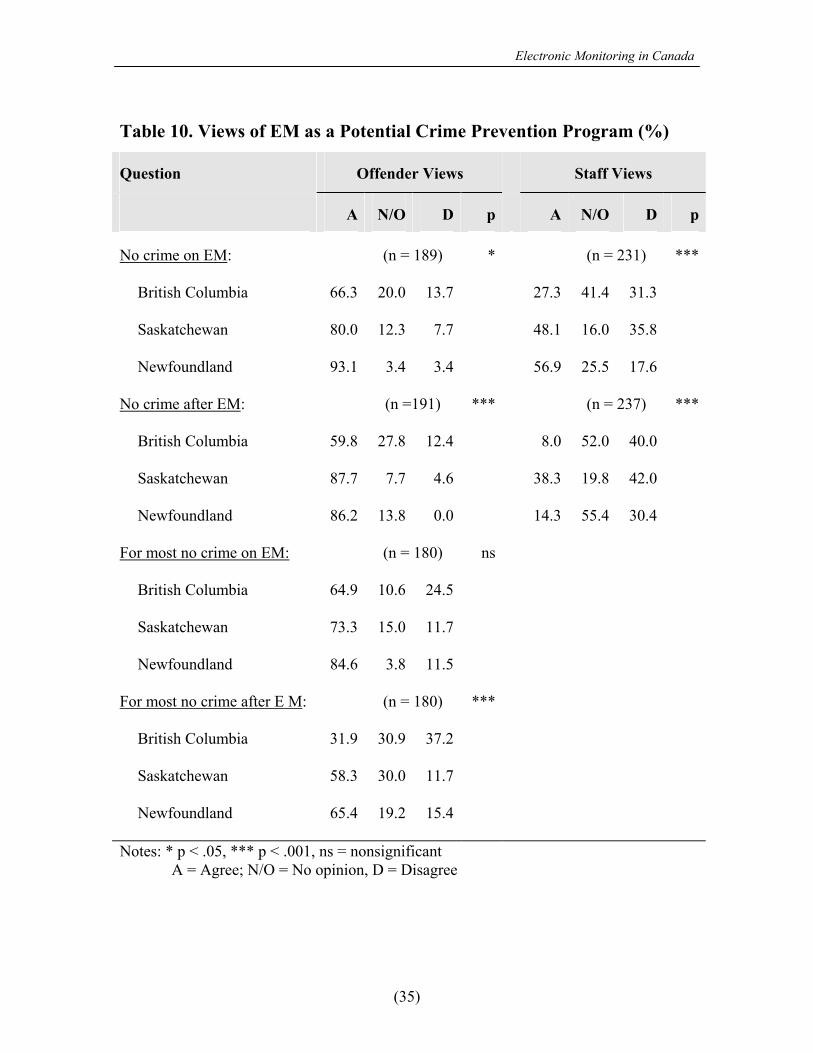
Not only did the B.C. offenders express the most pessimistic assessment of the
crime control potential of the EM program, so too did the supervising staff (see right side
of Table 10). The staff from B.C. felt that only 27.3% of their clients were prevented
from criminal behaviour while in the program. Staff from the other two provinces felt
that the EM program prevented crime for approximately half of their clients. Further,
when asked about the impact of the program after completion, the staff from
Saskatchewan gave the most optimistic rating of 38.3% of their clients unlikely to
commit further crimes. In B.C. and Newfoundland, staff had no opinion in half of their
cases. Twenty-seven supervising staff answered questions about the benefits and
deterrent value of EM for most offenders (not just the specific offender that they were
supervising). At this general level, 77.8% of the staff from the three provinces felt that
EM was useful for offenders but only 37.0% felt that EM is an effective deterrent of
future crime for most offenders.
(34)
Electronic Monitoring in Canada
Table 10. Views of EM as a Potential Crime Prevention Program (%)
Question Offender Views Staff Views
A N/O D p A N/O D p
No crime on EM: (n = 189) * (n = 231) ***
British Columbia 66.3 20.0 13.7 27.3 41.4 31.3
Saskatchewan 80.0 12.3 7.7 48.1 16.0 35.8
Newfoundland 93.1 3.4 3.4 56.9 25.5 17.6
No crime after EM: (n =191) *** (n = 237) ***
British Columbia 59.8 27.8 12.4 8.0 52.0 40.0
Saskatchewan 87.7 7.7 4.6 38.3 19.8 42.0
Newfoundland 86.2 13.8 0.0 14.3 55.4 30.4
For most no crime on EM: (n = 180) ns
British Columbia 64.9 10.6 24.5
Saskatchewan 73.3 15.0 11.7
Newfoundland 84.6 3.8 11.5
For most no crime after E M: (n = 180) ***
British Columbia 31.9 30.9 37.2
Saskatchewan 58.3 30.0 11.7
Newfoundland 65.4 19.2 15.4
Notes: * p < .05, *** p < .001, ns = nonsignificant A = Agree; N/O = No opinion, D = Disagree
(35)
Electronic Monitoring in Canada
Views of the LRP (Treatment). The LRP in Newfoundland is a structured and
intensive treatment program provided to the EM offenders. There are a number of
different components to the program consisting of a foundation group (a pretreatment,
mandatory course), a substance abuse module, anger management training, and a
cognitive skills course. In addition, individual counselling was given to almost all of the
offenders (92.6%). Approximately one-half of the offenders (55.6%) participated in the
anger management group and 75.9% attended the substance abuse program.
The EM offenders attending the LRP were generally approving of the program
and their therapists. Over eighty per cent (82.8%) said that the program was suited to
their needs and no one said that it was “a waste of time”. The offenders (96.4%) felt that
the counsellors gave them “real help” and only five offenders (17.2%) said that they
would change their counsellor if they had the opportunity. Finally, 86.2% agreed with the
statement that the LRP would prevent them from committing crimes in the future.
The treatment staff from the LRP generally agreed that the program was a benefit
to the offender. 88% of the offenders were thought to have benefited from the program.
More specifically, 74.5% of the clients were judged to have profited from the alcohol
counselling and 68.1% from individual counselling. However, when the counsellors were
asked if the program helped to reduce recidivism, there was mixed opinion. For nearly
one-third of the clients (30.8%), staff had no opinion as to whether the LRP prevented
crime while in the program. This rate jumps to 64.7% of the cases when asked if the
program prevents crime in the future for individual clients. This uncertainty mirrored the
answers to the questions about EM’s general impact on recidivism. No opinion was given
for 30.2% of cases regarding the control of crime while in the program and 71.7% for
(36)

Electronic Monitoring in Canada
future recidivism. Yet, staff felt that the LRP coupled with EM would benefit 96.2% of
the cases.
(37)

Electronic Monitoring in Canada
(38)
Electronic Monitoring in Canada
CHAPTER IV. PROGRAM EFFECTIVENESS
In correctional program evaluations, two measures of success have prominence:
1) controlling criminal behaviour while in the program, and 2) controlling criminal
behaviour after completing the program. Programs that perform poorly in controlling in-
program and post-program recidivism fail to meet the public’s expectation of ensuring
community safety. In this report we examined the role of EM programs in meeting the
goals of public safety.
What Factors Relate to Program Success?
Successful completion of EM was defined as completing the program without a
new criminal offence or a breach of conditions serious enough to warrant program
termination. In light of the variability in program operation and delivery (e.g., court vs
corrections based, type of supervisory staff), it was a bit surprising to find no significant
differences in program completion rates among the three provinces. In Newfoundland,
87.5% of the offenders completed the EM program without incident, in B.C. the
completion rate was 89.3%, and in Saskatchewan, 86.3% of the offenders successfully
completed the program.
We undertook a more detailed search for variables, beyond provincial program,
that could be associated with program success/failure. Over 40 variables were tested with
respect to an association with EM program outcome. These variables were taken from
files, the SRQ and the exit questionnaires completed by offenders and staff. The
significant predictors of EM failure are displayed in Table 11.
(39)
Electronic Monitoring in Canada
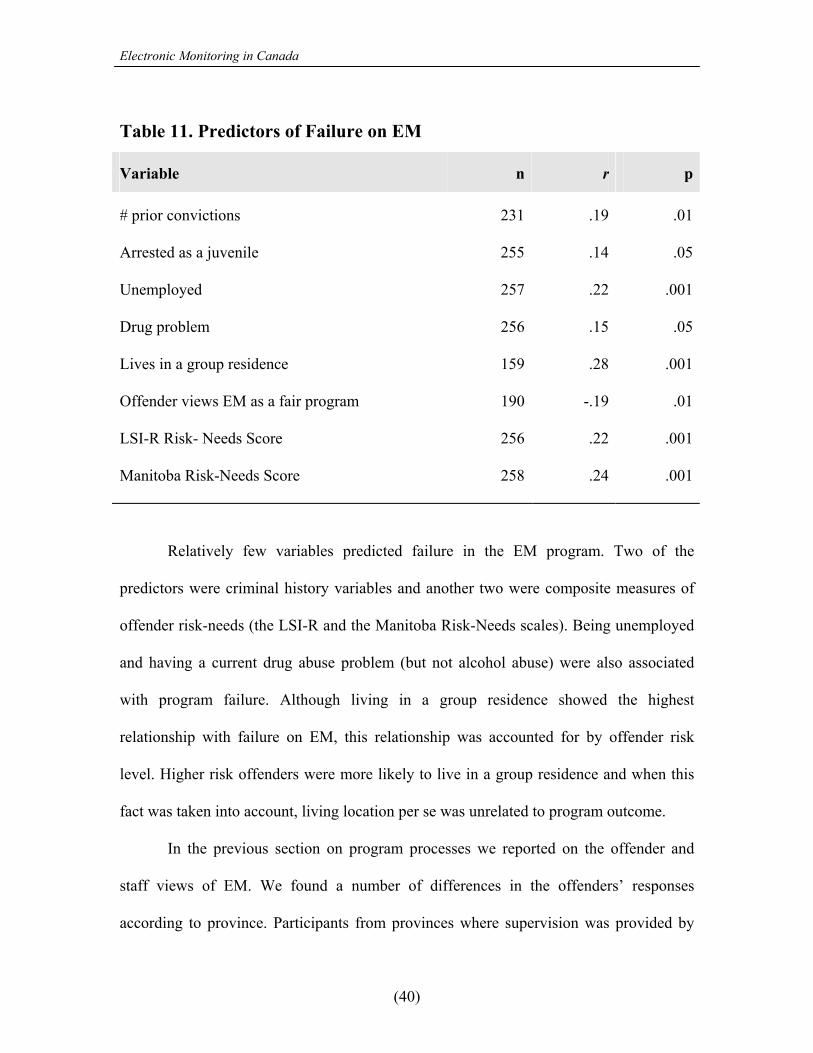
Table 11. Predictors of Failure on EM
Variable n r p
# prior convictions 231 .19 .01
Arrested as a juvenile 255 .14 .05
Unemployed 257 .22 .001
Drug problem 256 .15 .05
Lives in a group residence 159 .28 .001
Offender views EM as a fair program 190 -.19 .01
LSI-R Risk- Needs Score 256 .22 .001
Manitoba Risk-Needs Score 258 .24 .001
Relatively few variables predicted failure in the EM program. Two of the
predictors were criminal history variables and another two were composite measures of
offender risk-needs (the LSI-R and the Manitoba Risk-Needs scales). Being unemployed
and having a current drug abuse problem (but not alcohol abuse) were also associated
with program failure. Although living in a group residence showed the highest
relationship with failure on EM, this relationship was accounted for by offender risk
level. Higher risk offenders were more likely to live in a group residence and when this
fact was taken into account, living location per se was unrelated to program outcome.
In the previous section on program processes we reported on the offender and
staff views of EM. We found a number of differences in the offenders’ responses
according to province. Participants from provinces where supervision was provided by
(40)
Electronic Monitoring in Canada
probation staff, in general, had more favourable views of the staff and the program. An
analysis of these responses, for the most part, were unrelated to program outcome. The
only question that was related to outcome was one that tapped the perceived fairness of
EM. Offenders who viewed the program as unfair were more likely to not complete the
program. Caution is advised in assigning too much relevance to this observation. These
questions were administered at the end of the program after the outcome was known.
Program failures would have been more likely to give a negative evaluation of EM.
The variables that did not reach statistical significance were instructive. Race
(Aboriginal), marital status (single) and relying on welfare were unrelated to program
success/failure. Committing a violent offence also did not predict failure on EM. In
Saskatchewan, eight EM offenders were convicted of sexual offences and all successfully
completed the program. However, once again, offender risk-needs scores were important
when explaining this result. The sex offenders were relatively low risk and low needs
(average score of 15.4 on the LSI-R and 7.0 on the Manitoba instrument).
From the 234 participants for whom we had sufficient information, 163 (69.7%)
received some form of treatment. Treatment, for our purposes, was broadly defined,
ranging from the LRP in Newfoundland to Alcoholics Anonymous. The program success
rate for offenders receiving treatment was actually lower (68.1%) than it was for those
without any documented form of treatment (81.5%). The difference however, was
statistically nonsignificant (χ2 = 2.02). Although the offenders receiving treatment were
higher risk offenders (e.g., 22.9 vs. 17.4 on the LSI-R, df = 230, p < .001), introducing
(41)
Electronic Monitoring in Canada
statistical controls for risk still showed no relationship between general treatment and
program outcome (partial r = -.04).
In summary, offender risk-needs factors showed the most consistent relationship
to program outcome. Whether the program was court driven or corrections based and
whether supervision was provided by probation or correctional staff was unrelated to
program success/failure. When it came to predicting program outcome, knowledge of the
offender’s measured level of risk-needs was the most important factor. The next
important question is whether EM impacts on future recidivism?
Recidivism
Offender recidivism was defined as a new conviction within one year of program
completion. This information was taken from R.C.M.P. Criminal History records and
provincial databases. The recidivism rates one year after completion of the EM program
were similar across provinces. Although Saskatchewan demonstrated the lowest rate,
17.3%, it was statistically no different from the rate in B.C. (30.4%) and Newfoundland
(32.1%). A summary of the predictors of recidivism is shown in Table 12.
(42)
Electronic Monitoring in Canada
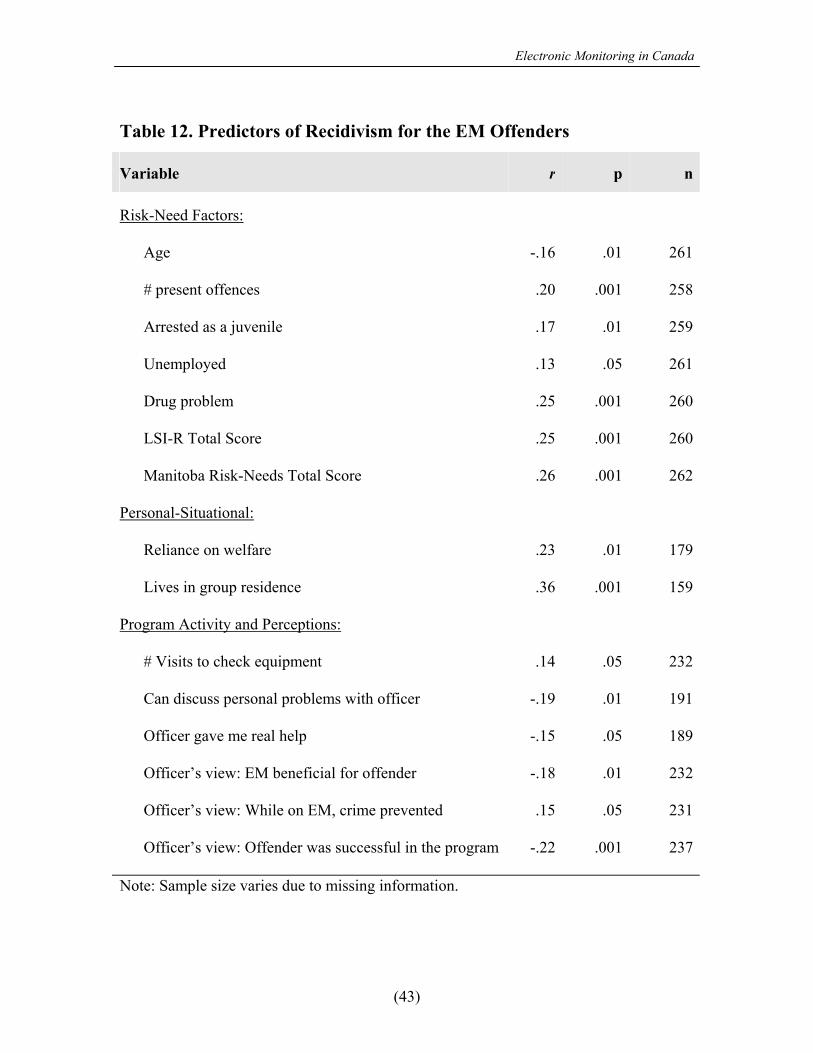
Table 12. Predictors of Recidivism for the EM Offenders
Variable r p n
Risk-Need Factors:
Age -.16 .01 261
# present offences .20 .001 258
Arrested as a juvenile .17 .01 259
Unemployed .13 .05 261
Drug problem .25 .001 260
LSI-R Total Score .25 .001 260
Manitoba Risk-Needs Total Score .26 .001 262
Personal-Situational:
Reliance on welfare .23 .01 179
Lives in group residence .36 .001 159
Program Activity and Perceptions:
# Visits to check equipment .14 .05 232
Can discuss personal problems with officer -.19 .01 191
Officer gave me real help -.15 .05 189
Officer’s view: EM beneficial for offender -.18 .01 232
Officer’s view: While on EM, crime prevented .15 .05 231
Officer’s view: Offender was successful in the program -.22 .001 237
Note: Sample size varies due to missing information.
(43)
Electronic Monitoring in Canada
Three general sets of variables predicted post-program recidivism: 1) offender
risk-needs, 2) personal-situational, and 3) EM program activities and perceptions.
Variables such as age, unemployment and drug abuse are well-established predictors of
recidivism (Gendreau, Little, & Goggin, 1996). These variables are reflected in the
composite measures of offender risk-needs and both the LSI-R and the Manitoba Risk-
Needs instruments showed significant correlations with recidivism (r = .25 and r = .26
respectively). As we found with the prediction of program failure, having committed a
violent offence did not predict recidivism. Moreover, none of the eight sex offenders
recidivated within the one year follow-up.
Reliance on welfare and living in a group residence predicted recidivism with
group residence yielding the highest correlation (r = .36). However, the offenders who
lived in halfway houses and other residential facilities were also higher risk offenders.
After controlling for offender risk-needs, the association between living in a group
residence and recidivism remained statistically significant (r = .29, p < .001).
Two variables directly associated with electronic monitoring predicted
recidivism: the number of visits to check equipment and the length of time on the
program. The recidivists had more visits for equipment checks than the nonrecidivists
(7.3 vs 5.3) and also shorter stays on the program (63.5 days vs 81.0 days). However,
once risk-needs levels were factored into the equations, the relationships disappeared.
That is, higher risk clients were likely checked more frequently. Furthermore, because
higher risk offenders were probably placed into EM later in their sentences and failed at
higher rates than low risk offenders, they consequently spent less time in the program.
(44)
Electronic Monitoring in Canada
The offenders who said that their supervising officers were easy to talk to about
personal problems and gave them “real help” were less likely to recidivate. Research on
behavioural influence has identified the importance of a positive interpersonal
relationship and some level of comfort with the counsellor or therapist (Andrews &
Kiessling, 1980). The present findings support the importance of correctional staff
establishing a relationship with their clientele that is conducive to behavioural change.
Similarly, when staff felt that the program was beneficial to the offender and helped
offenders to avoid crime, the post-program outcome appeared more favourable.
Offender treatment, broadly defined, was not related to recidivism.
Approximately two-thirds (69.7%) of the EM offenders participated in some form of
treatment. However, there were no statistically significant differences in the recidivism
rates between those who received treatment (25.2%) and those who did not (25.4%). As
discussed previously, treatment at this general level included a wide range of programs
(substance abuse, life skills, sex offender treatment, etc.) using different formats (e.g.,
self-help groups, cognitive-behavioural interventions). Therefore, the amorphous nature
of these treatment programs may account for the lack of differences in recidivism. A
more detailed analysis of the impact of treatment is reserved for the examination of the
LRP in Newfoundland.
In summary, when we compared the EM programs from the three jurisdictions we
found no statistically reliable differences in recidivism. Almost all the factors that
predicted recidivism could be reduced to offender risk-needs level. In other words, it did
not matter whether an offender was from the EM program in B.C., Saskatchewan or
Newfoundland. Knowledge of their risk-needs level was sufficient to explain future
(45)
Electronic Monitoring in Canada
recidivism. If the impact of variations in EM programs is almost negligible, does EM add
anything to the more traditional sanctions of imprisonment and probation? The next
section deals with this question.
The Effectiveness of Sanctions: EM vs Probation vs Prison
In most evaluations of the impact of EM on recidivism, comparisons are made to
inmates without any controls for possible differences in offender risk-needs level. In the
present study, we too used an inmate comparison group but with controls for the possible
influence of offender risk-needs level. Also available for comparison was a small sample
of probationers who were not subjected to EM. Consequently, we were in a position to
answer the following questions:
1) Are the recidivism rates of EM offenders different from the rates for
released inmates?
2) Are the recidivism rates of EM offenders different from the rates of
probationers?
There were 262 offenders who participated in the EM programs from the three
provinces. The inmates from the provinces formed the prison comparison sample (n =
240) and the Saskatchewan and Newfoundland probationers formed the probation
comparison (n = 30). There were no statistical differences in risk-needs scores for the
inmates and probationers from the various provinces. The recidivism rates for the three
groups were 26.7% for the EM participants, 33.3% for the probationers, and 37.9% for
the inmates (see Table 13).
(46)
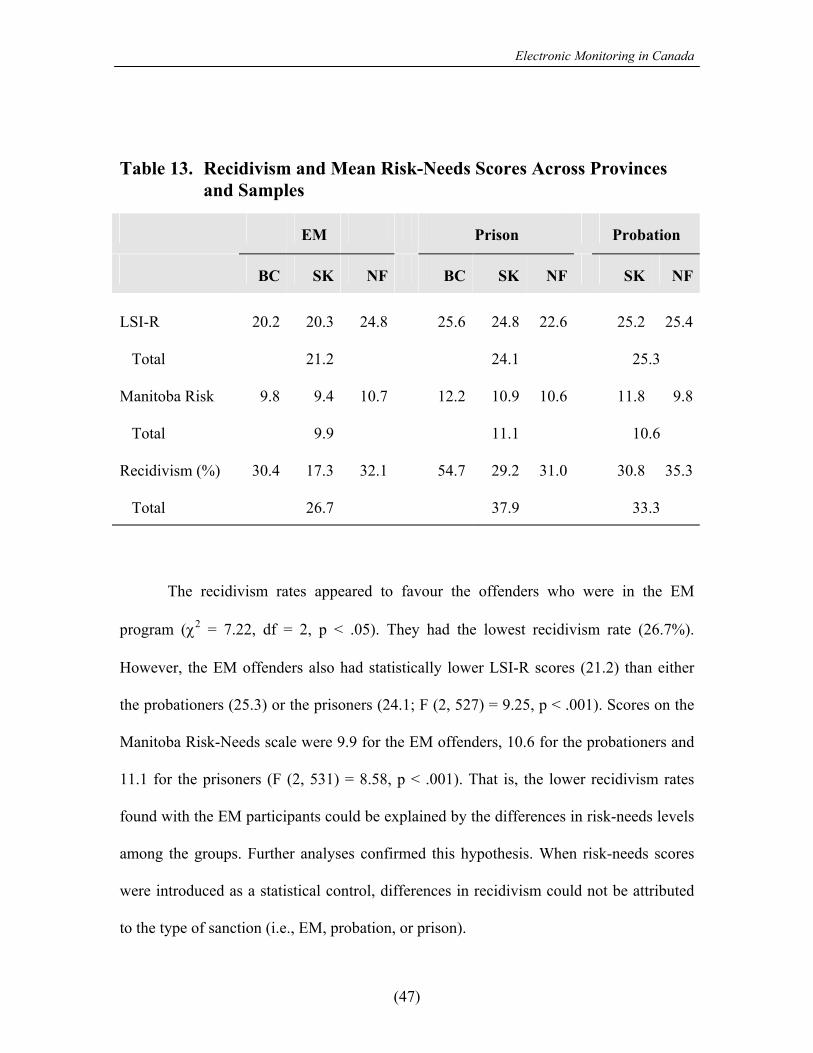
Electronic Monitoring in Canada
Table 13. Recidivism and Mean Risk-Needs Scores Across Provinces and Samples
EM Prison Probation
BC SK NF BC SK NF SK NF
LSI-R 20.2 20.3 24.8 25.6 24.8 22.6 25.2 25.4
Total 21.2 24.1 25.3 Manitoba Risk 9.8 9.4 10.7 12.2 10.9 10.6 11.8 9.8
Total 9.9 11.1 10.6 Recidivism (%) 30.4 17.3 32.1 54.7 29.2 31.0 30.8 35.3
Total 26.7 37.9 33.3
The recidivism rates appeared to favour the offenders who were in the EM
program (χ2 = 7.22, df = 2, p < .05). They had the lowest recidivism rate (26.7%).
However, the EM offenders also had statistically lower LSI-R scores (21.2) than either
the probationers (25.3) or the prisoners (24.1; F (2, 527) = 9.25, p < .001). Scores on the
Manitoba Risk-Needs scale were 9.9 for the EM offenders, 10.6 for the probationers and
11.1 for the prisoners (F (2, 531) = 8.58, p < .001). That is, the lower recidivism rates
found with the EM participants could be explained by the differences in risk-needs levels
among the groups. Further analyses confirmed this hypothesis. When risk-needs scores
were introduced as a statistical control, differences in recidivism could not be attributed
to the type of sanction (i.e., EM, probation, or prison).
(47)
Electronic Monitoring in Canada
These findings have important implications for sentencing and correctional
methods of controlling criminal behaviour. First, if one of the goals of sentencing and
corrections is reduced offender recidivism, EM has no added effect when compared to
the other two correctional options. Advocates of EM programming have argued that even
if recidivism is not reduced, it is certainly not increased. Therefore, EM offers a more
inexpensive alternative to imprisonment. To support their conclusion, evidence is
presented from evaluations using prison comparison groups that show the EM offenders
with lower recidivism rates than released inmates. Unfortunately, no information on
offender risk is given in these evaluations and we suspect that the prisoners are higher
risk offenders to begin with. Even if these studies controlled for offender risk, as in this
study, the argument for using EM remains plausible. However, the important question
about the impact of EM on recidivism is: “compared to what?”
When the recidivism rates of the EM offenders were compared to the
probationers, we found no statistically significant differences. The recidivism rates for
the EM offenders were 26.7% and it was 33.3% for the probationers. Introducing risk-
needs into the analysis did not alter the general results. The adjusted rates were 27% and
31% (χ2 = .59). Although the sample size of the probationers was small, when the
recidivism results from the prison comparison and risk-needs factors are considered, we
are left to conclude that adding electronic monitoring to the supervision of offenders has
little effect on recidivism.
(48)
Electronic Monitoring in Canada
The Newfoundland Treatment Program
If variations in sanctions show no relationship to offender recidivism, then what
impacts on recidivism? The general offender rehabilitation literature suggests that
appropriate offender treatment programs can make a difference. Almost all the EM
offenders in Newfoundland were required to attend the Learning Resources Program
(LRP). This is a relatively intensive treatment program consisting of two and a half hours
per day, four days per week. An independent review of the program suggested that the
LRP appeared appropriate for offenders and “reductions in recidivism in the range of 15-
25% are expected” (Gendreau, 1996, p. 8).
An analysis of the risk-needs scores for the three groups of offenders in
Newfoundland found no statistically significant differences on either the LSI-R, the
Manitoba Risk-Needs scale or Newfoundland’s Risk-Needs classification instrument (a
variation on the Wisconsin instrument). Therefore, the probationers were combined with
the EM offenders to form a treatment group consisting of 71 offenders (the two EM
offenders who were employed and unable to attend the LRP were removed from
analysis). This treatment group was compared to the prison inmates (n = 100) who did
not participate in the LRP. We found no pre-existing differences between the two groups.
The treated and the untreated groups were similar in age, grade level, number of present
offences, prior convictions and their length of sentences. They were also similar in their
employment, marital status and degree of substance abuse.
Preliminary analyses gave the appearance that treatment had no effect. The
recidivism rates for the treated and untreated (prison) groups were nearly identical
(49)
Electronic Monitoring in Canada
(32.4% vs. 31.0%; χ2 = .04). We had expected that the treated offenders would have
shown lower recidivism rates than the untreated prison sample. However, one of the
characteristics of effective offender rehabilitation programs is that intensive services
directed to higher risk offenders would be more effective. Intensive treatment services
matched to low risk offenders typically show either no effect on recidivism or, in some
cases, a slight increase in recidivism (Andrews & Bonta, 1998; Andrews, Zinger, et al.,
1990). Consequently, it was important to evaluate the program with respect to the risk
levels of the offenders.
Although, the program in Newfoundland accepted many higher risk-needs
offenders, there were also lower risk-needs offenders in the program. For example, on the
LSI-R, scores ranged from 13 to 43 for the offenders in the LRP. Taking the median
point on the LSI-R (score of 23) we constructed a low risk (n =86) and high risk (n = 83)
group of offenders for both the LRP offenders (71) and the prison comparison group
(100). The recidivism rates for the four groups are shown in Table 14. Nearly identical
results were found when we used the Manitoba Risk-Needs instrument with a median
split at 10 (results for the Newfoundland scale are not presented because scale
information was missing on 39 offenders).
(50)
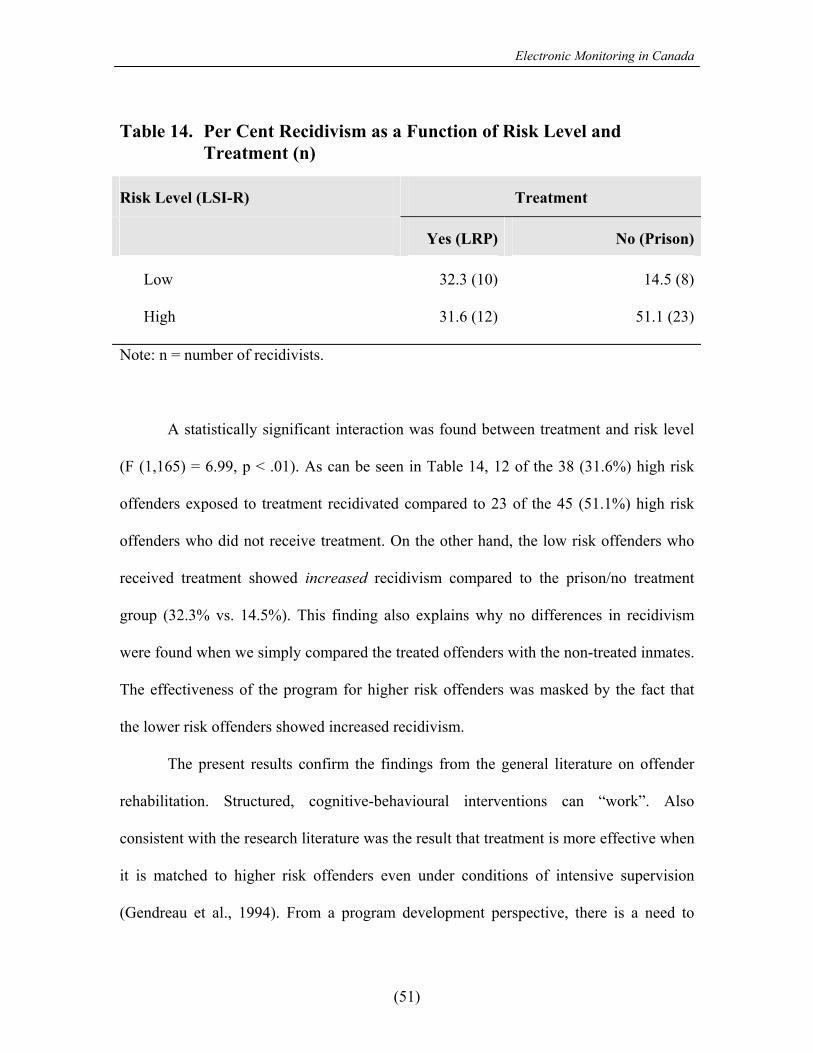
Electronic Monitoring in Canada
Table 14. Per Cent Recidivism as a Function of Risk Level and Treatment (n)
Risk Level (LSI-R) Treatment
Yes (LRP) No (Prison)
Low 32.3 (10) 14.5 (8)
High 31.6 (12) 51.1 (23)
Note: n = number of recidivists.
A statistically significant interaction was found between treatment and risk level
(F (1,165) = 6.99, p < .01). As can be seen in Table 14, 12 of the 38 (31.6%) high risk
offenders exposed to treatment recidivated compared to 23 of the 45 (51.1%) high risk
offenders who did not receive treatment. On the other hand, the low risk offenders who
received treatment showed increased recidivism compared to the prison/no treatment
group (32.3% vs. 14.5%). This finding also explains why no differences in recidivism
were found when we simply compared the treated offenders with the non-treated inmates.
The effectiveness of the program for higher risk offenders was masked by the fact that
the lower risk offenders showed increased recidivism.
The present results confirm the findings from the general literature on offender
rehabilitation. Structured, cognitive-behavioural interventions can “work”. Also
consistent with the research literature was the result that treatment is more effective when
it is matched to higher risk offenders even under conditions of intensive supervision
(Gendreau et al., 1994). From a program development perspective, there is a need to
(51)

Electronic Monitoring in Canada
improve the screening of offenders to the LRP program. Placing low risk offenders into
the treatment program had unintended consequences. Not only were treatment resources
wasted on these offenders but it also led to increased criminal activity. Without direct
evidence, we can only hypothesise that the daily associations of low risk offenders with
higher risk offenders in the treatment program altered the reinforcement contingencies for
criminal thinking and behaviour.
(52)
Electronic Monitoring in Canada
CHAPTER V. GENERAL SUMMARY AND CONCLUSIONS
Much of the attraction to EM is the possibility of providing a cost-effective
alternative to incarceration without increasing the risk to public safety. However, the
evaluations reported in the literature are difficult to interpret due to serious
methodological weaknesses. Although the present study has its own shortcomings, it
does improve upon earlier evaluations. Most notably, both prison and probation
comparison groups were used and the comparisons controlled for the influence of
offender risk and needs.
The three provincial programs differed in terms of who participated in the EM
program and how it was administered. The EM offenders from B.C. appeared to be the
least serious type of offender and we found differences in the views of staff and offenders
regarding the programs. In general, EM programs where supervision came from
probation officers received more favourable ratings from the offenders than the program
where supervision was by officers coming from institutional settings. Despite the fact
that the general type of supervision given to EM offenders was related to “consumer
satisfaction”, the overall program completion rate did not differ across sites. That is,
liking one’s supervising officer and the program did not translate into successful program
completion.
Analyses of offender characteristics and program features found that program
success was best explained by offender risk-needs level. Knowledge of the offender’s
risk-needs score was sufficient to predict whether they would successfully complete the
program. It did not seem to matter whether the EM program was court-based or
(53)
Electronic Monitoring in Canada
corrections-based. The high success rates reported by EM programs in this study, and in
the literature, may reflect little more than the likelihood that the programs are dealing
with relatively low risk offenders.
The recidivism analysis showed that EM does not have a post-program impact on
criminal behaviour. One of the most telling findings was that the recidivism rate for the
EM offenders was not different from the rate for probationers after controlling for
offender risk-needs scores. This lack of difference questions the cost savings value of EM
compared to the community-based supervision offered by probation.
Consistent with the general offender literature, treatment was associated with
reduced recidivism. In particular, it was intensive treatment that was directed to higher
risk offenders that showed a positive effect. Herein lies a potential advantage to using
EM as a correctional option. Higher risk offenders who would have normally served
custodial sentences were supervised in the community and demonstrated lower
recidivism rates following treatment than similar risk offenders released into the
community without treatment. In addition, the offenders who participated in the LRP and
who were under EM supervision were more likely to complete the program than the
probationers who attended the LRP. It appears that EM may not only facilitate tolerance
around releasing higher risk inmates into the community, but it may minimise treatment
drop-out. This said however, there may be other less intrusive and costly interventions
than EM that can improve treatment participation.
(54)
Electronic Monitoring in Canada
REFERENCES
Andrews, D. A., & Bonta, J. (1995). The Level of Service Inventory - Revised. Toronto, ON: Multi-Health Systems.
Andrews, D. A., & Bonta, J. (1998). The psychology of criminal conduct (2nd ed.).
Cincinnati, OH: Anderson. Andrews, D. A., Zinger, I., Hoge, R. D., Bonta, J., Gendreau, P., & Cullen, F. T. (1990).
Does correctional treatment work? A psychologically informed meta-analysis. Criminology, 28, 369-404.
Andrews, D. A., & Kiessling, J. J. (1980). Program structure and effective correctional
practices: A summary of the CaVIC research. In R. R. Ross & P. Gendreau (Eds.), Effective correctional practice (pp. 439-463). Toronto, ON: Butterworth.
Ball, R. A., Huff, C. R., & Lilly, R. J. (1988). House arrest and correctional policy: Doing
time at home. Newbury Park, CA: Sage. Ball, R. A., & Lilly, R. J. (1986). A theoretical examination of home incarceration. Federal
Probation, 50: 17-24. Baumer, T. L., Maxfield, M. G., & Mendelsohn, R. I. (1993). A comparative analysis of
three electronically monitored home detention programs. Justice Quarterly, 10, 121-142.
Beck, J., Klein-Saffran, J., & Wooten, H. B. (1990). Home confinement and the use of
electronic monitoring with federal parolees. Federal Probation, 54, 22-31. Bonta, J., Parkinson, R., Pang, B., Barkwell, L., & Wallace-Capretta, S. (1994). The revised
Manitoba classification system for probationers. Ottawa, ON: Solicitor General Canada.
British Columbia Corrections Branch. (1995). British Columbia Corrections Branch
electronic monitoring program. In K. Schulz (Ed.), Electronic monitoring and corrections: The policy, the operation, the research. (pp. 53-58). Burnaby, BC: Simon Fraser University.
Canada. (1996). Corrections population growth: Report for Federal/Provincial/Territorial
ministers responsible for justice. Ottawa, ON: Solicitor General Canada. Canada. (1998). Corrections population growth: Second progress report. Ottawa, ON:
Solicitor General Canada.
(55)
Electronic Monitoring in Canada
Cullen, F. T., Wright, J. T., & Applegate, B. K. (1996). Control in the community: The limits
of reform? In A. T. Harland (Ed.), Choosing correctional options that work: Defining the demand and evaluating the supply. (pp. 69-116). Thousand Oaks, CA: Sage.
Denton, M. (1988). Statistical report (Dec.), Harper Woods, Michigan. Described in A. K.
Schmidt, Electronic monitoring in the United States. United Nations Interregional Crime and Justice Research Institute, Chicago, IL: Nelson Hall.
Fox, R. G. (1987). Dr. Schwitzgebel’s machine revisited: Electronic monitoring of offenders.
Australian and New Zealand Journal of Criminology, 20, 131-147. Gendreau, P. (1996). A review of the Learning Resources Program. Report to Corrections
Research, Solicitor General Canada. Ottawa, Ontario. Gendreau, P., & Andrews, D. A. (1996). Correctional Programs Assessment Inventory
(CPAI, 6th Edition). Department of Psychology, University of New Brunswick, Saint John, New Brunswick.
Gendreau, P., Cullen, F. T., & Bonta, J. (1994). Intensive rehabilitation supervision: The
next generation in community corrections? Federal Probation, 58, 72-78. Gendreau, P., Little, T., & Goggin, C. (1996). A meta-analysis of the predictors of adult
offender recidivism: What works! Criminology, 34, 575-607. Lilly, R. J. (1992). Electronic monitoring: Another fatal remedy? In C. A. Hartjen & E. E.
Rhine (Eds.), Correctional theory and practice (pp. 87-115). Chicago, IL: Nelson-Hall.
Lilly, R. J., Ball, R. A., Curry, G. D., & McMullen, J. (1993). Electronic monitoring of the
drunk driver: A seven-year study of the home confinement alternative. Crime and Delinquency, 39: 462-484.
Lilly, R. J., Ball, R. A., Curry, G. D., & Smith, R. C. (1992). The Pride, Inc., program: An
evaluation of 5 years of electronic monitoring. Federal Probation, 56, 42-47. Mainprize, S. (1992). Electronic monitoring in corrections: Assessing cost effectiveness and
the potential for widening the threat of social control. Canadian Journal of Criminology, 34, 161-180.
Mainprize, S. (1995). Social, psychological, and familial impacts of home confinement and
electronic monitoring: Exploratory research findings from British Columbia’s pilot project. In K. Schulz (Ed.), Electronic monitoring and corrections: The policy, the operation, the research. (pp. 141-187). Burnaby, BC: Simon Fraser University.
(56)
Electronic Monitoring in Canada
Maxfield, M. G., & Baumer, T. L. (1990). Home detention with electronic monitoring: Comparing pretrial and postconviction programs. Crime and Delinquency, 36, 521-536.
McGowan, J. (1988). Letter to the Honorable Nortan Josephson May 19. Described in A. K.
Schmidt, Electronic monitoring in the United States. United Nations Interregional Crime and Justice Research Institute, Chicago, IL: Nelson Hall.
Mortimer, E., & May, C. (1997). Electronic monitoring in practice: the second year of the
trials of curfew orders. Home Office Research Study 177. London, England: Research and Statistics Directorate, Home Office.
Motiuk, M. S., Motiuk, L. L., & Bonta, J. (1992). A comparison between self-report and
interview-based inventories in offender classification. Criminal Justice and Behavior, 19, 143-159.
Nee, C. (1990). Electronic monitoring in England and Wales: Some key issues. Research
Bulletin #29. Home Office Research and Statistics Department, London, England. Nuffield, J. (1997). Diversion programs for adults. (User Report No. 1997-05). Ottawa, ON:
Solicitor General Canada. Ontario (1991). An evaluation of the electronic monitoring pilot project: Mimico
correctional centre, April, 1989 - October, 1990. North Bay, Ministry of Correctional Services of Ontario.
Petersilia, J. (1988). House arrest. Report No. NCJ 104559. Washington, DC: National
Institute of Justice. Renzema, M., & Skelton, D. T. (1990). Use of electronic monitoring in the United States:
1989 update. NIJ Research in Action, No. 222 (Nov./Dec.), pp. 9-13. Rogers, R., & Jolin, A. (1989). Electronic monitoring: A review of the empirical literature.
Journal of Contemporary Criminal Justice, 5, 141-153. Roy, S. (1997). Five years of electronic monitoring of adults and juveniles in Lake County,
Indiana: A comparative study on factors related to failure. Journal of Criminal Justice, 20, 141-157.
Whittington, M. (1987). Supervised electronic confinement pilot program October 1986 -
September 1987: Final report. Santa Anna, CA: Orange County Probation Department.
(57)
Related Documents