ELECTROLYSIS OF COAL AND CARBON SLURRY SUSPENSIONS by MOUSTAFA REDA ABOUSHABANA Presented to the Faculty of the Graduate School of The University of Texas at Arlington in Partial Fulfillment of the Requirements for the Degree of DOCTOR OF PHILOSOPHY THE UNIVERSITY OF TEXAS AT ARLINGTON December 2012

Welcome message from author
This document is posted to help you gain knowledge. Please leave a comment to let me know what you think about it! Share it to your friends and learn new things together.
Transcript
ELECTROLYSIS OF COAL AND CARBON SLURRY SUSPENSIONS
by
MOUSTAFA REDA ABOUSHABANA
Presented to the Faculty of the Graduate School of
The University of Texas at Arlington in Partial Fulfillment
of the Requirements
for the Degree of
DOCTOR OF PHILOSOPHY
THE UNIVERSITY OF TEXAS AT ARLINGTON
December 2012

Copyright © by Moustafa Reda Aboushabana 2012
All Rights Reserved

iii
ACKNOWLEDGEMENTS
I would like to express my sincere appreciation to my research advisor Professor Krishnan
Rajeshwar for his unwavering confidence in my abilities, intelligent guidance and continuous support. He
has provided me tremendous knowledge and valuable advice and has been an excellent source of
motivation during the entire research work. I would like to add that I felt him as a great leader rather than
as a boss in every situation during my dissertation study.
I would like also to acknowledge my dissertation committee members, Prof. Frederick
MacDonnell and Prof. Richard Timmons, for devoting their time and effort and giving important
suggestions to improve the quality of my research work.
My special thanks go to Professor Norma Tacconi for training me in the coal project shortly after
joining the group, giving me warm-hearted encouragement, friendly help, and fruitful discussions during
my research. Thanks to Dr. Wilaiwan Chanmanee for acquainting me with the experimental
instrumentation and Dr. Csaba Janaky for his valuable discussions and advice especially at the last part
of my research work. I also thank all the members of our research group for their support.
I sincerely thank my wife, Mrs. Rasha Yousef, for her endless love and support that helped me to
overcome all the difficult situations during my course work and dissertation study. Special thanks to her
for sacrificing her career advance, taking care of our kids, Karim, Menatalla and Ahmad and helping them
growing so healthy and lovely. I am proud of and thankful for all my family members for providing me with
warm and quiet environment that helped me to concentrate on my research.

iv
Finally, I thank the Department of Chemistry & Biochemistry and the Center for Renewable
Energy Science & Technology (CREST) laboratory, and the University of Texas at Arlington, for giving me
this opportunity and for financial support during this dissertation study.
December 4, 2012
v
ABSTRACT
ELECTROLYSIS OF COAL AND CARBON SLURRY SUSPENSIONS
Moustafa Reda Aboushabana, PhD
The University of Texas at Arlington, 2012
Supervising Professor: Krishnan Rajeshwar
In this dissertation study, different ranks of coal and carbons were tested as anode depolarizers
in a three electrode electrochemical cell designed for hydrogen generation. The focus of this study was
mainly Texas lignite coal (TXLC). For comparison purposes, other coals were carefully chosen to cover
the range from high-rank, intermediate-rank, and to low-rank (TXLC). Carbon blacks and carbon
nanotubes were also studied to gain more insight into the mechanistic aspects of the electrolysis process.
The Fe3+/2+ redox couple was used as an oxidation mediator throughout the study. It shuttles the
electrons between the coal or carbon particles and the anode surface. A standard reduction potential of
0.76 V explains the ability of Fe3+ species to (partially) oxidize the bulk carbon phase as well as the
surface functional groups of coal and carbons. In addition, the Fe+2 species can be anodically
regenerated at a low potential (0.8 V), that is much lower than the oxygen evolution potential. Finally, It is
recognized that these species exist as aqua complexes in solution, and among the Fe3+ species, the
dominant photoactive complex is the 6-coordinated Fe (OH) (H2O)52+ complex. The photoactivity of the
Fe(OH)(H2O)52+ complex allowed the use of light as a mechanistic probe of photoelectrolysis of coal and
carbons.
vi
In the photoelectrolysis of aqueous lignite coal and carbon black slurry suspensions, UV
irradiation of the anolyte in the presence of iron species, afforded enhanced currents associated with the
free radical-induced oxidative attack of the coal (or carbon) surface. Useful mechanistic insights were
gleaned into the factors responsible for the anode depolarization by the coal (or carbon) particles in the
slurry suspension. According to a photo-Fenton-like mechanism, UV light was used to modulate chemical
reactions in the solution phase generating very reactive •OH and other reactive oxygen species (ROS)
that oxidatively attack the coal matrix. It was found that the hydroxyl radicals (•OH) and the ROS
photogenerated via this mechanism can enhance hydrogen production in the cathode compartment of a
coal photoelectrolysis cell. GC analyses of the evolved gases in the anolyte compartment revealed the
gradual increase in the amount of CO2. Infrared (IR) spectrophotometric analysis of the samples before
and after UV irradiation (in the presence of Fe2+/3+) showed an overall increase in the surface oxygen
groups and a decrease in aromaticity. These data trends are consistent with an attack of the coal matrix
by the photogenerated •OH species and other ROS. Two carbon black samples were included in this
study for comparative purposes: (a) to assess the effect of oxidizability of the carbon matrix (relative to
lignite coal); and (b) to examine the influence of graphitization of the carbon black on its ease of oxidation.
The consequences of chemical pre-treatment of coals of varying rank and selected carbon black
samples, on their ability to generate hydrogen in an electrolytic environment were explored. Concurrently,
thermal analyses (differential scanning calorimetry or DSC and thermogravimetry or TGA) were
performed on these pre-treated samples to investigate the consequences in terms of corresponding
alterations in thermal reactivity. The chemical pre-treatment consisted of digestion with strong acid (1 M
each of HClO4, H2SO4, or HNO3) or by stirring the coal (or carbon black) sample with 35 % H2O2
overnight. The influence of H2O2 pre-treatment was shown to be critically dependent on the coal rank.
Further, coal samples responded differently relative to carbon black surfaces in terms of how the
hydrogen-generating capacity and thermal reactivity were altered by either acid or H2O2 pre-treatment.
vii
The improvement of the chemical reactivity of coal samples following chemical pre-treatment was
attributed to changes in surface area and surface oxygen functional groups. The surface area of coal
particles was measured (via nitrogen adsorption and the BET model) before and after treatment. The
surface and bulk oxygen functional groups were investigated by X-ray photoelectron spectroscopy (XPS)
and IR analysis, respectively. The results showed an appreciable increase in the oxygen functional
groups, specifically the carbonyl groups following the acid and H2O2 treatments. Multiwalled carbon
nanotubes (MWCNTs) were included in the oxidation treatment to assess which oxygen functional group
was responsible for the improvement of coal reactivity. Potassium permanganate (KMnO4), which is a
more powerful oxidizing agent than H2O2, was used to ensure complete oxidation of the chemically inert
MWCNTs. The XPS and IR data showed a specific increase in the hydroxyl rather than the carbonyl
groups. The complete absence of any improvement in the chemical and electrochemical reactivity of
MWCNTs following the oxidation treatment ruled out any contribution from the hydroxyl groups to the
improved reactivity of chemically pretreated coal.
Finally, economic analysis of hydrogen production by coal (dark and photo) electrolysis was
performed. The analysis aimed at carrying out a sensitivity analysis that addresses the influence of
variation of main system components (e.g., electricity price, operating potential, and process efficiency)
on the hydrogen production cost. Economic barriers associated with the commercial application of coal
electrolysis for hydrogen production were also addressed.

viii
TABLE OF CONTENTS
ACKNOWLEDGEMENTS ................................................................................................................ iii ABSTRACT ...................................................................................................................................... v LIST OF ILLUSTRATIONS ............................................................................................................. xii LIST OF TABLES ............................................................................................................................xv
Chapter Page 1. INTRODUCTION……………………………………..………..….. .................................................. 1
1.1 Coal Electrolysis ............................................................................................................ 1
1.2 Coal Structure and Ranks ............................................................................................. 2
1.2.1 Macromolecular structure ............................................................................. 2 1.2.2 Chemical structure ........................................................................................ 3 1.2.3 Coal ranks ..................................................................................................... 4
1.3 Electrocatalysis of Coal Oxidation ................................................................................ 6 1.4 Controlled Current Techniques ..................................................................................... 8 1.5 Thermal Analysis Techniques ..................................................................................... 12 1.6 Spectroscopic Techniques .......................................................................................... 16
1.6.1 Infrared spectroscopy ................................................................................. 16 1.6.2 Raman spectroscopy .................................................................................. 17 1.6.3 X-ray photoelectron spectroscopy .............................................................. 18
2. PHOTOELECTROLYSIS OF COAL AND CARBON BLACKS .................................................. 21
2.1 Literature Review ........................................................................................................ 21 2.2 Experimental ............................................................................................................... 23

ix
2.3 Results and Discussion ............................................................................................... 24
2.3.1 Iron redox and photochemistry ................................................................... 24 2.3.2 Experiments with lignite coal and carbon black .......................................... 26 2.3.3 General discussion ..................................................................................... 30
2.4 Conclusion .................................................................................................................. 31
3 CHEMICAL PRE-TREATMENT OF COAL AND CARBON BLACKS ....................................... 32 3.1 Introduction ................................................................................................................. 32
3.2 Experimental ............................................................................................................... 33
3.2.1 Chemicals, materials, and electrolysis cell ................................................. 33 3.2.2 Acid digestion, H2O2 and KMnO4 pre-treatments ....................................... 35 3.2.3 Instrumentation ........................................................................................... 35
3.3 Results and Discussion ............................................................................................... 36
3.3.1 Redox mediation of coal oxidation .............................................................. 36
3.3.2 Acid digestion of Texas lignite coal and carbon black ................................ 37
3.3.2.1 Voltammetric Experiments .......................................................... 37
3.3.2.2 Galvanostatic Polarization Experiments ..................................... 38 3.3.2.3 Consequences of Acid Pre-treatment on Thermal Reactivity ..... 46
3.3.3 Peroxide pre-treatment of coal and carbon black ....................................... 49
3.3.3.1 Rationale ..................................................................................... 49 3.3.3.2 Galvanostatic Polarization Experiments ..................................... 49 3.3.3.3 TGA and DSC Experiments ........................................................ 53
3.3.4 Mechanistic aspects of coal and carbon black electrolysis ........................ 54
3.3.4.1 Chemical vs. Electrochemical Reactivity of TXLC ...................... 54 and Carbon Blacks 3.3.4.2 Galvanostatic Polarization Experiments ..................................... 54
3.3.4.3 XPS Spectra of Bare and Oxidized TXLC .................................. 59

x
3.3.4.4 FTIR Spectra of Bare and Oxidized TXLC .................................. 60
3.3.4.5 Thermodynamics and Kinetics of Spontaneous ......................... 61 Reduction of Fe (III) 3.3.4.6 Raman Spectra of Bare and Oxidized MWCNTs ....................... 62 3.3.4.7 FTIR Spectra of Bare and Oxidized MWCNT ............................. 64
3.4 Conclusion .................................................................................................................. 65
4 ECONOMIC ANALYSIS OF HYDROGEN PRODUCTION ....................................................... 67 BY COAL ELECTROLYSIS
4.1 Hydrogen Production Technologies ............................................................................ 67
4.1.1 Hydrogen from Biomass ............................................................................. 68 4.1.2 Hydrogen from water .................................................................................. 70
4.1.2.1 Electrolysis .................................................................................. 70 4.1.2.2 Photoelectrochemical Water Splitting ......................................... 71
4.1.3 Hydrogen from Hydrocarbons ..................................................................... 72
4.1.3.1 Steam Methane Reforming (SMR) ............................................. 72 4.1.3.2 Coal Gasification ......................................................................... 74 4.1.3.3 Coal Electrolysis ......................................................................... 75
4.2 Coal Electrolysis Economic Analysis Model ............................................................... 76
4.2.1 Key assumptions in building the model ...................................................... 76 4.2.2 Demonstration system description and optimization .................................. 77
4.2.2.1 Dark Electrolysis of Coal ............................................................. 77 4.2.2.2 Photoelectrolysis of Coal ............................................................ 78
4.2.3 Sensitivity study .......................................................................................... 79
4.2.3.1 Electricity Price ........................................................................... 79 4.2.3.2 Cell Voltage ................................................................................. 81

xi
4.2.3.3 Process Efficiency ....................................................................... 83 4.3 Conclusion .................................................................................................................. 86
5 SUMMARY AND CONCLUSIONS .............................................................................................. 87 REFERENCES ............................................................................................................................... 89
BIOGRAPHICAL INFORMATION .................................................................................................. 96
xii
LIST OF ILLUSTRATIONS
Figure Page
1.1 Diagram showing the macromolecular coal structure ................................................................ 3
1.2 The primary chemical groups in a bituminous coal .................................................................... 4 1.3 Stepwise formation of different coal ranks from peat ................................................................. 5 1.4 Current excitation step in chronopotentiometry ......................................................................... 9 1.5 Potential change response in chronopotentiometry ................................................................... 9 1.6 Concentration-distance profiles for the electrochemical reduction of (O) to (R) under the effect of a constant current step .............................................................................. 10
1.7 Variation of �iτ�
�� with �i�for catalytic reaction .......................................................................... 12 1.8 Typical thermogravimetric and differential scanning calorimetry curves ................................. 13 1.9 Classification of TGA curves .................................................................................................... 15 1.10 Schematic diagram of differential scanning calorimetry instrument ...................................... 16 1.11 Raman spectrum of multi-walled carbon nanotube (MWCNT) sample ................................. 19 1.12 Schematic design of an X-ray photoelectron spectrometer ................................................... 20 2.1 Galvanostatic profiles for two blank solutions and a lignite coal ............................................. 26 suspension with added iron redox mediator 2.2 Linear sweep voltammograms (Potential Scan Rate: 3 mV/s) for: ......................................... 28 lignite coal (A), SRC-159 carbon black (B), and SRC-401 carbon black (C) 2.3 Photocurrent-time profiles (measured at 1.10 V) for: .............................................................. 29 (a) 0.2 M Fe(II)+ 0.3 M Fe(III) in 0.01 M H2SO4+x min UV irradiation; and (b)a + 0.02 g/mL lignite coal (c)The temperature changes in the photoelectrolysis cell are mapped 2.4 GC analysis of the gases evolved during photochemical oxidation ......................................... 30 of coal slurry (0.02 g %)

xiii
3.1 Linear sweep voltammograms (potential scan rate: 3 mV/s) .................................................. 38 for 20g/L TXLC slurries after digestion in different 1 M acids without externally added iron redox mediator
3.2 Effect of acid digestion time on the limiting current values for ................................................. 39
stirred TXLC slurries (20 g/L in 1 M H2SO4) at room temperature 3.3 Cyclic voltammograms (scan rate: 3 mV/s) for ....................................................................... 40
blank (a) and equimolar 1mM Fe2+/3+ mixture in 1 M H2SO4 before (b) and after boiling with one drop of conc. HNO3 (c)
3.4 Galvanostatic polarization profiles for: .................................................................................... 41
blank solutions and acid pre-treated TXLC suspension with externally added iron redox mediator
3.5 Galvanostatic polarization profiles for: .................................................................................... 45
blank solutions (refer to text) and acid pre-treated SRC-401 suspension with externally added iron redox mediator
3.6 Thermal analysis (TGA and DSC) curves for TXLC, SRC-401 and SRC-159 samples .......... 46 3.7 Thermal analysis (TGA) curves for TXLC before and after ..................................................... 48
treatment with different 1M acids
3.8 Thermal analysis (TGA and DSC) curves for SRC-401 before and after ................................ 50 treatment with different 1M acids
3.9 Galvanostatic polarization profiles for blank solution .............................................................. 51 and slurries in 30 mM H2O2
3.10 Thermal analysis (TGA and DSC) curves for TXLC before and after .................................... 53 treatment with H2O2 3.11 Galvanostatic polarization profiles for blank solution ............................................................ 55 and TXLC suspension with and without externally added iron redox mediator 3.12 Galvanostatic polarization profiles for blank solution ............................................................ 57 and TXLC suspension with and without externally added iron redox mediator 3.13 Galvanostatic polarization profiles for oxidized TXLC .......................................................... 58
suspension with and without externally added iron redox mediator 3.14 Deconvoluted X-ray photoelectron spectrum of as received TXLC ...................................... 59 3.15 Deconvoluted X-ray photoelectron spectrum of TXLC after oxidation with H2O2 ................. 60 3.16 FTIR spectra of as-received (TXLC) and oxidized (TXLC-OH) coal ..................................... 62
xiv
3.17 Raman spectra of as received MWCNTs (A) ........................................................................ 63 and MWCNTs oxidized with H2O2 (B) 3.18 Raman spectra of as received MWCNTs (A) ........................................................................ 64 and MWCNTs after oxidation with KMnO4 (B) 3.19 Deconvoluted XPS spectrum of MWCNTs after oxidation with KMnO4................................. 65 3.20 FTIR spectrum of MWCNTs before and after oxidation with KMnO4..................................... 66 4.1 Schematic of SMR process ..................................................................................................... 73 4.2 Demonstration setup for hydrogen production by dark coal electrolysis ................................. 78 4.3 Demonstration setup for hydrogen production by coal photoelectrolysis ............................... 79 4.4 Effect of electricity prices on the hydrogen production cost .................................................... 81 by dark and photoelectrolysis of coal 4.5 Effect of operating cell voltage on the hydrogen production .................................................... 82 cost by dark and photoelectrolysis of coal 4.6 Variation of EROEI values with cell voltage during dark coal electrolysis ............................... 83 4.7 Variation of EROEI values with cell voltage during ................................................................. 84 coal photoelectrolysis 4.8 Effect of Faradaic efficiency on the hydrogen production cost by dark ................................... 85 and photoelectrolysis of coal

xv
LIST OF TABLES
Table Page 1.1 Classification of Coal by Rank ................................................................................................... 6 3.I Designations of Coal and Carbon Black Samples Included in this Study ................................. 33 3.2 Proximate and Ultimate Analysis Data for the Studied Coal Samples .................................... 34 3.3 Effect of Acid Digestion Treatment on the Iron Mediated ....................................................... 42 Galvanostatic Polarization Behavior of TXLC Slurries 3.4 Effect of HClO4 Acid Pre-treatment on the Surface Area ....................................................... 43 and O/C ratio of TXLC and SRC-401 Samples 3.5 Effect of Acid Digestion Treatment on the Iron Mediated Galvanostatic ................................ 45 Polarization Behavior of SRC-401 Slurries 3.6 Parameters from Simultaneous TGA and DSC Analyses of Untreated ................................... 47 TXLC and SRC-401 Samples 3.7 Effect of Acid Pre-treatment on the TGA Parameters for TXLC ............................................. 49 3.8 Effect of H2O2 Pre-treatment on the Galvanostatic Polarization .............................................. 52 Behavior of Coal and Carbon Black Slurries 3.9 Semi-quantitative Analysis of Surface Groups in TXLC ......................................................... 61 before and after Oxidation with H2O2 3.10 Raman Spectrum Parameters of the as received and Oxidized MWCNTs ........................... 63 4.1 Commercial Processes Currently in Use for Hydrogen Production ........................................ 68 4.2 Prices for the Different Input Energy Sources for Hydrogen Production ................................. 76 4.3 Final Delivered Hydrogen Production Cost by Commercially .................................................. 86 Available Technologies

1
CHAPTER 1
INTRODUCTION
1.1 Coal Electrolysis
Coal is an intermediate solution to our ever-expanding energy needs owing to its abundance in
many parts of the world and the low cost of electricity generation from it. Currently it produces about 50%
of the world’s electricity needs. Nine out of ten tonnes of the coal mined in the United States today are
used to generate electricity. Combustion of coal is used to generate electricity with the well-known
disadvantages of harmful emissions and environmental pollution. On the other hand, steam reforming of
coal is a cleaner approach for extracting the stored energy (than burning it), and has long been used for
hydrogen and liquid fuels production.1,2
An alternate approach, namely, electrolysis of coal suspensions to generate hydrogen, was
originally proposed in 19793 and has been intensely studied in the years since.4–22 A major advantage of
this process, relative to steam reforming, is that it requires only mild temperatures and ambient pressure
and produces pure streams of hydrogen and carbon dioxide. The process looks promising specially under
the unprecedented constrains posed on the coal conversion processes and the urgent need for carbon
dioxide emission control.23 In other words, the modern coal conversion technologies need to find efficient
ways of extracting the energy stored in coal without contributing to the greenhouse pool.
Compared to coal which is a primary source of energy, hydrogen is an energy carrier and can be
considered as one of the cleanest forms of energy. The energy stored in its chemical bonds is released
when hydrogen combines with oxygen to produce water as a reaction product. Hydrogen can be used in
different scenarios. Almost half of the hydrogen produced globally is used for ammonia production.
Refineries use the second largest part of hydrogen for chemical conversion processes such as converting

2
heavy hydrocarbons into gasoline and diesel fuel.24 In fuel cells, however, hydrogen is used as a fuel to
produce direct current electricity.
Steam methane reforming (SMR) is the most widely used and most economical process for
producing hydrogen. Although SMR is a complex process involving many different catalytic steps that
produce carbon monoxide and carbon dioxide, the primary greenhouse gases, it will continue to be the
technology of choice for the mass production of hydrogen until another more environmentally friendly and
cost effective technology is developed.
Coal electrolysis, as an alternative way of producing hydrogen, has a lot of mechanistic aspects
that are still incompletely understood due to the complexity of coal structure and its components. The
different behavior of coal described in the literature may reside with the unique nature of coal structure
which is mainly determined by its plant origin and the conditions of its formation.
1.2 Coal Structure and Ranks
1.2.1 Macromolecular structure
Coal is characterized by an extensive network of pores that renders it unique between the other
fossil fuels. Such a network facilitates the accessibility of reactant molecules to the organic matter of coal
as a result of an appreciable volume of pore and increased surface area. The mass transfer of reactant
molecules across the pores network is of great consideration in coal reactivity. Figure 1.1 shows the
major constituents in coal structure, namely, organic matter, fragments of plant debris (macerals),
inorganic inclusions and an extensive pore network. The organic matter represents almost 85-90% (w/w)
of dry coal and differs from one sample to the other according to the precursor plant material. The
inorganic content of dry coal represents the remaining 5-15% and is mainly composed of aluminosilicates
and pyrites. As the organic matter dominates the coal structure, the nature of functional groups,
especially the oxygen functional groups, have a great influence on coal reactivity.25

3
Figure 1.1 Diagram showing the macromolecular coal structure.25
1.2.2 Chemical structure
The atomic hydrogen-to-carbon ratio in coal is 0.9. It is roughly half that of petroleum and oil
shale and shows that coal is hydrogen deficient. Compared to petroleum, coal has a very different
chemical structure, with higher levels of aromatic and other unsaturated species. Being solid, coal has a
high molecular weight, much higher than that of natural gas or petroleum. Coal is somewhat similar to
polymers (main constituents of plastics); a typical structure is illustrated below in Figure 1.2.

4
A second dominant feature is the high level of organic oxygen in coal, one oxygen for
every five carbon atoms, more than 10 times the oxygen levels in petroleum. These abundant
oxygen forms strongly influence coal's structure and reactivity. Oxygen occurs mainly as
phenolic or ether groups. Carboxylic and carbonyl groups are less predominant.26 Nitrogen
exists primarily as pyridine or pyrrolic type rings.
Figure 1.2 The primary chemical groups in a bituminous coal (as proposed by Wiser).25
1.2.3 Coal ranks
Coal is classified into four general categories or "ranks." They range from lignite
through sub-bituminous and bituminous to anthracite, reflecting the progressive response of
individual deposits of coal to increasing heat and pressure. The amount of energy stored per
unit mass of coal as well as its heating value depends mainly on its carbon content, but other
5
factors also influence. The amount of energy in coal is expressed in either British thermal units
per pound (Btu/lb) or KJ/kg. A Btu is the amount of heat required to raise the temperature of one
pound of water by one degree Fahrenheit. About 90 percent of the coal in the U.S. falls in the
bituminous and sub-bituminous categories, which are lower in rank than anthracite and mostly
contain less energy per unit mass. Bituminous coal dominates in the Eastern and Mid-continent
coal fields, while sub-bituminous coal is generally found in the western part of the U.S. and
Alaska.27
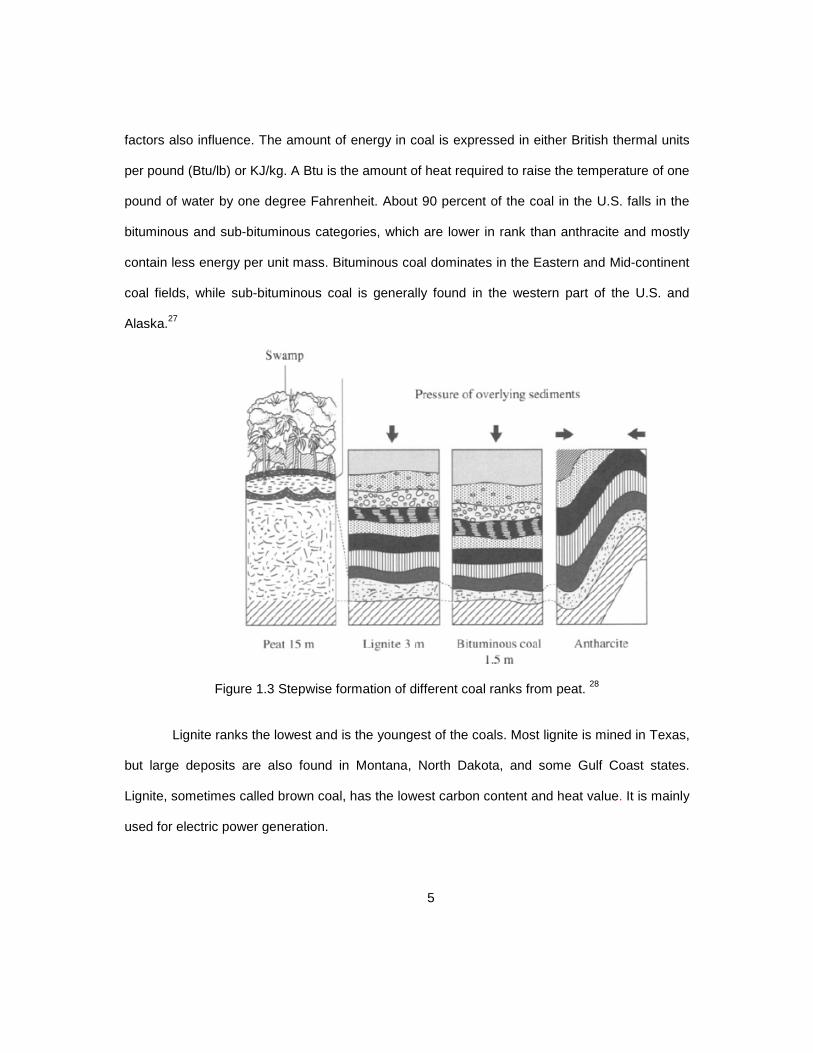
Figure 1.3 Stepwise formation of different coal ranks from peat. 28
Lignite ranks the lowest and is the youngest of the coals. Most lignite is mined in Texas,
but large deposits are also found in Montana, North Dakota, and some Gulf Coast states.
Lignite, sometimes called brown coal, has the lowest carbon content and heat value. It is mainly
used for electric power generation.

6
Table 1.1 shows the different ranks of coal which have been classified according to
their carbon content and heating value. The elementary composition changes with increasing
coal rank. The carbon content, amounting to roughly 71 wt% in lignite, increases to more than
92 wt% in anthracite, whereas hydrogen, initially at 5 wt%, drops to below 3 wt%, and oxygen,
initially at 22 wt% drops to 2 wt%. The aromatic carbon content increases with increasing the
rank.26 The changing elementary composition is also reflected in the carbon / hydrogen ratio,
which is approximately 14% for lignite and increases to more than 45% for anthracite.
Table 1.1 Classification of Coal by Rank28
a To convert kJ/kg to Btu/lb, divide by 2.326.
1.3 Electrocatalysis of Coal Oxidation
Consensus has emerged that electrooxidation of the coal surface involves reversible (or
quasi-reversible) redox mediators such as Fe3+/2+ that are already present in the coal matrix.13,14
The iron redox mediator shuttles electrons between coal and the anode surface where the coal
surface is getting oxidized by iron(III) ions and the resulting iron(II) ions are oxidized at the
electrode surface.

7
An undoubtedly over-simplified scheme for the chemical and electrochemical processes
taking place during coal electrolysis is as follows where the coal is simply represented as C(s)
and the oxidized surface of it is denoted as C(ox)(s):
At the anode:
e3Fe2Fe ++
→+
4e4H(g)2COO(l)22HC(s) ++
+→+
In solution:29
( ) ( ) ++ ++→+++ 2Fe2mH(g)]CO(g),2CO(s),(ox)C[lO2mHsC 3Fe
At the cathode:
(g)2H2e2H →++
Several redox mediators have been deliberately added to the suspension such as
V5+/3+, Mn3+/2+, Ce4+/3+, Fe3+/2+, I3-/I-, and Fe(CN)63-/4- by previous researchers.6,30 The redox
catalyst is mainly aimed at having as low a standard electrode potential as possible which would
still oxidize coal at a fast rate. This redox pair must be completely soluble in aqueous acid
solutions and must have a relatively large heterogeneous electron transfer rate constant.30 A
tradeoff exists between the rate of the catalytic reaction and the operating potential required for
coal electrolysis. Redox mediators with relatively high standard reduction potential show faster
reaction rates with coal at the expense of higher applied potential that is needed for
electrolysis.30
For this study we opted to use the Fe3+/2+ redox couple as an oxidation mediator. The
rationale for this choice was the ability of Fe3+ species to (partially) oxidize the bulk carbon
phase as well as the surface functional groups of coal. In addition, it can be anodically
regenerated at a low potential (0.8 V), much lower than the oxygen evolution reaction. Finally,
8
Fe(II) / Fe(III) species are soluble in water and in acidic solutions and chemically stable over a
long period of time under normal storage conditions.
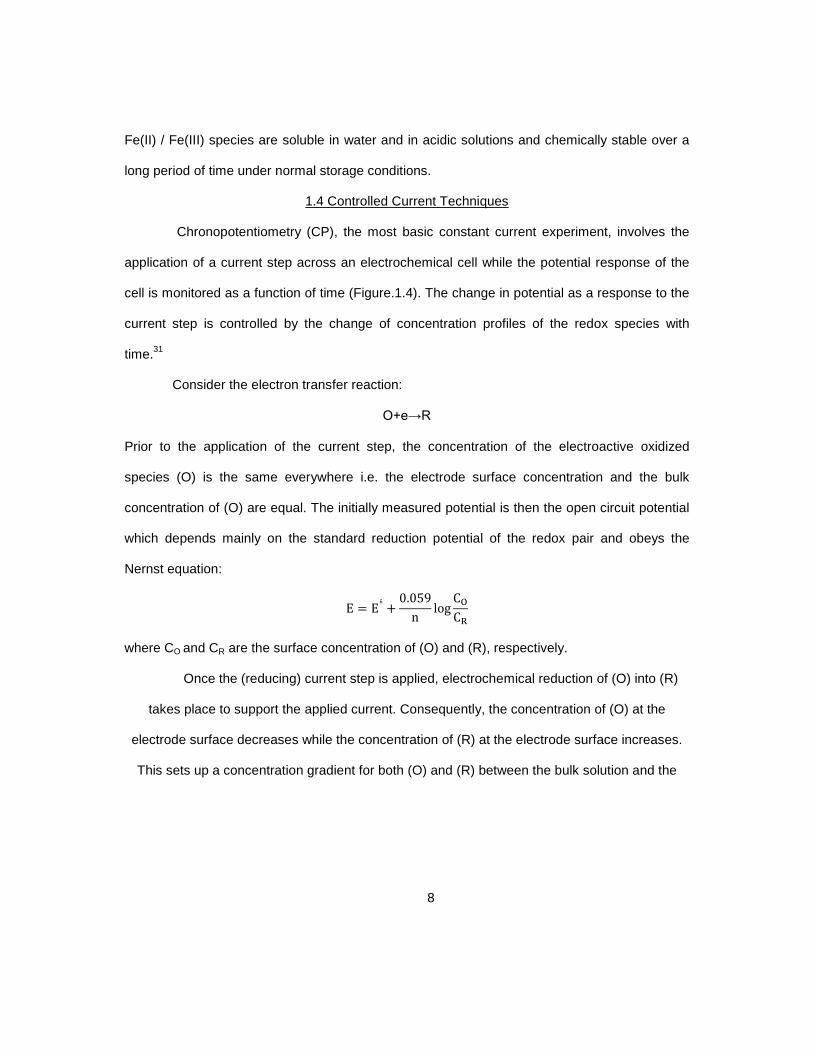
1.4 Controlled Current Techniques
Chronopotentiometry (CP), the most basic constant current experiment, involves the
application of a current step across an electrochemical cell while the potential response of the
cell is monitored as a function of time (Figure.1.4). The change in potential as a response to the
current step is controlled by the change of concentration profiles of the redox species with
time.31
Consider the electron transfer reaction:
O+e→R
Prior to the application of the current step, the concentration of the electroactive oxidized
species (O) is the same everywhere i.e. the electrode surface concentration and the bulk
concentration of (O) are equal. The initially measured potential is then the open circuit potential
which depends mainly on the standard reduction potential of the redox pair and obeys the
Nernst equation:
E � E° 0.059
nlog
C�
C�
where CO and CR are the surface concentration of (O) and (R), respectively.
Once the (reducing) current step is applied, electrochemical reduction of (O) into (R)
takes place to support the applied current. Consequently, the concentration of (O) at the
electrode surface decreases while the concentration of (R) at the electrode surface increases.
This sets up a concentration gradient for both (O) and (R) between the bulk solution and the

9
Cur
rent
Time
Figure.1.4 Current excitation step in chronopotentiometry.
Pot
entia
l
Time
τ
Figure.1.5 Potential change response in chronopotentiometry.

10
electrode. As the concentrations of both (O) and (R) vary with time, so do the potential. Actually,
as long as the concentration of (O) does not reach zero at the electrode surface, the value of
the potential will be more or less around the formal potential of the redox pair as shown in the
initial part of the potential-time plot (Figure 1.5). Once the concentration of (O) at the electrode
surface becomes zero as a result of electrochemical reduction (Figure 1.6), the applied current
can no longer be supported by this electron transfer reaction, so the potential changes to the
redox potential of another electron transfer reaction. Provided that no other electroactive
species exists in solution, an electron transfer reaction with the electrolyte will take place
resulting in a large change in the potential. This is indicated as a sharp inflection from low to
high value on the potential-time curve (Figure 1.5).
Figure 1.6 Concentration-distance profiles for the electrochemical reduction of (O) to (R) under the effect of a constant current step.31
The time (τ) required for the concentration of (O) at the electrode surface to reach zero

11
depends upon the value of the applied current step (�) and decreases as (�) is increased.
Sandʼs equation defines the quantitative relationship between (�) and (τ):
���� �
��������
��
2
n: number of electrons transferred in the electrochemical reaction
F: Faraday's constant = 96,485.3365 C/mol.
C: bulk concentration of electroactive species
D: diffusion coefficient of electroactive species
Whenever the excitation current step is kept constant, the square root of electrolysis
time (τ) varies with the bulk concentration of the electroactive species for the same
electrochemical reaction.
One advantage of CP measurements is avoiding the interference from the charging
current which normally develops as a result of potential changes during the experiment. The
magnitude of the charging current is not constant and goes up with higher rates of change in
potential. This reduces the amount of current available for the Faradic reaction and renders the
measurement less reliable. Since the potential stays almost constant and centered around the
formal potential value of the electroactive species and does not change abruptly except at the
end of the CP experiment, the adverse effect of the charging current on the measurement is
almost cancelled
Another advantage of CP measurements is that the electrolysis time (τ) is independent
of the form of diffusion to the electrode surface, as the Sand equation holds for both spherical
and planar electrodes.
Finally the CP experiments are well suited for studying and characterizing the electrode
reaction. Studying the variation of the (���
�� parameter with the excitation current step (�) helps in
drawing a conclusion about the nature of the electrode reaction.

12
For a catalytic reaction such as the iron mediated coal electrolysis, ����
�� varies with ���
in a specific way. The value of the chemical reaction rate constant will have a noticeable effect
Figure 1.7 Variation of ����
�� with ��� for Catalytic Reaction31
on the ���
� value whenever the electrochemical reaction is run at sufficiently low current value.
As the current value become higher and higher, the ���
� value will depend only on the surface
concentration of the electroactive species and follow Sand equation. In other words, if the rate
constant of the chemical reaction is very small, its effect on ���
� value can be neglected. For all
the advantages mentioned above, the coal electrolysis reaction was studied under galvanostatic
conditions.
1.5 Thermal Analysis Techniques
The term thermal analysis (TA) is frequently used for analytical techniques that describe
the behavior of a sample as a function of temperature and involve differential scanning
calorimetry (DSC), differential thermal analysis (DTA), thermogravimetry (TGA), thermo-
mechanical analysis (TMA) and dynamic mechanical analysis (DMA).32
Here we will focus mainly on the TGA and DSC experiments as they are the ones that
would be extensively applied during this study. While TGA measures the change in the mass of
13
200 400 600 800
0
20
40
60
80
100
0
10
20
30
40
50
Tec
B
Exo DSC
TGA
Hea
t Flo
w (
W/g
)
Wei
ght (
%)
Temperature (oC)
A
Tsh
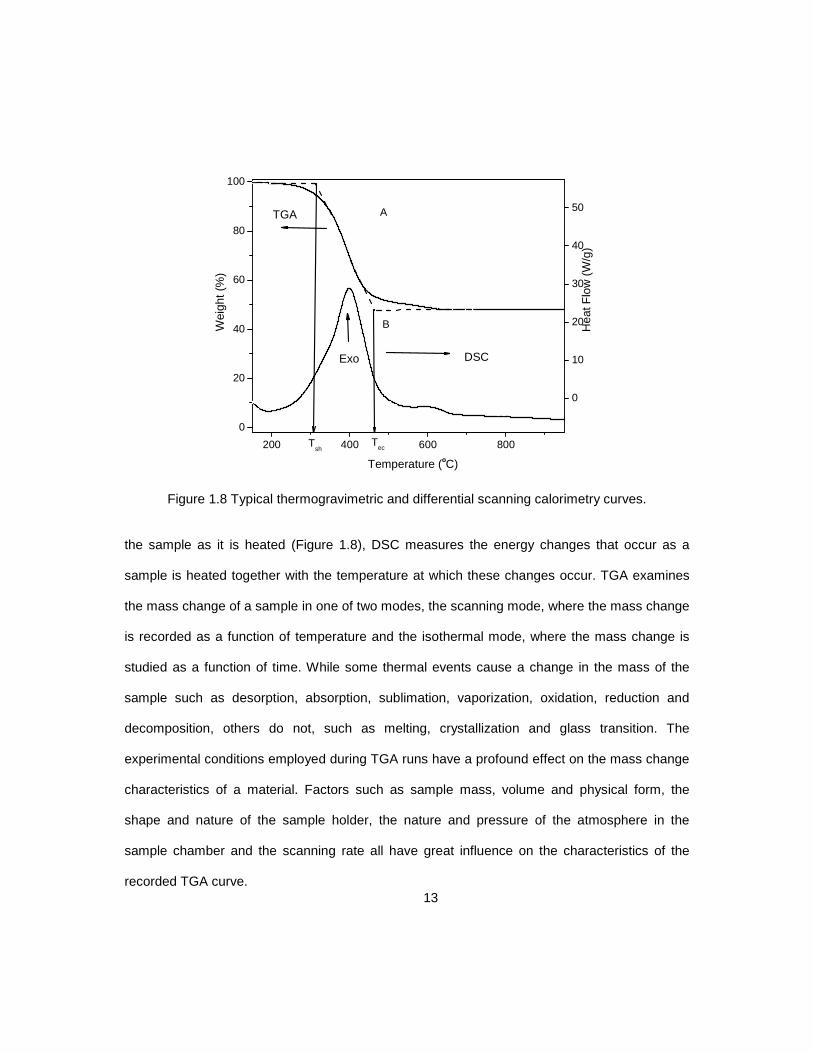
Figure 1.8 Typical thermogravimetric and differential scanning calorimetry curves.
the sample as it is heated (Figure 1.8), DSC measures the energy changes that occur as a
sample is heated together with the temperature at which these changes occur. TGA examines
the mass change of a sample in one of two modes, the scanning mode, where the mass change
is recorded as a function of temperature and the isothermal mode, where the mass change is
studied as a function of time. While some thermal events cause a change in the mass of the
sample such as desorption, absorption, sublimation, vaporization, oxidation, reduction and
decomposition, others do not, such as melting, crystallization and glass transition. The
experimental conditions employed during TGA runs have a profound effect on the mass change
characteristics of a material. Factors such as sample mass, volume and physical form, the
shape and nature of the sample holder, the nature and pressure of the atmosphere in the
sample chamber and the scanning rate all have great influence on the characteristics of the
recorded TGA curve.

14
TGA is not a black box technique and hence establishing the optimum conditions for
analysis is essential for reliable results. The experimental conditions should be recorded and
maintained within a given series of samples, so that curves from different experiments can be
compared in a meaningful way.
TGA curves are normally plotted with the mass change percentage on the y-axis and
temperature (T) or time (t) on the x-axis. A one-stage reaction process recorded in the scanning
mode is shown in Figure 1.8(A). The reaction is characterized by two temperatures, Ti
sometimes called Tsh (temperature of self-heating) and Tf or Tec (end of combustion
temperature). Tsh is the lowest temperature at which the onset of a mass change starts.
Similarly, Tec is the lowest temperature at which the mass change process is completed.
The data gleaned from the normal TGA run depends on the shape of the curve. Figure
1.9 shows seven main categories of TGA curves. Type (A) curves show no mass change over
the entire temperature range of the experiment. This takes place when the decomposition
temperature of the material is greater than the maximum temperature of the experiment. In such
a case, DSC can be used to look for non-mass-changing processes. Type B curves show large
initial mass loss followed by a mass plateau. This behavior normally corresponds to the
evaporation of volatile components, drying and desorption processes. The third category, type
C, is a single-stage decomposition reaction where the decomposition temperatures (Tsh and Tec)
are used to characterize the curve. Type D curves mark multi-stage decomposition processes
when the reaction steps are easily resolved. Type E curves, on the other hand, show up
whenever the individual reaction steps are not well resolved. In such a case the DTG
(differential TGA) experiments are often preferred as the characteristic temperatures can be
determined more accurately. Surface oxidation in the presence of an interacting atmosphere
leads to a mass increase as shown in type F curve. The final category, type G, takes place
when surface oxidation is followed by decomposition of the reaction products.

15
Figure 1.9 Classification of TGA curves.32
In quantitative DSC, the temperature difference between the sample and reference is
measured as a function of temperature or time, under controlled temperature conditions. The
temperature difference is proportional to the change in the heat flux. In other words, the main
property that is measured by DSC is heat flow, the flow of energy into or out of the sample as a
function of temperature or time. The unit used is W/g of sample on the y-axis (Figure 1.8 B).
Since W has units of J/s this is literally the flow of energy in unit time. The actual value of heat
flow measured is not absolute and depends largely on the effect of the reference. It is very
important that a stable baseline is obtained so that any changes can be measured. The starting
point of the curve on the y-axis should be set at or close to zero.

16
Figure 1.10 Schematic diagram of a differential scanning calorimetry instrument.32
1.6 Spectroscopic Techniques
1.6.1 Infrared spectroscopy
Infrared (IR) spectroscopy is a technique based on the vibrations of the atoms of a
molecule. An IR radiation is normally passed through the sample to determine what fraction of
the incident radiation is absorbed at a particular energy. The energy at which any peak in an
absorption spectrum appears corresponds to the frequency of a vibration of a part of a sample
molecule. Depending on the choice of the sampling technique a variety of samples can be
analyzed. Liquids, solutions, pastes, powders, films, fibers, gases and surfaces can all be
analyzed.33
The introduction of Fourier-transform spectrometers was one of the most important

17
advances in IR spectroscopy. The mathematical process of Fourier transformation has
dramatically improved the quality of infrared spectra and has minimized the time required for
data acquisition.
The selection rule for IR spectroscopy is that the electric dipole moment of the molecule
must change during the vibration to show infrared absorptions. The larger this change, the more
intense will be the absorption band. A molecule can only absorb radiation when the incident IR
radiation has the same frequency as one of the fundamental modes of vibration of the molecule.
This leads to increasing the vibrational motion of a small part of the molecule rather than the
entire molecule. An understanding of molecular symmetry and group theory is crucial for
assigning IR bands.
The interpretation of IR spectra is not that easy and may be complicated by a number of
factors. These factors involve overtone, combination bands, Fermi resonance and coupling.
They should be taken into account when looking at spectra as they can result in important
changes and misinterpretation of bands. Fourier transform IR (FTIR) spectroscopy is very useful
in probing the functional groups in coal and thus provides additional insight into coal structure.
For complex heterogeneous structures like coal, band assignments should be based on
comparison with standard patterns reported in the literature.
1.6.2 Raman spectroscopy
Raman spectroscopy uses a single frequency laser radiation to irradiate the sample.
The radiation scattered from the molecule, one vibrational unit of energy different from the
incident beam is measured. Thus, unlike infrared absorption, the energy difference between the
ground and excited states in Raman scattering does not need to match the energy of incident
radiation. The basic selection rule for intense Raman scattering is that the vibrations should
cause a change in the polarizability of the electron cloud around the molecule. The largest
changes and the greatest scattering usually results from symmetric vibrations. In infrared

18
absorption, on the other hand, the most intense absorption is caused by asymmetric
vibrations.34
Infrared and Raman spectroscopies are often complementary and usually used
together to give a better view of the vibrational structure of a molecule. Raman scattering is
normally expressed as a shift in energy from that of the exciting radiation and is often expressed
in cm-1 units. The most interesting features lie in the 3600-200 cm-1 range.34
Raman spectroscopy has been extensively used to obtain information about the degree
of ordering and crystallinity in carbonaceous materials. Raman bands, mainly the G (graphite)
and D (defect) bands at 1582 cm-1and 1357 cm-1, respectively, can provide such information.
The D band represents sp3 bonds (tetrahedral configurations) or it may represent disorder in
hybridized sp2 bonds (graphene edge configurations). G band represents sp2 bonds (planar
configurations). The G` mode (2600-2700 cm-1) is the second overtone of the defect-induced D
mode (Figure 1.11).35
The ratio between the D band and G band is normally used to study the quality of bulk
samples.36 Similar intensity of both bands is an indication of a high quantity of structural defects.
More details about the use of Raman spectroscopy to study the effect of different oxidation
treatments on multi-walled carbon nanotubes (MWCNT) will be given in Chapter 4.
1.6.3 X-ray photoelectron spectroscopy
X-ray photoelectron spectroscopy (XPS), previously known as electron spectroscopy
for chemical analysis (ESCA), is widely used to examine the surface of a material in its "as
received" state, or after some treatment. XPS is based on the photoelectric effect. The energy
of an incident X-ray photon overcomes the binding energy of a core-level electron which is then
excited and ejected from the analyte. The kinetic energies of the ejected photoelectrons, are
measured by an electron spectrometer (Figure 1.12).37

19
The binding energy of the photoelectron is characteristic of the orbital from which it
originates. A wealth of information about the sample can be obtained by analyzing the ejected
photoelectrons. A typical XPS spectrum is a plot of the number of electrons detected versus the
3000 2500 2000 1500 1000 5000
40
80
120
160
D band
Ram
an In
tens
ity (
a.u)
Raman Shift (cm-1)
G band
G` band
Figure 1.11 Raman spectrum of a multi-walled carbon nanotube (MWCNT) sample.
binding energy of the electrons detected. Each element produces a specific set of XPS peaks at
specific binding energies that can be used for its direct identification. Typically, the peaks in the
range from 0 eV to ~15eV in binding energy are attributed to valence electrons. The core-level
electron ejection appears at higher binding energies.
Qualitative elemental identification for the entire periodic table elements (except H and
He) can be achieved. Survey scans are obtained by recording low resolution spectra over a
broad binding energy range and aimed at simple identification of elements. Information about

20
the chemical (oxidation) state of elements is commonly carried out by acquisition of high
resolution spectra in binding energy regions of interest followed by peak-fitting.
Figure 1.12 Schematic design of an X-ray photoelectron spectrometer.37
Atoms of the same element in different chemical states can be identified by XPS.
Surrounding species can affect the binding energies of the core electrons; these changes are
called “chemical shifts.” and are generally less than 10 eV. Only the photoelectrons produced in
the top several nanometers of the sample are observed at their characteristic energies. This
corresponds to approximately 10 atomic layers of surface.
21
CHAPTER 2
PHOTOELECTROLYSIS OF COAL AND CARBON BLACKS
2.1 Literature Review
Fenton’s reagent was discovered about 100 years ago, but its application as an oxidizing reagent
for destroying toxic organics was not applied until the late 1960s. Fenton reaction processes are known to
be very effective in removing water pollutants and converting them completely into CO2. During Fenton
reaction, dissociation of H2O2 and the formation of highly reactive hydroxyl radicals takes place with
subsequent attack and destruction of the organic pollutants.38
Advanced oxidation techniques (AOT) is the general term given to the oxidation processes that
involve the generation of radical intermediates. Hydroxyl radicals (oxidation potential: 2.8 V) are so strong
oxidizing agents that they can non-specifically oxidize target compounds at high reaction rates (of the
order of 109 M−1s−1).39 Fenton’s oxidation process is one of the most widely applicable AOT. It depends on
the use of a mixture of H2O2 and ferrous iron to generate hydroxyl radicals according to the reaction
Fe2+ + H2O2 → Fe3+ + OH• + OH−
The decomposition of H2O2 is catalyzed by the ferrous iron (Fe2+) to produce hydroxyl radicals. The
generation of the radicals involves a complex reaction sequence in an aqueous solution. Walling40
simplified the overall Fenton chemistry by accounting for the dissociation of water.
2Fe2+ + H2O2 + 2H+ → 2Fe3+ + 2H2O
According to this scheme, the presence of H+ is required for the decomposition of H2O2 and to produce
the maximum amount of hydroxyl radicals. Various organic substrates (RH), can be attacked by the
hydroxyl radicals. For example, hydroxyl radicals can add to the aromatic or heterocyclic rings (as well as
to the unsaturated bonds of alkenes or alkynes). Thus, the Fenton reaction has been lately tested as a
potential method for wastewater treatment. 41
The efficiency of the Fenton process can be improved by combining it with UV light, in the so-

22
called photo-Fenton reaction. The increased efficiency was attributed to the decomposition of the photo-
active Fe(OH)2+ complex which leads to the production of two hydroxyl radicals for each molecule of H2O2
decomposed.41
Fe(OH)2+ + hν → Fe2+ + •OH
Below, we present the first example of the effects of ultraviolet (UV) illumination on the anolyte in
a coal (lignite) electrolysis cell. Since the first report in 1979 on the “electrochemical gasification” of coal
water slurry (or coal electrolysis) as a method of hydrogen production, there has been intense interest on
this topic. Mechanistically, a consensus has emerged for components leached from the coal matrix into
the aqueous medium (e.g., Fe2+/3+) that serve as redox mediators to shuttle the electrons between the
coal particles and the anode surface. It occurred to us that light can be used as a mechanistic probe of
this hypothesis especially given that a photo-Fenton-like mechanism41 can be used to generate potent
free radicals in solution even without an additive such as hydrogen peroxide. We show below that
hydroxyl radicals (•OH) and other reactive oxygen species (ROS) photogenerated via this mechanism can
enhance hydrogen production in the cathode compartment of a coal photoelectrolysis cell.
Light has been used by previous authors in other scenarios with coal (or carbon) slurries in
water.42–44 Thus UV-irradiated and platinized titanium dioxide (Pt-TiO2) was used in conjunction with
active carbon or lignite to generate H2, CO2, and O2 from aqueous suspensions. The water-gas shift
reaction over platinized, powdered TiO2 was also found by the same research group to be
photocatalytic.44 In all these cases, however, the excitation light activated the oxide semiconductor
generating electronic carriers that then influenced electrochemical processes at the particle-solution
interfaces. Contrastingly, in the present study, light was used to modulate chemical reactions in the
solution phase generating very reactive •OH species and other ROS that oxidatively attack the coal
matrix.

23
Two carbon black samples were also included in this study for comparative purposes: (a) to
assess the effect of oxidizability of the carbon matrix (relative to lignite coal); and (b) to examine the
influence of graphitization of the carbon black on its ease of oxidation.
2.2 Experimental
A sample of lignite for this portion of the dissertation study was obtained from Jewett, Texas, and
ground to pass a 200 mesh sieve. Ultimate analysis data for this lignite coal yielded 38.30 % C, 2.75 % H,
11.25 % O, 0.66 % N, 0.90 % S, 30.73 % moisture, and 15.52 % ash. The surface area (as measured via
nitrogen adsorption and the BET model) was 3.24 m2/g, which included 0.82 m2/g of micropore area and
2.42 m2/g of external surface area. Two samples of carbon black were obtained from Sid Richardson
Carbon & Energy Co (Fort Worth, TX): SRC-401 and SRC-159HN. The latter had been graphitized prior
to use by heating at 1800 °C for 1 h followed by treatment with conc. HNO3 for another hour. These
samples had ash contents less than 1.0 % and 0.5 % and surface areas of 59 m2/g and 260 m2/g,
respectively.
Ferrous sulfate 7-hydrate (AR) and ferric ammonium sulfate 12-hydrate (AR) were from J.T.
Baker and Mallinckrodt, respectively. Sulfuric acid was supplied by Alfa Aesar. All chemicals were used
as received and all aqueous solutions and slurry suspensions were prepared using de-ionized water.
The custom-designed photoelectrolysis cell had two compartments separated by a fritted glass
membrane that prevented metal ions and coal particles from passing to the cathode compartment but yet
allowing electrolytic contact between the two compartments. A stainless steel sheet (2.89 cm2) was used
as the working electrode (anode) except for the galvanostatic experiments where a Pt anode (11 cm2
area) was used. A Pt wire, dipped in 1 M H2SO4, was used as a counter electrode. The reference
electrode was an Ag/AgCl/3 M NaCl electrode; all potentials below are quoted relative to this reference
electrode. The anode compartment was made of quartz to allow UV light from the illumination source to
reach the anolyte. The anolyte solution was continuously stirred with a magnetic stirrer to keep the lignite

24
coal or carbon black particles in suspension.
The anolyte was illuminated using an ozone-free 450-1000 W Model 66355 Xe arc lamp
(Newport-Oriel). The radiant output of the lamp was 192 mW/cm2 translating to a photon flux of 4.2 x 10¹⁷
photons/s.cm2 over the wavelength range: 250-700 nm. To minimize heating effects from the infrared
component of the lamp output, a quartz water filter was placed between the photoelectrolysis cell and the
lamp. The water was replaced with an aqueous suspension of coal particles for the blank experiments
(see below) to maintain the light flux almost the same as that of the samples.
The reaction mixture contained variable amounts (specified below) of Fe(II) and Fe(III) species
dissolved in either 0.01 M or 1 M H2SO4. The pH was adjusted to 1.3 using 1 M NaOH. Although the
optimum pH for the photo-Fenton-like reaction is known to be in the range: 2-3,14 the pH was intentionally
kept at 1.3 in this study to avoid precipitation of iron (III) hydroxides. The lignite coal and carbon black
dose in the slurry suspensions for the galvanostatic experiments was 20 g/L unless otherwise noted (i.e.,
in the blank experiments where the lignite coal or the black were omitted). A much lower dose of 0.2 g/L
was chosen for the experiments with UV irradiation because higher coal or carbon black levels would
have otherwise blocked the light from reaching the anolyte bulk.
A CH Instruments Model CHI600C electrochemical analyzer was used for the galvanostatic and
voltammetry experiments. To monitor and quantify the amount of CO or CO2 evolved during the
photochemical reaction, a specially designed UV quartz reactor was used.15 This reactor, as described in
detail elsewhere, 45 ensures effective mixing of the suspension, cooling and allows for periodical
collection of aliquots for GC analyses. SRI 310C gas chromatograph fitted with a ShinCarbon ST column
and a thermal conductivity detector was used for evolved gas analyses. Infrared spectrophotometric
analysis of the lignite coal samples was carried out using a Bruker Alpha instrument.
2.3 Results and Discussion
2.3.1 Iron redox and photochemistry

25
In this study, an externally added Fe2+/3+ redox mediator was employed to shuttle the electrons
between the anode and the lignite coal (or carbon black) surface.46 Figure 2.1 contains results from
galvanostatic experiments (constant current: 50 mA) for two blank solutions and one test suspension
containing lignite coal. Blank 1 was 1 M H2SO4 while Blank 2 consisted of 100 mM each of Fe (II) and
Fe(III) species dissolved in 1 M H2SO4. The test suspension contained in addition lignite coal particles
suspended in it. The contrasting chronopotentiometric profiles in Figure 2.1 between Blank 1 on the one
hand, and Blank 2 and the test suspension on the other, underline the advantage with the use of coal and
Fe2+/3+ as anode depolarizers.7,47,48
The electrolysis of water can be sustained at a potential as low as ~0.8 V as opposed to the
Blank 1 case where the anode potential reaches ~1.8 V to sustain the imposed current flow in the cell.
The upswing in the anode potential at times longer than ~170 min (for Blank 2) and ~250 min for
the test suspension diagnoses the saturation of oxidative capacity in the medium, and the potential now
moves toward that corresponding to neat water electrolysis to sustain the current flow. Note that the
upswing is delayed for the test suspension relative to Blank 2. This trend can be rationalized by the notion
that the addition of lignite coal to the medium increases the oxidative capacity relative to the neat Fe2+/3+
case, diagnostic of the susceptibility of the lignite coal surface to be oxidized by Fe (III) species in
solution.
More germane to this study is what happens when the anolytes are irradiated by the UV light
source. The current-potential curves labeled ‘a’ and ‘b’ in Figure 2.2 show the voltammetric behavior for
the iron redox solution (with the Fe(II) and Fe(III) concentrations now at 200 mM and 300 mM
respectively) in 0.01 M H2SO4 “in the dark” and under illumination (for 30 min) respectively. The wave
associated with the Fe2+/3+ redox couple is markedly enhanced under illumination of the anolyte. This
trend is consistent with the net photoconversion of Fe (III) to Fe (II) species that can then be oxidized at
the anode.

26
0 50 100 150 200 2500.0
0.2
0.4
0.6
0.8
1.0
1.2
1.4
1.6
1.8
2.0
Blank 2
Blank 1
Time / min
Pot
entia
l / V
vs.
Ag/
AgC
l
[Coal] = 20 g/L
Figure 2.1 Galvanostatic profiles for two blank solutions and a lignite coal suspension with added iron redox mediator.
2.3.2 Experiments with Lignite Coal and Carbon Black
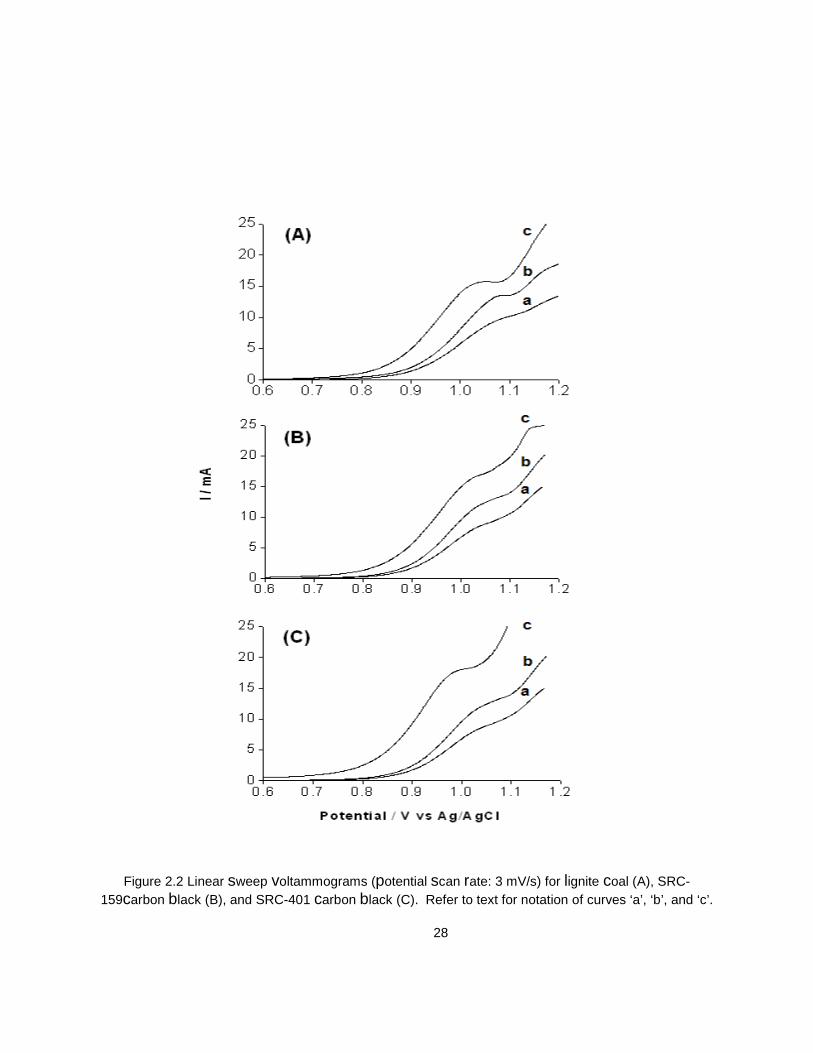
Curves labeled ‘c’ in Figures 2.2A-C show the voltammetric behavior of lignite coal and the two
samples of carbon black (SRC-159and SRC-401) in the presence of 200 mM Fe2+/300 mM Fe3+/0.01 M
H2SO4 and UV illumination. The curves ‘a’ and ‘b’ are the blank runs (see above) reproduced in all the
three frames for comparison. Worthy of note are the following trends:
(a) In all the three cases, the onset potentials for the current-potential curves are markedly shifted in the
negative direction relative to the blank cases.
(b) The mass transport-limited plateau currents (associated with the Fe2+/3+ couple) are significantly
enhanced (by ~15%) for the coal suspension case (Figure 2.2A) and ~12% and ~33 % for the two carbon
black samples respectively (Figures 2.2B and 2.2C) relative to the irradiated blanks.

27
(c) Both the onset potential shift and the plateau currents are ordered thus: SRC-401 > lignite coal =
SRC-159HN.
Clearly the above trends are rooted in the further conversion of Fe (III) to Fe(II) species in the
presence of lignite coal or carbon black in the medium. Another way of mechanistically interpreting these
trends is that the (oxidizable) lignite coal or carbon black particles scavenge (intercept) the free radicals
generated by the photo-Fenton-like mechanism (see below) before they can oxidize the Fe(II) species to
Fe(III) species. The fact that the SRC-401carbon black sample affords a higher plateau current than
lignite coal can be rationalized on the basis of both the much higher (oxidizable) carbon content of the
black and the higher surface area relative to the (low grade) coal. On the other hand, and interestingly
enough, the higher current observed for SRC-401 relative to SRC-159 is not rooted in surface area
differences; in fact, SRC-401 has a lower surface are (Experimental section). The structure of the two
carbon blacks, i.e., the degree to which the carbon particles are joined in aggregate clusters or chains is
also comparable as measured by the oil absorption number (ASTM D2414). Clearly, graphitization of the
black surface (as in the SRC-159 case) lowers its susceptibility toward oxidation leading to the observed
difference between SRC-401 and SRC-159HN. By extrapolation, the conclusion is inevitable that surface
area differences alone cannot account for the (electron transfer) reactivity differences between the lignite
coal and the two carbon black samples.
Figure 2.3 contains results showing the effect on plateau current of the illumination time both for
Blank 2 (as in curve ‘b’ in Figure 2.2 but for variable times) and for a suspension containing lignite coal in
addition. The effect of illumination clearly saturates at times longer than ~20 min beyond which competing
effects from back-reactions start to play a balancing role in the current flow. Curve ‘c’ in Figure 2.3
illustrates the temperature evolution in the photoelectrolysis cell as concomitantly monitored in these
experiments.
28
Figure 2.2 Linear sweep voltammograms (potential scan rate: 3 mV/s) for lignite coal (A), SRC-159carbon black (B), and SRC-401 carbon black (C). Refer to text for notation of curves ‘a’, ‘b’, and ‘c’.

29
0 10 20 30 40 50
6
8
10
12
14
16
18
Time/min
I/mA
0
10
20
30
40
50
60
70
80
90
100
c
a
b
Tem
p/ oC
Figure 2.3 Photocurrent-time profiles (measured at 1.10 V, see Figure 2.2) for: (a) 0.2 M Fe(II)+ 0.3 M Fe(III) in 0.01 M H2SO4+x min UV irradiation; and (b): a + 0.02 g/mL lignite coal. The temperature
changes in the photoelectrolysis cell are mapped in (c).
Clearly, the current enhancements noted above cannot be trivially attributed to anolyte heating (and
consequent mass-transport enhancement) as a result of the irradiation.
Finally, the lignite coal sample was subjected to prolonged UV irradiation under comparable
chemical conditions as in the photoelectrolysis cell. GC analyses of the evolved gases in the anolyte
revealed the gradual increase in the amount of CO2. After 4 h of illumination, another peak for CO started
to appear.

30
0 8 17 25 33 420.0
2.5
5.0
1 Hr.
Retention Time (min.)
Sig
nal I
nten
sity
(µ
V)
\ 102
0.0
2.5
5.0
CO22 Hr.
0.0
2.5
5.0
4 Hr.
0.0
2.5
5.0
CO 6 Hr.
0.0
2.5
5.0
8 Hr.
Figure 2.4 GC analysis of the gases evolved during the photochemical oxidation of coal slurry (0.02 g %).
2.3.3 General Discussion
The iron redox species were shown above as Fe2+ and Fe3+ only for notational convenience. It is
recognized that these species exist as aqua complexes in solution, and among the Fe(III) species, the
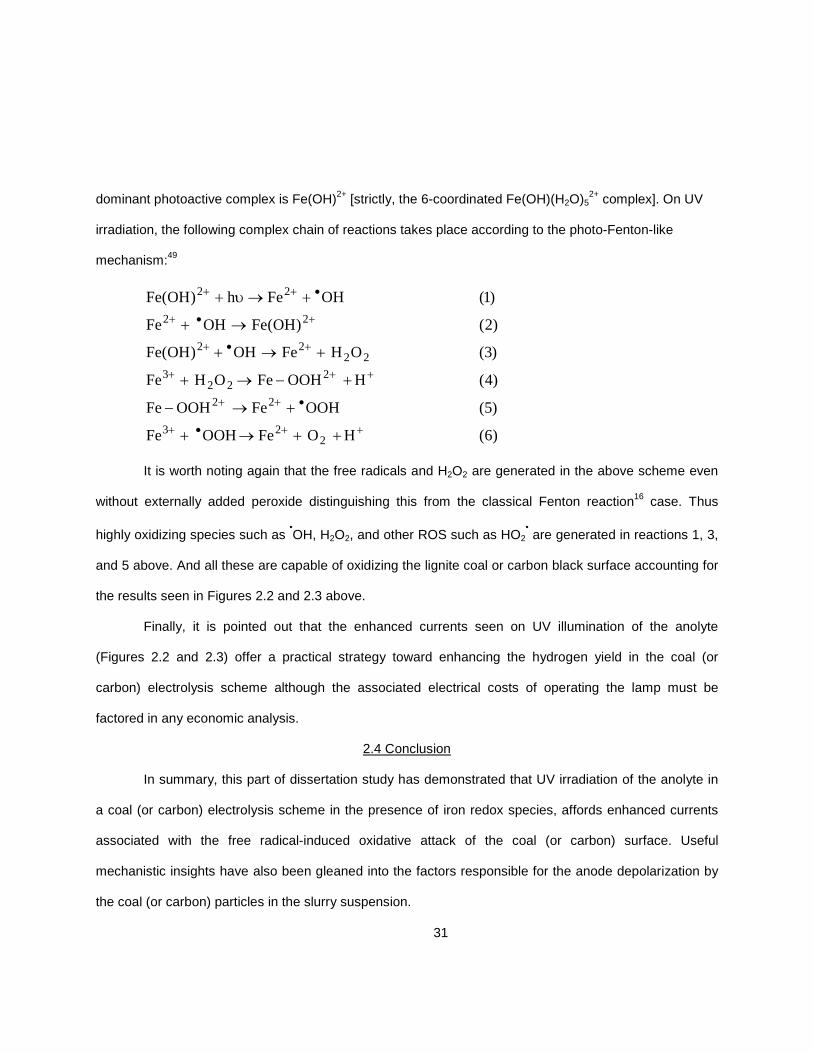
31
dominant photoactive complex is Fe(OH)2+ [strictly, the 6-coordinated Fe(OH)(H2O)52+ complex]. On UV
irradiation, the following complex chain of reactions takes place according to the photo-Fenton-like
mechanism:49
)6(HOFeOOHFe
)5(OOHFeOOHFe
)4(HOOHFeOHFe
)3(OHFeOH)OH(Fe
)2()OH(FeOHFe
)1(OHFeh)OH(Fe
223
22
222
3
2222
22
22
++•+
•++
+++
+•+
+•+
•++
++→+
+→−
+−→+
+→+
→+
+→υ+
It is worth noting again that the free radicals and H2O2 are generated in the above scheme even
without externally added peroxide distinguishing this from the classical Fenton reaction16 case. Thus
highly oxidizing species such as •OH, H2O2, and other ROS such as HO2
• are generated in reactions 1, 3,
and 5 above. And all these are capable of oxidizing the lignite coal or carbon black surface accounting for
the results seen in Figures 2.2 and 2.3 above.
Finally, it is pointed out that the enhanced currents seen on UV illumination of the anolyte
(Figures 2.2 and 2.3) offer a practical strategy toward enhancing the hydrogen yield in the coal (or
carbon) electrolysis scheme although the associated electrical costs of operating the lamp must be
factored in any economic analysis.
2.4 Conclusion
In summary, this part of dissertation study has demonstrated that UV irradiation of the anolyte in
a coal (or carbon) electrolysis scheme in the presence of iron redox species, affords enhanced currents
associated with the free radical-induced oxidative attack of the coal (or carbon) surface. Useful
mechanistic insights have also been gleaned into the factors responsible for the anode depolarization by
the coal (or carbon) particles in the slurry suspension.
32
CHAPTER 3
CHEMICAL PRE-TREATMENT OF COAL AND CARBON BLACKS
3.1 Introduction
In what follows, the consequences of chemical pre-treatment of coals of varying rank and selected
carbon black samples, on their ability to generate hydrogen in an electrolytic environment are explored.
Concurrently, thermal analyses (differential scanning calorimetry or DSC and thermogravimetry or TGA)
were performed on these pre-treated samples to investigate the consequences in terms of corresponding
alterations in thermal reactivity. The chemical pre-treatment consisted of digestion with strong acid (1 M
each of HClO4, H2SO4, or HNO3) or by stirring the coal, carbon black or multiwalled carbon nanotube
(MWCNT) sample with 35 % H2O2 overnight. The influence of H2O2 pre-treatment is shown below to be
critically dependent on the coal rank. Further, coal samples respond differently relative to carbon black
surfaces in terms of how the hydrogen-generating capacity and thermal reactivity are altered by either
acid or H2O2 pre-treatment. The chemical groups that are responsible for such enhancement and how it
affects both the chemical and electrochemical processes involved in coal electrolysis are also explored.
The introduction of oxygen functional groups, especially the carbonyl groups, on the coal surface
would selectively improve the chemical reactivity of coal and hence facilitates the elctron transfer between
coal and iron (III) ions. MWCNTs were also included because of their chemical stability and well-defined
chemical structrure which makes it easier to trace and identify any surface functional groups created as a
result of different treatments. MWCNTs have been separately subjected to more powerful oxidation
treatment with KMnO4 to effect surface modification. We also separately quantify the contribution of TXLC
and the redox mediator to the anodic current in an iron mediated electrolytic environment.
33
3.2 Experimental
3.2.1 Chemicals, materials, and electrolysis cell
Three types of coal and two types of carbon black samples were used in this part of the
dissertation study (Table 2.1). The focus of this study was Texas lignite (as in our previous companion
study reported elsewhere50), for comparison purposes, the coals were carefully chosen to cover the range
from high-rank (DECS21), intermediate-rank (DECS10), to low-rank (TXLC). Proximate analysis data on
these coals are given in Table 2.2. All the coal samples were finely ground and sieved to pass 200 mesh
before use. The two carbon black samples were obtained from Sid Richardson Carbon & Energy Co (Fort
Worth, TX) and are hereafter designated: SRC-401 and SRC-159 respectively (Table 2.I).
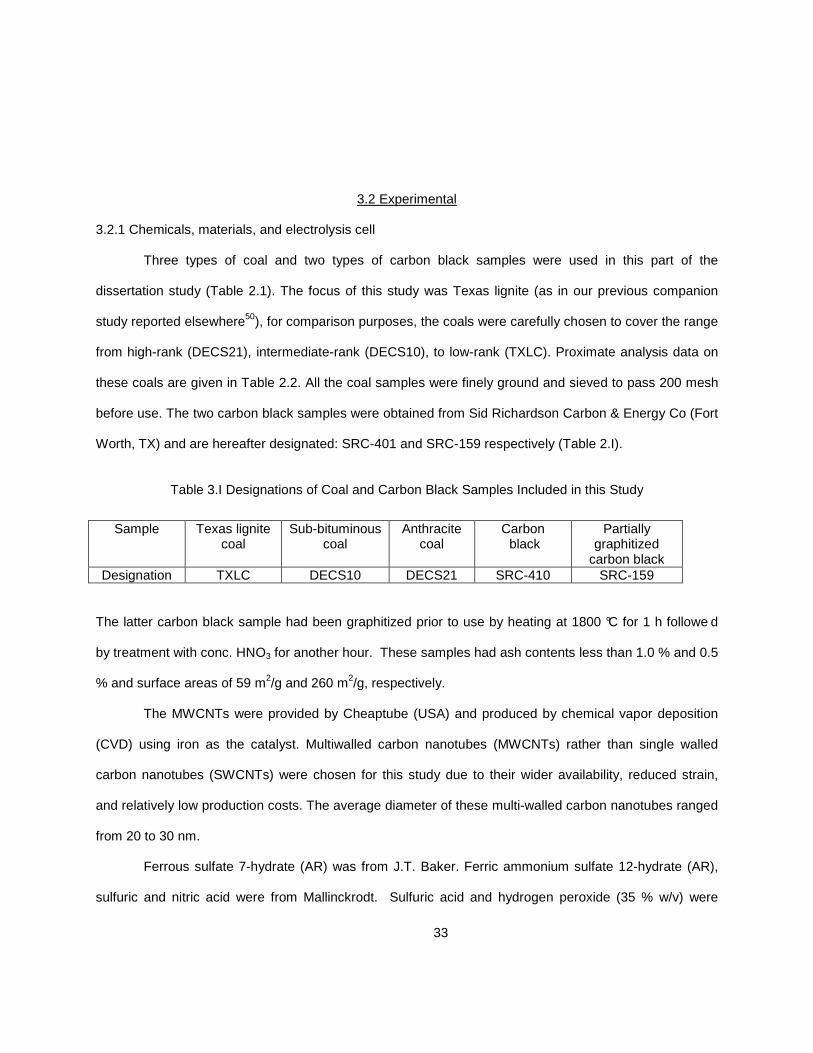
Table 3.I Designations of Coal and Carbon Black Samples Included in this Study
The latter carbon black sample had been graphitized prior to use by heating at 1800 °C for 1 h followe d
by treatment with conc. HNO3 for another hour. These samples had ash contents less than 1.0 % and 0.5
% and surface areas of 59 m2/g and 260 m2/g, respectively.
The MWCNTs were provided by Cheaptube (USA) and produced by chemical vapor deposition
(CVD) using iron as the catalyst. Multiwalled carbon nanotubes (MWCNTs) rather than single walled
carbon nanotubes (SWCNTs) were chosen for this study due to their wider availability, reduced strain,
and relatively low production costs. The average diameter of these multi-walled carbon nanotubes ranged
from 20 to 30 nm.
Ferrous sulfate 7-hydrate (AR) was from J.T. Baker. Ferric ammonium sulfate 12-hydrate (AR),
sulfuric and nitric acid were from Mallinckrodt. Sulfuric acid and hydrogen peroxide (35 % w/v) were
Sample Texas lignite coal
Sub-bituminous coal
Anthracite coal
Carbon black
Partially graphitized
carbon black Designation TXLC DECS10 DECS21 SRC-410 SRC-159

34
supplied by Alfa Aesar. All chemicals were used as received and all aqueous solutions and slurry
suspensions were prepared using de-ionized water.
The three-electrode electrolysis cell consisted of a glass beaker containing a Pt foil (11 cm2 area)
anode. The coal or carbon black slurries were stirred with a magnetic stirrer to keep the particles in
suspension and to maintain a constant flux of the mediator redox species (see below) to the electrode
surface. A glass tube ending with a fritted glass disc (to prevent metal ions and coal particles from
passing to the cathode compartment but yet allowing electrolytic contact between the two compartments)
contained the catholyte (1 M solution of the corresponding acids) and a Pt wire cathode. The cathode
tube was sealed from the other end except at a small aperture that allowed the collection of hydrogen
over the surface of water in an inverted cylinder setup. The reference electrode was an Ag/AgCl/3 M NaCl
electrode; all potentials below are quoted relative to this reference electrode. For the galvanostatic
polarization experiments, the reaction mixture contained a fixed amount (40 ml) of 0.1 M solution of Fe(II)
/ Fe(III) mixture dissolved in 1 M H2SO4.
Table 3.2. Proximate and Ultimate Analysis Data for the Studied Coal Samples
Designation TXLC DECS10 DECS21
Coal Rank Lignite Sub-bituminous Anthracite
Proximate analysis (dry)
% Ash 22.40 12.56 11.15
% Vol. matter (dry) 44.20 41.76 4.51
% Fixed carbon 33.40 45.77 84.34
Ultimate analysis (dry)
% Carbon 55.29 68.73 80.26
% Oxygen 16.09 13.30 3.82
35
The coal, carbon black and MWCNT dose in the slurry suspensions was 20 g/L (coal and carbon black)
and 4 g/L, respectively, in the galvanostatic polarization experiments in both galvanostatic polarization
and voltammetric experiments unless otherwise noted.
3.2.2 Acid digestion, H2O2 and KMnO4 pre-treatments
Acid digestion of TXLC and SRC-401 was carried out in a beaker by boiling 1.6 g of the sample
in 80 ml of 1 M acid (HClO4, H2SO4 or HNO3) for 20 min with stirring. The treated slurries were cooled and
quantitatively transferred (without filtration) to the electrochemical cell. For the voltammetric runs, no
externally-added iron redox mediator (see below) was used, while 40 ml aliquot of 0.1 M solution of Fe(II)
/ Fe(III) mixture in 1 M H2SO4 was added prior to the galvanostatic polarization runs. In all cases the final
volume of the slurry was adjusted to 80 ml with an appropriate amount of the corresponding 1 M acid. For
TGA and X-ray photoelectron spectroscopy (XPS) analyses, the acid-digested slurries were filtered and
thoroughly washed with distilled water till the washings were neutral to pH paper, and then dried at 110
°C overnight. Wet oxidation with H 2O2 was performed by simply stirring the samples with 35 % H2O2
overnight. The oxidized slurries were then filtered and thoroughly washed with distilled water and dried at
110 °C overnight. The pristine MWCNTs were chemical ly oxidized in H2SO4/500 wt% KMnO4 and
subsequently named (MWCNT-K). After oxidation, the samples were thoroughly washed and dried before
characterization to monitor the change in their surface groups. It should be mentioned here that TXLC
samples cannot withstand the KMnO4 treatment and have been dissolved completely and cannot be
subsequently separated from the oxidizing agent.
3.2.3 Instrumentation
AMETEK Solartron Multichannel Cell Test System Model 1470E and CH Instruments Model CHI
600C electrochemical analyzer were used for the galvanostatic and voltammetric experiments
respectively. Simultaneous TGA/DSC analyses were performed on a TA Instruments Model SDT Q600.
Variables such as sample mass, gas flow rate and heating rate were kept constant between runs to make

36
comparisons meaningful. Raman spectra were acquired using a Thermo Fisher Raman micro
spectrometer. The excitation source was a He–Ne laser (633 nm, 1.96 eV), focused (50x objective) to a
spot size of approximately 2.1 µm. The spectral resolution was 5.8-8.8 cm-1 and the laser power was 5
mW. Fourier-transform infrared (FTIR) spectra were recorded using an IR Prestige-21 (SHIMADZU) FTIR
spectrometer. The samples were mixed with potassium bromide (KBr), pressed into pellets of 1 mm
thickness and measured in the absorption mode. A Kratos Axis 165 Ultra instrument was used for XPS;
other details of the spectroscopic analyses are given elsewhere.45
3.3 Results and Discussion
3.3.1 Redox mediation of coal oxidation
Consensus has emerged that electrooxidation of the coal surface involves reversible (or quasi-
reversible) redox mediators such as Fe3+/2+ that are already present in the coal matrix. An undoubtedly
over-simplified scheme for the chemical and electrochemical processes taking place during coal
electrolysis is as follows where the coal is simply represented as C(s) and the oxidized surface of it is
denoted as C(ox)(s):
At the anode:
4e4H(g)2COO(l)22HC(s)
e3Fe2Fe
+++→+
++
→+
In solution:
+++ ++→++ 22(ox)2
3 Fe2mH(g)]CO(g),CO(s),C[O(l)mHC(s)Fe
At the cathode:
(g)2H2e2H →++
Several redox mediators have been deliberately added to the suspension such as V5+/3+, Mn3+/2+,
Ce4+/3+, Fe3+/2+, I3-/I-, and Fe(CN)6
3-/4- by previous researchers.6,29 For this study we opted to use the
Fe3+/2+ redox couple as an oxidation mediator. The rationale for this choice was the ability of Fe3+ species

37
to (partially) oxidize the bulk carbon phase as well as the surface functional groups of coal. In addition, it
can be anodically regenerated at a low potential (0.8 V), much lower than the oxygen evolution reaction.
Finally, Fe(II) / Fe(III) species are soluble in water and in acidic solutions and chemically stable over a
long period of time under normal storage conditions.13
3.3.2 Acid digestion of Texas lignite coal and carbon black
3.3.2.1 Voltammetric Experiments
The linear sweep voltammetric curves in Figure 3.1 show that the applied potential required for
initiating the oxidation of TXLC slurry varies according to the type of 1 M acid used in the digestion step.
For both 1 M HClO4 and I M H2SO4, oxidation of the coal slurry started at an applied potential of 0.43 V
and became mass-transfer limited at about 0.8 V. On the other hand, digestion with 1 M HNO3 rendered
the oxidation process more difficult with a required applied potential of 0.85 V and an absence of the
mass transfer limited region due to overlap with the water oxidation wave. In all the cases, the anodic
current is attributable to the oxidation of Fe2+ (leached from the inorganic content of the coal matrix) at the
anode surface.51 The higher anodic current density in 1 M HClO4 case compared to the H2SO4 case can
be simply attributed to the better ability of 1 M HClO4 to dissolve the iron content of the coal matrix.
A study of the effect of digestion time in 1 M H2SO4 on the limiting current density at 0.8 V was
carried out and the results are shown in Figure.3.2. After a boiling time of 15 min, the limiting anodic
current density did not change, indicating the complete leaching of iron content of TXLC. Therefore a
digestion time of 20 min was considered sufficient for all acid digestion treatments. The absence of any
anodic current at 0.8 V in 1 M HNO3 is due to the complete chemical oxidation of Fe2+ to Fe3+ species by
the oxidizing acid during the digestion step. Although the ability of boiling HNO3 to oxidize Fe2+ to Fe3+ is
well known, we carried out a cyclic voltammetry (CV) experiment to confirm this hypothesis. Figure 3.3
shows the CV curves for an equimolar (1 mM) Fe2+/3+ mixture in 1 M H2SO4 before (b) and after (c) boiling
with HNO3 acid in addition to a blank of 1 M KNO3 solution (a). As the potential was scanned in the

38
positive direction, curve (c) shows the absence of any initial anodic current compared to curve (b),
marking the complete conversion of Fe2+ into Fe3+ as a result of the HNO3 treatment. Correspondingly the
cathodic peak (curve c) which corresponds to the reduction of Fe3+ into Fe2+ is well-defined and shows a
higher cathodic current relative to curve (b).
3.3.2.2 Galvanostatic Polarization Experiments
Figure 3.4 contains results from galvanostatic polarization experiments (constant current: 50 mA,
implying a current density of 4.5 mA/cm2) for two blank solutions (a, c) and three test suspensions (b, d
and e) containing acid-treated TXLC. Blank 1 consisted of 40 mL
0.5 0.6 0.7 0.8 0.9 1.0 1.1 1.20.0
0.1
0.2
0.3
0.4
0.5
1 M HNO3
1 M H2SO
4
1 M HClO4
j (m
A/c
m2 )
E (V) vs Ag/AgCl
Figure 3.1. Linear sweep voltammograms (potential scan rate: 3 mV/s) for 20g/L TXLC slurries after digestion in different 1 M acids without externally added iron redox mediator.

39
aliquot of 0.1 M each of Fe(II) and Fe(III) species in 1 M H2SO4, while Blank 2 contained the
stated amount of the redox mediator and 2 % (by mass) dose of untreated TXLC in 1 M H2SO4.
The test suspensions contained the acid-treated slurry in addition to the redox mediator.
0 5 10 15 20 250.0
0.1
0.2
0.3
0.4
j (m
A/c
m2 )
Time (min)
Figure 3.2. Effect of acid digestion time on the limiting current values for stirred TXLC slurries (20 g/L in 1 M H2SO4) at room temperature (data from Figure 3.1).
In interpreting these profiles, note that there are two plateaus, namely ca. 0.6 V and ca. 1.6 V;
where the potential remains constant. These regimes are associated with Fe (II) oxidation and
water oxidation at the anode surface respectively. The longer the plateau (with respect to the
time axis) at the lower potential, the higher is the H2 electrolytic yield from the coal electrolysis.

40
A shorter time span (before the potential jumps) signals that all the oxidizable species on the
coal are used up.
The difference in the chronopotentiometric profiles (longer polarization time in Blank 2)
between Blank 1 (curve a) and Blank 2 (curve c) can be attributed to:
0.2 0.3 0.4 0.5 0.6 0.7 0.8 0.9-20
-10
0
10
20
c
a
(a) 1M KNO3 in 1M KCl
(b) 1mM Fe2+/3+
(c) 1mM Fe2+/3+ boiled with one drop of conc. HNO3
I (µA
)
E (V) vs Ag/AgCl
b
Figure 3.3 Cyclic voltammograms (scan rate: 3 mV/s) for blank (a) and equimolar 1mM Fe2+/3+ mixture in 1 M H2SO4 before (b) and after boiling with one drop of conc. HNO3 (c).
i) The extra amount of Fe (II) leached out of the TXLC matrix during the run which can
depolarize the anode surface for a longer time.
ii) The extra amount of Fe (II) that can be regenerated as a result of the redox reaction between
Fe (III) and TXLC particles.
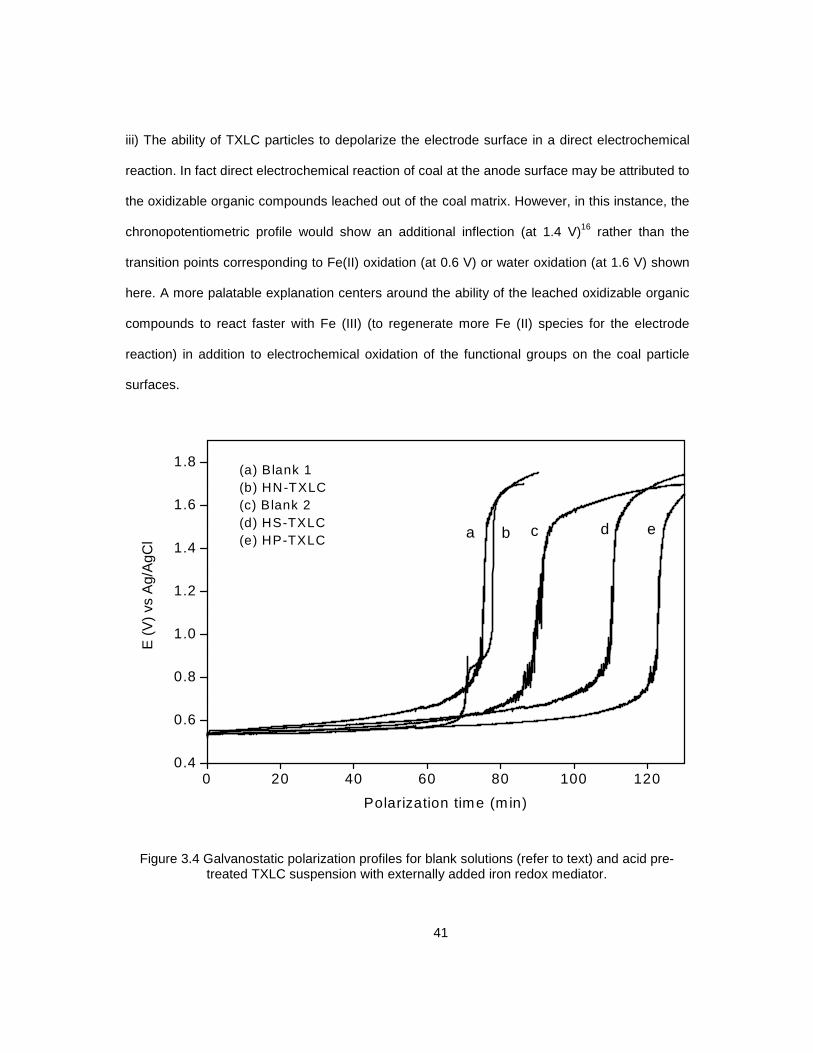
41
iii) The ability of TXLC particles to depolarize the electrode surface in a direct electrochemical
reaction. In fact direct electrochemical reaction of coal at the anode surface may be attributed to
the oxidizable organic compounds leached out of the coal matrix. However, in this instance, the
chronopotentiometric profile would show an additional inflection (at 1.4 V)16 rather than the
transition points corresponding to Fe(II) oxidation (at 0.6 V) or water oxidation (at 1.6 V) shown
here. A more palatable explanation centers around the ability of the leached oxidizable organic
compounds to react faster with Fe (III) (to regenerate more Fe (II) species for the electrode
reaction) in addition to electrochemical oxidation of the functional groups on the coal particle
surfaces.
0 20 40 60 80 100 1200.4
0.6
0.8
1.0
1.2
1.4
1.6
1.8
edcb
(a) Blank 1(b) HN-TXLC(c) Blank 2(d) HS-TXLC(e) HP-TXLC
E (
V)
vs A
g/A
gCl
Polarization time (m in)
a
Figure 3.4 Galvanostatic polarization profiles for blank solutions (refer to text) and acid pre-treated TXLC suspension with externally added iron redox mediator.

42
The comparison between Blank 2 (curve c) which corresponds to as-received TXLC
and the H2SO4-treated TXLC (HS-TXLC) (curve d) or HClO4-treated TXLC (HP-TXLC) (curve e)
samples shows the beneficial effect of coal pre-treatment on the polarization time and hence the
amount of hydrogen generated at the cathode. The HClO4 treatment was found to be better
than H2SO4 treatment as indicated by a larger increase in polarization time. Table 3.3 shows a
comparison between the different treatments in terms of the polarization time and the amount of
hydrogen generated at the cathode. The better performance of HP-TXLC sample can be related
to the better ability of HClO4 to dissolve the pyrite and the other forms of iron (II) in coal and
also to its better oxidizing power. In addition to the factors i), ii), and iii) identified above,
mechanical disintegration of the coal particles (and consequent exposure of new surfaces) as a
result of the acid pre-treatment can also play a crucial role. Such a picture would be consistent
with the increase in the N2 surface area measured after the pre-treatment (see below).
Thus the net result of acid pre-treatment can reside in a number of inter-related factors:
a) Improving the accessibility of Fe (III) to more reactive sites in the coal matrix. The kinetics of
coal surface oxidation by reaction with Fe(III) is profoundly affected by the ability of Fe(III) to
Table 3.3 Effect of Acid Digestion Treatment on the Iron Mediated Galvanostatic Polarization Behavior of TXLC Slurries
Digestion Acid Polarization Time
(min) Volume of Hydrogen
(mL) % Increase in H2
Generation None (Blank 1) 70 22 0 None (Blank 2) 90 28 28
1M H2SO4 110 34 57 1M HClO4 125 39 78 1M HNO3 70 22 0
reach the coal reactive sites. According to the model advanced by previous authors12, the
reactive sites on the coal particle surfaces are divided into three categories with varying ease of
accessibility. The acid digestion treatment is expected to convert most of the less accessible
sites into the more accessible ones.
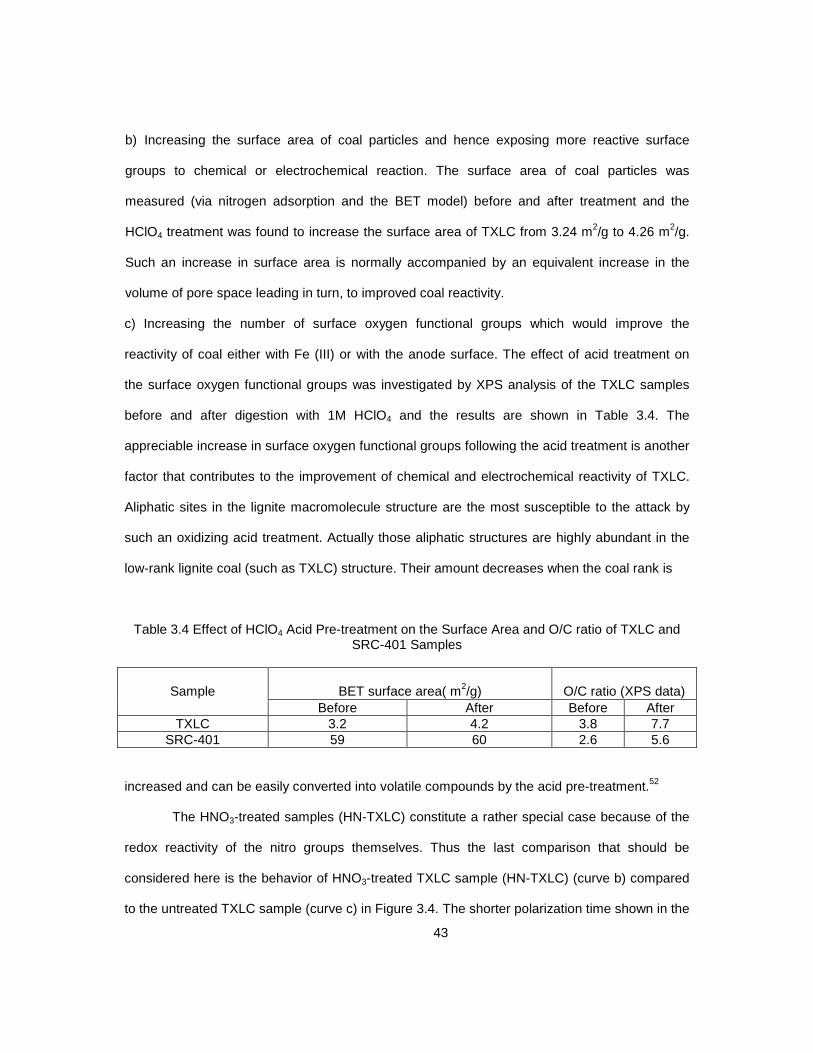
43
b) Increasing the surface area of coal particles and hence exposing more reactive surface
groups to chemical or electrochemical reaction. The surface area of coal particles was
measured (via nitrogen adsorption and the BET model) before and after treatment and the
HClO4 treatment was found to increase the surface area of TXLC from 3.24 m2/g to 4.26 m2/g.
Such an increase in surface area is normally accompanied by an equivalent increase in the
volume of pore space leading in turn, to improved coal reactivity.
c) Increasing the number of surface oxygen functional groups which would improve the
reactivity of coal either with Fe (III) or with the anode surface. The effect of acid treatment on
the surface oxygen functional groups was investigated by XPS analysis of the TXLC samples
before and after digestion with 1M HClO4 and the results are shown in Table 3.4. The
appreciable increase in surface oxygen functional groups following the acid treatment is another
factor that contributes to the improvement of chemical and electrochemical reactivity of TXLC.
Aliphatic sites in the lignite macromolecule structure are the most susceptible to the attack by
such an oxidizing acid treatment. Actually those aliphatic structures are highly abundant in the
low-rank lignite coal (such as TXLC) structure. Their amount decreases when the coal rank is
Table 3.4 Effect of HClO4 Acid Pre-treatment on the Surface Area and O/C ratio of TXLC and SRC-401 Samples
Sample
BET surface area( m2/g)
O/C ratio (XPS data) Before After Before After
TXLC 3.2 4.2 3.8 7.7 SRC-401 59 60 2.6 5.6
increased and can be easily converted into volatile compounds by the acid pre-treatment.52
The HNO3-treated samples (HN-TXLC) constitute a rather special case because of the
redox reactivity of the nitro groups themselves. Thus the last comparison that should be
considered here is the behavior of HNO3-treated TXLC sample (HN-TXLC) (curve b) compared
to the untreated TXLC sample (curve c) in Figure 3.4. The shorter polarization time shown in the

44
HNO3 case may be explained by the ability of boiling HNO3 to completely oxidize the pyritic and
other Fe (II) forms in TXLC. In such a case, an equivalent amount of nitrite ion should be
produced:
In solution:
2Fe2+ + NO3- + 2H+
→ 2Fe3+ + NO2- + H2O
At the anode:
NO2- + H2O → NO3
- + 2H+ + 2e
This nitrite ion can be oxidized at the anode surface during the galvanostatic polarization run
and appears as the first inflection point (at ~70 min) in Figure 3.4 that follows the Fe (II)
oxidation plateau. Although the reaction between boiling HNO3 and the Fe(II) content of coal is
well-known and even officially used for its quantitative determination, it cannot alone account for
that reduction of the polarization time when going from curve (c) to curve (b) in Figure. 3.4.
Other factors include the nitration and loss of organic matter as a result of HNO3 acid treatment.
Here the oxidation process does not stop at the stage of creating more oxygen functional
groups (that would in turn improve the TXLC reactivity), but subsequent decomposition of those
groups into volatile compounds is likely to take place,23 rendering, in fact, the TXLC surface less
reactive to oxidizing agents.
For comparison with the TXLC behavior, similar galvanostatic polarization experiments
were repeated with SRC-401 (Figure 3.5). The first and most important conclusion can be
drawn by comparing the Blank 2 experiment in Figure 3.4 (curve c) and Figure 3.5 (curve e).
The longer polarization time in the SRC-401 case may be attributed to either its better ability to
depolarize the anode surface or higher reactivity with the iron redox mediator. The higher
carbon content as well as the larger surface area of SRC-401 is the underlying cause for its
better chemical and electrochemical reactivity. Table 3.5 shows that all the acid treatments have
reduced the polarization time to varying degrees compared to the untreated SRC-401 (curve e).

45
0 20 40 60 80 100 1200.4
0.6
0.8
1.0
1.2
1.4
1.6
1.8
edcb
(a) Blank 1(b) HN-SRC-410(c) HP-SRC-410(d) HS-SRC-410(e) Blank 2
E
(V
) vs
Ag/
AgC
l
Polarization time (min)
a
Figure 3.5 Galvanostatic polarization profiles for blank solutions (refer to text) and acid pre-
treated SRC-401 suspension with externally added iron redox mediator.
Table 3.5 Effect of Acid Digestion Treatment on the Iron Mediated Galvanostatic Polarization Behavior of SRC-401 Slurries
Digestion Acid Polarization Time
(min) Volume of H2(ml) % increase in
H2 generation None (Blank 1) 70 22 0 None (Blank 2) 115 36 64
1M H2SO4 107 32 53 1M HClO4 90 28 28 1M HNO3 80 25 14
The greatest reduction in polarization time was observed in the HNO3 treated SRC-401(HN-
SRC-410). In addition, unlike the first inflection that appears with the HN-TXLC case in Fig. 3.4,
HNO3 treatment of SR-401 does not result in this feature (curve b, Fig. 3.5) due to the absence
of any Fe (II) content in the SRC-401 sample. The surface area of the acid treated SRC-401

46
was decreased and the O/C ratio was increased as a result of acid digestion (Table 3.4). Both
effects can result in the observed inversion of the polarization time trend compared to the TXLC
case.
3.3.2.3 Consequences of Acid Pre-treatment on Thermal Reactivity
To have a more clear idea about the differential behavior of the untreated and acid pre-
treated TXLC and SRC-401 samples, DSC and TGA characterization of TXLC and SRC-401
samples was carried out. An additional carbon black sample (SRC-159) was introduced here to
confirm the effect of HNO3 treatment on the thermal reactivity of the studied samples.
200 400 600 800
0
20
40
60
80
100
0
10
20
30
40
50
Hea
t Flo
w (
W/g
)
Wei
ght (
%)
Temperature (oC)
TXLCSRC-401SRC-159
Figure 3.6.Thermal analysis (TGA and DSC) curves for TXLC, SRC-401 and SRC-159 samples.
The results are shown in Figure 3.6 and Table 3.6. The TXLC sample shows the lowest
ignition temperature, Tsh (the temperature at which the sample begins to lose weight)25,26
compared to the others, owing to the higher content of volatile matter which represent 44.2% of

47
its dry weight. The volatile matter normally burns quickly at a lower temperature with a net effect
of widening the combustion interval, tci (the time interval between Tsh and Tec, the end of the
combustion regime) and reducing the burning intensity, I (the intensity of instantaneous heat
release calculated by dividing the peak height, H, the distance vertical to the temperature axis,
between the base line and the peak tip in the DSC curve by W, the time interval at half height of
the DSC peak).26 It is clearly seen here that graphitization and HNO3 treatment (SRC-159
sample) has rendered it the most un-reactive for combustion. As shown in Table 3.6, the SRC-
159 sample shows highest values for the Tsh, Tec parameters and the lowest value for I.
Table 3.6 Parameters from Simultaneous TGA and DSC Analyses of Untreated TXLC and SRC-401 Samples a
Sample H/(W/g) W(min) Tsh(°C) T ec(°C) t ci(min) I/(W/g.min) TXLC 29 4 340 450 4 7.2
SRC-401 52 3 531 705 3.5 17.3 SRC-159 37 6 579 797 8 6.2
aRefer to Figure 3.6 and the text.
The results for the acid pre-treated TXLC samples are shown in Figure 3.7 and Table
3.7. The highest mass change % (i.e., the ratio of mass loss during the course of coal
combustion), which corresponds to the demineralization ability of the acid, was found to be for
the HClO4 case (HP-TXLC). This behavior corroborates the results shown earlier in Figure 3.1
and explains the longer polarization time in this case compared to the H2SO4 case (HS-TXLC).
The HNO3 acid pre-treatment (HN-TXLC) results in almost the same percent mass change but
the demineralization ability is accompanied by complete oxidation of the dissolved mineral
matrix. The introduction of oxygen functional groups on the coal surface as a result of the
oxidizing acid pre-treatment manifests here as an additional inflection which appears prior to the
sharp one that corresponds to complete coal combustion. This initial inflection in the TGA curve,
which is clear in all cases except the TXLC curve (untreated sample), is due to the combustion

48
of volatile matter which normally takes place at lower temperature. In other words, the
introduction of volatile matter due to acid pre-treatment has lowered the TXLC ignition
temperature and elevated the end of combustion temperature and the combustion interval.
Again for comparative purposes, the effect of acid pre-treatment on the thermal reactivity of
SRC-401 was also studied and the results are shown in Figure 3.8. The introduction of oxygen
functional groups on the carbon black surface has clearly lowered the ignition temperature (Tsh)
and the burning intensity (I) and has widened the combustion interval (tci) compared to the
200 400 600 80030
40
50
60
70
80
90
100
Wei
ght (
%)
Temperature (
oC )
TXLCHP-TXLCHN-TXLCHS-TXLC
Figure 3.7. Thermal analysis (TGA) curves for TXLC before and after treatment with different 1 M acids.
untreated SRC-401 sample. This modification in the thermal behavior reflects more resistance
to combustion. It is worth noting here that the change in the thermal parameters specially the
combustion interval and the burning intensity, follows the same trend as the galvanostatic
behavior, with the HNO3-treated sample (HN-SRC-401) showing the lowest burning intensity
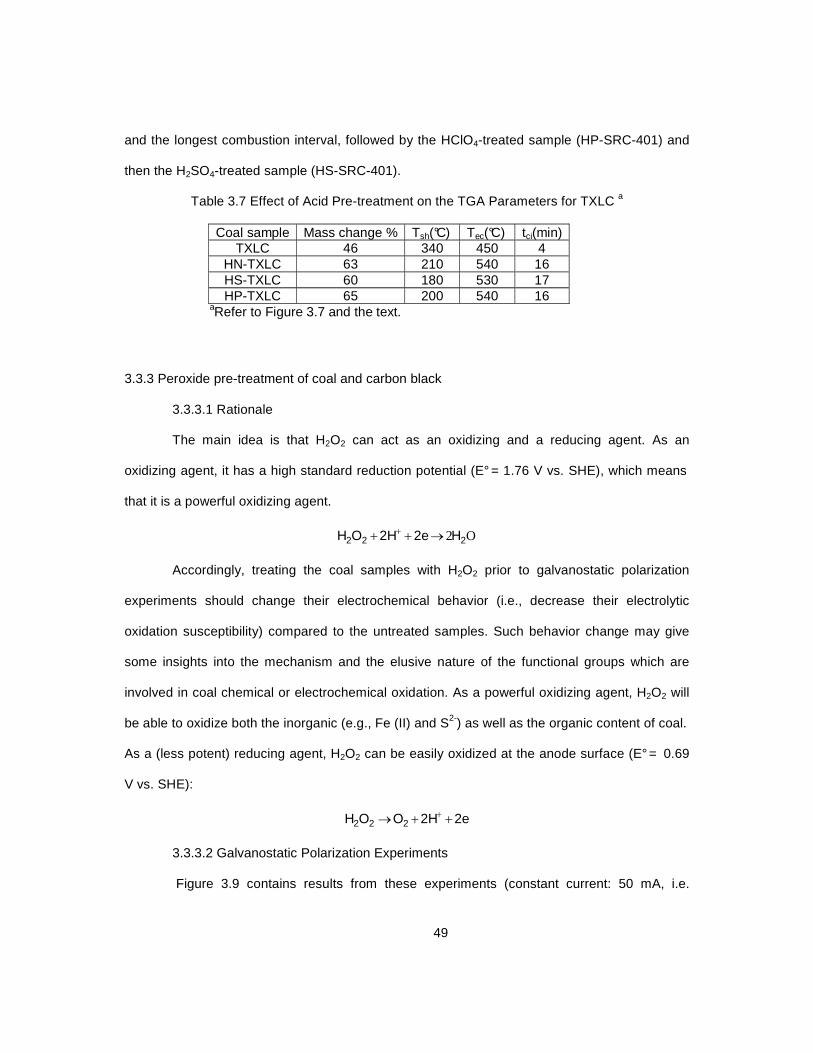
49
and the longest combustion interval, followed by the HClO4-treated sample (HP-SRC-401) and
then the H2SO4-treated sample (HS-SRC-401).
Table 3.7 Effect of Acid Pre-treatment on the TGA Parameters for TXLC a
Coal sample Mass change % Tsh(°C) Tec(°C) tci(min) TXLC 46 340 450 4
HN-TXLC 63 210 540 16 HS-TXLC 60 180 530 17 HP-TXLC 65 200 540 16
aRefer to Figure 3.7 and the text.
3.3.3 Peroxide pre-treatment of coal and carbon black
3.3.3.1 Rationale
The main idea is that H2O2 can act as an oxidizing and a reducing agent. As an
oxidizing agent, it has a high standard reduction potential (E° = 1.76 V vs. SHE), which means
that it is a powerful oxidizing agent.
O2 222 H2e2HOH →++ +
Accordingly, treating the coal samples with H2O2 prior to galvanostatic polarization
experiments should change their electrochemical behavior (i.e., decrease their electrolytic
oxidation susceptibility) compared to the untreated samples. Such behavior change may give
some insights into the mechanism and the elusive nature of the functional groups which are
involved in coal chemical or electrochemical oxidation. As a powerful oxidizing agent, H2O2 will
be able to oxidize both the inorganic (e.g., Fe (II) and S2-) as well as the organic content of coal.
As a (less potent) reducing agent, H2O2 can be easily oxidized at the anode surface (E° = 0.69
V vs. SHE):
2e2HOOH 222 ++→ +
3.3.3.2 Galvanostatic Polarization Experiments
Figure 3.9 contains results from these experiments (constant current: 50 mA, i.e.
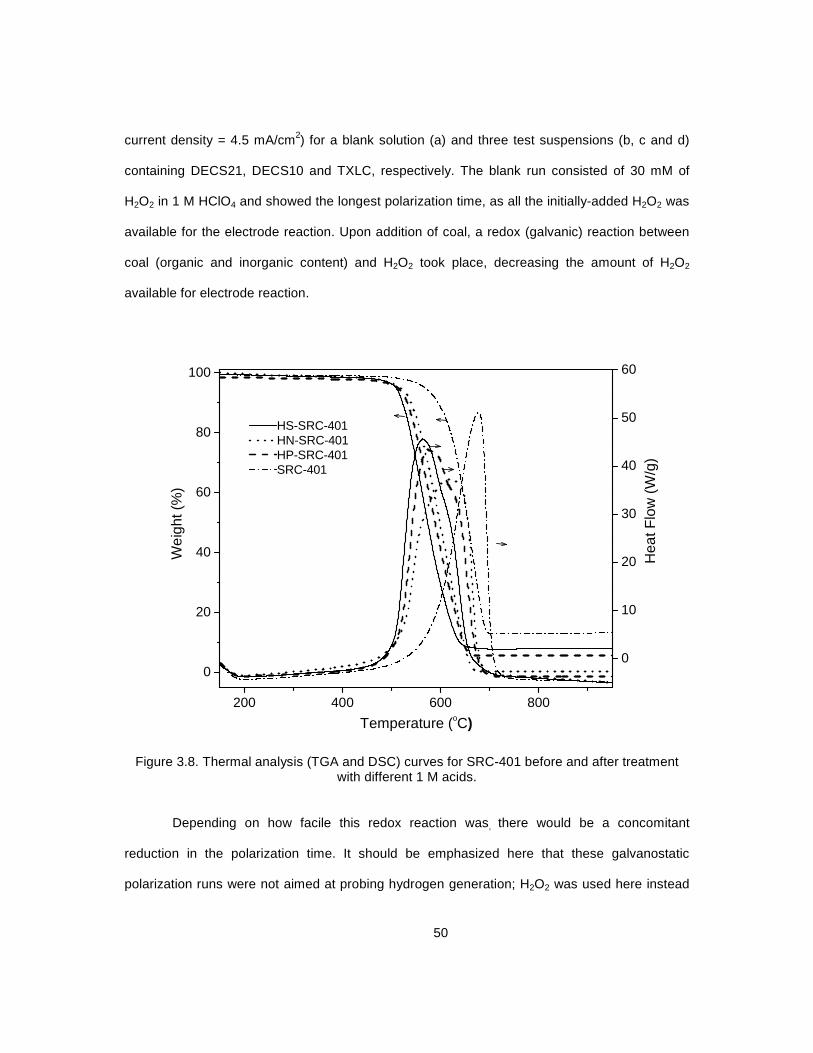
50
current density = 4.5 mA/cm2) for a blank solution (a) and three test suspensions (b, c and d)
containing DECS21, DECS10 and TXLC, respectively. The blank run consisted of 30 mM of
H2O2 in 1 M HClO4 and showed the longest polarization time, as all the initially-added H2O2 was
available for the electrode reaction. Upon addition of coal, a redox (galvanic) reaction between
coal (organic and inorganic content) and H2O2 took place, decreasing the amount of H2O2
available for electrode reaction.
200 400 600 800
0
20
40
60
80
100
0
10
20
30
40
50
60
Hea
t Flo
w (
W/g
)
Wei
ght (
%)
Temperature (oC)
HS-SRC-401HN-SRC-401HP-SRC-401SRC-401
Figure 3.8. Thermal analysis (TGA and DSC) curves for SRC-401 before and after treatment with different 1 M acids.
Depending on how facile this redox reaction was, there would be a concomitant
reduction in the polarization time. It should be emphasized here that these galvanostatic
polarization runs were not aimed at probing hydrogen generation; H2O2 was used here instead
51
as a probe for coal reactivity. As shown in Figure 3.9, the greatest reduction in polarization time
(77 %) and hence the best reactivity was observed with TXLC samples (curve d). This was
followed by the DECS10 sample (curve c) and then DECS21 sample (curve b) which showed
reductions of 28 % and 14 %, respectively.
0 40 80 120 160 2000.8
1.0
1.2
1.4
1.6
1.8
d c b
(a) Blank(b) DECS21(c) DECS10(d) TXLC
E (
V)
vs A
g/A
gCl
Polarization time (min)
a
Figure 3.9. Galvanostatic polarization profiles for blank solution and slurries in 30 mM H2O2.
The difference in reactivity between the three samples cannot be attributed to their fixed
carbon content. Actually, DECS21 sample, the least reactive coal, has the highest fixed carbon
content (refer to Table 3.2), while TXLC, the most reactive one, has the lowest fixed carbon
content. Instead, the availability of susceptible organic groups can be the underlying cause for
the difference in reactivity with H2O2. The most susceptible organic moieties to chemical
oxidation are the methylene groups which act as a cross linkers in the coal macromolecular

52
matrix. Methylene groups can be oxidized to carbonyl groups upon H2O2 pre-treatment.53 Low
rank coals, such as TXLC, usually have higher aliphatic content than the higher rank coal
samples,52 rendering them more susceptible to chemical oxidation. The breakdown of the cross
linker groups upon H2O2 treatment will expose more surface functional groups and at the same
time will improve the pore network in the coal macromolecules
Based on these results, we decided to use H2O2 in a different way, aiming at enhancing
the amount of hydrogen that can be generated at the cathode in an iron-mediated electrolysis
cell. In the new experiments, the three coal samples and a carbon black sample (SRC-410) and
MWCNTs (Table 3.1) were pre-treated with H2O2 overnight (refer to the experimental section)
and then mixed with the iron redox mediator under the same experimental conditions described
for the acid pre-treatment part of this study. Table 3.8 shows the results. Blank 1 and 2
experiments were described before in the acid pre-treatment section above.
Table 3.8 Effect of H2O2 Pre-treatment on the Galvanostatic Polarization Behavior of Coal and Carbon Black Slurries
Pretreatment Polarization time(min)
TXLC DECS10 DECS21 SRC-410 None (Blank 1) 70 None (Blank 2) 90 100 100 115
35% H2O2 100 97 97 107
The comparison between the various samples in the Blank 2 experiments shows how
the fixed carbon content of untreated samples positively affected the polarization time. The
SRC-410 sample, with a fixed carbon content of more than 99 % showed the largest increase
(64 %) in polarization time. On the other hand, the TXLC sample with the lowest fixed carbon
content (44.2 %) shows the least improvement of polarization time (28 %). The polarization time
improved only for the TXLC sample upon H2O2 pre-treatment, while for the other samples, this
parameter was almost the same (DECS10, DECS 21) or even shorter (SRC-410). It should be
noted that the H2O2 pre-treatment increased the amount of oxygen functional groups on the
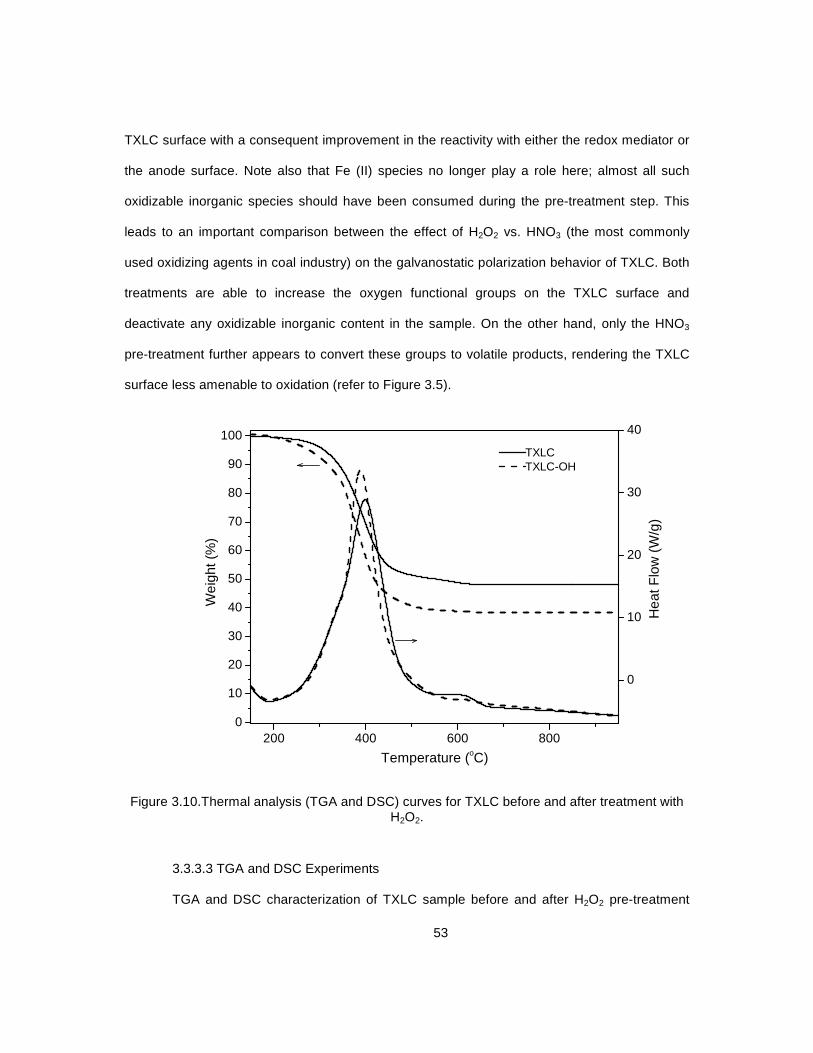
53
TXLC surface with a consequent improvement in the reactivity with either the redox mediator or
the anode surface. Note also that Fe (II) species no longer play a role here; almost all such
oxidizable inorganic species should have been consumed during the pre-treatment step. This
leads to an important comparison between the effect of H2O2 vs. HNO3 (the most commonly
used oxidizing agents in coal industry) on the galvanostatic polarization behavior of TXLC. Both
treatments are able to increase the oxygen functional groups on the TXLC surface and
deactivate any oxidizable inorganic content in the sample. On the other hand, only the HNO3
pre-treatment further appears to convert these groups to volatile products, rendering the TXLC
surface less amenable to oxidation (refer to Figure 3.5).
200 400 600 8000
10
20
30
40
50
60
70
80
90
100
0
10
20
30
40
Hea
t Flo
w (
W/g
)
Wei
ght (
%)
Temperature (oC)
TXLCTXLC-OH
Figure 3.10.Thermal analysis (TGA and DSC) curves for TXLC before and after treatment with H2O2.
3.3.3.3 TGA and DSC Experiments
TGA and DSC characterization of TXLC sample before and after H2O2 pre-treatment

54
(TXLC-OH) was carried out and the results are shown in Figure 3.10. H2O2 pre-treatment
obviously decreased the ash content of TXLC and hence increased the effective carbon
content. This can be considered as an additional factor that contributed to the improvement in
the galvanostatic polarization behavior of TXLC-OH sample discussed in the preceding section.
The introduction of oxygen functional groups upon H2O2 pre-treatment is marked by the
decrease in the ignition temperature, Tsh, widening the combustion interval, tci and lowering the
burn intensity, I.
3.3.4 Mechanistic aspects of coal and carbon black electrolysis
3.3.4.1 Chemical vs. Electrochemical Reactivity of TXLC and Carbon Blacks
The reactions taking place on the anode side of the electrochemical cell are two types.
The first type is an electrochemical (direct oxidation) reaction that involves an electron transfer
between the anode and a chemical species in solution. The chemical species available for
anode reaction are the iron(II) ions and the carbonaceous material particles. The
electrochemical oxidation of iron(II) on platinum electrode is known to be reversible or quasi
reversible and hence taking place quickly. On the otherhand , the oxidation of the carbonaceous
material particles is known to be irreversible54 and varies according the coal rank. The second
type is a sloution chemical reaction (indirect) where the reactive sites on the coal paritcle
surface are getting oxidized by iron(III) ions. Different sites on the coal particle surface can react
at different rates55.
3.3.4.2 Galvanostatic Polarization Experiments
The contribution of each of the aforementioned reactions to the total polarization time in
a glvanostatic run is shown in Figure 3.11. The contribution of the redox mediator to the total
polarization time is simply obtained by running a reagent blank (solution of redox mediator in 1
M H2SO4) experiment (Figure 3.11B). This experiment was run at a fixed current of 50 mA as
the kinetics are very fast. The same high current (50 mA) was also applied for the coal-mediator
experiment (Figure 3.11C) but can not be attained when a coal slurry(without any externally

55
added iron) is used as an anode depolarizer (Figure 3.11A). Instead, a smaller current of 3 mA
was used. It is worth noted here that this experiment accounts for any contributions from the
coal particles itself, any dissolved iron or oxidizable organic compounds leached out of the coal
matrix. For the sake of comparing the three experiments (A, B and C), the x-axis was conveted
into charge (Q) rather than a time (t) axis.
0 50 100 150 200 250 300 3500.4
0.6
0.8
1.0
1.2
1.4
1.6
1.8
CB
E(V
)
Q(C)
A
Figure 3.11 Galvanostatic polarization profiles for blank solution (refer to text) and TXLC suspension with and without externally added iron redox mediator.
As shown in Figure 3.11 A, part of the charge consumed during the electrochemical
process is due to oxidation of coal particle surface groups as well as any inherent oxidizable
ions in the coal matrix on the anode. Actually this electrode reaction did not start until the cell
potential have reached a value of 1.4 V. Although the amount of charge consumed in this

56
electrochemical reaction is very small compared to the charge involved in the redox process of
the mediator (Figure 3.11B), it is still an obvious evidence of coal particle oxidation on the
anode surface and even an indication to how difficult it is to electrochemically oxidize the coal
particles. Figure 3.11C showed an amount of a charge that is not a simple addition of the
amount of charges involved in Figures 3.11A and 3.11B. The value of charge is actually too
much higher than the simple addition value. Since Figure 3.11C is representing an experiment
run at a polarization current of 50 mA which can not be supported by the direct redox reaction of
coal particle surface, the amount of charge expressed represent a vlaue that is completely due
to the redox mediator and the indirect (chemical) reaction between iron(III) ions and coal
surface groups. This cleary indicate that the main process responsible for enhancement of
polarization time is the chemical reaction between coal and iron(III).
It should be clarified here that there is no controversy between the amenability of coal
particles surface for oxidation with iron(III) ions and their resistance to oxidation on the anode
surface. The standard reduction potential of iron(III) ions is 0.76 V while the anodic oxidation of
coal particles did not start untill the cell potential reached 1.4 V (Figure 3.11A). This is explained
by the high overpotential required to bring the suspended coal particles (which lack any electric
conductivity) to the electrode surface. On the other hand the iron(III) ions are freely moving in
solution and their adsorption on the coal particle surface is a preliminary step for the redox
reaction.9
The same set of experiments were repeated with SRC-401 slurry and the results are
shown in Figure 3.12. In this case a reasonable amount of charge was attributed to direct
oxidation of the carbon black on the electrode surface but the glavnostatic behaviour was still
dominated by the the chemical reaction between iron(III) ions and carbon black surface
groups.The charge transfer took place at relatively lower potential compared to the TXLC case
marking the readiness of the direct electrochemical oxidation of carbon black.
Both TXLC and SRC-401 were subjected to oxidation with H2O2. This pre-treatment has
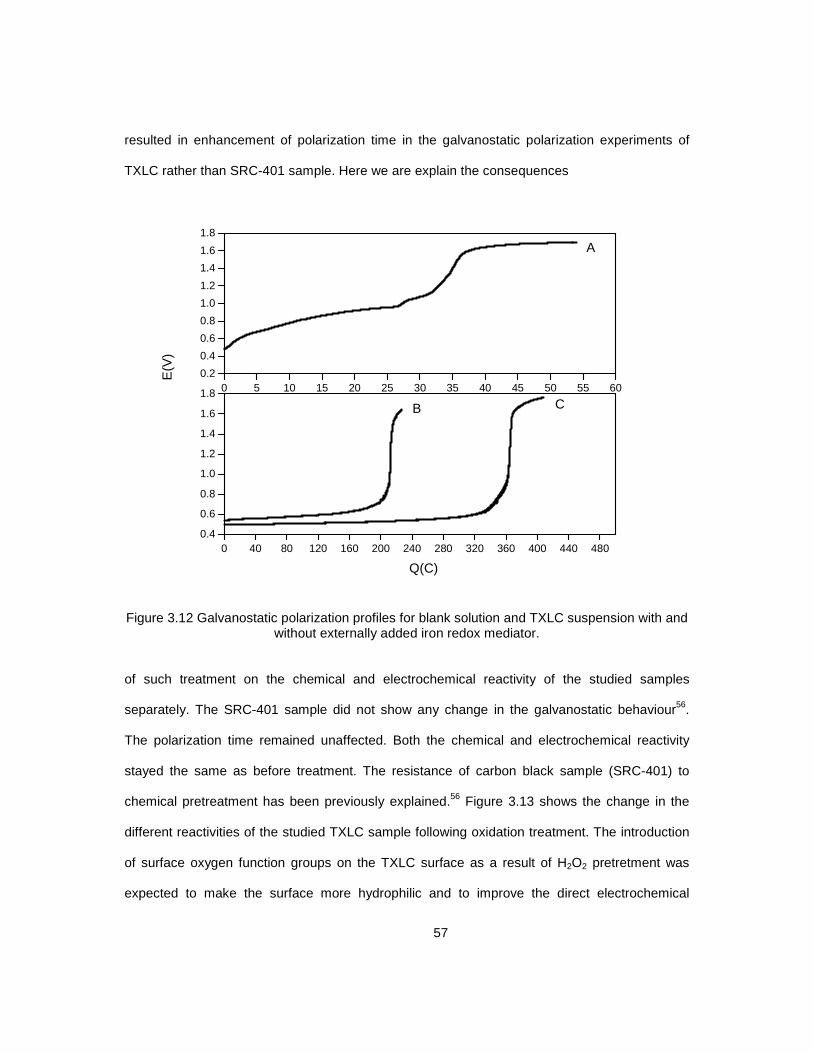
57
resulted in enhancement of polarization time in the galvanostatic polarization experiments of
TXLC rather than SRC-401 sample. Here we are explain the consequences
0 40 80 120 160 200 240 280 320 360 400 440 4800.4
0.6
0.8
1.0
1.2
1.4
1.6
1.8 0 5 10 15 20 25 30 35 40 45 50 55 600.2
0.4
0.6
0.8
1.0
1.2
1.4
1.6
1.8
CB
E(V
)
Q(C)
A
Figure 3.12 Galvanostatic polarization profiles for blank solution and TXLC suspension with and without externally added iron redox mediator.
of such treatment on the chemical and electrochemical reactivity of the studied samples
separately. The SRC-401 sample did not show any change in the galvanostatic behaviour56.
The polarization time remained unaffected. Both the chemical and electrochemical reactivity
stayed the same as before treatment. The resistance of carbon black sample (SRC-401) to
chemical pretreatment has been previously explained.56 Figure 3.13 shows the change in the
different reactivities of the studied TXLC sample following oxidation treatment. The introduction
of surface oxygen function groups on the TXLC surface as a result of H2O2 pretretment was
expected to make the surface more hydrophilic and to improve the direct electrochemical

58
reaction. However, the electrochemical reactivity of TXLC did not change following H2O2
pretretment as shown in Figure 3.13A. The quantity of charge transferred to the TXLC particles
before water oxidation starts (at 1.6 V) is the same as in Figure 3.11A. The enhancement of the
amount of charge transferred during TXLC electrolysis shown in Figure 3.13B (compared to
Figure 3.11C) can then be attributed to the improvement of the chemical reactivity of TXLC with
the redox mediator. Note that the contribution of the redox mediator itself to the amount of
charge should stay unchanged before and after H2O2 pretreatment.
0 50 100 150 200 250 300 350 4000.4
0.6
0.8
1.0
1.2
1.4
1.6
1.8 B
E(V
)
Charge (C)
A
Figure 3.13 Galvanostatic polarization profiles for oxidized TXLC suspension with and without externally added iron redox mediator.
The change in the surface and the bulk chemsitry of TXLC particles following the treatment was
monitored by XPS and FTIR experiments, respectively to relate this improvement of chemical
reactivity to specific functional groups.

59
3.3.4.3 XPS Data of Bare and Oxidized TXLC
XPS analysis can provide information about chemical bonding on the surface of
particles. XPS was performed on both as received (TXLC) and H2O2 treated (TXLC-OH)
samples to show the effect of such treatment on the surface elemental composition. The XPS
spectra are shown in Figures 3.14 and 3.15. For the TXLC sample (Figure 3.14), the C 1s main
peak was scanned at high resolution. Figure 3.14 gives a typical carbon 1s peak envelope from
Figure 3.14 Deconvoluted X-ray photoelectron spectrum of as received TXLC.
the untreated TXLC. In the peak deconvolution, the overall peak in the range of 280–287 eV
can be fitted by a superposition of two peaks. The main peak (282.21 eV) is attributed to the C
1s, while the other peak (284.09 eV) is assigned to the C–O bond.57 The spectrum of the TXLC-
OH sample is shown in Figure 3.15. In addition to the above two mentioned peaks, another
peak at (286.35 eV) appeared and is assigned to the –C=O bond. The semi-quantitative
TXLC[14]
NameC 1sC 1s
Pos.282.21284.09
FWHM1.7072.116
L.Sh.GL(30)GL(30)
Area212369.8
60581.1
At%77.80522.195C
1s
C 1sx 104
2
4
6
8
10
12
14
CPS
294 292 290 288 286 284 282 280 278Binding Energy (eV)

60
analysis of TXLC-OH sample shows the relative concentration of surface carbon
Figure 3.15 Deconvoluted X-ray photoelectron spectrum of TXLC after oxidation with H2O2.
atoms that have been functionalized compared to the as received TXLC sample. (Table 3.9). An
overall increase in atomic % of carbon atoms bonded to oxygen (27% in TXLC-OH compared to
22% in TXLC) is observed and about 8% is assigned to -C=O bonds. This surface increase in
the carbonyl group functionalities may or may not be accompanied by a corresponding increase
in their bulk concentration and must be confirmed by FTIR spectroscopy .
3.3.4.4 FTIR Spectra of Bare and Oxidized TXLC
The FTIR spectra of TXLC and TXLC-H samples are shown in Figure 3.16. A well
defined peak with a maximum at 1710 cm−1 was observed. This peak is much less defined for
the untreated TXLC compared to TXLC-H sample and is attributed to carbonyl (C=O) groups.
Both XPS and FTIR data confirm the increase of carbonyl groups on TXLC particles following
the H2O2 treatment and clearly confirm the crucial rule of such functional groups in improving
the chemical reactivity of coal particles in iron mediated coal electrolysis.
TXOHF[23]
NameC 1sC 1sC 1s
Pos.282.38284.15286.35
FWHM1.4731.7581.488
L.Sh.GL(30)GL(30)GL(30)
Area329877.6
85620.434788.4
At%73.25919.015
7.726
C 1sx 104
5
10
15
20
25CPS
294 292 290 288 286 284 282 280 278Binding Energy (eV)
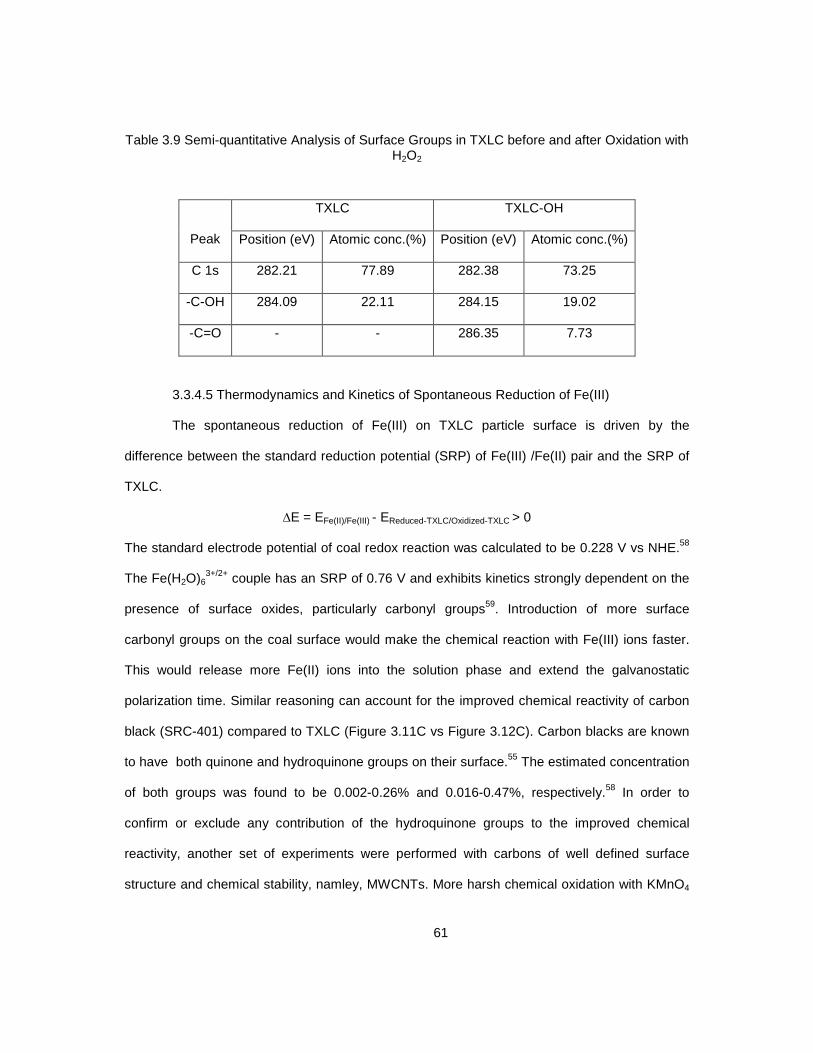
61
Table 3.9 Semi-quantitative Analysis of Surface Groups in TXLC before and after Oxidation with H2O2
Peak
TXLC TXLC-OH
Position (eV) Atomic conc.(%) Position (eV) Atomic conc.(%)
C 1s 282.21 77.89 282.38 73.25
-C-OH 284.09 22.11 284.15 19.02
-C=O - - 286.35 7.73
3.3.4.5 Thermodynamics and Kinetics of Spontaneous Reduction of Fe(III)
The spontaneous reduction of Fe(III) on TXLC particle surface is driven by the
difference between the standard reduction potential (SRP) of Fe(III) /Fe(II) pair and the SRP of
TXLC.
∆E = EFe(II)/Fe(III) - EReduced-TXLC/Oxidized-TXLC > 0
The standard electrode potential of coal redox reaction was calculated to be 0.228 V vs NHE.58
The Fe(H2O)63+/2+ couple has an SRP of 0.76 V and exhibits kinetics strongly dependent on the
presence of surface oxides, particularly carbonyl groups59. Introduction of more surface
carbonyl groups on the coal surface would make the chemical reaction with Fe(III) ions faster.
This would release more Fe(II) ions into the solution phase and extend the galvanostatic
polarization time. Similar reasoning can account for the improved chemical reactivity of carbon
black (SRC-401) compared to TXLC (Figure 3.11C vs Figure 3.12C). Carbon blacks are known
to have both quinone and hydroquinone groups on their surface.55 The estimated concentration
of both groups was found to be 0.002-0.26% and 0.016-0.47%, respectively.58 In order to
confirm or exclude any contribution of the hydroquinone groups to the improved chemical
reactivity, another set of experiments were performed with carbons of well defined surface
structure and chemical stability, namley, MWCNTs. More harsh chemical oxidation with KMnO4

62
was used in addition to H2O2 oxidation to ensure sufficient oxidation of the nanotubes.
3000 2500 2000 1500 1000 500
TXLC-OH
TXLCA
(a.
u)
1710
1710
Wavenumber (cm-1)
Figure 3.16 FTIR spectra of as-received (TXLC) and oxidized (TXLC-OH) coal.
3.3.4.6 Raman Spectra of Bare and Oxidized MWCNTs
Raman spectroscopy is a very efficient tool for characterizing carbon-based
nanostructures.36 The Raman spectra of CNTs usually exhibit four to five characteristic bands
(Figure 3.17 A) : the G mode (1500–1600 cm-1) which originates from the stretching vibrations
of the carbon–carbon bonds within the graphene sheets, the D mode (1350 cm-1) which is a
measure of amorphous or disordered carbon in the CNT samples and most likely stems from
added functional groups or missing carbon atoms in the wall,60 the G` mode (2600-2700 cm-1),
the second overtone of the defect-induced D mode and finally, the radial breathing modes
(RBMs) (100–400 cm-1) which is sensitive to the diameter of SWCNT and rarely found in the
spectra of MWCNTs.36 The oxidation of MWCNTs was previously used to determine the best
conditions to remove amorphous carbon, introduce defects and functionalize their surface.36
The ratio of Raman intensities, R, of the D and G bands (ID/IG) of the as-received and

63
chemically oxidized MWCNTs (Table 3.10) was used to quantify the density of structural defects
3000 2500 2000 1500 1000 5000
50
100
150
200
250 3000 2500 2000 1500 1000 5000
50
100
150
200
250
G` (2659 cm-1)
G (1574 cm-1)
D (1335 cm-1)
Inte
nsity
(a.
u)
Raman shift (cm-1)
A
B
Figure 3.17. Raman spectra of as received MWCNTs (A) and MWCNTs oxidized with H2O2 (B).
created by such pre-treatment. The R value increased sharply in the case of KMnO4 treatment
(0.25 to 0.56) compared to H2O2 (0.25-0.36) (compare Figures 3.17B and 3.18B). The increase
in disorder indicated by the increase in Raman R value (i.e. from 0.25 to 0.56 in MWCNT-K)
may be due to
Table 3.10 Raman Spectrum Parameters of the As received and Oxidized MWCNTs
Sample D band (cm-1) G band (cm-1) G' band (cm-1) R MWCNT 1339 1578 2665 25
MWCNT-K 1339 1573 2665 56 MWCNT-H 1335 1574 2660 36

64
disruption of surface graphene planes by hydroxylation. This oxidation changes the chemical
make-up of the reactive edge of the tips and perhaps even the outer (and the inner) layer of the
nanotube. XPS was used to study chemical modification of the surface and indicated that about
20% of the carbon constituting the nanotubes (MWCNT-K) is bound to oxygen atoms (Figure
3.19). This indicates that not only the reactive tube edges have been modified but also the
surface of the outer layer was affected.
3000 2500 2000 1500 1000 5000
50
100
150
200
250 3000 2500 2000 1500 1000 5000
50
100
150
200
250
Raman shift (cm-1)
A
Inte
nsity
(a.
u)
B
Figure 3.18 Raman spectra of as received MWCNTs (A) and MWCNTs after oxidation with KMnO4 (B).
3.3.4.7 FTIR Spectra of Bare and Oxidized MWCNT
The FTIR spectrum of KMnO4- oxidized sample (MWCNT-K) is shown in Figure 3.20.
The KMnO4 treatment has mainly introduced hydroxyl group functionalities as confirmed by the
well defined peaks at 3500 and 1150 cm-1. The same iron-mediated galvanostatic polarization
experiments (at constant current of 3mA) was carried out for both MWCNT and MWCNT-K
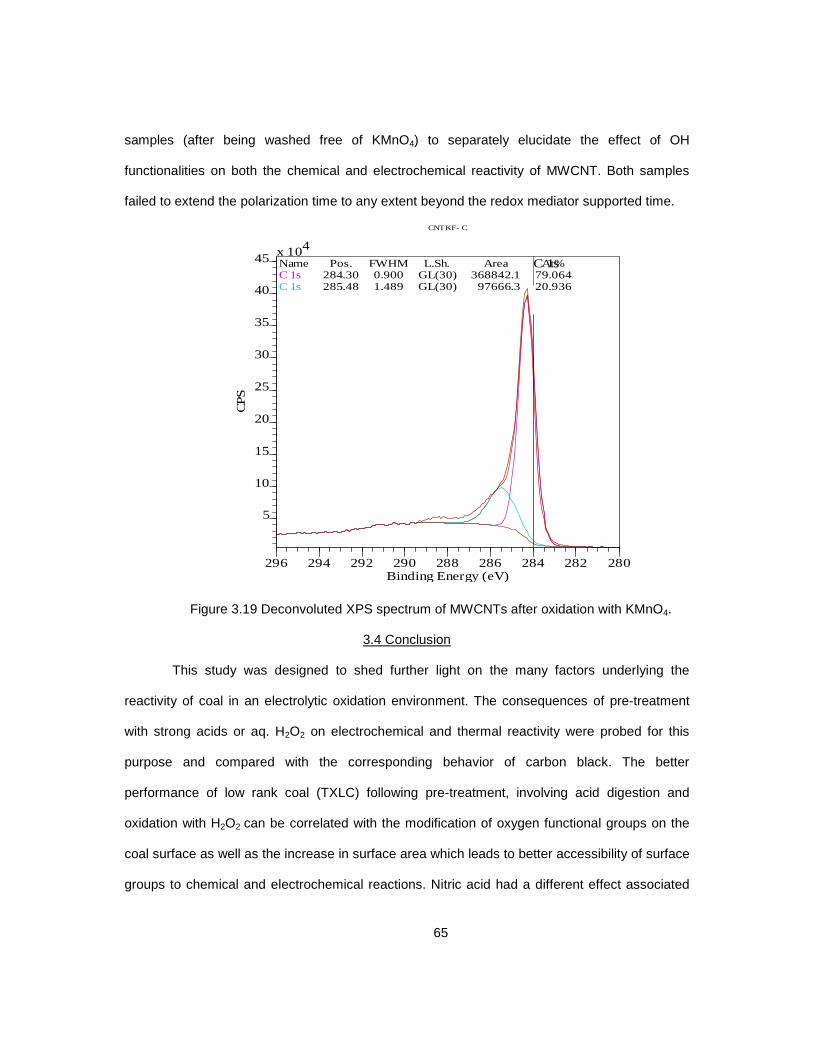
65
samples (after being washed free of KMnO4) to separately elucidate the effect of OH
functionalities on both the chemical and electrochemical reactivity of MWCNT. Both samples
failed to extend the polarization time to any extent beyond the redox mediator supported time.
Figure 3.19 Deconvoluted XPS spectrum of MWCNTs after oxidation with KMnO4.
3.4 Conclusion
This study was designed to shed further light on the many factors underlying the
reactivity of coal in an electrolytic oxidation environment. The consequences of pre-treatment
with strong acids or aq. H2O2 on electrochemical and thermal reactivity were probed for this
purpose and compared with the corresponding behavior of carbon black. The better
performance of low rank coal (TXLC) following pre-treatment, involving acid digestion and
oxidation with H2O2 can be correlated with the modification of oxygen functional groups on the
coal surface as well as the increase in surface area which leads to better accessibility of surface
groups to chemical and electrochemical reactions. Nitric acid had a different effect associated
CNTKF- C
NameC 1sC 1s
Pos.284.30285.48
FWHM0.9001.489
L.Sh.GL(30)GL(30)
Area368842.1
97666.3
At%79.06420.936
C 1sx 104
5
10
15
20
25
30
35
40
45
CPS
296 294 292 290 288 286 284 282 280Binding Energy (eV)

66
with its own redox behavior. Conversely the adverse effect of chemical pre-treatment,
specifically H2O2 pre-treatment, on the carbon blacks, medium, and high rank coals
4000 3500 3000 2500 2000 1500 1000 500
MWCNT
MWCNT-K
A (
a.u.
)
Wavenumber (cm-1)
Figure 3.20 FTIR spectrum of MWCNTs before and after oxidation with KMnO4.
was attributed to the lower content of aliphatic structures and higher resistance to oxidation of
these samples.
Further investigations on the mechanistic aspects of iron mediated coal electrolysis
revealed that the introduction of oxygen functional groups, especially carbonyl groups, on the
coal surface selectively improved the chemical reactivity of coal and hence facilitated electron
transfer between coal and iron (III) ions. The modification of MWCNT surface with hydroxyl
groups following KMnO4 treatment did not result in any improvement in their chemical or
electrochemical reactivity in iron-mediated electrolysis and ruled out any significant effect of
hydroxyl groups on their reactivity.

67
CHAPTER 4
ECONOMIC ANALYSIS OF HYDROGEN PRODUCTION BY COAL ELECTROLYSIS
In this part, the commercially applicable techniques for hydrogen production are briefly discussed
with emphasis on their economic aspects. Following this, a model allowing the analysis of the economics
of hydrogen production by coal (dark and photo) electrolysis is developed. A sensitivity analysis study that
addresses the influence of variation of main system components (e.g., electricity price, operating potential
and process efficiency) on the hydrogen production cost by electrolysis is then presented. Finally, the
cost of hydrogen production according to the proposed model is compared to that of the closely related
and commercially applicable hydrogen production technologies, namely, water electrolysis, biomass and
coal gasification. The aim is to identify the economic barriers (if any) associated with the commercial
application of coal (dark and photo) electrolysis for hydrogen production. The stepwise approach to the
economic analysis model is summarized as follows:
I. Designing a process scheme for the production of hydrogen.
II. Determining the optimal hydrogen production through testing various simulation cases.
III. Analyzing the simulation results to determine technical and economic feasibility.
4.1 Hydrogen Production Technologies
Although USA is the 3rd largest oil producer in the world, the amount of imported petroleum is
expected to increase to 60% by 2025. Hence, an increasing interest in developing alternative fuels to
power our society and to increase energy and economic security is obvious and becomes more critical
with the substantial political uncertainty in the world today, particularly in the Middle East. In addition, an
increased demand from developing countries (Brazil, India, China) has contributed to the problem and
increased the cost of oil substantially in the past few years. Cost is not the only main concern but there
are significant environmental concerns with petroleum usage as well.61

68
Hydrogen is expected to play a crucial role as a potential solution to the current concerns with
energy supply. In fact, hydrogen was excluded as a solution to the aforementioned concerns when
gasoline was priced at 1 $/gallon.62 As an energy carrier, hydrogen has many advantages. Besides being
an inexhaustible resource, hydrogen has zero contribution to environmental pollution. Water vapor is the
product of hydrogen combustion and electricity generation in fuel cells. Hydrogen has several production
paths summarized in Table 4.1. Two factors play a crucial role in all of these processes. They are namely
the cost of the energy input and the efficiency of energy conversion.63
Table 4.1 Commercial Processes Currently in Use for Hydrogen Production61
Technology Feedstock Efficiency Biomass gasification Biomass 35-50%a
Alkaline electrolyzer H2O+ electricity 50-60%b
Partial oxidation Hydrocarbons 60-75%a
Steam reforming Hydrocarbons 70-85%a
Biomass gasification Hydrocarbons 60-65%c a Thermal efficiency calculated based on higher heating values (HHV)
bLower heating value(LHV) of hydrogen produced divided by the electrical energy supplied c Dry coal to syngas, LHV, not counting electric input
The majority of hydrogen produced currently depends on non-renewable sources such as oil,
natural gas and coal. In other words, fossil fuel based processes are used to produce about 95% of global
hydrogen. Only 5% is generated from water using electricity and biomass. Table 4.1 describes the
techniques that are commercially used for hydrogen production. Each technique will be discussed in more
detail in what follows.
4.1.1 Hydrogen from Biomass
Wood is the oldest form of energy used by mankind. As a biomass energy source, wood has
been subjected to direct combustion to release its stored energy. Biomass comprises all the living matter
present on earth.64 Other sources of biomass include algae, trees, agricultural crops and their byproducts,
animal manure and food processing waste.65 The organic matter constituting the majority of biomass
69
consists of carbon, hydrogen, oxygen and nitrogen with the solar energy stored in chemical bonds. Some
biomass is composed of an appreciable amount of inorganic species.66
Biomass can offer the most efficient renewable substitute to petroleum. Biomass and biomass
derived fuels can provide a sustainable pathway for hydrogen production. The net amount of CO2
released during biomass gasification does not contribute to CO2 emissions as it was originally absorbed
from the atmosphere and fixed by the plants in the photosynthesis process.65 Biomass can be converted
into hydrogen rich gas by two routes, namely, biomass gasification and biochemical/biological conversion.
Biomass gasification is a mature process and commercially applicable for hydrogen production.
During this thermal process, biomass is partially oxidized in a pure stream of oxygen at high
temperatures, typically 800-900 °C, and is converte d completely into H2 and CO. Under these conditions,
biomass gasification produces large amount of tar in the product gas and Ni based catalysts are needed
to reduce tar formation and to upgrade the product gas.67 An oxygen separation unit is also needed to
supply the required amount of pure oxygen for the oxidation process. This unit is too costly especially for
small-scale plants. Pure oxygen can be replaced with air as an oxidant but the product gas will be more
dilute and contaminated with NOx. Large scale production can reduce the final cost of hydrogen
production but requires massive amounts of feedstock. In all the cases, a gas separation process is
necessary to produce a pure stream of hydrogen, which adds to the entire cost of hydrogen production.
Biomass gasification can achieve 35-50% efficiency but the cost effectiveness of the process is largely
affected by the logistic costs which limit the spread of efficient distributed gasification plants.
The price of hydrogen produced by biomass gasification is almost three times higher than that for
hydrogen produced by steam methane reforming (SMR). Although commercially applicable, hydrogen
production from biomass still has major challenges. The main challenge is the low yield of hydrogen, as
the hydrogen content of the feedstock is low (6 % vs. 25 % for methane). The energy content of the

70
feedstock is low as well due to the high oxygen content (40 wt %) which limits the efficiency of the
process.
4.1.2 Hydrogen from water
Splitting water into hydrogen and oxygen has been a hot topic for research for a long time and
dates back to the 1890s. There are three main processes that can be used to effect water splitting,
namely, electrolysis, thermolysis, and photoelectrolysis.
4.1.2.1 Electrolysis
Electrolysis is the simplest way of splitting water and involves the application of an electric current
between two electrodes to break water into its elemental components. The electrical energy is simply
converted into chemical energy with efficiencies ranging from 50-60% (Table 4.1). Alkaline electrolyzers
are mostly used compared to polymer exchange membrane (PEM) or solid oxide electrolysis (SOEC)
cells. They are lower in capital cost and have typical efficiencies of 50-60% based on the lower heating
values.
The overall reactions taking place at the cathode and the anode are:
At the anode:
4 OH-→O2+2H2O
At the cathode:
2H2O +2e→H2+2 OH-
Overall reaction:
H2O →H2+2 OH-
Water is decomposed at the cathode into H2 and OH-. OH
- ions travel to the anode where O2 is
formed. The H2 produced must be separated from the alkaline solution using a gas liquid separator.

71
Electrolyzers have several advantages for hydrogen production. They are capable of producing hydrogen
in high purity. They can be operated under high pressure to eliminate the need for expensive hydrogen
compressors and are easily fitted to on-site production to avoid shipping costs. When the energy supply is
mechanical (hydropower or wind turbines), or photovoltaic from sunlight, there is virtually no pollution or
toxic byproducts, and the feed sources are fully renewable, so the importance of electrolysis is increasing
as human population and pollution increase. Electrolysis will become more economically competitive as
non-renewable resources (carbon-based compounds) dwindle and as government removes subsidies on
carbon-based energies.68
4.1.2.2 Photoelectrochemical Water Splitting
Sunlight in presence of semiconductor materials is used to decompose water into hydrogen and
oxygen. In photoelectrochemical cells (PECs), a photocathode (p-type semiconductor having excess
holes) or a photoanode (n-type semiconductor having excess electrons) is immersed in an aqueous
electrolyte to split water into the constituting elements. For a photoanode based system, the process may
be described as follows:
1. When a photon with a greater energy than the semiconductor band gap energy (Eg) strikes the
photoanode surface, an electron-hole pair is created.
2. The holes are used to decompose water into O2 and H+ ions on the photoanode side, while the
electrons are used to reduce H+ ions into H2 on the cathode side.
3. A semi-permeable membrane is commonly used between the anode and the cathode compartments
to keep the two gases separated.
The performance of PECs depends mainly on the photoelectrode material and the
semiconductor. Imperfections in the crystalline structure, bulk and surface properties of the
photoelectodes usually limits the hydrogen production efficiency. An ideal photoelectrode should be able
to resist corrosion caused by aqueous electrolytes and at the same time retain the ability to drive the
72
water decomposition reaction. This ability depends mainly on the perfect matching of the energetic of the
electrochemical reaction and the absorbed solar radiation. Improper matching we will mostly lead to
corrosion or development of blocking layers on the photoelectrode surface.69 In general an ideal
photoelectrode should have the following characteristics:
1. A band gap that straddle the redox potential of H2 and O2 half reactions.
2. Maximum absorption of the solar spectrum.
3. High quantum yield (> 80%) across the absorption band.
The target efficiency of PECs is > 16% solar energy to H2. Current water splitting photoelectrodes have
low efficiency and on-going research is targeting development of electron transfer catalysts and surface
enhancements to improve their performance.
4.1.3 Hydrogen from Hydrocarbons
4.1.3.1 Steam Methane Reforming (SMR)
Hydrogen generation from natural gas is the most commonly used method with approximately
80% efficiency70–72. This process releases greenhouse gases. Since the production is concentrated in one
facility, it is possible to separate the gases and dispose of them properly, for example by injecting them in
an oil or gas reservoir.
The steam-methane reforming (SMR) process is illustrated in Figure 4.1.73 The basic steps
leading from the natural gas, to the high purity hydrogen product are:
1. Pretreatment of the raw feedstock:
First, the catalytic nature of the reforming reaction renders it very sensitive to catalyst poisons.
The catalysts employed are normally poisoned by even trace amounts of sulfur.70–72 Hence, for
economical operation, sulfur compounds need to be removed through the feedstock pretreatment.
Second, reforming is a reaction between methane and steam, so non-methane hydrocarbons must be
converted to methane.

73
2. Reforming to synthesis gas:
Commercial bulk hydrogen is usually produced by the steam reforming of natural gas. At high
temperatures (700–1100 °C), steam (H 2O) reacts with methane (CH4) to yield syngas.
CH4 + H2O → CO + 3 H2
Essentially, the oxygen (O) atom is stripped from the water (steam) to oxidize the carbon (C), liberating
the hydrogen formerly bound to the carbon and oxygen. The heat required to drive the process is
generally supplied by burning some portion of the methane.
Figure 4.1 Schematic of SMR process.
3. Conversion to a hydrogen-rich gas:
The syngas from the reformer is rich in H2 and in CO. Additional hydrogen can be recovered from
carbon monoxide (CO) through the lower-temperature water gas shift reaction:
CO + H2O → CO2 + H2
Low reaction temperatures are favorable to achieve equilibrium, but high temperature is required to
achieve a practical reaction rate. This is normally overcome through the use of a two stage shift system.

74
In the first stage, a high temperature, typically 350 °C, is required. A low cost iron-based catalyst is used
to promote the reaction and to reduce the CO concentration to a few percent. In the second stage of shift,
a lower temperature (190 - 210 °C) in the presence of a more expensive, copper-based catalyst is used to
increase the equilibrium concentration of H2. at a reasonable rate.
4. Purification to hydrogen product specifications:
The shifted syngas has a high concentration of H2, but is still contaminated with a high
concentration of CO2 and H2O, as well as residual methane and small amounts of carbon monoxide and
nitrogen. The gas is purified by removal of CO2, removal of moisture by condensation and drying, and
removal of other contaminants in a pressure swing adsorption unit.
At present, SMR dominates the market for hydrogen production and to assess the economics of
hydrogen production as currently practiced, a typical facility providing 120,500 kg/d of hydrogen is
considered.73 Different factors such as: the direct capital cost, the prices of natural gas, catalysts and
solvents and operating costs are taken into account according to the model. The Total Plant Investment is
$82 million. Assuming an availability of 95% and operating with an efficiency of 78%, the cost for the
production of H2 comes to $0.83/kg with 1366 tons CO2/d emitted Purchase of natural gas accounts for
55% of this price, capital equipment charges, operating and maintenance accounts for 45% of costs. The
cost for the production of H2 with CO2 capture is increased by 35% and becomes $1.12/kg.
4.1.3.2 Coal Gasification
Coal gasification is a clean coal technology that avoids the conventional coal burning process by
converting coal into a gas.77,78 In this way, sulfur and nitrogen compounds and particulates are removed
before the fuel is burned, making it almost equally clean as natural gas. Coal was first used in gas
production during the late 18th century. Early production was used primarily for lighting, but as
gasification techniques improved, applications grew wider. By the 19th century the conversion of coal to
gas was a well-established commercial process. Gasification technology is particularly suitable for low-

75
rank coals because of their higher reactivity for gasification than high-rank coals.79 Focusing only on the
coal carbon content, coal gasification can be represented by the well-known steam carbon reaction:
C + H2O → CO + H2
This reaction is strongly endothermic and its equilibrium is highly unfavorable at ordinary temperatures.
Coal is gasified in practice by treating it with a mixture containing both steam and oxygen:
C + O2 → CO2
In this manner a part of the coal is burnt and the heat released by the combustion reaction provides the
thermal energy required by the steam carbon reaction. The detailed chemistry and technology of coal
gasification is complex and involve different side reactions such as reactions between CO2 and coal,
between CO and H2O, and between O2 and CO. The complex gaseous product from coal gasification
must be cleaned to remove impurities such as tars, ash, carbon dioxide, and sulfur compounds. The
hydrogen and carbon monoxide contents of this gas are often further adjusted by means of the water-gas
shift reaction to provide the required CO/H2 ratio.
Coal gasification requires extreme conditions of temperature and pressure (>1000 psig and
temperatures of 800 °C) which raise process and hydrogen production costs. In addition, the coal
gasification process is not completely clean and air contamination by the released COx, NOx, SOx and Hg
should be dealt with.80
4.1.3.3 Coal Electrolysis
Coal electrolysis has re-appeared as a possible technology to produce hydrogen due to its
advantages of operating at low temperature (<100 °C) and atmospheric pressure. Additionally, a pure
stream of H2 can be obtained, problems with H2 storage are lacking with distributed production, and
products of the process (CO2 and H2) are free of tar and sulfur compounds. A literature review of coal
electrolysis has been previously discussed at the introductory chapter of this dissertation. Since coal
electrolysis as a technological pathway for hydrogen production is not a commercial process and still
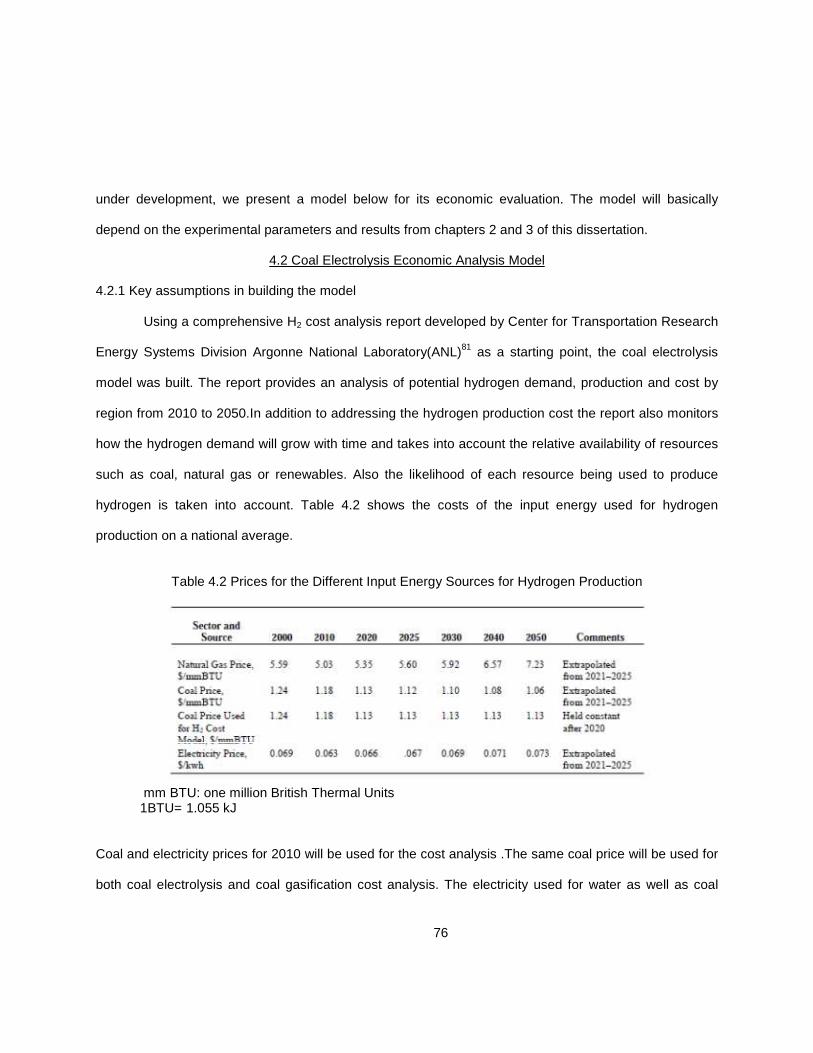
76
under development, we present a model below for its economic evaluation. The model will basically
depend on the experimental parameters and results from chapters 2 and 3 of this dissertation.
4.2 Coal Electrolysis Economic Analysis Model
4.2.1 Key assumptions in building the model
Using a comprehensive H2 cost analysis report developed by Center for Transportation Research
Energy Systems Division Argonne National Laboratory(ANL)81 as a starting point, the coal electrolysis
model was built. The report provides an analysis of potential hydrogen demand, production and cost by
region from 2010 to 2050.In addition to addressing the hydrogen production cost the report also monitors
how the hydrogen demand will grow with time and takes into account the relative availability of resources
such as coal, natural gas or renewables. Also the likelihood of each resource being used to produce
hydrogen is taken into account. Table 4.2 shows the costs of the input energy used for hydrogen
production on a national average.
Table 4.2 Prices for the Different Input Energy Sources for Hydrogen Production
mm BTU: one million British Thermal Units 1BTU= 1.055 kJ
Coal and electricity prices for 2010 will be used for the cost analysis .The same coal price will be used for
both coal electrolysis and coal gasification cost analysis. The electricity used for water as well as coal

77
electrolysis is assumed to be generated from renewable sources. The cost for each centralized
production case is based on a capacity of 150,000 kg H2/day. The coal gasifiers used in the ANL report
and with which we are comparing are assumed to operate at 64% efficiency (dry coal to syngas, LHV, not
counting electric inputs). The commercialization of H2 production and distribution systems is known to be
highly capital intensive. Therefore, the sensitivity study will be limited to process efficiency and input
energy (feedstock) cost. Detailed economic analysis of the coal electrolysis process that covers capital
investment, fixed and variable costs and return on investment is beyond the scope of this study. However
this preliminary economic analysis will show how the electrolysis process may be used as a competitive
technology for hydrogen production.
It is worth mentioning here the coal electrolysis is not a sustainable hydrogen production
pathway. Even if it is driven by energy sources that do not contribute to greenhouse gas emissions, it still
depends on consuming materials (coal and chemicals) other than water.
4.2.2 Demonstration system description and optimization
4.2.2.1 Dark Electrolysis of Coal
The demonstration setup indicated here (Figure 4.2) is previously described in the beginning of
Chapter 2 and 3 of this dissertation. Very few modifications are introduced here to reduce the input
energy consumed during the acid pretreatment step. The modification involves the use of solar heat
energy to boil the coal acid slurry prior to electrolysis.
A non-concentrating solar collector is assumed to provide sufficient heat energy to cover the specific
heat as well as the heat of vaporization of water over the 30 min boiling period.82 Both the 1 M acid and
the catalyst may be filtered off and separated from the coal slurry and reused. The catalyst solution will
then contain iron(III) ions only which are known to have a catalytic effect on coal electrolysis.83 Coal itself
may be reactivated by heating at 250 °C and repeatedly reused5 with minimum contribution to the total

cost. Instead of the grid electricity source used during experiments, a renewable electricity source such
as solar cells can be used to reduce the contribution of the process to greenhouse gas emissions.
Figure 4.2 Demonstration
The price of electricity used in the cost estimates of hydrogen production will adhere to the same prices
shown in Table 4.2. An average electrolysis time of 100 min at 50 mA and hydrogen evolution rate of
0.301 mL/min is assumed for the calculations. It is applicable to both acid treatment as well as the
hydrogen peroxide pretreatment cases.
4.2.2.2 Photoelectrolysis of Coal
Similar modifications to that explained above for dark coal electrolysis apply here. In addition, the
Xe arc lamp used to provide the required UV light will be replaced with a non
78
ity source used during experiments, a renewable electricity source such
as solar cells can be used to reduce the contribution of the process to greenhouse gas emissions.
4.2 Demonstration setup for hydrogen production by dark coal electrolysis
The price of electricity used in the cost estimates of hydrogen production will adhere to the same prices
shown in Table 4.2. An average electrolysis time of 100 min at 50 mA and hydrogen evolution rate of
/min is assumed for the calculations. It is applicable to both acid treatment as well as the
hydrogen peroxide pretreatment cases.
2 Photoelectrolysis of Coal
Similar modifications to that explained above for dark coal electrolysis apply here. In addition, the
Xe arc lamp used to provide the required UV light will be replaced with a non- concentrating solar
ity source used during experiments, a renewable electricity source such
as solar cells can be used to reduce the contribution of the process to greenhouse gas emissions.
lectrolysis.
The price of electricity used in the cost estimates of hydrogen production will adhere to the same prices
shown in Table 4.2. An average electrolysis time of 100 min at 50 mA and hydrogen evolution rate of
/min is assumed for the calculations. It is applicable to both acid treatment as well as the
Similar modifications to that explained above for dark coal electrolysis apply here. In addition, the
concentrating solar

collector. This type of collector is specifically used
sunlight.
Figure 4.3 Demonstration
4.2.3 Sensitivity study
The cost estimation of hydrogen production
data from the previous chapters and mainly based on custom
addresses the influence of variation of main syste
potential, and process efficiency) on the hydrogen production
4.2.3.1 Electricity Price
Electricity prices have proven to be the major contributor to the overall hydrogen production cost
in all electrolytic hydrogen production technologies such as alkaline wat
79
collector. This type of collector is specifically used due to its high ability to collect both direct and diffuse
4.3 Demonstration setup for hydrogen production by coal photoelectrolysis
The cost estimation of hydrogen production was made using currently availab
data from the previous chapters and mainly based on custom-made assumptions. The
addresses the influence of variation of main system components (e.g., electricity
and process efficiency) on the hydrogen production cost.
Electricity prices have proven to be the major contributor to the overall hydrogen production cost
in all electrolytic hydrogen production technologies such as alkaline water electrolysis.
high ability to collect both direct and diffuse
lectrolysis.
made using currently available experimental
sensitivity analysis
electricity price, operating
Electricity prices have proven to be the major contributor to the overall hydrogen production cost
er electrolysis.84 Since the coal

80
electrolysis process depends mainly on using the electric energy and the energy stored in the coal
feedstock to produce hydrogen, electricity prices are expected to play a major role in determining the
hydrogen production cost. The electricity prices shown in Table 4.2 will be used to calculate the hydrogen
production cost in 2010 US dollars assuming 90% and 85% efficiency for the dark and photoelectrolysis
processes, respectively. A separate analysis of the effect of the process efficiency on the hydrogen
production cost will be given in the following discussion.
Figure 4.4 shows a linear increase in the hydrogen production cost with the electricity price as
expected. The lower hydrogen prices with dark electrolysis compared to photoelectrolysis is related to the
difference in the process efficiency (90% and 85 % for dark and photoelectrolysis, respectively) which
pins the cost at $ 2.40 and 3.60 /kg H2 for dark and photoelectrolysis respectively.
An overall, compression, storage, and dispensing (CSD) costs are expected to total about $1.90
per kilogram of hydrogen dispensed85. This increases the hydrogen production cost to US $ 4.30 and
5.50 per kilogram of hydrogen dispensed for dark and photoelectrolysis, respectively. A slight increase in
the electricity price from the currently used value ($ 0.063/kWh) to $ 0.10/kWh would increase the cost to
US $ 5.20 and 7.90 per kilogram of hydrogen dispensed for dark and photoelectrolysis, respectively. The
cost of electricity then is considered as one of the biggest obstacles for large scale electrolytic hydrogen
production. It must be emphasized that the foregoing economic analysis is very approximate.
An overall, compression, storage, and dispensing (CSD) costs are expected to total about $1.90
per kilogram of hydrogen dispensed85. This increases the hydrogen production cost to US $ 4.30 and
5.50 per kilogram of hydrogen dispensed for dark and photoelectrolysis, respectively. A slight increase in
the electricity price from the currently used value ($ 0.063/kWh) to $ 0.10/kWh would increase the cost to
US $ 5.20 and 7.90 per kilogram of hydrogen dispensed for dark and photoelectrolysis, respectively.
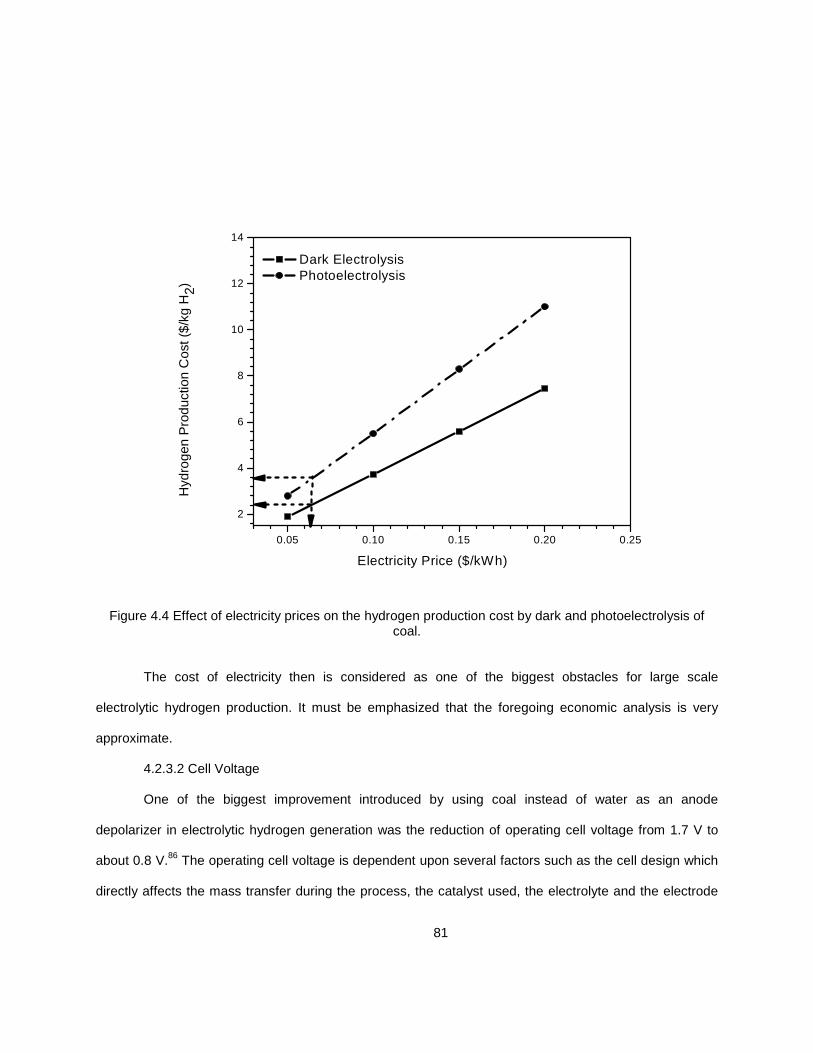
81
0.05 0.10 0.15 0.20 0.25
2
4
6
8
10
12
14
Dark Electrolysis Photoelectrolysis
Hyd
roge
n P
rodu
ctio
n C
ost (
$/kg
H2)
Electricity Price ($/kWh)
Figure 4.4 Effect of electricity prices on the hydrogen production cost by dark and photoelectrolysis of coal.
The cost of electricity then is considered as one of the biggest obstacles for large scale
electrolytic hydrogen production. It must be emphasized that the foregoing economic analysis is very
approximate.
4.2.3.2 Cell Voltage
One of the biggest improvement introduced by using coal instead of water as an anode
depolarizer in electrolytic hydrogen generation was the reduction of operating cell voltage from 1.7 V to
about 0.8 V.86 The operating cell voltage is dependent upon several factors such as the cell design which
directly affects the mass transfer during the process, the catalyst used, the electrolyte and the electrode

82
material. Technological modifications involving the above mentioned factors can result in further reduction
in the cell voltage and subsequent improvement of the process efficiency and economics.
0.4 0.6 0.8 1.0 1.2 1.4 1.6 1.80
1
2
3
4
5
6
7
8
9
Hyd
roge
n P
rodu
ctio
n C
ost (
$/kg
H2)
Cell Voltage (V) at 50 mA
Dark Electrolysis Photoelectrolysis
Figure 4.5 Effect of operating cell potential on the hydrogen production cost by dark and photoelectrolysis of coal.
Figure 4.5 shows the effect of operating cell voltage on the hydrogen production cost. The dark
electrolysis is still showing more favorable economics as it can be carried out at an operating voltage of
0.6 V compared to 0.9 V for the photoelectrolysis process. The operating cell voltage also affects the
energy return over energy input (EROEI) value of the process as shown in Figures 4.6 and 4.7. The
energy input is simply calculated from the power supplied all over the electrolysis reaction time and
expressed in Wh (Watt. hour) units. The energy output on the other hand is calculated using the number

83
of moles of hydrogen obtained from Faraday's law (assuming 90% and 85% efficiency for the dark and
photoelectrolysis reactions, respectively) and the enthalpy of combustion of hydrogen (−286 kJ/mol ).The
EROEI value was found to be 2.22 and 1.40 for dark and photoelectrolysis, respectively.
0.4 0.6 0.8 1.0 1.2 1.4 1.6 1.8 2.00.5
1.0
1.5
2.0
2.5
3.0
3.5
4.0
Cell Voltage (V) at 50 mA
Ene
rgy
Ret
urn
Ove
r E
nerg
y In
put (
ER
OE
I)
at 9
0% e
ffici
ency
Figure 4.6 Variation of EROEI values with cell voltage during dark coal electrolysis.
Keeping the process efficiency constant and reducing the operating cell voltage from 0.6 to 0.4 V
would increase the EROEI value of dark electrolysis to 3.4. Similar exponential increase in the EROEI
value of photoelectrolysis to 2.1 can be attained at an operating cell voltage of 0.6 V.
4.2.3.3 Process Efficiency
The efficiency stated here describes the energy efficiency of the process; i.e., the ratio of the
process energy output to input. Since the energy inputs shown do not include any energy used upstream

84
of the process, e.g., to extract fossil fuels, to build the cell, or to make the chemicals, the energy efficiency
is almost reduced to a Faradaic efficiency. Faradic efficiency describes the efficiency with which the
electrons are transferred in a system facilitating an electrochemical reaction.87 In this coal electrolysis
reaction, it is calculated from the ratio of the amount of hydrogen collected to the theoretical amount from
Faraday's law.
0.2 0.4 0.6 0.8 1.0 1.2 1.4 1.6 1.8 2.0
0.5
1.0
1.5
2.0
2.5
3.0
3.5
Ene
rgy
Ret
urn
Ove
r E
nerg
y In
put (
ER
OE
I)
at 8
5% e
ffici
ency
Cell Voltage (V) at 50 mA
Figure 4.7 Variation of EROEI values with cell voltage during coal photoelectrolysis.
Figure 4.8 shows the reduction in the hydrogen production cost as the process efficiency is
improved. The Faradic efficiency may be improved in different ways; e.g., by reducing the overvoltage
associated with the limited mass transfer of coal particles and catalyst ions to the electrode surface and
reducing the losses during hydrogen collection and measurement. A 10 % increase in the Faradic
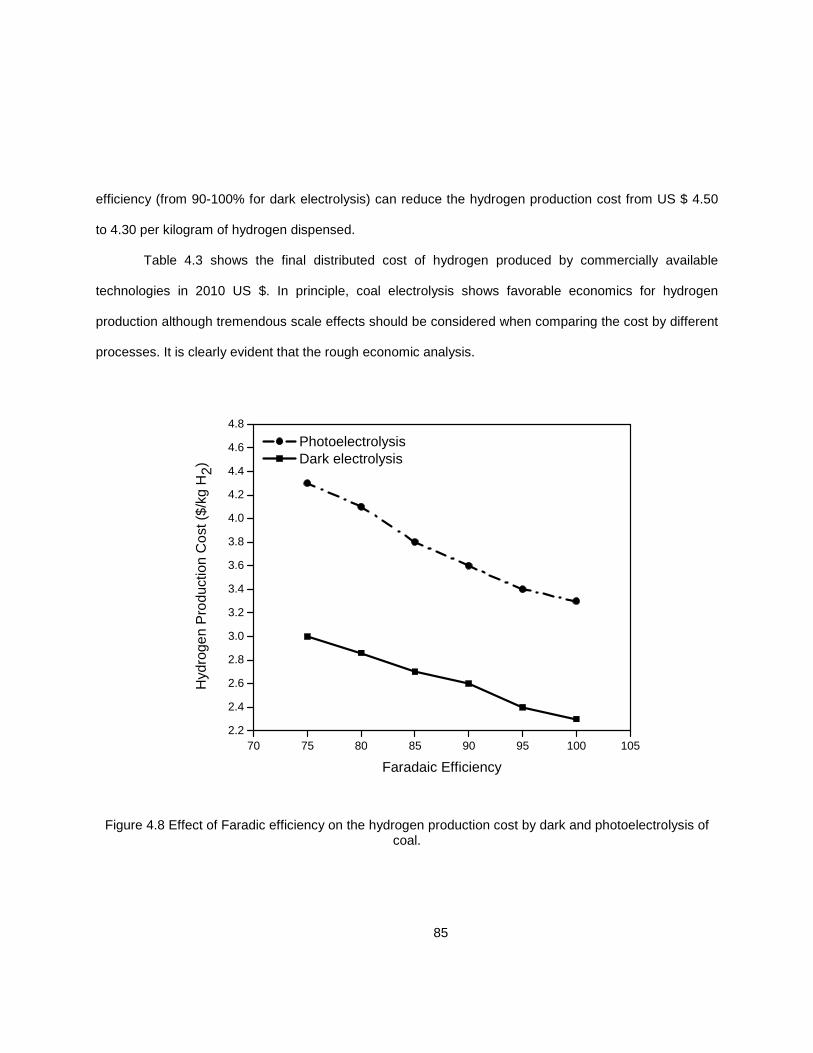
85
efficiency (from 90-100% for dark electrolysis) can reduce the hydrogen production cost from US $ 4.50
to 4.30 per kilogram of hydrogen dispensed.
Table 4.3 shows the final distributed cost of hydrogen produced by commercially available
technologies in 2010 US $. In principle, coal electrolysis shows favorable economics for hydrogen
production although tremendous scale effects should be considered when comparing the cost by different
processes. It is clearly evident that the rough economic analysis.
70 75 80 85 90 95 100 1052.2
2.4
2.6
2.8
3.0
3.2
3.4
3.6
3.8
4.0
4.2
4.4
4.6
4.8
Photoelectrolysis Dark electrolysis
Hyd
roge
n P
rodu
ctio
n C
ost (
$/kg
H2)
Faradaic Efficiency
Figure 4.8 Effect of Faradic efficiency on the hydrogen production cost by dark and photoelectrolysis of coal.

86
Table 4.3 Final Delivered Hydrogen Production Cost by Commercially Available Technologies81
Technology Natural
Gas Water
Electrolysis Coal
Gasification Biomass
Gasification Coal
Electrolysis Coal
Photoelectrolysis
Price 2010 US $/GGE∗
4.11 12.4 4.60 4.51 4.30 5.50
∗ Gasoline gas equivalent = 0.997 kg H2
set above is dependent on large scale production which would keep the electricity costs at the lowest
rate. For small or on-site production, coal electrolysis may compete better with the other processes in
general as processes such as SMR would become prohibitively expensive on small scale.
4.3 Conclusion
Coal electrolysis will fit well with distributed hydrogen production sites where other commercial
processes could prove to be very expensive. The energy requirements as well as the very mild reaction
conditions render coal electrolysis applicable to small hydrogen generators in residential areas. In
addition, coal electrolyzers can be readily integrated with renewable energy sources. The technical
advances expected in the future can result in more reduction of the hydrogen production costs through
developing better catalysts, more effective and cheaper electrode materials.
87
CHAPTER 5
SUMMARY AND CONCLUSIONS
This dissertation study was designed to shed further light on the many factors underlying the
reactivity of Texas lignite coal (TXLC) and carbon blacks in an electrolytic oxidation environment and to
evaluate the feasibility of this process as a commercial pathway for hydrogen generation.
In the first part of the study, UV light has been used as a mechanistic probe for coal and carbon
black photoelectrolysis. The (oxidizable) lignite coal or carbon black particles were able to scavenge
(intercept) the free radicals generated by the photo-Fenton-like mechanism before they can oxidize the
Fe(II) species to Fe(III) species with a net effect of anodic current enhancement. Factors like the amount
of the (oxidizable) carbon content and the surface area of the particles were found to play a crucial role in
the reactivity of coal and the two different carbon blacks. The highest plateau current was obtained with
SRC-401carbon black sample compared to lignite coal and SRC-159and was rationalized on the basis of
both the much higher (oxidizable) carbon content of the black (compared to both coal and SRC-159) and
the higher surface area relative to the (low grade) coal. The higher current observed for SRC-401 relative
to SRC-159(graphitized) was due to its lower susceptibility toward oxidation as a result of graphitization.
By extrapolation, the conclusion is inevitable that surface area differences alone cannot account for the
(electron transfer) reactivity differences between the lignite coal and the two carbon black samples.
In the second part, the consequences of pre-treatment with acids or aq. H2O2 on electrochemical
and thermal reactivity of coal (TXLC) were probed and compared with the corresponding behavior of
carbon black. The higher susceptibility of TXLC to oxidation facilitated the modification of oxygen
functional groups on the particle surface and increased the surface area. This modification lead to better
accessibility of surface groups to chemical and electrochemical reactions and underlined the better TXLC
reactivity following both treatments. Conversely the adverse effect of chemical pre-treatment, specifically
H2O2 pre-treatment, on the carbon blacks, medium, and high rank coals was attributed to the lower

88
content of aliphatic structures and higher resistance to oxidation of these samples. Further investigations
on the mechanistic aspects of iron mediated coal electrolysis revealed that the introduction of oxygen
functional groups, especially the carbonyl groups, on the coal surface have selectively improved the
chemical reactivity of coal and hence facilitates the electron transfer between coal and iron (III) ions.
Modification of MWCNT surface with hydroxyl groups following KMnO4 treatment did not result in any
improvement in their chemical or electrochemical reactivity in iron-mediated electrolysis and ruled out any
effect of hydroxyl groups on their reactivity.
Finally, an economic analysis of hydrogen production by coal (dark and photo) electrolysis was
performed. The analysis aimed at carrying out a sensitivity analysis that addresses the influence of
variation of main system components (e.g., electricity price, operating voltage and process efficiency) on
the hydrogen production cost. Coal electrolysis will fit well with distributed hydrogen production sites
where other commercial processes would be very expensive. The energy requirements as wells as the
very mild reaction conditions render coal electrolysis applicable to small hydrogen generators in
residential areas. In addition, coal electrolyzers can be readily integrated with renewable energy sources.
The technical advances expected in the future can result in more reduction of the hydrogen production
costs through developing better catalysts, more effective and cheaper electrode materials.

89
REFERENCES
(1) Cormos, C.-C. International Journal of Hydrogen Energy 2011, 36, 5960–5971.
(2) Dufour, J.; Serrano, D. P.; Jose, L. G.; Moreno, J.; Gonz, A.; Rey, U.; Carlos, J. Energy & Fuels
2011, 2194–2202.
(3) Coughlin, R. W.; Farooque, M. Nature 1979, 279, 301–303.
(4) Coughlin, R. W.; Farooque, M. Industrial & Engineering Chemistry Process Design and
Development 1982, 21, 559–564.
(5) Coughlin, R. W.; Farooque, M. Industrial & Engineering Chemistry Process Design and
Development 1980, 19, 211–219.
(6) Clarke, R. L.; Foller, P. C.; Wasson, a. R. Journal of Applied Electrochemistry 1988, 18, 546–554.
(7) Seehra, M. S.; Ranganathan, S.; Manivannan, A. Applied Physics Letters 2007, 90, 044104(1–3).
(8) Yin, R.; Ji, X.; Zhang, L.; Lu, S.; Cao, W.; Fan, Q. 2007, 637–641.
(9) Jin, X.; Botte, G. G. Journal of Power Sources 2010, 195, 4935–4942.
(10) Clemens, T.; Gong, D.; Pearce, S. International Journal of Coal Geology 2006, 65, 235–242.
(11) Murphy, O. J.; Bockris, J. O.; Later, D. W. International Journal of Hydrogen Energy 1985, 10,
453–474.

90
(12) Farooque, M.; Coughlin, R. W. Fuel 1979, 58, 705–712.
(13) Dhooge, P. M. Journal of The Electrochemical Society 1983, 130, 1539–1542.
(14) Park, S.-M. Journal of The Electrochemical Society 1984, 131, 363C–373C.
(15) Morooka, S.; Murakami, A.; Kusakabe, K.; Kato, Y.; Kusunoki, K. Fuel 1984, 63, 947–951.
(16) Taylor, N.; Gibson, C.; Bartle, K. D.; Mills, D. G.; Richards, D. G. Fuel 1985, 64, 415–419.
(17) Okada, G. Journal of The Electrochemical Society 1981, 128, 2097–2102.
(18) Baldwin, R.; Jones, K.; Joseph, J.; Wong, J. Fuel 1981, 60, 739–743.
(19) Santos, L. M.; Baldwin, R. P. Journal of Applied Electrochemistry 1986, 16, 203–212.
(20) Thomas, G.; Chettiar, M.; Birss, V. I. Journal of Applied Electrochemistry 1990, 20, 941–950.
(21) Demoz, A.; Khulbe, C.; Fairbridge, C.; Petrovic, S. Journal of Applied Electrochemistry 2008, 38,
845–851.
(22) Thomas, G. Journal of The Electrochemical Society 1990, 137, 3104–3108.
(23) Li, F.; Fan, L.-S. Energy & Environmental Science 2008, 1, 248–267.
(24) Navarro, R. M.; Sanchez-Sanchez, M. C.; Alvarez-Galvan, M. C.; Valle, F. del; Fierro, J. L. G.
Energy & Environmental Science 2009, 2, 35–54.
(25) Levine, D. G.; Schlosberg, R. H.; Silbernagel, B. G. Proceedings of the National Academy of
Sciences 1982, 79, 3365–3370.

91
(26) Whitehurst D, D. In Organic Chemistry of Coal; American Chemical Society, 1978; Vol. 71, pp. 1–
35.
(27) Types of Coal http://www.ket.org/trips/coal/agsmm/agsmmtypes.html (accessed Aug 28, 2012).
(28) Haenel, M. W. Fuel 1992, 71, 1211–1223.
(29) Demoz, a.; Khulbe, C.; Fairbridge, C.; Petrovic, S. Journal of Applied Electrochemistry 2008, 38,
845–851.
(30) Dhooge, P. M., Park, S.-M. Journal of The Electrochemical Society 1983, 130, 1029–1036.
(31) Bott, A. W. Current Separations 2000, 4, 125–127.
(32) Hatakeyama, T.; Quinn, F. X. Thermal Analysis: Fundamentals and Applications to Polymer
Science; John Wiley & Sons, Inc., 1999.
(33) Stuart, B. H. Infrared Spectroscopy: Fundamentals and Applications; David J. Ando, Ed.; John
Wiley & Sons, Ltd, 2004.
(34) Smith, E.; Dent, G. Modern Raman Spectroscopy - A Practical Approach; John Wiley & Sons, Ltd,
2004; Vol. 5.
(35) Datsyuk, V.; Kalyva, M.; Papagelis, K.; Parthenios, J.; Tasis, D.; Siokou, A.; Kallitsis, I.; Galiotis, C.
Carbon 2008, 46, 833–840.
(36) Osswald, S.; Havel, M.; Gogotsi, Y. Journal of Raman Spectroscopy 2007, 38, 728–736.
(37) Musfeldt, J. L. Handbook of Applied Solid State Spectroscopy; Vij, D. R., Ed.; Springer, 2007; Vol.
129.

92
(38) Neyens, E.; Baeyens, J. Journal of Hazardous Materials 2003, 98, 33–50.
(39) Venkatadri, R.; Peters, R. W. Hazardous Waste and Hazardous Materials 1993, 10, 107–149.
(40) Walling, C. Accounts of Chemical Research 1975, 8, 125–131.
(41) Faust, B. C.; Hoigné, J. Atmospheric Environment. Part A. General Topics 1990, 24, 79–89.
(42) Kawai, T.; Sakata, T. Nature 1979, 282, 283–284.
(43) Sato, S.; White, J. M. The Journal of Physical Chemistry 1981, 85, 336–341.
(44) Sato, S.; White, J. M. Journal of the American Chemical Society 1980, 102, 7206–7210.
(45) Chen, X.; Rajeshwar, K.; Timmons, R. B.; Chen, J.-J.; Chyan, O. M. R. Chemistry of Materials
1996, 8, 1067–1077.
(46) Sathe, N.; Botte, G. G. Journal of Power Sources 2006, 161, 513–523.
(47) G.Thomas, M Chettiar, V. I. B. Journal of Applied Electrochemistry 1990, 20, 941–950.
(48) Johnson, K. E.; Verdet, L. Canadian Journal of Chemistry 1986, 64, 419–423.
(49) Soler, L.; Macanas, J.; Munoz, M.; Casado, J. International Journal of Hydrogen Energy 2006, 31,
129–139.
(50) Aboushabana, M.; De Tacconi, N. R.; Rajeshwar, K. Electrochemical and Solid-State Letters
2011, 14, E31–E33.
(51) Okada, G. Journal of The Electrochemical Society 1981, 128, 2097.

93
(52) Alcañiz-Monge, J.; Pérez-Cadenas, M.; Lozano-Castelló, D. Energy & Fuels 2010, 24, 3385–3393.
(53) Kreysa, G.; Kochanek, W. Nature 1985, 316, 714–716.
(54) Thomas, G.; Whitcombe, S.; Farebrother, M. D.; Birss, V. I. Journal of The Electrochemical
Society 1990, 137, 3104–3108.
(55) Anthony, K. E.; Linge, H. G. Journal of The Electrochemical Society 1983, 130, 2217–2219.
(56) Aboushabana, M.; De Tacconi, N. R.; Rajeshwar, K. Journal of The Electrochemical Society 2012,
159, B695–B701.
(57) Zhang, N.; Xie, J.; Varadan, V. K. Smart Mater. Struct. 2002, 11, 962–965.
(58) Park, S. Journal of The Electrochemical Society 1984, 131, 363–373.
(59) McCreery, R. L. Chemical Reviews 2008, 108, 2646–2687.
(60) Kim, U. J.; Furtado, C. A.; Liu, X.; Chen, G.; Eklund, P. C. Journal of the American Chemical
Society 2005, 127, 15437–15445.
(61) Holladay, J. D.; Hu, J.; King, D. L.; Wang, Y. Catalysis Today 2009, 139, 244–260.
(62) Bockris, J. O.; Veziroglu, T. N. International Journal of Hydrogen Energy 2007, 32, 1605–1610.
(63) Monteverde, M.; Magistri, L. International Journal of Hydrogen Energy 2012, 37, 5452–5460.
(64) Kalinci, Y.; Hepbasli, A.; Dincer, I. International Journal of Hydrogen Energy 2009, 34, 8799–8817.
(65) Balat, H.; Kırtay, E. International Journal of Hydrogen Energy 2010, 35, 7416–7426.
94
(66) Boyle, G. Renewable Energy: Power for a Sustainable Future; Oxford University Press, USA.
(67) Asadullah, M.; Ito, S.; Kunimori, K.; Yamada, M.; Tomishige, K. Environmental Science &
Technology 2002, 36, 4476–4481.
(68) Koroneos, C.; Dompros, A.; Roumbas, G.; Moussiopoulos, N. International Journal of Hydrogen
Energy 2004, 29, 1443–1450.
(69) Minggu, L. J.; Wan Daud, W. R.; Kassim, M. B. International Journal of Hydrogen Energy 2010,
35, 5233–5244.
(70) Achenbach, E.; Riensche, E. Journal of Power Sources 1994, 52, 283–288.
(71) Arzamendi, G.; Diéguez, P. M.; Montes, M.; Odriozola, J. A.; Sousa-Aguiar, E. F.; Gandía, L. M.
Chemical Engineering Journal 2009, 154, 168–173.
(72) Hou, K.; Hughes, R. Chemical Engineering Journal 2001, 82, 311–328.
(73) Molburg, J. C.; Doctor, R. D. Hydrogen from Steam-Methane Reforming with CO2 Capture;
Argonne National Laboratory, 2003.
(74) Zhai, X.; Ding, S.; Liu, Z.; Jin, Y.; Cheng, Y. International Journal of Hydrogen Energy 2011, 36,
482–489.
(75) Maluf, S. S.; Assaf, E. M. Fuel 2009, 88, 1547–1553.
(76) Kim, H.-W.; Kang, K.-M.; Kwak, H.-Y.; Kim, J. H. Chemical Engineering Journal 2011, 168, 775–
783.

95
(77) Bhutto, A. W.; Bazmi, A. A.; Zahedi, G. Progress in Energy and Combustion Science 2013, 39,
189–214.
(78) Öztürk, M.; Özek, N.; Yüksel, Y. E. Energy Conversion and Management 2012, 56, 157–165.
(79) Kajitani, S.; Tay, H.-L.; Zhang, S.; Li, C.-Z. Fuel 2013, 103, 7–13.
(80) De Abreu, Y.; Patil, P.; Marquez, A. I.; Botte, G. G. Fuel 2007, 86, 573–584.
(81) Singh, M.; Moore, J.; William, S. Hydrogen Demand , Production and Cost by Region to 2050;
Center for Transportation Research Energy Systems Division Argonne National Laboratory and
TA Engineering, Inc., 2005.
(82) Parra, S. Malato, S., Blanco, J., Péringer, P. and Pulgarin, C. Water Science & Technology 2001,
44, 219–227.
(83) Jin, X.; Botte, G. G. Journal of Power Sources 2007, 171, 826–834.
(84) Yilmaz, C.; Kanoglu, M.; Bolatturk, A.; Gadalla, M. International Journal of Hydrogen Energy 2012,
37, 2058–2069.
(85) Ramsden, T.; Steward, D.; Zuboy, J. Analyzing the Levelized Cost of Centralized and Distributed
Hydrogen Production Using the H2A Production Model; National Renewable Energy laboratory,
NREL/TP-560-46267, 2005.
(86) Patil, P.; De Abreu, Y.; Botte, G. G. Journal of Power Sources 2006, 158, 368–377.
(87) Kaneco, S.; Iiba, K.; Hiei, N.; Ohta, K.; Mizuno, T.; Suzuki, T. Electrochimica Acta 1999, 44, 4701–
4706.

96
BIOGRAPHICAL INFORMATION
Moustafa Reda Aboushabana received his Ph.D in Chemistry and Biochemistry from The
University of Texas at Arlington in December 2012. He obtained his Master of Science (with specialization
in Pharmaceutical Analytical Chemistry) degree from Mansoura University, Mansoura, Egypt in November
2005, and Bachelor of Pharmaceutical Sciences degree from Mansoura University, Mansoura, Egypt in
May 1997.
Related Documents