Minerals 2022, 12, 442. https://doi.org/10.3390/min12040442 www.mdpi.com/journal/minerals Article Electrocoagulation vs. Integrate Electrocoagulation-Natural Zeolite for Treatment of Biowaste Compost Leachate—Whether the Optimum Is Truly Optimal Nediljka Vukojević Medvidović 1, *, Ladislav Vrsalović 2 , Sandra Svilović 3 and Anđela Bobanović 4 1 Department of Environmental Engineering, Faculty of Chemistry and Technology, University of Split, 21000 Split, Croatia 2 Department of Electrochemistry and Materials Protection, Faculty of Chemistry and Technology, University of Split, 21000 Split, Croatia; [email protected] 3 Department of Chemical Engineering, Faculty of Chemistry and Technology, University of Split, 21000 Split, Croatia; [email protected] 4 Žuvela d.o.o., 21450 Hvar, Croatia; [email protected] * Correspondence: [email protected]; Tel.: +385-21-329-452 Abstract: Natural zeolites are well-known materials widely applied in the environmental remedia- tion treatment process. However, the integration of various treatment methods is exceedingly in- vestigated for achieving satisfactory effluent quality. In this paper, the integration of electrocoagu- lation and natural zeolite was evaluated in the treatment of biowaste compost leachate in a single step. The influence of different distances of electrodes (1.5, 3, and 4.5 cm), stirring speed (70, 200, and 400 rpm), the addition of natural zeolite and electrolyte NaCl on the efficiency of treatment of biowaste compost leachate has been carried out. Process efficiency was evaluated by measuring the change of pH value, electrical conductivity, temperature, turbidity, chemical oxygen demand (COD), total Kjeldahl nitrogen (TNK), total solids, and sludge settling test. The Taguchi method was applied to optimize biowaste compost leachate treatment. Experiments are planned according to Taguchi’s L8 (2 4 4 1 ) orthogonal array. The stirring speed, electrode distance, electrolyte and zeolite addition, solution initial pH adjustment were chosen as controllable factors, and their impact on COD, turbidity, TNK, settling rate, and electrode consumption were studied. Results show that op- timal conditions depend on the parameter of interest and that optimal values for a particular pa- rameter are not always the optimum if the desired goal is considered. Keywords: natural zeolite; integration of zeolite with electrocoagulation; biowaste compost leach- ate; removal efficiency; Taguchi optimization 1. Introduction Even composting is recognized as an effective way of managing organic waste, com- posting on industrial scales creates a significant amount of leachate, which contains a va- riety of hazardous substances that can have potential adverse effects on the environment. Therefore, leachate treatment prior to discharge into the sewer or natural recipient is nec- essary. Today, various physicochemical treatment methods (coagulation/flocculation, electrocoagulation, nanofiltration, reverse osmosis), biological treatment methods (biofil- ters, anaerobic bioreactors, membrane bioreactors, MBR), advanced oxidation technolo- gies (Fenton, ozone, UV/TiO2, etc.) are used to treat leachate generated during compost- ing. Still, they do not achieve a sufficient purification effect when applied as a single pro- cess [1]. Thus, many scientists are focused on the integration of two or more single process treatments conducted simultaneously or in succession to achieve satisfactory leachate ef- Citation: Vukojević Medvidović, N.; Vrsalović, L.; Svilović, S.; Bobanović, A. Electrocoagulation vs. Integrate Electrocoagulation-Natural Zeolite for Treatment of Biowaste Compost Leachate—Whether the Optimum Is Truly Optimal. Minerals 2022, 12, 442. https://doi.org/ 10.3390/min12040442 Academic Editor: Carmen Mihaela Neculita Received: 28 February 2022 Accepted: 30 March 2022 Published: 2 April 2022 Publisher’s Note: MDPI stays neu- tral with regard to jurisdictional claims in published maps and institu- tional affiliations. Copyright: © 2022 by the authors. Li- censee MDPI, Basel, Switzerland. This article is an open access article distributed under the terms and con- ditions of the Creative Commons At- tribution (CC BY) license (http://crea- tivecommons.org/licenses/by/4.0/).

Welcome message from author
This document is posted to help you gain knowledge. Please leave a comment to let me know what you think about it! Share it to your friends and learn new things together.
Transcript
Minerals 2022, 12, 442. https://doi.org/10.3390/min12040442 www.mdpi.com/journal/minerals
Article
Electrocoagulation vs. Integrate Electrocoagulation-Natural Zeolite for Treatment of Biowaste Compost Leachate—Whether the Optimum Is Truly Optimal Nediljka Vukojević Medvidović 1,*, Ladislav Vrsalović 2, Sandra Svilović 3 and Anđela Bobanović 4
1 Department of Environmental Engineering, Faculty of Chemistry and Technology, University of Split, 21000 Split, Croatia
2 Department of Electrochemistry and Materials Protection, Faculty of Chemistry and Technology, University of Split, 21000 Split, Croatia; [email protected]
3 Department of Chemical Engineering, Faculty of Chemistry and Technology, University of Split, 21000 Split, Croatia; [email protected]
4 Žuvela d.o.o., 21450 Hvar, Croatia; [email protected] * Correspondence: [email protected]; Tel.: +385-21-329-452
Abstract: Natural zeolites are well-known materials widely applied in the environmental remedia-tion treatment process. However, the integration of various treatment methods is exceedingly in-vestigated for achieving satisfactory effluent quality. In this paper, the integration of electrocoagu-lation and natural zeolite was evaluated in the treatment of biowaste compost leachate in a single step. The influence of different distances of electrodes (1.5, 3, and 4.5 cm), stirring speed (70, 200, and 400 rpm), the addition of natural zeolite and electrolyte NaCl on the efficiency of treatment of biowaste compost leachate has been carried out. Process efficiency was evaluated by measuring the change of pH value, electrical conductivity, temperature, turbidity, chemical oxygen demand (COD), total Kjeldahl nitrogen (TNK), total solids, and sludge settling test. The Taguchi method was applied to optimize biowaste compost leachate treatment. Experiments are planned according to Taguchi’s L8 (24 41) orthogonal array. The stirring speed, electrode distance, electrolyte and zeolite addition, solution initial pH adjustment were chosen as controllable factors, and their impact on COD, turbidity, TNK, settling rate, and electrode consumption were studied. Results show that op-timal conditions depend on the parameter of interest and that optimal values for a particular pa-rameter are not always the optimum if the desired goal is considered.
Keywords: natural zeolite; integration of zeolite with electrocoagulation; biowaste compost leach-ate; removal efficiency; Taguchi optimization
1. Introduction Even composting is recognized as an effective way of managing organic waste, com-
posting on industrial scales creates a significant amount of leachate, which contains a va-riety of hazardous substances that can have potential adverse effects on the environment. Therefore, leachate treatment prior to discharge into the sewer or natural recipient is nec-essary. Today, various physicochemical treatment methods (coagulation/flocculation, electrocoagulation, nanofiltration, reverse osmosis), biological treatment methods (biofil-ters, anaerobic bioreactors, membrane bioreactors, MBR), advanced oxidation technolo-gies (Fenton, ozone, UV/TiO2, etc.) are used to treat leachate generated during compost-ing. Still, they do not achieve a sufficient purification effect when applied as a single pro-cess [1]. Thus, many scientists are focused on the integration of two or more single process treatments conducted simultaneously or in succession to achieve satisfactory leachate ef-
Citation: Vukojević Medvidović, N.;
Vrsalović, L.; Svilović, S.;
Bobanović, A. Electrocoagulation vs.
Integrate Electrocoagulation-Natural
Zeolite for Treatment of Biowaste
Compost Leachate—Whether the
Optimum Is Truly Optimal. Minerals
2022, 12, 442. https://doi.org/
10.3390/min12040442
Academic Editor: Carmen Mihaela
Neculita
Received: 28 February 2022
Accepted: 30 March 2022
Published: 2 April 2022
Publisher’s Note: MDPI stays neu-
tral with regard to jurisdictional
claims in published maps and institu-
tional affiliations.
Copyright: © 2022 by the authors. Li-
censee MDPI, Basel, Switzerland.
This article is an open access article
distributed under the terms and con-
ditions of the Creative Commons At-
tribution (CC BY) license (http://crea-
tivecommons.org/licenses/by/4.0/).
Minerals 2022, 12, 442 2 of 22
fluent quality. Such processes are commonly referred to as hybrid, combined, or inte-grated [2–4]. Our intention here was to investigate the combination of integrated adsorp-tion and electrocoagulation (EC) in wastewater treatment because only several published papers considered this combination in wastewater purification, most of them without mathematical analysis, such as Taguchi optimization. Regarding the previously published papers on this topic, Linares-Hernández et al. (2007) [5] reported that the integration of EC with biosorption on bioadsorbent Ectodemis of Opuntia improves the efficiency of pollutant removal from mixed industrial wastewater. The processes were carried out se-quentially, i.e., EC as pretreatment and biosorption after EC. The parameters monitored in the purification process were color, turbidity, COD, BOD5, and fecal coliform content. The efficiencies of removal of color, turbidity, and fecal coliforms were 97%, 98.8%, and 99.9%, respectively, while removals of COD and BOD5 recorded lower removal values of 84% and 78%, respectively. Narayanan and Ganesan (2009) [6] apply a hybrid of EC and adsorption process to remove chromium from synthetic wastewater using activated car-bon as an adsorbent. It was found that the addition of adsorbent increases the rate of re-moval of chromium at lower current density, and increased chromate removal is due to the combined effect of precipitation, coprecipitation, sweep coagulation, and adsorption. Chang et al. (2010) [7] also combine EC with activated carbon as an adsorbent to remove the azo dye Reactive Black 5 (RB5) from the synthetic solution. The treatment was con-ducted as a two-stage, first EC with Fe-electrodes and NaCl electrolyte, and then adsorp-tion on activated carbon. Although visually very rapid removal of the staining solution was achieved, COD removal was only 39%, and the effluent after treatment was highly toxic due to the resulting RB5 intermediates and chlorine byproducts from added NaCl electrolyte. Ouaissa et al. (2012) [8] investigated the treatment of tannery wastewater pol-lutants by EC using aluminum plates coupled with adsorption onto granular carbon. The monitored parameters in the purification process were COD, turbidity, and chromium content. When applying only the EC process, the removal efficiency of COD, turbidity, and chromium was 25%, 94.25%, and 24.6%, and when combining EC and adsorption, 75%, 96%, and 92%. Elabbas et al. (2020) [9] used an integrated process of EC and adsorp-tion to remove chromium from the wastewater from the leather industry, using the egg-shell as an adsorbent. This type of material, as adsorbent, showed high efficiency of chro-mium removal of 99%, while the stand-alone EC process was 63%.
The EC found its application only in the 21st century due to the high price of electric-ity in previous times. However, as the price of electricity is rising again, combining re-newable energy sources with electrocoagulation, these processes will maintain a sustain-able alternative for water and wastewater treatment [10–13]. The advantages of EC are related to relatively low investment costs, energy, and treatment costs due to the small size of used equipment [14,15]. EC is a complex process that can be divided into four steps: (1) electrochemical reactions on the electrode surfaces, (2) formation of coagulant in the aqueous phase by hydroxides of anodic metal, (3) adsorption of pollutants in flocks, and (4) removal by electroflotation, sedimentation, and adhesion to bubbles [16,17]. On Al electrodes, the basic electrochemical reactions on the anode and cathode can be written as follows:
Main anodic reaction: Al → Al + 3e (1)Acidic medium: 2H O → 4H + O + 4e (2)Basic medium: 4OH → O + 2H O + 4e (3)Chatodic reaction: 2H O + 2e → 2OH + H (4)Solution medium: Al + 3H O → Al(OH) + 3H (5)
Minerals 2022, 12, 442 3 of 22
During the oxidation process, the aluminum anode dissolves and generates Al3+ cat-ions, which are further reacted and transformed into various monomeric and polymeric ionic forms such as Al(OH)2+, Al(OH)2+, Al2(OH)24+, and Al(OH)4−, Al6(OH)153+, Al7(OH)174+, Al8(OH)204+, Al13O4(OH)247+, and Al13(OH)345+ and also low soluble amorphous species such as Al(OH)3 and Al2O3, which depend on the initial pH of the solution [17–19].
Electrolysis of water at the cathode generates hydroxide ions that combine with dis-solved aluminum from the anode, and form hydroxide precipitate at a suitable pH which removes pollutants by sweep-floc mechanism. The formation of H2 due to water electrol-ysis at the cathode may promote the flotation of some portion of coagulated pollutants to the surface [20]. Besides aluminum dissolution from the anode, aluminum dissolution from the cathode is also recorded, confirming that both electrodes are influencing on for-mation floc of Al(OH)3 during electrocoagulation [14]. Thus, the mechanism of EC takes into account aluminum dissolution at the cathode according to Equation (6): Al(s) + 4 OH (aq) − 3e → Al(OH) (aq) (6)
Aluminum dissolution at the anode (1) and cathode (6) produces Al3+ and Al(OH)4−
(aq), respectively. In solution, Al3+ reacts with OH- and forms floc Al(OH)3 (s), but also contributes with Al(OH)4− to produce floc of Al(OH)3 (s), according to Equation (7) [21]: Al(OH) (aq) → Al(OH) (s) + OH (aq) (7)
The application of EC allows avoidance of chemical additives (except possible NaCl as electrolyte), which makes the EC a “green technology” due to the prevention of sec-ondary pollution. Compared to classical coagulation, EC can remove much smaller parti-cles as the electric field causes faster movement and collision, increasing their aggregation process’s efficiency [22]. Bubbles formed in the EC process carry the substances toward the surface, where they are more concentrated and easier to coagulate and remove [23]. Compared to classical coagulation, EC significantly reduces the volume of sludge pro-duced. This is particularly key regarding the economy of the process since generated sludge in any water treatment method must be further treated [22]. The obtained sludge is of better quality: lower water content, much larger and more stable accumulations (flocs) with better settling characteristics [22,23].
Like every other process, EC also has some disadvantages. Periodically replacement of the electrodes is needed because they oxidize and consume water [22]. Uneven anode dissolution can interfere with EC efficiency. Electrode inertness can cause oxide protective layer formation on electrode surfaces. This prevents electron exchange and dissolution of metals, resulting in increased electricity consumption. Although there is still no universal solution to this problem, periodic electrode cleaning and the use of alternative pulse cur-rent (APC) can prevent passivation [22]. In addition, there is a need for adequate water conductivity. However, natural water and slightly polluted wastewater do not have this feature, so their conductivity must be increased by using a supporting electrolyte. Due to its low cost, availability, and non-toxicity, NaCl is the most used support electrolyte, but others have occasionally been used, such as Na2SO4 [22,23].
Zeolites can be described as aluminosilicates of specific spatial structures that have the properties of ion exchange, adsorption, and molecular sieves. Natural zeolites and their modified forms are used to separate, bind, and chemically stabilize hazardous inor-ganic, organic and radioactive species in soils and aqueous systems. After application as adsorbent and ion-exchanger, zeolite can be easily regenerated and used again without losing its original capacity [24–30]. According to Syafalni et al. [31], the combination of modified zeolite-ferric chloride and modified zeolite-bentonite was found to be a suitable environment-friendly coagulant in river water treatment. Besides modified zeolite, other coagulants such as FeCl3 6H2O, Al2(SO4)3⋅18 H2O, as well as chitosan, powder-activated carbon, starch, etc., are also investigated, mostly in powdered form, to enhance coagula-tion [32–34]. Coagulation is defined as the destabilization of colloidal particles by reduc-
Minerals 2022, 12, 442 4 of 22
ing repulsive forces between them, while flocculation represents the binding of destabi-lized particles into larger agglomerates flocs as a result of flocs collision due to Brownian motion (perikinetic flocculation) or velocity gradients (orthokinetic flocculation) [35].
Today, only a few papers are published on the topic of integration of EC and natural zeolite. Hamid et al. (2020a, 2020b, 2021) [36–38] investigated the ammonia removal from landfills leachate at a zeolite/solution ratio of 120 g/L in a single treatment reactor. Our preliminary investigation has confirmed that EC combined with natural zeolite is efficient for the treatment of biowaste compost leachate in a single step and with a significantly smaller amount of zeolite of 20 g/L [39].
The Taguchi method uses a specifically designed orthogonal array consisting of con-trollable factors and their variation levels to optimize experimental conditions. The ad-vantage of the Taguchi method is assessing optimal experimental conditions without a high number of experiments [40,41].
This paper examines the efficiency of biowaste compost leachate treatment using an electrocoagulation process with and without the addition of zeolites and electrolytes at different distances of electrodes and stirring speeds. The Taguchi method was applied to achieve multiple parameters optimization. The stirring speed, electrode distance, electro-lyte and zeolite addition, and solution initial pH adjustment were chosen as controllable factors, and their impact on COD, turbidity, TNK, settling rate, and electrode consumption were studied.
2. Materials and Methods Biowaste compost leachate solutions were used for treatment. The leachate was obtained
from composting mass in an open container. The characterization of initial biowaste com-post leachate was performed through the determination of the pH, el. conductivity, tur-bidity, COD, TNK, and TS were performed according to standard methods for examining water and wastewater [42].
Natural zeolite used in this study was originated from the Zlatokop deposit, Vranjska Banja, Serbia, with granulation of 0.1–0.5 mm. The XRD and semiquantitative mineralog-ical analysis have confirmed that the main mineralogical component is clinoptilolite with quartz as an impurity [26,43]. Based on chemical composition, the theoretical exchange capacity equals 1.411 mmol/g [44]. Si/Al ration equals 4.08, while the content of exchange-able cations indicates that Ca > (Na + K), which confirms the Ca-form of clinoptilolite. The characterization of the raw zeolite sample by the X-ray powder diffraction method (XRPD, Phillips PW-1710 diffractometer, Amsterdam, The Netherlands), scanning electron mi-croscopy and energy dispersive X-ray analysis (SEM-EDS, JOEL JSM-6610 microscope, Tokyo, Japan), a thermal analysis (TG-DTG, Perkin Elmer STA 6000, Waltham, MA, USA) and Fourier transform infrared spectroscopy (FTIR, Thermo Nicolet 6500 spectrometer, Waltham, MA, USA) has been published previously [45].
Al electrode material used in this study was aluminum alloy AA2007 series 2000, in which the main alloying element is copper. Analysis of chemical composition is showing that Al = 92.58%, Cu = 3.39%, Pb = 1.02%, Mg = 0.88%, Mn = 0.67%, Fe = 0.62%, Si = 0.21%, while Zn, Ti, Cr, Ni, Sn, Bi, Zr, and Be are present in less than 0.1%. The total surface area of Al-alloy electrodes immersed in biowaste compost leachate was 44 cm2.
Electrocoagulation experiments (EC) were performed in a batch-type electrochemical cell of 300 mL, with immersed aluminum AA2007 alloy electrodes. In all experiments, current intensity and applied voltage were in the range of 0.1–0.3 A and 8.3–29.9 V, re-spectively. A total of 16 experiments have been performed to investigate the influence of different distances of electrodes (1.5, 3, and 4.5 cm), stirring speed (70, 200, and 400 rpm), the addition of natural zeolite (in the amount of solid to liquid ratio 20 g/L), the addition of electrolyte NaCl (NaCl, p.a. was added in a concentration of 1 g/L), at a contact time of 40 min, without adjustment of initial pH of solutions. Table 1 gives an overview of exper-imental conditions during the 16 experiments.
Minerals 2022, 12, 442 5 of 22
Table 1. Overview of experimental conditions during experiments.
Exp. no.
Experiment Mark
Stirring Speed,
rpm
Electrode Distance,
cm
Zeolite Addition,
20 g/L
NaCl Addition,
1 g/L
Voltage, V
Current Intensity,
A 1 EC70rpm+EL 70 4.5 no yes 16.1 0.3 2 EC200rpm+EL 200 4.5 no yes 16.1 0.3 3 EC400rpm+EL 400 4.5 no yes 16.1 0.3 4 EC70rpm 70 4.5 no no 29.9 0.1 5 ECZ70rpm+EL 70 4.5 yes yes 16.1 0.3 6 ECZ200rpm+EL 200 4.5 yes yes 17.8 0.3 7 ECZ400rpm+EL 400 4.5 yes yes 16.1 0.3 8 ECZ70rpm 70 4.5 yes no 29.2 0.1 9 EC1.5cm+EL 70 1.5 no yes 8.3 0.3
10 EC3cm+EL 70 3.0 no yes 13.4 0.3 11 EC4.5cm+EL 70 4.5 no yes 16.1 0.3 12 EC1.5cm 70 1.5 no no 22.8 0.1 13 ECZ1.5cm+EL 70 1.5 yes yes 9.3 0.3 14 ECZ3cm+EL 70 3.0 yes yes 12.8 0.3 15 ECZ4.5cm+EL 70 4.5 yes yes 16.1 0.3 16 ECZ1.5cm 70 1.5 yes no 21.2 0.1
Between each experiment, the electrodes were ground and polished with successive wet SiC emery papers (up to 800 grit), ultrasonically cleaned in 70% ethanol, and deion-ized water. The pH value, temperature, and el. conductivity were recorded during the experiments, while the turbidity, COD, TNK, and TS were determined in solution at the end of the experiments.
Sludge settling tests were performed after each electrocoagulation experiment. The suspensions were transferred into the cylindrical vessel, and a sludge settling test was performed by applying the Kynch theory of sedimentation. The settling curves were de-termined for all 16 experiments.
Taguchi Optimization In order to optimize the integrated electrocoagulation process with natural zeolite, a
set of eight experiments were performed, according to Taguchi’s L8 (24 41) design. Table 2 gives an overview of experimental conditions during these eight experiments. For that purpose, experiments were performed with (Z1) and without (Z2) the addition of natural zeolite, with (E1) and without (E2) addition of electrolyte solutions of NaCl, in concentra-tion 1 g/L, with adjustment of initial solutions pH values pH = 4, and without initial pH adjustment. Distances of electrodes were 1.5 (D1) and 4.5 cm (D2), while stirring speeds were 0 (S1), 70 (S2), 200 (S3), and 400 (S4) rpm, respectively. The experiment duration time was set at 30 min. The addition of natural zeolite was 20 g/L. Initial pH values were ad-justed with 0.1 mol/L HCl.
Minerals 2022, 12, 442 6 of 22
Table 2. Experimental plan and factor used for L8 (24 41) Taguchi design.
Exp. no.
Experiment Mark
Stirring Speed
Electrode Distance
Electrolyte Addition
Zeolite Addition
Solution Initial pH Adjustment
1 ECZ1.5cm+EL+pH not adjusted+0rpm S1 D1 E1 Z1 pH1 2 EC4.5cm+pH=4+0rpm S1 D2 E2 Z2 pH2 3 EC1.5cm+EL+pH=4+70rpm S2 D1 E1 Z2 pH2 4 ECZ4.5cm+pH not adjusted+70rpm S2 D2 E2 Z1 pH1 5 ECZ1.5cm+pH=4+200rpm S3 D1 E2 Z1 pH2 6 EC4.5cm+EL+pH not adjusted+200rpm S3 D2 E1 Z2 pH1 7 EC1.5cm+pH not adjusted+400rpm S4 D1 E2 Z2 pH1 8 ECZ4.5cm+EL+pH=4+400rpm S4 D2 E1 Z1 pH2
Note: S1, S2, S3, and S4 correspond to steering speeds of 0, 70, 200, and 400 rpm; D1 and D2 corre-spond to electrode distances of 1.5 and 4.5 cm; E1 and E2 correspond to NaCl electrolyte addition (with and without); Z1 and Z2 correspond to zeolite addition (with and without); pH1 and pH2 correspond to solution initial pH adjustment (pH not adjusted and adjustment at pH = 4).
Experiments in this study were planned according to Taguchi’s (24 41) design (Table 2). This design has eight rows representing the number of experiments and five columns representing the controllable factors. The electrode distance (D), the addition of electrolyte (E), the addition of zeolite (Z), solution initial pH adjustment (pH), and stirring speed (S) were chosen as controllable factors, and their impact on COD, TNK, turbidity, settling rate, and electrodes loss were studied. As shown in Table 2, four factors used had two levels of testing conditions and fifth factor had four levels.
As the studied integrated process has a few output parameters, and in this study, the effect of experimental conditions for five of them are of interest, the two quality charac-teristics, the smaller-the-better or the larger-the-better, were used depending on the pa-rameter to be optimized.
Smaller-the-better quality characteristic is represented by Equation (8) [46]: 𝑆/𝑁 = −10 𝑙𝑜𝑔 ∑ 𝑦𝑛 (8)
where S/N represents signal-to-noise ratio, subscript SB represents smaller-the-better, n is the number of repetitions under the same experimental conditions, and y is a measure-ment value.
Larger-the-better quality characteristic is represented by Equation (9) [40,41]:
𝑆/𝑁 = −10 𝑙𝑜𝑔 ∑ 1𝑦𝑛 (9)
where subscript LB represents larger-the-better. Afterward, it is urged to determine the optimal conditions. For that purpose, the av-
erage S/NSB or S/NLB ratio of each controllable factor at level i, marked as S/NFL, was calcu-lated:
𝑆/𝑁 = ∑ (𝑆/𝑁)𝑛 (10)
where ( )FjNS / represents S/NSB or S/NLB ratio for factor F on level i, the superscript j is the j-th appearance of the i-th level.
Minerals 2022, 12, 442 7 of 22
3. Results 3.1. Physical-Chemical Characterization of Biowaste Compost Leachate
Table 3 gives a physical-chemical analysis of biowaste compost leachate compared with maximal allowed values according to the Croatian regulation (NN 26/2020) [47]. The pH value of the biowaste compost leachate is 7.95 and does not exceed the limit values for discharge into surface waters and into the public sewage system. The el. conductivity, as an indication of the presence of solutes that have ionic conductivity properties, is 205.00 µS/cm. However, to promote the EC process, it is necessary to add electrolytes to ensure better conductivity and lower resistance. The value of COD in the sample is 278.32, which indicates the presence of both biodegradable and inorganic substances susceptible to oxi-dation with bichromate. The value is above the limit prescribed by the Croatian regulation (125 mg O2/L). The TNK equals 47.62 mg N/L. The obtained value is compared with the values for total nitrogen since the values for TNK are not defined by Croatian regulation. It can be seen that the TNK value is higher than the limit value stated by the Croatian regulation for discharge into surface waters (15 mg N/L). The turbidity is very high and amounts to 87.20 NTU (Nefelometric Turbidity Units) due to the presence of dissolved and dispersed substances in the leachate. Although the values for turbidity are not stated, the discharge of water of this turbidity into a natural recipient would cause detrimental effects on the photosynthesis process and the dissolved oxygen content. The TS equals 275 mg/L, indicating the presence of suspended, dissolved, and settleable solids in the bio-waste leachate and refer to turbidity and el. conductivity. The obtained value is compared with the values for total suspended solids (TSS) since the values for TS are not defined by Croatian regulation. It can be seen that the TS value is significantly higher than the TSS limit value prescribed by the Croatian regulation for discharge into surface waters (35 mg/L), which indicates the presence of suspended and settleable solids.
Table 3. Biowaste compost leachate characterization and the admissible values according to Croa-tian regulation (NN 26/2020) [47].
Parameter Biowaste Compost Leachate
Natural Surface Waters
Public Sewage System
pH 7.95 6.5–9.5 6.5–9.5 El. cond., µS/cm 205.00 - - Turbidity, NTU 87.20 - -
COD, mg/L 278.32 125 700 TNK, mg N/L 47.62 15 * 50 *
TS, mg/L 275 35 ** - Note: *—values for total nitrogen are compared since values for Kjeldahl nitrogen are not specified by Croatian regulation; **—values for total suspended solids TSS are compared since values for total solids (TS) are not specified by Croatian regulation.
3.2. Biowaste Compost Leachate Treatment with Electrocoagulation and Electrocoagulation Inte-grate with Zeolite
The biowaste compost leachate was treated by EC without and with the addition of zeolite and electrolyte at different distances between the electrode (1.5, 3, and 4.5 cm) and stirring speed (70, 200, and 400 rpm). Results of continuous monitoring of pH, el. conduc-tivity and temperature at different experimental conditions during the EC process are compared in Figures 1–3.
Minerals 2022, 12, 442 8 of 22
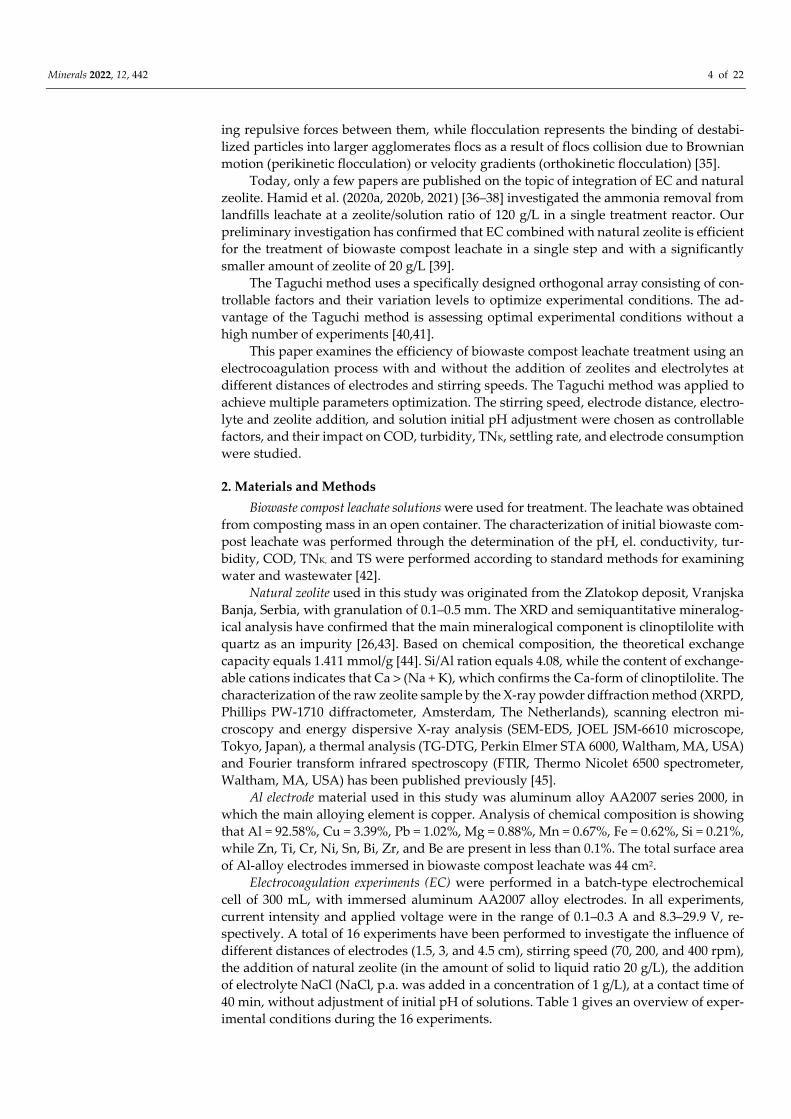
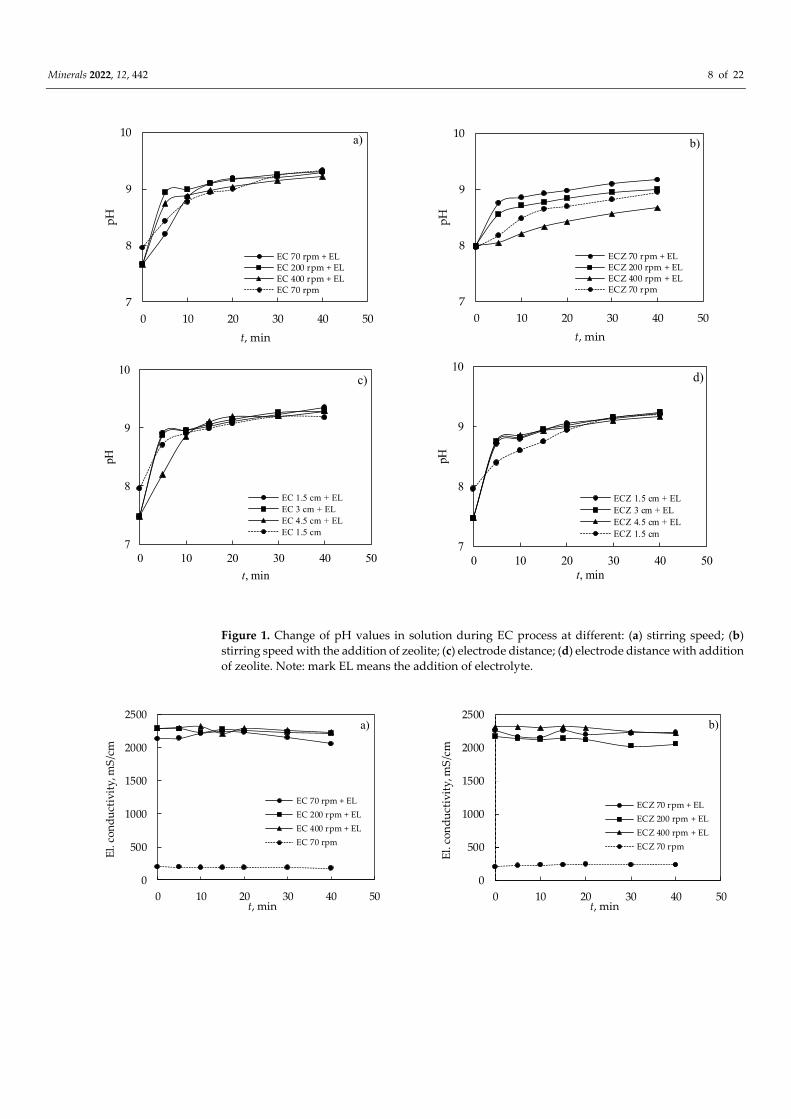
Figure 1. Change of pH values in solution during EC process at different: (a) stirring speed; (b) stirring speed with the addition of zeolite; (c) electrode distance; (d) electrode distance with addition of zeolite. Note: mark EL means the addition of electrolyte.
7
8
9
10
0 10 20 30 40 50
pH
t, min
EC 70 rpm + ELEC 200 rpm + ELEC 400 rpm + ELEC 70 rpm
a)
7
8
9
10
0 10 20 30 40 50
pH
t, min
ECZ 70 rpm + ELECZ 200 rpm + ELECZ 400 rpm + ELECZ 70 rpm
b)
7
8
9
10
0 10 20 30 40 50
pH
t, min
EC 1.5 cm + ELEC 3 cm + ELEC 4.5 cm + ELEC 1.5 cm
c)
7
8
9
10
0 10 20 30 40 50
pH
t, min
ECZ 1.5 cm + ELECZ 3 cm + ELECZ 4.5 cm + ELECZ 1.5 cm
d)
0
500
1000
1500
2000
2500
0 10 20 30 40 50
El. c
ondu
ctiv
ity, m
S/cm
t, min
EC 70 rpm + ELEC 200 rpm + ELEC 400 rpm + ELEC 70 rpm
a)
0
500
1000
1500
2000
2500
0 10 20 30 40 50
El. c
ondu
ctiv
ity, m
S/cm
t, min
ECZ 70 rpm + ELECZ 200 rpm + ELECZ 400 rpm + ELECZ 70 rpm
b)
Minerals 2022, 12, 442 9 of 22
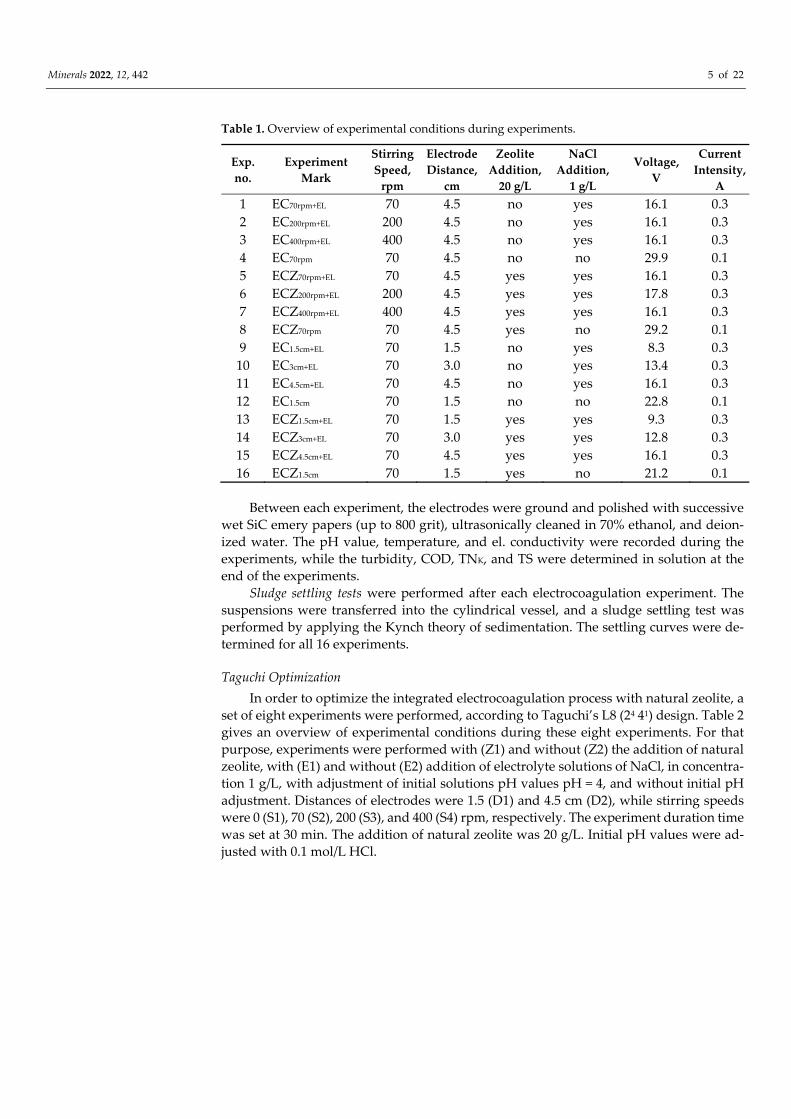
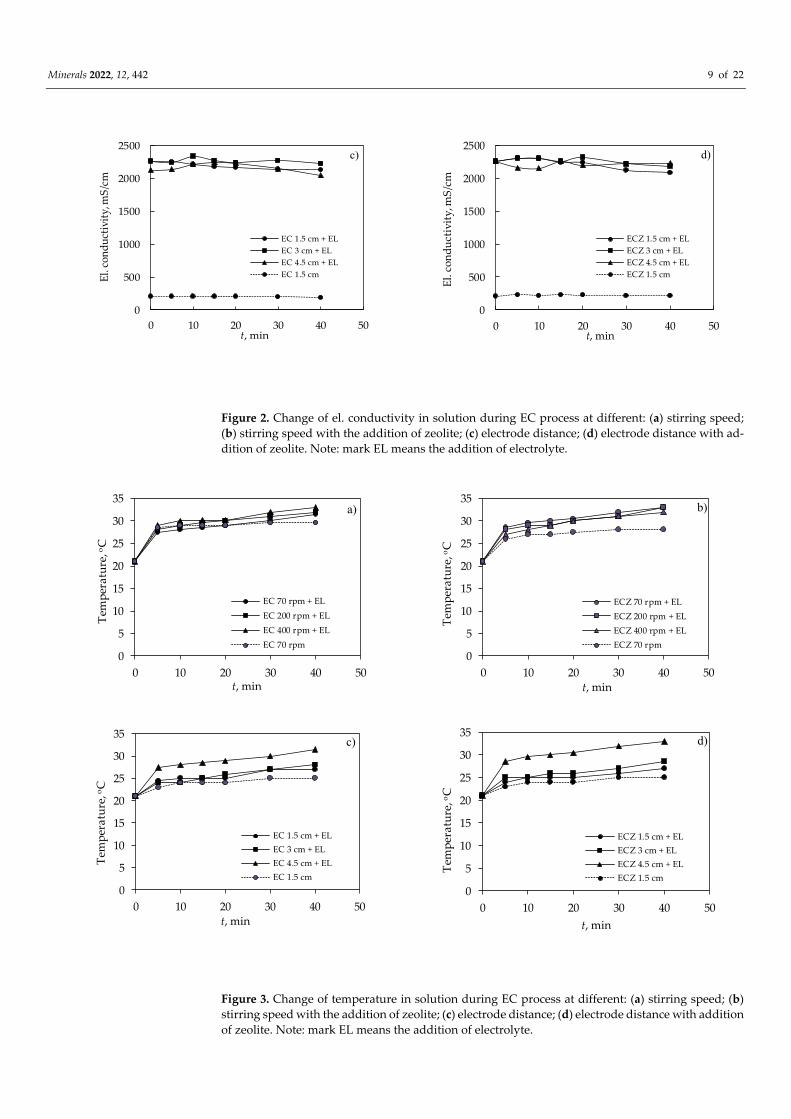
Figure 2. Change of el. conductivity in solution during EC process at different: (a) stirring speed; (b) stirring speed with the addition of zeolite; (c) electrode distance; (d) electrode distance with ad-dition of zeolite. Note: mark EL means the addition of electrolyte.
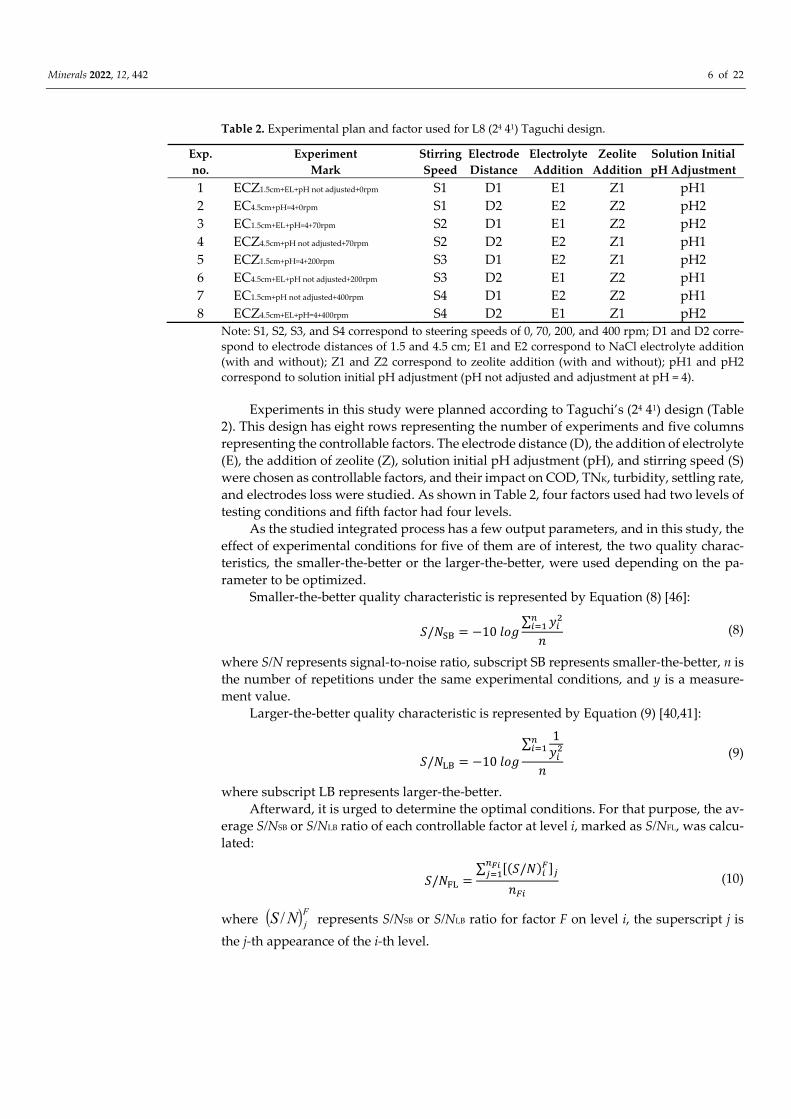
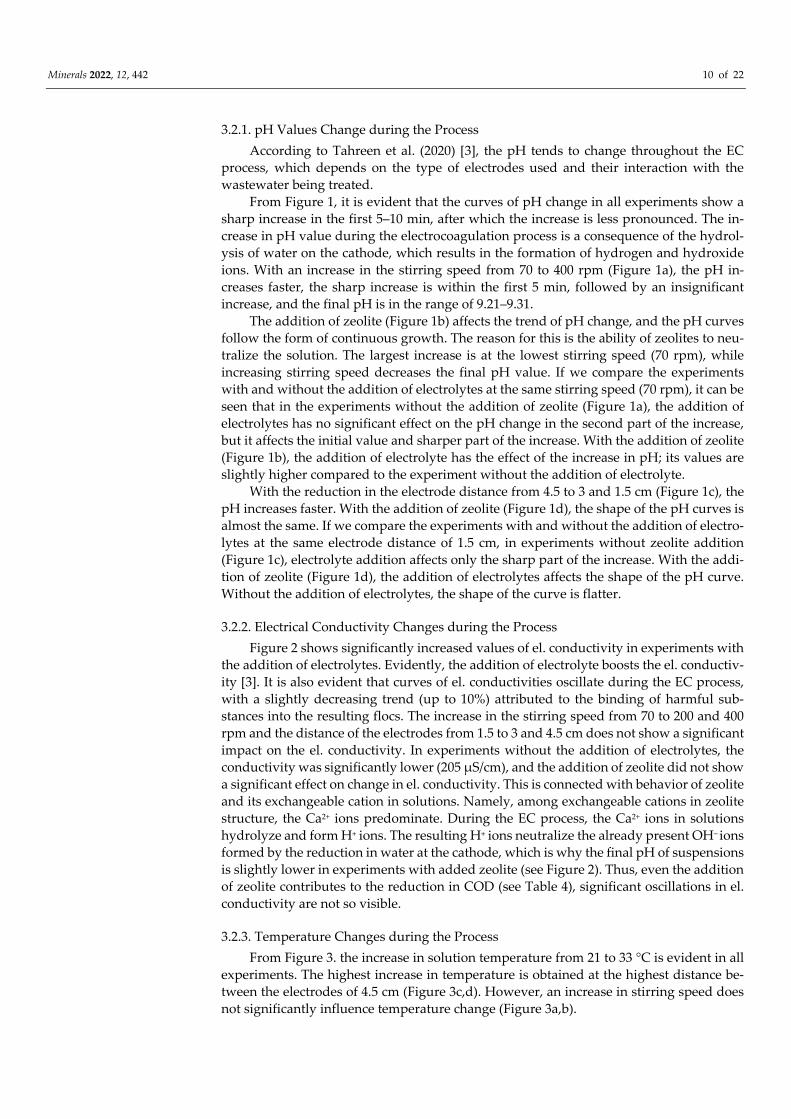
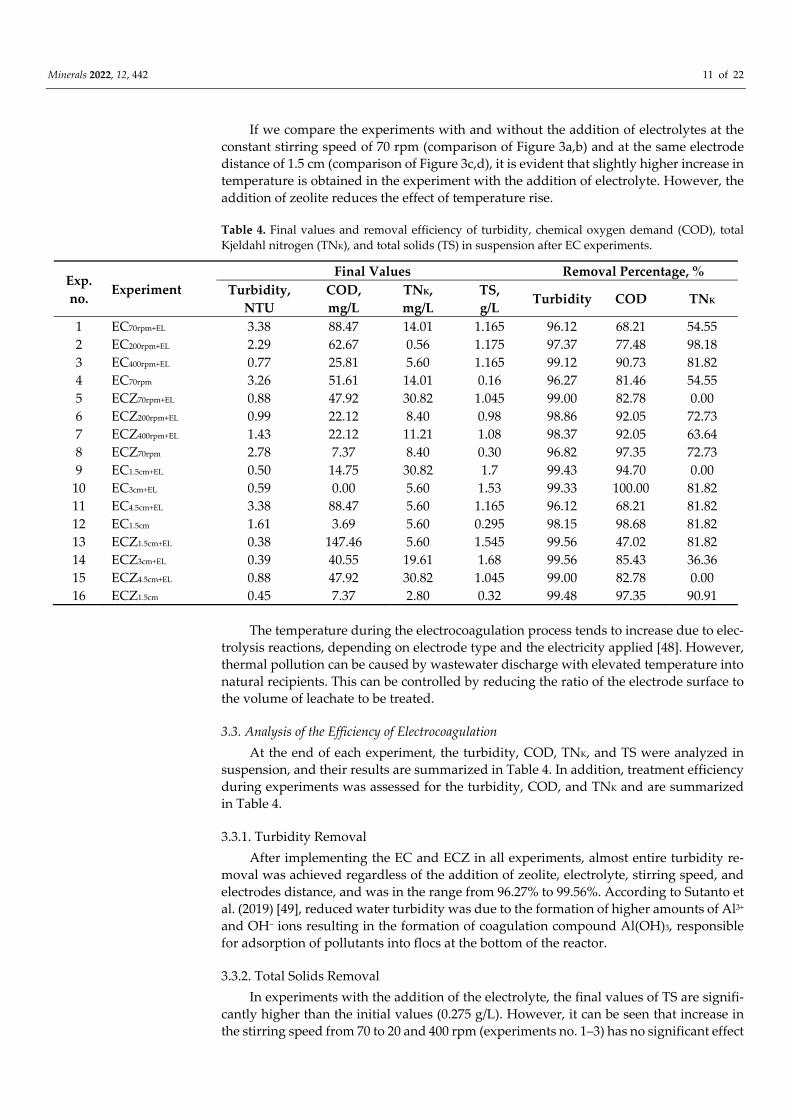
Figure 3. Change of temperature in solution during EC process at different: (a) stirring speed; (b) stirring speed with the addition of zeolite; (c) electrode distance; (d) electrode distance with addition of zeolite. Note: mark EL means the addition of electrolyte.
0
500
1000
1500
2000
2500
0 10 20 30 40 50
El. c
ondu
ctiv
ity, m
S/cm
t, min
EC 1.5 cm + ELEC 3 cm + ELEC 4.5 cm + ELEC 1.5 cm
c)
0
500
1000
1500
2000
2500
0 10 20 30 40 50
El. c
ondu
ctiv
ity, m
S/cm
t, min
ECZ 1.5 cm + ELECZ 3 cm + ELECZ 4.5 cm + ELECZ 1.5 cm
d)
0
5
10
15
20
25
30
35
0 10 20 30 40 50
Tem
pera
ture
, o C
t, min
EC 70 rpm + ELEC 200 rpm + ELEC 400 rpm + ELEC 70 rpm
a)
0
5
10
15
20
25
30
35
0 10 20 30 40 50
Tem
pera
ture
, o C
t, min
ECZ 70 rpm + ELECZ 200 rpm + ELECZ 400 rpm + ELECZ 70 rpm
b)
0
5
10
15
20
25
30
35
0 10 20 30 40 50
Tem
pera
ture
, o C
t, min
EC 1.5 cm + ELEC 3 cm + ELEC 4.5 cm + ELEC 1.5 cm
c)
0
5
10
15
20
25
30
35
0 10 20 30 40 50
Tem
pera
ture
, o C
t, min
ECZ 1.5 cm + ELECZ 3 cm + ELECZ 4.5 cm + ELECZ 1.5 cm
d)
Minerals 2022, 12, 442 10 of 22
3.2.1. pH Values Change during the Process According to Tahreen et al. (2020) [3], the pH tends to change throughout the EC
process, which depends on the type of electrodes used and their interaction with the wastewater being treated.
From Figure 1, it is evident that the curves of pH change in all experiments show a sharp increase in the first 5–10 min, after which the increase is less pronounced. The in-crease in pH value during the electrocoagulation process is a consequence of the hydrol-ysis of water on the cathode, which results in the formation of hydrogen and hydroxide ions. With an increase in the stirring speed from 70 to 400 rpm (Figure 1a), the pH in-creases faster, the sharp increase is within the first 5 min, followed by an insignificant increase, and the final pH is in the range of 9.21–9.31.
The addition of zeolite (Figure 1b) affects the trend of pH change, and the pH curves follow the form of continuous growth. The reason for this is the ability of zeolites to neu-tralize the solution. The largest increase is at the lowest stirring speed (70 rpm), while increasing stirring speed decreases the final pH value. If we compare the experiments with and without the addition of electrolytes at the same stirring speed (70 rpm), it can be seen that in the experiments without the addition of zeolite (Figure 1a), the addition of electrolytes has no significant effect on the pH change in the second part of the increase, but it affects the initial value and sharper part of the increase. With the addition of zeolite (Figure 1b), the addition of electrolyte has the effect of the increase in pH; its values are slightly higher compared to the experiment without the addition of electrolyte.
With the reduction in the electrode distance from 4.5 to 3 and 1.5 cm (Figure 1c), the pH increases faster. With the addition of zeolite (Figure 1d), the shape of the pH curves is almost the same. If we compare the experiments with and without the addition of electro-lytes at the same electrode distance of 1.5 cm, in experiments without zeolite addition (Figure 1c), electrolyte addition affects only the sharp part of the increase. With the addi-tion of zeolite (Figure 1d), the addition of electrolytes affects the shape of the pH curve. Without the addition of electrolytes, the shape of the curve is flatter.
3.2.2. Electrical Conductivity Changes during the Process Figure 2 shows significantly increased values of el. conductivity in experiments with
the addition of electrolytes. Evidently, the addition of electrolyte boosts the el. conductiv-ity [3]. It is also evident that curves of el. conductivities oscillate during the EC process, with a slightly decreasing trend (up to 10%) attributed to the binding of harmful sub-stances into the resulting flocs. The increase in the stirring speed from 70 to 200 and 400 rpm and the distance of the electrodes from 1.5 to 3 and 4.5 cm does not show a significant impact on the el. conductivity. In experiments without the addition of electrolytes, the conductivity was significantly lower (205 µS/cm), and the addition of zeolite did not show a significant effect on change in el. conductivity. This is connected with behavior of zeolite and its exchangeable cation in solutions. Namely, among exchangeable cations in zeolite structure, the Ca2+ ions predominate. During the EC process, the Ca2+ ions in solutions hydrolyze and form H+ ions. The resulting H+ ions neutralize the already present OH− ions formed by the reduction in water at the cathode, which is why the final pH of suspensions is slightly lower in experiments with added zeolite (see Figure 2). Thus, even the addition of zeolite contributes to the reduction in COD (see Table 4), significant oscillations in el. conductivity are not so visible.
3.2.3. Temperature Changes during the Process From Figure 3. the increase in solution temperature from 21 to 33 °C is evident in all
experiments. The highest increase in temperature is obtained at the highest distance be-tween the electrodes of 4.5 cm (Figure 3c,d). However, an increase in stirring speed does not significantly influence temperature change (Figure 3a,b).
Minerals 2022, 12, 442 11 of 22
If we compare the experiments with and without the addition of electrolytes at the constant stirring speed of 70 rpm (comparison of Figure 3a,b) and at the same electrode distance of 1.5 cm (comparison of Figure 3c,d), it is evident that slightly higher increase in temperature is obtained in the experiment with the addition of electrolyte. However, the addition of zeolite reduces the effect of temperature rise.
Table 4. Final values and removal efficiency of turbidity, chemical oxygen demand (COD), total Kjeldahl nitrogen (TNK), and total solids (TS) in suspension after EC experiments.
Exp. no. Experiment
Final Values Removal Percentage, % Turbidity,
NTU COD, mg/L
TNK,
mg/L TS, g/L
Turbidity COD TNK
1 EC70rpm+EL 3.38 88.47 14.01 1.165 96.12 68.21 54.55 2 EC200rpm+EL 2.29 62.67 0.56 1.175 97.37 77.48 98.18 3 EC400rpm+EL 0.77 25.81 5.60 1.165 99.12 90.73 81.82 4 EC70rpm 3.26 51.61 14.01 0.16 96.27 81.46 54.55 5 ECZ70rpm+EL 0.88 47.92 30.82 1.045 99.00 82.78 0.00 6 ECZ200rpm+EL 0.99 22.12 8.40 0.98 98.86 92.05 72.73 7 ECZ400rpm+EL 1.43 22.12 11.21 1.08 98.37 92.05 63.64 8 ECZ70rpm 2.78 7.37 8.40 0.30 96.82 97.35 72.73 9 EC1.5cm+EL 0.50 14.75 30.82 1.7 99.43 94.70 0.00
10 EC3cm+EL 0.59 0.00 5.60 1.53 99.33 100.00 81.82 11 EC4.5cm+EL 3.38 88.47 5.60 1.165 96.12 68.21 81.82 12 EC1.5cm 1.61 3.69 5.60 0.295 98.15 98.68 81.82 13 ECZ1.5cm+EL 0.38 147.46 5.60 1.545 99.56 47.02 81.82 14 ECZ3cm+EL 0.39 40.55 19.61 1.68 99.56 85.43 36.36 15 ECZ4.5cm+EL 0.88 47.92 30.82 1.045 99.00 82.78 0.00 16 ECZ1.5cm 0.45 7.37 2.80 0.32 99.48 97.35 90.91
The temperature during the electrocoagulation process tends to increase due to elec-trolysis reactions, depending on electrode type and the electricity applied [48]. However, thermal pollution can be caused by wastewater discharge with elevated temperature into natural recipients. This can be controlled by reducing the ratio of the electrode surface to the volume of leachate to be treated.
3.3. Analysis of the Efficiency of Electrocoagulation At the end of each experiment, the turbidity, COD, TNK, and TS were analyzed in
suspension, and their results are summarized in Table 4. In addition, treatment efficiency during experiments was assessed for the turbidity, COD, and TNK and are summarized in Table 4.
3.3.1. Turbidity Removal After implementing the EC and ECZ in all experiments, almost entire turbidity re-
moval was achieved regardless of the addition of zeolite, electrolyte, stirring speed, and electrodes distance, and was in the range from 96.27% to 99.56%. According to Sutanto et al. (2019) [49], reduced water turbidity was due to the formation of higher amounts of Al3+ and OH− ions resulting in the formation of coagulation compound Al(OH)3, responsible for adsorption of pollutants into flocs at the bottom of the reactor.
3.3.2. Total Solids Removal In experiments with the addition of the electrolyte, the final values of TS are signifi-
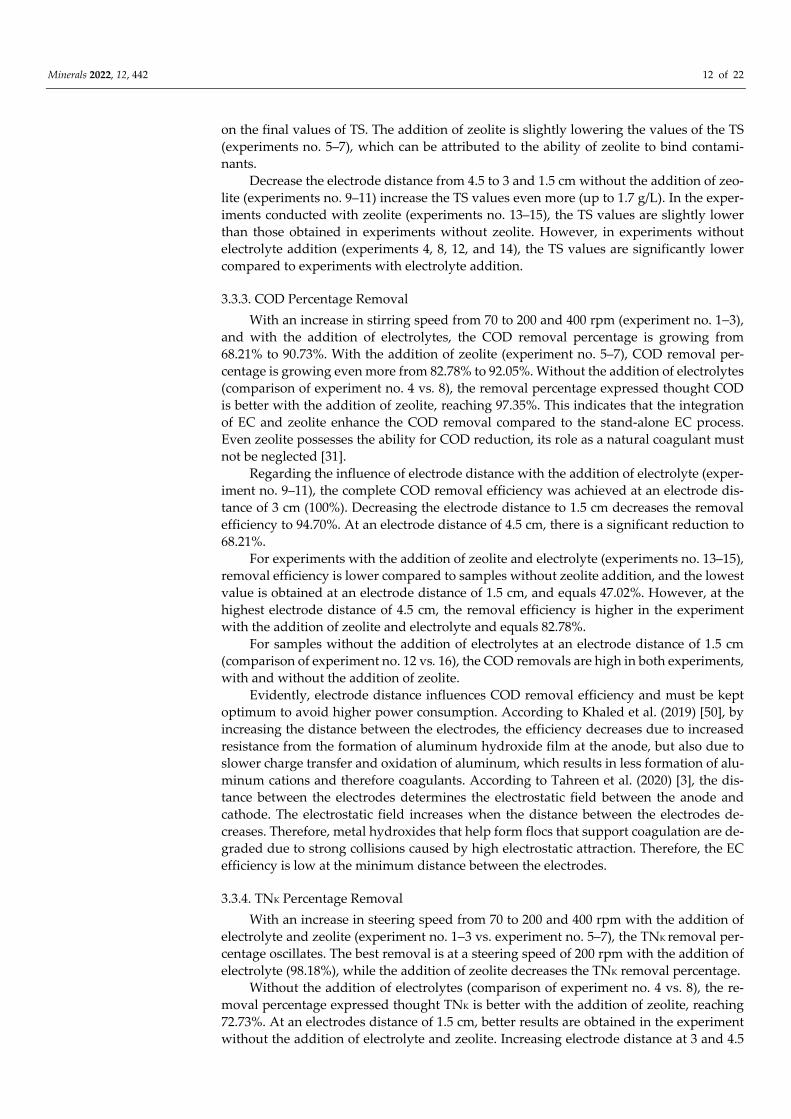
cantly higher than the initial values (0.275 g/L). However, it can be seen that increase in the stirring speed from 70 to 20 and 400 rpm (experiments no. 1–3) has no significant effect
Minerals 2022, 12, 442 12 of 22
on the final values of TS. The addition of zeolite is slightly lowering the values of the TS (experiments no. 5–7), which can be attributed to the ability of zeolite to bind contami-nants.
Decrease the electrode distance from 4.5 to 3 and 1.5 cm without the addition of zeo-lite (experiments no. 9–11) increase the TS values even more (up to 1.7 g/L). In the exper-iments conducted with zeolite (experiments no. 13–15), the TS values are slightly lower than those obtained in experiments without zeolite. However, in experiments without electrolyte addition (experiments 4, 8, 12, and 14), the TS values are significantly lower compared to experiments with electrolyte addition.
3.3.3. COD Percentage Removal With an increase in stirring speed from 70 to 200 and 400 rpm (experiment no. 1−3),
and with the addition of electrolytes, the COD removal percentage is growing from 68.21% to 90.73%. With the addition of zeolite (experiment no. 5–7), COD removal per-centage is growing even more from 82.78% to 92.05%. Without the addition of electrolytes (comparison of experiment no. 4 vs. 8), the removal percentage expressed thought COD is better with the addition of zeolite, reaching 97.35%. This indicates that the integration of EC and zeolite enhance the COD removal compared to the stand-alone EC process. Even zeolite possesses the ability for COD reduction, its role as a natural coagulant must not be neglected [31].
Regarding the influence of electrode distance with the addition of electrolyte (exper-iment no. 9–11), the complete COD removal efficiency was achieved at an electrode dis-tance of 3 cm (100%). Decreasing the electrode distance to 1.5 cm decreases the removal efficiency to 94.70%. At an electrode distance of 4.5 cm, there is a significant reduction to 68.21%.
For experiments with the addition of zeolite and electrolyte (experiments no. 13–15), removal efficiency is lower compared to samples without zeolite addition, and the lowest value is obtained at an electrode distance of 1.5 cm, and equals 47.02%. However, at the highest electrode distance of 4.5 cm, the removal efficiency is higher in the experiment with the addition of zeolite and electrolyte and equals 82.78%.
For samples without the addition of electrolytes at an electrode distance of 1.5 cm (comparison of experiment no. 12 vs. 16), the COD removals are high in both experiments, with and without the addition of zeolite.
Evidently, electrode distance influences COD removal efficiency and must be kept optimum to avoid higher power consumption. According to Khaled et al. (2019) [50], by increasing the distance between the electrodes, the efficiency decreases due to increased resistance from the formation of aluminum hydroxide film at the anode, but also due to slower charge transfer and oxidation of aluminum, which results in less formation of alu-minum cations and therefore coagulants. According to Tahreen et al. (2020) [3], the dis-tance between the electrodes determines the electrostatic field between the anode and cathode. The electrostatic field increases when the distance between the electrodes de-creases. Therefore, metal hydroxides that help form flocs that support coagulation are de-graded due to strong collisions caused by high electrostatic attraction. Therefore, the EC efficiency is low at the minimum distance between the electrodes.
3.3.4. TNK Percentage Removal With an increase in steering speed from 70 to 200 and 400 rpm with the addition of
electrolyte and zeolite (experiment no. 1−3 vs. experiment no. 5–7), the TNK removal per-centage oscillates. The best removal is at a steering speed of 200 rpm with the addition of electrolyte (98.18%), while the addition of zeolite decreases the TNK removal percentage.
Without the addition of electrolytes (comparison of experiment no. 4 vs. 8), the re-moval percentage expressed thought TNK is better with the addition of zeolite, reaching 72.73%. At an electrodes distance of 1.5 cm, better results are obtained in the experiment without the addition of electrolyte and zeolite. Increasing electrode distance at 3 and 4.5
Minerals 2022, 12, 442 13 of 22
cm, the addition of zeolite and electrolyte also compete with each other; thus, better results are obtained with the addition of electrolyte.
Results also indicated that at certain experimental conditions, none of TNK is re-moved, at the lowest steering speed of 70 rpm and highest electrode distance of 4.5 cm and addition of zeolite and electrolyte (experiments no. 5 and 15), and at the lowest elec-trode distance with addition of electrolyte (experiment no. 9).
Based on results given in Table 3, additions of zeolite, electrolyte, selected electrode distance, and steering speed have mutually opposite influences on decreasing turbidity, COD, and TNK, which is also connected with the mass of aluminum electrodes consumed during experiments.
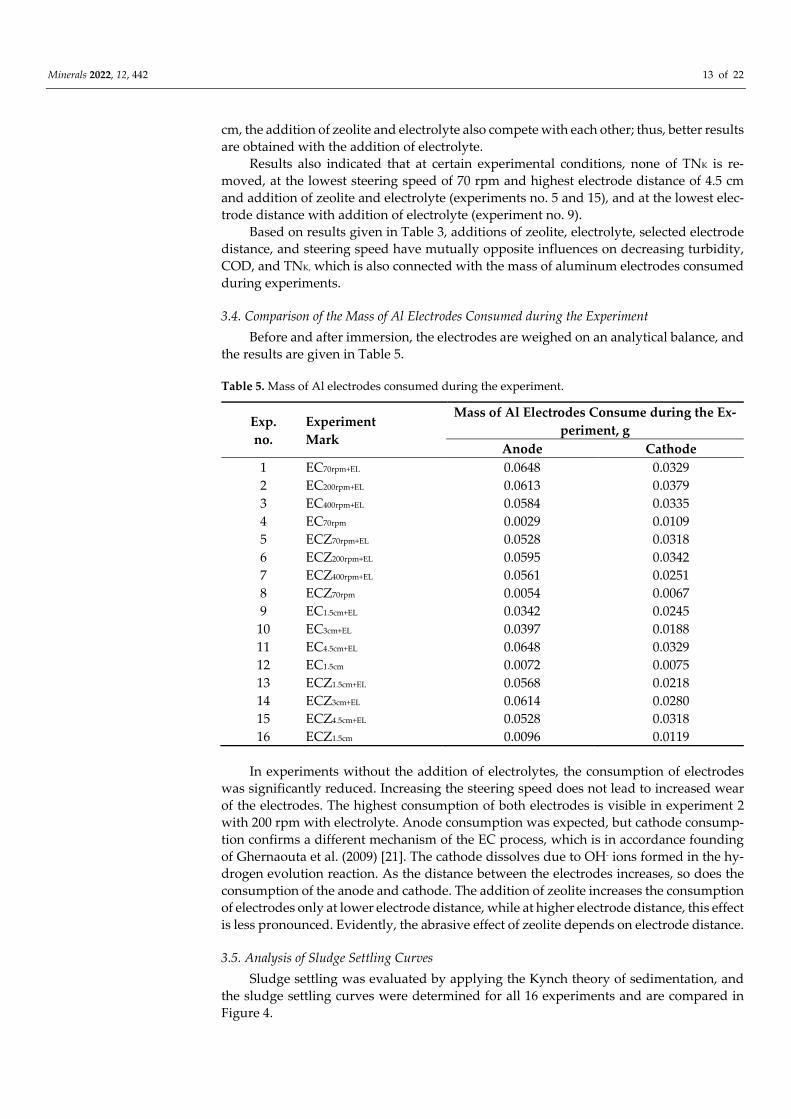
3.4. Comparison of the Mass of Al Electrodes Consumed during the Experiment Before and after immersion, the electrodes are weighed on an analytical balance, and
the results are given in Table 5.
Table 5. Mass of Al electrodes consumed during the experiment.
Exp. no.
Experiment Mark
Mass of Al Electrodes Consume during the Ex-periment, g
Anode Cathode 1 EC70rpm+EL 0.0648 0.0329 2 EC200rpm+EL 0.0613 0.0379 3 EC400rpm+EL 0.0584 0.0335 4 EC70rpm 0.0029 0.0109 5 ECZ70rpm+EL 0.0528 0.0318 6 ECZ200rpm+EL 0.0595 0.0342 7 ECZ400rpm+EL 0.0561 0.0251 8 ECZ70rpm 0.0054 0.0067 9 EC1.5cm+EL 0.0342 0.0245
10 EC3cm+EL 0.0397 0.0188 11 EC4.5cm+EL 0.0648 0.0329 12 EC1.5cm 0.0072 0.0075 13 ECZ1.5cm+EL 0.0568 0.0218 14 ECZ3cm+EL 0.0614 0.0280 15 ECZ4.5cm+EL 0.0528 0.0318 16 ECZ1.5cm 0.0096 0.0119
In experiments without the addition of electrolytes, the consumption of electrodes was significantly reduced. Increasing the steering speed does not lead to increased wear of the electrodes. The highest consumption of both electrodes is visible in experiment 2 with 200 rpm with electrolyte. Anode consumption was expected, but cathode consump-tion confirms a different mechanism of the EC process, which is in accordance founding of Ghernaouta et al. (2009) [21]. The cathode dissolves due to OH- ions formed in the hy-drogen evolution reaction. As the distance between the electrodes increases, so does the consumption of the anode and cathode. The addition of zeolite increases the consumption of electrodes only at lower electrode distance, while at higher electrode distance, this effect is less pronounced. Evidently, the abrasive effect of zeolite depends on electrode distance.
3.5. Analysis of Sludge Settling Curves Sludge settling was evaluated by applying the Kynch theory of sedimentation, and
the sludge settling curves were determined for all 16 experiments and are compared in Figure 4.
Minerals 2022, 12, 442 14 of 22
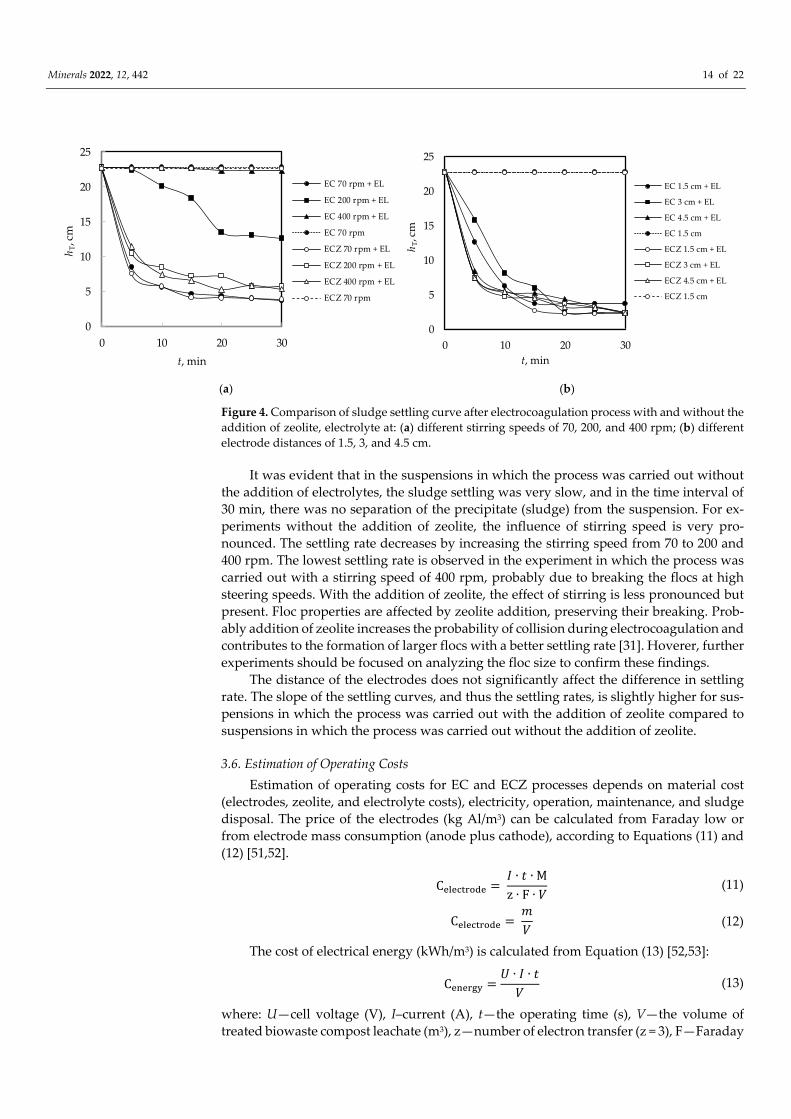
(a) (b)
Figure 4. Comparison of sludge settling curve after electrocoagulation process with and without the addition of zeolite, electrolyte at: (a) different stirring speeds of 70, 200, and 400 rpm; (b) different electrode distances of 1.5, 3, and 4.5 cm.
It was evident that in the suspensions in which the process was carried out without the addition of electrolytes, the sludge settling was very slow, and in the time interval of 30 min, there was no separation of the precipitate (sludge) from the suspension. For ex-periments without the addition of zeolite, the influence of stirring speed is very pro-nounced. The settling rate decreases by increasing the stirring speed from 70 to 200 and 400 rpm. The lowest settling rate is observed in the experiment in which the process was carried out with a stirring speed of 400 rpm, probably due to breaking the flocs at high steering speeds. With the addition of zeolite, the effect of stirring is less pronounced but present. Floc properties are affected by zeolite addition, preserving their breaking. Prob-ably addition of zeolite increases the probability of collision during electrocoagulation and contributes to the formation of larger flocs with a better settling rate [31]. Hoverer, further experiments should be focused on analyzing the floc size to confirm these findings.
The distance of the electrodes does not significantly affect the difference in settling rate. The slope of the settling curves, and thus the settling rates, is slightly higher for sus-pensions in which the process was carried out with the addition of zeolite compared to suspensions in which the process was carried out without the addition of zeolite.
3.6. Estimation of Operating Costs Estimation of operating costs for EC and ECZ processes depends on material cost
(electrodes, zeolite, and electrolyte costs), electricity, operation, maintenance, and sludge disposal. The price of the electrodes (kg Al/m3) can be calculated from Faraday low or from electrode mass consumption (anode plus cathode), according to Equations (11) and (12) [51,52]. C = 𝐼 ∙ 𝑡 ∙ Mz ∙ F ∙ 𝑉 (11)C = 𝑚𝑉 (12)
The cost of electrical energy (kWh/m3) is calculated from Equation (13) [52,53]: C = 𝑈 ∙ 𝐼 ∙ 𝑡𝑉 (13)
where: U—cell voltage (V), I–current (A), t—the operating time (s), V—the volume of treated biowaste compost leachate (m3), z—number of electron transfer (z = 3), F—Faraday
0
5
10
15
20
25
0 10 20 30
h T, c
m
t, min
EC 70 rpm + EL
EC 200 rpm + EL
EC 400 rpm + EL
EC 70 rpm
ECZ 70 rpm + EL
ECZ 200 rpm + EL
ECZ 400 rpm + EL
ECZ 70 rpm
0
5
10
15
20
25
0 10 20 30
h T, c
m
t, min
EC 1.5 cm + EL
EC 3 cm + EL
EC 4.5 cm + EL
EC 1.5 cm
ECZ 1.5 cm + EL
ECZ 3 cm + EL
ECZ 4.5 cm + EL
ECZ 1.5 cm
Minerals 2022, 12, 442 15 of 22
constant (96 485.33 C/mol), M—molecular mass of aluminum (26.98 g/mol), m—the mass of consumed electrode (anode and cathode), g.
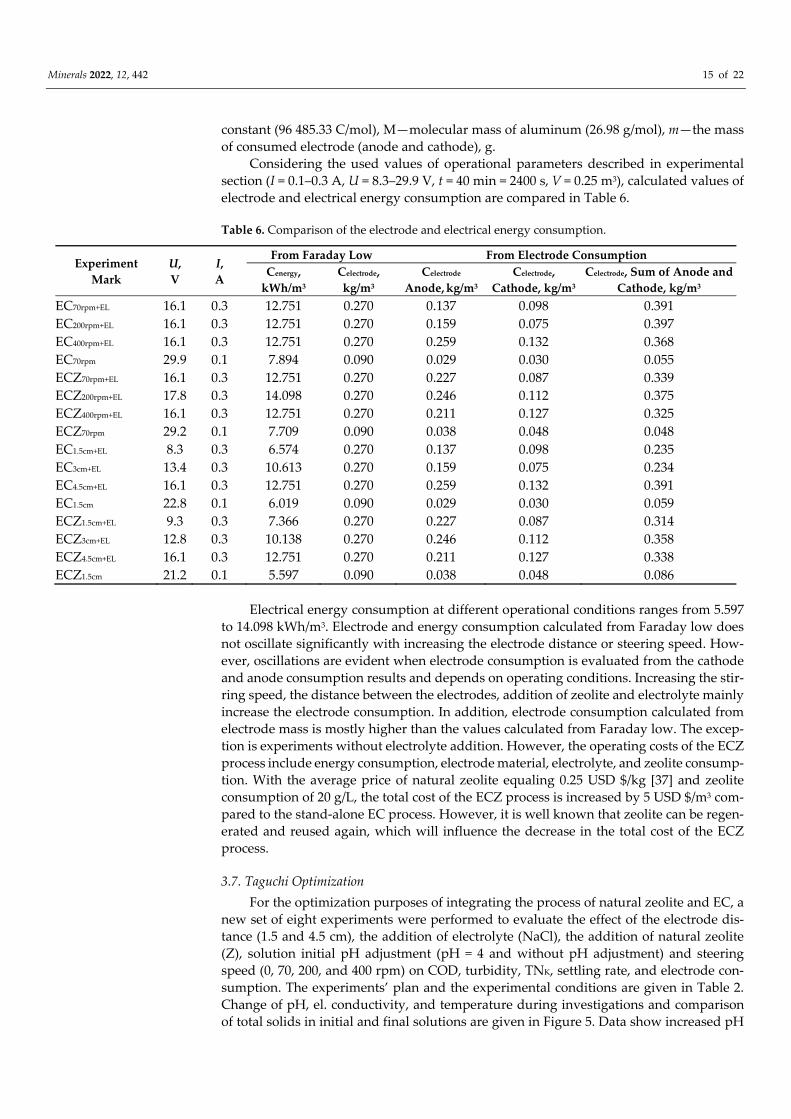
Considering the used values of operational parameters described in experimental section (I = 0.1–0.3 A, U = 8.3–29.9 V, t = 40 min = 2400 s, V = 0.25 m3), calculated values of electrode and electrical energy consumption are compared in Table 6.
Table 6. Comparison of the electrode and electrical energy consumption.
Experiment Mark
U, V
I, A
From Faraday Low From Electrode Consumption Cenergy,
kWh/m3 Celectrode,
kg/m3 Celectrode
Anode, kg/m3 Celectrode,
Cathode, kg/m3 Celectrode, Sum of Anode and
Cathode, kg/m3 EC70rpm+EL 16.1 0.3 12.751 0.270 0.137 0.098 0.391 EC200rpm+EL 16.1 0.3 12.751 0.270 0.159 0.075 0.397 EC400rpm+EL 16.1 0.3 12.751 0.270 0.259 0.132 0.368 EC70rpm 29.9 0.1 7.894 0.090 0.029 0.030 0.055 ECZ70rpm+EL 16.1 0.3 12.751 0.270 0.227 0.087 0.339 ECZ200rpm+EL 17.8 0.3 14.098 0.270 0.246 0.112 0.375 ECZ400rpm+EL 16.1 0.3 12.751 0.270 0.211 0.127 0.325 ECZ70rpm 29.2 0.1 7.709 0.090 0.038 0.048 0.048 EC1.5cm+EL 8.3 0.3 6.574 0.270 0.137 0.098 0.235 EC3cm+EL 13.4 0.3 10.613 0.270 0.159 0.075 0.234 EC4.5cm+EL 16.1 0.3 12.751 0.270 0.259 0.132 0.391 EC1.5cm 22.8 0.1 6.019 0.090 0.029 0.030 0.059 ECZ1.5cm+EL 9.3 0.3 7.366 0.270 0.227 0.087 0.314 ECZ3cm+EL 12.8 0.3 10.138 0.270 0.246 0.112 0.358 ECZ4.5cm+EL 16.1 0.3 12.751 0.270 0.211 0.127 0.338 ECZ1.5cm 21.2 0.1 5.597 0.090 0.038 0.048 0.086
Electrical energy consumption at different operational conditions ranges from 5.597 to 14.098 kWh/m3. Electrode and energy consumption calculated from Faraday low does not oscillate significantly with increasing the electrode distance or steering speed. How-ever, oscillations are evident when electrode consumption is evaluated from the cathode and anode consumption results and depends on operating conditions. Increasing the stir-ring speed, the distance between the electrodes, addition of zeolite and electrolyte mainly increase the electrode consumption. In addition, electrode consumption calculated from electrode mass is mostly higher than the values calculated from Faraday low. The excep-tion is experiments without electrolyte addition. However, the operating costs of the ECZ process include energy consumption, electrode material, electrolyte, and zeolite consump-tion. With the average price of natural zeolite equaling 0.25 USD $/kg [37] and zeolite consumption of 20 g/L, the total cost of the ECZ process is increased by 5 USD $/m3 com-pared to the stand-alone EC process. However, it is well known that zeolite can be regen-erated and reused again, which will influence the decrease in the total cost of the ECZ process.
3.7. Taguchi Optimization For the optimization purposes of integrating the process of natural zeolite and EC, a
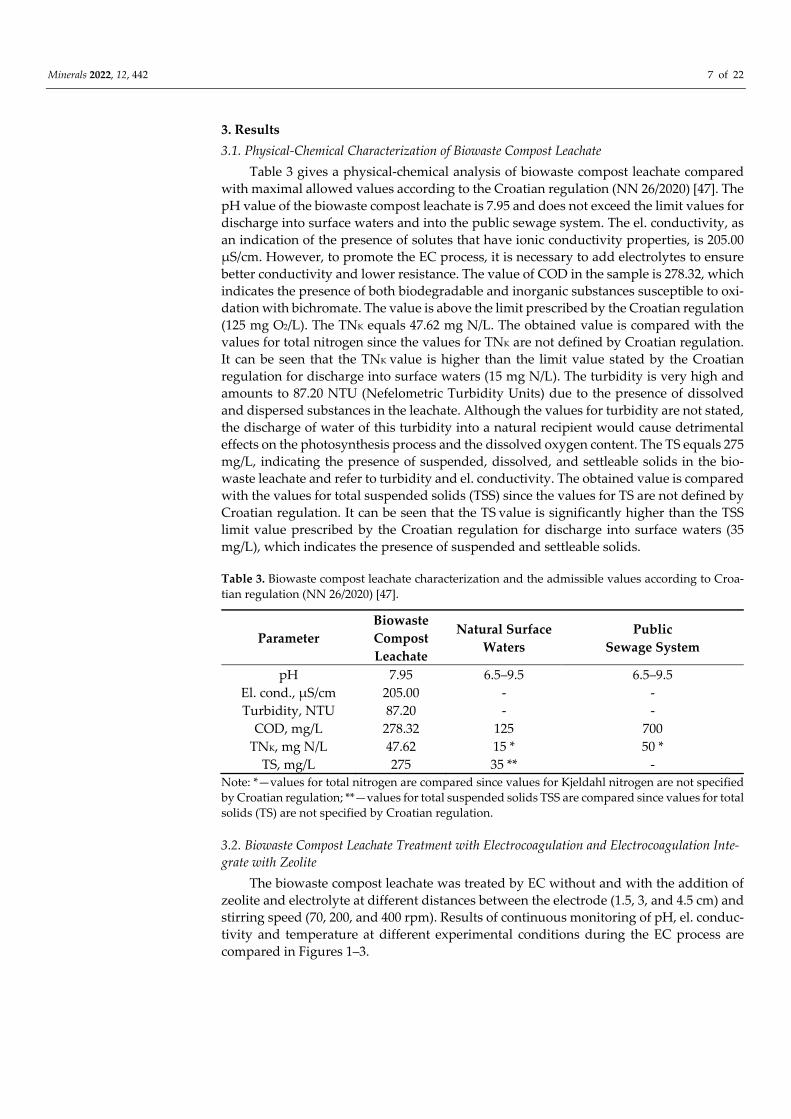
new set of eight experiments were performed to evaluate the effect of the electrode dis-tance (1.5 and 4.5 cm), the addition of electrolyte (NaCl), the addition of natural zeolite (Z), solution initial pH adjustment (pH = 4 and without pH adjustment) and steering speed (0, 70, 200, and 400 rpm) on COD, turbidity, TNK, settling rate, and electrode con-sumption. The experiments’ plan and the experimental conditions are given in Table 2. Change of pH, el. conductivity, and temperature during investigations and comparison of total solids in initial and final solutions are given in Figure 5. Data show increased pH
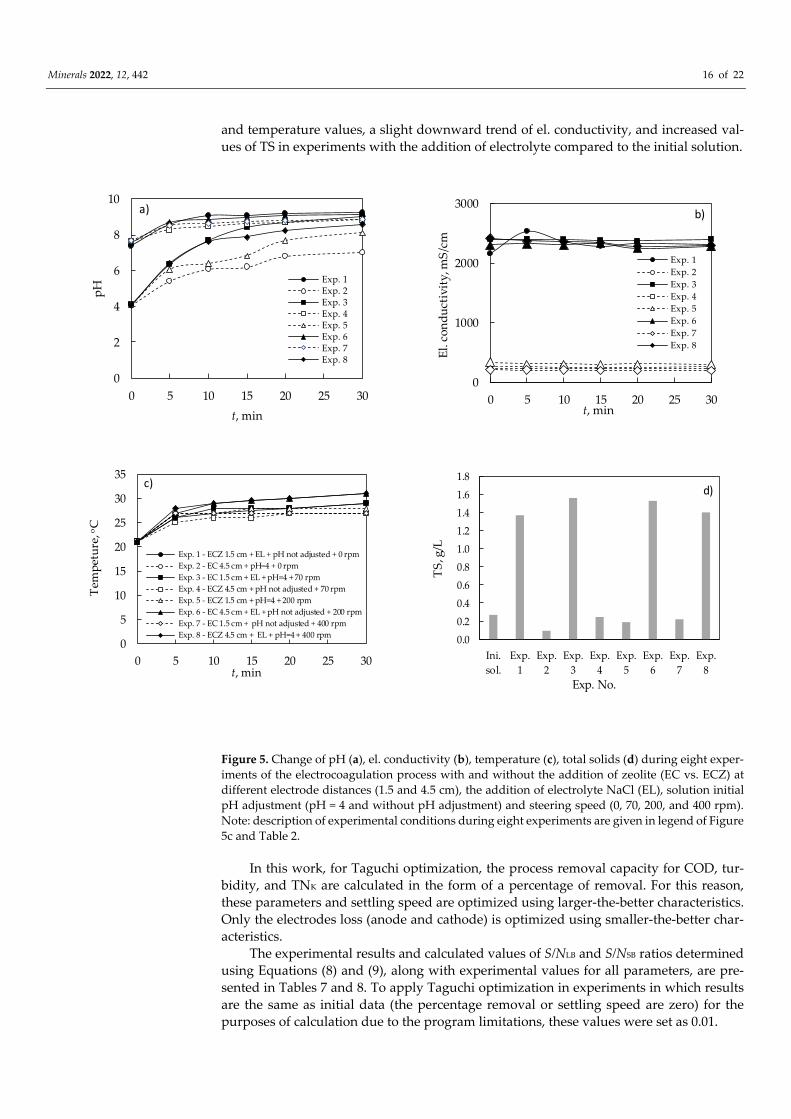
Minerals 2022, 12, 442 16 of 22
and temperature values, a slight downward trend of el. conductivity, and increased val-ues of TS in experiments with the addition of electrolyte compared to the initial solution.
Figure 5. Change of pH (a), el. conductivity (b), temperature (c), total solids (d) during eight exper-iments of the electrocoagulation process with and without the addition of zeolite (EC vs. ECZ) at different electrode distances (1.5 and 4.5 cm), the addition of electrolyte NaCl (EL), solution initial pH adjustment (pH = 4 and without pH adjustment) and steering speed (0, 70, 200, and 400 rpm). Note: description of experimental conditions during eight experiments are given in legend of Figure 5c and Table 2.
In this work, for Taguchi optimization, the process removal capacity for COD, tur-bidity, and TNK are calculated in the form of a percentage of removal. For this reason, these parameters and settling speed are optimized using larger-the-better characteristics. Only the electrodes loss (anode and cathode) is optimized using smaller-the-better char-acteristics.
The experimental results and calculated values of S/NLB and S/NSB ratios determined using Equations (8) and (9), along with experimental values for all parameters, are pre-sented in Tables 7 and 8. To apply Taguchi optimization in experiments in which results are the same as initial data (the percentage removal or settling speed are zero) for the purposes of calculation due to the program limitations, these values were set as 0.01.
0
2
4
6
8
10
0 5 10 15 20 25 30
pH
t, min
Exp. 1Exp. 2Exp. 3Exp. 4Exp. 5Exp. 6Exp. 7Exp. 8
a)
0
1000
2000
3000
0 5 10 15 20 25 30
El. c
ondu
ctiv
ity, m
S/cm
t, min
Exp. 1Exp. 2Exp. 3Exp. 4Exp. 5Exp. 6Exp. 7Exp. 8
b)
0
5
10
15
20
25
30
35
0 5 10 15 20 25 30
Exp. 1 - ECZ 1.5 cm + EL + pH not adjusted + 0 rpmExp. 2 - EC 4.5 cm + pH=4 + 0 rpmExp. 3 - EC 1.5 cm + EL + pH=4 + 70 rpmExp. 4 - ECZ 4.5 cm + pH not adjusted + 70 rpmExp. 5 - ECZ 1.5 cm + pH=4 + 200 rpmExp. 6 - EC 4.5 cm + EL + pH not adjusted + 200 rpmExp. 7 - EC 1.5 cm + pH not adjusted + 400 rpmExp. 8 - ECZ 4.5 cm + EL + pH=4 + 400 rpm
t, min
Tem
petu
re,o C
c)
0.00.20.4
0.60.81.01.21.41.6
1.8
Ini.sol.
Exp.1
Exp.2
Exp.3
Exp.4
Exp.5
Exp.6
Exp.7
Exp.8
TS,
g/L
Exp. No.
d)
Minerals 2022, 12, 442 17 of 22
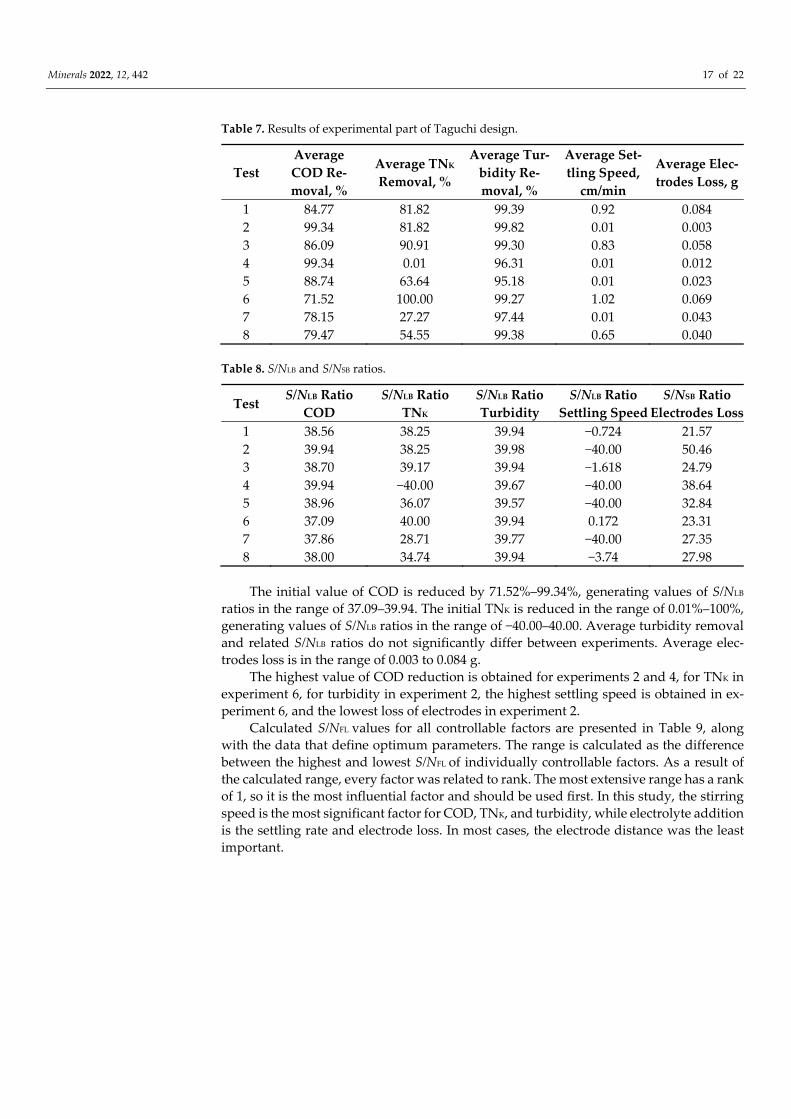
Table 7. Results of experimental part of Taguchi design.
Test Average COD Re-moval, %
Average TNK Removal, %
Average Tur-bidity Re-moval, %
Average Set-tling Speed,
cm/min
Average Elec-trodes Loss, g
1 84.77 81.82 99.39 0.92 0.084 2 99.34 81.82 99.82 0.01 0.003 3 86.09 90.91 99.30 0.83 0.058 4 99.34 0.01 96.31 0.01 0.012 5 88.74 63.64 95.18 0.01 0.023 6 71.52 100.00 99.27 1.02 0.069 7 78.15 27.27 97.44 0.01 0.043 8 79.47 54.55 99.38 0.65 0.040
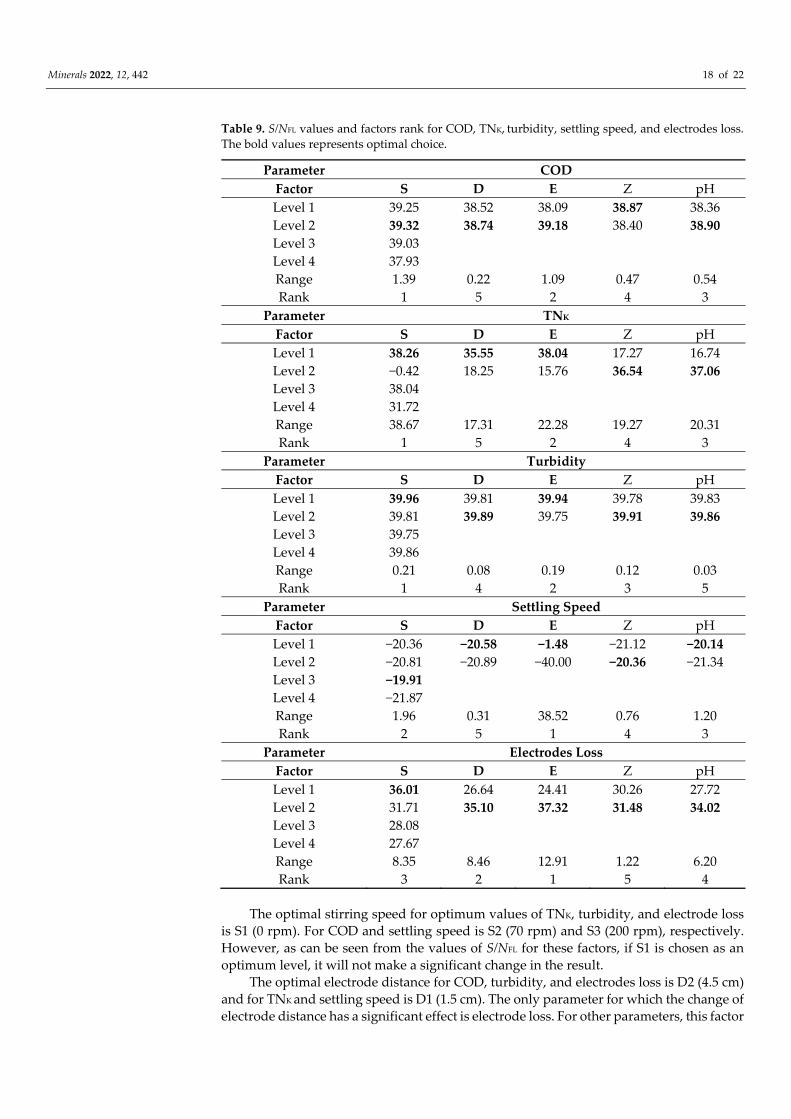
Table 8. S/NLB and S/NSB ratios.
Test S/NLB Ratio COD
S/NLB Ratio TNK
S/NLB Ratio Turbidity
S/NLB Ratio Settling Speed
S/NSB Ratio Electrodes Loss
1 38.56 38.25 39.94 −0.724 21.57 2 39.94 38.25 39.98 −40.00 50.46 3 38.70 39.17 39.94 −1.618 24.79 4 39.94 −40.00 39.67 −40.00 38.64 5 38.96 36.07 39.57 −40.00 32.84 6 37.09 40.00 39.94 0.172 23.31 7 37.86 28.71 39.77 −40.00 27.35 8 38.00 34.74 39.94 −3.74 27.98
The initial value of COD is reduced by 71.52%–99.34%, generating values of S/NLB ratios in the range of 37.09–39.94. The initial TNK is reduced in the range of 0.01%–100%, generating values of S/NLB ratios in the range of −40.00–40.00. Average turbidity removal and related S/NLB ratios do not significantly differ between experiments. Average elec-trodes loss is in the range of 0.003 to 0.084 g.
The highest value of COD reduction is obtained for experiments 2 and 4, for TNK in experiment 6, for turbidity in experiment 2, the highest settling speed is obtained in ex-periment 6, and the lowest loss of electrodes in experiment 2.
Calculated S/NFL values for all controllable factors are presented in Table 9, along with the data that define optimum parameters. The range is calculated as the difference between the highest and lowest S/NFL of individually controllable factors. As a result of the calculated range, every factor was related to rank. The most extensive range has a rank of 1, so it is the most influential factor and should be used first. In this study, the stirring speed is the most significant factor for COD, TNK, and turbidity, while electrolyte addition is the settling rate and electrode loss. In most cases, the electrode distance was the least important.
Minerals 2022, 12, 442 18 of 22
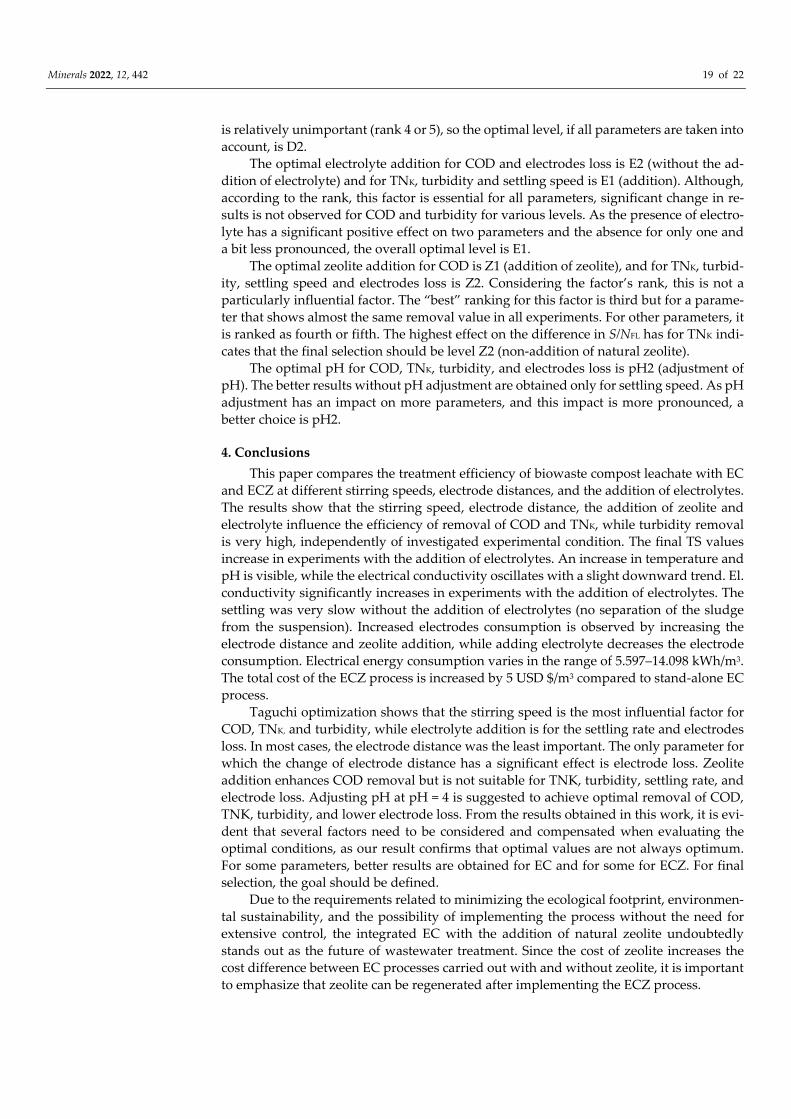
Table 9. S/NFL values and factors rank for COD, TNK, turbidity, settling speed, and electrodes loss. The bold values represents optimal choice.
Parameter COD Factor S D E Z pH Level 1 39.25 38.52 38.09 38.87 38.36 Level 2 39.32 38.74 39.18 38.40 38.90 Level 3 39.03 Level 4 37.93 Range 1.39 0.22 1.09 0.47 0.54 Rank 1 5 2 4 3
Parameter TNK Factor S D E Z pH Level 1 38.26 35.55 38.04 17.27 16.74 Level 2 −0.42 18.25 15.76 36.54 37.06 Level 3 38.04 Level 4 31.72 Range 38.67 17.31 22.28 19.27 20.31 Rank 1 5 2 4 3
Parameter Turbidity Factor S D E Z pH Level 1 39.96 39.81 39.94 39.78 39.83 Level 2 39.81 39.89 39.75 39.91 39.86 Level 3 39.75 Level 4 39.86 Range 0.21 0.08 0.19 0.12 0.03 Rank 1 4 2 3 5
Parameter Settling Speed Factor S D E Z pH Level 1 −20.36 −20.58 −1.48 −21.12 −20.14 Level 2 −20.81 −20.89 −40.00 −20.36 −21.34 Level 3 −19.91 Level 4 −21.87 Range 1.96 0.31 38.52 0.76 1.20 Rank 2 5 1 4 3
Parameter Electrodes Loss Factor S D E Z pH Level 1 36.01 26.64 24.41 30.26 27.72 Level 2 31.71 35.10 37.32 31.48 34.02 Level 3 28.08 Level 4 27.67 Range 8.35 8.46 12.91 1.22 6.20 Rank 3 2 1 5 4
The optimal stirring speed for optimum values of TNK, turbidity, and electrode loss is S1 (0 rpm). For COD and settling speed is S2 (70 rpm) and S3 (200 rpm), respectively. However, as can be seen from the values of S/NFL for these factors, if S1 is chosen as an optimum level, it will not make a significant change in the result.
The optimal electrode distance for COD, turbidity, and electrodes loss is D2 (4.5 cm) and for TNK and settling speed is D1 (1.5 cm). The only parameter for which the change of electrode distance has a significant effect is electrode loss. For other parameters, this factor
Minerals 2022, 12, 442 19 of 22
is relatively unimportant (rank 4 or 5), so the optimal level, if all parameters are taken into account, is D2.
The optimal electrolyte addition for COD and electrodes loss is E2 (without the ad-dition of electrolyte) and for TNK, turbidity and settling speed is E1 (addition). Although, according to the rank, this factor is essential for all parameters, significant change in re-sults is not observed for COD and turbidity for various levels. As the presence of electro-lyte has a significant positive effect on two parameters and the absence for only one and a bit less pronounced, the overall optimal level is E1.
The optimal zeolite addition for COD is Z1 (addition of zeolite), and for TNK, turbid-ity, settling speed and electrodes loss is Z2. Considering the factor’s rank, this is not a particularly influential factor. The “best” ranking for this factor is third but for a parame-ter that shows almost the same removal value in all experiments. For other parameters, it is ranked as fourth or fifth. The highest effect on the difference in S/NFL has for TNK indi-cates that the final selection should be level Z2 (non-addition of natural zeolite).
The optimal pH for COD, TNK, turbidity, and electrodes loss is pH2 (adjustment of pH). The better results without pH adjustment are obtained only for settling speed. As pH adjustment has an impact on more parameters, and this impact is more pronounced, a better choice is pH2.
4. Conclusions This paper compares the treatment efficiency of biowaste compost leachate with EC
and ECZ at different stirring speeds, electrode distances, and the addition of electrolytes. The results show that the stirring speed, electrode distance, the addition of zeolite and electrolyte influence the efficiency of removal of COD and TNK, while turbidity removal is very high, independently of investigated experimental condition. The final TS values increase in experiments with the addition of electrolytes. An increase in temperature and pH is visible, while the electrical conductivity oscillates with a slight downward trend. El. conductivity significantly increases in experiments with the addition of electrolytes. The settling was very slow without the addition of electrolytes (no separation of the sludge from the suspension). Increased electrodes consumption is observed by increasing the electrode distance and zeolite addition, while adding electrolyte decreases the electrode consumption. Electrical energy consumption varies in the range of 5.597–14.098 kWh/m3. The total cost of the ECZ process is increased by 5 USD $/m3 compared to stand-alone EC process.
Taguchi optimization shows that the stirring speed is the most influential factor for COD, TNK, and turbidity, while electrolyte addition is for the settling rate and electrodes loss. In most cases, the electrode distance was the least important. The only parameter for which the change of electrode distance has a significant effect is electrode loss. Zeolite addition enhances COD removal but is not suitable for TNK, turbidity, settling rate, and electrode loss. Adjusting pH at pH = 4 is suggested to achieve optimal removal of COD, TNK, turbidity, and lower electrode loss. From the results obtained in this work, it is evi-dent that several factors need to be considered and compensated when evaluating the optimal conditions, as our result confirms that optimal values are not always optimum. For some parameters, better results are obtained for EC and for some for ECZ. For final selection, the goal should be defined.
Due to the requirements related to minimizing the ecological footprint, environmen-tal sustainability, and the possibility of implementing the process without the need for extensive control, the integrated EC with the addition of natural zeolite undoubtedly stands out as the future of wastewater treatment. Since the cost of zeolite increases the cost difference between EC processes carried out with and without zeolite, it is important to emphasize that zeolite can be regenerated after implementing the ECZ process.
Minerals 2022, 12, 442 20 of 22
Author Contributions: N.V.M. and L.V.: Formal analysis, Conceptualization, Methodology, Vali-dation, Writing—original draft, Supervision, Writing—review and editing. S.S.: Conceptualization, Writing—original draft, Methodology; Modeling, Supervision, Writing—review and editing. A.B.: Conceptualization, Formal analysis, Investigation, Writing—review and editing. All authors have read and agreed to the published version of the manuscript.
Funding: The results in this paper are funded by institution funds of the three Department at Fac-ulty of Chemistry and Technology, University of Split, Croatia (Department of Environmental En-gineering, Department of Electrochemistry and Materials Protection, and Department of Chemical Engineering), and by project “Development of a new hybrid process for wastewater treatment based on electrocoagulation and natural zeolite” partially supported by HAZU Foundation (Foundation of the Croatian Academy of Sciences and Arts).
Data Availability Statement: The data presented in this study will be available on request from the corresponding author.
Acknowledgments: We would like to thank to HAZU Foundation (Foundation of the Croatian Academy of Sciences and Arts) for financing the project “Development of a new hybrid process for wastewater treatment based on electrocoagulation and natural zeolite” under which these investi-gations are partially funded.
Conflicts of Interest: The authors declare no conflict of interest.
References 1. Roy, D.; Azaïs, A.; Benkaraache, S.; Drogui, P.; Tyagi, R.D. Composting leachate: Characterization, treatment and future per-
spectives. Rev. Environ. Sci. Biotechnol. 2018, 17, 323–349. https://doi.org/10.1007/s11157-018-9462-5. 2. Al-Qodah, Z.; Tawalbeh, M.; Al-Shannag, M.; Al-Anber, Z.; Bani-Melheme, K. Combined electrocoagulation processes as a
novel approach for enhanced pollutants removal: A state-of-the-art review. Sci. Total Environ. 2020, 744, 140806. https://doi.org/10.1016/j.scitotenv.2020.140806.
3. Tahreen, A.; Jami, M.S.; Ali, F. Role of electrocoagulation in wastewater treatment: A developmental review. J. Water Process Eng. 2020, 37, 101440. https://doi.org/10.1016/j.jwpe.2020.101440.
4. Ziouvelou, A.; Tekerelekopoulou, A.G.; Vayenas, D.V. A hybrid system for groundwater denitrification using electrocoagula-tion and adsorption. J. Environ. Manag. 2019, 249, 109355. https://doi.org/10.1016/j.jenvman.2019.109355.
5. Linares-Hernández, I.; Barrera-Díaz, C.; Roa-Morales, G.; Bilyeu, B.; Ureña-Núñez, F. A combined electrocoagulation–sorption process applied to mixed industrial wastewater. J. Hazard. Mater. 2007, 144, 240–248. https://doi.org/10.1016/j.jhaz-mat.2006.10.015.
6. Narayanan, N.V.; Ganesan, M. Use of adsorption using granular activated carbon (GAC) for the enhancement of removal of chromium from synthetic wastewater by electrocoagulation. J. Hazard. Mater. 2009, 161, 575–580. https://doi.org/10.1016/j.jhaz-mat.2008.03.113.
7. Chang, S.-H.; Wang, K.-S.; Liang, H.-H.; Chen, H.-Y.; Li, H.-C.; Peng, T.-H.; Su, Y.-C.; Chang, C.-Y.: Treatment of Reactive Black 5 by combined electrocoagulation– granular activated carbon adsorption–microwave regeneration process. J. Hazard. Mater. 2010, 175, 850–857. https://doi.org/10.1016/j.jhazmat.2009.10.088.
8. Ouaissa, Y.A.; Chabani, M.; Amrane, A.; Bensmaili, A. Integration of electro coagulation and adsorption for the treatment of tannery wastewater—The case of an Algerian factory, Rouiba. Procedia Eng. 2012, 33, 98–101. https://doi.org/10.1016/j.pro-eng.2012.01.1181.
9. Elabbas, S.; Adjeroud, N.; Mandi, L.; Berrekhis, F.; Pons, M.N.; Leclerc, J.P.; Ouazzani, N. Eggshell adsorption process coupled with electrocoagulation for improvement of chromium removal from tanning wastewater. Int. J. Environ. Anal. Chem. 2020, 1–13. https://doi.org/10.1080/03067319.2020.1761963.
10. Jeon, S.-B.; Kim, S.; Park, S.-J.; Seol, M.L.; Kim, D.; Chang, Y.K.; Choi, Y.K. Self-powered electro-coagulation system driven by wind energy harvesting triboelectric nanogenerator for decentralized water treatment. Nano Energy 2016, 28, 288–295. https://doi.org/10.1016/j.nanoen.2016.08.051.
11. Nawarkar, C.J.; Salkar, D.V.D. Solar powered electrocoagulation: A review. Int. J. Recent Res. Asp. 2017, 4, 365–368. 12. Kumar, A.; Pan, S.-Y. Opportunities and challenges of electrochemical water treatment integrated with renewable energy at the
water-energy nexus. Water-Energy Nexus 2020, 3, 110–116. https://doi.org/10.1016/j.wen.2020.03.006. 13. Ganiyu, S.O.; Martinez-Huitle, C.A.; Rodrigo, M.A. Renewable energies driven electrochemical wastewater/soil decontamina-
tion technologies: A critical review of fundamental concepts and applications. Appl. Catal. B Environ. 2020, 270, 118857. https://doi.org/10.1016/j.apcatb.2020.118857.
14. Sahu, O.; Mazumdar, B.; Chaudhari, P.K. Treatment of wastewater by electrocoagulation: A review. Environ. Sci. Pollut. Res. Int. 2014, 21, 2397–2413. https://doi.org/10.1007/s11356-013-2208-6.
15. Malinovic, B.N.; Pavlovic, M.G.; Djuricic, T. Electrocoagulation of textile wastewater containing of mixture of organic dyes by iron electrode. J. Electrochem. Sci. Eng. 2017, 7, 103–110. https://doi.org/10.5599/jese.36.
Minerals 2022, 12, 442 21 of 22
16. Prajapati, A.K.; Bidyut, M.; Chaudhari, P.K. Electrochemical treatment of rice grain based distillery effluent using iron electrode. Int. J. Chemtech. Res. 2013, 5, 694–698.
17. Sharma, D.; Chaudhari, P.K.; Dubey, S. Electrocoagulation treatment of electroplating wastewater: A review. J. Environ. Eng. 2020, 146, 03120009. https://doi.org/10.1061/(ASCE)EE.1943-7870.0001790.
18. Rakhmania; Kamyab, H.; Yuzir, M.A.; Abdullah, N.; Quan, L.M.; Riyadi, F.A.; Marzouki, R. Recent Applications of the Electro-coagulation Process on Agro-Based Industrial Wastewater: A Review. Sustainability 2022, 14, 1985. https://doi.org/10.3390/su14041985.
19. Luba, M.; Mikolajczyk, T.; Pierozynski, B.; Smoczynski, L.; Wojtacha, P.; Kuczynski, M. Electrochemical degradation of indus-trial dyes in wastewater through the dissolution of aluminum sacrificial anode of Cu/Al macro-corrosion galvanic cell. Molecules 2020, 25, 4108;. https://doi.org/10.3390/molecules25184108.
20. Tegladza, I.D.; Xu, Q.; Hu, K.; Lv, G.; Lu, J. Electrocoagulation processes: A general review about role of electro-generated flocs in pollutant removal. Process Saf. Environ. Prot. 2021, 146, 169–189.
21. Ghernaouta, D.; Ghernaoutb, B.; Boucherita, A.; Naceura, M.W.; Khelifaa, A.; Kelli, A. Study on mechanism of electrocoagula-tion with iron electrodes in idealised conditions and electrocoagulation of humic acids solution in batch using aluminium elec-trodes. Desalin. Water Treat. 2009, 8, 91–99.
22. Mollah, M.Y.A.; Morkovsky, P.; Gomes, J.A.G.; Kesmez, M.; Parga, J.; Cocke, D.L. Fundamentals, present and future perspec-tives of electrocoagulation. J. Hazard. Mater. 2004, 114, 199–210. https://doi.org/10.1016/j.jhazmat.2004.08.009.
23. Moussa, D.T.; El-Naas, M.H.; Nasser, M.; Al-Marri, M.J. A comprehensive review of electrocoagulation for water treatment: Potentials and challenges. J. Environ Manag. 2016, 186, 24–41. https://doi.org/10.1016/j.jenvman.2016.10.032.
24. Misaelides, P. Application of natural zeolites in environmental remediation: A short review. Microporous Mesoporous Mater. 2011, 144, 15–18. https://doi.org/10.1016/j.micromeso.2011.03.024.
25. Tasić, Ž.Z.; Bogdanović, G.D.; Antonijević, M.M. Application of natural zeolite in wastewater treatment–a review. J. Min. Metall. 2019, 55, 67–79. https://doi.org/10.5937/JMMA1901067T.
26. Vukojević Medvidović, N.; Perić, J.; Trgo, M. Column performance in lead removal from aqueous solutions by fixed bed of natural zeolite–clinoptilolite. Sep. Purif. Technol. 2006, 49, 237–244. https://doi.org/10.1016/j.seppur.2005.10.005.
27. Vukojević Medvidović, N.; Nuić, I.; Ugrina, M.; Trgo, M. Evaluation of natural zeolite as a material for permeable reactive barrier for remediation of zinc contaminated groundwater based on column study. Water Air Soil Pollut. 2018, 229, 367–380. https://doi.org/10.1007/s11270-018-4019-3.
28. Ugrina, M.; Čeru, T.; Nuić, I.; Trgo, M. Comparative Study of Mercury(II) Removal from Aqueous Solutions onto Natural and Iron-Modified Clinoptilolite Rich Zeolite. Processes 2020, 8, 1523. https://doi.org/10.3390/pr8111523.
29. Ugrina, M.; Gaberšek, M.; Daković, A.; Nuić, I. Preparation and Characterization of the Sulfur-Impregnated Natural Zeolite Clinoptilolite for Hg(II) Removal from Aqueous Solutions. Processes 2021, 9, 217. https://doi.org/10.3390/pr9020217.
30. Kalebić, B.; Pavlović, J.; Dikić, J.; Rečnik, A.; Gyergyek, S.; Škoro, N.; Rajić, N. Use of Natural Clinoptilolite in the Preparation of an Efficient Adsorbent for Ciprofloxacin Removal from Aqueous Media. Minerals 2021, 11, 518. https://doi.org/10.3390/min11050518.
31. Syafalni, S.; Johari, N.A.; Satrio, S. Pre treatment of river water by using bentonite and modified zeolite. Int. J. Appl. Eng. Res. 2015, 10, 14515–14528. Available online: http://www.ripublication.com/Volume/ijaerv10n6.htm (accessed on 20 February 2022).
32. Renault, F.; Sancey, B.; Badot, P.-M.; Grégorio, C. Chitosan for coagulation/flocculation processes—An eco-friendly approach. Eur. Polym. J. 2009, 45, 1337–1348. 10.1016/j.eurpolymj.2008.12.027.
33. Usefi, S.; Asadi-Ghalhari, M.; Izanloo, H.; Yari, A.; Mostafaloo, R. The performance of starch as a natural coagulant for turbidity removal from wastewater in stone cutting industry. Arch. Hyg. Sci. 2019, 8, 17–26. 10.29252/ArchHygSci.8.1.17.
34. Huang, X.; Wan, Y.; Shi, B.; Shi, J. Effects of powdered activated carbon on the coagulation-flocculation process in humic acid and humic acid-kaolin water treatment. Chemosphere 2020, 238, 124637. https://doi.org/10.1016/j.chemosphere.2019.124637.
35. Zaharia, C. Coagulation-flocculation processes in water and wastewater treatment. (II) Fine particles and its removal using electrolytes and polyelectrolytes. In Current Topics, Concepts and Research Priorities in Environmental Chemistry (III); Zaharia, C., Ed.; Alexandru Ioan Cuza University Publishing House: Iasi, Romania, 2014; Chapter 8, pp. 165–194.
36. Hamid, M.A.A.; Aziz, H.A.; Yusoff, M.S.; Abdul Rezan, S. Clinoptilolite augmented electrocoagulation process for the reduction of high-strength ammonia and color from stabilized landfill leachate. Water Environ. Res. 2020, 93, 1461. https://doi.org/10.1002/wer.1461.
37. Hamid, M.A.A.; Aziz, H.A.; Yusoff, M.S.; Abdul Rezan, S. Optimization and analysis of zeolite augmented electrocoagulation process in the reduction of high-strength ammonia in saline landfill leachate. Water 2020, 12, 247. https://doi.org/10.3390/w12010247.
38. Hamid, M.A.A.; Aziz, H.A.; Yusoff, M.S.; Rezan, S.A. A continuous clinoptilolite augmented SBR-electrocoagulation process to remove concentrated ammonia and colour in landfill leachate. Environ. Technol. Innov. 2021, 23, 101575; https://doi.org/10.1016/j.eti.2021.101575.
39. Vukojević Medvidović, N.; Vrsalović, L.; Ugrina, T.; Jukić, I. Electrocoagulation augmented with natural zeolite—The new hy-brid process for treatment of leachate from composting of biowaste. In Proccedings of the 19th International Foundrymen Con-ference: Humans—Valuable Resource for Foundry Industry Development, Split, Croatia, 16–18 June 2021; Dolić, N., Zovko Brodarac, Z., Brajčinović, S., Eds.; Faculty of Metallurgy, University of Zagreb: Zagreb, Croatia, 2021; pp. 489–498. Available online: https://ifc.simet.hr/?page_id=2518 (accessed on 20 February 2022).
Minerals 2022, 12, 442 22 of 22
40. Svilović, S.; Mužek, M.N.; Nuić, I.; Vučenović, P. Taguchi design of optimum process parameters for sorption of copper ions using different sorbens. Water Sci. Technol. 2019, 80, 98–108. https://doi.org/10.2166/wst.2019.249.
41. Svilović, S.; Rušić, D.; Stipišić, R.; Kuzmanić, N. Process optimization for copper sorption on synthetic zeolite NaX. Bulg. Chem. Commun. 2020, 52, 189–196. https://doi.org/10.34049/bcc.52.2.4620.
42. Eaton, A.D.; Clesceri, L.S.; Rice, E.W.; Greenberg, A.E.; Franson, M.A.H. (Eds.). Standard Methods for the Examination of Water and Wastewater, 21st ed.; American Public Health Association (APHA); American Water Works Association (AWWA); Water Envi-ronment Federation (WEF): Washington, DC, USA, 2005.
43. Vukojević Medvidović, N. Lead Removal on Natural Zeolite Clinoptilolite–Column Process Modelling. Ph.D. Thesis, Faculty of Chemistry and Technology, University of Split, Split, Croatia, 2007. (In Croatian)
44. Nuić, I.; Trgo, M.; Perić, J.; Vukojević Medvidović, N. Analysis of breakthrough curves of Pb and Zn sorption from binary solutions on natural clinoptilolite. Microporous Mesoporous Mater. 2013, 167, 55–61. https://doi.org/10.1016/j.mi-cromeso.2012.04.037.
45. Ugrina, M.; Vukojević Medvidović, N.; Daković, A. Characterization and environmental application of iron-modified zeolite from the Zlatokop deposit. Desalin. Water Treat. 2015, 53, 3557–3569. https://doi.org/10.1080/19443994.2013.873743.
46. Zeng, Y.P.; Lin, C.L.; Dai, H.M.; Lin, Y.C.; Hung, J.C. Multi-performance optimization in electrical discharge machining of Al2O3 ceramics using Taguchi base AHP weighted TOPSIS method. Processes 2021, 9, 1647. https://doi.org/10.3390/pr9091647.
47. Croatian Regulation on Emission Limits Values in Wastewater, NN 26/2020. (In Croatian). Available online: https://narodne-novine.nn.hr/clanci/sluzbeni/2020_03_26_622.html (accessed on 20 February 2022).
48. Ilhan, F.; Kurt, U.; Apaydin, O.; Talha Gonullu, M. Treatment of leachate by electrocoagulation using aluminum and iron elec-trodes. J. Hazar Mater. 2008, 154, 381–389. https://doi.org/10.1016/j.jhazmat.2007.10.035.
49. Sutanto, N.; Hidjan, R. Impact of adding sodium chloride to change of turbidity and iron concentration on treatment waste water using electrocoagulation process. J. Phys. Conf. Ser. 2019, 1364, 012062. https://doi.org/10.1088/1742-6596/1364/1/012062a.
50. Khaled, B.; Wided, B.; Béchir, H.; Limam, A.; Mouna, L.; Tlili, Z. Investigation of electrocoagulation reactor design parameters effect on the removal of cadmium from synthetic and phosphate industrial wastewater. Arabian J. Chem. 2019, 12, 1848–1859. https://doi.org/10.1016/j.arabjc.2014.12.012.
51. El-Ashtoukhy, E.-S.Z.; Amin, N.K.; Fouad, Y.O.; Hamad, H.A. Intensification of a new electrocoagulation system characterized by minimum energy consumption and maximum removal efficiency of heavy metals from simulated wastewater. Chem. Eng. Process.-Process Intensif. 2020, 154, 108026. https://doi.org/10.1016/j.cep.2020.108026.
52. Lončar, G.; Halkijević, I.; Posavčić, H.; Ban, I. Application of electrocoagulation devices for reducing ammonium concentrations. Hrvat. Vode 2019, 27, 129–142. (In Croatian). Available online: https://hrcak.srce.hr/clanak/325581 (accessed on 20 February 2022).
53. Oguzie, K.; Oguzie, E.; Nwanonenyi, S.; Edoziem, J.; Vrsalović, L. Electrochemical decolorization of disperse blue-1 dye in aqueous solution. Environ. Eng. Manag. J. 2021, 20, 1467–1476. Available online: http://www.eemj.icpm.tuiasi.ro/; http://www.eemj.eu; http://www.eemj.icpm.tuiasi.ro/pdfs/vol20/no9/7_524_Oguzie_20.pdf (accessed on 20 February 2022).
Related Documents