Electrochemical reactivity, surface composition and corrosion mechanisms of the complex metallic alloy Al 3 Mg 2 Ming Liu a,b,c , Patrik Schmutz b , Sandrine Zanna c , Antoine Seyeux c , Helene Ardelean c , Guangling Song a , Andrej Atrens a,b,c, * , Philippe Marcus c a The University of Queensland, Brisbane, Division of Materials, Qld 4072, Australia b EMPA, Swiss Federal Laboratories for Materials Testing and Research, Ueberlandstrasse 129, CH-8600 Dubendorf, Switzerland c Laboratoire de Physico-Chimie des Surfaces, CNRS-ENSCP (UMR 7045), Ecole Nationale Supérieure de Chimie de Paris (ENSCP), 11 rue Pierre et Marie Curie, 75005 Paris, France article info Article history: Received 11 August 2009 Accepted 9 October 2009 Available online 7 November 2009 Keywords: A. Magnesium B. XPS B. ToF-SIMS C. Dealloying C. Surface film abstract A corrosion mechanism is proposed for Al 3 Mg 2 , based on electrochemical tests, XPS, and depth profiling using XPS and ToF-SIMS. After short (2 min) solution exposure, the surface consists of a surface film above dealloying. The dealloying is attributed to selective Mg dissolution and the surface rearrangement of Al into islands, although the metallic Al could alternatively be formed by two reduction reactions. The surface film thickness was 10 nm. After exposure to ultra-pure water, the composition was AlM- g 1.3 O 0.2 (OH) 5.1 corresponding to Al(OH) 3 1.1 Mg(OH) 2 0.2MgO. After exposure to 0.01 M Na 2 SO 4 , the com- position was AlMg 0.2 O 0.4 (OH) 2.5 corresponding to Al(OH) 3 0.1Al 2 O 3 0.2MgO. Longer exposure produced a thicker surface film, more pronounced metallic Al islands and more MgH 2 . Three possibilities are identi- fied for MgH 2 formation. Al(OH) 3 formation is attributed to a precipitation reaction. Bulk nanoporous Al 3 Mg 2 formation is predicted to be possible by Mg dealloying of Mg 17 Al 12 . Ó 2009 Elsevier Ltd. All rights reserved. 1. Introduction 1.1. Importance Al and Mg alloys are used in the automotive, aerospace, marine, consumer electronics and construction industries due to their light weight. Al alloys can have a high strength to weight ratio and have typically excellent resistance to corrosion. Mg alloys can have excellent castability. However, despite the extensive research on the corrosion behaviour of Mg [1–15] and Al alloys [16–18], there is a significant lack of understanding concerning the role of micro- scale particles of intermetallics, such as Mg 17 Al 12 and Al 3 Mg 2 . An understanding of the surface properties of the intermetallics will help all fields of technological application of Al and Mg alloys and will allow development of tailored alloys with predictable reactivity. Corrosion is related to the surface layers, so it is appro- priate to investigate the electrochemical properties and the initial surface layers of the intermetallics after solution exposure. Mg 17 Al 12 and Al 3 Mg 2 are the two intermetallic phases in the Al–Mg binary phase diagram. Both Mg 17 Al 12 and Al 3 Mg 2 have cor- rosion rates significantly lower than pure Mg or Mg alloys in a typ- ical testing solution like 3% NaCl [3,19]. In multiphase Mg alloys, all second phases are cathodic to the matrix [3,4]. In a typical Mg alloy like AZ91D, corrosion typically initiates in the Mg-rich matrix at the interface between the matrix and the intermetallic compound Mg 17 Al 12 . If the volume fraction of Mg 17 Al 12 is sufficiently high, and there is a continuous Mg 17 Al 12 network, then the Mg 17 Al 12 network can act as a corrosion barrier and the corrosion rate can be lower than that of pure Mg in a typ- ical solution like 3% NaCl. Otherwise, the Mg alloy has a corrosion rate significantly larger than that of pure Mg [20–30]. The corro- sion rate of the Mg alloy is accelerated by Mg 17 Al 12 , because Mg 17 Al 12 acts as a efficient site for the cathodic reaction [1,3,4], the evolution of hydrogen. Al 3 Mg 2 is a common second phase in Al alloys containing Mg. It is typically more active than Al and corrodes preferentially. It is associ- ated with localized corrosion, inter-granular corrosion (IGC) and stress corrosion cracking (SCC). IGC and SCC are of concern when the Al 3 Mg 2 is concentrated on grain boundaries [31–33]. Al 3 Mg 2 has a low density, 2.2 g/cm 3 , consists entirely of relatively inexpen- sive elements, has a slight composition range and has several crystal structures. Al 3 Mg 2 belongs to the class of complex metallic alloys (CMA), because of its complex crystal structure [34–36]. The modifi- cation b-Al 61.5 Mg 38.5 has one of the highest identified degrees of complexity with 1168 atoms per unit cell [35]. There are significant experimental difficulties in the study of the surfaces of Mg intermetallics. They are reactive. Thick corrosion product layers form relatively quickly during sample preparation 0010-938X/$ - see front matter Ó 2009 Elsevier Ltd. All rights reserved. doi:10.1016/j.corsci.2009.10.015 * Corresponding author. Address: The University of Queensland, Brisbane, Division of Materials, St. Lucia, Brisbane, Qld 4072, Australia. Tel.: +61 733653748; fax: +61 733653888. E-mail address: [email protected] (A. Atrens). Corrosion Science 52 (2010) 562–578 Contents lists available at ScienceDirect Corrosion Science journal homepage: www.elsevier.com/locate/corsci

Welcome message from author
This document is posted to help you gain knowledge. Please leave a comment to let me know what you think about it! Share it to your friends and learn new things together.
Transcript
Corrosion Science 52 (2010) 562–578
Contents lists available at ScienceDirect
Corrosion Science
journal homepage: www.elsevier .com/locate /corsc i
Electrochemical reactivity, surface composition and corrosion mechanismsof the complex metallic alloy Al3Mg2
Ming Liu a,b,c, Patrik Schmutz b, Sandrine Zanna c, Antoine Seyeux c, Helene Ardelean c, Guangling Song a,Andrej Atrens a,b,c,*, Philippe Marcus c
a The University of Queensland, Brisbane, Division of Materials, Qld 4072, Australiab EMPA, Swiss Federal Laboratories for Materials Testing and Research, Ueberlandstrasse 129, CH-8600 Dubendorf, Switzerlandc Laboratoire de Physico-Chimie des Surfaces, CNRS-ENSCP (UMR 7045), Ecole Nationale Supérieure de Chimie de Paris (ENSCP), 11 rue Pierre et Marie Curie, 75005 Paris, France
a r t i c l e i n f o a b s t r a c t
Article history:Received 11 August 2009Accepted 9 October 2009Available online 7 November 2009
Keywords:A. MagnesiumB. XPSB. ToF-SIMSC. DealloyingC. Surface film
0010-938X/$ - see front matter � 2009 Elsevier Ltd. Adoi:10.1016/j.corsci.2009.10.015
* Corresponding author. Address: The University of Qof Materials, St. Lucia, Brisbane, Qld 4072, Australia. T733653888.
E-mail address: [email protected] (A. Atre
A corrosion mechanism is proposed for Al3Mg2, based on electrochemical tests, XPS, and depth profilingusing XPS and ToF-SIMS. After short (�2 min) solution exposure, the surface consists of a surface filmabove dealloying. The dealloying is attributed to selective Mg dissolution and the surface rearrangementof Al into islands, although the metallic Al could alternatively be formed by two reduction reactions. Thesurface film thickness was �10 nm. After exposure to ultra-pure water, the composition was AlM-g1.3O0.2(OH)5.1 corresponding to Al(OH)3�1.1 Mg(OH)2�0.2MgO. After exposure to 0.01 M Na2SO4, the com-position was AlMg0.2O0.4(OH)2.5 corresponding to Al(OH)3�0.1Al2O3�0.2MgO. Longer exposure produced athicker surface film, more pronounced metallic Al islands and more MgH2. Three possibilities are identi-fied for MgH2 formation. Al(OH)3 formation is attributed to a precipitation reaction. Bulk nanoporousAl3Mg2 formation is predicted to be possible by Mg dealloying of Mg17Al12.
� 2009 Elsevier Ltd. All rights reserved.
1. Introduction
1.1. Importance
Al and Mg alloys are used in the automotive, aerospace, marine,consumer electronics and construction industries due to their lightweight. Al alloys can have a high strength to weight ratio and havetypically excellent resistance to corrosion. Mg alloys can haveexcellent castability. However, despite the extensive research onthe corrosion behaviour of Mg [1–15] and Al alloys [16–18], thereis a significant lack of understanding concerning the role of micro-scale particles of intermetallics, such as Mg17Al12 and Al3Mg2.An understanding of the surface properties of the intermetallicswill help all fields of technological application of Al and Mg alloysand will allow development of tailored alloys with predictablereactivity. Corrosion is related to the surface layers, so it is appro-priate to investigate the electrochemical properties and the initialsurface layers of the intermetallics after solution exposure.Mg17Al12 and Al3Mg2 are the two intermetallic phases in theAl–Mg binary phase diagram. Both Mg17Al12 and Al3Mg2 have cor-rosion rates significantly lower than pure Mg or Mg alloys in a typ-ical testing solution like 3% NaCl [3,19].
ll rights reserved.
ueensland, Brisbane, Divisionel.: +61 733653748; fax: +61
ns).
In multiphase Mg alloys, all second phases are cathodic to thematrix [3,4]. In a typical Mg alloy like AZ91D, corrosion typicallyinitiates in the Mg-rich matrix at the interface between the matrixand the intermetallic compound Mg17Al12. If the volume fraction ofMg17Al12 is sufficiently high, and there is a continuous Mg17Al12
network, then the Mg17Al12 network can act as a corrosion barrierand the corrosion rate can be lower than that of pure Mg in a typ-ical solution like 3% NaCl. Otherwise, the Mg alloy has a corrosionrate significantly larger than that of pure Mg [20–30]. The corro-sion rate of the Mg alloy is accelerated by Mg17Al12, becauseMg17Al12 acts as a efficient site for the cathodic reaction [1,3,4],the evolution of hydrogen.
Al3Mg2 is a common second phase in Al alloys containing Mg. It istypically more active than Al and corrodes preferentially. It is associ-ated with localized corrosion, inter-granular corrosion (IGC) andstress corrosion cracking (SCC). IGC and SCC are of concern whenthe Al3Mg2 is concentrated on grain boundaries [31–33]. Al3Mg2
has a low density, 2.2 g/cm3, consists entirely of relatively inexpen-sive elements, has a slight composition range and has several crystalstructures. Al3Mg2 belongs to the class of complex metallic alloys(CMA), because of its complex crystal structure [34–36]. The modifi-cation b-Al61.5Mg38.5 has one of the highest identified degrees ofcomplexity with 1168 atoms per unit cell [35].
There are significant experimental difficulties in the study ofthe surfaces of Mg intermetallics. They are reactive. Thick corrosionproduct layers form relatively quickly during sample preparation
M. Liu et al. / Corrosion Science 52 (2010) 562–578 563
and these obscure the detailed characterization of the film at themetal surface. This is significant since the film at the metal surfacetypically plays a key role in controlling reactivity. Our prior work[6] used X-ray Photoelectron Spectroscopy (XPS) to elucidate thefilms formed on initial immersion in ultra-pure water on pureMg, Al3Mg2 and Mg17Al12 using the approach of a previous workin the Paris Lab [37]. Specimens were prepared by mechanicalgrinding to 1200 grit without the use of water or any lubricant; thisapproach allowed the study of the early stages of corrosion, typi-cally the period of 30–420 s after first exposure to high puritywater. After immersion in ultra-pure water, the surface film thick-ness was �10 nm [6]; the film composition on Al3Mg2 was AlM-g1.4O0.2(OH)5.4 whilst the composition was AlMg2.5(OH)8 onMg17Al12. Time of Flight-Secondary Ion Mass Spectrometry(ToF-SIMS) was used to examine the film on pure Mg immersedin ultra-pure water [5]; of particular interest was Mg hydride with-in the surface film produced as a result of the Mg corrosionmechanism.
1.2. Electrochemistry and corrosion of Al3Mg2
There is no complete account of the electrochemical behaviourof Al3Mg2. It was suggested that the electrochemical polarizationcurve of Al3Mg2 can be understood based on the anodic behaviourof Al and the cathodic behaviour of Mg [38,39]. The e-beam oxidi-zation of Al3Mg2 indicated oxidation of Al and Mg at the surfaceaccompanied by Mg diffusion through the surface oxide [40]. XPSdepth profiles of the surface films on Al3Mg2 after exposure towater showed an enhanced Al concentration at the metal surface,attributed to preferential dissolution of Mg [39]. An understandingof the corrosion of Al3Mg2 needs to be gained based on under-standing the corrosion of the elements Mg and Al. The overall Mgcorrosion reaction can be summarized as follows [1,3,4,21–23,41–43]:
Mg ¼Mgþ þ e ðanodic reactionÞ ð1Þ
kMgþ ¼ kMg2þ þ e ðanodic reactionÞ ð2Þ
ð1þ kÞHþ þ ð1þ kÞe ¼ ð1þ kÞ 12
� �H2 ðcathodic reactionÞ ð3Þ
ð1� kÞMgþ þ ð1� kÞHþ ¼ ð1� kÞMg2þ þ 12
� �ð1
� kÞH2 ðchemical reactionÞ ð4Þ
Mgþ 2Hþ ¼ Mg2þ þH2 ðoverall reactionÞ ð5Þ
Two sequential anodic partial reactions produce Mg2+, Eqs. (1) and(2). A fraction, k, of Mg+ ions reacts electrochemically to produceMg2+, the complement (1 � k) reacts by a chemical reaction, Eq.(4). The two anodic reactions are balanced by a cathodic partialreaction, Eq. (3), the hydrogen evolution reaction. Hydrogen is alsoproduced by the chemical reaction, Eq. (4). In the overall reaction,Eq. (5), one hydrogen molecule is evolved for every atom of Mg dis-solved. When the limited solubility of the Mg2+ ions is exceeded,Mg(OH)2 is precipitated, at pH = 10.5 [44], by:
Mg2þ þ 2OH� ¼MgðOHÞ2 ðproduct formation reactionÞ ð6Þ
At alkaline pH values, Mg(OH)2 can be produced by [44]:
Mgþ 2H2O ¼MgðOHÞ2 þ 2Hþ
þ 2e ðanodic film formationÞ ð7Þ
Al can be passivated in neutral solutions by [44]:
2Alþ 3H2O ¼ Al2O3 þ 6Hþ þ 6e ð8Þ
Pourbaix [44] lists five solid substances including Al(OH)3, howeverPourbaix [44] indicates that Al2O3 forms because it has the lowestfree energy. In contrast, in alkaline solutions, the aluminate ion,AlO�2 , is soluble, and can be formed from solid Al by the followinganodic partial reaction:
Alþ 2H2O ¼ AlO�2 þ 4Hþ þ 3e ð9Þ
Pourbaix [44] indicates that addition of acid, to a solution of an alu-minate, forms a precipitate of Al(OH)3 by:
AlO�2 þHþ þH2O ¼ AlðOHÞ3 ð10Þ
1.3. Dealloying
Dealloying manifests as selective dissolution of the more activeelement of a homogeneous alloy. Dealloying plays an importantrole in certain forms of SCC and corrosion fatigue, as dealloyingcan produce a highly brittle surface layer [45–51]. Mg dealloyingwas observed in our prior work [6] on Al3Mg2 and in Mg2Si inter-metallics after immersion in NaCl solution [52]. Guillaumin andMankowski [18] observed Mg dealloying from Al2CuMg precipi-tates leaving Cu-rich remnants in an Al alloy. Zhao et al. [53] pro-duced bulk nanoporous Cu by dealloying Mg–Cu alloys in 5 wt.%HCl. Zberg et al. [54] observed Mg dealloying in the corrosion ofMgZnCa metallic glasses. Metallic Zn was formed by the corrosionof Mg74Zn21Ca5. The intermetallic CaZn13 was formed by the corro-sion of Mg67Zn28Ca5 and Mg60Zn35Ca5.
The simplest explanation, developed for Cu–Zn alloys, is thatthe more active element is selectively dissolved from the alloy[55]. Erlebacher and co-workers [56,57] have shown that the nano-porous structure is the result of the dissolution of the more activeelement accompanied by the surface diffusion of the more-nobleelement. Dealloying is potential dependent [58] and porous struc-tures are produced in the potential range where the dissolution ofthe more active element is possible but below the potential ofnoble element dissolution. More positive potentials lead to the dis-solution of both elements, and the subsequent selective depositionof the more-noble element.
1.4. Research aims
The issues addressed included:
1. surface film composition, depth and spatial distribution, chem-ical species and their formation;
2. dealloying at the interface, mechanism and implications, and3. corrosion mechanism.
2. Experimental methods
2.1. Sample preparation
The Al3Mg2 sample was grown by Feuerbacher of the JülichResearch Center GmbH, Germany in the European network ofexcellence CMA project (Contract No. NMP3-CT-2005-500140 inthe 6th Framework Program). Feuerbacher et al. [35] explainedthe crystallography of samples from the same production batchof material. Our characterization, using optical microscopy andscanning electron microscopy, indicated that the microstructurewas single phase and homogeneous. The chemical composition,measured using an electron probe micro-analyzer, confirmed thatthe sample was homogeneous and that the element ratio ofAl/Mg was 59/41, which is within the range of composition forAl3Mg2 from the Al–Mg phase diagram [59].
The Al3Mg2 surfaces were prepared in two conditions: (i)mechanically ground to 1200 grit (MG) and (ii) polished to
564 M. Liu et al. / Corrosion Science 52 (2010) 562–578
0.25 lm diamond (polished). The MG surface was used to investi-gate the initial effect of water. Specimens were carefully drymechanically ground using SiC papers to 1200 grit in laboratoryair, with no lubricant and with no water. A stream of air was usedto blow away surface particles. There was no water during speci-men preparation, thus the time of solution exposure was clearlydefined. The specimen was thin and was hand held during grind-ing; the experimenter felt no temperature increase during grind-ing. To minimize oxidation, each specimen was ground justbefore measurement. The sample preparation was the same as inour previous work [6], so the present results are directly compara-ble to the previous work [6].
Diamond polishing was used for the electrochemical measure-ments, some of the XPS depth profiles, the angle resolved XPSand the ToF-SIMS measurements. Each specimen was ground to1200 grit using SiC papers, was further polished to 0.25 lm dia-mond, washed with ultra-pure water and dried by blowing withpressure air. The lubricant for diamond polishing probably con-tained some water or equivalent. These specimens were probablyexposed to water already during specimen preparation, so thatthe time for solution exposure was not well defined. The examina-tion of these specimens typically used relatively longer solutionexposure times.
2.2. Solutions
The 0.01 M Na2SO4 solutions were prepared with A.R. gradechemicals and ultra-pure water, with a resistivity greater than18 MX cm. The pH of the solution was (i) neutral, with pH � 6.5,for the as prepared solution, (ii) pH 10.5, produced by saturatingthe solution with Mg(OH)2 and (iii) pH 12, produced by the addi-tion of NaOH to the solution. The pH of each solution was mea-sured with a pH meter. All experiments were conducted at roomtemperature.
2.3. Electrochemical testing and pretreatment
The electrochemical experiments were carried out using pol-ished samples in the 0.01 M Na2SO4 solutions (at pH � 6.5, 10.5and 12) using an AUTOLAB PGSTAT 30 electrochemical systemfrom Ecochemie NL, using a standard three-electrode cell, of250 ml volume. Specimens were encapsulated in cold setting resinwith one face, area 0.785 cm2, exposed to the solution. Electricalconnection was to the back of the resin-encapsulated specimen.A saturated calomel-electrode, SCE, was the reference electrode.The counter electrode was a shrouded platinum disc, 5.0 mm indiameter and 12 mm in height. The open circuit potential (OCP)was monitored as a function of time after immersion. For polariza-tion curve measurement, a specimen was immersed in the testsolution for 1 min and the polarization scan was carried out fromthe OCP, separately in the cathodic or anodic direction, at a rateof 1 mV/s.
For electrochemical treatment before XPS depth profilemeasurement, the specimen was immersed in the solution, polar-ized 300 mV negative (or positive) to the open circuit potential for
Table 1Curve fitting parameters. The T values are dependent on experiment conditions. All analysesused the small area values.
Inelastic mean free path (nm)
Al3Mg2 MgO Mg(OH)2 Al(OH
Mg 3.40 3.10 3.28 3.61Al 3.36 3.24 3.56O 2.09 2.38 2.61
30 s, removed from the solution, rinsed with ultra-pure water,dried with pressure air and introduced into the XPS vacuum cham-ber for analysis.
2.4. XPS analysis
XPS analysis was carried out with a Thermo Electron Escalab250 spectrometer with monochromatic Al Ka radiation(1486.6 eV). The analyzer pass energy was 100 eV for survey spec-tra and 20 eV for high-resolution spectra. The spectrometer wascalibrated using the Au 4f7/2 peak at 84.1 eV. The following corelevels were analyzed: Mg 2p, Al 2p, O 1s and C 1s.
XPS analysis was carried out after exposure to ultra-pure waterand the 0.01 M Na2SO4 solutions. The MG sample was ground to1200 grit, introduced into the XPS chamber and vacuum pumpingwas started immediately; the pressure reached 6 � 10�2 Pa inabout 10 min, then the sample was transferred into the high vac-uum system. Each sample for solution exposure was removed fromthe XPS apparatus, immediately immersed into the ultra-purewater or the Na2SO4 solution for the desired duration, rinsed in ul-tra-pure water, a stream of air was used to dry the surface and thespecimen was reintroduced into XPS vacuum chamber.
XPS depth profiles were obtained by sputtering using Ar+ ionswith voltage of 1 kV and a current of 1 lA/cm2. Prior experimentsindicated that these sputtering conditions give an etching rate of0.05 nm/s for the sputtering of Ta2O5. For angle resolved XPS, thephotoelectron take-off angle (the angle of the surface with the direc-tion in which the photoelectrons were analyzed) was 90� or 40�.
Curve fitting of the XPS spectra used the Thermo Electron soft-ware Advantage. The inelastic mean free path values were as calcu-lated by Tanuma et al. [60]. The photo emission cross-sections, r,were as calculated by Scofield [61]. A Shirley correction was madeto the background under all fitted peaks. The transmission factorwas calibrated using a crystal sample of Mg(OH)2. The binding en-ergy could be estimated to an accuracy of ±0.1 eV. The parametersused for the calculations are given in Table 1.
2.5. ToF-SIMS
Time-of-Flight-Secondary Ion Mass Spectrometry (ToF-SIMS)analyses used a ToF-SIMS 5 spectrometer (Ion Tof – Munster Ger-many) using polished specimens (to 0.25 lm diamond), which hadbeen immersed in the test solution for the desired time, rinsed inultra-pure water and dried by pressure air. After preparation, thespecimen was immediately introduced into ToF-SIMS vacuumchamber; this took about 2 min. The spectrometer operated at apressure of 10�9 mbar. Analysis used a pulsed 25 keV Bi+ primaryion source, delivering 1.2 pA current over a 100 lm � 100 lm area.Analysis yields detailed elemental and molecular information fromthe surface of the sample. Depth profiles were measured using a0.5 keV Cs+ sputter beam with 45� incidence to the specimen sur-face, giving a 45 nA target current over a 250 lm � 250 lm area.The sputtering rate was estimated to be 0.07 nm/s using a realisticvalue of the sputter yield of �1.2, and assuming the surface densityof oxygen ions was 5.27 � 1022 ions/cm3, which corresponds to the
used the T values corresponding to large area except for the angle resolved XPS which
r T T
)3 Large area XL Small area XL150
0.3335 3349 13990.537 3381 14102.93 3435 1672
M. Liu et al. / Corrosion Science 52 (2010) 562–578 565
average density of Mg(OH)2 and Al(OH)3. Negative ion depthprofiles were recorded because these have a better sensitivity tofragments originating from oxide. Data acquisition and post-pro-cessing analyses were performed using the Ion-Spec software.
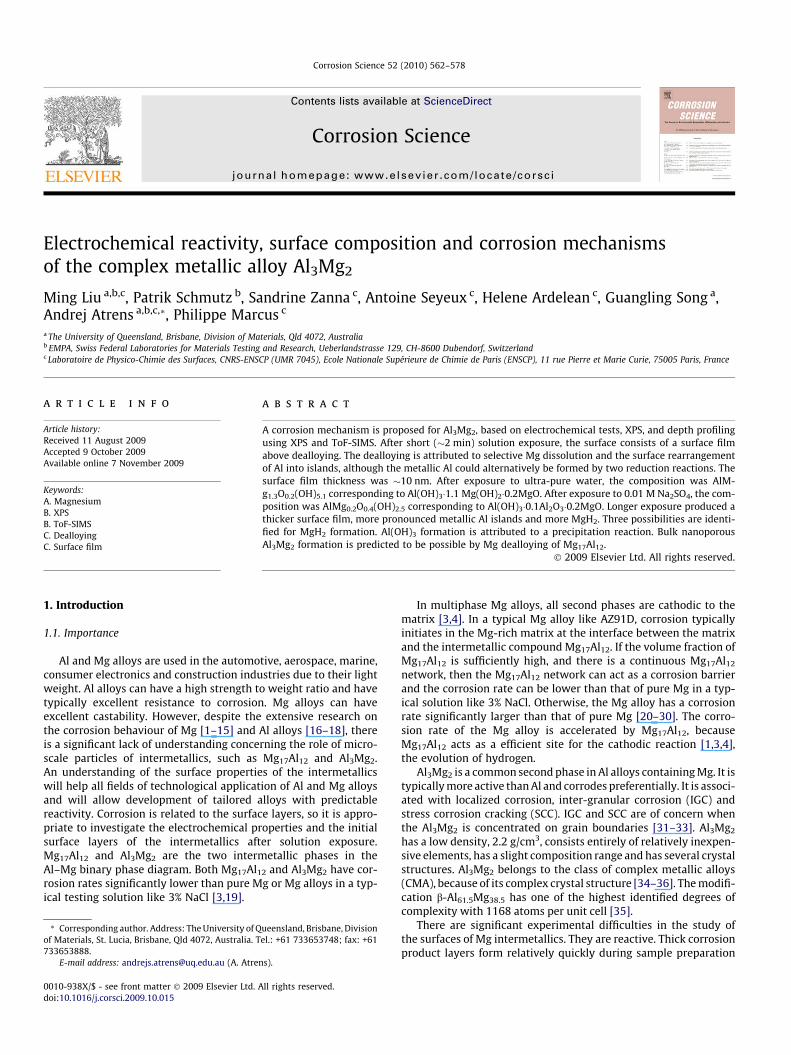
Fig. 2. The polarization curves of Al3Mg2 in 0.01 M Na2SO4 with different pH values.
3. Results
3.1. Electrochemical measurements
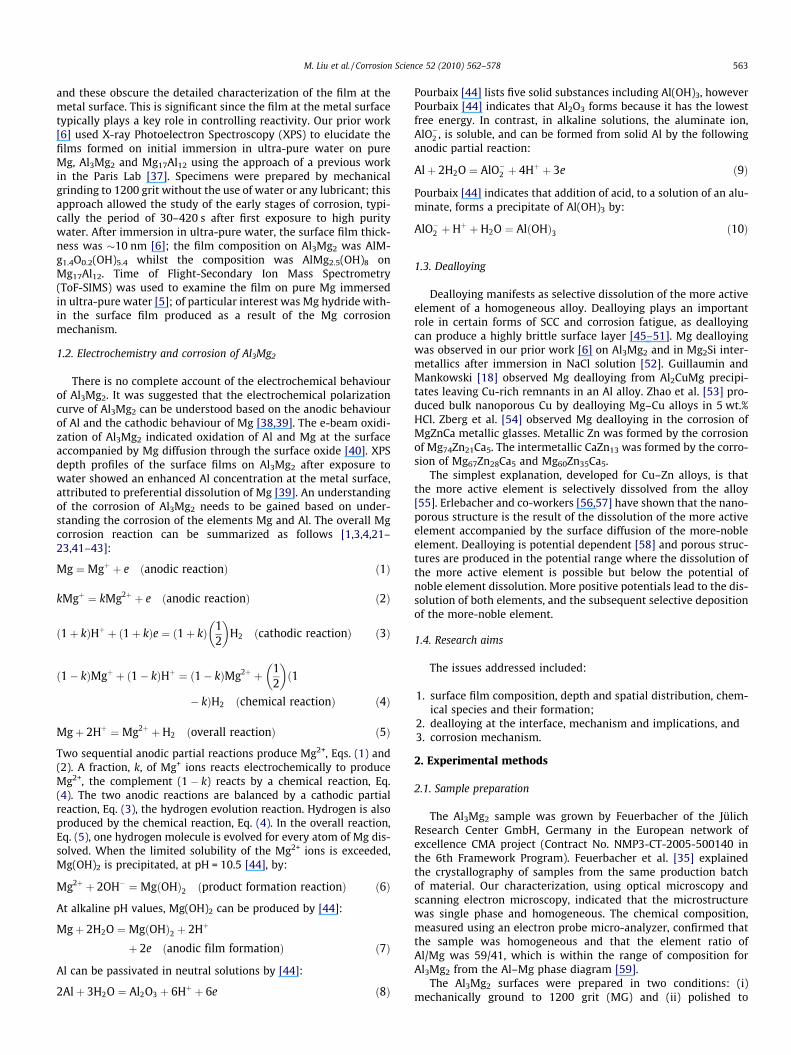
Fig. 1 presents the open circuit potential (or corrosion potential)for Al3Mg2 in 0.01 M Na2SO4; the time axis in linear in Fig. 1(a) andlogarithmic in Fig. 1(b). The open circuit potential provides someindication of the state of the metal surface. The open circuit potentialwas relatively negative immediately after specimen immersion inthe solution. Subsequently the open circuit potential shifted towardspositive values. Hydrogen bubbles started to form on the surface butthere was no visible corrosion. Corrosion began in localized spots onthe surface simultaneously with fluctuations in the corrosion poten-tial at the times indicated on Fig. 1. Hydrogen bubbles evolved rap-idly from areas of visible corrosion. Subsequently, these corrodingareas extended across the specimen surface.
Fig. 2 presents the polarization curves for Al3Mg2 in 0.01 MNa2SO4, after 60 s immersion in the solution for stabilisation. Thecorrosion potential was between �1.77 VSCE and �1.58 VSCE andincreased with increasing pH. This was consistent with the opencircuit potential transients presented in Fig. 1. There was an anodicpassive plateau in each solution, which indicated the pH domainfor passivation of Al3Mg2 was broader than that for pure Mg orpure Al. In the neutral pH solution, and the Mg(OH)2 saturatedsolution, there was a small peak at the beginning of the anodiccurve, followed by an anodic passive plateau that extended fromabout �1.6 VSCE to �0.65 VSCE. In the pH 12 solution, the passiv-ation plateau extended to an applied potential of +0.4 VSCE, whichwas 2 V more positive than the corrosion potential and was at theend of the testing potential domain. In the neutral solution, therewas a small peak at the end of the passivation plateau just beforethe significant increase of current density; this was not present inthe higher pH solutions. The cathodic branch of the polarizationcurve was similar in all three solutions indicating a similar catho-dic reaction in all three solutions.
Optical microscopy, Fig. 3, indicated that, after anodic polariza-tion in the neutral pH solution, the specimen surface was coveredby a uniform black film. This film was adherent and compact, andcould only be removed by polishing. A light polish removed thefilm revealing areas of greater localized dissolution, arrowed. Therewas no evidence of corrosion over the remaining surface on which
Fig. 1. The open circuit potential transients for Al3M
the original polishing scratches were visible. After cathodic polar-ization, there were black spots on the surface, �1 lm in size. Someof these may be casting pores, arising from the specimen manufac-ture by casting, and some were dissolution in a local area. In thesolution saturated with Mg(OH)2, there was less localized corro-sion after the anodic polarization. Most of the surface was oxidizedto a dark appearance but some localized areas were still bright.After cathodic polarization, there were some dark areas but mostof the surface was uncorroded and bright. In the pH 12 solution,the specimen did not show any sign of corrosion after the anodicor the cathodic polarization; the corrosion was inhibited due tothe high pH of the solution.
3.2. XPS – MG surface
The investigation of the initial aqueous corrosion of Al3Mg2
used XPS analysis of mechanically ground (MG) samples. Fig. 4illustrates the deconvolution of the high-resolution XPS spectrafor the Mg 2p, Al 2p and O 1s peaks for Al3Mg2 after differentimmersion times in 0.01 M Na2SO4 and Tables 2a–c presents thedata of peak area and binding energy. In addition, there was noNa 2p signal and a very weak of S 1s signal only in several casesafter immersion in Na2SO4 solutions. The change of these peaks,Table 2a–c, with immersion time was similar in both solutionsand was similar to that measured in pure water [6]. The Mg 2p,
g2 in 0.01 M Na2SO4 with different pH values.
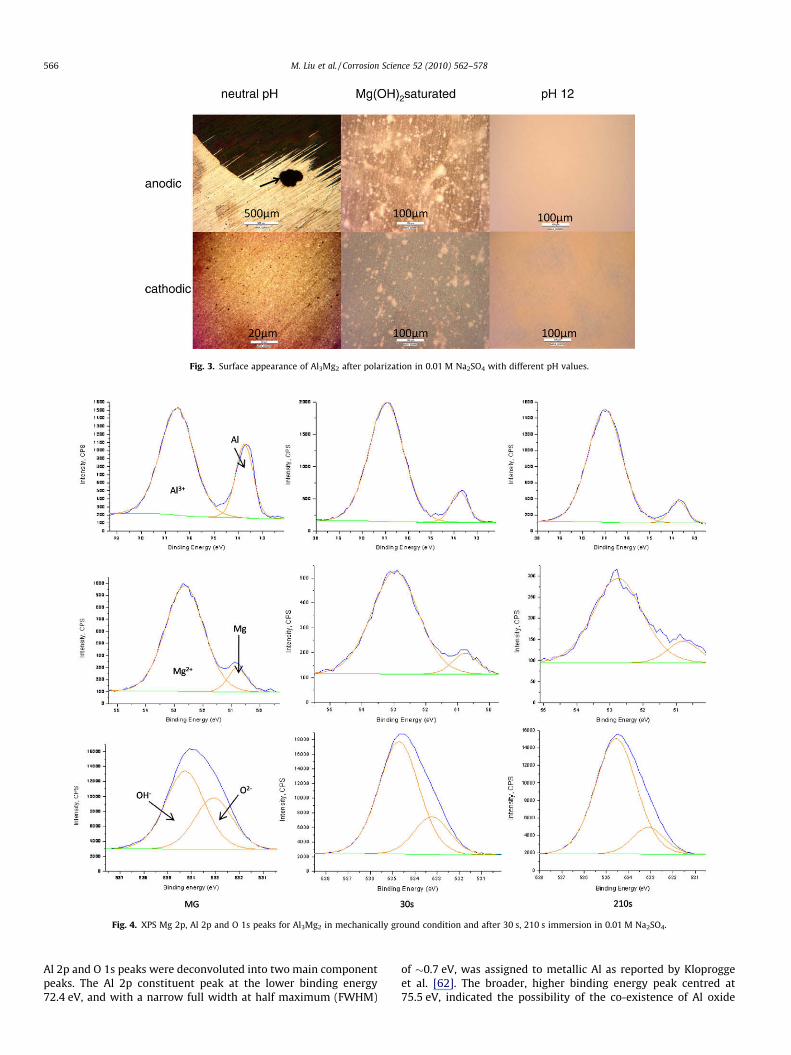
Fig. 3. Surface appearance of Al3Mg2 after polarization in 0.01 M Na2SO4 with different pH values.
Fig. 4. XPS Mg 2p, Al 2p and O 1s peaks for Al3Mg2 in mechanically ground condition and after 30 s, 210 s immersion in 0.01 M Na2SO4.
566 M. Liu et al. / Corrosion Science 52 (2010) 562–578
Al 2p and O 1s peaks were deconvoluted into two main componentpeaks. The Al 2p constituent peak at the lower binding energy72.4 eV, and with a narrow full width at half maximum (FWHM)
of �0.7 eV, was assigned to metallic Al as reported by Kloproggeet al. [62]. The broader, higher binding energy peak centred at75.5 eV, indicated the possibility of the co-existence of Al oxide
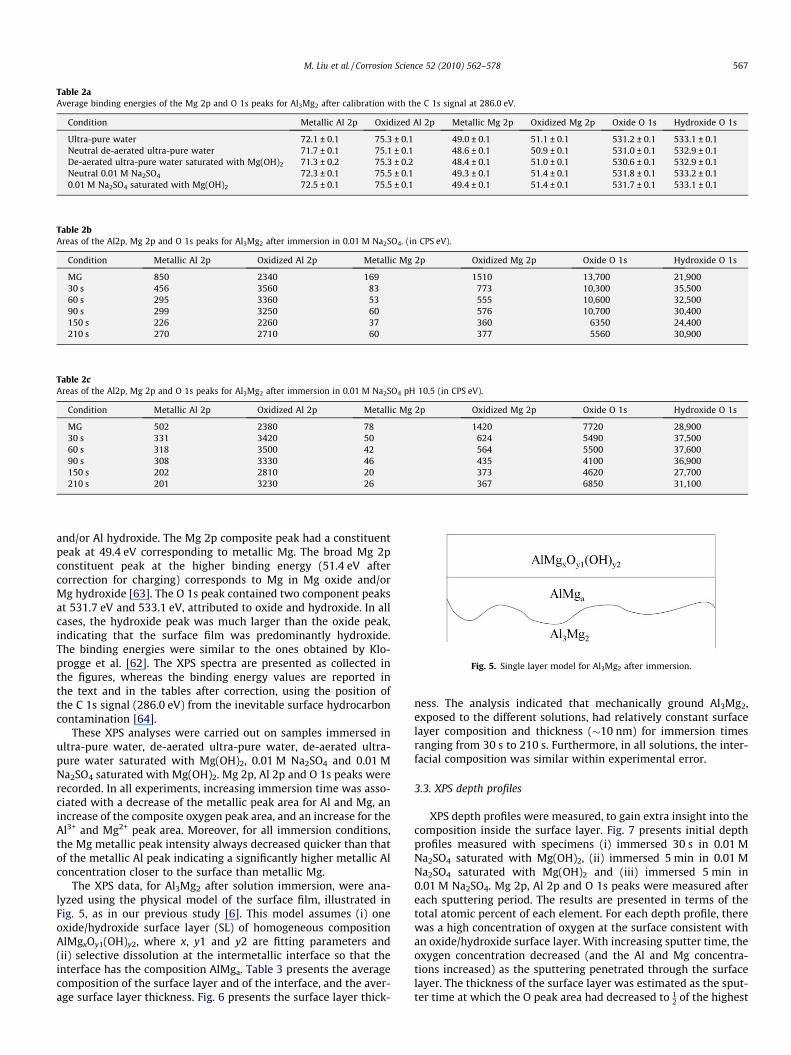
Table 2aAverage binding energies of the Mg 2p and O 1s peaks for Al3Mg2 after calibration with the C 1s signal at 286.0 eV.
Condition Metallic Al 2p Oxidized Al 2p Metallic Mg 2p Oxidized Mg 2p Oxide O 1s Hydroxide O 1s
Ultra-pure water 72.1 ± 0.1 75.3 ± 0.1 49.0 ± 0.1 51.1 ± 0.1 531.2 ± 0.1 533.1 ± 0.1Neutral de-aerated ultra-pure water 71.7 ± 0.1 75.1 ± 0.1 48.6 ± 0.1 50.9 ± 0.1 531.0 ± 0.1 532.9 ± 0.1De-aerated ultra-pure water saturated with Mg(OH)2 71.3 ± 0.2 75.3 ± 0.2 48.4 ± 0.1 51.0 ± 0.1 530.6 ± 0.1 532.9 ± 0.1Neutral 0.01 M Na2SO4 72.3 ± 0.1 75.5 ± 0.1 49.3 ± 0.1 51.4 ± 0.1 531.8 ± 0.1 533.2 ± 0.10.01 M Na2SO4 saturated with Mg(OH)2 72.5 ± 0.1 75.5 ± 0.1 49.4 ± 0.1 51.4 ± 0.1 531.7 ± 0.1 533.1 ± 0.1
Table 2bAreas of the Al2p, Mg 2p and O 1s peaks for Al3Mg2 after immersion in 0.01 M Na2SO4. (in CPS eV).
Condition Metallic Al 2p Oxidized Al 2p Metallic Mg 2p Oxidized Mg 2p Oxide O 1s Hydroxide O 1s
MG 850 2340 169 1510 13,700 21,90030 s 456 3560 83 773 10,300 35,50060 s 295 3360 53 555 10,600 32,50090 s 299 3250 60 576 10,700 30,400150 s 226 2260 37 360 6350 24,400210 s 270 2710 60 377 5560 30,900
Table 2cAreas of the Al2p, Mg 2p and O 1s peaks for Al3Mg2 after immersion in 0.01 M Na2SO4 pH 10.5 (in CPS eV).
Condition Metallic Al 2p Oxidized Al 2p Metallic Mg 2p Oxidized Mg 2p Oxide O 1s Hydroxide O 1s
MG 502 2380 78 1420 7720 28,90030 s 331 3420 50 624 5490 37,50060 s 318 3500 42 564 5500 37,60090 s 308 3330 46 435 4100 36,900150 s 202 2810 20 373 4620 27,700210 s 201 3230 26 367 6850 31,100
Fig. 5. Single layer model for Al3Mg2 after immersion.
M. Liu et al. / Corrosion Science 52 (2010) 562–578 567
and/or Al hydroxide. The Mg 2p composite peak had a constituentpeak at 49.4 eV corresponding to metallic Mg. The broad Mg 2pconstituent peak at the higher binding energy (51.4 eV aftercorrection for charging) corresponds to Mg in Mg oxide and/orMg hydroxide [63]. The O 1s peak contained two component peaksat 531.7 eV and 533.1 eV, attributed to oxide and hydroxide. In allcases, the hydroxide peak was much larger than the oxide peak,indicating that the surface film was predominantly hydroxide.The binding energies were similar to the ones obtained by Klo-progge et al. [62]. The XPS spectra are presented as collected inthe figures, whereas the binding energy values are reported inthe text and in the tables after correction, using the position ofthe C 1s signal (286.0 eV) from the inevitable surface hydrocarboncontamination [64].
These XPS analyses were carried out on samples immersed inultra-pure water, de-aerated ultra-pure water, de-aerated ultra-pure water saturated with Mg(OH)2, 0.01 M Na2SO4 and 0.01 MNa2SO4 saturated with Mg(OH)2. Mg 2p, Al 2p and O 1s peaks wererecorded. In all experiments, increasing immersion time was asso-ciated with a decrease of the metallic peak area for Al and Mg, anincrease of the composite oxygen peak area, and an increase for theAl3+ and Mg2+ peak area. Moreover, for all immersion conditions,the Mg metallic peak intensity always decreased quicker than thatof the metallic Al peak indicating a significantly higher metallic Alconcentration closer to the surface than metallic Mg.
The XPS data, for Al3Mg2 after solution immersion, were ana-lyzed using the physical model of the surface film, illustrated inFig. 5, as in our previous study [6]. This model assumes (i) oneoxide/hydroxide surface layer (SL) of homogeneous compositionAlMgxOy1(OH)y2, where x, y1 and y2 are fitting parameters and(ii) selective dissolution at the intermetallic interface so that theinterface has the composition AlMga. Table 3 presents the averagecomposition of the surface layer and of the interface, and the aver-age surface layer thickness. Fig. 6 presents the surface layer thick-
ness. The analysis indicated that mechanically ground Al3Mg2,exposed to the different solutions, had relatively constant surfacelayer composition and thickness (�10 nm) for immersion timesranging from 30 s to 210 s. Furthermore, in all solutions, the inter-facial composition was similar within experimental error.
3.3. XPS depth profiles
XPS depth profiles were measured, to gain extra insight into thecomposition inside the surface layer. Fig. 7 presents initial depthprofiles measured with specimens (i) immersed 30 s in 0.01 MNa2SO4 saturated with Mg(OH)2, (ii) immersed 5 min in 0.01 MNa2SO4 saturated with Mg(OH)2 and (iii) immersed 5 min in0.01 M Na2SO4. Mg 2p, Al 2p and O 1s peaks were measured aftereach sputtering period. The results are presented in terms of thetotal atomic percent of each element. For each depth profile, therewas a high concentration of oxygen at the surface consistent withan oxide/hydroxide surface layer. With increasing sputter time, theoxygen concentration decreased (and the Al and Mg concentra-tions increased) as the sputtering penetrated through the surfacelayer. The thickness of the surface layer was estimated as the sput-ter time at which the O peak area had decreased to 1
2 of the highest
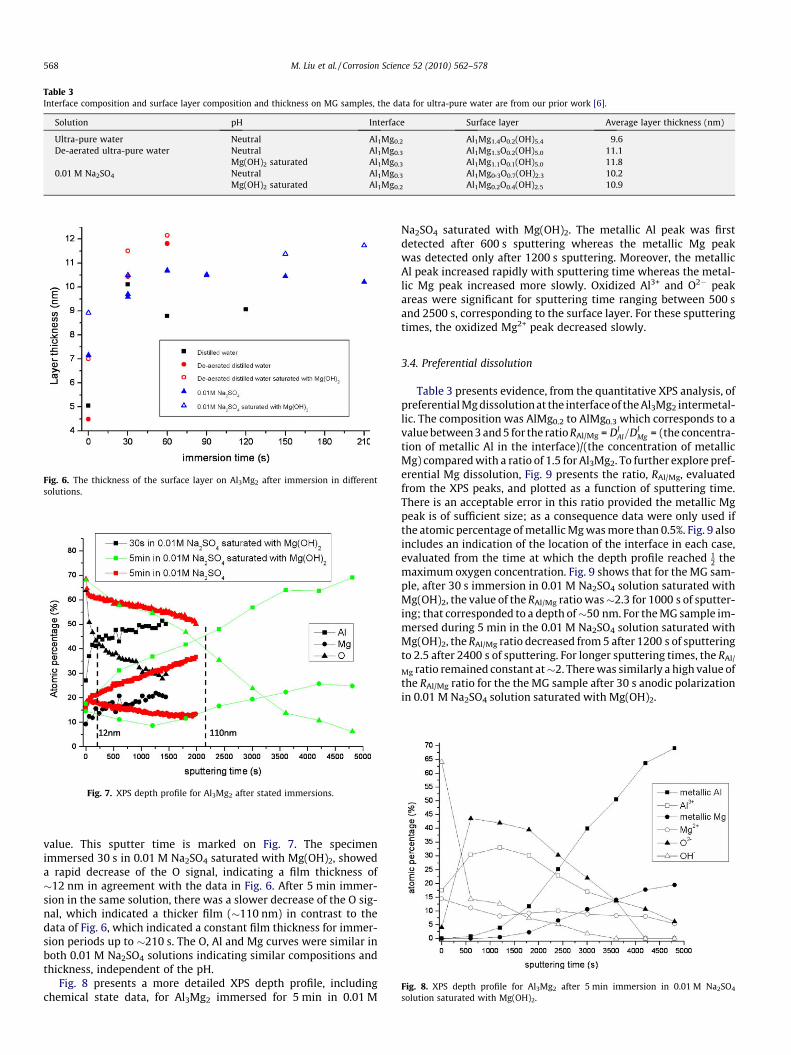
Table 3Interface composition and surface layer composition and thickness on MG samples, the data for ultra-pure water are from our prior work [6].
Solution pH Interface Surface layer Average layer thickness (nm)
Ultra-pure water Neutral Al1Mg0.2 Al1Mg1.4O0.2(OH)5.4 9.6De-aerated ultra-pure water Neutral Al1Mg0.3 Al1Mg1.3O0.2(OH)5.0 11.1
Mg(OH)2 saturated Al1Mg0.3 Al1Mg1.1O0.1(OH)5.0 11.80.01 M Na2SO4 Neutral Al1Mg0.3 Al1Mg0.3O0.7(OH)2.3 10.2
Mg(OH)2 saturated Al1Mg0.2 Al1Mg0.2O0.4(OH)2.5 10.9
Fig. 6. The thickness of the surface layer on Al3Mg2 after immersion in differentsolutions.
Fig. 7. XPS depth profile for Al3Mg2 after stated immersions.
Fig. 8. XPS depth profile for Al3Mg2 after 5 min immersion in 0.01 M Na2SO4
solution saturated with Mg(OH)2.
568 M. Liu et al. / Corrosion Science 52 (2010) 562–578
value. This sputter time is marked on Fig. 7. The specimenimmersed 30 s in 0.01 M Na2SO4 saturated with Mg(OH)2, showeda rapid decrease of the O signal, indicating a film thickness of�12 nm in agreement with the data in Fig. 6. After 5 min immer-sion in the same solution, there was a slower decrease of the O sig-nal, which indicated a thicker film (�110 nm) in contrast to thedata of Fig. 6, which indicated a constant film thickness for immer-sion periods up to �210 s. The O, Al and Mg curves were similar inboth 0.01 M Na2SO4 solutions indicating similar compositions andthickness, independent of the pH.
Fig. 8 presents a more detailed XPS depth profile, includingchemical state data, for Al3Mg2 immersed for 5 min in 0.01 M
Na2SO4 saturated with Mg(OH)2. The metallic Al peak was firstdetected after 600 s sputtering whereas the metallic Mg peakwas detected only after 1200 s sputtering. Moreover, the metallicAl peak increased rapidly with sputtering time whereas the metal-lic Mg peak increased more slowly. Oxidized Al3+ and O2� peakareas were significant for sputtering time ranging between 500 sand 2500 s, corresponding to the surface layer. For these sputteringtimes, the oxidized Mg2+ peak decreased slowly.
3.4. Preferential dissolution
Table 3 presents evidence, from the quantitative XPS analysis, ofpreferential Mg dissolution at the interface of the Al3Mg2 intermetal-lic. The composition was AlMg0.2 to AlMg0.3 which corresponds to avalue between 3 and 5 for the ratio RAl/Mg = DI
Al=DIMg = (the concentra-
tion of metallic Al in the interface)/(the concentration of metallicMg) compared with a ratio of 1.5 for Al3Mg2. To further explore pref-erential Mg dissolution, Fig. 9 presents the ratio, RAl/Mg, evaluatedfrom the XPS peaks, and plotted as a function of sputtering time.There is an acceptable error in this ratio provided the metallic Mgpeak is of sufficient size; as a consequence data were only used ifthe atomic percentage of metallic Mg was more than 0.5%. Fig. 9 alsoincludes an indication of the location of the interface in each case,evaluated from the time at which the depth profile reached 1
2 themaximum oxygen concentration. Fig. 9 shows that for the MG sam-ple, after 30 s immersion in 0.01 M Na2SO4 solution saturated withMg(OH)2, the value of the RAl/Mg ratio was�2.3 for 1000 s of sputter-ing; that corresponded to a depth of�50 nm. For the MG sample im-mersed during 5 min in the 0.01 M Na2SO4 solution saturated withMg(OH)2, the RAl/Mg ratio decreased from 5 after 1200 s of sputteringto 2.5 after 2400 s of sputtering. For longer sputtering times, the RAl/
Mg ratio remained constant at�2. There was similarly a high value ofthe RAl/Mg ratio for the the MG sample after 30 s anodic polarizationin 0.01 M Na2SO4 solution saturated with Mg(OH)2.
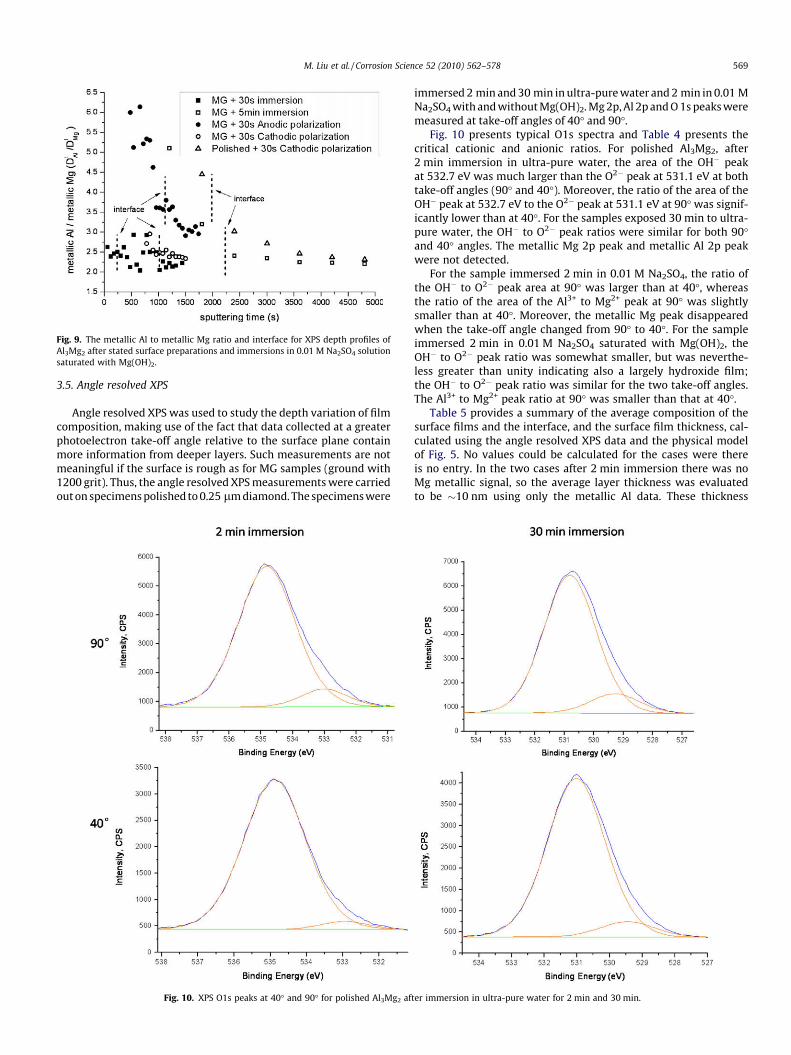
Fig. 9. The metallic Al to metallic Mg ratio and interface for XPS depth profiles ofAl3Mg2 after stated surface preparations and immersions in 0.01 M Na2SO4 solutionsaturated with Mg(OH)2.
M. Liu et al. / Corrosion Science 52 (2010) 562–578 569
3.5. Angle resolved XPS
Angle resolved XPS was used to study the depth variation of filmcomposition, making use of the fact that data collected at a greaterphotoelectron take-off angle relative to the surface plane containmore information from deeper layers. Such measurements are notmeaningful if the surface is rough as for MG samples (ground with1200 grit). Thus, the angle resolved XPS measurements were carriedout on specimens polished to 0.25 lm diamond. The specimens were
Fig. 10. XPS O1s peaks at 40� and 90� for polished Al3Mg2 af
immersed 2 min and 30 min in ultra-pure water and 2 min in 0.01 MNa2SO4 with and without Mg(OH)2. Mg 2p, Al 2p and O 1s peaks weremeasured at take-off angles of 40� and 90�.
Fig. 10 presents typical O1s spectra and Table 4 presents thecritical cationic and anionic ratios. For polished Al3Mg2, after2 min immersion in ultra-pure water, the area of the OH� peakat 532.7 eV was much larger than the O2� peak at 531.1 eV at bothtake-off angles (90� and 40�). Moreover, the ratio of the area of theOH� peak at 532.7 eV to the O2� peak at 531.1 eV at 90� was signif-icantly lower than at 40�. For the samples exposed 30 min to ultra-pure water, the OH� to O2� peak ratios were similar for both 90�and 40� angles. The metallic Mg 2p peak and metallic Al 2p peakwere not detected.
For the sample immersed 2 min in 0.01 M Na2SO4, the ratio ofthe OH� to O2� peak area at 90� was larger than at 40�, whereasthe ratio of the area of the Al3+ to Mg2+ peak at 90� was slightlysmaller than at 40�. Moreover, the metallic Mg peak disappearedwhen the take-off angle changed from 90� to 40�. For the sampleimmersed 2 min in 0.01 M Na2SO4 saturated with Mg(OH)2, theOH� to O2� peak ratio was somewhat smaller, but was neverthe-less greater than unity indicating also a largely hydroxide film;the OH� to O2� peak ratio was similar for the two take-off angles.The Al3+ to Mg2+ peak ratio at 90� was smaller than that at 40�.
Table 5 provides a summary of the average composition of thesurface films and the interface, and the surface film thickness, cal-culated using the angle resolved XPS data and the physical modelof Fig. 5. No values could be calculated for the cases were thereis no entry. In the two cases after 2 min immersion there was noMg metallic signal, so the average layer thickness was evaluatedto be �10 nm using only the metallic Al data. These thickness
ter immersion in ultra-pure water for 2 min and 30 min.
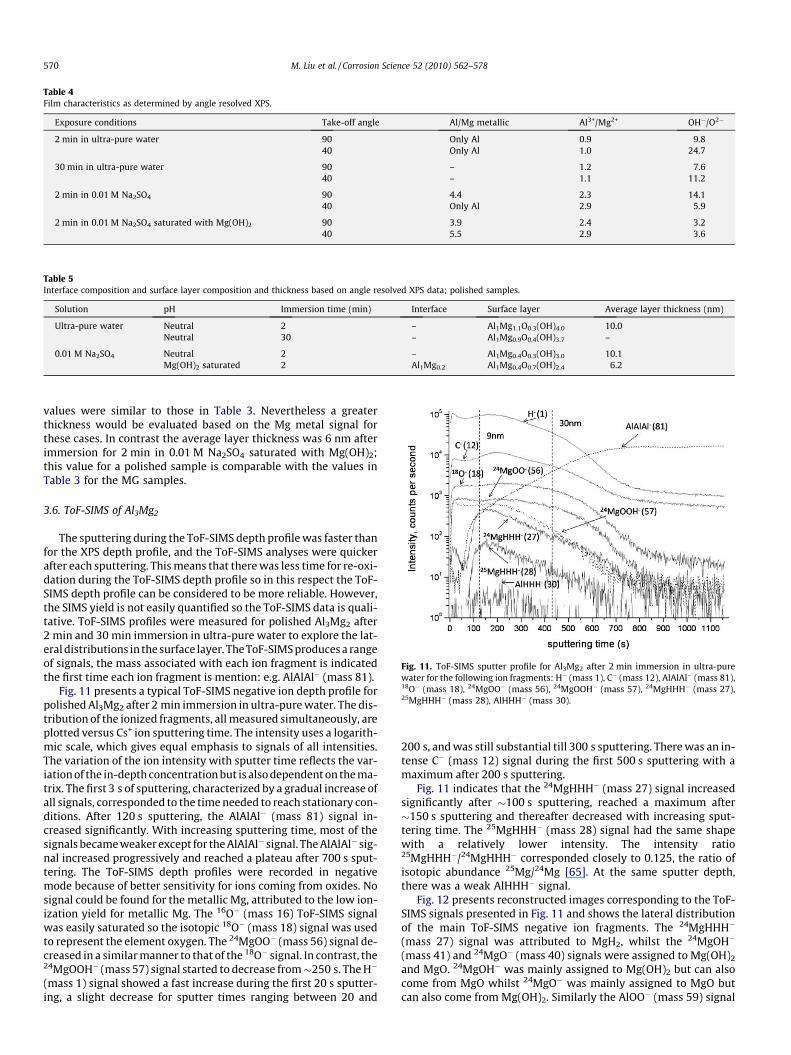
Table 4Film characteristics as determined by angle resolved XPS.
Exposure conditions Take-off angle Al/Mg metallic Al3+/Mg2+ OH�/O2�
2 min in ultra-pure water 90 Only Al 0.9 9.840 Only Al 1.0 24.7
30 min in ultra-pure water 90 – 1.2 7.640 – 1.1 11.2
2 min in 0.01 M Na2SO4 90 4.4 2.3 14.140 Only Al 2.9 5.9
2 min in 0.01 M Na2SO4 saturated with Mg(OH)2 90 3.9 2.4 3.240 5.5 2.9 3.6
Table 5Interface composition and surface layer composition and thickness based on angle resolved XPS data; polished samples.
Solution pH Immersion time (min) Interface Surface layer Average layer thickness (nm)
Ultra-pure water Neutral 2 – Al1Mg1.1O0.3(OH)4.0 10.0Neutral 30 – Al1Mg0.9O0.4(OH)3.7 –
0.01 M Na2SO4 Neutral 2 – Al1Mg0.4O0.3(OH)3.0 10.1Mg(OH)2 saturated 2 Al1Mg0.2 Al1Mg0.4O0.7(OH)2.4 6.2
Fig. 11. ToF-SIMS sputter profile for Al3Mg2 after 2 min immersion in ultra-purewater for the following ion fragments: H� (mass 1), C� (mass 12), AlAlAl� (mass 81),18O� (mass 18), 24MgOO� (mass 56), 24MgOOH� (mass 57), 24MgHHH� (mass 27),25MgHHH� (mass 28), AlHHH� (mass 30).
570 M. Liu et al. / Corrosion Science 52 (2010) 562–578
values were similar to those in Table 3. Nevertheless a greaterthickness would be evaluated based on the Mg metal signal forthese cases. In contrast the average layer thickness was 6 nm afterimmersion for 2 min in 0.01 M Na2SO4 saturated with Mg(OH)2;this value for a polished sample is comparable with the values inTable 3 for the MG samples.
3.6. ToF-SIMS of Al3Mg2
The sputtering during the ToF-SIMS depth profile was faster thanfor the XPS depth profile, and the ToF-SIMS analyses were quickerafter each sputtering. This means that there was less time for re-oxi-dation during the ToF-SIMS depth profile so in this respect the ToF-SIMS depth profile can be considered to be more reliable. However,the SIMS yield is not easily quantified so the ToF-SIMS data is quali-tative. ToF-SIMS profiles were measured for polished Al3Mg2 after2 min and 30 min immersion in ultra-pure water to explore the lat-eral distributions in the surface layer. The ToF-SIMS produces a rangeof signals, the mass associated with each ion fragment is indicatedthe first time each ion fragment is mention: e.g. AlAlAl� (mass 81).
Fig. 11 presents a typical ToF-SIMS negative ion depth profile forpolished Al3Mg2 after 2 min immersion in ultra-pure water. The dis-tribution of the ionized fragments, all measured simultaneously, areplotted versus Cs+ ion sputtering time. The intensity uses a logarith-mic scale, which gives equal emphasis to signals of all intensities.The variation of the ion intensity with sputter time reflects the var-iation of the in-depth concentration but is also dependent on the ma-trix. The first 3 s of sputtering, characterized by a gradual increase ofall signals, corresponded to the time needed to reach stationary con-ditions. After 120 s sputtering, the AlAlAl� (mass 81) signal in-creased significantly. With increasing sputtering time, most of thesignals became weaker except for the AlAlAl� signal. The AlAlAl� sig-nal increased progressively and reached a plateau after 700 s sput-tering. The ToF-SIMS depth profiles were recorded in negativemode because of better sensitivity for ions coming from oxides. Nosignal could be found for the metallic Mg, attributed to the low ion-ization yield for metallic Mg. The 16O� (mass 16) ToF-SIMS signalwas easily saturated so the isotopic 18O� (mass 18) signal was usedto represent the element oxygen. The 24MgOO� (mass 56) signal de-creased in a similar manner to that of the 18O� signal. In contrast, the24MgOOH� (mass 57) signal started to decrease from�250 s. The H�
(mass 1) signal showed a fast increase during the first 20 s sputter-ing, a slight decrease for sputter times ranging between 20 and
200 s, and was still substantial till 300 s sputtering. There was an in-tense C� (mass 12) signal during the first 500 s sputtering with amaximum after 200 s sputtering.
Fig. 11 indicates that the 24MgHHH� (mass 27) signal increasedsignificantly after �100 s sputtering, reached a maximum after�150 s sputtering and thereafter decreased with increasing sput-tering time. The 25MgHHH� (mass 28) signal had the same shapewith a relatively lower intensity. The intensity ratio25MgHHH�/24MgHHH� corresponded closely to 0.125, the ratio ofisotopic abundance 25Mg/24Mg [65]. At the same sputter depth,there was a weak AlHHH� signal.
Fig. 12 presents reconstructed images corresponding to the ToF-SIMS signals presented in Fig. 11 and shows the lateral distributionof the main ToF-SIMS negative ion fragments. The 24MgHHH�
(mass 27) signal was attributed to MgH2, whilst the 24MgOH�
(mass 41) and 24MgO� (mass 40) signals were assigned to Mg(OH)2
and MgO. 24MgOH� was mainly assigned to Mg(OH)2 but can alsocome from MgO whilst 24MgO� was mainly assigned to MgO butcan also come from Mg(OH)2. Similarly the AlOO� (mass 59) signal
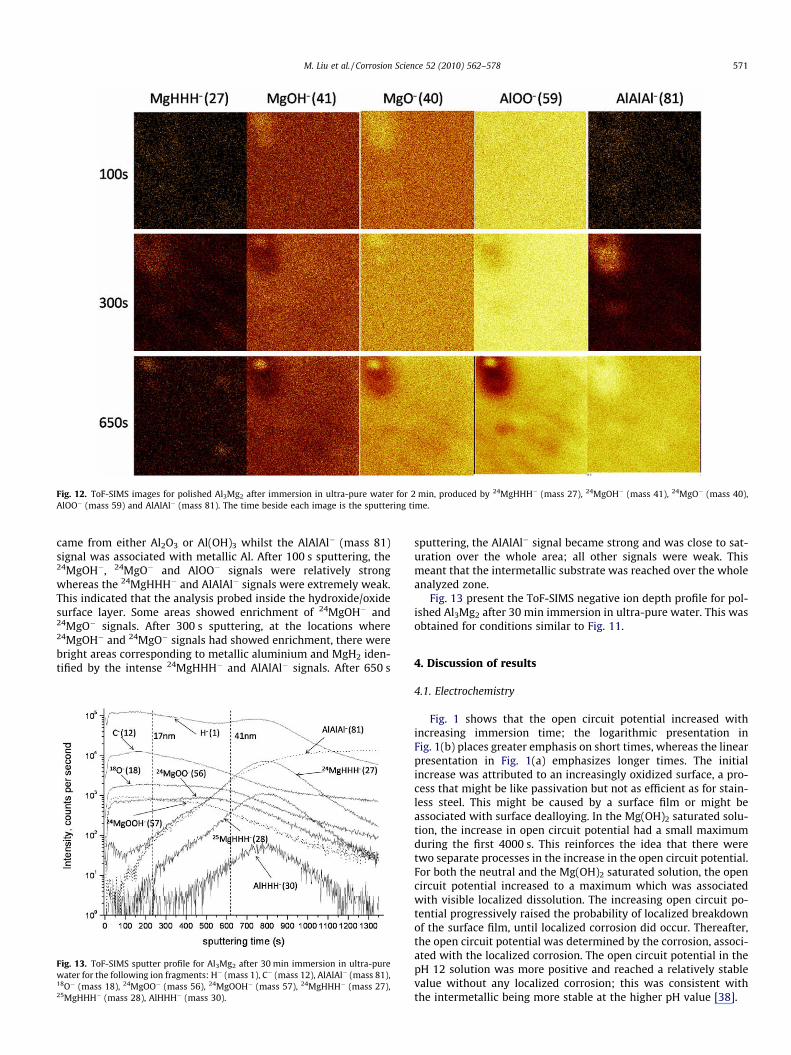
Fig. 12. ToF-SIMS images for polished Al3Mg2 after immersion in ultra-pure water for 2 min, produced by 24MgHHH� (mass 27), 24MgOH� (mass 41), 24MgO� (mass 40),AlOO� (mass 59) and AlAlAl� (mass 81). The time beside each image is the sputtering time.
M. Liu et al. / Corrosion Science 52 (2010) 562–578 571
came from either Al2O3 or Al(OH)3 whilst the AlAlAl� (mass 81)signal was associated with metallic Al. After 100 s sputtering, the24MgOH�, 24MgO� and AlOO� signals were relatively strongwhereas the 24MgHHH� and AlAlAl� signals were extremely weak.This indicated that the analysis probed inside the hydroxide/oxidesurface layer. Some areas showed enrichment of 24MgOH� and24MgO� signals. After 300 s sputtering, at the locations where24MgOH� and 24MgO� signals had showed enrichment, there werebright areas corresponding to metallic aluminium and MgH2 iden-tified by the intense 24MgHHH� and AlAlAl� signals. After 650 s
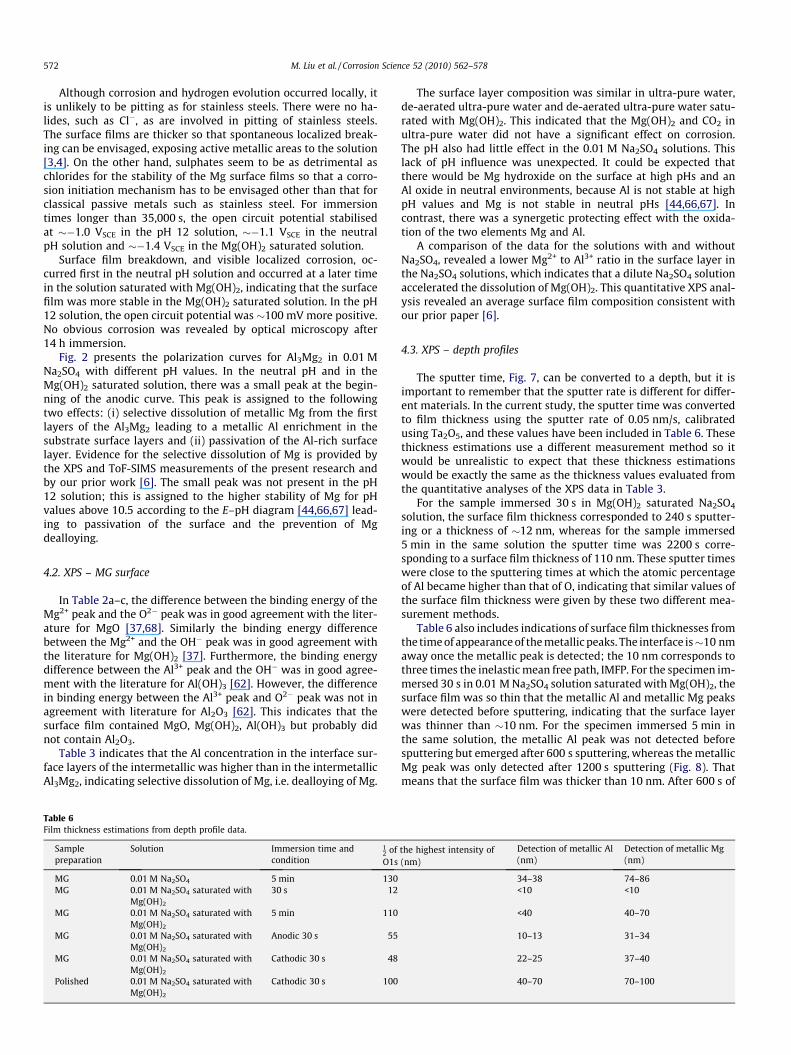
Fig. 13. ToF-SIMS sputter profile for Al3Mg2 after 30 min immersion in ultra-purewater for the following ion fragments: H� (mass 1), C� (mass 12), AlAlAl� (mass 81),18O� (mass 18), 24MgOO� (mass 56), 24MgOOH� (mass 57), 24MgHHH� (mass 27),25MgHHH� (mass 28), AlHHH� (mass 30).
sputtering, the AlAlAl� signal became strong and was close to sat-uration over the whole area; all other signals were weak. Thismeant that the intermetallic substrate was reached over the wholeanalyzed zone.
Fig. 13 present the ToF-SIMS negative ion depth profile for pol-ished Al3Mg2 after 30 min immersion in ultra-pure water. This wasobtained for conditions similar to Fig. 11.
4. Discussion of results
4.1. Electrochemistry
Fig. 1 shows that the open circuit potential increased withincreasing immersion time; the logarithmic presentation inFig. 1(b) places greater emphasis on short times, whereas the linearpresentation in Fig. 1(a) emphasizes longer times. The initialincrease was attributed to an increasingly oxidized surface, a pro-cess that might be like passivation but not as efficient as for stain-less steel. This might be caused by a surface film or might beassociated with surface dealloying. In the Mg(OH)2 saturated solu-tion, the increase in open circuit potential had a small maximumduring the first 4000 s. This reinforces the idea that there weretwo separate processes in the increase in the open circuit potential.For both the neutral and the Mg(OH)2 saturated solution, the opencircuit potential increased to a maximum which was associatedwith visible localized dissolution. The increasing open circuit po-tential progressively raised the probability of localized breakdownof the surface film, until localized corrosion did occur. Thereafter,the open circuit potential was determined by the corrosion, associ-ated with the localized corrosion. The open circuit potential in thepH 12 solution was more positive and reached a relatively stablevalue without any localized corrosion; this was consistent withthe intermetallic being more stable at the higher pH value [38].
572 M. Liu et al. / Corrosion Science 52 (2010) 562–578
Although corrosion and hydrogen evolution occurred locally, itis unlikely to be pitting as for stainless steels. There were no ha-lides, such as Cl�, as are involved in pitting of stainless steels.The surface films are thicker so that spontaneous localized break-ing can be envisaged, exposing active metallic areas to the solution[3,4]. On the other hand, sulphates seem to be as detrimental aschlorides for the stability of the Mg surface films so that a corro-sion initiation mechanism has to be envisaged other than that forclassical passive metals such as stainless steel. For immersiontimes longer than 35,000 s, the open circuit potential stabilisedat ��1.0 VSCE in the pH 12 solution, ��1.1 VSCE in the neutralpH solution and ��1.4 VSCE in the Mg(OH)2 saturated solution.
Surface film breakdown, and visible localized corrosion, oc-curred first in the neutral pH solution and occurred at a later timein the solution saturated with Mg(OH)2, indicating that the surfacefilm was more stable in the Mg(OH)2 saturated solution. In the pH12 solution, the open circuit potential was �100 mV more positive.No obvious corrosion was revealed by optical microscopy after14 h immersion.
Fig. 2 presents the polarization curves for Al3Mg2 in 0.01 MNa2SO4 with different pH values. In the neutral pH and in theMg(OH)2 saturated solution, there was a small peak at the begin-ning of the anodic curve. This peak is assigned to the followingtwo effects: (i) selective dissolution of metallic Mg from the firstlayers of the Al3Mg2 leading to a metallic Al enrichment in thesubstrate surface layers and (ii) passivation of the Al-rich surfacelayer. Evidence for the selective dissolution of Mg is provided bythe XPS and ToF-SIMS measurements of the present research andby our prior work [6]. The small peak was not present in the pH12 solution; this is assigned to the higher stability of Mg for pHvalues above 10.5 according to the E–pH diagram [44,66,67] lead-ing to passivation of the surface and the prevention of Mgdealloying.
4.2. XPS – MG surface
In Table 2a–c, the difference between the binding energy of theMg2+ peak and the O2� peak was in good agreement with the liter-ature for MgO [37,68]. Similarly the binding energy differencebetween the Mg2+ and the OH� peak was in good agreement withthe literature for Mg(OH)2 [37]. Furthermore, the binding energydifference between the Al3+ peak and the OH� was in good agree-ment with the literature for Al(OH)3 [62]. However, the differencein binding energy between the Al3+ peak and O2� peak was not inagreement with literature for Al2O3 [62]. This indicates that thesurface film contained MgO, Mg(OH)2, Al(OH)3 but probably didnot contain Al2O3.
Table 3 indicates that the Al concentration in the interface sur-face layers of the intermetallic was higher than in the intermetallicAl3Mg2, indicating selective dissolution of Mg, i.e. dealloying of Mg.
Table 6Film thickness estimations from depth profile data.
Samplepreparation
Solution Immersion time andcondition
12 ofO1s
MG 0.01 M Na2SO4 5 min 130MG 0.01 M Na2SO4 saturated with
Mg(OH)2
30 s 12
MG 0.01 M Na2SO4 saturated withMg(OH)2
5 min 110
MG 0.01 M Na2SO4 saturated withMg(OH)2
Anodic 30 s 55
MG 0.01 M Na2SO4 saturated withMg(OH)2
Cathodic 30 s 48
Polished 0.01 M Na2SO4 saturated withMg(OH)2
Cathodic 30 s 100
The surface layer composition was similar in ultra-pure water,de-aerated ultra-pure water and de-aerated ultra-pure water satu-rated with Mg(OH)2. This indicated that the Mg(OH)2 and CO2 inultra-pure water did not have a significant effect on corrosion.The pH also had little effect in the 0.01 M Na2SO4 solutions. Thislack of pH influence was unexpected. It could be expected thatthere would be Mg hydroxide on the surface at high pHs and anAl oxide in neutral environments, because Al is not stable at highpH values and Mg is not stable in neutral pHs [44,66,67]. Incontrast, there was a synergetic protecting effect with the oxida-tion of the two elements Mg and Al.
A comparison of the data for the solutions with and withoutNa2SO4, revealed a lower Mg2+ to Al3+ ratio in the surface layer inthe Na2SO4 solutions, which indicates that a dilute Na2SO4 solutionaccelerated the dissolution of Mg(OH)2. This quantitative XPS anal-ysis revealed an average surface film composition consistent withour prior paper [6].
4.3. XPS – depth profiles
The sputter time, Fig. 7, can be converted to a depth, but it isimportant to remember that the sputter rate is different for differ-ent materials. In the current study, the sputter time was convertedto film thickness using the sputter rate of 0.05 nm/s, calibratedusing Ta2O5, and these values have been included in Table 6. Thesethickness estimations use a different measurement method so itwould be unrealistic to expect that these thickness estimationswould be exactly the same as the thickness values evaluated fromthe quantitative analyses of the XPS data in Table 3.
For the sample immersed 30 s in Mg(OH)2 saturated Na2SO4
solution, the surface film thickness corresponded to 240 s sputter-ing or a thickness of �12 nm, whereas for the sample immersed5 min in the same solution the sputter time was 2200 s corre-sponding to a surface film thickness of 110 nm. These sputter timeswere close to the sputtering times at which the atomic percentageof Al became higher than that of O, indicating that similar values ofthe surface film thickness were given by these two different mea-surement methods.
Table 6 also includes indications of surface film thicknesses fromthe time of appearance of the metallic peaks. The interface is�10 nmaway once the metallic peak is detected; the 10 nm corresponds tothree times the inelastic mean free path, IMFP. For the specimen im-mersed 30 s in 0.01 M Na2SO4 solution saturated with Mg(OH)2, thesurface film was so thin that the metallic Al and metallic Mg peakswere detected before sputtering, indicating that the surface layerwas thinner than �10 nm. For the specimen immersed 5 min inthe same solution, the metallic Al peak was not detected beforesputtering but emerged after 600 s sputtering, whereas the metallicMg peak was only detected after 1200 s sputtering (Fig. 8). Thatmeans that the surface film was thicker than 10 nm. After 600 s of
the highest intensity of(nm)
Detection of metallic Al(nm)
Detection of metallic Mg(nm)
34–38 74–86<10 <10
<40 40–70
10–13 31–34
22–25 37–40
40–70 70–100
M. Liu et al. / Corrosion Science 52 (2010) 562–578 573
sputtering, the oxide–hydroxide/metallic interface was �10 nmaway from metallic Al (as determined from the metallic Al signal)whereas the surface was more than 10 nm away from metallic Mg(as determined from the metallic Mg signal). This indicates thatmetallic Al was in the surface film. Similarly, for the specimen im-mersed 5 min in 0.01 M Na2SO4, metallic Al was not detected after480 s sputtering but was detected after 560 s sputtering whereasmetallic Mg was not detected after 1280 s sputtering but was de-tected after 1520 s sputtering; (these curves are not included in thispaper). There was metallic Al closer to the surface than metallic Mgin these cases.
Table 6 summarizes the surface film thickness estimated fromthe depth profile data. For the specimen immersed 30 s in 0.01 MNa2SO4 solution saturated with Mg(OH)2, the surface film thick-ness was �12 nm. This thickness is comparable with that inFig. 6 and Table 3. It is also similar to the thickness determinedin our previous work after 30 s immersion in ultra-pure water [6]in which the surface layer thickness was �9–10 nm for immersiontimes of 30–420 s in ultra-pure water. In contrast, Table 6 indicatesmuch thicker surface films (above 100 nm) for 5 min immersion in0.01 M Na2SO4 independently of the pH. The increased surface filmthickness for long immersion times indicates that the surface hasaccumulated more corrosion product.
In Fig. 8, the OH� peak was significant before sputtering and de-creased rapidly with increasing sputtering time. This indicates that(i) the hydroxide was predominantly in the surface of the layer or(ii) hydroxide was reduced by the sputtering. Reduction of hydrox-ide by sputtering is a well known effect [69,70]. These XPS depthprofile results can be summarized as indicating that the surfacefilm is a fairly homogeneous film of Al oxy–hydroxide containingsome Mg oxy–hydroxide. The upper part of the film has probablymore hydroxide and the inner part is probably more oxide. Thedata do not support a surface film consisting of two distinct layersof hydroxide at the solution interface and oxide in contact with theintermetallic.
4.4. Preferential dissolution
Fig. 9 shows that for the MG sample, after 30 s immersion in0.01 M Na2SO4 solution saturated with Mg(OH)2, the value of theRAl/Mg ratio was �2.3 for 1000 s of sputtering; that correspondedto a depth of �50 nm. This RAl/Mg ratio could indicate selectiveMg dissolution. However, it is much more likely that this RAl/Mg ra-tio was the result of the preferential sputtering of the lighter ele-ment Mg, as reported previously for Mg based alloys containingAl [39,71]. Similarly, there was no appreciable Al enrichment forthe MG sample after 30 s cathodic polarization in 0.01 M Na2SO4
solution saturated with Mg(OH)2. This supports the hypothesisthat Al enrichment was due to selective dissolution of Mg.
For the MG sample immersed during 5 min in the 0.01 M Na2SO4
solution saturated with Mg(OH)2, the RAl/Mg ratio decreased from 5after 1200 s of sputtering to 2.5 after 2400 s of sputtering. For longersputtering times, the RAl/Mg ratio remained constant at�2. The highvalues of the RAl/Mg ratio are interpreted as Al enrichment (i.e. selec-tive dissolution of Mg) just inside the interface whereas the lowerratio (�2) for longer sputtering times is interpreted as the result ofthe Mg preferential sputtering during the depth profile measure-ment. Similarly, there was appreciable Al enrichment just insidethe interface for the MG sample after 30 s anodic polarization in0.01 M Na2SO4 solution saturated with Mg(OH)2.
The polished sample after 30 s cathodic polarization had someAl enrichment just inside the interface. This Al enrichment isattributed to Mg dealloying during the polishing rather than dueto the cathodic treatment, because there was no Al enrichmentfor the MG sample after 30 s cathodic polarization.
4.5. Angle resolved XPS
Table 4 presents the critical cationic and anionic ratios. For pol-ished Al3Mg2, after 2 min immersion in ultra-pure water, the arearatio of the Al3+ to the Mg2+ peak was essentially the same at 90�and 40�. Furthermore, only the metallic Al 2p peak was detected.These data indicated that the surface film was thin (�10 nm),had essentially the same composition of Al3+ and Mg2+ throughout,was largely composed of hydroxide, the oxide concentration wassomewhat higher closer to the surface of the intermetallic andthere was metallic Al in the deeper layers of the surface film. Thisis consistent with the previous results of this study and consistentwith our prior study [6]. For the samples exposed 30 min to ultra-pure water, the OH� to O2� peak ratios were similar for both 90�and 40� angles. The metallic Mg 2p peak and metallic Al 2p peakwere not detected. This suggests that the surface film was thickand that the angle resolved XPS measured only the outer part ofthe film, which was an Al/Mg oxy/hydroxide similar to the outerpart of the film on the specimen exposed 2 min in ultra-pure water.
For the sample immersed 2 min in 0.01 M Na2SO4, the data indi-cated that there was more O2� and Al3+ at the solution interface,more OH� and Mg2+ closer to intermetallic substrate and therewas metallic Al in the deeper layers of the surface film. The surfacefilm was essentially hydroxide, as indicated by the large OH� toO2� peak ratio. For the sample immersed 2 min in 0.01 M Na2SO4
saturated with Mg(OH)2, the data indicated more Al3+ and O2� atthe surface. The ratio of metallic Al/Mg indicated Mg dealloyingand the greater metallic Al/Mg ratio at 40� indicated that therewas metallic Al in the deeper layers of the surface film.
Comparison of the results for immersion of 2 min in the differ-ent solutions indicates that, for immersion in Na2SO4, the surfacelayer had more Al3+ (or less Mg2+) and less hydroxide at the outerlayer in contact with the solution. This is consistent with sulphateions having a destabilising effect on Mg oxy–hydroxide as has al-ready been mentioned in the section presenting the electrochemi-cal results.
Comparison of Tables 6 (polished samples) and 3 (MG samples)indicates that the polished samples produced surface films some-what thicker than the MG samples in some cases and produced asurface film of comparable thickness in one case.
Table 5 indicates that the surface layer composition was similarfor the samples immersed 2 min and 30 min in ultra-pure water.Nevertheless, the film was much thicker after 30 min immersion,so that only the outer part of the surface layer was measured. Thus,the composition of the outer part of the film formed by immersionfor 30 min was similar to the film formed by 2 min immersion. ThisXPS data related to polished specimens. Their surface layer compo-sition was similar to that for MG specimens. This indicates that thesurface film composition was determined by the solution and wasnot dependent on the specimen preparation or initial surfaceroughness. Furthermore, the surface layer composition formed byimmersion in 0.01 M Na2SO4 was similar to that formed by immer-sion in 0.01 M Na2SO4 saturated with Mg(OH)2; and these compo-sitions were similar to those on the MG specimens presented inTable 3.
4.6. ToF-SIMS of Al3Mg2
Fig. 11 presents a typical ToF-SIMS negative ion depth profilefor polished Al3Mg2 after 2 min immersion in ultra-pure water.After 120 s sputtering, the AlAlAl� (mass 81) signal increased sig-nificantly, which indicated that metallic Al was detected. Withincreasing sputtering time, the AlAlAl� signal increased progres-sively and reached a plateau value after 700 s sputtering, indicatingthat the metallic substrate had been reached. The sputtering time,at which the 18O� signal decreased to 2/3 of the highest intensity,
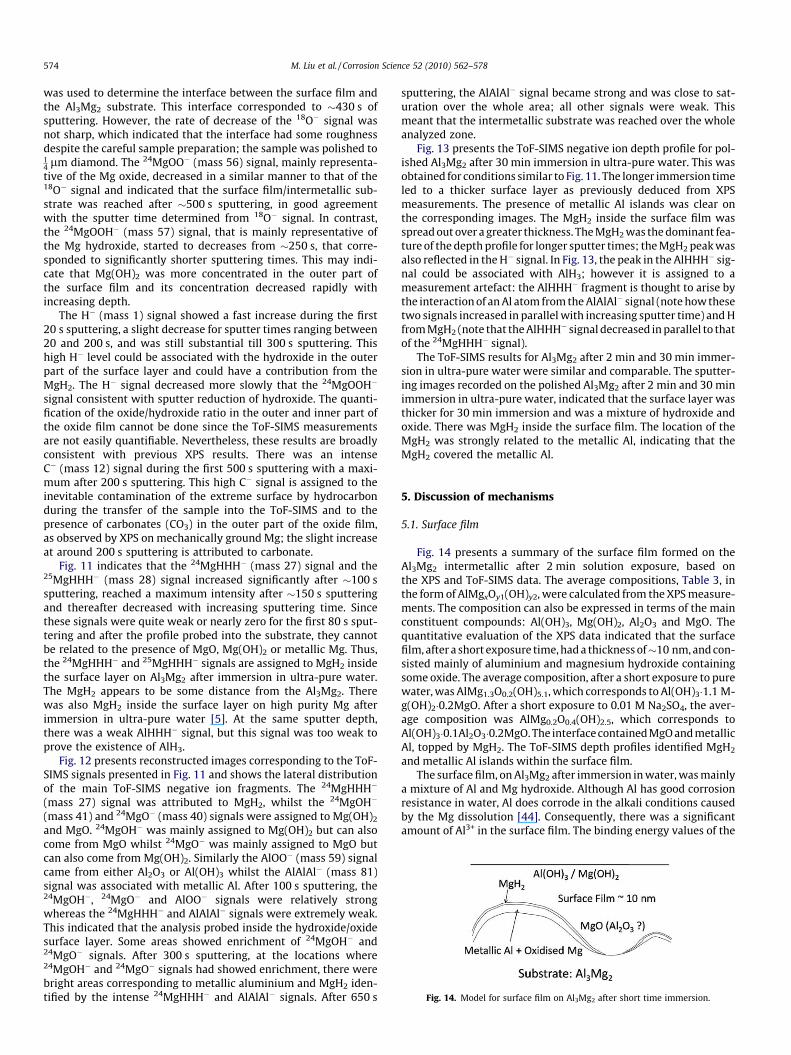
Fig. 14. Model for surface film on Al3Mg2 after short time immersion.
574 M. Liu et al. / Corrosion Science 52 (2010) 562–578
was used to determine the interface between the surface film andthe Al3Mg2 substrate. This interface corresponded to �430 s ofsputtering. However, the rate of decrease of the 18O� signal wasnot sharp, which indicated that the interface had some roughnessdespite the careful sample preparation; the sample was polished to14 lm diamond. The 24MgOO� (mass 56) signal, mainly representa-tive of the Mg oxide, decreased in a similar manner to that of the18O� signal and indicated that the surface film/intermetallic sub-strate was reached after �500 s sputtering, in good agreementwith the sputter time determined from 18O� signal. In contrast,the 24MgOOH� (mass 57) signal, that is mainly representative ofthe Mg hydroxide, started to decreases from �250 s, that corre-sponded to significantly shorter sputtering times. This may indi-cate that Mg(OH)2 was more concentrated in the outer part ofthe surface film and its concentration decreased rapidly withincreasing depth.
The H� (mass 1) signal showed a fast increase during the first20 s sputtering, a slight decrease for sputter times ranging between20 and 200 s, and was still substantial till 300 s sputtering. Thishigh H� level could be associated with the hydroxide in the outerpart of the surface layer and could have a contribution from theMgH2. The H� signal decreased more slowly that the 24MgOOH�
signal consistent with sputter reduction of hydroxide. The quanti-fication of the oxide/hydroxide ratio in the outer and inner part ofthe oxide film cannot be done since the ToF-SIMS measurementsare not easily quantifiable. Nevertheless, these results are broadlyconsistent with previous XPS results. There was an intenseC� (mass 12) signal during the first 500 s sputtering with a maxi-mum after 200 s sputtering. This high C� signal is assigned to theinevitable contamination of the extreme surface by hydrocarbonduring the transfer of the sample into the ToF-SIMS and to thepresence of carbonates (CO3) in the outer part of the oxide film,as observed by XPS on mechanically ground Mg; the slight increaseat around 200 s sputtering is attributed to carbonate.
Fig. 11 indicates that the 24MgHHH� (mass 27) signal and the25MgHHH� (mass 28) signal increased significantly after �100 ssputtering, reached a maximum intensity after �150 s sputteringand thereafter decreased with increasing sputtering time. Sincethese signals were quite weak or nearly zero for the first 80 s sput-tering and after the profile probed into the substrate, they cannotbe related to the presence of MgO, Mg(OH)2 or metallic Mg. Thus,the 24MgHHH� and 25MgHHH� signals are assigned to MgH2 insidethe surface layer on Al3Mg2 after immersion in ultra-pure water.The MgH2 appears to be some distance from the Al3Mg2. Therewas also MgH2 inside the surface layer on high purity Mg afterimmersion in ultra-pure water [5]. At the same sputter depth,there was a weak AlHHH� signal, but this signal was too weak toprove the existence of AlH3.
Fig. 12 presents reconstructed images corresponding to the ToF-SIMS signals presented in Fig. 11 and shows the lateral distributionof the main ToF-SIMS negative ion fragments. The 24MgHHH�
(mass 27) signal was attributed to MgH2, whilst the 24MgOH�
(mass 41) and 24MgO� (mass 40) signals were assigned to Mg(OH)2
and MgO. 24MgOH� was mainly assigned to Mg(OH)2 but can alsocome from MgO whilst 24MgO� was mainly assigned to MgO butcan also come from Mg(OH)2. Similarly the AlOO� (mass 59) signalcame from either Al2O3 or Al(OH)3 whilst the AlAlAl� (mass 81)signal was associated with metallic Al. After 100 s sputtering, the24MgOH�, 24MgO� and AlOO� signals were relatively strongwhereas the 24MgHHH� and AlAlAl� signals were extremely weak.This indicated that the analysis probed inside the hydroxide/oxidesurface layer. Some areas showed enrichment of 24MgOH� and24MgO� signals. After 300 s sputtering, at the locations where24MgOH� and 24MgO� signals had showed enrichment, there werebright areas corresponding to metallic aluminium and MgH2 iden-tified by the intense 24MgHHH� and AlAlAl� signals. After 650 s
sputtering, the AlAlAl� signal became strong and was close to sat-uration over the whole area; all other signals were weak. Thismeant that the intermetallic substrate was reached over the wholeanalyzed zone.
Fig. 13 presents the ToF-SIMS negative ion depth profile for pol-ished Al3Mg2 after 30 min immersion in ultra-pure water. This wasobtained for conditions similar to Fig. 11. The longer immersion timeled to a thicker surface layer as previously deduced from XPSmeasurements. The presence of metallic Al islands was clear onthe corresponding images. The MgH2 inside the surface film wasspread out over a greater thickness. The MgH2 was the dominant fea-ture of the depth profile for longer sputter times; the MgH2 peak wasalso reflected in the H� signal. In Fig. 13, the peak in the AlHHH� sig-nal could be associated with AlH3; however it is assigned to ameasurement artefact: the AlHHH� fragment is thought to arise bythe interaction of an Al atom from the AlAlAl� signal (note how thesetwo signals increased in parallel with increasing sputter time) and Hfrom MgH2 (note that the AlHHH� signal decreased in parallel to thatof the 24MgHHH� signal).
The ToF-SIMS results for Al3Mg2 after 2 min and 30 min immer-sion in ultra-pure water were similar and comparable. The sputter-ing images recorded on the polished Al3Mg2 after 2 min and 30 minimmersion in ultra-pure water, indicated that the surface layer wasthicker for 30 min immersion and was a mixture of hydroxide andoxide. There was MgH2 inside the surface film. The location of theMgH2 was strongly related to the metallic Al, indicating that theMgH2 covered the metallic Al.
5. Discussion of mechanisms
5.1. Surface film
Fig. 14 presents a summary of the surface film formed on theAl3Mg2 intermetallic after 2 min solution exposure, based onthe XPS and ToF-SIMS data. The average compositions, Table 3, inthe form of AlMgxOy1(OH)y2, were calculated from the XPS measure-ments. The composition can also be expressed in terms of the mainconstituent compounds: Al(OH)3, Mg(OH)2, Al2O3 and MgO. Thequantitative evaluation of the XPS data indicated that the surfacefilm, after a short exposure time, had a thickness of�10 nm, and con-sisted mainly of aluminium and magnesium hydroxide containingsome oxide. The average composition, after a short exposure to purewater, was AlMg1.3O0.2(OH)5.1, which corresponds to Al(OH)3�1.1 M-g(OH)2�0.2MgO. After a short exposure to 0.01 M Na2SO4, the aver-age composition was AlMg0.2O0.4(OH)2.5, which corresponds toAl(OH)3�0.1Al2O3�0.2MgO. The interface contained MgO and metallicAl, topped by MgH2. The ToF-SIMS depth profiles identified MgH2
and metallic Al islands within the surface film.The surface film, on Al3Mg2 after immersion in water, was mainly
a mixture of Al and Mg hydroxide. Although Al has good corrosionresistance in water, Al does corrode in the alkali conditions causedby the Mg dissolution [44]. Consequently, there was a significantamount of Al3+ in the surface film. The binding energy values of the
M. Liu et al. / Corrosion Science 52 (2010) 562–578 575
XPS spectra indicated that the oxide corresponded most probably toMg oxide. Nevertheless, Al oxide cannot be completely excluded. TheToF-SIMS 24MgOO� and 24MgOOH� signals, Figs. 11 and 13, indi-cated that the composition changed gradually from hydroxide (outerlayer) to oxide (inner layer) with increasing sputter time, but thequantification of the hydroxide/oxide ratio is made difficult by thesputter induced degradation of hydroxide. Nevertheless, the factthat the composition change was gradual justifies treating the sur-face layer as a single homogenous layer to estimate the chemicalcomposition from the XPS measurements in Tables 3 and 5.
It is relevant to understand why the surface film containsAl(OH)3 rather than Al2O3. Pourbaix [44] indicated that Al2O3 hasthe lowest free energy of the solid oxidized Al phases, and conse-quently is expected to occur during Al corrosion by the anodic par-tial anodic reaction (8) for solutions with neutral pH values.However, for the pH value �10.5 corresponding to the solution sat-urated by Mg(OH)2, it is expected that Al corrodes to produce alu-minate ions by the anodic partial reaction (9). In the other layers ofthe surface film, the aluminate ions are expected to precipitateAl(OH)3 by reaction (10).
The surface layer composition was similar for ultra-pure water,de-aerated ultra-pure water and de-aerated ultra-pure water satu-rated with Mg(OH)2. This implies that dissolved CO2 and Mg(OH)2
do not have significant influence on the corrosion process. Simi-larly, the surface film composition in 0.01 M Na2SO4 was similarto that in 0.01 M Na2SO4 saturated with Mg(OH)2. This is attributedto the dissolution of Mg leading to the local solution becoming sat-urated with Mg(OH)2.
The surface layer composition in ultra-pure water was differentto that in 0.01 M Na2SO4. There was less Mg2+ in the surface layerin sulphate containing solutions. This is most probably due to ahigher solubility of Mg2+ in SO4
2� containing solutions that accel-erates Mg(OH)2 dissolution.
The surface film thickness, calculated from the XPS data for themechanical ground samples, was �10 nm for immersion times upto 210 s in ultra-pure water and in 0.01 M Na2SO4, Tables 3 and 6.This indicates that the surface film formed quickly and inhibits cor-rosion. The surface layer was thicker �100 nm after 5 min immer-sion 0.01 M Na2SO4, Table 6. Comparison of the XPS data for MGand polished samples, Tables 3 and 5, indicated that the polishedsamples produced surface films somewhat thicker than the MGsamples in some cases and produced a surface film of comparablethickness in one case. The thicker surface film could be due to thecontact with water (or equivalent) during sample polishing. Fig. 11shows that the ToF-SIMS depth profile indicated a surface filmsthickness that was somewhat larger on the polished sample. Thisis attributed to a too large value for the estimated sputter ratefor the ToF-SIMS sputter calibration. The ToF-SIMS depth profileson polished samples did show that the surface layer was thickerfor the long immersion time of 30 min.
An interface region was indicated between the surface film andAl3Mg2 bulk substrate. The XPS data indicated that the interfacehad a composition of AlMg0.2 to AlMg0.3, Tables 3 and 5. This indi-cated that metallic Mg was selectively dissolved from the Al3Mg2.Both the XPS and the ToF-SIMS profiles showed a substantial in-crease of the metallic Al concentration once the sputtering pene-trated into the surface film. The ToF-SIMS profiles confirmed theexistence of metallic Al in the interfacial region, and the ToF-SIMSimages revealed that the metallic Al was distributed in islands. TheToF-SIMS negative ion profiles did not provide a signal for metallicMg, so it is not known if the metallic Al islands also containedmetallic Mg.
MgH2 covered metallic Al islands were clearly indicated by theToF-SIMS depth images for polished Al3Mg2 after immersion in ul-tra-pure water, Fig. 12. Similarly, the ToF-SIMS depth profiles, Figs.11 and 13, indicated that MgH2 was inside the surface layer. This
was similar to our previous ToF-SIMS study [5] showing MgH2 in-side the surface film on pure Mg after exposure to ultra-purewater. The MgH2, observed in the present research, is also expectedto be produced by corrosion.
The interface thickness can be estimated from the depth pro-files, e.g. Figs. 8, 9, 11 and 13. In the XPS depth profile, Fig. 9, themetallic Al to metallic Mg ratio became constant after a long sput-tering time. After �4000 s sputtering (�200 nm) it is expected thatthe bulk intermetallic had been reached. There was almost no O1ssignal and the metallic Al/Mg ratio was down to �2; this value washigher than the value of 1.5 that corresponds to Al3Mg2, because ofthe preferential sputtering of the lighter element Mg, as reportedfor Al–Mg alloys [39,71]. Thus a first measure of the thickness ofthe interface layer is �2000 s (�100 nm) sputtering evaluated asthe sputter time from the edge of the surface layer at sputter timeof �2200 s to the sputter time of �4000 s corresponding to havingreached the intermetallic. This analysis indicates that the interfacethickness is comparable or less than the surface layer thickness.Fig. 11 allows a similar analysis. The interface thickness is �270 ssputtering (=700 s at the intermetallic � 430 s at the edge of thesurface layer) or 270/430 = �60% of the thickness of the surfacelayer.
5.2. Formation of MgH2 and metallic Al
The E–pH diagram for the Mg–H2O system produced by Pour-baix [44] did not consider the possibility of MgH2. Pourbaix [44]found that metallic Mg is stable at potentials more negative than��2.4 VSHE and at more positive potentials the stable species wereMg+ and Mg2+. Subsequently, Perrault [66,67] constructed the E–pH diagram for the Mg–H2O system considering MgH2; he foundthat MgH2 can be formed at the metallic Mg surface by the follow-ing cathodic reaction.
Mgþ 2Hþ þ 2e ¼MgH2 ð11Þ
In the present case of Al3Mg2 exposed to water, the Mg atomswould come from the Al3Mg2. Perrault [66,67] found that, forpH < �8, the stable species are as follows: (i) MgH2 is the stable en-tity for a potential more negative than �2.3 VSHE, (ii) the unipositivemagnesium ion, Mg+, is stable for potentials between �2.3 VSHE and�2.07 VSHE and (iii) the dipositive magnesium ion, Mg2+, is stablefor potentials more positive than �2.07 VSHE. Comparison of theE–pH diagrams of Pourbaix [44] and Perrault [66,67] indicates thatMg+ can form by oxidation of metallic Mg at potentials between�2.4 VSHE and �2.3 VSHE, but that MgH2 is the stable species. Thatmeans that there is a thermodynamic driving force for Mg+ to reactto form MgH2 in this potential range.
If MgH2 formed at the surface of the intermetallic Al3Mg2, it canbe formed by the cathodic reaction Eq. (11). If this were the case,one would expect that the concentration of MgH2 would be a max-imum at the Al3Mg2 surface and that the MgH2 concentrationwould decrease from the Al3Mg2 intermetallic surface to thefilm/electrolyte interface, since MgH2 is expected to be decom-posed in the presence of water by following the reaction:
MgH2 þ 2H2O ¼MgðOHÞ2 þ 2H2 ð12Þ
If the maximum of MgH2 is concentrated some distance away fromthe Al3Mg2 intermetallic surface, see Fig. 11, then MgH2 might beproduced at this location. This could occur by a chemical reactionof the unipositive Mg ion, Mg+. Moreover MgH2 is a relatively minorconstituent in the surface film for a short exposure time. This wasalso the case for our prior observation of MgH2 in the surface filmformed on pure Mg after short immersion times in ultra-pure water[5]. This indicates that MgH2 has a minor role in the corrosionmechanism.
576 M. Liu et al. / Corrosion Science 52 (2010) 562–578
Alternatively the formation of MgH2 may be associated withhydrogen produced by the cathodic partial reaction of hydrogenevolution, Eq. (3). It is useful to consider the H fugacity, fH. If it isassumed that Eq. (3) is at equilibrium on the intermetallic surfaceat a potential E, in a solution of a particular pH value, then an esti-mate of the H fugacity, fH, is provided by the Nernst equation[44,58] written in the following form:
fH ¼ k1 expðk2½EH � E�Þ ð13Þwhere k1 and k2 are constants. EH is the H2 evolution reaction refer-ence potential and is equal to the standard hydrogen potential for asolution with pH = 0 and fH = 1 atmosphere. The constant k1 is deter-mined by the fact that fH = 1 atmosphere when [EH � E] = 0. Substitut-ing the numerical value of the free corrosion potential into Eq. (13),gives an estimation of the hydrogen fugacity at the surface of freelycorroding Mg in an aqueous solution. Since the difference [EH � E]is over 1000 mV, the equilibrium H fugacity, fH, is extremely large.Thus the H fugacity (estimated from Eq. (13)) at a Al3Mg2 surface ex-posed to an aqueous solution is expected to be many orders of mag-nitude larger than that for steel exposed to similar media. Thisindicates that there are two possible powerful reducing agents asso-ciated with the corrosion of Al3Mg2 in water:Mg+ and high fugacity H.
Production of both MgH2 and metallic Al is possible by reactionof hydrogen with the intermetallics Mg17Al12 and Al3Mg2 as foundby [72–75]:
Mg17Al12 þ 9H2 ¼ 9MgH2 þ 4Al3Mg2 ð14Þ
4Al3Mg2 þ 8H2 ¼ 8MgH2 þ 12Al ð15Þ
Reactions (14) and (15) were observed [72–75] associated withhydriding at 350 �C in high pressure hydrogen. They indicate thatthese reactions are possible with a high H activity. Thus it is possi-ble that reaction (15) occurs inside the surface film on Al3Mg2 onimmersion in water due to the high fugacity of the hydrogen pro-duced by the cathodic corrosion reaction (3). Metallic Al might alsobe produced by reactions involving the unipositive magnesium ion,Mg+, by the following reaction:
3Mgþ þ Al3þ ¼ Alþ 3Mg2þ ð16Þ
Thus, there are three distinct ways in which MgH2 could form: (i) bya cathodic reaction like Eq. (11) at the Mg metal surface (ii) by achemical reaction from Mg+, or (iii) a direct hydriding of metallicMg by the high fugacity hydrogen produced by the cathodic reac-tion, Eq. (3). Metallic Al may be produced by (i) the reduction ofAl3Mg2 by the high fugacity hydrogen produced by the cathodicreaction or (ii) by reduction of Al3+ by the unipositive Mg+ ion.
5.3. Interface and dealloying
The present study indicates an enrichment of metallic Al and adepletion of Mg in the surface region of the Al3Mg2 intermetallic.The ToF-SIMS images indicate that the metallic Al was distributedas islands. Fig. 2 indicates that the corrosion potential of the interme-tallic Al3Mg2 is between�1.77 and �1.58 VSCE. This potential rangeshould be compared with (i) the equilibrium potential for Mg, whichis�2.6 VSCE for an Mg2+ activity of 1, and (ii) the equilibrium poten-tial for Al which is�1.90 VSCE for an Al3+ activity of 1, and�2.02 VSCE
for an Al3+ activity of 10�6. The corrosion potential of the Al3Mg2
intermetallic (�1.77 to �1.58 VSCE) might indicate the thermody-namic possibility of simultaneous dissolution of both Mg and Al.The much more positive open circuit potentials for the Al3Mg2 inter-metallic, presented in Fig. 1, are interpreted as mixed potentials, dueto partial reactions at a film covered Al3Mg2 surface, and are notinterpreted as being representative for conditions under the surfacefilm where the Al3Mg2 intermetallic may be in contact with ultra-pure water or sulphate solution. This simple analysis would indicate
that the dealloying of the Al3Mg2 intermetallic in the present inves-tigation would occur by the simultaneous dissolution of both Mg andAl, and the subsequent deposition of metallic Al from solution. Thedeposition of metallic Al could occur by the reduction of Al3+ in theinterface; Mg+ and high fugacity H are two possible powerful reduc-ing agents associated with the corrosion of Al3Mg2.
It must however be considered if the corrosion potentials fromFig. 2 represent the conditions under the surface film where theAl3Mg2 intermetallic may be in contact with the ultra-pure wateror the sulphate solution. The corrosion potentials from Fig. 2 aremacroscopic values representative for the filmed surface on theAl3Mg2 intermetallic substrate. There may be a significant poten-tial between the surface of the oxy–hydroxide film and the metallicAl3Mg2 intermetallic substrate in contact with the ultra-pure wateror the sulphate solution. In that case, conditions may be such thatonly Mg can dissolve, because the potential is so low that Al cannotdissolve. As the Mg is selectively dissolved, the Al atoms would un-dergo surface diffusion diffuse to agglomerate into islands. TheseAl islands would be mounds that are Al-rich at their peaks and thathave a composition close to the intermetallic substrate at theirbases. Alternatively, as a complex metallic alloy, Al3Mg2 has a com-plex crystal structure with a lot of atom vacancies that can enhanceatom mobility during dissolution, so that there could be a dealloy-ing mechanism specific to Al3Mg2.
The resulting structure of the surface film is illustrated inFig. 14. There are metallic islands inside the surface film. The out-side part of surface film consisted of Al and Mg hydroxide whilstthere is more MgO inside the surface film. A layer of MgH2 coversthe metallic islands. The top of the metallic islands is essentiallypure Al whilst the composition of the base corresponds to that ofintermetallic substrate. Dealloying would be expected to increasethe surface roughness.
5.4. Corrosion mechanism
The above analysis leads to the following corrosion mechanismfor Al3Mg2. In the neutral solutions, corrosion of Mg produces a lo-cal solution such that the solubility of Mg2+ is exceeded, Mg(OH)2
precipitates and the local pH is �10.5. There is dealloying of Mg, byMg dissolution, and there is lateral surface diffusion of Al into is-lands. There is some dissolution of Al to aluminate ions by Eq.(9), and the aluminate ions precipitate Al(OH)3 in the surface film.The surface film of Al(OH)3 and Mg(OH)2 partially protects the sur-face. In the solutions of pH �10.5 the reactions are essentially thesame. In the pH 12 solution, the surface becomes unreactive be-cause Mg atoms at the surface are converted to a complete surfacecover of Mg(OH)2 by reaction (7).
Mg17Al12 and Al3Mg2 are the two intermetallic phases in theAl–Mg binary phase diagram. By analogy with the above corrosionmechanism for Al3Mg2, it would be expected that Mg dealloyingwould occur in the corrosion of Mg17Al12 under appropriate condi-tions. Mg dealloying of Mg17Al12, under conditions that metallic Alis stable and metallic Mg dissolves, would be expected to lead toAl3Mg2. This follows from the fact that the intermetallic CaZn13
was formed by Mg dealloying during the corrosion of Mg67Zn28Ca5
and Mg60Zn35Ca5 as shown by Zberg et al. [54]. Furthermore, asdealloying typically leads to a nanoporous product [53,57,76,77],it is predicted that the formation of nanoporous Al3Mg2 is possibleby the Mg dealloying of Mg17Al12.
6. Conclusions
1. On the Al3Mg2 intermetallic surface after a short (�2 min)aqueous solution exposure, the quantitative evaluation of theXPS data indicated that the surface film had a thickness of
M. Liu et al. / Corrosion Science 52 (2010) 562–578 577
�10 nm, and consisted of Al and Mg hydroxide containing someoxide. The average composition, after a short exposure to purewater, was AlMg1.3O0.2(OH)5.1, which corresponds toAl(OH)3�1.1 Mg(OH)2�0.2MgO. After a short exposure to 0.01 MNa2SO4, the average composition was AlMg0.2O0.4(OH)2.5, whichcorresponds to Al(OH)3�0.1Al2O3�0.2MgO. The interface con-tained MgO and metallic Al, topped by a thin layer of MgH2.
2. The formation of Al(OH)3 is attributed to a precipitationreaction.
3. ToF-SIMS sputter profiles of polished Al3Mg2 samples immersedin ultra-pure water for longer times revealed a thicker surfacelayer, more pronounced metallic Al islands and much moreMgH2 so that MgH2 was the dominant feature in the surfacefilm close to the Al3Mg2 substrate.
4. There are three distinct ways in which MgH2 could form: (i) bya chemical reaction from Mg+, (ii) by direct hydriding of metal-lic Mg by the high fugacity hydrogen produced by the cathodicreaction, or (iii) by a cathodic reaction at the metal surface likeMg + 2H+ + 2e = MgH2.
5. There was Mg dealloying, assigned to the selective dissolutionof Mg and the surface rearrangement of Al into Al islands.
6. Alternatively, metallic Al may be produced (i) by the reduction ofAl3Mg2 by the high fugacity hydrogen produced by the cathodicreaction or (ii) by reduction of Al3+ by the unipositive Mg+ ion.
Acknowledgements
The work was performed within the frame of the European Net-work of Excellence on Complex Metallic Alloy CMA. The work wassupported by the Australian Research Council, Centre of Excellence,Design of Light Alloys in Australia, CNRS in France and by the Euro-pean Research Commission in the 6th Framework Program underContract No. NMP3-CT-2005-500140. The sample were grownand provided by Feuerbacher of the Jülich Research Center GmbH,Germany. Liu and Atrens would like to thank for the support of theEMPA research program that allowed them to spend considerableperiods in the EMPA laboratories. EMPA is the Swiss Federal Labo-ratories for Materials Testing and Research. Liu and Atrens wouldalso like to thank Ecole Nationale Supérieure de Chimie de Paris(ENSCP) and the Université Pierre et Marie Curie for support thatallowed them to spend considerable periods in the Laboratoirede Physico-Chimie des Surfaces, CNRS-ENSCP (UMR 7045), EcoleNationale Supérieure de Chimie de Paris (ENSCP), 11 rue Pierre etMarie Curie, 75005 Paris, France. The financial support of RegionIle-de-France for the XPS and the ToF-SIMS equipment is acknowl-edged. Aleks D. Atrens is thanked for useful discussions.
References
[1] G. Song, A. Atrens, Recent insights into the mechanism of magnesium corrosionand research suggestions, Advanced Engineering Materials 9 (2007) 177–183.
[2] G. Song, Recent progress in corrosion and protection of magnesium alloys,Advanced Engineering Materials 7 (2005) 563–586.
[3] G. Song, A. Atrens, Understanding magnesium corrosion – a framework forimproved alloy performance, Advanced Engineering Materials 5 (2003) 837–858.
[4] G. Song, A. Atrens, Corrosion mechanisms of magnesium alloys, AdvancedEngineering Materials 1 (1999) 11–33.
[5] A. Seyeux, M. Liu, P. Schmutz, G. Song, A. Atrens, P. Marcus, ToF-SIMS depthprofile of the surface film on pure magnesium formed by immersion in purewater and the identification of magnesium hydride, Corrosion Science 51(2009) 1883–1886.
[6] M. Liu, S. Zanna, H. Ardelean, I. Frateur, P. Schmutz, G. Song, A. Atrens, P.Marcus, A first quantitative XPS study of the surface films formed, by exposureto water, on Mg and on the Mg–Al intermetallics: Al3Mg2 and Mg17Al12,Corrosion Science 51 (2009) 1115–1127.
[7] M. Liu, D. Qiu, M.C. Zhao, G. Song, A. Atrens, The effect of crystallographicorientation on the active corrosion of pure magnesium, Scripta Materialia 58(2008) 421–424.
[8] N. Winzer, A. Atrens, W. Dietzel, G. Song, K.U. Kainer, Comparison of thelinearly increasing stress test and the constant extension rate test in the
evaluation of transgranular stress corrosion cracking of magnesium, MaterialsScience and Engineering A 472 (2008) 97–106.
[9] N. Winzer, A. Atrens, W. Dietzel, G. Song, K.U. Kainer, Fractography of stresscorrosion cracking of Mg–Al alloys, Metallurgical and Materials Transactions A39 (2008) 1157–1173.
[10] N. Winzer, A. Atrens, W. Dietzel, V.S. Raja, G. Song, K.U. Kainer,Characterisation of stress corrosion cracking (SCC) of Mg–Al alloys, MaterialsScience and Engineering A 488 (2008) 339–351.
[11] N. Winzer, A. Atrens, G. Song, E. Ghali, W. Dietzel, K.U. Kainer, N. Hort, C.Blawert, A critical review of the stress corrosion cracking (SCC) of magnesiumalloys, Advanced Engineering Materials 7 (2005) 659–693.
[12] M. Bobby Kannan, W. Dietzel, C. Blawert, A. Atrens, P. Lyon, Stress corrosioncracking of rare-earth containing magnesium alloys ZE41, QE22 and Elektron21 (EV31A) compared with AZ80, Materials Science and Engineering A 480(2008) 529–539.
[13] N. Birbilis, M.A. Easton, A.D. Sudholz, S.M. Zhu, M.A. Gibson, On the corrosionof binary magnesium-rare earth alloys, Corrosion Science 51 (2009) 683–689.
[14] T.L. Chia, M.A. Easton, S.M. Zhu, M.A. Gibson, N. Birbilis, J.F. Nie, The effect ofalloy composition on the microstructure and tensile properties of binary Mg-rare earth alloys, Intermetallics 17 (2009) 481–490.
[15] A.D. Südholz, N. Birbilis, C.J. Bettles, M.A. Gibson, Corrosion behaviour of Mg-alloy AZ91E with atypical alloying additions, Journal of Alloys and Compounds471 (2009) 109–115.
[16] P. Schmutz, G.S. Frankel, Influence of dichromate ions on corrosion of purealuminum and AA2024-T 3 in NaCl solution studied by AFM scratching,Journal of the Electrochemical Society 146 (1999) 4461–4472.
[17] P. Schmutz, G.S. Frankel, Corrosion study of AA2024-T 3 by scanning Kelvinprobe force microscopy and in situ atomic force microscopy scratching,Journal of the Electrochemical Society 145 (1998) 2295–2306.
[18] V. Guillaumin, G. Mankowski, Localized corrosion of 2024 T 351 aluminiumalloy in chloride media, Corrosion Science 41 (1998) 421–438.
[19] K. Spencer, M.X. Zhang, Heat treatment of cold spray coatings to formprotective intermetallic layers, Scripta Materialia 61 (2009) 44–47.
[20] G. Song, A. Atrens, M. Dargusch, Influence of microstructure on the corrosion ofdiecast AZ91D, Corrosion Science 41 (1998) 249–273.
[21] M.-C. Zhao, P. Schmutz, S. Brunner, M. Liu, G.-L. Song, A. Atrens, An exploratorystudy of the corrosion of Mg alloys during interrupted salt spray testing,Corrosion Science 51 (2009) 1277–1292.
[22] M. Liu, P.J. Uggowitzer, A.V. Nagasekhar, P. Schmutz, M. Easton, G.-L. Song, A.Atrens, Calculated phase diagrams and the corrosion of die-cast Mg–Al alloys,Corrosion Science 51 (2009) 602–619.
[23] L.-M. Peng, J.-W. Chang, X.-W. Guo, A. Atrens, W.-J. Ding, Y.-H. Peng, Influenceof heat treatment and microstructure on the corrosion of magnesium alloyMg-10Gd-3Y–0.4Zr, Journal of Applied Electrochemistry 39 (2009) 913–920.
[24] M.-C. Zhao, M. Liu, G.-L. Song, A. Atrens, Influence of pH and chloride ionconcentration on the corrosion of Mg alloy ZE41, Corrosion Science 50 (2008)3168–3178.
[25] M.C. Zhao, M. Liu, G. Song, A. Atrens, Influence of the beta-phase morphology onthe corrosion of the Mg alloy AZ91, Corrosion Science 50 (2008) 1939–1953.
[26] S. Bender, J. Goellner, A. Atrens, Corrosion of AZ91 in 1 N NaCl and themechanism of magnesium corrosion, Advanced Engineering Materials 10(2008) 583–587.
[27] M.C. Zhao, M. Liu, G. Song, A. Atrens, Influence of homogenization annealing ofAZ91 on mechanical properties and corrosion behavior, Advanced EngineeringMaterials 10 (2008) 93–103.
[28] M.C. Zhao, M. Liu, G. Song, A. Atrens, Influence of microstructure on corrosionof As-cast ZE41, Advanced Engineering Materials 10 (2008) 104–111.
[29] G. Wu, Y. Fan, A. Atrens, C. Zhai, W. Ding, Electrochemical behavior ofmagnesium alloys AZ91D, AZCe2, and AZLa1 in chloride and sulfate solutions,Journal of Applied Electrochemistry 38 (2008) 251–257.
[30] J. Chang, L. Peng, X. Guo, A. Atrens, P. Fu, W. Ding, X. Wang, Comparison of thecorrosion behaviour in 5% NaCl solution of Mg alloys NZ30K and AZ91D,Journal of Applied Electrochemistry 38 (2008) 207–214.
[31] M.C. Carroll, P.I. Gouma, M.J. Mills, G.S. Daehn, B.R. Dunbar, Effects of Znadditions on the grain boundary precipitation and corrosion of Al-5083,Scripta Materialia 42 (2000) 335–340.
[32] R. Jones, D. Baer, M. Danielson, J. Vetrano, Role of Mg in the stress corrosioncracking of an Al–Mg alloy, Metallurgical and Materials Transactions A 32(2001) 1699–1711.
[33] J. Searles, P. Gouma, R. Buchheit, Stress corrosion cracking of sensitizedAA5083 (Al–4.5Mg–1.0Mn), Metallurgical and Materials Transactions A 32(2001) 2859–2867.
[34] S. Samson, in: B.C. Giessen (Ed.), Developments in the Structural Chemistry ofAlloy Phases, Plenum Press, New York, 1969, p. 65.
[35] M. Feuerbacher, C. Thomas, J.P.A. Makongo, S. Hoffmann, W. Carrillo-Cabrera,R. Cardoso, Y. Grin, G. Kreiner, J.M. Joubert, T. Schenk, J. Gastaldi, H. Nguyen-Thi, N. Mangelinck-Noel, B. Billia, P. Donnadieu, A. Czyrska-Filemonowicz, A.Zielinska-Lipiec, B. Dubiel, T. Weber, P. Schaub, G. Krauss, V. Gramlich, J.Christensen, S. Lidin, D. Fredrickson, M. Mihalkovic, W. Sikora, J. Malinowski, S.Bruhne, T. Proffen, W. Assmus, M. de Boissieu, F. Bley, J.L. Chemin, J. Schreuer,W. Steurer, The Samson phase, beta-Mg2Al3, revisited, Zeitschrift FurKristallographie 222 (2007) 259–288.
[36] K. Urban, M. Feuerbacher, Structurally complex alloy phases, Journal of Non-Crystalline Solids 334–335 (2004) 143–150.
[37] M. Santamaria, F. Di Quarto, S. Zanna, P. Marcus, Initial surface film onmagnesium metal: a characterization by X-ray photoelectron spectroscopy
578 M. Liu et al. / Corrosion Science 52 (2010) 562–578
(XPS) and photocurrent spectroscopy (PCS), Electrochimica Acta 53 (2007)1314–1324.
[38] B. Mazurkiewicz, The electrochemical behaviour of the Al8Mg5 intermetalliccompound, Corrosion Science 23 (1983) 687–696.
[39] D.R. Baer, J.C.F. Windisch, M.H. Engelhard, M.J. Danielson, R.H. Jones, J.S.Vetrano, Influence of Mg on the corrosion of Al, Journal of Vacuum Science &Technology A: Vacuum, Surfaces, and Films 18 (2000) 131–136.
[40] G. Palasantzas, D.T.L. van Agterveld, J.T.M. De Hosson, Electron beam inducedoxidation of Al–Mg alloy surfaces, Applied Surface Science 191 (2002) 266–272.
[41] A. Atrens, W. Dietzel, The negative difference effect and unipositive Mg,Advanced Engineering Materials 9 (2007) 292–297.
[42] G. Song, A. Atrens, D.S. John, X. Wu, J. Nairn, The anodic dissolution ofmagnesium in chloride and sulphate solutions, Corrosion Science 39 (1997)1981–2004.
[43] G. Song, A. Atrens, D. Stjohn, J. Nairn, Y. Li, The electrochemical corrosion ofpure magnesium in 1 N NaCl, Corrosion Science 39 (1997) 855–875.
[44] M. Pourbaix, Atlas of Electrochemical Equilibria in Aqueous Solutions, NACE,Houston, TX, 1974.
[45] A. Barnes, N.A. Senior, R.C. Newman, Film-induced cleavage of Ag–Au alloys,Metallurgical and Materials Transactions A – Physical Metallurgy andMaterials Science 40A (2009) 58–68.
[46] R.C. Newman, Stress corrosion cracking of noble metals and their alloys insolutions containing cations of the noble metal: review of observationsrelevant to competing models of SCC, Corrosion Science 50 (2008) 1807–1810.
[47] J. Deakin, Z.H. Dong, B. Lynch, R.C. Newman, De-alloying of type 316 stainlesssteel in hot, concentrated sodium hydroxide solution, Corrosion Science 46(2004) 2117–2133.
[48] A. Barnes, R.C. Newman, Progress in testing the film-induced cleavage modelof stress corrosion cracking, Metals Materials and Processes 8 (1996) 211–217.
[49] T. Shahrabi, R.C. Newman, K. Sieradzki, Stress-corrosion cracking of alpha-brass without copper oxidation, Journal of the Electrochemical Society 140(1993) 348–352.
[50] M. Saito, G. S. Smith, R. C. Newman, Testing the film-induced cleavage model ofstress-corrosion cracking in: International Conference to Mark the 20thAnniversary of the UMIST Corrosion-and-Protection-Centre: Advances inCorrosion and Protection, Pergamon-Elsevier Science Ltd., Manchester,United Kingdom, 1992, pp. 411–417.
[51] R.G. Kelly, A.J. Frost, T. Shahrabi, R.C. Newman, Brittle-fracture of an Au/Agalloy induced by a surface-film, Metallurgical Transactions A – PhysicalMetallurgy and Materials Science 22 (1991) 531–541.
[52] K.A. Yasakau, M.L. Zheludkevich, S.V. Lamaka, M.G.S. Ferreira, Role ofintermetallic phases in localized corrosion of AA5083, Electrochimica Acta52 (2007) 7651–7659.
[53] C. Zhao, Z. Qi, X. Wang, Z. Zhang, Fabrication and characterization ofmonolithic nanoporous copper through chemical dealloying of Mg–Cu alloys,Corrosion Science. doi: 10.1016/j.corsci.2009.05.043.
[54] B. Zberg, P.J. Uggowitzer, J.F. Loffler, MgZnCa glasses without clinicallyobservable hydrogen evolution for biodegradable implants, Nature Materials(2009), doi:10.1038/nmat2542 Letter.
[55] H.H. Uhlig, R.W. Revie, Corrosion and Corrosion Control, Wiley, New York,1985.
[56] J. Erlebacher, M.J. Aziz, A. Karma, N. Dimitrov, K. Sieradzki, Evolution ofnanoporosity in dealloying, Nature 410 (2001) 450–453.
[57] J. Erlebacher, An atomistic description of dealloying, Journal of theElectrochemical Society 151 (2004) C614–C626.
[58] D.A. Jones, Principles and Prevention of Corrosion, Upper Saddle River, PrenticeHall, 1996.
[59] H. Okamoto, Al–Mg (aluminum–magnesium), Journal of Phase Equilibria 19(1998) 598.
[60] S. Tanuma, C.J. Powell, D.R. Penn, Calculations of electron inelastic mean freepaths. II. Data for 27 elements over the 50–2000 eV range, Surface andInterface Analysis 17 (1991) 911–926.
[61] J.H. Scofield, Hartree–Slater subshell photoionization cross-sections at 1254and 1487 eV, Journal of Electron Spectroscopy and Related Phenomena 8(1976) 129–137.
[62] J.T. Kloprogge, L.V. Duong, B.J. Wood, R.L. Frost, XPS study of the majorminerals in bauxite: Gibbsite, bayerite and (pseudo-)boehmite, Journal ofColloid and Interface Science 296 (2006) 572–576.
[63] V. Fournier, P. Marcus, I. Olefjord, Oxidation of magnesium, Surface andInterface Analysis 34 (2002) 494–497.
[64] D.R. Cousens, B.J. Wood, J.Q. Wang, A. Atrens, Implications of specimenpreparation and of surface contamination for the measurement of the grainboundary carbon concentration of steels using X-ray microanalysis in an UHVFESTEM, Surface and Interface Analysis 29 (2000) 23–32.
[65] J.R. De Laeter, J.K. Bohlke, P. De Bievre, H. Hidaka, H.S. Peiser, K.J.R. Rosman,P.D.P. Taylor, Atomic weights of the elements: review 2000 (IUPAC technicalreport), Pure and Applied Chemistry 75 (2003) 683–800.
[66] G.G. Perrault, The potential–pH diagram of the magnesium–water system,Journal of Electroanalytical Chemistry 51 (1974) 107–119.
[67] G.G. Perrault, Potentiostatic study of the magnesium electrode in aqueoussolution, Journal of Electroanalytical Chemistry 27 (1970) 47–58.
[68] H.B. Yao, Y. Li, A.T.S. Wee, An XPS investigation of the oxidation/corrosion ofmelt-spun Mg, Applied Surface Science 158 (2000) 112–119.
[69] K.S. Kim, W.E. Baitinger, N. Winograd, X-ray photoelectron spectroscopicstudies of PbO surfaces bombarded with He+, Ne+, Ar+, Xe+ and Kr+, SurfaceScience 55 (1976) 285–290.
[70] S. Hoffmann, in: D. Briggs, M. Seah (Eds.), Practical Surface Analysis, Wiley,Chichester, 1983, pp. 141–179.
[71] S.J. Splinter, N.S. McIntyre, The initial interaction of water vapour with Mg–Alalloy surfaces at room temperature, Surface Science 314 (1994) 157–171.
[72] J.F. Fernández, F. Leardini, J. Bodega, C. Sánchez, J.M. Joubert, F. Cuevas, E.Leroy, M. Baricco, M. Feuerbacher, Interaction of hydrogen with the [beta]-Al3Mg2 complex metallic alloy: experimental reliability of theoreticalpredictions, Journal of Alloys and Compounds 472 (2009) 565–570.
[73] J.C. Crivello, T. Nobuki, S. Kato, M. Abe, T. Kuji, Hydrogen absorption propertiesof the -Mg17Al12 phase and its Al-richer domain, Journal of Alloys andCompounds 446–447 (2007) 157–161.
[74] A. Zaluska, L. Zaluski, J.O. Ström-Olsen, Structure catalysis and atomicreactions on the nano-scale: a systematic approach to metal hydrides forhydrogen storage, Applied Physics A: Materials Science & Processing 72 (2001)157–165.
[75] S. Bouaricha, J.P. Dodelet, D. Guay, J. Huot, S. Boily, R. Schulz, Hydridingbehavior of Mg–Al and leached Mg–Al compounds prepared by high-energyball-milling, Journal of Alloys and Compounds 297 (2000) 282–293.
[76] M. Hakamada, M. Mabuchi, Fabrication of nanoporous palladium by dealloyingand its thermal coarsening, Journal of Alloys and Compounds 479 (2009) 326–329.
[77] M. Hakamada, M. Mabuchi, Preparation of nanoporous Ni and Ni–Cu bydealloying of rolled Ni–Mn and Ni–Cu–Mn alloys, Journal of Alloys andCompounds, Journal of Alloys and Compounds (2009), doi:10.1016/j.jallcom.2009.06.031.
Related Documents