Hindawi Publishing Corporation International Journal of Photoenergy Volume 2008, Article ID 631597, 8 pages doi:10.1155/2008/631597 Research Article Electrochemical Investigation of Doped Titanium Dioxide J. W. J. Hamilton, 1 J. A. Byrne, 1 C. McCullagh, 2 and P. S. M. Dunlop 1 1 Nanotechnology and Integrated BioEngineering Centre (NIBEC), University of Ulster, Jordanstown Campus, Newtownabbey, County Antrim BT37 0QB, Northern Ireland, UK 2 The School of Resources and Environment Engineering (CREE), Faculty of Design and Technology, The Robert Gordon University, Clarke Building, Schoolhill, Aberdeen, AB10 1FR, UK Correspondence should be addressed to J. W. J. Hamilton, [email protected] Received 30 August 2007; Revised 7 January 2008; Accepted 25 January 2008 Recommended by Vincenzo Augugliaro Thin films of transition-metal doped (0.2, 1.0, and 5.0 atom%) TiO 2 were prepared on titanium foil using a sol-gel route catalyzed by ammonium acetate. Dopants investigated were the fourth-period transition metals. The prepared films were characterised by Raman spectroscopy, Auger electron spectroscopy, and photoelectrochemical methods. The films doped with transition metals showed a lower photocurrent response than undoped samples. No major red shift in the photocurrent response spectra of the doped films was observed. A photocurrent response was observed under visible light irradiation of the samples and was potential dependent peaking around −0.3 V (SCE), which is indicative of electron promotion from a filled defect level. Examination of the defect level potential dependence by analysis of the current-time response under chopped illumination at fixed potential (−0.8 V– +1.07 V) gave a good correlation with the potential dependence observed in the visible light irradiation studies. Copyright © 2008 J. W. J. Hamilton et al. This is an open access article distributed under the Creative Commons Attribution License, which permits unrestricted use, distribution, and reproduction in any medium, provided the original work is properly cited. 1. INTRODUCTION The photoactive properties of titanium dioxide (TiO 2 ) have been utilised for two main fields of application: (i) envi- ronmental remediation including water/air purification, and selfcleaning surfaces; (ii) solar energy conversion through photoelectrolytic water splitting to yield hydrogen and oxygen [1–4]. Nanoparticle TiO 2 electrodes have also found application in dye sensitised photovoltaic cells [5, 6]. The reported efficiency of TiO 2 for solar applications in (i) and (ii) above is low due to its wide band-gap (3.0–3.2 eV) requir- ing ultraviolet irradiation (UV). In attempts to increase the solar efficiency by utilising visible light, TiO 2 has been doped with other elements with the aim of producing a red shift in the absorbance spectrum. Transition metal ions are commonly employed dopants due to their strong absorption of visible light and their similar ionic radius to the parent titanium ion. However, studies into the effectiveness of tran- sition metal ions as dopants to improve solar efficiency have reported conflicting results. For example, chromium doping of TiO 2 has been reported to yield both an increase in activity [7–10] and a decrease in activity [11–16]. The majority of dopant studies do report a red shift in the absorption spectra of the doped material, however, this does not necessarily correlate with an increase in photoactivity [13, 17–20]. Unfortunately, there are few publications which report both the photocurrent response and absorption spectra for doped TiO 2 . Where they exist, the results are conflicting, with some researchers reporting a good correlation between the photoactive spectrum and the absorption spectrum [8, 11, 17] while others have not found a correlation [21]. The direct comparison of published results for the effi- ciency of doped TiO 2 photocatalysts is not straightforward as reported materials have been produced using different methods and have been tested under different conditions. For example, if the photocatalytic degradation of a model pollutant is used as the measure of efficacy then changes in surface adsorption, due to changes in surface PZC resulting from doping, may result in an increase in photocatalytic degradation rate of certain organics but not others [15, 22]. Only a few papers discriminate between the effects of the dopant ion energy levels and the dopant ion-induced oxygen defect energy level within band structure. An oxygen defect level is introduced when the dopant has a lower valence than titanium thus leaving oxygen bonding unsatisfied and a new energy level is produced.

Welcome message from author
This document is posted to help you gain knowledge. Please leave a comment to let me know what you think about it! Share it to your friends and learn new things together.
Transcript
Hindawi Publishing CorporationInternational Journal of PhotoenergyVolume 2008, Article ID 631597, 8 pagesdoi:10.1155/2008/631597
Research ArticleElectrochemical Investigation of Doped Titanium Dioxide
J. W. J. Hamilton,1 J. A. Byrne,1 C. McCullagh,2 and P. S. M. Dunlop1
1 Nanotechnology and Integrated BioEngineering Centre (NIBEC), University of Ulster, Jordanstown Campus, Newtownabbey,County Antrim BT37 0QB, Northern Ireland, UK
2 The School of Resources and Environment Engineering (CREE), Faculty of Design and Technology, The Robert Gordon University,Clarke Building, Schoolhill, Aberdeen, AB10 1FR, UK
Correspondence should be addressed to J. W. J. Hamilton, [email protected]
Received 30 August 2007; Revised 7 January 2008; Accepted 25 January 2008
Recommended by Vincenzo Augugliaro
Thin films of transition-metal doped (0.2, 1.0, and 5.0 atom%) TiO2 were prepared on titanium foil using a sol-gel route catalyzedby ammonium acetate. Dopants investigated were the fourth-period transition metals. The prepared films were characterised byRaman spectroscopy, Auger electron spectroscopy, and photoelectrochemical methods. The films doped with transition metalsshowed a lower photocurrent response than undoped samples. No major red shift in the photocurrent response spectra of thedoped films was observed. A photocurrent response was observed under visible light irradiation of the samples and was potentialdependent peaking around −0.3 V (SCE), which is indicative of electron promotion from a filled defect level. Examination of thedefect level potential dependence by analysis of the current-time response under chopped illumination at fixed potential (−0.8 V–+1.07 V) gave a good correlation with the potential dependence observed in the visible light irradiation studies.
Copyright © 2008 J. W. J. Hamilton et al. This is an open access article distributed under the Creative Commons AttributionLicense, which permits unrestricted use, distribution, and reproduction in any medium, provided the original work is properlycited.
1. INTRODUCTION
The photoactive properties of titanium dioxide (TiO2) havebeen utilised for two main fields of application: (i) envi-ronmental remediation including water/air purification, andselfcleaning surfaces; (ii) solar energy conversion throughphotoelectrolytic water splitting to yield hydrogen andoxygen [1–4]. Nanoparticle TiO2 electrodes have also foundapplication in dye sensitised photovoltaic cells [5, 6]. Thereported efficiency of TiO2 for solar applications in (i) and(ii) above is low due to its wide band-gap (3.0–3.2 eV) requir-ing ultraviolet irradiation (UV). In attempts to increasethe solar efficiency by utilising visible light, TiO2 has beendoped with other elements with the aim of producing a redshift in the absorbance spectrum. Transition metal ions arecommonly employed dopants due to their strong absorptionof visible light and their similar ionic radius to the parenttitanium ion. However, studies into the effectiveness of tran-sition metal ions as dopants to improve solar efficiency havereported conflicting results. For example, chromium dopingof TiO2 has been reported to yield both an increase in activity[7–10] and a decrease in activity [11–16]. The majority ofdopant studies do report a red shift in the absorption spectra
of the doped material, however, this does not necessarilycorrelate with an increase in photoactivity [13, 17–20].Unfortunately, there are few publications which report boththe photocurrent response and absorption spectra for dopedTiO2. Where they exist, the results are conflicting, withsome researchers reporting a good correlation between thephotoactive spectrum and the absorption spectrum [8, 11,17] while others have not found a correlation [21].
The direct comparison of published results for the effi-ciency of doped TiO2 photocatalysts is not straightforwardas reported materials have been produced using differentmethods and have been tested under different conditions.For example, if the photocatalytic degradation of a modelpollutant is used as the measure of efficacy then changes insurface adsorption, due to changes in surface PZC resultingfrom doping, may result in an increase in photocatalyticdegradation rate of certain organics but not others [15, 22].
Only a few papers discriminate between the effects of thedopant ion energy levels and the dopant ion-induced oxygendefect energy level within band structure. An oxygen defectlevel is introduced when the dopant has a lower valence thantitanium thus leaving oxygen bonding unsatisfied and a newenergy level is produced.

2 International Journal of Photoenergy
The effect of this induced defect level is difficult tostudy within a single dopant regime. Analysis of the dopantinduced oxygen level within the band structure of platinisedTiO2 was studied by Karakitsou and Verykios using dopantsof different valences to titanium [23]. Using hydrogen evolu-tion as the measure of photoactivity, they reported thatdopants with a valence greater than 4 gave higher activity,and dopants with valence less than 4 had a lower activity, ascompared to the undoped TiO2. The decrease in the pho-toactivity with dopants of valence less than 4 was attributedto an increased rate of charge carrier recombination.
The effect of oxygen defect levels in the TiO2 band stru-cture have previously been reported in literature [24, 25].Siripala and Tomkievicz were the first to examine the effectof these defects on charge transfer at the TiO2 electrolyteinterface [26]. They reported that oxygen defect levels wereresponsible for observed photocurrent using sub-band gapillumination. The sub-band gap photocurrent was onlyobserved between applied potentials of −0.6 V and +0.6 V(SCE). Other workers have reported the generation of oxygendefect states via plasma modification of TiO2 which yieldeda visible photocurrent response [27].
In this work, we report the effect of doping with transi-tion metal ions on changes in UV/Vis absorption spectra,crystal phase, current-potential response, and spectral pho-tocurrent response.
2. EXPERIMENTAL
A sol gel procedure, adapted from the work of Murakamiet al. [28] using ammonium acetate as a catalyst, was usedto prepare TiO2 films. A solution of 0.0973 g ammoniumacetate, in 0.2 cm3 water/15 cm3 butan-1-ol, was added drop-wise to solution of 0.377 g titanium (IV) butoxide in 10 cm3
butan-1-ol. For doped samples, the relevant dopant acetatesalt was added along with the ammonium acetate to give0.2, 1.0, or 5.0 atom% (with respect to titanium). Dopantsinvestigated were V, Cr, Mn, Fe, Co, Ni, and Cu. The resultingtransparent sol gel was stirred for a further 1 hour beforedip coating onto previously cleaned 2 × 2 cm2 titaniumfoil coupons (1.27 × 10⁻² cm thick, Aldrich). Films weredeposited in five coat cycles, drying between coats withan infrared lamp, before annealing at 500◦C in air for 1hour with a temperature ramp rate 1◦C min−1. Electricalcontact was made to the coupons by attaching copper wirewith conductive silver epoxy (Circuit Works, Chemtronics).The contact and coupons were painted with a negativephotoresist (KPR resist, Casio Chemicals) and UV cured,leaving a defined area of TiO2 exposed.
Electrochemical characterisation of samples was per-formed under potentiostatic control (Autolab PGSTAT30) ina one-compartment cell with quartz window, platinum bas-ket counter electrode, and a saturated calomel reference elec-trode (SCE). The supporting electrolyte was 0.1 M sodiumperchlorate, and irradiation was provided from a 1 kW Xearc lamp (ss1000 Spears Robinson) either; unfiltered, with anAM1 filter (to simulate solar conditions) or with a sodiumnitrite filter (λ > 420 nm) for high-intensity visible light.For monochromatic irradiation, a high-intensity monochro-
Table 1: Elemental analysis by AES for Cu and Cr doped TiO2 films.
Sample Cu doped sample 1 atom% precursor
Element Carbon Oxygen Titanium Copper
Before etch 8.65% 75.17% 15.79% 0.39%
After etch 22.86% 52.42% 24.64% 0.09%
Cr doped sample 5 atom% precursor
Element Carbon Oxygen Titanium Chromium
Before etch 13.57% 66.60% 17.63% 2.20%
After etch 11.44% 66.75% 20.21% 1.59%
mator (GM252, set for 10 nm band pass) was positionedbetween the source and the photoreactor. Light intensitywas measured using a calibrated spectral radiometer (JobinYvonne Gemini spectral radiometer). Linear sweep voltam-metry (LSV) was carried scanning from –1.0 V to +1.5 Vwith a scan rate of 10 mV s−1. The current-time responsewas measured at fixed potentials using chopped irradiation(Uniblitz vmm-t1, Vincent Associates). The cell temperaturewas maintained at 25◦C ± 2◦C. The presence or absenceof dissolved oxygen was controlled by sparging with air oroxygen free nitrogen (OFN), respectively. All potentials arereported versus SCE.
Elemental analysis was carried out by Auger electronspectroscopy (AES) (Kratos Φ 660) in a vacuum of 10−6
torr with electrons accelerated from a field-emission sourceat 4 kV accelerating voltage to give a beam current of 2 μA.Depth profiling was achieved using an argon etch.
UV-Vis transmission spectra of films deposited on quartzwere measured using a spectrophotometer (Lambda 11,Perkin Elmer). Optical band-gap values were calculated byextrapolation of the absorption band edge. Crystal phasewas analysed by Raman spectroscopy (LabRam 300, ISAinstruments) by comparing to commercial anatase (99.5%,Aldrich) and rutile (created from predominantly rutilesample (Aldrich) by heating to 800◦C). The source was anargon laser λ = 514 nm. Optimum analysis was performedwith an acquisition time of 5 seconds, averaged over 10accumulations, with the neutral density filter set to 50%.
3. RESULTS AND DISCUSSION
AES measurements indicated that not all of the correspond-ing dopant was incorporated at the hydrolysis stage of sol-gel procedure. Determination of dopant concentrations atinitial precursor levels below 1.0 atom% was not possiblewith the AES system used in this study. Analysis of dopedsamples containing 1.0 atom% and 5.0 atom%, as precursor,confirmed the presence of the dopants (Table 1), however,they were at much lower levels (ca. 40%) than that of theinitial precursor dopant level.
For simplicity, we will continue to refer to percentagedoping of samples as the initial concentration of dopantadded to the sol precursor. Depth profiling of the thin filmsshowed that the dopant species were preferentially located onthe surface with lower concentrations present in the bulk.Additionally, a high proportion of carbon was measured

J. W. J. Hamilton et al. 3
0
10000
20000
30000
40000
50000
60000
Inte
nsi
ty(A
.U.)
50 150 250 350 450 550 650 750
Wavenumber (cm−1)
a
b
cd
Figure 1: Raman spectra of (a) undoped TiO2 film, (b) vanadiumdoped TiO2, (c) commercial anatase powder, (d) commercial rutilepowder (following high-temperature anneal).
which originated from the alkoxide precursor used in thesol-gel process. Carbon was present in all samples includingthe undoped sample.
Figure 1 shows the Raman spectra obtained for a TiO2
film and a TiO2:V film, compared with anatase and rutilepowders. Analysis of the powder samples showed all relevantRaman vibration modes of anatase and rutile correlatingwith previous literature on Raman analysis of TiO2 [29].Comparison of the sol-gel derived thin films showed allsamples to contain the Eg vibrational mode at 144 cm−1
common to both anatase and rutile. However, the rutilesignal at 144 cm−1 is much weaker compared to the anatasesignal. Since the sol-gel film shows a large peak at 144 cm−1
but no other rutile peaks, then we can assume it was predo-minantly anatase. The TiO2:V sample showed peaks presentat 447 cm−1 (Eg) and 612 cm−1 (A1g) representative ofrutile and 519 cm−1 (B1g) representative of an anatasecrystal structure. The spectra of the undoped sample andall other doped samples were almost identical showing apredominantly anatase crystal phase, with the 399 cm−1 and519 cm−1B1g peaks, along with the 639 cm−1Eg peak associ-ated with anatase.
UV-Vis absorption spectroscopy of the doped films, dep-osited on quartz, showed a minor red shift in the absorbancespectra as compared to the undoped film, however, thiswas mainly confined to the region from 250 nm to 350 nm(examples in Figure 2).
With all dopants investigated, an increase in the dopantconcentration resulted in an increase in the absorbancebetween 290 nm and 350 nm with a small increase inabsorbance at wavelengths greater than 350 nm. For example,the change in absorbance with concentration of dopant usingTiO2:Mn is given in Figure 3. Changes in the absorptionband edge, obtained by extrapolation of the UV/Vis absorp-tion data, were in the range of 0.01–0.25 eV. The error inthese calculations was not acceptable and therefore we do notreport the band-gap values.
The photoelectrochemical characterisation of the filmsusing linear sweep voltammetry (LSV) showed a typical n-type semiconductor response with negligible anodic current
0
0.2
0.4
0.6
0.8
1
1.2
1.4
Abs
orba
nce
200 220 240 260 280 300 320 340
Wavelenght (nm)
a
b
c
d
UndopedVanadium
ChromiumManganese
Figure 2: UV/Vis absorption spectra of doped TiO2 films (a) V0.2 atom%, (b) Cr 0.2 atom%, (c) Mn 0.2 atom%, (d) undopedTiO2.
0
0.2
0.4
0.6
0.8
1
1.2
1.4A
bsor
ban
ce
250 270 290 310 330 350 370 390 410 430 450
Wavelenght (nm)
a
b
cd
Undoped0.2 atom %
1 atom %5 atom %
Figure 3: UV/Vis absorbance versus dopant concentration forTiO2:Mn (a) 5 atom%, (b) 1 atom%, (c) 0.2 atom%, (d) undoped.
in the dark and a significant increase in the anodic currentunder AM1 solar simulated irradiation (Figure 4).
The photocurrent was dependent on the applied poten-tial, and the undoped TiO2 sample showed a larger photocur-rent response than any of the doped samples. Furthermore,a decrease in photocurrent with increasing dopant concen-tration was observed with all doped samples. Air sparging ofthe electrolyte prior to LSV resulted in a positive shift in theonset potential for anodic current (Figure 5 and Table 2).
The photocurrent response spectra of these filmswere obtained using chopped monochromatic illumination(10 nm band pass). The spectral current-time response forthe undoped TiO2 electrode is given in Figure 6. The incidentphoton conversion efficiency (IPCE) was calculated by
%IPCE = J
I0F× 100, (1)

4 International Journal of Photoenergy
−2
−1
0
1
2
3
4I (mA)
−1 −0.5 0 0.5 1 1.5
E (V)
ab
c
d
e
Figure 4: Linear sweep voltammograms under AM1 solar sim-ulated irradiation for doped TiO2 films (0.5 atom% dopant) (a)undoped, (b) Fe, (c) Co, (d) Ni, (e) dark response for undoped film.
−1
−0.5
0
0.5
1
1.5
2I (mA)
−1 −0.5 0 0.5 1 1.5
E (V)
a
b
cd
Figure 5: Effect of electrolyte air sparging on the I-E responsefor TiO2:Cr (0.2 atom%) under unfiltered irradiation (a) light,following air sparging, (b) light, following nitrogen sparging, (c)dark, following air sparging, (d) dark, following nitrogen sparging(SR = 10 mV s−1).
where J is the photocurrent density, I0 is the incident lightintensity, and F is Faraday’s constant.
The %IPCE versus wavelength is given in Figure 7.The monochromatic light intensity was a limiting factor inthese experiments yielding very low photocurrents. A smallphotocurrent response at wavelengths above 400 nm wasobserved for a number of samples (see Figure 6), however,a change in current less than three times the deviation of thebackground current (i.e., 30 nA) was not taken as significant.The doped samples exhibited no red shift in the %IPCEcompared to the undoped TiO2.
To overcome the limitations of the low light intensityof the monochromatic source, the photocurrent responsewas measured under visible excitation using a NaNO2 filter(λ ≥ 410 nm) with the Xe source. All samples showed a pho-tocurrent response under sub-band gap irradiation whichwas dependent on applied potential with the photocurrentmaxima observed between −0.5 and −0.1 V (see Figure 8).
Table 2: Anodic photocurrent onset potential for different prepara-tions in the presence of oxygen (the undoped sample gave an onsetpotential of –0.8 V).
Onset potential (V)
Dopant 0.2 atom% 1.0 atom% 5.0 atom%
Vanadium −0.49 −0.47 −0.46
Chromium −0.48 −0.48 −0.45
Manganese −0.47 −0.45 −0.41
Iron −0.56 −0.45 −0.49
Cobalt −0.58 −0.44 −0.45
Nickel −0.52 −0.49 −0.44
Copper −0.67 −0.56 −0.54
Table 3: Photoelectrochemical data for undoped and 0.5 atom%doped TiO2 films under visible irradiation.
DopantOnset poten-tial for anodiccurrent (V)
Peakpotential (V)
Photocurrent atpeak potential(mA)
None −0.71 −0.19 0.038
Vanadium −0.51 −0.24 0.049
Chromium −0.49 −0.26 0.051
Manganese −0.53 −0.30 0.070
Iron −0.51 −0.22 0.044
Cobalt −0.60 −0.31 0.076
Nickel −0.53 −0.35 0.066
Copper −0.62 −0.30 0.062
The peak potentials and onset potentials for anodic currentare given in Table 3. AES analysis confirmed the presence ofcarbon impurities at high levels and this is common withsol-gel routes employing alkoxide precursors. It has beenpreviously reported that carbon doped TiO2 gives a visibleresponse [30]. All samples contained carbon impurities andthere was a small visible response observed for the undopedTiO2 sample. This visible photocurrent for the undopedsample, which may be due to carbon impurities, is much lessthan that observed for the metal ion dopants (see Figure 8and Table 3). Recently, Asahi et al. [31] reported the carbondefect level to be too low to give an optical transition inthe visible. Changes in the optical or photoactive spectra ofTiO2 due carbon doping have been correlated to an increasein the concentration of Ti3+ stabilised by carbon impurities[32, 33].
The presence of metal ion dopants will result in oxygenvacancy states or single-bonded oxygen (possibly hydroxyl)due to the lower coordination of the dopant with respectto the parent Ti4+. Nakamura et al. [27] reported thatH2 plasma treatment of TiO2 resulted in the formation ofoxygen vacancy states located around 2.02–2.45 eV above thevalence band corresponding to a wavelength between 506and 614 nm. Electrons may be promoted from the valenceband to the vacancy states by visible light excitation. They

J. W. J. Hamilton et al. 5
0
2
4
6
I(m
A)
0 0.1 0.2 0.3 0.4
Time (ks)
10 nm intervals
Light on Light off
Figure 6: Current-time response under chopped irradiation forundoped sample as function of irradiation wavelength from 250to 430 nm (left to right) in 10 nm intervals. Measured in a one-compartment cell with applied potential of +1.0 V and 0.1 Msodium perchlorate as a backing electrolyte with air sparging.
0
1
2
3
4
5
6
7
8
IPC
E(%
)
250 270 290 310 330 350 370 390
Wavelenght (nm)
a
bcd
efg
h
Figure 7: Incident photon to current efficiency for samples dopedto 0.5 atom%. Dopant: (a) none, (b) Fe, (c) Cu, (d) V, (e) Co, (f) Cr,(g) Ni, (h) Mn (measured in a one-compartment cell at an appliedpotential of +1.0 V and 0.1 M sodium perchlorate electrolyte withair sparging).
reported that plasma modification of TiO2 allowed visible-light-driven oxidation of NO.
Siripala and Tomkievicz [26] investigated interactionsbetween photoinduced and dark charge transfer at singlecrystal TiO2-aqueous electrolyte interfaces. They reported asub-band gap irradiation resulted in electron injection fromthe valence band to states in the gap which lie around 0.6 eVbelow the bottom of the conduction band. Carrier excitationthrough such surface states should be much less potentialdependent than carrier excitation through the bulk. Indeedthey report that sub-band gap photocurrent is observed onlybetween−0.5 and +0.4 V (SCE) at pH 6.5 (reported flat bandpotential was ca. −0.8 V). They proposed that the surfacestate was an intermediate of the dark reaction forming TiO2–H, the energy for which lies within the band-gap.
The photocurrent under visible light excitation observedat negative potentials is consistent with previously pub-lished results which attribute this visible response todonor/acceptor energy levels below the conduction bandcaused by surface defects [24–27]. Photocurrent under sub-band gap illumination is only observed in the potentialregion where donor/acceptor energy levels are filled, thatis, more negative than −0.1 V in this case. The presence
−0.1
−0.08
−0.06
−0.04
−0.02
0
0.02
0.04
0.06
0.08
0.1I (mA)
−1 −0.5 0 0.5 1
E (V)
a
b
c
Figure 8: Visible (λ > 410 nm) photocurrent response (a) TiO2:Co0.5 atom%, (b) undoped TiO2, and (c) dark current for undopedTiO2.
−0.5
0
0.5
1
1.5
2
2.53
3.5
Ph
otoc
urr
ent
(mA
)
0 50 100 150 200 250 300 350 400
Time (ks)
Figure 9: Changes in photocurrent transients as a function appliedpotential. Example of undoped sample under polychromatic illu-mination (applied bias from 1.0 V to −1.0 V in 0.2 V steps left toright).
of defect states is usually reported to have a negative effecton photoactivity because they act as recombination centresfor charge carriers. However, under appropriate appliedpotential, these defect levels can act as electron donorstates yielding a photocurrent response under sub-band gapirradiation.
To investigate the potential dependence of these defectlevels, the current-time response of TiO2 electrodes underchopped illumination was examined. Salvador [34] investi-gated the kinetics of recombination involving defects, surfacegroups, and absorbed species, by photocurrent transientmeasurements. Using single crystal TiO2 electrodes, theyreported that the initial photocurrent produced in the instantof illumination (Iph in) decayed with time to a steady state(Iph st) due to recombination on defects and surface states.By plotting the ratio of Iph st/Iph in versus potential, the criticalband bending was determined.
Figures 9 and 10 show examples of transients produced inthis work for the undoped and doped samples, respectively.For the undoped samples, the initial photocurrent spike is
6 International Journal of Photoenergy
−0.2
0
0.2
0.4
0.6
0.8
1
Ph
otoc
urr
ent
(mA
)
0 50 100 150 200 250 300 350 400
Time (s)
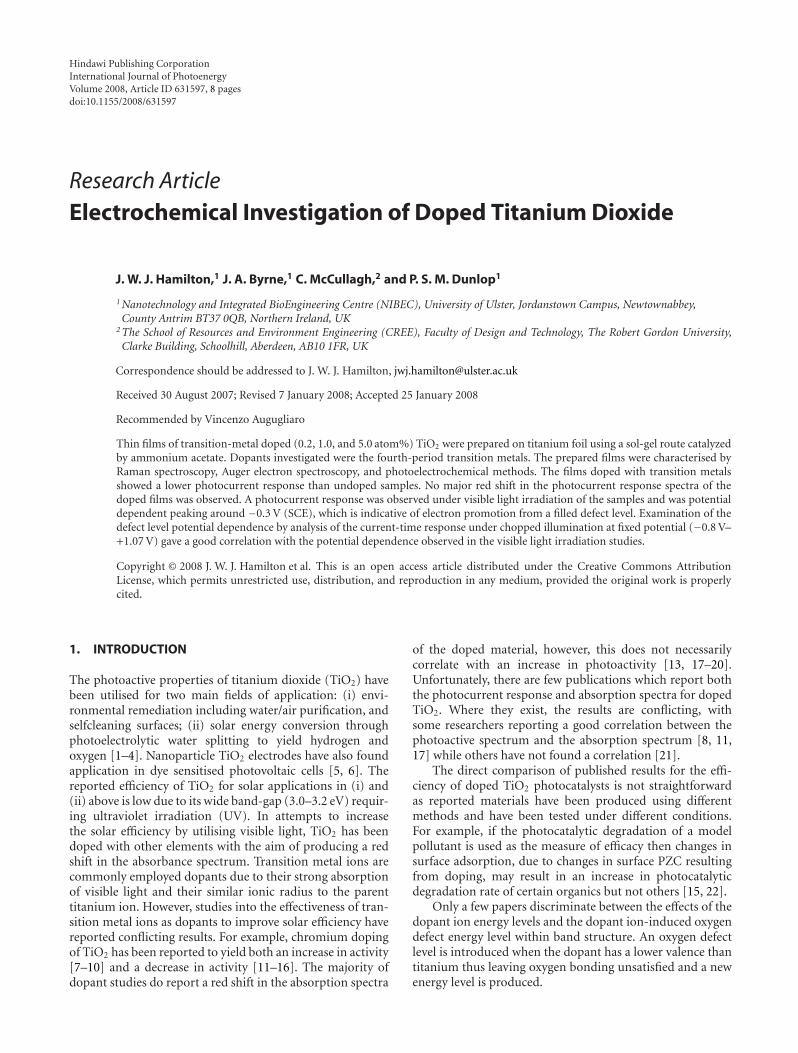
Figure 10: Changes in photocurrent transients as a functionapplied potential. Example of 0.2% chromium doped sample underpolychromatic illumination (applied bias from +1.0 V to −1.0 V in0.2 V steps left to right).
0
0.02
0.04
0.06
0.08
0.1
0.12
0.14
0.16
0.18
I ph
in−I p
hst
(mA
)
−1 −0.8 −0.6 −0.4 −0.2 0 0.2 0.4 0.6 0.8 1
E (V)
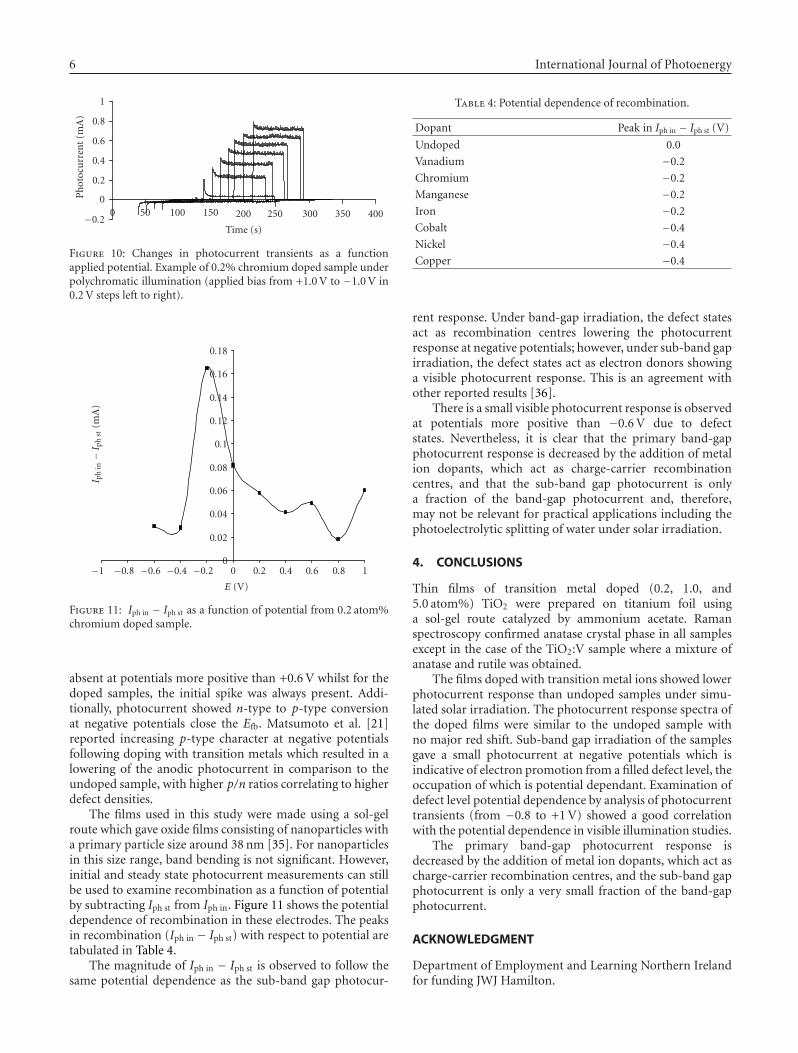
Figure 11: Iph in − Iph st as a function of potential from 0.2 atom%chromium doped sample.
absent at potentials more positive than +0.6 V whilst for thedoped samples, the initial spike was always present. Addi-tionally, photocurrent showed n-type to p-type conversionat negative potentials close the Efb. Matsumoto et al. [21]reported increasing p-type character at negative potentialsfollowing doping with transition metals which resulted in alowering of the anodic photocurrent in comparison to theundoped sample, with higher p/n ratios correlating to higherdefect densities.
The films used in this study were made using a sol-gelroute which gave oxide films consisting of nanoparticles witha primary particle size around 38 nm [35]. For nanoparticlesin this size range, band bending is not significant. However,initial and steady state photocurrent measurements can stillbe used to examine recombination as a function of potentialby subtracting Iph st from Iph in. Figure 11 shows the potentialdependence of recombination in these electrodes. The peaksin recombination (Iph in − Iph st) with respect to potential aretabulated in Table 4.
The magnitude of Iph in − Iph st is observed to follow thesame potential dependence as the sub-band gap photocur-
Table 4: Potential dependence of recombination.
Dopant Peak in Iph in − Iph st (V)
Undoped 0.0
Vanadium −0.2
Chromium −0.2
Manganese −0.2
Iron −0.2
Cobalt −0.4
Nickel −0.4
Copper −0.4
rent response. Under band-gap irradiation, the defect statesact as recombination centres lowering the photocurrentresponse at negative potentials; however, under sub-band gapirradiation, the defect states act as electron donors showinga visible photocurrent response. This is an agreement withother reported results [36].
There is a small visible photocurrent response is observedat potentials more positive than −0.6 V due to defectstates. Nevertheless, it is clear that the primary band-gapphotocurrent response is decreased by the addition of metalion dopants, which act as charge-carrier recombinationcentres, and that the sub-band gap photocurrent is onlya fraction of the band-gap photocurrent and, therefore,may not be relevant for practical applications including thephotoelectrolytic splitting of water under solar irradiation.
4. CONCLUSIONS
Thin films of transition metal doped (0.2, 1.0, and5.0 atom%) TiO2 were prepared on titanium foil usinga sol-gel route catalyzed by ammonium acetate. Ramanspectroscopy confirmed anatase crystal phase in all samplesexcept in the case of the TiO2:V sample where a mixture ofanatase and rutile was obtained.
The films doped with transition metal ions showed lowerphotocurrent response than undoped samples under simu-lated solar irradiation. The photocurrent response spectra ofthe doped films were similar to the undoped sample withno major red shift. Sub-band gap irradiation of the samplesgave a small photocurrent at negative potentials which isindicative of electron promotion from a filled defect level, theoccupation of which is potential dependant. Examination ofdefect level potential dependence by analysis of photocurrenttransients (from −0.8 to +1 V) showed a good correlationwith the potential dependence in visible illumination studies.
The primary band-gap photocurrent response isdecreased by the addition of metal ion dopants, which act ascharge-carrier recombination centres, and the sub-band gapphotocurrent is only a very small fraction of the band-gapphotocurrent.
ACKNOWLEDGMENT
Department of Employment and Learning Northern Irelandfor funding JWJ Hamilton.

J. W. J. Hamilton et al. 7
REFERENCES
[1] A. Mills, R. H. Davies, and D. Worsley, “Water purificationby semiconductor photocatalysis,” Chemical Society Reviews,vol. 22, no. 6, pp. 417–425, 1993.
[2] R. J. Watts, S. Kong, M. P. Orr, G. C. Miller, and B. E. Henry,“Photocatalytic inactivation of coliform bacteria and virusesin secondary waste-water effluent,” Water Research, vol. 29,no. 1, pp. 95–100, 1995.
[3] O. Legrini, E. Oliveros, and A. M. Braun, “Photochemicalprocesses for water treatment,” Chemical Reviews, vol. 93,no. 2, pp. 671–698, 1993.
[4] A. Mills, A. Lepre, N. Elliott, S. Bhopal, I. P. Parkin, and S.A. O’Neill, “Characterisation of the photocatalyst PilkingtonActivTM: a reference film photocatalyst?” Photochemistry andPhotobiology A, vol. 160, no. 3, pp. 213–244, 2003.
[5] B. O’Regan and M. Gratzel, “A low cost, high efficiency solarcell based on dye sensitised colloidal TiO2 films,” Nature,vol. 353, no. 6346, pp. 737–740, 1991.
[6] M. Gratzel, “Photovoltaic and photoelectrochemical conver-sion of solar energy,” Philosophical Transactions of the RoyalSociety A, vol. 365, no. 1853, pp. 993–1005, 2007.
[7] E. Borgarello, J. Kiwi, M. Gratzel, E. Pelizzetti, and M. Visca,“Visible light induced water cleavage in colloidal solutions ofchromium-doped titanium dioxide particles,” Journal of theAmerican Chemical Society, vol. 104, no. 11, pp. 2996–3002,1982.
[8] M. Anpo, “Photocatalysis on titanium oxide catalysts: appro-aches in achieving highly efficient reactions and realizing theuse of visible light,” Catalysis Surveys from Japan, vol. 1, no. 2,pp. 169–179, 1997.
[9] Y. Wang, H. Cheng, Y. Hao, J. Ma, W. Li, and S. Cai, “Photo-electrochemical properties of metal-ion-doped TiO2 nanocr-ystalline electrodes,” Thin Solid Films, vol. 349, no. 1-2, pp.120–125, 1999.
[10] W. Choi, A. Termin, and M. R. Hoffmann, “The role of metal-ion dopants in quantum-sized TiO2: correlation betweenphotoreactivity and charge carrier recombination dynamics,”Journal of Physical Chemistry, vol. 98, no. 51, pp. 13669–13679,1994.
[11] A. Monnier and J. Augustynski, “Photoelectrolysis of water:photoresponses of nickel, chromium and zinc-doped poly-crystalline TiO2 electrodes,” Journal of the ElectrochemicalSociety, vol. 127, no. 7, pp. 1576–1579, 1980.
[12] Z. H. Luo and Q.-H. Gao, “Decrease in the photoactivity ofTiO2 pigment on doping with transition-metals,” Journal ofPhotochemistry and Photobiology A, vol. 63, no. 3, pp. 367–375,1992.
[13] H. Wittmer, St. Holten, H. Kliem, and H. D. Breuer, “Detec-tion of space charge limited currents in nanoscaled titania,”Physica Status Solidi (A), vol. 181, no. 2, pp. 461–469, 2000.
[14] V. Brezova, A. Blazkova, L. Karpinsky, et al., “Phenol decom-position using Mn+/TiO2 photocatalysts supported by the sol-gel technique on glass fibres,” Journal of Photochemistry andPhotobiology A, vol. 109, no. 2, pp. 177–183, 1997.
[15] A. Di Paola, E. Garcıa-Lopez, S. Ikeda, G. Marcı, B. Ohtani,and L. Palmisano, “Photocatalytic degradation of organiccompounds in aqueous systems by transition metal dopedpolycrystalline TiO2,” Catalysis Today, vol. 75, no. 1–4, pp. 87–93, 2002.
[16] J. A. Navıo, J. J. Testa, P. Djedjeian, J. R. Padron, D. Rodrıguez,and M. I. Litter, “Iron-doped titania powders prepared by asol-gel method—part II: photocatalytic properties,” AppliedCatalysis A, vol. 178, no. 2, pp. 191–203, 1999.
[17] T. E. Phillips, K. Moorjani, J. C. Murphy, and T. O. Poehler,“TiO2-VO2 alloys—reduced bandgap effects in the photo-electrolysis of water,” Journal of the Electrochemical Society,vol. 129, no. 6, pp. 1210–1215, 1982.
[18] W. Choi, A. Termin, and M. R. Hoffmann, “Effects of metal-ion dopants on the photocatalytic reactivity of quantum-sizedTiO2 particles,” Angewandte Chemie International Edition inEnglish, vol. 33, no. 10, pp. 1091–1092, 1994.
[19] A. Di Paola, G. Marcı, L. Palmisano, et al., “Preparation ofpolycrystalline TiO2 photocatalysts impregnated with varioustransition metal ions: characterization and photocatalyticactivity for the degradation of 4-nitrophenol,” Journal ofPhysical Chemistry B, vol. 106, no. 3, pp. 637–645, 2002.
[20] D. Dvoranova, V. Brezova, M. Mazur, and M. A. Malati,“Investigations of metal-doped titanium dioxide photocata-lysts,” Applied Catalysis B, vol. 37, no. 2, pp. 91–105, 2002.
[21] Y. Matsumoto, J.-I. Kurimoto, T. Shimizu, and E.-I. Sato,“Photoelectrochemical properties of polycrystalline TiO2
doped with 3d transition-metals,” Journal of the Electrochemi-cal Society, vol. 128, no. 5, pp. 1040–1044, 1981.
[22] K. Wilke and H. D. Breuer, “The influence of transitionmetal doping on the physical and photocatalytic propertiesof titania,” Journal of Photochemistry and Photobiology A,vol. 121, no. 1, pp. 49–53, 1999.
[23] K. E. Karakitsou and X. E. Verykios, “Effects of altervalentcation doping of TiO2 on its performance as a photocatalystfor water cleavage,” Journal of Physical Chemistry, vol. 97, no. 6,pp. 1184–1189, 1993.
[24] V. N. Bogomolov, E. K. Kudinov, D. N. Merlin, and A.Y. Frisov, “Polaron mechanism of light absorption in rutilecrystals,” Soviet Physics—Solid State, vol. 9, pp. 1630–1639,1963.
[25] E. K. Kudinov, D. N. Mirlin, and A. Y. Firsov, “Polaron natureof the current carriers in rutile TiO2,” Soviet Physics—SolidState, vol. 11, pp. 2257–2266, 1970.
[26] W. Siripala and M. Tomkievicz, “Interactions between pho-toinduced and dark charge transfer across n-TiO2-aqueouselectrolyte interface,” Journal of the Electrochemical Society,vol. 129, no. 6, pp. 1240–1245, 1982.
[27] I. Nakamura, N. Negishi, S. Kutsuna, T. Ihara, S. Sugihara, andK. Takeuchi, “Role of oxygen vacancy in the plasma-treatedTiO2 photocatalyst with visible light activity for NO removal,”Journal of Molecular Catalysis A, vol. 161, no. 1-2, pp. 205–212,2000.
[28] Y. Murakami, T. Matsumoto, and Y. Takasu, “Salt catalystscontaining basic anions and acidic cations for the sol-gelprocess of titanium alkoxide: controlling the kinetics anddimensionality of the resultant titanium oxide,” Journal ofPhysical Chemistry B, vol. 103, no. 11, pp. 1836–1840, 1999.
[29] Y.-H. Zhang, C. K. Chan, J. F. Porter, and W. Guo, “Micro-Raman spectroscopic characterization of nanosized TiO2
powders prepared by vapor hydrolysis,” Journal of MaterialsResearch, vol. 13, no. 9, pp. 2602–2609, 1998.
[30] S. Sakthivel and H. Kisch, “Daylight photocatalysis by carbon-modified titanium dioxide,” Angewandte Chemie InternationalEdition, vol. 42, no. 40, pp. 4908–4911, 2003.
[31] R. Asahi, T. Morikawa, T. Ohwaki, K. Aoki, and Y. Taga,“Visible-light photocatalysis in nitrogen-doped titaniumoxides,” Science, vol. 293, no. 5528, pp. 269–271, 2001.
[32] Y. Li, D.-S. Hwang, N. H. Lee, and S.-J. Kim, “Synthesisand characterization of carbon-doped titania as an artificialsolar light sensitive photocatalyst,” Chemical Physics Letters,vol. 404, no. 1–3, pp. 25–29, 2005.
8 International Journal of Photoenergy
[33] X.-Q. Chen, H.-B. Liu, and G.-B. Gu, “Preparation ofnanometer crystalline TiO2 with high photo-catalytic activityby pyrolysis of titanyl organic compounds and photo-catalyticmechanism,” Materials Chemistry and Physics, vol. 91, no. 2-3,pp. 317–324, 2005.
[34] P. Salvador, “Kinetic approach to the photocurrent transientsin water photoelectrolysis at n-TiO2 dioxide electrodes—1: analysis of the ratio of the instantaneous to steady-statephotocurrent,” Journal of Physical Chemistry, vol. 89, no. 18,pp. 3863–3869, 1985.
[35] J. W. J. Hamilton, “Preparation and characterisation ofphoto-anode materials,” Ph.D. thesis, Faculty of Engineering,University of Ulster, Northern Ireland, UK, 2004.
[36] N. Beermann, G. Boschloo, and A. Hagfeldt, “Trapping ofelectrons in nanostructured TiO2 studied by photocurrenttransients,” Journal of Photochemistry and Photobiology A,vol. 152, no. 1–3, pp. 213–218, 2002.
Related Documents