Electrochemical and Spectroscopic Studies of Graphene Nanoflakes with Functionalised Edges Mailis Maria Lounasvuori Thesis submitted in partial fulfilment of the requirements for the degree of Doctor of Philosophy UNIVERSITY COLLEGE LONDON February 2017

Welcome message from author
This document is posted to help you gain knowledge. Please leave a comment to let me know what you think about it! Share it to your friends and learn new things together.
Transcript

Electrochemical and Spectroscopic Studies of
Graphene Nanoflakes with Functionalised Edges
Mailis Maria Lounasvuori
Thesis submitted in partial fulfilment of the requirements for the degree of
Doctor of Philosophy
UNIVERSITY COLLEGE LONDON
February 2017

2
Declaration
I, Mailis Maria Lounasvuori, confirm that the work presented in this thesis is my own.
Where information has been derived from other sources, I confirm that this has been
indicated in the thesis.
Signature: ………………………………………………………………….
Date: ……………………….

3
Abstract
The influence of surface functional groups on the electrochemical performance of
carbon electrodes was studied by using graphene nanoflakes (GNF), a well-defined
carbon nanomaterial. After characterisation with different techniques, GNF were used
to modify a boron-doped diamond (BDD) electrode and the influence of different edge
terminations on various redox probes was investigated using cyclic voltammetry (CV).
The outer-sphere redox probe ferrocenemethanol (FcMeOH) was found to be
unaffected by the presence of GNF at the electrode surface, confirming that GNF do
not inhibit electron transfer. When proton-coupled electron transfer was investigated, it
was shown that the acid-terminated GNF acted as a non-solution proton source and
sink.
The [Fe(CN6)]3−/4− redox couple was found to be quasi-reversible and independent of
electrolyte pH at clean BDD and BDD modified with amide-terminated GNF. When
GNF were decorated with COOH functionalities, the reaction became less reversible
and pH-dependent. The reaction was also directly influenced by the electrolyte
concentration, with low concentrations causing the reaction to become more
irreversible.
Potential-induced dissociation of the carboxylic acid edge groups on GNF was
investigated with in situ spectroelectrochemistry combining potentiostatic control with
attenuated total reflectance Fourier transform infrared spectroscopy (ATR-FTIR).
Applying a negative electrode potential led to the deprotonation of both electrode-
immobilised groups and species in solution. Acid dissociation was driven by an
increase in interfacial cation activity at the electrode surface that lowered the apparent
pKa of all species at or near the electrode.
Different methods of GNF attachment on the electrode surface were explored,
including direct attachment to gold via thiol edge groups and EDC-mediated amidation
reaction to form covalent bonds with a self-assembled monolayer (SAM) on gold.
Scanning tunnelling microscopy (STM) was used to verify the presence and probe the
orientation of GNF at the surface.

4
Contents
Declaration ................................................................................................................... 2
Abstract ....................................................................................................................... 3
Contents ....................................................................................................................... 4
List of Symbols ............................................................................................................. 9
List of Abbreviations ................................................................................................... 11
List of Figures ............................................................................................................. 13
List of Schemes .......................................................................................................... 19
List of Tables .............................................................................................................. 20
List of Appendix Figures ............................................................................................. 22
List of Publications...................................................................................................... 23
1 Introduction.......................................................................................................... 24
1.1 Graphene ..................................................................................................... 24
1.1.1 Graphene synthesis ............................................................................... 28
1.1.2 Graphene Oxide..................................................................................... 30
1.1.3 Graphene Functionalisation ................................................................... 32
1.2 Electrochemistry of Graphene ...................................................................... 33
1.3 Graphene Nanoflakes................................................................................... 36
1.4 Acid-base Properties of Graphene-related Materials..................................... 40
1.4.1 Controlling the Protonation State of Electrode-Immobilised Species ...... 41
1.5 Methods of immobilising GNF on Electrode .................................................. 43
1.5.1 Drop-coating .......................................................................................... 43

Contents
5
1.5.2 Spin-coating........................................................................................... 43
1.5.3 Self-assembly ........................................................................................ 44
1.6 Aim and Scope of the Thesis ........................................................................ 45
References for Chapter 1 ........................................................................................ 47
2 Experimental Theory and Techniques.................................................................. 56
2.1 Electrochemistry ........................................................................................... 56
2.1.1 Cyclic Voltammetry ................................................................................ 59
2.1.2 Differential Pulse Voltammetry ............................................................... 61
2.2 Infrared Spectroscopy................................................................................... 64
2.2.1 Attenuated Total Reflectance................................................................. 66
2.3 Scanning Tunnelling Microscopy .................................................................. 68
2.4 X-ray Photoelectron Spectroscopy................................................................ 70
2.5 Transmission Electron Microscopy ............................................................... 71
References for Chapter 2 ........................................................................................ 73
3 Characterisation of GNF ...................................................................................... 74
3.1 Introduction................................................................................................... 74
3.2 Experimental Methods .................................................................................. 75
3.2.1 Preparation of Complexed GNF............................................................. 76
3.2.2 X-ray Photoelectron Spectroscopy......................................................... 76
3.2.3 Transmission Electron Microscopy......................................................... 76
3.2.4 pH Titration ............................................................................................ 77
3.2.5 Electrochemical Experiments ................................................................. 77
3.2.6 ATR-FTIR .............................................................................................. 79
3.2.6.1 Stability of Aqueous Suspension of GNF ........................................ 79
3.2.6.2 Solution-Phase Characterisation of GNF ........................................ 79
3.3 Results and Discussion ................................................................................ 80
3.3.1 Transmission Electron Microscopy......................................................... 80
3.3.2 X-ray Photoelectron Spectroscopy......................................................... 81
3.3.3 Infrared Spectroscopy............................................................................ 83

Contents
6
3.3.3.1 Stability........................................................................................... 86
3.3.4 pH Titration ............................................................................................ 86
3.3.5 In Situ pH Studies Monitored with Infrared Spectroscopy....................... 89
3.3.6 Electrochemistry of GNF without Redox Probes..................................... 91
3.3.7 Electrochemistry of FcMeOH at GNF-Modified Electrode....................... 95
3.3.8 Electrochemistry of Hydroquinone/Benzoquinone at GNF-ModifiedElectrode.............................................................................................. 100
3.3.8.1 pH-Dependence of the Q/H2Q Reaction ....................................... 102
3.3.8.2 Exploring the Mechanism for Hydroquinone Oxidation ................. 107
3.3.9 Electrochemistry of [Ru(NH3)6]2+/3+ at GNF-Modified Electrode............. 112
3.4 Conclusion.................................................................................................. 121
References for Chapter 3 ...................................................................................... 123
4 GNF-COOH and Ferri/Ferrocyanide .................................................................. 125
4.1 Introduction................................................................................................. 125
4.2 Experimental Methods ................................................................................ 127
4.2.1 Electrochemical Experiments ............................................................... 127
4.2.2 Infrared Spectroscopy Experiments ..................................................... 127
4.2.3 Spectroelectrochemical Experiments ................................................... 128
4.3 Results and Discussion .............................................................................. 129
4.3.1 The Effect of Solution pH ..................................................................... 129
4.3.2 The Effect of Background Electrolyte Concentration ............................ 133
4.3.3 Cyclic Voltammetric Studies of [Fe(CN)6]3−/4− Redox Couple in the
Presence of GNF-COOH in Solution .................................................... 137
4.3.4 Isotope Effect of H2O and D2O on [Fe(CN)6]3−/4− Redox Couple at GNF-
COOH Modified Electrode.................................................................... 138
4.3.5 Spectroelectrochemical Studies of [Fe(CN)6]3−/4−.................................. 140
4.3.6 Stability of [Fe(CN)6]3−/4− in the Presence of GNF-COOH ..................... 142
4.3.6.1 Identity of decomposition product ................................................. 145
4.4 Conclusion.................................................................................................. 146
References for Chapter 4 ...................................................................................... 148

Contents
7
5 Potential-Induced Dissociation of Acid Groups .................................................. 150
5.1 Introduction................................................................................................. 150
5.2 Experimental Methods ................................................................................ 152
5.2.1 Construction of Calibration Curves....................................................... 154
5.3 Estimating the Distance between the Electrode Surface and the ATR InternalReflection Element...................................................................................... 155
5.4 Penetration Depth of IR Evanescent Wave................................................. 157
5.5 Proposed Mechanism for Potential-Induced Deprotonation of Acid EdgeGroups........................................................................................................ 159
5.6 Evidence of Electrolyte Ion Migration.......................................................... 163
5.7 Quantifying Changes in Ion Activity ............................................................ 168
5.8 Ruling Out pH Change at Interface............................................................. 171
5.9 Investigating the Effect of Electrolyte Cation............................................... 173
5.10 Estimating the Number of Acid Groups Undergoing Potential-InducedChanges..................................................................................................... 175
5.11 Predicting Potential-Dependent Changes in Solution Species .................... 180
5.11.1 Sulphate............................................................................................... 181
5.11.2 Phosphate............................................................................................ 184
5.12 Conclusion.................................................................................................. 188
References for Chapter 5 ...................................................................................... 191
6 Immobilisation of GNF on Electrode Surface ..................................................... 193
6.1 Introduction................................................................................................. 193
6.1.1 Thiol-Functionalised GNF .................................................................... 198
6.1.2 Electrochemistry of Ferrocene Derivatives ........................................... 200
6.2 Experimental Methods ................................................................................ 201
6.2.1 Substrate Preparation .......................................................................... 201
6.2.2 SAM Deposition ................................................................................... 202
6.2.3 Attaching GNF onto SAM..................................................................... 202
6.2.4 Labelling GNFs with Ferrocene Derivatives ......................................... 204
6.2.5 X-ray Photoelectron Spectroscopy....................................................... 204

Contents
8
6.2.6 Scanning Tunnelling Microscopy.......................................................... 205
6.2.7 Electrochemical Experiments ............................................................... 205
6.3 Results and Discussion .............................................................................. 205
6.3.1 Thiol-Functionalised GNF .................................................................... 205
6.3.1.1 STM.............................................................................................. 209
6.3.2 GNF Attached onto SAM-functionalised Gold ...................................... 215
6.3.2.1 Electrochemical Studies of Au + SAM + GNF Assembly............... 220
6.4 Conclusion.................................................................................................. 225
References for Chapter 6 ...................................................................................... 227
7 Concluding Remarks ......................................................................................... 230
7.1 Influence of GNF on the Electrochemistry of Redox Probes ....................... 231
7.2 Potential-Driven Deprotonation of Acid Groups........................................... 232
7.3 Immobilisation of GNF ................................................................................ 233
7.4 Future Work................................................................................................ 233
References for Chapter 7 ...................................................................................... 235
Appendix 1: Additional Figures for Chapter 4............................................................ 237
Appendix 2: Derivation of Equation (5.9)................................................................... 240
Appendix 3: Calculation of the values presented in Table 5.6 ................................... 242
Appendix 4: Calculation of the values presented in Table 5.7 ................................... 246

9
List of Symbols
Symbol Meaning Units
A Area
a Activity
c Speed of light m s−1
C∗
Bulk concentration of species jM, moldm−3
(C∗)app Apparent bulk concentration of species j
M, moldm−3
d Distance between STM tip and substrate Å
de Effective penetration depth μm
dp Penetration depth μm
e Elementary charge C
E Energy of electron eV
EB binding energy eV
EK Kinetic energy eV
E Potential V
E0 Standard potential V
E0’ Formal potential V
Epa Anodic peak potential V
Epc Cathodic peak potential V
ΔEp Peak potential separation V
F Faraday constant C
h Planck constant J s
ℏ Reduced Planck constant J s
h Solution thickness in thin-layer electrochemical cell μm
i Current A
ip Peak current A
It Tunnelling current A
I Integrated peak area
I Intensity
I0 Intensity at distance z = 0
k0 Standard heterogeneous electron transfer rate constant
Ka Dissociation constant of an acid

List of Symbols
10
Symbol Meaning Units
n Refractive index
me Mass of electronkg, u, J,MeV
OOxidised species; used as subscript to denote quantitiespertaining to O
p Momentum
pKa(app) Apparent pKa of acid
q Charge C
RReduced species; used as subscript to denote quantitiespertaining to R
r Angle of refraction
S Atomic sensitivity factor
T Temperature K
t Time s
v Scan rate V s−1
z Distance normal to the ATR surface μm
Γ∗ Initial amount of adsorbed species j
γj Activity coefficient of species j
δ Bend
θ Angle of incidence
θc Critical angle of incidence
κ Force constant
λ Wavelength nm
μ Reduced mass
ν Wavenumber cm−1
ν Frequency Hz
ν Stretch
νas Asymmetric stretch
νs Symmetric stretch
φ Surface potential V
φ Work function eV
φsp Calibrated spectrometer work function eV

11
List of Abbreviations
AFM Atomic force microscopy
ATR Attenuated total reflectance
BDD Boron-doped diamond
CNT Carbon nanotube
CPET Concerted proton-electron transfer
CV Cyclic voltammetry
CVD Chemical vapour deposition
DME Dropping mercury electrode
DPV Differential pulse voltammetry
EDC 1-ethyl-3-[3-dimethylaminopropyl]carbodiimide
FcCHO Ferrocenealdehyde
FcCOOH Ferrocenecarboxylic acid
FcMeOH Ferrocenemethanol
FTIR Fourier transform infrared
FTO Fluorine-doped tin oxide
FWHM Full width at half maximum
GL(30) Line shape that is 70% Gaussian and 30% Lorentzian
GNF Graphene nanoflakes
GNF-amide Amide-terminated graphene nanoflakes
GNF-COOH Carboxylic acid -terminated graphene nanoflakes
GNF-thiol Thiol-terminated graphene nanoflakes
GO Graphene oxide
H2Q Hydroquinone
HET Heterogeneous electron transfer
HOPG Highly oriented pyrolytic graphite
IHP Inner Helmholtz plane
IR Infrared
IRE Internal reflection element
LBE Liquid-based direct exfoliation
MWCNT Multi-walled carbon nanotube
OHP Outer Helmholtz plane
PAD Plane of acid dissociation

List of Abbreviations
12
PAH Polycyclic aromatic hydrocarbon
PCET Proton-coupled electron transfer
PCTFE Polychlorotrifluoroethylene
PEEK Polyether ether ketone
PMMA Polymethyl methacrylate
Q 1,4-benzoquinone
QCM Quartz crystal microbalance
RGO Reduced graphene oxide
SAM Self-assembled monolayer
SEM Scanning electron microscopy
SPM Scanning probe microscopy
STM Scanning tunnelling microscopy
Sulfo-NHS N-hydroxysulfosuccinimide
TEM Transmission electron microscopy
UHV Ultra-high vacuum
XPS X-ray photoelectron spectroscopy
XRD X-ray diffraction

13
List of Figures
Figure 1.1 Graphene is a two-dimensional building material for other carbon materials;it can be wrapped up into 0D buckyballs, rolled into 1D nanotubes or stacked into 3Dgraphite. Reproduced from [5] with permission. .......................................................... 25
Figure 1.2 (a) Comparison of Raman spectra at 514 nm for bulk graphite andgraphene. They are scaled to have similar height of the 2D peak at ∼2700 cm−1. (b)Evolution of the spectra at 514 nm with the number of layers. (c) Evolution of theRaman spectra at 633 nm with the number of layers. Adapted from [7] with permission.................................................................................................................................... 26
Figure 1.3 (a) X-ray photoelectron survey spectra of graphene oxide (blue) and GNF(black). Inset: High resolution XPS spectra of the C1s region of GO (blue) and GNF(black). (b) AFM image of GNF spin-coated onto highly oriented pyrolytic graphite. (c)Height and (d) diameter distribution of GNF. (e) 13C solid state NMR and (f) Ramanspectra of GO (black) and GNF (blue). Adapted from [107] with permission. .............. 38
Figure 1.4 (a) Electrostatic potential distribution across a metal/acidmonolayer/solution interface. (b) Schematic representation of a mixed monolayer of 11-mercaptoundecanoic acid and 1-decanethiol in contact with an electrolyte solution as afunction of electrode potential (E) and pH. Reproduced from [121] with permission.Copyright 1998 American Chemical Society. .............................................................. 42
Figure 2.1 A schematic representation of the electric double layer at the electrode-solution interface and the potential profile across the double layer region in theabsence of specific adsorption. Adapted from [1] with permission. ............................. 57
Figure 2.2 Waveforms in cyclic voltammetry. (a) Potential as a function of time, (b)current as a function of potential. Adapted from [1] with permission............................ 60
Figure 2.3 (a) Potential waveform for a differential pulse voltammetric experimentshowing two full potential steps. (b) Differential current plotted against potential forreaction O + ne R. Adapted from [1] with permission. ............................................. 62
Figure 2.4 Stretching and bending modes of (a) water and (b) CO2 molecule.Reproduced from [2] with permission.......................................................................... 66

List of Figures
14
Figure 2.5 (a) Graphical representation of the evanescent wave. (b) Variation of theangle of refraction (r) with the angle of incidence (θ). The critical angle θc is the angle ofincidence that leads to r = 90°. Adapted from [2] and [3] with permission.................... 67
Figure 3.1 A schematic of the electrochemical cell used in this Chapter. ................... 77
Figure 3.2 TEM images of the GNF. (a), (b): GNF-COOH. (c), (d): GNF-Ba............... 80
Figure 3.3 Wide scan survey spectra of GNF-COOH (black) and GNF-COOHcomplexed with Ca2+ (red); Ba2+ (green); [Ru(NH3)6]
3+ (blue). Relevant elements arehighlighted with circles. Spectra are offset for clarity................................................... 82
Figure 3.4 ATR-FTIR spectra of (a) GNF-COOH; (b) GNF-amide; (c) GNF-Ca. ......... 85
Figure 3.5 Titration curve of GNF-COOH (black), first derivative (red). Adapted from[6]. .............................................................................................................................. 88
Figure 3.6 Changes in IR absorption of GNF upon addition of 0.1 M KOH. GNF with noadded base at pH 2 (black), pH 3 (red), pH 5 (green), pH 7 (blue). Reproduced from[11]. ............................................................................................................................ 91
Figure 3.7 (a) pH 4.6 PBS with oxygen and (b) pH 4.6 PBS without oxygen; clean BDD(black), acid-terminated GNF (red) and amide-terminated GNF (blue). Adapted from[6]. .............................................................................................................................. 92
Figure 3.8 Cyclic voltammograms of BDD modified with (a) carboxylic acid-terminatedGNF and (b) amide-terminated GNF in pH 4.6 (red) and 9.2 (blue). Electrolyteconcentration 0.1 M. Scan rate 50 mV/s. Adapted from [6]. ........................................ 94
Figure 3.9 Cyclic voltammograms in 0.1 PBS at pH 7. Working electrode: clean BDD(black); BDD modified with GNF-Ca (blue). Red curve shows the response of BDDmodified with GNF-Ca in deoxygenated electrolyte..................................................... 95
Figure 3.10 Cyclic voltammograms of 0.5 × 10⁻³ M ferrocenemethanol at differentelectrode modifications. (a) At clean BDD (black), GNF-COOH modified BDD (red) andGNF-amide modified BDD (blue) in 0.1 M KH2PO4 pH 4.6, scan rate 100 mV s−1. (b) Atclean BDD (black), GNF-COOH modified BDD (red) and GNF-amide modified BDD(blue) in 0.1 M K2HPO4 pH 9.2, scan rate 100 mV s−1. Adapted from [6]..................... 96
Figure 3.11 Cyclic voltammograms of 0.5 × 10⁻³ M ferrocenemethanol at GNF-amidemodified BDD. Supporting electrolyte: (a) 0.1 M KH2PO4 pH 4.6; (b) 0.1 M K2HPO4 pH9.2. Scan rate 100 mV s−1 (black, blue), 1 (red, orange) V s−1. Adapted from [6]......... 97
Figure 3.12 (a) Cyclic voltammograms of 0.5 × 10⁻³ M ferrocenemethanol at GNF-COOH modified BDD in 0.1 M KH2PO4 pH 4.6: scan rate 50 (black), 100 (red), 250(green), 500 (blue), 1000 (light blue) mV s−1; (b) peak currents ipa (red) and ipc (blue)plotted against square root of scan rate v; (c) log ipa (red) and log |ipc| (blue) plottedagainst log ν. .............................................................................................................. 98
Figure 3.13 Cyclic voltammograms of 0.5 × 10⁻³ M hydroquinone in 0.1 M PBS: (a) atpH 5; (b) at pH 8.5. Working electrode: clean BDD (black), BDD modified with GNF-COOH (red) and BDD modified with GNF-amide (blue). Scan rate 50 mV s−1. Firstscans shown. Adapted from [6]................................................................................. 101
Figure 3.14 (a) Peak potential of hydroquinone oxidation (circles) and benzoquinonereduction (squares); (b) peak separation; (c) E1/2 as a function of pH at clean BDD

List of Figures
15
electrode (black), GNF-COOH modified BDD (red) and GNF-amide modified BDD(blue). Adapted from [6]. ........................................................................................... 104
Figure 3.15 (a) CVs of 0.5 × 10⁻³ M hydroquinone at clean BDD electrode (black line)and GNF-COOH modified electrode (red line) in unbuffered H2O pH 6.6. (b) Peakpotential of hydroquinone oxidation in unbuffered KCl electrolyte as a function of pH ata clean BDD electrode (black) and GNF-COOH modified electrode (red). (c) CVs of 0.5× 10⁻³ M hydroquinone at clean BDD electrode in unbuffered H2O pH 6.5 (black line)and D2O pD 6.6 (red line). Supporting electrolyte: 0.1 M KCl. Scan rate: 50 mV s−1.First scans shown. Adapted from [27]. ...................................................................... 109
Figure 3.16 (a) CV of 0.5 × 10⁻³ M hydroquinone at clean BDD electrode (black line)and GNF-COOH modified electrode (red line) in unbuffered H2O. The pH of the H2Oelectrolyte solution was adjusted to 8.21 with KOH. Supporting electrolyte: 0.1 M KCl.Scan rate: 50 mV s−1. Second scans shown. (b) Ratio of peak heights of hydroquinoneoxidation as a function of pH at clean BDD electrode (black) and GNF-COOH modifiedelectrode (red). Adapted from [27]. ........................................................................... 111
Figure 3.17 Cyclic voltammograms of 0.5 × 10⁻³ M [Ru(NH3)6]Cl3 in 0.1 M PBS pH 7 at(a) clean BDD and (b) GNF-COOH modified BDD. Scan rates 50 mV s−1 (black), 250mV s−1 (red) and 500 mV s−1 (blue). .......................................................................... 113
Figure 3.18 (a) Cyclic voltammograms of 0.5 × 10⁻³ M [Ru(NH3)6]Cl3 in 0.1 M PBS pH3 at GNF-Ca modified BDD. Scan rates 5 (black), 25 (red), 50 (green), 250 (blue) and500 (light blue) mV s−1. (b) Cyclic voltammograms from (a) with normalised current. 114
Figure 3.19 (a) Peak current ipa of peak Ia determined from Figure 3.18(a) plottedagainst the square root of scan rate ν. (d) ipa of peak IIa determined from Figure3.18(a) plotted against ν. .......................................................................................... 116
Figure 3.20 log ipa of (a) peak Ia and (b) peak IIa determined from Figure 3.19(a)plotted against log ν. ................................................................................................. 117
Figure 3.21 (a) Cyclic voltammograms recorded at a BDD modified with [Ru(NH3)6]3+
complexed GNF. Scan rates 5 (black), 25 (red), 100 (green), 325 (blue) and 500 (lightblue) mV s−1. Electrolyte: 0.1 M K2HPO4. (b) A plot of oxidation peak current ipa againstscan rate v. (c) log ipa plotted against log ν. ............................................................... 119
Figure 4.1 Spectroscopy cell used in this Chapter.................................................... 127
Figure 4.2 (a) Spectroelectrochemical setup used in this Chapter. (b) Schematic of thecell viewed from the top. ........................................................................................... 129
Figure 4.3 Cyclic voltammograms of 0.5 × 10⁻³ M K3[Fe(CN)6] recorded in 0.1 M PBS.Working electrode: (a) BDD; (b) BDD modified with GNF-COOH; (c) BDD modified withGNF-amide. Solution pH 4.6 (black, blue, light blue); 9.2 (red, orange, pink). Scan rate50 mV s−1. First scans shown. Adapted from [14]...................................................... 132
Figure 4.4 Cyclic voltammograms of 0.5 × 10⁻³ M K3[Fe(CN)6] recorded in differentconcentrations of KCl: (a) 1 M; (b) 0.1 M; (c) 0.01 M. Working electrode: BDD (black);BDD modified with GNF-COOH (red); BDD modified with GNF-amide (blue). Scan rate50 mV s−1. First scans shown. Adapted from [14]...................................................... 135
Figure 4.5 Cyclic voltammograms of 0.5 × 10⁻³ M K3[Fe(CN)6] (dashed blue); 0.5 ×10⁻³ M K3[Fe(CN)6] and 34 μg ml−1 GNF (solid blue); 0.5 × 10⁻³ M K4[Ru(CN)6] (dashedred); 0.5 × 10⁻³ M K4[Ru(CN)6] and 34 μg ml−1 GNF (solid red); 34 μg ml−1 GNF only

List of Figures
16
(black). Working electrode: BDD. Supporting electrolyte: 10−3 M KCl. Scan rate: 50 mVs−1. First scans shown. Reproduced from [11]........................................................... 138
Figure 4.6 Cyclic voltammograms of 0.5 × 10⁻³ M K3[Fe(CN)6] recorded at GNF-COOHmodified BDD in (a) H2O; (b) D2O. First scans (black) and 10th scans (red) shown.Supporting electrolyte 0.01 M KCl. Scan rate 50 mV s−1. Adapted from [11]. ............ 139
Figure 4.7 (a) Difference spectra of [Fe(CN)6]3− and [Fe(CN)6]
4−. After reduction of[Fe(CN)6]
3−, the IR spectrum shows a negative [Fe(CN)6]3− band and positive
[Fe(CN)6]4− band (solid line). Oxidation of [Fe(CN)6]
4− results in a positive[Fe(CN)6]
3− band and negative [Fe(CN)6]4− band (dashed line). (b) Height of the
[Fe(CN)6]4− CN stretch band at 2036 cm−1 relative to the intensity of absorption at full
conversion as a function of time. Blue squares: 1 × 10⁻³ M K3[Fe(CN)6]; red squares: 1× 10⁻³ M K3[Fe(CN)6] and 3.2 μg ml−1 of GNF. Electrolyte: 0.01 M KCl. Potentials: 0 V(reduction), +350 mV (oxidation). Reproduced from [11]........................................... 141
Figure 4.8 Infrared spectra of 2 × 10⁻³ M K3[Fe(CN)6] and 2 × 10⁻³ M K4[Fe(CN)6] inH2O at t = 0 h (solid blue) and at t = 24 h (dashed blue); with 30 μg ml−1 GNF at t = 0 h(solid red) and at t = 24 h (dashed red). Spectra are offset for clarity. Reproduced from[11]. .......................................................................................................................... 143
Figure 4.9 ATR-FTIR spectra of 2 × 10⁻³ M K3[Fe(CN)6] and 2 × 10⁻³ M K4[Fe(CN)6]with 30 μg ml−1 GNF In H2O at t = 0 h (solid red) and t = 4 h (dashed red), in D2Oat t = 0 h (solid blue) and t = 4 h (dashed blue). Spectra are offset for clarity.Reproduced from [11]. .............................................................................................. 144
Figure 5.1 Experimental setup in in situ spectroelectrochemical experiments. Adaptedfrom [9] ..................................................................................................................... 154
Figure 5.2 Cyclic voltammograms of 1.13 × 10⁻³ M FcMeOH in 0.1 M NaCl in IR setup.(a) Black line: BDD positioned 5 mm above ATR prism. Red line: BDD positionedagainst ATR prism, creating thin-layer conditions. Scan rate 5 mV s−1. (b) CVs recordedin the thin-layer geometry with scan rates 5, 8 10, 12, 14 and 17 mV s−1. Reproducedfrom [9]. .................................................................................................................... 156
Figure 5.3 Difference spectra of BDD modified with GNF-Ca in 0.1 M NaCl electrolyteat pH 7. Initial application of +1 V, background spectrum recorded without appliedpotential (light blue); spectrum after subsequent application of −0.5 V (black); spectrum after subsequent application of +1 V (red). Arrows on top spectrum indicate direction ofspectral features relative to baseline as a guide to the eye. Reproduced from [9]. .... 159
Figure 5.4 Potential-induced changes in cation activity in the electrode-electrolyteinterfacial region drive protonation and deprotonation of acidic surface groups. ....... 162
Figure 5.5 GNF-Ca modified electrode immersed in 2 ml of 0.1 M K2SO4 electrolyte inspectroelectrochemical setup after 0 minutes (black line), 5 minutes (red line) and 35minutes (blue line). Background: electrolyte only. Reproduced from [9]. ................... 164
Figure 5.6 Difference spectra of BDD modified with GNF-Ca in 0.1 M Na2SO4 pH 7.Background recorded at the beginning of experiment before the application of potential.Potentials: +1 V (light blue); −0.5 V (black); +1 V (red); −0.5 V (blue); +1 V (orange). The sulphate band at 1100 cm−1 is highlighted in green. Reproduced from [9].......... 165
Figure 5.7 Difference spectra in different concentrations of supporting electrolyteNa2SO4 at pH 7. BDD modified with GNF-Ca in 0.1 M: application of −0.5 V (black); application of +1 V (red). BDD modified with GNF-Ca in 1×10⁻³ M: application of −0.5 V

List of Figures
17
(orange); application of +1 V (blue). A background spectrum was collected at eachpotential immediately prior to switching the applied potential. Reproduced from [9]. . 167
Figure 5.8 (a) Infrared spectra of aqueous solutions of K2SO4 at differentconcentrations. The pH of all solutions was ca. 7. Inset: Magnification of the SO4
2−
absorption bands. (b) Peak fit of the sulphate absorption band from 0.075 M K2SO4
spectrum. (c) Peak areas from Fig 1.1 plotted against concentration of K2SO4 and alinear fit of data points. Error bars represent one standard deviation. Reproduced from[9]. ............................................................................................................................ 169
Figure 5.9 (a) Cyclic voltammograms in 0.1 M PBS at pH 7 with and without oxygenpresent in solution. Clean BDD with O2 (black); BDD modified with GNF-Ca with O2
(blue); BDD modified with GNF-Ca without O2 (red). (b) Cyclic voltammograms indifferent ionic strength solutions. BDD modified with GNF-Ca in 1 × 10⁻³ M PBS at pH 7(red); in 0.1 M PBS at pH 7 (blue). Reproduced from [9]........................................... 172
Figure 5.10 Difference spectra of BDD modified with GNF-Ca in 0.1 M K2SO4 pH 3.5.Application of −0.5 V (black); application of +1 V (red). Difference spectra under same conditions but electrolyte deoxygenated with argon for 20 minutes. Application of −0.5 V (blue); application of +1 V (orange). Reproduced from [9]. .................................... 173
Figure 5.11 Difference spectra of BDD modified with GNF-Ca in 0.1 M K2SO4 pH 7;application of −0.5 V (black); subsequent application of +1 V (red). Difference spectra of BDD modified with GNF-Ca in 0.1 M Na2SO4 pH 6.8; application of −0.5 V (blue); subsequent application of +1 V (orange). Reproduced from [9]. ............................... 174
Figure 5.12 Difference spectra of BDD modified with GNF-Ca in 0.1 M NaCl electrolyteat pH 3.5. Application of −0.5 V (black); subsequent application of +1 V (red).Difference spectra of BDD modified with GNF-Ca in 0.1 M CaCl2 pH 3.5. Application of −0.5 V (blue); subsequent application of +1 V (orange)........................................................ 175
Figure 5.13 (a) Peak fit of drop-coated potassium acetate film containing 5.38 × 10⁻⁹
moles of acetate groups. Experimental data (black), baseline (green), peak fits (red),cumulative peak fit (blue). (b) Asymmetric stretch peak areas at 1565 cm−1 plottedagainst number of acetate groups and a linear fit of data points. (c) Symmetric stretchpeak areas at 1415 cm−1 plotted against number of acetate groups and a linear fit ofdata points. Error bars represent one standard deviation. Reproduced from [9]........ 177
Figure 5.14 Peak fitted difference spectrum in 0.1 M K2SO4 pH 7 when applying −0.5 V to GNF-Ca modified BDD. Experimental data (black), baseline (green), peak fits (red),cumulative peak fit (blue). Reproduced from [9]. ....................................................... 178
Figure 5.15 IR difference spectra of the GNF-Ca modified electrode interface in: 0.1 MpH 7 K2SO4, −0.5 V (pink), +1.0 V (light blue); 0.1 M pH 3.5 K2SO4, −0.5 V (blue), +1.0 V (orange); 0.1 M pH 3 K2SO4, −0.5 V (black), +1.0 V (red). Reproduced from [9]. ... 182
Figure 5.16 Difference spectra of BDD modified with GNF-Ca in 0.1 MKH2PO4/K2HPO4 electrolytes of different pH: pH 3 at +1 V (red) and −0.5 V (black); pH 7 at +1 V (orange) and −0.5 V (blue); pH 9 at +1 V (light blue) and −0 5 V (pink). Reproduced from [9]. ................................................................................................ 186
Figure 6.1 Infrared spectrum of GNF-thiol. ............................................................... 199
Figure 6.2 (a) Survey spectra of unmodified Au (black) and Au+GNF-thiol (red). (b)High-resolution spectrum of the N1s region of unmodified Au (black) and Au+GNF-thiol(red). Spectra are offset for clarity............................................................................. 206

List of Figures
18
Figure 6.3 High-resolution XPS spectra of the C1s region of (a) Au and (b) Au+GNF-thiol. Experimental data is shown in black, background in green, peak fits in red and thecumulative peak fit in blue......................................................................................... 208
Figure 6.4 STM images of (a) clean Au(111); (b) GNF-thiol spin-coated onto Au(111).Suspension concentration 72 μg ml−1. ...................................................................... 210
Figure 6.5 STM images of GNF-thiol spin-coated onto Au(111). Suspensionconcentration (a) 8 μg ml−1; (b) 124 μg ml−1. (c) Height profile from (a) along green line.(d) Height profile from (b) along green line................................................................ 212
Figure 6.6 (a) STM image of Au(111) substrate after drop-coating distilled water. (b)Height profile from (a) along green line. .................................................................... 213
Figure 6.7 (a) STM image of 2 μg ml−1 GNF-thiol drop-coated on Au(111). (b) Height profile from (a) along green line. ............................................................................... 214
Figure 6.8 High-resolution spectra of (a) S2p and (b) N1s regions. Au (black),Au+cysteine (red), Au+cysteine+GNF-amide (blue), Au+cysteamine (green),Au+cysteamine+GNF-COOH (light blue). Spectra are offset for clarity. .................... 216
Figure 6.9 Narrow scan XPS spectra of the C1s region. (a) Unmodified Au; (b)Au+cysteine; (c) Au+cysteine+GNF-amide; (d) Au+cysteamine; (e)Au+cysteamine+GNF-COOH. Black squares: experimental data; green: baseline; red:peak fits; blue: cumulative peak fit. ........................................................................... 217
Figure 6.10 Narrow scans of the Fe2p regions of Au+cysteamine+GNF-COOH (black)and Au+cysteine+GNF-amide+FcCHO (red). Spectra are offset for clarity. .............. 219
Figure 6.11 Differential pulse voltammograms of (a) Au+cysteamine+GNF-COOH (red)and Au+cysteamine+GNF-COOH+FcCOOH (blue); (b) Au+cysteine (red) andAu+cysteine+GNF-amide+FcCHO (blue). Solid line: oxidation; line and symbols:reduction................................................................................................................... 221
Figure 6.12 (a) Cyclic voltammograms at Au+cysteine+GNF-amide+FcCHO in 0.1 MPBS pH 7; scan rate 50 (black), 100 (red), 250 (blue), 500 (green), 750 (light blue) and1000 (pink) mV s−1; 5th scans shown; (b) ipa (red) and ipc (blue) plotted against ν; (c) log ipa (red) and log |ipc| (blue) plotted against log ν. ........................................................ 223

19
List of Schemes
Scheme 1.1 Schematic representation of different edge configurations. A defect in thebasal plane is shown in orange. Reproduced from [11] with permission. .................... 27
Scheme 1.2 Schematic depiction of edge-carboxylated (left) and amide-functionalisedGNF. The images are not to scale; the aromatic region at the core of the flakes issignificantly larger than is depicted here. Reproduced from [110]. .............................. 39
Scheme 3.1: 1,4-Benzoquinone undergoes a two-proton, two-electron reduction tohydroquinone............................................................................................................ 100
Scheme 6.1 (a) Cystamine dihydrochloride; (b) cysteamine SAM formed by cystamineon gold; (c) GNF-COOH attached onto cysteamine SAM on gold; ((d) ferrocenecarboxylic acid attached onto Au-cysteamine-GNF-COOH. ...................................... 195
Scheme 6.2 (a) Cysteine molecule; (b) cysteine SAM on gold; (c) GNF-amide attachedonto cysteine SAM on gold; (d) ferrocene carboxaldehyde attached onto Au-cysteine-GNF-amide. .............................................................................................................. 196
Scheme 6.3 Schematic depiction of edge-thiolated GNF. The image is not to scale; thearomatic region at the core of the flakes is significantly larger than is depicted here. 198
Scheme 6.4 Reaction scheme illustrating activation of carboxylate with EDC andformation of reaction intermediate after addition of sulfo-NHS. Adapted from [32]. ... 203

20
List of Tables
Table 1.1: Summary and comparison of some methods for graphene synthesis.Modified from [13] with permission.............................................................................. 28
Table 2.1: Tabulated values of dp at a diamond ATR crystal-water interface when θ =45°. The values of n1 were found in [4] and the values of n2 in [5]. .............................. 68
Table 3.1: Fraction of carboxylic acid groups that are complexed in different materialscalculated from the atomic percentages of oxygen and complexing cation. ................ 83
Table 3.2: Peak parameters of FcMeOH redox reaction from cyclic voltammetryexperiments at GNF-COOH modified BDD in 0.1 M KH2PO4 pH 4.6........................... 99
Table 3.3: Scan rates, oxidation peak currents and oxidation peak potentials extractedfrom Figure 3.21....................................................................................................... 121
Table 4.1: Calculated values of peak potential separation ΔEp in various concentrationsof supporting electrolyte KCl. .................................................................................... 134
Table 5.1: Scan rates, peak currents for forward and backward scans, calculatedvolumes of the thin-layer cell and distance h between electrode and IRE. Adapted from[9]. ............................................................................................................................ 157
Table 5.2: Penetration depth dp and the effective penetration de calculated at differentwavenumbers. Values of n1 were found in ref [12] and values of n2 in ref [13].Reproduced from [9]. ................................................................................................ 158
Table 5.3: Peak areas from difference spectra obtained at different potentials and thecalculated activity change in sulphate ion at the electrode surface. Reproduced from[9]. ............................................................................................................................ 170
Table 5.4: Carboxylate asymmetric and symmetric stretch peak areas from differencespectra obtained at different potentials. Reproduced from [9]. .................................. 179
Table 5.5: Values used to calculate change in the number of carboxylate groups at theelectrode surface when a potential is applied. Reproduced from [9].......................... 179
Table 5.6: Predicted changes in activity of HSO4− and SO4
2− on application of −0.5 V calculated from Equation (5.9). Reproduced from [9]. ............................................... 183
Table 5.7: Changes in activity of H3PO4, H2PO4− and HPO4
2− on application of −0.5 V calculated from Equation (5.9). Reproduced from [9]. ............................................... 186

List of Tables
21
Table 6.1: XPS binding energies of some carbon species. ....................................... 197
Table 6.2: Elemental composition calculated from peak areas in survey spectra inFigure 6.2................................................................................................................. 206
Table 6.3: Peak parameters from peak fit of C1s spectra in Figure 6.3.................... 208
Table 6.4: Peak parameters extracted from peak fits in Figure 6.9. ......................... 218
Table 6.5: Peak currents found from cyclic voltammograms in Figure 6.12(b), amountof charge q calculated by integrating peak areas under CV curve in Coulombs andcorresponding number of FcCHO molecules in moles. ............................................. 224

22
List of Appendix Figures
Figure A1.1 Cyclic voltammograms of 0.5 × 10⁻³ M K3[Fe(CN)6] at a BDD modified withGNF-COOH in different concentrations of pH 5 PBS: 1 M (blue); 0.1 M (red); 0.01 M(black). Scan rate 50 mV s−1. First scans shown. ...................................................... 237
Figure A1.2 Cyclic voltammograms of 0.5 × 10⁻³ M K4[Ru(CN)6] at (a) clean BDD; (b)BDD modified with GNF-COOH. Supporting electrolyte: 0.1 M PBS at pH 6 (black), pH7 (red), pH 8 (blue). Scan rate 50 mV s−1. First scans shown.................................... 238
Figure A1.3 Cyclic voltammograms of 0.5 × 10⁻³ M K3[Fe(CN)6] at a BDD modified withGNF-COOH in 0.01 M NaCl at pH 5 (black) and pH 8.4 (red). Scan rate 50 mV s−1.First scans shown. .................................................................................................... 239
Figure A1.4 UV Vis spectra of 2 × 10⁻³ M K3[Fe(CN)6] and 2 × 10⁻³ M K4[Fe(CN)6] with30 μg ml−1 GNF in H2O at t = 0 h (black), t = 7 h (red) and t = 24 h (blue). ................ 239

23
List of Publications
Lounasvuori, M. M.; Rosillo-Lopez, M.; Salzmann, C. G., et al., ElectrochemicalCharacterisation of Graphene Nanoflakes with Functionalised Edges. FaradayDiscussions 2014, 172 ( ), 293-310.
Lounasvuori, M. M.; Rosillo-Lopez, M.; Salzmann, C. G., et al., The Influence of AcidicEdge Groups on the Electrochemical Performance of Graphene Nanoflakes. J.Electroanal. Chem. 2015, 753, 28-34.
Lounasvuori, M. M., Holt, K. B., Acid Deprotonation Driven by Cation Migration atBiased Graphene Nanoflake Electrodes. Chem. Commun. 2017, Advance Article.DOI: 10.1039/C6CC09418J.

24
1 Introduction
1.1 Graphene
For decades, carbon nanomaterials, such as fullerenes and carbon nanotubes, have
been the subject of intense research due to their exceptional electrical and mechanical
properties (for reviews see [1-4]). The building block of these carbon materials is
graphene [5], a one-atom thick sheet of sp2-hybridised carbon arranged in six-
membered rings (Figure 1.1). Graphene has long been studied theoretically, but it was
not isolated experimentally until 2004, when it was successfully prepared by Geim and
Novoselov [6] by peeling thin layers off a graphite surface using Scotch tape. This
method, termed micromechanical cleavage, resulted in samples with few defects as
shown by field effect experiments.

1 Introduction
25
Figure 1.1 Graphene is a two-dimensional building material for other carbon materials; it can bewrapped up into 0D buckyballs, rolled into 1D nanotubes or stacked into 3D graphite.
Reproduced from [5] with permission.
Raman spectroscopy is widely used to characterise graphitic materials. The two most
intense Raman bands in graphite are the G peak at ~1580 and 2D peak at ~2700 cm−1
(with 514 nm excitation) resulting from the doubly degenerate zone centre E2g mode
and a second-order two-phonon process of zone-boundary phonons, respectively [7].
Raman spectra of graphite and graphene are presented in Figure 1.2(a). Defects in
graphitic materials give rise to a Raman band termed the D peak at ca. 1350 cm−1, thus
allowing the use of Raman spectroscopy to assess the number of defects in graphene.
Ferrari et al. [7] were the first to show that Raman spectroscopy also produces unique
fingerprints depending on the number of layers in graphene samples. The 2D band,

1 Introduction
26
sometimes referred to as the G′ band, changes significantly in shape and intensity
going from single-layer graphene to graphite as shown in Figure 1.2(b-c).
Figure 1.2 (a) Comparison of Raman spectra at 514 nm for bulk graphite and graphene. Theyare scaled to have similar height of the 2D peak at ∼2700 cm
−1. (b) Evolution of the spectra at
514 nm with the number of layers. (c) Evolution of the Raman spectra at 633 nm with thenumber of layers. Adapted from [7] with permission.
The remarkable electronic properties of graphene, such as high carrier mobility and
high transport velocity, stem from the sp2-hybridisation of the carbon atoms, where the
pz orbitals remain perpendicular to the graphene lattice and form a conjugated π-bond
network extending across the basal plane [8]. This electronic structure is disrupted at

1 Introduction
27
defect sites – which is why pristine graphene is desirable for electronic applications –
and at the edges of the graphene sheets.
Graphene edges can adopt two different configurations, referred to as armchair and
zigzag, with an edge often consisting of alternating segments of the two types referred
to as a chiral edge [8] (Scheme 1.1). The zigzag and armchair edges have very
different electron configurations: the armchair edge is more stable due to a triple
covalent bond between the two open edge carbon atoms [9], whereas the zigzag edge
is higher in energy because of the pz electrons confined on each outer carbon atom [8].
Due to these edge states, the zigzag edge is metastable and undergoes planar
reconstruction to pentagonal or heptagonal structures [10].
Scheme 1.1 Schematic representation of different edge configurations. A defect in the basalplane is shown in orange. Reproduced from [11] with permission.

1 Introduction
28
1.1.1 Graphene synthesis
As mentioned above, the first successful reported experiment to prepare graphene
made use of Scotch tape, which was used to mechanically exfoliate sheets from bulk
graphite [6]. This simple method is cheap to operate but suffers from low throughput as
well as small and irregular sample size, making this method currently not relevant for
commercial electronic applications [12]. More techniques have since been devised and
a selection of the most commonly used methods are summarised in Table 1.1.
Table 1.1: Summary and comparison of some methods for graphene synthesis. Modified from[13] with permission.
Method Precursor Advantages Disadvantages Ref
Mechanicalexfoliation
GraphiteLow cost, high
electronicquality
Lowthroughput,broad sizedistribution,small size
[6, 14-16]
Liquid-baseddirect exfoliation
GraphiteScalable,
versatile, mildconditions
Low monolayercontent, broadsize distribution
[17-23]
CVDMethane,ethane,
acetylene
Large-areagraphene,
relatively highelectronic
quality
Polycrystalline,damagingtransferprocessrequired
[24-34]
Electrochemical/Chemical/Thermal
reduction of GO
Grapheneoxide (fromoxidation of
graphite)
Low cost, highthroughput
Low electronicquality
[35-37]
Chemical vapour deposition (CVD) has become the method of choice to prepare
graphene for electronic applications (for a review see [38, 39]). CVD growth utilises
heat, light or electric discharge [38] to deposit carbon onto a substrate from
hydrocarbon precursors, usually methane [32-34]. The thermal decomposition of
methane occurs at a very high temperature, and therefore a substrate that can
simultaneously act as a catalyst is used [38]. The most common substrate is Cu [30,

1 Introduction
29
31], although the use of Pt [27, 34], Ni [29, 40] and Cu-Ni alloys [32, 33] have also
been reported. CVD allows the fabrication of large-area graphene of relatively high
quality, although not as high as that achieved by mechanical exfoliation due to bilayer
domains and grain boundaries [28, 38]. In addition to the requirement of high
temperature and high vacuum, the major drawback of graphene grown by the CVD
method is the need to transfer the graphene film from the conductive metal substrate
onto an insulating substrate. The conventional wet chemical transfer method involves
attaching a temporary support layer onto the graphene film, etching the metal substrate
off, transferring the film onto the targeted substrate and removing the temporary
support. Commonly used temporary supports are polymers such as polymethyl
methacrylate (PMMA) [25, 26]. This transfer process can be damaging to the structural
integrity of the graphene film due to water trapped underneath the graphene, and leave
behind residue from the etching reagents and the polymer support [28]. Alternative
methods of transfer are the subject of intense research and recent reports of PMMA-
free CVD graphene have been published [28, 41].
Liquid-based direct exfoliation (LBE) is an emerging collection of synthetic methods for
preparing high quality graphene using mild conditions (for a review see [42]). In LBE,
graphite is directly exfoliated into 2D nanosheets in liquid media using ultrasonic,
electrochemical or shear exfoliation. Ultrasonic exfoliation can make use of organic
solvent only [43]; surfactants [17], polymers [19] or polycyclic aromatic hydrocarbons
(PAHs) [20] can be added as stabilisers; and different intercalants such as Li+ [18] or
acids [21] can be used to facilitate exfoliation. In electrochemical exfoliation, a potential
bias is used to achieve intercalation of ionic species into graphite, thus making the
subsequent ultrasonic exfoliation more facile (for a review see [44]). Shear exfoliation
can be performed by ball milling [23] or by rotor and stator [22] in stabilising liquids.

1 Introduction
30
1.1.2 Graphene Oxide
Aside from electronic applications where large, single-crystalline graphene is needed,
there are various other potential applications for graphene-related materials that don’t
require high electronic quality, defect-free graphene, allowing for cheaper, higher-
throughput synthesis techniques to be used. One method for graphene synthesis
producing high yields is the reduction of graphene oxide (GO). GO has been known
and studied since Brodie first oxidised graphite using potassium perchlorate and
fuming nitric acid more than 150 years ago [45]. Staudenmaier improved on Brodie’s
method but employed the same oxidising agents, with the addition of sulphuric acid to
increase the acidity of the reaction mixture [46]. Later, Hummers replaced KClO3 and
fuming HNO3 with potassium permanganate and sulphuric acid [47]. These three
methods are the main routes to GO [48]. The products show great variation depending
not only on the oxidising agent but also the starting material, which is most commonly
naturally occurring flake graphite, purified to remove heteroatomic contamination but
containing an abundance of inherent localised defects in the π-structure [48]. The
resulting graphite oxide can be easily exfoliated in many solvents [49], giving individual
sheets of GO which can then be chemically [36], thermally [37] or electrochemically
[35] reduced to give the final product.
The chemical structure of GO is difficult to determine because of its inherently
nonstoichiometric structure and dependence on synthesis method and parameters [50].
Earlier models were based on regular lattices, such as Hofmann and Holst’s structure
consisting of epoxy groups spread across the basal plane of graphite [51] and Ruess’
model based on an sp3-hybridised carbon backbone incorporating hydroxyl groups in
addition to epoxy groups [52]. In current models, the discrete repeat units of regular
lattices are rejected in favour of non-stoichiometric amorphous structures [48]. The
model proposed by Lerf and Klinowski consists of both aromatic regions with

1 Introduction
31
unoxidised benzene rings and regions with sp3-hybridised 6-membered rings of carbon,
with hydroxyl groups and epoxides above and below the plane and carboxyl and
hydroxyl groups terminating the edges [53]. The supporting evidence for the model
came from NMR and CP/MAS experiments [53]. The main issue with this model, as
pointed out by Szabó and Dékány [54], is the assumption of edge-terminating
carboxylic acid groups being the only carbonyl species, which is not supported by
spectroscopic data and does not explain the planar acidity of GO. A new model
presented by Szabó and Dékány [54] introduces phenolic groups into the bulk of the
layers through carbon-carbon bond cleavage to account for the spectroscopic data and
the acidity; also, the presence of 1,3-ethers is assumed rather than epoxides. The
carbon backbone has a periodic structure of trans-linked cyclohexane chairs and
ribbons of flat hexagons with C=C double bonds; aromaticity is lost early in the
oxidation process [54].
Dimiev et al. [55] have introduced a new dynamic structural model in which interaction
with water, rather than existing acidic functional groups, is the main factor in the acidity
of GO and the functional groups evolve continuously as water incorporates into GO,
transforms it, generates protons and then leaves via different reactions. In this model,
reaction with water results in carbon-carbon bond cleavage, formation of vinylogous
carboxylic acids and generation of protons. The reaction proceeds faster in alkaline
solution. Based on experimental results, Dimiev’s group combine elements from the
two conflicting models: the main functional groups on the basal plane proposed by Lerf
and Klinowski, namely tertiary alcohols and epoxides [53], and the idea of carbonyl
group formation through C-C bond cleavage suggested by Szabó and Dékány [54].
Recent direct imaging experiments support the dynamic interpretation of the structural
evolution of GO [50].

1 Introduction
32
1.1.3 Graphene Functionalisation
Pristine graphene exhibits remarkable electronic properties. Experimental results show
high charge carrier mobilities at ambient temperatures over a technologically relevant
range of carrier concentrations [16]. Additionally, due to the ambipolarity of graphene,
the charge carriers can be tuned continuously between electrons and holes [5]. This
means that the adsorption of both electron withdrawing and donating groups can lead
to chemical gating of graphene, making graphene a potential material for resistive-type
sensors [56]. These electronic properties, combined with a high surface area, suggest
tantalising possibilities for graphene in applications such as optoelectronic devices [57-
59], supercapacitors [60-62] and electrochemical sensing [63-65].
However, pristine graphene suffers from low solubility in polar solvents and a tendency
to restack irreversibly, making its use problematic in many practical applications. To
improve the water solubility and to prevent restacking of the graphene layers, various
approaches to introduce functionalities onto graphene have been reported, such as
covalent modification [66, 67], π–π interactions [68, 69] and hydrophobic interactions
[70, 71].
Although covalent functionalisation will in most cases disrupt the π-bonding system of
graphene, Jeong et al. [66] suggest existing defects can be used as active sites to
minimise introduction of sp3 carbon. They modified thermally exfoliated graphene with
ethanolamine and butyl bromide to introduce cationic ammonium functionalities onto
the graphene basal plane and obtained a product that was stable in solution for months
despite a particle size of around 7 μm. Aminoethyl acrylate –functionalised graphene
nanosheets bearing cationic functional groups were also shown to effectively resist
restacking and agglomeration [67]. To preserve the electronic structure of the graphene
basal plane, non-covalent methods of functionalisation are needed. Pyrene derivatives
such as 4-(pyren-1-yl)butanal [68] or 1-pyrenebutyric acid hydroxysuccinimide ester

1 Introduction
33
[69] can be used to functionalise graphene as the pyrene moiety has the ability to form
π–π interactions with the graphene sheet while the end groups introduce a polar
functionality, thus improving water solubility and preventing stacking due to steric
effects from the bulky molecules.
Non-covalent modification of graphene can also be achieved by exploiting hydrophobic
interactions, for example between the graphene basal plane and the butyl chains in
poly-L-lysine [70] or the PTFE backbone of Nafion [71]. Both graphene hybrid materials
exhibited good stability and dispersibility in aqueous solutions.
1.2 Electrochemistry of Graphene
Traditional consensus has been that electron transfer on graphitic materials is
dominated by the edge plane [72-74], and it has been shown that the intentional
generation of oxygen-containing defects increases the reactivity [72]. However,
recently it has been shown that the basal plane of highly oriented pyrolytic graphite
(HOPG) can exhibit fast electron transfer for outer-sphere redox couples [72, 75-79].
High resolution electrochemical surface imaging studies have shown that electron
transfer at carbon nanotube walls and the graphene basal plane surfaces is fast and
reversible and limited only by available density of states [78, 80-82]. This contrasts with
previous and indeed very recent studies [74, 83] reporting exceedingly sluggish kinetics
at the basal plane of graphitic materials. One possible explanation for these
discrepancies is in preparation of the materials before electrochemical investigation.
Adsorption of organic impurities onto freshly prepared graphene has been shown to
take place within minutes on exposure to a typical laboratory atmosphere [84] and such
a surface layer may lead to inhibition of electron transfer at carbon surfaces.
Notwithstanding the conflicting reports of basal plane activity, it is accepted that the
edge plane of graphitic materials shows enhanced electrochemical activity due to the

1 Introduction
34
presence of high energy defects such as dangling bonds and oxygen functionalities.
The interaction of various redox species with oxygen functionalities at carbon
electrodes has been investigated extensively by McCreery and co-workers [85-87].
Common redox probes can be classified roughly into three categories: those which are
insensitive to surface termination (FcMeOH, [Ru(NH3)6]3+/2+); those which interact with
specific oxygen functionalities (such as Fe3+/2+ with C O) and those which are surface
sensitive but apparently do not interact with specific oxygen-containing groups
([Fe(CN)6]3−/4−) [88].
Graphene has been studied as electrode material using several different redox probes,
such as ferrocenemethanol [41, 89], [Fe(CN)6]3−/4− [14, 74, 90] and
1,4-benzoquinone/hydroquinone [91, 92]. Due to the variation in the methodology of
graphene synthesis and electrode preparation, comparing the results is not
straightforward. For example, Dryfe’s group [14] fabricated electrodes from
mechanically exfoliated graphene with a well-defined exposed area and controlled level
of defects, thus being able to compare defect-free graphene and graphene with
defects. In contrast with reports of defects improving HET kinetics at basal plane of
graphite [72], Dryfe et al. found no significant difference in the electrochemical
response of [Fe(CN)6]3− reduction at graphene regardless whether defects were
present [14]. Abruña and Ralph’s group [89] employed a similarly rigorous electrode
fabrication method to both mechanically exfoliated and CVD-grown graphene.
Amemiya’s group [41] reported significantly faster electron transfer kinetics for
ferrocenemethanol at PMMA-free CVD-grown graphene compared to conventionally
transferred CVD graphene contaminated with PMMA residue. Banks and co-workers
[74], on the other hand, used commercially available graphene platelets directly from
the ethanol dispersion in which the platelets were supplied and modified an edge-plane
graphite electrode by the drop-coating method. This method gives very little control
over surface area and coverage of the underlying electrode. Chemically, thermally and

1 Introduction
35
electrochemically reduced GO samples are also widely employed by immobilisation
onto a glassy carbon electrode surface [93-95]. Aksay et al. [96] have pointed out that
the effect of roughness and porosity of drop-coated films on electrodes can often
dominate the electrochemical response. In some cases, effects stemming from
electrode morphology are unwittingly being measured, rather than effects related to
specific surface chemistry and differences in the HET rates [90, 96].
In addition to variations in oxygen content, defect density and electrode morphology,
the presence of impurities also plays a role in the electrochemistry of graphene-related
materials. The identity of impurities varies from sample to sample and is often
overlooked when results are reported. Exciting electrochemical properties originally
attributed to graphene have subsequently been shown to originate from metallic
impurities [97, 98]. Metallic impurities are inherent in natural graphite and introduced to
both natural and synthetic graphite during milling [99]; they persist in reduced GO
despite the extensive oxidative treatment graphite is subjected to [99]. Additionally, the
use of permanganate in the Hummers method of graphite oxidation has been shown to
lead to Mn impurities at high ppm levels in the graphene oxide product [98]. Different
carbonaceous impurities include the presence of multiple layers due to incomplete
exfoliation [97]; amorphous carbon impurities that persist from precursors to synthetic
graphite [99] and are created during digestion of graphite with strong oxidants [97]. The
use of hydrazine as reducing agent introduces significant amounts of covalently
bonded nitrogen into reduced GO [100-102] with a number of possible configurations
leading to differences in the electronic structure [103].
Different oxygen-containing impurities arise from the oxidation of graphite and its
subsequent incomplete reduction [104] depending on the synthesis method. The
identity of the different oxygen-containing functionalities that remain on reduced GO
and may develop during atmospheric exposure on any graphene material remains
unclear. The presence of carbonyls, epoxy groups and carboxylic acid functionalities

1 Introduction
36
has been detected by XPS [100]. Epoxy and hydroxyl groups have been suggested
without experimental evidence [105], and IR spectra have been reported without
attempts to assign the observed bands [106]. The amount of oxygen in graphene
samples also varies depending on the preparation steps, with 4.96 % atomic oxygen
reported in commercially available graphene platelets [74] and 6.25 % in “highly
reduced GO” [102].
Given that even the most carefully prepared graphene samples may have some
oxygen content, it seems important to determine the influence of these functionalities
on the electrochemical response. As graphene is increasingly being manufactured via
reduction of graphene oxide, where an array of oxygen groups persist in the final
product, the interaction of oxygen moieties with solution species will influence how well
the material performs in electrochemical applications.
1.3 Graphene Nanoflakes
The work presented in this report was conducted using graphene nanoflakes (GNF)
provided by Dr Salzmann’s group, who have reported the synthesis and
characterisation of this novel graphene-related nanomaterial [107]. The method
involves chemical oxidation of multi-walled carbon nanotubes grown by CVD using
sulphuric and nitric acids, followed by neutralisation with KOH, dialysis and freeze-
drying.
Whereas graphene is defined as “a single carbon layer of the graphite structure,
describing its nature by analogy to a polycyclic aromatic hydrocarbon of quasi infinite
size” [108], the GNF synthesised by Salzmann’s group were, on average, only 30 nm in
diameter [107]. In comparison, commercially available pristine graphene flakes, used
by Banks et al. [74], have an average lateral dimension of 550 nm. Graphene grown

1 Introduction
37
epitaxially and by CVD is usually aimed for applications in which large areas of pristine
aromatic carbon is desirable.
After purification and dialysis, XPS confirmed the purity of GNF, detecting only carbon
and oxygen [107] (Figure 1.3(a)). The carbon-carbon bonding in GO is only 60 % sp2-
hybridised [109] due to increased defect density leading to sp3-hybridisation. In
contrast, 13C solid state NMR studies by Salzmann’s group show that only COOH and
sp2-hybridised carbon are present [107], indicating that the GNF contain fewer
oxygenated defects on the basal plane and that the oxygen content is concentrated
around the edges. High-resolution spectrum of the C1s region showed the presence of
COOH groups and a complete lack of any alcohol or epoxide groups in GNF [107]
which are often found on the basal plane in GO materials [48], providing further
evidence that the GNF consist of a pristine basal plane with carboxylic acid groups
decorating the edges.

1 Introduction
38
Figure 1.3 (a) X-ray photoelectron survey spectra of graphene oxide (blue) and GNF (black).Inset: High resolution XPS spectra of the C1s region of GO (blue) and GNF (black). (b) AFMimage of GNF spin-coated onto highly oriented pyrolytic graphite. (c) Height and (d) diameterdistribution of GNF. (e)
13C solid state NMR and (f) Raman spectra of GO (black) and GNF
(blue). Adapted from [107] with permission.
The carboxylic acid groups offer useful synthetic routes to flakes terminated with
different functionalities. The experiments included in this report were conducted using
carboxyl-functionalised GNF and amide-functionalised GNF. Schematic
representations of these two functionalities are given in Scheme 1.2.

1 Introduction
39
Scheme 1.2 Schematic depiction of edge-carboxylated (left) and amide-functionalised GNF.The images are not to scale; the aromatic region at the core of the flakes is significantly larger
than is depicted here. Reproduced from [110].
In addition to acting as a precursor to other functionalities, the acid groups in GNF-
COOH form strong complexes with divalent cations. This is achieved by deprotonating
the carboxylic acid edge groups of GNF-COOH and subsequently adding an aqueous
solution of a chloride salt of an alkali earth metal. Reaction of the water-soluble GNF
with Ca2+ results in a porous precipitate where the loss of solubility indicates a strong
interaction between the COO− edge groups and the Ca2+ cation.
The use of GNF distinguishes this project from work done by other groups on
graphene-related materials. The small size of the flakes amplifies the importance of the
edge groups. GNF will also bridge pristine graphene and GO in a manner similar to
reduced GO while providing a unique starting point in terms of uniform small size,
controlled introduction of functionalities and low defect density, all of which are absent
from reduced GO.

1 Introduction
40
1.4 Acid-base Properties of Graphene-related Materials
Many ionisable functionalities are present in GO, such as carboxylic acids and phenols
[48-50, 55, 111-114]. Carboxylic acid groups are commonly found on carbon electrode
surfaces, especially after use at high anodic potentials. Their presence has been
shown to greatly influence the electron transfer kinetics of common redox species at
graphene-modified [110] and BDD [115] electrodes, although the exact nature of the
influence is unclear.
The ability of acidic functional groups to dissociate and carry negative charge means
that they can interact electrostatically with cationic species to form complexes, and this
can be exploited in applications where relatively weak interactions are desirable. For
instance, Loh’s group [116] used the carboxylic acid groups on graphene oxide to
create a charge transfer complex through electrostatic interaction between the
negatively charged GO and a positively charged dye. Additional π–π interactions led to
fluorescence quenching of the dye through charge transfer. The fluorescence could be
recovered by extracting the dye from the GO-dye complex and DNA was found to be
very efficient in achieving this as DNA formed a stronger electrostatic bond than GO
with the positively charged dye. By monitoring the intensity of the fluorescence, the
GO-dye complex could then be used to detect the presence of DNA in biological
mixtures.
The pKa of a functional group determines the pH at which protonation takes place. pH
differences in biological systems can therefore be exploited to achieve selective
release of molecules from complexes, as demonstrated by Qiu et al. [117]. They used
graphene quantum dots (GQD) functionalised with NH2 groups as a fluorescent carrier
for a common anti-cancer drug. The increased acidic conditions inside cancer cells
compared to healthy tissue caused protonation of the NH2 groups on both the GQDs
and the drug, weakening the interaction and promoting release of the drug.

1 Introduction
41
1.4.1 Controlling the Protonation State of Electrode-Immobilised
Species
Organic acids do not undergo reversible redox reactions and potentials exceeding +2 V
vs. SCE are required to achieve their irreversible oxidation [118], while reduction
occurs at potentials exceeding −2 V vs. SCE [119]. Even though less extreme
potentials have been reported to partially reduce graphene oxide electrochemically
[112, 120], COOH groups may not be fully reduced at these potentials. There are,
however, reports of reversible non-Faradaic peaks being observed in CV and
electrochemical impedance spectroscopy (EIS) studies of electrode-confined carboxylic
acid –terminated SAMs [121-124]. Theoretical treatment of this phenomenon attributes
the CV peaks to the change in interfacial differential capacitance induced by the
change in protonation state of the acid, the protonation/deprotonation being driven by
the electric field at the electrode [125-128]. The interfacial potential distribution for a
monolayer of an acid-terminated alkanethiol at a gold electrode is depicted in Figure
1.4 showing the plane of acid dissociation (PAD) [125], the common plane on which all
the acid groups lie. This electrochemically driven reversible acid protonation reaction
has recently been exploited to fabricate a novel supercapacitor electrode material,
making use of the fast charge-discharge response of the electric field driven
protonation of 3,4,9,10-perylene tetracarboxylic acid [129].

1 Introduction
42
Figure 1.4 (a) Electrostatic potential distribution across a metal/acid monolayer/solutioninterface. (b) Schematic representation of a mixed monolayer of 11-mercaptoundecanoic acidand 1-decanethiol in contact with an electrolyte solution as a function of electrode potential (E)and pH. Reproduced from [121] with permission. Copyright 1998 American Chemical Society.
Other studies have used in situ quartz crystal microbalance (QCM) [130] and IR
spectroscopy [131-133] to determine the protonation/deprotonation behaviour of
carboxylic acid –terminated SAMs on gold electrodes and have observed protonation
taking place at positive potentials and deprotonation at negative potentials. Instead of
being driven by the electric field, the acid dissociation was thought to be governed by
the concentration of electrolyte cations near the surface that affected the apparent pKa
of the acid groups [130-133].

1 Introduction
43
Based on these conflicting reports, the nature and response of carboxylic acid groups
at the electrode surface seems quite complex and not entirely understood. Given their
ubiquity, not only as defect sites on carbon electrodes, but also in the polymer
electrolytes employed in solid supercapacitors, the response of organic acids to applied
electrode potential is an essential area of study.
1.5 Methods of immobilising GNF on Electrode
In order to use GNF in an electrochemical investigation, they must be fabricated into an
electrode. Various ways of constructing electrodes from nanomaterials exist, such as
incorporating the sample in a compact paste [134, 135] or screenprinting the sample as
an ink [136, 137], but these methods involve the addition of binders. An alternative
method is immobilisation on the surface of commercially available solid electrodes, and
this is the route chosen for my work. The surface modification can be achieved by
drop-coating, spin-coating or self-assembly.
1.5.1 Drop-coating
In drop-coating, a sample is first suspended in a desired solvent. A known volume of
the suspension is then applied onto the substrate and the solvent is allowed to
evaporate either under atmospheric conditions or under inert atmosphere. Drop-coating
is a quick and easy method of modifying electrodes, and it is widely used in
electrochemical research to immobilise graphene-related materials on electrode
surfaces [93-95]. However, it doesn’t give much control over the structure of the
deposited layer.
1.5.2 Spin-coating
Spin-coating is a technique for depositing thin films on flat substrates. The coating
material in a solution form is applied onto the substrate and the substrate is rotated at

1 Introduction
44
high speed, which causes the coating material to spread by centrifugal force. Spin-
coating offers many advantages, such as the ability to obtain uniform coatings and the
ability to control the thickness of the film by altering the speed of rotation. However, the
wastage is high in this process as >95% of the solution is wicked off the substrate
[138]. Spin-coating is a commonly used technique in microfabrication of solar cells
[139, 140], OLEDs [141] and field-effect transistors [142].
1.5.3 Self-assembly
Self-assembly of molecules at interfaces is a common phenomenon. It is exhibited by
surfactant molecules and lipids that consist of a polar head group and a hydrophobic
tail. Due to this ambiphility they aggregate and form micelles in emulsions and lipid
bilayers in living organisms.
Spontaneous adsorption on a substrate can occur if the substrate environment is
energetically more favourable than solution environment [143]. This process can be
exploited in surface engineering to tailor the interfacial properties of a surface. Self-
assembled monolayers carry several benefits compared to ultra-thin films made by
molecular beam epitaxy (MBE) or CVD. Firstly, they can be formed without expensive
equipment or the use of ultra-high vacuum (UHV). Secondly, highly ordered
monolayers can be formed using self-assembly on substrates of different shapes and
sizes [144]. Thirdly, there is a large variety of molecular structures available in terms of
head groups (thiols [145], silanes [146] and phosphonates [147]); tail groups (alkyl
chains [148], aromatic chains [144]); and end groups (non-polar [149], polar [133],
electroactive [150]).
SAMs of thiols on gold are a good example of spontaneous adsorption due to a very
strong gold-sulphur interaction. Gold is the most studied substrate due to, in part, the
great affinity with which it binds sulphur, but also because gold has many useful

1 Introduction
45
characteristics: thin films and nanoparticles of gold are straightforward to prepare; it
can be handled in atmospheric conditions due to its inert nature and ability to withstand
oxidation by atmospheric oxygen; it is a commonly used substrate in various
spectroscopic and analytical techniques; and it is compatible with cells [145].
The self-assembly occurs in two distinct kinetic steps: in the first, fast step, the head
groups chemisorb onto the Au substrate, followed by a slow reorganisation of the alkyl
chain tail groups to form a tightly packed, ordered monolayer [151].
In applications, the alkyl chain tail is often functionalised with an end group. Thiols with
a variety of different end groups are commercially available and synthesis procedures
are reported for many others, such as ferrocenyl-terminated alkanethiols [152] for
molecular diodes [150]. The identity of the end group affects interfacial properties [153],
but they can also be tailored to enable attachment of large, complex ligands after SAM
formation either covalently (antibodies for immunosensing [148], polymers for solar
cells [154]) , or via adsorption (proteins for cell adhesion [155], polyelectrolytes for
water purification [156]).
1.6 Aim and Scope of the Thesis
This thesis has three objectives: to examine the effect of specific surface functionalities
present at carbon electrodes on common redox probes; to study the potential-
dependent dissociation of acidic surface functionalities; and to explore different ways of
attaching functionalised carbon nanomaterials onto a surface.
The structure of this thesis is as follows: The main techniques used in this work are
briefly introduced in Chapter 2. Existing literature on GNF was summarised in Section
1.3 and further characterisation is presented in Chapter 3. Transmission electron
microscopy (TEM) was used to image the flakes, while attenuated total reflectance
Fourier transform infrared spectroscopy (ATR-FTIR) was employed to verify the identity

1 Introduction
46
of functional groups present, and to explore the acid/base properties of the material.
Cyclic voltammetry (CV) was also used to determine the electrochemical properties of
GNF immobilised onto an electrode surface. After characterising the GNF, their
influence on a standard outer-sphere redox couple was studied. Ferrocenemethanol
(FcMeOH) was used as a probe to ascertain whether electrode-immobilised GNF
would inhibit or improve electron transfer. Inner-sphere redox probes and redox
couples exhibiting proton-coupled electron transfer were also investigated to further
elucidate the influence on different electron transfer processes.
Chapter 4 focuses on the redox couple [Fe(CN)6]3−/4− and examines how it is affected
by the presence of GNF both in solution and immobilised on the electrode surface. CV,
IR and in situ spectroelectrochemical techniques were employed to gain information on
the stability of [Fe(CN)6]3−/4−.
In Chapter 5, the effect of potential on the carboxylic acid groups present at the GNF
edge is studied in depth. A new experimental protocol was developed for in situ
spectroelectrochemistry that involves applying a series of potential steps to the GNF-
modified electrode and monitoring possible changes to the GNF edge groups. A range
of different solution conditions were examined, including changing the identity of the
electrolyte cation and anion, varying the pH of the electrolyte and changing the ionic
strength of the electrolyte.
Chapter 6 explores different ways of attaching GNF onto a surface. Cysteine and
cystamine were used to form self-assembled monolayers on Au substrates that offered
two different types of head groups onto which GNF were attached. Thiol-functionalised
GNF were also assembled directly onto Au(111). CV, differential pulse voltammetry
(DPV), X-ray photoelectron spectroscopy (XPS) and scanning tunnelling microscopy
(STM) were used to verify the presence of GNF on the surface.

1 Introduction
47
References for Chapter 1
1. Wu, Y.; Wang, J.; Jiang, K., et al., Applications of Carbon Nanotubes in HighPerformance Lithium Ion Batteries. Frontiers of Physics 2014, 9 (3), 351-369.
2. Barsan, M. M.; Ghica, M. E.; Brett, C. M. A., Electrochemical Sensors andBiosensors Based on Redox Polymer/Carbon Nanotube Modified Electrodes: AReview. Anal. Chim. Acta 2015, 881, 1-23.
3. Kirner, S.; Sekita, M.; Guldi, D. M., 25th Anniversary Article: 25 Years ofFullerene Research in Electron Transfer Chemistry. Adv. Mater. 2014, 26 (10),1482-1493.
4. Coro, J.; Suárez, M.; Silva, L. S. R., et al., Fullerene Applications in Fuel Cells: AReview. Int. J. Hydrogen Energy 2016, 41 (40), 17944-17959.
5. Geim, A. K.; Novoselov, K. S., The Rise of Graphene. Nature Materials 2007, 6(3), 183-191.
6. Novoselov, K. S.; Geim, A. K.; Morozov, S. V., et al., Electric Field Effect inAtomically Thin Carbon Films. Science 2004, 306 (5696), 666-669.
7. Ferrari, A. C.; Meyer, J. C.; Scardaci, V., et al., Raman Spectrum of Grapheneand Graphene Layers. Phys. Rev. Lett. 2006, 97 (18), 187401.
8. Bellunato, A.; Arjmandi Tash, H.; Cesa, Y., et al., Chemistry at the Edge ofGraphene. ChemPhysChem 2016, 17 (6), 785-801.
9. He, K.; Lee, G.-D.; Robertson, A. W., et al., Hydrogen-Free Graphene Edges.Nature Communications 2014, 5, 3040.
10. Koskinen, P.; Malola, S.; Häkkinen, H., Evidence for Graphene Edges BeyondZigzag and Armchair. Physical Review B 2009, 80 (7), 073401.
11. Quintana, M.; Vazquez, E.; Prato, M., Organic Functionalization of Graphene inDispersions. Acc. Chem. Res. 2013, 46 (1), 138-148.
12. Avouris, P.; Dimitrakopoulos, C., Graphene: Synthesis and Applications. Mater.Today 2012, 15 (3), 86-97.
13. Guo, S.; Dong, S., Graphene Nanosheet: Synthesis, Molecular Engineering, ThinFilm, Hybrids, and Energy and Analytical Applications. Chem. Soc. Rev. 2011, 40(5), 2644-2672.
14. Valota, A. T.; Kinloch, I. A.; Novoselov, K. S., et al., Electrochemical Behavior ofMonolayer and Bilayer Graphene. ACS Nano 2011, 5 (11), 8809-8815.
15. Zhang, Y.; Tan, Y.-W.; Stormer, H. L., et al., Experimental Observation of theQuantum Hall Effect and Berry's Phase in Graphene. Nature 2005, 438 (7065),201-204.
16. Morozov, S. V.; Novoselov, K. S.; Katsnelson, M. I., et al., Giant Intrinsic CarrierMobilities in Graphene and Its Bilayer. Phys. Rev. Lett. 2008, 100 (1), 016602-016604.
17. Smith, R. J.; Lotya, M.; Coleman, J. N., The Importance of Repulsive PotentialBarriers for the Dispersion of Graphene Using Surfactants. New Journal ofPhysics 2010, 12 (12), 125008.

1 Introduction
48
18. Zhou, K.; Shi, Y.; Jiang, S., et al., A Facile Liquid Phase Exfoliation Method toPrepare Graphene Sheets with Different Sizes Expandable Graphite. Mater. Res.Bull. 2013, 48 (9), 2985-2992.
19. Xu, L.; McGraw, J.-W.; Gao, F., et al., Production of High-ConcentrationGraphene Dispersions in Low-Boiling-Point Organic Solvents by Liquid-PhaseNoncovalent Exfoliation of Graphite with a Hyperbranched Polyethylene andFormation of Graphene/Ethylene Copolymer Composites. The Journal ofPhysical Chemistry C 2013, 117 (20), 10730-10742.
20. Schlierf, A.; Yang, H.; Gebremedhn, E., et al., Nanoscale Insight into theExfoliation Mechanism of Graphene with Organic Dyes: Effect of Charge, Dipoleand Molecular Structure. Nanoscale 2013, 5 (10), 4205-4216.
21. Kovtyukhova, N. I.; Wang, Y.; Berkdemir, A., et al., Non-Oxidative Intercalationand Exfoliation of Graphite by Brønsted Acids. Nat Chem 2014, 6 (11), 957-963.
22. Paton, K. R.; Varrla, E.; Backes, C., et al., Scalable Production of LargeQuantities of Defect-Free Few-Layer Graphene by Shear Exfoliation in Liquids.Nat Mater 2014, 13 (6), 624-630.
23. Del Rio-Castillo, A. E.; Merino, C.; Díez-Barra, E., et al., Selective Suspension ofSingle Layer Graphene Mechanochemically Exfoliated from Carbon Nanofibres.Nano Research 2014, 7 (7), 963-972.
24. Kibena, E.; Mooste, M.; Kozlova, J., et al., Surface and ElectrochemicalCharacterisation of CVD Grown Graphene Sheets. Electrochem. Commun. 2013,35, 26-29.
25. Kumar, K.; Kim, Y.-S.; Yang, E.-H., The Influence of Thermal Annealing toRemove Polymeric Residue on the Electronic Doping and MorphologicalCharacteristics of Graphene. Carbon 2013, 65, 35-45.
26. Park, J.-H.; Jung, W.; Cho, D., et al., Simple, Green, and Clean Removal of aPoly(Methyl Methacrylate) Film on Chemical Vapor Deposited Graphene. Appl.Phys. Lett. 2013, 103 (17), 171609.
27. Ma, T.; Ren, W.; Liu, Z., et al., Repeated Growth–Etching–Regrowth for Large-Area Defect-Free Single-Crystal Graphene by Chemical Vapor Deposition. ACSNano 2014, 8 (12), 12806-12813.
28. Deokar, G.; Avila, J.; Razado-Colambo, I., et al., Towards High Quality CVDGraphene Growth and Transfer. Carbon 2015, 89, 82-92.
29. Cabrero-Vilatela, A.; Weatherup, R. S.; Braeuninger-Weimer, P., et al., Towardsa General Growth Model for Graphene CVD on Transition Metal Catalysts.Nanoscale 2016, 8 (4), 2149-2158.
30. Li, X.; Colombo, L.; Ruoff, R. S., Synthesis of Graphene Films on Copper Foils byChemical Vapor Deposition. Adv. Mater. 2016, 28 (29), 6247-6252.
31. Ta, H. Q.; Perello, D. J.; Duong, D. L., et al., Stranski–Krastanov and Volmer–Weber CVD Growth Regimes to Control the Stacking Order in Bilayer Graphene.Nano Lett. 2016, 16 (10), 6403-6410.
32. Wu, T.; Zhang, X.; Yuan, Q., et al., Fast Growth of Inch-Sized Single-CrystallineGraphene from a Controlled Single Nucleus on Cu-Ni Alloys. Nat Mater 2016, 15(1), 43-47.
33. Cho, J. H.; Gorman, J. J.; Na, S. R., et al., Growth of Monolayer Graphene onNanoscale Copper-Nickel Alloy Thin Films. Carbon 2017, 115, 441-448.
34. Nam, J.; Kim, D.-C.; Yun, H., et al., Chemical Vapor Deposition of Graphene onPlatinum: Growth and Substrate Interaction. Carbon 2017, 111, 733-740.
35. Wang, N.; Lin, M.; Dai, H., et al., Functionalized Gold Nanoparticles/ReducedGraphene Oxide Nanocomposites for Ultrasensitive Electrochemical Sensing ofMercury Ions Based on Thymine–Mercury–Thymine Structure. Biosens.Bioelectron. 2016, 79, 320-326.
36. Zhan, T.; Wang, X.; Li, X., et al., Hemoglobin Immobilized in Exfoliated Co2AlLDH-Graphene Nanocomposite Film: Direct Electrochemistry and

1 Introduction
49
Electrocatalysis toward Trichloroacetic Acid. Sensors and Actuators B: Chemical2016, 228, 101-108.
37. Zhang, B.; Xiao, C.; Xiang, Y., et al., Nitrogen-Doped Graphene Quantum DotsAnchored on Thermally Reduced Graphene Oxide as an Electrocatalyst for theOxygen Reduction Reaction. ChemElectroChem 2016, 3 (6), 864-870.
38. Muñoz, R.; Gómez-Aleixandre, C., Review of CVD Synthesis of Graphene.Chem. Vap. Deposition 2013, 19 (10-11-12), 297-322.
39. Geng, D.; Wang, H.; Yu, G., Graphene Single Crystals: Size and MorphologyEngineering. Adv. Mater. 2015, 27 (18), 2821-2837.
40. Lin, L.; Liu, Z., Graphene Synthesis: On-the-Spot Growth. Nat Mater 2016, 15 (1),9-10.
41. Chen, R.; Nioradze, N.; Santhosh, P., et al., Ultrafast Electron Transfer Kineticsof Graphene Grown by Chemical Vapor Deposition. Angew. Chem. 2015, 127(50), 15349-15352.
42. Niu, L.; Coleman, J. N.; Zhang, H., et al., Production of Two-DimensionalNanomaterials Via Liquid-Based Direct Exfoliation. Small 2016, 12 (3), 272-293.
43. Khan, U.; Porwal, H.; O’Neill, A., et al., Solvent-Exfoliated Graphene at ExtremelyHigh Concentration. Langmuir 2011, 27 (15), 9077-9082.
44. Abdelkader, A. M.; Cooper, A. J.; Dryfe, R. A. W., et al., How to Get between theSheets: A Review of Recent Works on the Electrochemical Exfoliation ofGraphene Materials from Bulk Graphite. Nanoscale 2015, 7 (16), 6944-6956.
45. Brodie, B. C., Sur Le Poids Atomique Du Graphite. Annales de Chimie et dePhysique 1860, 59, 466-472.
46. Staudenmaier, L., Verfahren Zur Darstellung Der Graphitsaure. Berichte derDeutschen Chemischen Gesellschaft 1898, 31, 1481.
47. Hummers, W. S.; Offeman, R. E., Preparation of Graphitic Oxide. J. Am. Chem.Soc. 1958, 80 (2), 1339-1348.
48. Dreyer, D. R.; Park, S.; Bielawski, C. W., et al., The Chemistry of GrapheneOxide. Chem. Soc. Rev. 2010, 39 (1), 228-240.
49. Zhu, Y. W.; Murali, S.; Cai, W. W., et al., Graphene and Graphene Oxide:Synthesis, Properties, and Applications. Adv. Mater. 2010, 22 (35), 3906-3924.
50. Dave, S. H.; Gong, C.; Robertson, A. W., et al., Chemistry and Structure ofGraphene Oxide Via Direct Imaging. ACS Nano 2016, 10 (8), 7515-7522.
51. Hofmann, U.; Holst, R., Über Die Säurenatur Und Die Methylierung VonGraphitoxyd. Berichte der deutschen chemischen Gesellschaft (A and B Series)1939, 72 (4), 754-771.
52. Ruess, G., Über Das Graphitoxyhydroxyd (Graphitoxyd). Monatshefte für Chemieund verwandte Teile anderer Wissenschaften 1947, 76 (3-5), 381-417.
53. Lerf, A.; He, H. Y.; Forster, M., et al., Structure of Graphite Oxide Revisited. TheJournal of Physical Chemistry B 1998, 102 (23), 4477-4482.
54. Szabó, T.; Berkesi, O.; Forgó, P., et al., Evolution of Surface Functional Groupsin a Series of Progressively Oxidized Graphite Oxides. Chem. Mater. 2006, 18(11), 2740-2749.
55. Dimiev, A. M.; Alemany, L. B.; Tour, J. M., Graphene Oxide. Origin of Acidity, ItsInstability in Water, and a New Dynamic Structural Model. ACS Nano 2013, 7 (1),576-588.
56. Green, N. S.; Norton, M. L., Interactions of DNA with Graphene and SensingApplications of Graphene Field-Effect Transistor Devices: A Review. Anal. Chim.Acta 2015, 853, 127-142.
57. Lin, L.; Liao, L.; Yin, J., et al., Building Graphene P–N Junctions for Next-Generation Photodetection. Nano Today 2015, 10 (6), 701-716.
58. Singh, E.; Nalwa, H. S., Stability of Graphene-Based Heterojunction Solar Cells.RSC Advances 2015, 5 (90), 73575-73600.

1 Introduction
50
59. Sun, Y.; Zhang, W.; Chi, H., et al., Recent Development of Graphene MaterialsApplied in Polymer Solar Cell. Renewable and Sustainable Energy Reviews2015, 43, 973-980.
60. Choi, H.; Yoon, H., Nanostructured Electrode Materials for ElectrochemicalCapacitor Applications. Nanomaterials 2015, 5 (2), 906.
61. Fan, X.; Chen, X.; Dai, L., 3D Graphene Based Materials for Energy Storage.Current Opinion in Colloid & Interface Science 2015, 20 (5–6), 429-438.
62. Mombeshora, E. T.; Nyamori, V. O., A Review on the Use of CarbonNanostructured Materials in Electrochemical Capacitors. International Journal ofEnergy Research 2015, 39 (15), 1955-1980.
63. Adhikari, B.-R.; Govindhan, M.; Chen, A., Carbon Nanomaterials BasedElectrochemical Sensors/Biosensors for the Sensitive Detection ofPharmaceutical and Biological Compounds. Sensors 2015, 15 (9), 22490.
64. Kumar, S.; Ahlawat, W.; Kumar, R., et al., Graphene, Carbon Nanotubes, ZincOxide and Gold as Elite Nanomaterials for Fabrication of Biosensors forHealthcare. Biosens. Bioelectron. 2015, 70, 498-503.
65. Wang, Z.; Yu, J.; Gui, R., et al., Carbon Nanomaterials-Based ElectrochemicalAptasensors. Biosens. Bioelectron. 2016, 79, 136-149.
66. Dao, T. D.; Lee, H.-i.; Jeong, H. M., et al., Direct Covalent Modification ofThermally Exfoliated Graphene Forming Functionalized Graphene StablyDispersible in Water and Poly(Vinyl Alcohol). Colloid. Polym. Sci. 2013, 291 (10),2365-2374.
67. Hsiao, S.-T.; Ma, C.-C. M.; Tien, H.-W., et al., Effect of Covalent Modification ofGraphene Nanosheets on the Electrical Property and ElectromagneticInterference Shielding Performance of a Water-Borne Polyurethane Composite.ACS Applied Materials & Interfaces 2015, 7 (4), 2817-2826.
68. Myung, S.; Yin, P. T.; Kim, C., et al., Label-Free Polypeptide-Based EnzymeDetection Using a Graphene-Nanoparticle Hybrid Sensor. Adv. Mater. 2012, 24(45), 6081-6087.
69. Chia, J. S. Y.; Tan, M. T. T.; Khiew, P. S., et al., A Bio-Electrochemical SensingPlatform for Glucose Based on Irreversible, Non-Covalent Pi–Pi Functionalizationof Graphene Produced Via a Novel, Green Synthesis Method. Sensors andActuators B: Chemical 2015, 210, 558-565.
70. Wang, J.; Zhao, Y.; Ma, F.-X., et al., Synthesis of a Hydrophilic Poly-L-Lysine/Graphene Hybrid through Multiple Non-Covalent Interactions forBiosensors. Journal of Materials Chemistry B 2013, 1 (10), 1406-1413.
71. Yangqiao, L.; Lian, G.; Jing, S., et al., Stable Nafion-Functionalized GrapheneDispersions for Transparent Conducting Films. Nanotechnology 2009, 20 (46),465605.
72. Lim, C. X.; Hoh, H. Y.; Ang, P. K., et al., Direct Voltammetric Detection of DNAand pH Sensing on Epitaxial Graphene: An Insight into the Role of OxygenatedDefects. Analytical Chemistry 2010, 82 (17), 7387-7393.
73. Sharma, R.; Baik, J. H.; Perera, C. J., et al., Anomalously Large Reactivity ofSingle Graphene Layers and Edges toward Electron Transfer Chemistries. NanoLett. 2010, 10 (2), 398-405.
74. Brownson, D. A. C.; Munro, L. J.; Kampouris, D. K., et al., Electrochemistry ofGraphene: Not Such a Beneficial Electrode Material? RSC Advances 2011, 1 (6),978-988.
75. Edwards, M. A.; Bertoncello, P.; Unwin, P. R., Slow Diffusion Reveals theIntrinsic Electrochemical Activity of Basal Plane Highly Oriented PyrolyticGraphite Electrodes. The Journal of Physical Chemistry C 2009, 113 (21), 9218-9223.

1 Introduction
51
76. Lai, S. C. S.; Patel, A. N.; McKelvey, K., et al., Definitive Evidence for FastElectron Transfer at Pristine Basal Plane Graphite from High-ResolutionElectrochemical Imaging. Angew. Chem. Int. Ed. 2012, 51 (22), 5405-5408.
77. Patel, A. N.; Collignon, M. G.; O’Connell, M. A., et al., A New View ofElectrochemistry at Highly Oriented Pyrolytic Graphite. J. Am. Chem. Soc. 2012,134 (49), 20117-20130.
78. Ebejer, N.; Gueell, A. G.; Lai, S. C. S., et al., Scanning Electrochemical CellMicroscopy: A Versatile Technique for Nanoscale Electrochemistry andFunctional Imaging. Annual Review of Analytical Chemistry, Vol 6 2013, 6, 329-351.
79. Patel, A. N.; Tan, S.-y.; Unwin, P. R., Epinephrine Electro-Oxidation HighlightsFast Electrochemistry at the Graphite Basal Surface. Chem. Commun. 2013, 49(78), 8776-8778.
80. Gueell, A. G.; Ebejer, N.; Snowden, M. E., et al., Structural Correlations inHeterogeneous Electron Transfer at Monolayer and Multilayer GrapheneElectrodes. J. Am. Chem. Soc. 2012, 134 (17), 7258-7261.
81. Miller, T. S.; Ebejer, N.; Gueell, A. G., et al., Electrochemistry at CarbonNanotube Forests: Sidewalls and Closed Ends Allow Fast Electron Transfer.Chem. Commun. 2012, 48 (60), 7435-7437.
82. Gueell, A. G.; Meadows, K. E.; Dudin, P. V., et al., Mapping NanoscaleElectrochemistry of Individual Single-Walled Carbon Nanotubes. Nano Lett. 2014,14 (1), 220-224.
83. Rowley-Neale, S. J.; Brownson, D. A. C.; Banks, C. E., Defining the Origins ofElectron Transfer at Screen-Printed Graphene-Like and Graphite Electrodes:MoO2 Nanowire Fabrication on Edge Plane Sites Reveals ElectrochemicalInsights. Nanoscale 2016, 8 (33), 15241-15251.
84. Li, Z.; Wang, Y.; Kozbial, A., et al., Effect of Airborne Contaminants on theWettability of Supported Graphene and Graphite. Nat Mater 2013, 12 (10), 925-931.
85. McDermott, C. A.; Kneten, K. R.; McCreery, R. L., Electron Transfer Kinetics ofAquated Fe+3/+2, Eu+3/+2, and V+3/+2 at Carbon Electrodes: Inner Sphere Catalysisby Surface Oxides. J. Electrochem. Soc. 1993, 140 (9), 2593-2599.
86. Chen, P.; Fryling, M. A.; McCreery, R. L., Electron Transfer Kinetics at ModifiedCarbon Electrode Surfaces: The Role of Specific Surface Sites. AnalyticalChemistry 1995, 67 (18), 3115-3122.
87. Chen, P.; McCreery, R. L., Control of Electron Transfer Kinetics at Glassy CarbonElectrodes by Specific Surface Modification. Analytical Chemistry 1996, 68 (22),3958-3965.
88. McCreery, R. L., Advanced Carbon Electrode Materials for MolecularElectrochemistry. Chem. Rev. 2008, 108 (7), 2646-2687.
89. Li, W.; Tan, C.; Lowe, M. A., et al., Electrochemistry of Individual MonolayerGraphene Sheets. ACS Nano 2011, 5 (3), 2264-2270.
90. Punckt, C.; Pope, M. A.; Liu, Y. M., et al., Structure-Dependent Electrochemistryof Reduced Graphene Oxide Monolayers. J. Electrochem. Soc. 2016, 163 (7),H491-H498.
91. Zhang, H.; Bo, X.; Guo, L., Electrochemical Preparation of Porous Graphene andIts Electrochemical Application in the Simultaneous Determination ofHydroquinone, Catechol, and Resorcinol. Sensors and Actuators B: Chemical2015, 220, 919-926.
92. Li, S.-J.; Xing, Y.; Deng, D.-H., et al., A Comparative Study of Different Types ofReduced Graphene Oxides as Electrochemical Sensing Platforms forHydroquinone and Catechol. J. Solid State Electrochem. 2015, 19 (3), 861-870.
93. Robledo, S. N.; López, J. C.; Granero, A. M., et al., Characterization of theSurface Redox Process of Caffeic Acid Adsorbed at Glassy Carbon Electrodes

1 Introduction
52
Modified with Partially Reduced Graphene Oxide. J. Electroanal. Chem. 2016,783, 258-267.
94. Bagheri, H.; Hajian, A.; Rezaei, M., et al., Composite of Cu Metal Nanoparticles-Multiwall Carbon Nanotubes-Reduced Graphene Oxide as a Novel and HighPerformance Platform of the Electrochemical Sensor for SimultaneousDetermination of Nitrite and Nitrate. J. Hazard. Mater. 2017, 324, Part B, 762-772.
95. Haldorai, Y.; Yeon, S.-H.; Huh, Y. S., et al., Electrochemical Determination ofTryptophan Using a Glassy Carbon Electrode Modified with Flower-LikeStructured Nanocomposite Consisting of Reduced Graphene Oxide and SnO2.Sensors and Actuators B: Chemical 2017, 239, 1221-1230.
96. Punckt, C.; Pope, M. A.; Aksay, I. A., High Selectivity of Porous GrapheneElectrodes Solely Due to Transport and Pore Depletion Effects. The Journal ofPhysical Chemistry C 2014, 118 (39), 22635-22642.
97. Pumera, M.; Ambrosi, A.; Chng, E. L. K., Impurities in Graphenes and CarbonNanotubes and Their Influence on the Redox Properties. Chemical Science 2012,3 (12), 3347-3355.
98. Wang, L.; Chua, C. K.; Khezri, B., et al., Remarkable Electrochemical Propertiesof Electrochemically Reduced Graphene Oxide Towards Oxygen ReductionReaction Are Caused by Residual Metal-Based Impurities. Electrochem.Commun. 2016, 62, 17-20.
99. Ambrosi, A.; Chua, C. K.; Khezri, B., et al. In Chemically Reduced GrapheneContains Inherent Metallic Impurities Present in Parent Natural and SyntheticGraphite, Proc Natl Acad Sci U S A, Aug 7; 2012; pp 12899-904.
100. Stankovich, S.; Dikin, D. A.; Piner, R. D., et al., Synthesis of Graphene-BasedNanosheets Via Chemical Reduction of Exfoliated Graphite Oxide. Carbon 2007,45 (7), 1558-1565.
101. Si, Y.; Samulski, E. T., Synthesis of Water Soluble Graphene. Nano Lett. 2008, 8(6), 1679-1682.
102. Ren, P. G.; Yan, D. X.; Ji, X., et al., Temperature Dependence of GrapheneOxide Reduced by Hydrazine Hydrate. Nanotechnology 2011, 22 (5).
103. Fujimoto, Y.; Saito, S., Formation, Stabilities, and Electronic Properties ofNitrogen Defects in Graphene. Physical Review B 2011, 84 (24), 245446.
104. Compton, O. C.; Nguyen, S. T., Graphene Oxide, Highly Reduced GrapheneOxide, and Graphene: Versatile Building Blocks for Carbon-Based Materials.Small 2010, 6 (6), 711-23.
105. Kim, Y.-R.; Bong, S.; Kang, Y.-J., et al., Electrochemical Detection of Dopaminein the Presence of Ascorbic Acid Using Graphene Modified Electrodes. Biosens.Bioelectron. 2010, 25 (10), 2366-2369.
106. Du, H.; Ye, J.; Zhang, J., et al., A Voltammetric Sensor Based on Graphene-Modified Electrode for Simultaneous Determination of Catechol andHydroquinone. J. Electroanal. Chem. 2011, 650 (2), 209-213.
107. Rosillo-Lopez, M.; Lee, T. J.; Bella, M., et al., Formation and Chemistry ofCarboxylic Anhydrides at the Graphene Edge. RSC Advances 2015, 5 (126),104198-104202.
108. McNaught, A. D.; Wilkinson, A., IUPAC. Compendium of Chemical Terminology(the "Gold Book"). 2nd ed.; Blackwell Scientific Publications: Oxford, 1997.
109. Mkhoyan, K. A.; Contryman, A. W.; Silcox, J., et al., Atomic and ElectronicStructure of Graphene-Oxide. Nano Lett. 2009, 9 (3), 1058-1063.
110. Lounasvuori, M. M.; Rosillo-Lopez, M.; Salzmann, C. G., et al., ElectrochemicalCharacterisation of Graphene Nanoflakes with Functionalised Edges. FaradayDiscussions 2014, 172 ( ), 293-310.

1 Introduction
53
111. Veerapandian, M.; Lee, M.-H.; Krishnamoorthy, K., et al., Synthesis,Characterization and Electrochemical Properties of Functionalized GrapheneOxide. Carbon 2012, 50 (11), 4228-4238.
112. Kauppila, J.; Kunnas, P.; Damlin, P., et al., Electrochemical Reduction ofGraphene Oxide Films in Aqueous and Organic Solutions. Electrochim. Acta2013, 89, 84-89.
113. Krishnamoorthy, K.; Veerapandian, M.; Yun, K., et al., The Chemical andStructural Analysis of Graphene Oxide with Different Degrees of Oxidation.Carbon 2013, 53 (0), 38-49.
114. Zhang, C.; Dabbs, D. M.; Liu, L.-M., et al., Combined Effects of FunctionalGroups, Lattice Defects, and Edges in the Infrared Spectra of Graphene Oxide.The Journal of Physical Chemistry C 2015, 119 (32), 18167-18176.
115. Hutton, L. A.; Iacobini, J. G.; Bitziou, E., et al., Examination of the FactorsAffecting the Electrochemical Performance of Oxygen-Terminated PolycrystallineBoron-Doped Diamond Electrodes. Analytical Chemistry 2013, 85 (15), 7230-7240.
116. Balapanuru, J.; Yang, J.-X.; Xiao, S., et al., A Graphene Oxide–Organic Dye IonicComplex with DNA-Sensing and Optical-Limiting Properties. Angew. Chem. Int.Ed. 2010, 49 (37), 6549-6553.
117. Qiu J, Z. R., Li J, Sang Y, Tang W, Rivera Gil P, Liu H, Fluorescent GrapheneQuantum Dots as Traceable, pH-Sensitive Drug Delivery Systems. InternationalJournal of Nanomedicine 2015, 10 (1), 6709—6724.
118. Cañizares, P.; García-Gómez, J.; Lobato, J., et al., Electrochemical Oxidation ofAqueous Carboxylic Acid Wastes Using Diamond Thin-Film Electrodes. Industrial& Engineering Chemistry Research 2003, 42 (5), 956-962.
119. Coleman, J. P., The Electrochemistry of Carboxylic Acids and Derivatives:Cathodic Reductions. In Acid Derivatives: Volume 2 (1979), Patai, S., Ed. JohnWiley & Sons, Ltd.: Chichester, UK, 1979; pp 781-824.
120. Shao, Y.; Wang, J.; Engelhard, M., et al., Facile and Controllable ElectrochemicalReduction of Graphene Oxide and Its Applications. J. Mater. Chem. 2010, 20 (4),743-748.
121. White, H. S.; Peterson, J. D.; Cui, Q., et al., Voltammetric Measurement ofInterfacial Acid/Base Reactions. The Journal of Physical Chemistry B 1998, 102(16), 2930-2934.
122. Burgess, I.; Seivewright, B.; Lennox, R. B., Electric Field DrivenProtonation/Deprotonation of Self-Assembled Monolayers of Acid-TerminatedThiols. Langmuir 2006, 22 (9), 4420-4428.
123. Rosendahl, S. M.; Burgess, I. J., Electrochemical and Infrared SpectroscopyStudies of 4-Mercaptobenzoic Acid SAMs on Gold Surfaces. Electrochim. Acta2008, 53 (23), 6759-6767.
124. Wang, M.; Xiao, F.-N.; Wang, K., et al., Electric Field DrivenProtonation/Deprotonation of 3,4,9,10-Perylene Tetracarboxylic Acid Immobilizedon Graphene Sheets Via Π–Π Stacking. J. Electroanal. Chem. 2013, 688, 304-307.
125. Smith, C. P.; White, H. S., Voltammetry of Molecular Films Containing Acid/BaseGroups. Langmuir 1993, 9 (1), 1-3.
126. Andreu, R.; Fawcett, W. R., Discreteness-of-Charge Effects at Molecular FilmsContaining Acid/Base Groups. The Journal of Physical Chemistry 1994, 98 (48),12753-12758.
127. Fawcett, W. R.; Fedurco, M.; Kovacova, Z., Double Layer Effects at MolecularFilms Containing Acid/Base Groups. Langmuir 1994, 10 (7), 2403-2408.
128. Luque, A. M.; Mulder, W. H.; Calvente, J. J., et al., Proton Transfer Voltammetryat Electrodes Modified with Acid Thiol Monolayers. Analytical Chemistry 2012, 84(13), 5778-5786.

1 Introduction
54
129. Gan, S.; Zhong, L.; Gao, L., et al., Electrochemically Driven Surface-ConfinedAcid/Base Reaction for an Ultrafast H+ Supercapacitor. J. Am. Chem. Soc. 2016.
130. Sugihara, K.; Shimazu, K.; Uosaki, K., Electrode Potential Effect on the SurfacepKa of a Self-Assembled 15-Mercaptohexadecanoic Acid Monolayer on aGold/Quartz Crystal Microbalance Electrode. Langmuir 2000, 16 (18), 7101-7105.
131. Futamata, M., Characterization of the First Layer and Second Layer Adsorbateson Au Electrodes Using ATR-IR Spectroscopy. J. Electroanal. Chem. 2003, 550–551, 93-103.
132. Goutev, N.; Futamata, M., Attenuated Total Reflection Surface-EnhancedInfrared Absorption Spectroscopy of Carboxyl Terminated Self-AssembledMonolayers on Gold. Appl. Spectrosc. 2003, 57 (5), 506-513.
133. Luque, A. M.; Cuesta, A.; Calvente, J. J., et al., Potentiostatic Infrared Titration of11-Mercaptoundecanoic Acid Monolayers. Electrochem. Commun. 2014, 45, 13-16.
134. Alizadeh, T.; Azizi, S., Graphene/Graphite Paste Electrode Incorporated withMolecularly Imprinted Polymer Nanoparticles as a Novel Sensor for DifferentialPulse Voltammetry Determination of Fluoxetine. Biosens. Bioelectron. 2016, 81,198-206.
135. Heidari, H.; Habibi, E., Amperometric Enzyme-Free Glucose Sensor Based onthe Use of a Reduced Graphene Oxide Paste Electrode Modified withElectrodeposited Cobalt Oxide Nanoparticles. Microchimica Acta 2016, 183 (7),2259-2266.
136. Fu, K.; Wang, Y.; Yan, C., et al., Graphene Oxide-Based Electrode Inks for 3D-Printed Lithium-Ion Batteries. Adv. Mater. 2016, 28 (13), 2587-2594.
137. Li, C.; Guo, B.; Guo, X. M., et al., The Electrochemical Sensor Based onElectrochemical Oxidation of Nitrite on Metalloporphyrin-Graphene ModifiedGlassy Carbon Electrode. RSC Advances 2016, 6 (93), 90480-90488.
138. Madou, M. J., Fundamentals of Microfabrication and Nanotechnology Volume II.Manufacturing Techniques for Microfabrication and Nanotechnology. CRC Press:Boca Raton, 2011.
139. Krebs, F. C., Fabrication and Processing of Polymer Solar Cells: A Review ofPrinting and Coating Techniques. Sol. Energy Mater. Sol. Cells 2009, 93 (4), 394-412.
140. Hanaei, H.; Assadi, M. K.; Saidur, R., Highly Efficient Antireflective and Self-Cleaning Coatings That Incorporate Carbon Nanotubes (CNTs) into Solar Cells:A Review. Renewable and Sustainable Energy Reviews 2016, 59, 620-635.
141. Eccher, J.; Zajaczkowski, W.; Faria, G. C., et al., Thermal Evaporation VersusSpin-Coating: Electrical Performance in Columnar Liquid Crystal OLEDs. ACSApplied Materials & Interfaces 2015, 7 (30), 16374-16381.
142. Wang, D.; Noël, V.; Piro, B., Electrolytic Gated Organic Field-Effect Transistorsfor Application in Biosensors—a Review. Electronics 2016, 5 (1), 9-32.
143. Bard, A. J.; Faulkner, L. R.; Leddy, J., Electrochemical Methods : Fundamentalsand Applications. 2nd ed.; Wiley: New York ; Chichester, 2001; p xxi, 833 p.
144. Goldmann, C.; Lazzari, R.; Paquez, X., et al., Charge Transfer at HybridInterfaces: Plasmonics of Aromatic Thiol-Capped Gold Nanoparticles. ACS Nano2015, 9 (7), 7572-7582.
145. Love, J. C.; Estroff, L. A.; Kriebel, J. K., et al., Self-Assembled Monolayers ofThiolates on Metals as a Form of Nanotechnology. Chem. Rev. 2005, 105 (4),1103-1170.
146. Liu, L.; Mei, A.; Liu, T., et al., Fully Printable Mesoscopic Perovskite Solar Cellswith Organic Silane Self-Assembled Monolayer. J. Am. Chem. Soc. 2015, 137(5), 1790-1793.

1 Introduction
55
147. Hoque, E.; Derose, J. A.; Hoffmann, P., et al., Phosphonate Self-AssembledMonolayers on Aluminum Surfaces. The Journal of chemical physics 2006, 124(17), 174710.
148. Bhadra, P.; Shajahan, M. S.; Bhattacharya, E., et al., Studies on Varying n-Alkanethiol Chain Lengths on a Gold Coated Surface and Their Effect onAntibody-Antigen Binding Efficiency. RSC Advances 2015, 5 (98), 80480-80487.
149. Srinivasan, U.; Houston, M. R.; Howe, R. T., et al., Alkyltrichlorosilane-BasedSelf-Assembled Monolayer Films for Stiction Reduction in Silicon Micromachines.Journal of Microelectromechanical Systems 1998, 7 (2), 252-260.
150. Yuan, L.; Thompson, D.; Cao, L., et al., One Carbon Matters: The Origin andReversal of Odd–Even Effects in Molecular Diodes with Self-AssembledMonolayers of Ferrocenyl-Alkanethiolates. The Journal of Physical Chemistry C2015, 119 (31), 17910-17919.
151. Ulman, A., Formation and Structure of Self-Assembled Monolayers. Chem. Rev.1996, 96 (4), 1533-1554.
152. Creager, S. E.; Rowe, G. K., Competitive Self-Assembly and Electrochemistry ofSome Ferrocenyl-n-Alkanethiol Derivatives on Gold. J. Electroanal. Chem. 1994,370 (1), 203-211.
153. Laibinis, P. E.; Whitesides, G. M.; Allara, D. L., et al., Comparison of theStructures and Wetting Properties of Self-Assembled Monolayers of n-Alkanethiols on the Coinage Metal Surfaces, Copper, Silver, and Gold. J. Am.Chem. Soc. 1991, 113 (19), 7152-7167.
154. Murugan, P.; Krishnamurthy, M.; Jaisankar, S. N., et al., Controlled Decoration ofthe Surface with Macromolecules: Polymerization on a Self-AssembledMonolayer (SAM). Chem. Soc. Rev. 2015, 44 (10), 3212-3243.
155. Arima, Y.; Iwata, H., Preferential Adsorption of Cell Adhesive Proteins fromComplex Media on Self-Assembled Monolayers and Its Effect on SubsequentCell Adhesion. Acta Biomaterialia 2015, 26, 72-81.
156. Maroni, P.; Montes Ruiz-Cabello, F. J.; Cardoso, C., et al., Adsorbed Mass ofPolymers on Self-Assembled Monolayers: Effect of Surface Chemistry andPolymer Charge. Langmuir 2015, 31 (22), 6045-6054.

56
2 Experimental Theory and Techniques
2.1 Electrochemistry
Electrochemistry studies the relationship between electrical energy and chemical
change. In electrochemical systems, a chemical reaction can be harnessed to produce
electrical energy, or an external current can be supplied to a system to drive a chemical
change. In order for an electrochemical reaction to happen, charge must be transferred
across the interface between the different chemical phases of an electrode and an
electrolyte. The electrode is a solid electronic conductor, typically metal, carbon or a
semiconductor material, whereas the electrolyte is an ionic conductor and can be solid,
liquid or plasma.
The electrode-solution interface behaves much like a capacitor. Due to the potential
difference between the electrode and the solution, charge qM accumulates on the
electrode surface in the form of excess electrons or holes, depending on the potential

2 Experimental Theory and Techniques
57
difference. At the same time, charge qS accumulates in a thin layer of solution next to
the electrode in the form of excess anions or cations so that qM = −qS [1]. This
arrangement of charged species and dipoles at the electrode-solution interface,
illustrated in Figure 2.1, is called the electrical double layer. On the solution side, the
structure of the layer changes with distance from the electrode surface, and this affects
the potential profile across the double layer as shown in Figure 2.1. The region closest
to the electrode is called the Helmholtz layer and it is defined by the inner Helmholtz
plane (IHP), the plane through the electrical centres of specifically adsorbed ions.
Solvent molecules will also reside in the inner layer. Solvated ions can only approach
the electrode to a distance called the outer Helmholt plane (OHP) and they will only
interact with the electrode through electrostatic forces. Due to the potential drop
through the double layer, the potential experienced by these non-specifically adsorbed,
solvated ions at the OHP is less than the potential difference between the electrode
and the solution by φ2 − φS. [1]
Figure 2.1 A schematic representation of the electric double layer at the electrode-solutioninterface and the potential profile across the double layer region in the absence of specific
adsorption. Adapted from [1] with permission.
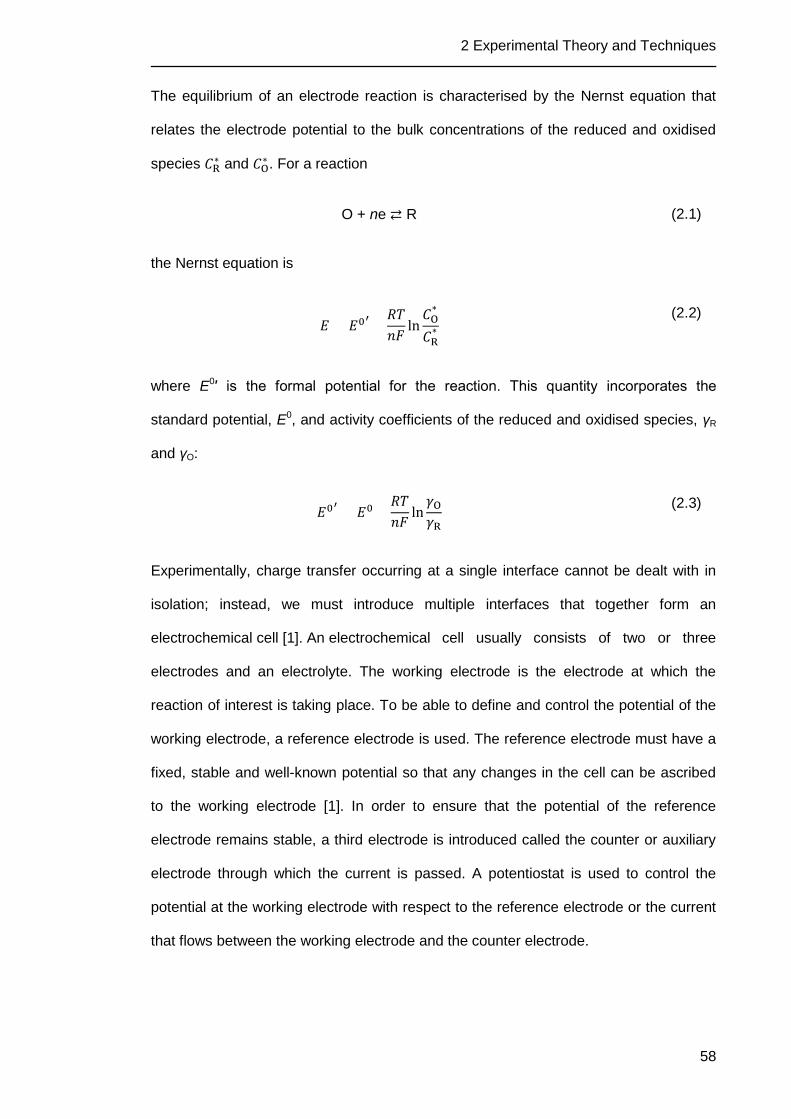
2 Experimental Theory and Techniques
58
The equilibrium of an electrode reaction is characterised by the Nernst equation that
relates the electrode potential to the bulk concentrations of the reduced and oxidised
species ∗ and
∗ . For a reaction
O + ne R (2.1)
the Nernst equation is
=
+
ln
*
*
(2.2)
where E0′ is the formal potential for the reaction. This quantity incorporates the
standard potential, E0, and activity coefficients of the reduced and oxidised species, γR
and γO:
= +
ln
(2.3)
Experimentally, charge transfer occurring at a single interface cannot be dealt with in
isolation; instead, we must introduce multiple interfaces that together form an
electrochemical cell [1]. An electrochemical cell usually consists of two or three
electrodes and an electrolyte. The working electrode is the electrode at which the
reaction of interest is taking place. To be able to define and control the potential of the
working electrode, a reference electrode is used. The reference electrode must have a
fixed, stable and well-known potential so that any changes in the cell can be ascribed
to the working electrode [1]. In order to ensure that the potential of the reference
electrode remains stable, a third electrode is introduced called the counter or auxiliary
electrode through which the current is passed. A potentiostat is used to control the
potential at the working electrode with respect to the reference electrode or the current
that flows between the working electrode and the counter electrode.

2 Experimental Theory and Techniques
59
A supporting electrolyte is used for several reasons. Firstly, it is used to increase the
conductivity of the solution, which helps to reduce the so-called iR drop, a drop in the
potential between the working and reference electrode caused by solution resistance.
Secondly, using a supporting electrolyte in excess compared to the electroactive
species of interest ensures that practically all current is transported by the electrolyte
and thus the contribution of migration to the mass transport of the electroactive species
is minimised. Thirdly, by using a suitable supporting electrolyte the ionic strength and
pH of the solution can be maintained constant irrespective of reactions occurring at the
electrodes. Fourthly, the use of a supporting electrolyte minimises the thickness of the
electrical double layer, and therefore the potential drop, at the electrode interface. [1]
2.1.1 Cyclic Voltammetry
CV is a widely used electrochemical technique where the voltage is ramped linearly in
time and the resulting current is recorded as a function of potential. A single cyclic
voltammogram can give a multitude of information about the kinetics of heterogeneous
electron transfer (HET), the thermodynamics of a redox reaction and adsorption
processes occurring at the electrode.
Consider the redox couple in Equation (2.1). A CV experiment is carried out initially
with only species R in solution. The potential is swept from Ei (usually Ei is chosen at
which no electrode reactions occur, in this case sufficiently negative of E0′ so that R
isn’t oxidised) to Eλ at rate v (usually in the range of mV s−1). As the potential
approaches E0′, the current begins to increase rapidly as R is oxidised at the electrode
to produce O. This depletes R from the vicinity of the electrode surface, creating a
concentration gradient that causes R to diffuse towards the electrode. Up until a
potential Epa somewhat positive of E0′, the mass transfer or R to the electrode surface
can maintain the ratio of O and R to satisfy the Nernst equation. At Epa the diffusion
layer of R becomes so thick that the flux of R to the electrode is no longer fast enough

2 Experimental Theory and Techniques
60
to support equilibrium concentration of R at the electrode surface. At this point the
oxidation becomes controlled by the rate of mass transfer of R and the current begins
to decay1. When Eλ is reached, the scan rate is switched to –v and the potential is
ramped back to Ei. In the reverse sweep, the current response has a similar shape to
the forward sweep and can be explained by the same arguments of mass transfer rate
and concentration gradient. The potential sweep and resulting cyclic voltammogram
are depicted in Figure 2.2.
Figure 2.2 Waveforms in cyclic voltammetry. (a) Potential as a function of time, (b) current as afunction of potential. Adapted from [1] with permission.
CV can be used to assess the reversibility of a reaction. For a Nernstian reaction, the
separation of peak potentials, ΔEp, is given by Equation (2.4)
ΔEp = | Epa – Epc | ≈ 2.3RT
nF(2.4)
Equation (2.4) gives ΔEp = 59/n mV at 25 °C. If the standard heterogeneous electron
transfer rate constant k0 is very low, a large overpotential η is required before current
begins to flow and the peak potentials are pushed further apart. Therefore, ΔEp that
increases with increasing scan rate is indicative of slow HET.
1At an electrode smaller than the scale of the diffusion layer the current will reach a steady
state instead of decaying.

2 Experimental Theory and Techniques
61
The scan rate is an important parameter not only in qualitative determination of kinetics
but also in identifying adsorbed redox species. This can be done because the peak
current, ip, is a function of the scan rate. The Randles-Sevcik equation (2.5) describes
ip for the forward sweep of an electrode reaction involving dissolved species R:
= (2.69 × 10 )
∗
(2.5)
where A is the electroactive electrode area, ∗ is the bulk concentration of R, DR is the
diffusion constant of R. It can be seen from Equation (2.5) that for a dissolved species,
ip will vary linearly with v1/2. In contrast, for adsorbed species, peak current is given by
=
4 Γ
∗(2.6)
where Γ∗ is the initial amount of adsorbed R. The peak current is now proportional to v
and not v1/2.
2.1.2 Differential Pulse Voltammetry
Pulse voltammetry techniques were developed as a mechanism to suppress charging
currents arising from the expanding mercury drop at a dropping mercury electrode
(DME). Pulse methods offer improved sensitivity by sampling the current at a point
where the ratio of faradaic current to charging current is largest. In the context of DME,
this would occur at the end of drop lifetime just before it is dislodged. Even though
pulse techniques originated in a polarographic context, the potential waveforms and
measurement strategies are applicable to stationary electrodes and therefore a similar
sensitivity improvement can be seen at disc electrodes, making pulse voltammetry
particularly suitable for trace analysis [1].
In differential pulse voltammetry, small amplitude pulses are superimposed on a
stepped base potential and the current is sampled twice in each step: first at time t = τ′

2 Experimental Theory and Techniques
62
immediately before the pulse at potential E and second at t = τ towards the end of the
pulse at potential E + ΔE. The potential waveform for a Nernstian reaction O + e R
is shown in Figure 2.3(a). The current, shown in Figure 2.3(b), is plotted as the
difference of the two sampled values:
= (τ) − (τ′) (2.7)
The potential step time τ′ is usually around 0.5 to 4 seconds and the pulse width τ − τ′
is 5 to 100 milliseconds [1]. Therefore a thick diffusion layer is established by t = τ′, and
the pulse can only perturb a small part of it. In effect, the purpose of the base potential
is to establish apparent bulk concentrations that vary from pure O to pure R for each
potential step.
Figure 2.3 (a) Potential waveform for a differential pulse voltammetric experiment showing twofull potential steps. (b) Differential current plotted against potential for reaction O + ne R.
Adapted from [1] with permission.
When R is initially absent, the apparent bulk concentrations for the pulse are the
surface concentrations at potential E:

2 Experimental Theory and Techniques
63
( ∗) = (0, ) =
∗
1 +
(2.8)
( ∗) = (0, ) =
∗
1 +
(2.9)
Where = exp[
( − ′)] and = ( )⁄ /
. In a Nernstian system ( ∗) and
( ∗) are in equilibrium with potential E, so the faradaic current flow after a step from
E to E + ΔE is:
=
/
π / / ⋅ (
∗) − ′( ∗)
(1 + ′)
(2.10)
where ′ = exp[
( + Δ − ′)]. Substituting Equations (2.8) and (2.9) into (2.10):
=
/ ∗
π / / ⋅
( − ′)
(1 + )(1 + ′)
(2.11)
The differential faradaic current in Equation (2.7) is then:
δ =
/ ∗
π / (τ − τ′) / ⋅
( − ′)
(1 + )(1 + ′)
(2.12)
DPV results in a peak current rather than limiting current. This is because the base
potential is made more negative at each step. Clearly at the beginning of the
experiment no faradaic current flows as E >> E0′ and a small amplitude pulse is not
able to stimulate the reduction of O. As the experiment proceeds past E0′, the base
potential E reaches the diffusion limited current region and O is reduced at a maximum
rate. A small amplitude pulse is not able to increase the rate further, making the
faradaic current component of i(τ) – i(τ′) equal to zero. Only close to E0′ can a small ΔE
stimulate a significant δi.

2 Experimental Theory and Techniques
64
The magnitude of ΔE controls the maximum δi, with larger |ΔE| giving higher δimax.
However, increasing |ΔE| also increases the width of the peak, meaning the resolution
becomes objectionably poor at |ΔE| > 100 mV [1].
2.2 Infrared Spectroscopy
Infrared is electromagnetic radiation extending from 1 mm to 750 nm and is further
divided into far-, mid- and near-infrared regions. Higher energy near-infrared light is
closer to visible light in frequency and can excite a molecule to a second or third
excited state, referred to as an overtone, whereas at the lower end of the infrared
region far-infrared is used for rotational spectroscopy. Mid-infrared frequencies, usually
given in wavenumbers, span the region between 4000 and 400 cm−1 and are used to
study fundamental vibrations.
Interatomic bonds in molecules have different modes of vibrations that absorb at
specific frequencies. When IR light is passed through a sample, it may interact with a
covalent bond in the sample and lose intensity as photons are absorbed by the sample.
The resulting absorbance spectrum will show a peak at the wavenumber at which the
absorption occurred.
Bond vibrations can be described in terms of a simple harmonic oscillator. The
fundamental vibrational frequency ν is given by:
=1
2π
(2.13)
where κ is the force constant and μ is the reduced mass of two atoms with masses m1
and m2:

2 Experimental Theory and Techniques
65
=
+
(2.14)
Transitions between the ground state and the first vibrational quantum level are
virtually unaffected by anharmonicity, although when studying overtones at higher
frequencies anharmonicity will begin to influence the transitions and must be taken into
account.
The minimum set of fundamental vibrations, known as the normal modes, are
described in terms of coordinate axes in three-dimensional space, and all possible
variants of vibrational motion can be reduced to this minimum set. The number of
normal modes of vibration for a molecule with N atoms is given by 3N − 5 for linear
molecules, and 3N − 6 for non-linear molecules. According to this rule, a CO2 molecule
has 4 vibrations and a H2O molecule has 3.
A vibrational mode is IR active if it causes a change in the dipole moment of the
molecule. A symmetric diatomic molecule such as N2 is not IR active as there is no
change in the dipole moment, whereas H2O and CO2 have both IR active and IR
inactive normal modes. These are illustrated in Figure 2.4. In Figure 2.4(a), the first
two panels show the stretching modes and the panel on the right shows the bending
mode of a water molecule. The out-of-plane stretch on the left causes a change in the
dipole moment of the molecule and hence the vibration is IR active, whereas the in-
plane stretching mode in the middle is IR inactive as there is no change in the dipole
moment. The bending mode shown in the right-hand panel is also IR active due to the
change in the dipole moment of the molecule. Correspondingly, the normal modes of
CO2 are shown in Figure 2.4(b). The first two panels from the left illustrate the IR active
asymmetric stretching mode and the IR inactive symmetric stretching mode,
respectively. The last two panels show the two IR active, mutually perpendicular
bending modes.

2 Experimental Theory and Techniques
66
Figure 2.4 Stretching and bending modes of (a) water and (b) CO2 molecule. Reproduced from[2] with permission.
2.2.1 Attenuated Total Reflectance
In the attenuated total reflectance configuration (Figure 2.5), an infrared beam is
directed into a crystal made of a material that has a high refractive index. Due to the
different refractive indices of the ATR crystal and the medium in contact with the
crystal, the angle of the IR beam can be set so that it exceeds the critical angle at
which total internal reflection occurs. The internal reflection creates an evanescent
wave that extends orthogonally beyond the surface of the crystal. If a sample is placed
into contact with the crystal, some of the energy in the evanescent wave is absorbed by
the sample. The attenuated energy is passed back to the IR beam and back to the
detector. By recording a background of a clean ATR crystal and subtracting that from
the sample spectrum, an absorbance spectrum of the sample can be obtained.
The IR beam enters the ATR crystal with an angle of incidence, θ. Due to the
differences in refractive indices, the angle of refraction, r, will differ from θ according to
Snell’s Law.

2 Experimental Theory and Techniques
67
sin
sin =
(2.15)
where n1 and n2 are the refractive indices of the ATR crystal and the sample,
respectively. The critical angle θc is the angle at which r is equal to 90° and it follows
from Equation (2.15) that
= (2.16)
Figure 2.5 (a) Graphical representation of the evanescent wave. (b) Variation of the angle ofrefraction (r) with the angle of incidence (θ). The critical angle θc is the angle of incidence that
leads to r = 90°. Adapted from [2] and [3] with permission.
Refractive indices are wavelength-dependent and are usually measured using the
doublet sodium D line at 589 nm. For a diamond ATR crystal in contact with water, θc
at mid-IR frequencies is ca. 34°.
The graphical depiction of the evanescent wave in Figure 2.5(a) shows that the wave
doesn’t extend very far from the ATR surface; instead, the intensity I of the wave
decays exponentially with distance:
=
(2.17)
where z is the distance normal to the ATR surface, I0 the intensity at z = 0, and dp is the
penetration depth. dp is defined as the distance at which the electric field amplitude

2 Experimental Theory and Techniques
68
falls to 1/e of the value at the surface and it depends on the wavelength of the light (λ),
θ, and the refractive indices of the two phases:
=
2 ( sin −
)
(2.18)
Table 2.1 lists values of dp at wavelengths in the mid-infrared region together with
penetration depths at those wavelengths.
Table 2.1: Tabulated values of dp at a diamond ATR crystal-water interface when θ = 45°. Thevalues of n1 were found in [4] and the values of n2 in [5].
n1 n2 λ / nm / cm−1 dp / μm
2.38 1.22 10000 1000 1.38
2.38 1.33 6667 1500 2.32
2.38 1.33 5000 2000 3.09
2.39 1.35 4000 2500 3.96
2.39 1.43 3333 3000 5.39
2.3 Scanning Tunnelling Microscopy
STM is part of a family of scanning probe microscopy (SPM) techniques. All SPM
techniques use a sharp probe, with a radius of curvature typically in the nanometres or
tens of nanometres, to study the surface properties of a sample. The probe may be in
intermittent contact, constant contact, or near-contact with the sample surface,
depending on the technique used.
In STM, a bias voltage is applied across the probe and the sample. As the probe
approaches the sample, electrons can tunnel across the gap between the tip of the
probe and the sample. For electron tunnelling to occur, both the probe and the sample
must be made of a conductive or semi-conductive material. The tunnelling current, It,
can be described by the following equation:

2 Experimental Theory and Techniques
69
∝ (2.19)
Where e is the electron charge, Vb is a bias voltage between the tip and the surface
and d is the distance between the tip and the surface. c is a constant for a given
material and is given by
c =2 2
ℏ
(2.20)
where me is the mass of the electron, φ is the work function and ℏ is Planck’s constant.
Atomic resolution can be achieved in STM due to the exponential relationship of It with
d in Equation (2.19) which means that a 0.1 nm increase in d leads to It decreasing by
an order of magnitude.
STM is commonly operated in a constant current mode where a piezoelectric element
controls the tip position and moves it along the z axis to maintain a constant current
while also controlling the movement in the xy-plane for scanning the surface. Because
the tunnelling current depends on not only the tip-to-sample distance but also the local
density of states in the sample, STM images are a convolution of topography and
electronic structure.
As tunnelling current decreases exponentially with distance, the resolution of STM
depends on the ability to precisely control the tip-to-sample distance. The technique is
therefore very sensitive to vibrations and experimental conditions must be carefully
controlled to minimise interference. The tip and sample are placed on a vibration
isolation table inside a solid box lined with contoured foam to reduce the impact of
acoustic waves. The box is mounted on a table with air-damped feet to maximise
isolation from floor vibrations.

2 Experimental Theory and Techniques
70
2.4 X-ray Photoelectron Spectroscopy
XPS is a surface-sensitive ionisation technique that can be used in elemental,
quantitative and surface structure analysis. Soft X-rays with energies in the range of 1-
5 keV are used to ionise samples. The photons are sufficiently high in energy to eject
core electrons. Since each core atomic orbital is associated with a characteristic
binding energy, XPS is a chemically specific technique.
The surface-sensitivity of XPS arises from the emission and detection of the ejected
electrons. Even though the penetration depth of the X-rays employed in XPS is
measured in micrometres, the overwhelming majority of electrons ejected from the
sample at those depths will collide with other atoms in the sample before reaching the
surface. These collisions will lead to a loss of energy, making the electrons unable to
escape from the sample. Only electrons from the top 4-5 monolayers are likely to be
ejected and reach the detector without any energy loss.
When a photon of energy hν is incident upon the surface of a sample, the energy can
be absorbed by an electron in the sample. If the frequency of excitation is above the
work function φ, a threshold value representing the energy it takes to remove an
electron from the Fermi level to vacuum, photoemission takes place and the electron is
ejected with a specific kinetic energy EK. For a spectrometer with a calibrated work
function φsp and measuring kinetic energy , the binding energy of the electron, EB,
can be obtained from:
= ℎ − − (2.21)
If the photon energy is known and the kinetic energy of the ejected electron can be
measured, the binding energy of the ejected electron can be calculated.
The observed binding energy of an electron depends on the chemical environment of
the atom such as oxidation state and ligand electronegativity. The deviation in binding

2 Experimental Theory and Techniques
71
energy caused by the environment is known as a chemical shift and it is readily
observable in XPS. Therefore XPS can be used as a tool to identify not only elemental
composition but also the oxidation state of the elements.
As the XPS signal at a given incident photon energy is proportional to the amount of
species on the surface, the technique can be used for quantitative analysis. To
determine the composition of the surface, the relative peak intensities are examined.
For a homogeneous material with two components, A and B, the ratio of the
concentrations is given by equation
[A]
[B]≈
(2.22)
where I is the integrated peak area and S is the atomic sensitivity factor. The atomic
sensitivity factor is derived empirically for each spectrometer and the values are readily
available in literature.
2.5 Transmission Electron Microscopy
The resolution of traditional light microscopes is limited by the wavelength of the light
source. To image nanometre-scale specimens, electron microscopy is often used. The
de Broglie equation gives a relationship between the wavelength λ and momentum p of
a moving particle:
=ℎ
(2.23)
where h is Planck’s constant. As the electron velocity approaches the speed of light,
the de Broglie equation must be corrected to account for relativistic effects [6]:

2 Experimental Theory and Techniques
72
=ℎ
2 1 +
2
(2.24)
where m0 is the rest mass of the electron, E the energy of the accelerated electron and
c the speed of light.
The source of electrons in electron microscopy is called an electron gun. When a high
voltage is applied to the gun, electrons will be emitted either by thermionic emission or
field emission. The resulting electron beam is accelerated further to achieve higher
energy electrons as this shortens the wavelength and therefore improves resolution.
Electromagnetic lenses are used to focus the electron beam, and changes in
magnification are achieved by changing the current flowing through the lenses. In TEM,
the electron beam is transmitted through a sample, meaning that only very thin
specimens can be imaged. The electrons interact with the sample as they pass through
and the transmitted beam contains information about electron density, phase and
periodicity in the sample. The de Broglie wavelength in a typical electron microscope is
in the picometre range, but in practice it is not possible to achieve that kind of
resolution due to the limitations of the focusing of the electron beam. The resolution of
TEM is typically 2 nm.

2 Experimental Theory and Techniques
73
References for Chapter 2
1. Bard, A. J.; Faulkner, L. R.; Leddy, J., Electrochemical Methods : Fundamentalsand Applications. 2nd ed.; Wiley: New York ; Chichester, 2001; p xxi, 833 p.
2. Larkin, P., Infrared and Raman Spectroscopy : Principles and SpectralInterpretation. Elsevier: Waltham, MA, 2011.
3. Pike Technologies. ATR – Theory and Applications Application Note. 2011,Http://Www.Piketech.Com/Files/Pdfs/Atran611.Pdf (Accessed 29 May 2016).
4. Phillip, H. R.; Taft, E. A., Kramers-Kronig Analysis of Reflectance Data forDiamond. Physical Review 1964, 136 (5A), A1445-A1448.
5. Hale, G. M.; Querry, M. R., Optical Constants of Water in the 200-nm to 200-μm Wavelength Region. Appl. Opt. 1973, 12 (3), 555-563.

74
3 Characterisation of GNF
3.1 Introduction
One of the many advantages of carbon as electrode material is its relatively inert
electrochemistry. However, carbon has a rich surface chemistry, and while this
property is useful in that it allows the chemical modification of the electrode surface, it
can also lead to unwanted oxidation in the presence of atmospheric oxygen and
moisture [1, 2]. The interaction of various redox species with oxygen functionalities at
carbon electrodes has been investigated extensively by McCreery et al. [3-5]. Common
redox probes can be classified roughly into three categories: those which are
insensitive to surface termination (FcMeOH, [Ru(NH3)6]3+/2+); those which interact with
specific oxygen functionalities (such as Fe3+/2+ with C=O) and those which are surface
sensitive but apparently do not interact with specific oxygen-containing groups

3 Characterisation of GNF
75
([Fe(CN)6]3−/4−) [1]. As higher surface area nanomaterials are used, the role of carbon
surface chemistry becomes increasingly important.
A large variety of oxygen functionalities at the electrode surface makes it difficult to
attribute changes in electrochemical response to specific functional groups. Our
approach is to use novel GNF with average lateral dimension of just 30 nm. The basal
plane of the GNF is predominantly defect free and hence contains negligible oxygen
content. In this study we have two very clearly defined types of edge functionality with
which to probe the interaction of different redox probes with carbon electrode surfaces.
The high density of carboxylic acid groups available on the GNF-COOH allows us to
study both the electrostatic interaction between the redox species and acid groups in
different protonation states and the effect of acid/base equilibria on the redox response.
The amide-terminated GNF allows us to probe the influence of the electronegative
carbonyl moieties but in the absence of the deprotonation equilibria exhibited by the
COOH groups. The high density of edge COOH groups makes this an ideal material
with which to study the role of oxygen species on electrochemical response, as their
influence is greatly amplified due to the small size of the flakes. Additionally, the acid-
terminated GNF can be complexed with different cations. The use of divalent alkaline
earth metal cations such as Ca2+ and Ba2+ allows the immobilisation of a thicker layer
of GNF onto an electrode surface, thereby increasing the electroactive surface area.
Complexation of GNF-COOH with redox-active counter cations increases the
electroactive surface area and additionally allows the study of surface-immobilised
redox probes at higher concentrations.
Some of the work presented in this Chapter has been published in [6].
3.2 Experimental Methods
All aqueous solutions were prepared with doubly deionised water, taken from a Milli-Q
water purification system, with a resistivity of not less than 18.2 MΩ cm at 25 °C.

3 Characterisation of GNF
76
3.2.1 Preparation of Complexed GNF
For preparation of GNF complexed with divalent cations 2 mg of GNF dissolved in
water was neutralised with dilute KOH to deprotonate all acidic groups. An aqueous
solution of CaCl2 or BaCl2 was added dropwise and the mixture was agitated between
additions. Addition of the divalent cation resulted in complexation of neighbouring GNF
and hence a loss of solubility. The resulting precipitate suspension was centrifuged and
washed four times.
For preparation of GNF complexed with [Ru(NH3)6]3+ 2.5 mg of GNF dissolved in water
was neutralised with dilute KOH to deprotonate all acidic groups. An aqueous solution
of [Ru(NH3)6]Cl3 was added dropwise and the mixture was agitated between additions.
The resulting precipitate suspension was centrifuged and washed four times.
3.2.2 X-ray Photoelectron Spectroscopy
XPS was carried out on a Thermo Scientific K-Alpha spectrometer equipped with a
monochromated Al Kα (hv = 1486.6 eV) X-ray source. All survey scans were scanned 3
times with a resolution of 1 eV, 400 μm spot size and 50 ms dwell time. Samples were
either compacted into wells in a custom-built powder sample plate or pressed into a
piece of indium that was then secured onto a sample plate. Elemental composition
ratios were calculated from survey spectra using the element library function.
3.2.3 Transmission Electron Microscopy
TEM images were recorded using a Jeol JEM 2100 TEM with a 200 kV accelerating
voltage using a LaB6 filament. All nanoparticles were deposited from methanol
dispersions. Holey carbon coated copper TEM grids were used as the nanoparticle
support.

3 Characterisation of GNF
77
3.2.4 pH Titration
An equivalence point and approximate pKa for the GNF-COOH was obtained by
titration of an aqueous suspension of dispersed GNF-COOH with NaOH. The
hydrophilic nature of the COOH edge groups means the GNF disperse readily in water
and other polar solvents. The NaOH solution was standardised prior to titration using
potassium hydrogen phthalate (KHP). NaOH and KHP were placed in a desiccator for
12 hours prior to use. Water was either boiled or deoxygenated with argon before use.
All solutions were kept under argon throughout the experiment. A micropipette was
used to measure the volume of NaOH additions.
3.2.5 Electrochemical Experiments
Figure 3.1 A schematic of the electrochemical cell used in this Chapter.
CV was carried out using a µ-Autolab potentiostat (Ecochemie, NL) coupled with GPES
software. The electrochemical cell, depicted in Figure 3.1 was a stoppered glass vial

3 Characterisation of GNF
78
with holes in the top to hold electrodes in place. A 3-mm diameter boron-doped
diamond (BDD) disk sealed in polyether ether ketone (PEEK) (Windsor Scientific, UK)
was used as the working electrode, either unmodified or modified with a layer of
adsorbed GNF. A platinum wire, coiled at the end to increase the surface area, served
as a counter electrode. The reference electrode was Ag/AgCl in saturated KCl and all
potentials are reported relative to it. The BDD electrode was polished using
successively finer grades of alumina suspension down to 0.05 μm, rinsed thoroughly
with ultrapure water after each step and dried using an ambient air flow.
Complexed GNF precipitates were re-suspended in water and sonicated briefly before
each use. The concentration of the suspensions, assuming full conversion of GNF and
one Ca2+ per two carboxylate groups or one [Ru(NH3)6]3+ per three carboxylate groups,
is estimated to be 4.5 and 3.7 mg/ml for GNF-Ca and GNF-[Ru(NH3)6], respectively.
The GNF samples were drop-coated from aqueous suspensions of known
concentration onto the freshly polished BDD electrode using a micropipette and
allowed to dry under ambient conditions. After drying, the electrode was rinsed
thoroughly with water to remove any poorly adhered material from the surface and
dried using an ambient air flow. The resulting amount of GNF, GNF-Ca and GNF-
[Ru(NH3)6] on the electrode was estimated at (1.5 ± 0.5), (10 ± 2) and (7 ± 2) μg,
respectively, in all experiments, and all CVs were recorded using a freshly modified
electrode.
Redox probes hydroquinone (H2Q), ferrocenemethanol (FcMeOH) and
hexaammineruthenium(III) chloride were obtained from Sigma-Aldrich and used as
received. For experiments in deoxygenated solutions and with air sensitive chemicals
such as hydroquinone, high purity argon was bubbled through electrolyte solutions for
30 minutes to remove dissolved oxygen, and the gas flow was maintained over the
surface of the solution during electrochemical experiments.

3 Characterisation of GNF
79
3.2.6 ATR-FTIR
3.2.6.1 Stability of Aqueous Suspension of GNF
The stability of GNF suspended in water was monitored over 6 months by recording
mid-infrared spectra in ATR mode with a Bruker Tensor 27 spectrometer (Bruker, UK)
fitted with a room temperature DLaTGS detector at 4 cm−1 resolution and a diamond
crystal as the internal reflection element. A background was first collected of the clean
ATR crystal. 0.50 µl of an aqueous suspension of the GNF was then applied directly
onto the ATR crystal using a micropipette and allowed to dry.
3.2.6.2 Solution-Phase Characterisation of GNF
A droplet (volume ca. 50 µl) of an aqueous suspension of the GNF was applied directly
onto the ATR crystal and 2 µl aliquots of 0.1 M KOH were added until the pH of the
solution reached ca. 9 as determined with pH indicator paper. A spectrum was
collected after each addition. Water bands were subtracted from the sample spectra by
recording a background spectrum of water only prior to the experiment. The data was
processed using the atmospheric compensation function of OPUS software. Changes
in concentration due to the addition of aqueous aliquots of base were compensated by
multiplying the spectra by the volume ratio.
To obtain spectra of the Ca2+-complexed flakes 0.5 μl of GNF-Ca precipitate
suspended in water was applied onto the ATR crystal and the solvent was allowed to
evaporate. A droplet of water was then carefully added to ensure full hydration of the
precipitate. Bulk water bands were subtracted from the sample spectra by recording a
background spectrum of water prior to the experiment. The data was processed using
the atmospheric compensation function of OPUS software.

3 Characterisation of GNF
80
3.3 Results and Discussion
3.3.1 Transmission Electron Microscopy
To gain information about the morphology of GNF, both in the acid-terminated form and
when complexed with cations, TEM was employed.
TEM images of the acid-terminated GNF are shown in Figure 3.2(a)-(b). To reduce the
degassing time in the chamber, the GNF were drop-coated onto a holey carbon
covered copper TEM grid from a methanol dispersion. The acid-terminated GNF don’t
dissolve in methanol to the same extent as they do in water, so some aggregation and
stacking of the particles is evident in the images. The flakes can be seen to curl up and
form spherical shapes of concentric sheets.
Figure 3.2 TEM images of the GNF. (a), (b): GNF-COOH. (c), (d): GNF-Ba.

3 Characterisation of GNF
81
GNF complexed with Ba2+ were also imaged with TEM and shown in Figure 3.2(c)-(d).
When the divalent cations bind to carboxylate groups, it is sterically favourable for the
flakes to cross-link through COO− groups on two different flakes rather than adjacent
groups on one flake. This is observed in the TEM images where chains of flakes can
be seen at the edges of the clusters of particles. Also discernible in the image is the
porous, three-dimensional nature of the resulting material. The crosslinking of the GNF
leads to the formation of a disordered, three-dimensional structure that, due to its
porosity and the small size of the flakes, possesses a large surface area.
3.3.2 X-ray Photoelectron Spectroscopy
XPS characterisation of GNF-COOH, GNF-amide and GNF-thiol has been reported
previously [7, 8] and the high resolution spectrum of the C1s region of GNF-COOH is
shown in Figure 1.3(a). The conversion of carboxylic acid edge groups was confirmed
by the presence of nitrogen in GNF-amide and both nitrogen and sulphur in GNF-thiol.
Additionally, components at binding energies corresponding to –C–N, –N–C=O and C–
S appeared in the C1s region, further supporting the successful conversion of edge
groups.
Carboxylic acid functional groups are versatile as precursors to other functionalities as
demonstrated in [7, 8]. In addition to conversion to amides, the acid edge groups
present in GNF-COOH can be exploited to form electrostatic complexes. In this thesis,
GNF-COOH are complexed with divalent cations to construct a large surface area
electrode for spectroelectrochemical experiments. GNF-COOH are also complexed
with [Ru(NH3)6]3+ to study the redox behaviour of the immobilised Ru(III) centre. XPS
was used to confirm complexation of GNF and to estimate the number of edge groups
that remain non-complexed.

3 Characterisation of GNF
82
Figure 3.3 Wide scan survey spectra of GNF-COOH (black) and GNF-COOH complexed withCa
2+(red); Ba
2+(green); [Ru(NH3)6]
3+(blue). Relevant elements are highlighted with circles.
Spectra are offset for clarity.
Survey spectra of GNF-COOH and GNF-COOH complexed with Ca2+, Ba2+ and
[Ru(NH3)6]3+ are compared in Figure 3.3. The presence of calcium is evident in GNF-
Ca (red line) from the appearance of a peak at 350 eV corresponding to calcium Ca2p.
Complexation with Ba2+ leads to new peaks at 781 and 90 eV arising from Ba3f and
Ba4d, respectively (green line). Although ruthenium was not detected in the survey
spectrum of [Ru(NH3)6]3+ complexed GNF (blue line), the presence of nitrogen in the
survey scan at 400 eV shows that [Ru(NH3)6]3+ is present in the sample. Additionally,
clear peaks were seen in the Ru2d narrow scan. Because the Ru2d binding energies
overlap with C1s, fitting of the region was not attempted.

3 Characterisation of GNF
83
From the atomic percentages of oxygen and the complexing cation, the ratio of COOH
groups that are complexed was calculated. In the case of GNF-Ru, the atomic
percentage of ruthenium was taken as 1/6 of the amount of nitrogen. To maintain
charge neutrality, it is assumed that two carboxylate groups are complexed by one
divalent cation and three COO− by one [Ru(NH3)6]3+ ion. The results are gathered in
Table 3.1. Another method to estimate the ratio for GNF-Ca is presented in Section
5.10.
Table 3.1: Fraction of carboxylic acid groups that are complexed in different materialscalculated from the atomic percentages of oxygen and complexing cation.
GNF-CaO / atomic % Ca / atomic % COOH complexed / %
32.3 6.2 76 ± 6
GNF-BaO / atomic % Ba / atomic % COOH complexed / %
27.6 2 28 ± 4
GNF-RuO / atomic % Ru / atomic % COOH complexed / %
22.4 0.6 16.0 ± 0.1
Of the three cations tested, Ca2+ is most efficient at binding the carboxylate groups.
This is probably due to the higher charge density and smaller size of the cation
compared to Ba2+ and [Ru(NH3)6]3+. The results show that even complex cations can be
incorporated into the GNF material, thereby allowing the construction of high surface
area redox active assemblies.
3.3.3 Infrared Spectroscopy
Carboxylic acid groups are well suited to characterisation by IR due to the strong
absorption intrinsic to C–O bonds. The deprotonation process can also be followed
using IR because the carbonyl band disappears and two new stretching modes appear
arising from the carboxylate.

3 Characterisation of GNF
84
The IR spectrum of dry GNF (Figure 3.4(a)) shows a strong band at 1720 cm−1
assigned to the C=O stretching mode of carboxylic acid. Also present are the
carboxylate asymmetric stretch at 1580 cm−1 and overlapping bands at 1435 and 1350
cm−1 assigned to the symmetric carboxylate stretch. The presence of two bands for the
symmetric stretch is predicted by computational models for situations where the
carboxylate groups occupy distinctly different environments within a molecule [9]. The
feature at around 1220 cm−1 is a convolution of vibrational modes, but can be assigned
partly to the C–O stretch in protonated COOH. The broad absorption features at 3700-
2700 cm−1 are attributed to O–H stretches of adsorbed water (> 3000 cm−1) and O–H
stretches of the carboxylic acid edge groups (< 3000 cm−1). The persistence of the
water band even after lengthy drying suggests water is strongly associated with the
GNF, most likely due to hydrogen bonding to the oxygenated edge groups. Adsorbed
water associated with oxygen groups of graphene oxide is known to persist even after
months of drying [10].
Figure 3.4(b) shows the IR spectrum of GNF-amide. The carbonyl stretch has moved
from 1720 to 1640 cm−1 as the acid has been converted to an amide group. In addition
to ν(C=O), δ(N–H) of the amide and amine groups and δ(O–H) of adsorbed water will
contribute to the absorption band present at 1700–1500 cm−1. The presence of water in
the sample is clear from the broad absorption band above 3000 cm−1 that is attributed
to O–H stretching of water. On top of this broad feature two bands can be discerned at
3380 and 3240 cm−1 that are assigned to the primary amine N-H stretches, although
these are very broad and will probably include absorption by the secondary amide N-H
stretch. Weak features arising from C–H stretches of the edge groups can be seen at
2925 and 2855 cm−1. It is evident from the shoulder at 1720 cm−1 that some carboxylic
acid groups remain in GNF-amide after reaction with ethylene diamine.

3 Characterisation of GNF
Figure 3.4
)
(a)
(b(c)
85
ATR-FTIR spectra of (a) GNF-COOH; (b) GNF-amide; (c) GNF-Ca.

3 Characterisation of GNF
86
Reaction of the water-soluble GNF with Ca2+ results in a porous precipitate where the
loss of solubility indicates a strong interaction between the COO− edge groups and the
Ca2+ cation. IR spectrum of the dried GNF-Ca precipitate (Figure 3.4(c)) supports this
observation, showing that the C=O stretching band at 1720 cm−1 and the C–O stretch
at 1220 cm−1 are almost entirely absent and the majority of COOH groups are
converted to carboxylate. The most intense peak for GNF-Ca at 1585 cm−1 is assigned
to the asymmetric stretch in carboxylate and also contains a contribution from the
bending mode of water at 1635 cm−1; this peak is accompanied by the slightly weaker
carboxylate symmetric stretch modes at 1430 and 1350 cm−1. The presence of a strong
stretching band for water at 3700–3000 cm−1 suggests that a significant number of
water molecules remain in the sample. Absorption bands for acid O–H groups at 3000–
2700 cm−1 are much reduced compared to the non-complexed GNF, which is
consistent with the majority of acid groups being found as carboxylate and bound to
Ca2+.
3.3.3.1 Stability
The stability of GNF-COOH suspended in water was monitored over a period of six
months. The sample was stored in a plastic Eppendorf vial in normal laboratory
atmosphere, and no precautions were taken to exclude oxygen or to maintain a specific
temperature. The temperature fluctuated between 18 and 25 °C over the course of the
six months. No changes were observed to the IR spectrum over this time, suggesting
that the GNF are stable in water under atmospheric conditions.
3.3.4 pH Titration
The acid/base properties of the acid-terminated GNF were investigated by pH titration.
When a weak acid, HA, is dissolved in water, a dynamic equilibrium is established:

3 Characterisation of GNF
87
HA(aq) + H2O(l) H3O+(aq) + A−(aq) (3.1)
The dissociation constant, Ka, is given by
Ka = H3O
+ [A
]
[HA]
(3.2)
The dissociation constants of different acids span several orders of magnitude, and
therefore it is common to work with pKa values of acids. To get an estimate of the pKa
of the flakes, titrations were performed using a sodium hydroxide solution. When a
strong base such as NaOH is added to a solution of a weak acid, the hydroxide ions
react with the dissociated protons, perturbing the equilibrium and causing more of the
weak acid to dissociate. When the number of moles of OH− equals the number of
moles of weak acid present, the pH of the solution will rise sharply. This point is the
equivalence point, and after this any addition of OH− will merely increase the pH. If the
pH of the solution is monitored as a function of NaOH added, a titration curve can be
constructed. By rearranging Equation (3.2) and taking logs, we arrive at Equation (3.3):
pH = pKa + log10[ ]
[ ] (3.3)
Equation (3.3) is the Henderson-Hasselbalch equation, and it tells us that when [HA] =
[A−], pKa = pH. The pKa can therefore be read from the titration curve at the point where
half of the base required to reach the equivalence point is added.

3 Characterisation of GNF
88
Figure 3.5 Titration curve of GNF-COOH (black), first derivative (red). Adapted from [6].
Figure 3.5 shows the titration curve for the addition of aliquots of (236 ± 6) × 10−4 M
NaOH to an aqueous suspension of GNF-COOH. As the XPS and IR characterisation
show no detectable concentration of other acidic functionalities present in the flakes,
the observed behaviour can be attributed solely to the COOH edge groups.
When the weak acid COOH edge groups of the GNF-COOH are exposed to water a
dynamic equilibrium is established, where the acid groups become deprotonated:
GNF-COOH + H2O GNF-COO− + H3O+ (3.4)
Addition of a small amount of strong base to the solution results in reaction of OH− with
the solution protons and hence the equilibrium is perturbed. Once the number of moles
of OH− added is equal to the number of moles of weak acid groups (the equivalence
point, found from the first derivative curve), further addition of base results in a rapid
increase in pH. For GNF-COOH we observe more complex behaviour than would be
expected for a single acid species dissolved in water. On addition of ca. 200–400 μl
NaOH an increase in pH is observed, but this is not the sharp rise expected if all of the
acid groups underwent deprotonation with the same pKa. It is probable that different
bonding environments or electrostatic/hydrogen-bonding interactions between

3 Characterisation of GNF
89
neighbouring groups result in a range of acid/base behaviours among the edge-group
population. After addition of further NaOH an inflection point is observed in the first
derivative curve, which we interpret as the point at which all COOH groups are fully
deprotonated and which gives us an equivalence point of pH 8.3. This allows us to
estimate the number of COOH groups as 7 × 10⁻³ mol of acid groups per gram of GNF
material. The pKa of a weak acid is defined as the pH at which half of the base required
to reach the equivalence point is added and for the GNF-COOH pKa is therefore
estimated as 4.5. However given the wide pH range over which deprotonation is
observed, the usefulness in reporting a single pKa value for the GNF-COOH is
questionable.
To understand the titration data, the spatial distribution of the groups must be
considered. The flakes bear a large number of COOH functionalities that decorate the
edges, making it very likely that these groups are found in close proximity to each
other. In the beginning of the titration, as the added OH− combine with H3O+, the COOH
groups that dissociate to re-establish equilibrium would be located away from any
existing negatively charged groups, and could also be stabilised by hydrogen bonding
with neighbouring COOH functionalities. As deprotonation proceeds, the remaining
COOH groups begin to experience the electrostatic effect of neighbouring negatively
charged carboxylate groups. Consequently, these remaining COOH functionalities will
be progressively more difficult to deprotonate, and more base needs to be added to
achieve dissociation leading to deprotonation over a wide pH range.
3.3.5 In Situ pH Studies Monitored with Infrared Spectroscopy
The solution-phase IR spectra of solvated GNF are shown in Figure 3.6. Initially, when
only water and GNF are present and no base has been added, the pH of the solution is
approximately 2 as determined with pH indicator paper. Absorption bands can be seen
at 1720 cm cm−1 (C=O stretch), 1590 cm−1 (asymmetric COO− stretch), 1420 cm−1

3 Characterisation of GNF
90
(symmetric COO− stretch) and 1260 cm−1 (overlapping C–O stretch and O–H
deformation). The GNF are partially deprotonated already before the addition of base,
as indicated by the low pH of the solution and the peaks corresponding to both
protonated and deprotonated forms of COOH. Adding increasing aliquots of KOH
causes the signal from the C=O and C–O stretches associated with protonated
carboxylic acid to decrease, whereas the two bands from COO− gain intensity with
added base. Changes can also be observed in the O–H stretch region where a
decrease in absorption intensity is seen around 2900 cm−1 and increase around
3300 cm−1. Because a background spectrum of pure water was recorded, the O–H
stretch of water is subtracted from the sample spectra which initially leads to a negative
feature centred at 3300 cm−1. The increase in absorption at 3300 cm−1 upon addition of
base is assigned to increased solvation of the deprotonated carboxylate groups. At the
same time, the intensity of absorption around 2700 cm−1 decreases and this is
attributed to the loss of hydrogen-bonded COOH groups. The final spectrum in is
recorded at pH ca. 7. Thus these in situ pH studies agree with our former observations
that the flakes occupy a range of protonation states in solutions of pH 3-7.

3 Characterisation of GNF
91
Figure 3.6 Changes in IR absorption of GNF upon addition of 0.1 M KOH. GNF with no addedbase at pH 2 (black), pH 3 (red), pH 5 (green), pH 7 (blue). Reproduced from [11].
3.3.6 Electrochemistry of GNF without Redox Probes
The edge-carboxylated GNF are very water-soluble, so there was a concern that they
would not adhere to the surface of the BDD electrode when immersed in aqueous
solution, and hence we would be unable to probe their electrochemical response using
a drop-coating method. In order to establish the stability of a GNF layer immobilised on
BDD, cyclic voltammetry in the absence of any redox probes was performed in the
potential window −0.3 to +1 V in supporting electrolytes of varying pH. Additionally,
these experiments show whether there is any inherent redox activity present in the
flakes.

3 Characterisation of GNF
92
Figure 3.7 (a) pH 4.6 PBS with oxygen and (b) pH 4.6 PBS without oxygen; clean BDD (black),acid-terminated GNF (red) and amide-terminated GNF (blue). Adapted from [6].
Figure 3.7(a) shows the response of GNF-COOH, GNF-amide and clean BDD in 0.1 M
KH2PO4 pH 4.6 electrolyte over the potential range −0.3 V to +1.0 V. Figure 3.7(b)
shows the same but in degassed solution. In both solution conditions the response of
the GNF layer can be observed over the background response of the BDD at potentials
above ca. +0.4 V and below −0.2 V. Currents are larger for GNF-amide than GNF-
COOH under the same conditions. No Faradaic peaks are observed for the GNF
modified electrodes in the range 0 to +0.4 V. In deoxygenated solution the cathodic

3 Characterisation of GNF
93
currents below −0.2 V are greatly diminished, showing that the reduction currents in
Figure 3.7(a) can be attributed to oxygen reduction. This indicates that both GNF
samples can catalyse oxygen reduction better than BDD, which is a poor
electrocatalyst for this reaction in comparison to sp2 carbon materials.
These data show that despite their high solubility in water, a few monolayers of the
GNF adhere to the surface of the BDD electrode for the duration of the experiment. At
the present time it is unclear in what orientation the GNF are arranged on the electrode
surface, as their small size and transparency makes the immobilised layer difficult to
characterise. The capacitive current increases only slightly, which could be interpreted
as the flakes adopting a horizontal conformation, lying flat on the electrode surface, as
this orientation would not cause a significant increase the surface area. If the surface
area would change markedly upon modification, a larger increase in the capacitance
would be expected.
Figure 3.8(a) compares the response of GNF-COOH in pH 4.6 and pH 9.2, and (b)
compares the response of GNF-amide in the same conditions. We found a pH-
dependent increase in oxidation current at +0.6 V that closely resembles the response
at a clean BDD electrode and is unaffected by the presence of oxygen in solution.

3 Characterisation of GNF
94
Figure 3.8 Cyclic voltammograms of BDD modified with (a) carboxylic acid-terminated GNF and(b) amide-terminated GNF in pH 4.6 (red) and 9.2 (blue). Electrolyte concentration 0.1 M. Scan
rate 50 mV/s. Adapted from [6].
The CV response of GNF after complexation with Ca2+ was also studied (Figure 3.9).
Again, there are no Faradaic peaks in the range 0 to 0.4 V. Significantly more current
flows when the flakes are complexed with the precipitated flakes compared to acid-
terminated flakes. This is due to the lower solubility of the complexed GNF that results
in a higher coverage of the electrode surface and a larger electroactive surface area.

3 Characterisation of GNF
95
Figure 3.9 Cyclic voltammograms in 0.1 PBS at pH 7. Working electrode: clean BDD (black);BDD modified with GNF-Ca (blue). Red curve shows the response of BDD modified with GNF-
Ca in deoxygenated electrolyte.
3.3.7 Electrochemistry of FcMeOH at GNF-Modified Electrode
Ferrocenemethanol was chosen as the first redox probe because it undergoes a
reversible one-electron oxidation and exhibits near ideal outer-sphere behaviour.
Unlike ferrocene, it is also soluble enough in water to allow its use in aqueous
electrolyte.
Cyclic voltammograms of 0.5 × 10⁻³ M ferrocenemethanol were measured at a clean
BDD electrode and BDD modified with either GNF-COOH or GNF-amide, and the
results are shown in Figure 3.10. No difference in electrochemical response could be
discerned between the BDD and the GNF-modified BDD under any conditions.
Changing the pH of the supporting electrolyte from 4.6 (Figure 3.10(a)) to 9.2 (Figure
3.10(b)) did not affect the peak height or separation. ΔEp calculated from the CVs in
Figure 3.10(a)–(b) was approximately 65 mV at each electrode and in each pH, which
is very close to the theoretical value for a reversible one-electron process.

3 Characterisation of GNF
96
Figure 3.10 Cyclic voltammograms of 0.5 × 10⁻³
M ferrocenemethanol at different electrodemodifications. (a) At clean BDD (black), GNF-COOH modified BDD (red) and GNF-amide
modified BDD (blue) in 0.1 M KH2PO4 pH 4.6, scan rate 100 mV s−1
. (b) At clean BDD (black),GNF-COOH modified BDD (red) and GNF-amide modified BDD (blue) in 0.1 M K2HPO4 pH 9.2,
scan rate 100 mV s−1
. Adapted from [6].
Figure 3.11 demonstrates that modification of BDD with GNF-amide resulted in
reversible behaviour at a range of pH values and that scan rates up to 1 V s−1 could be
used without significant increase to the peak separation.

3 Characterisation of GNF
97
Figure 3.11 Cyclic voltammograms of 0.5 × 10⁻³
M ferrocenemethanol at GNF-amide modifiedBDD. Supporting electrolyte: (a) 0.1 M KH2PO4 pH 4.6; (b) 0.1 M K2HPO4 pH 9.2. Scan rate 100
mV s−1
(black, blue), 1 (red, orange) V s−1
. Adapted from [6].

3 Characterisation of GNF
98
Figure 3.12 (a) Cyclic voltammograms of 0.5 × 10⁻³
M ferrocenemethanol at GNF-COOHmodified BDD in 0.1 M KH2PO4 pH 4.6: scan rate 50 (black), 100 (red), 250 (green), 500 (blue),1000 (light blue) mV s
−1; (b) peak currents ipa (red) and ipc (blue) plotted against square root of
scan rate v; (c) log ipa (red) and log |ipc| (blue) plotted against log ν.

3 Characterisation of GNF
99
Figure 3.12(a) shows CVs of FcMeOH at GNF-COOH modified BDD recorded at
different scan rates. As was seen for the GNF-amide modified BDD in Figure 3.11,
scan rates up to 1 V s−1 could be utilised without significant irreversibility showing in the
response (ΔEp ca. 80 mV at both electrodes).
The peak currents from Figure 3.12(a) are plotted in Figure 3.12(b) against the square
root of scan rate. The data can be fitted with a linear regression line, confirming that the
redox reaction is diffusion controlled. The log-log plots in Figure 3.12(c) are also fitted
with a linear regression line, and the regression coefficients for both the oxidation and
reduction sweeps are very close to the theoretical value of 0.5 for a diffusion-controlled
process. Selected parameters extracted from Figure 3.12(a) are tabulated in Table
3.2.
Table 3.2: Peak parameters of FcMeOH redox reaction from cyclic voltammetry experiments atGNF-COOH modified BDD in 0.1 M KH2PO4 pH 4.6.
v / mV s−1 Epa / V ipa / µA Epc / V ipc / µA ΔEp / V ipa / ipc
50 0.267 5.43 0.198 −5.35 0.066 1.02
100 0.266 7.73 0.198 −7.54 0.065 1.03
250 0.270 11.3 0.195 −11.3 0.075 1.00
500 0.270 15.8 0.195 −16.0 0.075 0.989
1000 0.270 21.1 0.190 −21.4 0.083 0.984
It is not unexpected to find that the response of this redox probe is unchanged at the
modified electrode, as the FcMeOH/FcMeOH+ redox couple is known to be relatively
surface-insensitive and outer-sphere in nature. However, adsorption of this species to
graphene [12] has been reported, indicating some surface interaction that could
influence the electrochemical response. In this case no evidence of adsorption is seen
and also no indication that the protonation state of the GNF-COOH plays any role in
the redox response of this probe. An outer-sphere reaction is not necessarily
independent of electrode material and can be influenced by double-layer effects and
effects of the energy and distribution of electronic states in the electrode [13]. In this

3 Characterisation of GNF
100
case, the changes in the degree of protonation of the functional groups on the
electrode surface as a function of electrolyte pH do not affect the electron transfer
kinetics. The GNF materials likewise show no electrode blocking effects that inhibit
electrochemical response and no sign of limitation in electron transfer kinetics due to
low density of states or lack of surface adsorption sites. On the other hand no
enhancement in electron transfer kinetics is noted either, although the response at the
underlying BDD is also close to reversible, so it would be difficult to determine any
improvement.
3.3.8 Electrochemistry of Hydroquinone/Benzoquinone at GNF-
Modified Electrode
Scheme 3.1: 1,4-Benzoquinone undergoes a two-proton, two-electron reduction tohydroquinone.
After having established that GNF do not inhibit electron transfer for an outer-sphere
redox couple, a more complex redox system was investigated. The
1,4-benzoquinone/hydroquinone (Q/H2Q) redox couple (Scheme 3.1) was chosen to
examine how the acidic groups at the GNF edge influence proton-coupled electron
transfer (PET). Phenolic compounds are used in various industrial processes, including
the preparation of petrochemicals [14], cosmetics and pharmaceutical products [15].
Phenols are non-biodegradable and toxic to many organisms, and their release into the
environment from the waste streams of these industrial processes leads to soil and

3 Characterisation of GNF
101
water contamination [16]. Therefore, finding ways to detect and degrade phenolic
compounds is of great importance.
Figure 3.13 Cyclic voltammograms of 0.5 × 10⁻³
M hydroquinone in 0.1 M PBS: (a) at pH 5; (b)at pH 8.5. Working electrode: clean BDD (black), BDD modified with GNF-COOH (red) and BDD
modified with GNF-amide (blue). Scan rate 50 mV s−1
. First scans shown. Adapted from [6].
The oxidation of hydroquinone (H2Q) to benzoquinone (Q) was studied at clean BDD,
GNF-COOH modified and GNF-amide modified electrodes over the pH range 5.0 to
8.5. Figure 3.13 shows cyclic voltammograms recorded for hydroquinone in phosphate
buffer solutions of pH 5 (a) and 8.5 (b). The voltammograms at a clean BDD are shown

3 Characterisation of GNF
102
in blue, scans at BDD modified with GNF-COOH are in red, and those at BDD modified
with GNF-amide are in blue. At BDD the response was very irreversible, as has been
reported previously [17] with ΔEp being ca. 200 mV at pH 8 and >450 mV at pH 5.
Modification of the BDD with a layer of GNF-COOH resulted in a decrease in peak
separation (ΔEp ca. 150 mV at pH 8.5, 250 mV at pH 5). A shift in both oxidation and
reduction peaks towards reduced overpotential is observed at the GNF-COOH
electrode; however the shift in oxidation peak potential is greater than that for the
reduction peak. Indeed it was found that the anodic shift in the reduction peak position
of ca. 40 mV compared to the peak at clean BDD was constant and independent of pH
over the range tested. In contrast, the cathodic shift in the oxidation peak for GNF-
COOH compared to BDD was pH-dependent and was greater at lower pH. A small
improvement in electron transfer kinetics is observed for the GNF-amide modified
electrode, with respect to the oxidation peak current, although little change to ΔEp is
observed on modifying the electrode.
3.3.8.1 pH-Dependence of the Q/H2Q Reaction
Consider the reaction
O + mH+ + ne− R (3.5)
where O is the oxidised species, R is the reduced species, and m and n are the
stoichiometric numbers of protons and electrons, respectively. The equilibrium
potential, E, is given by the Nernst equation:
= ° −
ln
[R]
[O][H ](3.6)
where E0 is the standard potential, R the gas constant and T is the temperature in
Kelvin. At equilibrium, [O] = [R] and

3 Characterisation of GNF
103
E = E +
ln[H ] (3.7)
For the benzoquinone reduction shown in Scheme 3.1, m = n = 2, and replacing the
natural logarithm with base 10 logarithm gives the pH dependence:
= −2.3
pH (3.8)
At 25 °C the equilibrium potential changes by −59 mV per pH unit. The equilibrium
potential is often estimated from CV data as the average of the oxidation and reduction
peak potentials (Epa + Epc) / 2.
Due to the significant changes in peak position, especially at lower pH, depending on
whether the BDD is clean or modified, further investigation of the ET kinetics was
undertaken. The experiments were repeated in PBS solution of pH ranging from 5 to
8.5. Epa, Epc and ΔEp are plotted in Figure 3.14. The error bars represent one standard
deviation.
Figure 3.14(a) shows how Epa and Epc change with pH of the supporting electrolyte. A
linear relationship is observed between peak position and pH for both oxidation and
reduction at the BDD electrode, but the rate of change is very different. Analysis of the
gradients gives a relationship of 96 and 28 mV per pH unit for Epa and Epc, respectively.
The H2Q/Q redox reaction is usually considered a 2e−/2H+ process:
Q + 2e− + 2H3O+ H2Q + 2H2O (3.9)
Or in alkaline solution:
Q + 2e− + 2H2O H2Q + 2OH− (3.10)
A 59 mV shift in peak position with pH is predicted for a Nernstian 2e−/2H+ process.

3 Characterisation of GNF
104
Figure 3.14 (a) Peak potential of hydroquinone oxidation (circles) and benzoquinone reduction(squares); (b) peak separation; (c) E1/2 as a function of pH at clean BDD electrode (black), GNF-
COOH modified BDD (red) and GNF-amide modified BDD (blue). Adapted from [6].

3 Characterisation of GNF
105
Figure 3.14(b) shows that ΔEp at clean BDD is roughly linearly dependent on pH,
although the reaction was found to be very surface sensitive and resulted in a large
standard deviation. Because the kinetics of the reaction at BDD are so sluggish, it is
not possible to estimate the equilibrium potential from experimental data. The Nernst
equation describes reversible ET reactions with fast kinetics, which clearly isn’t the
case for the Q/H2Q redox reaction at BDD. E1/2 was calculated as Epa – Epc and plotted
in Figure 3.14(c). E1/2 exhibits pH-dependent behaviour with a gradient of 61 mV per
pH unit at the clean BDD electrode, suggesting that the reaction is a 2e−, 2H+ process.
At both GNF-COOH and GNF-amide modified BDD, Epc has a similar gradient as Epc at
clean BDD. Epa data points follow the linear response for clean BDD in neutral and
alkaline conditions but begin to diverge from them in acidic solution, especially at GNF-
COOH electrode and to a much lesser extent at GNF-amide electrode (Figure 3.14(a)).
At both modified electrodes, ΔEp follows the data for the clean BDD in neutral and
slightly alkaline conditions, but at GNF-COOH electrode, ΔEp becomes independent of
pH below pH 6.5. At GNF-amide modified electrode, the pH dependence of ΔEp follows
that at the clean BDD electrode, but deviates from it slightly at more acidic solutions.
For the GNF-COOH modified electrode two distinct behaviours can be noted. At
pH > 6.5 the relationship between E1/2 and pH is similar to that seen at BDD (61 mV per
pH unit). However at pH < 6.5 a different gradient of 40 mV per pH unit can be fitted to
the data. Clearly a change in reaction mechanism takes place at ca. pH 6.5, or
alternatively the manner in which the H2Q reactant or Q product interacts with GNF-
COOH changes in this pH range. The pH-independent behaviour of ΔEp in acidic
solution can be understood by considering the slopes of Epa and Epc, which are roughly
equal below pH 6.5.
The change in the reaction mechanism occurs in the pH region where COOH groups
are in a dynamic equilibrium with carboxylate groups as seen in the titration curve
(Figure 3.5). At these lower pH values there would be protons readily available at the

3 Characterisation of GNF
106
flake edges to participate in proton transfer reactions and to provide hydrogen bonding
sites, thereby creating conditions that differ substantially from those in the bulk solution.
A 40 mV shift with pH unit is close to the theoretical value of 29.5 mV per pH unit
predicted for a 2e−/1H+ process:
Q + 2e− + H3O+ HQ− + H2O (3.11)
Such a reaction mechanism is unlikely in acidic, buffered solution as it requires
hydroquinone to be deprotonated, which is not possible given its pKa is 9.9 [18]. A
mechanism with a 2e−/1H+ relationship would however be possible in the presence of
an additional, non-solution, source of protons, such as the COOH-terminating groups
offered by GNF-COOH:
Q + 2e− + GNF-COOH + H3O+ H2Q + GNF-COO− + H2O (3.12)
In the case of the hydroquinone oxidation reaction it has been shown that modification
of glassy carbon electrodes with phthalate bases (which contain two COOH groups)
shifts the oxidation potential cathodically [19]. The proposed mechanism involves
surface COO− groups accepting the protons liberated in the oxidation of hydroquinone
and thus stabilising the reaction products. In effect the shift in oxidation potential is a
thermodynamic consequence of the change in reaction mechanism rather than an
improvement in electron transfer kinetics.
A similar process may be taking place in our system. Some improvement in electron
transfer kinetics is observed on modifying the BDD electrode with GNF, as can be seen
in the increase in oxidation peak currents for both GNF-amide and GNF-COOH
electrodes (Figure 3.13). The GNF-amide electrode also shows a small cathodic shift
in oxidation potential as pH is lowered, indicating improved electron transfer kinetics.
H2Q/Q can interact with the GNF via hydrogen bonding or electrostatic interactions with
the edge groups or by hydrophobic or π–π interactions with the GNF basal plane. Such

3 Characterisation of GNF
107
surface adsorption has been proposed to explain the improved electron transfer
kinetics for this process (both oxidation and reduction) experienced at sp2 carbon
materials [20] in comparison to BDD, where limited surface adsorption is believed to
take place [21]. It is also possible that some acid groups remain at the GNF, as
discussed in section 3.3.3, and that there are enough of these acid groups to cause a
noticeable difference in the reaction. The marked change in proton concentration
dependence noted at pH < 7 is unique to the acid-terminated GNF and strongly
suggests the COOH groups play a role in the reaction mechanism, as shown in
Equation (3.12). At pH > 7 the solution is sufficiently basic to allow the deprotonation
accompanying hydroquinone oxidation to proceed predominantly via a solution phase
mechanism involving OH− as the base (Equation (3.10)). However at pH < 7 there is a
strong thermodynamic driving force for the COOH edge groups of the GNF to
protonate, concomitant with conditions where there are fewer basic solution species. At
this point a mechanism such as that shown in Equation (3.12) begins to dominate and
is reflected by the change in proton concentration dependence of the oxidation peak
position.
3.3.8.2 Exploring the Mechanism for Hydroquinone Oxidation
Proton-coupled electron transfer (PCET) reactions play a key role in essential
biological processes. Quinone groups are often involved in PCET reactions [22], as is
the case for photosynthesis, where the reduction of plastoquinone and oxidation of the
phenol group of a tyrosine residue are central to the function of photosystem II [23].
PCET can occur stepwise, where either the proton or the electron is transferred first, or
in a concerted fashion (CPET), where both the proton and the electron are transferred
in a single step [24]. The concerted pathway avoids high-energy intermediates and
therefore tends to exhibit a lower overpotential [25]. For a long time, significant effort
has been made to elucidate the mechanism of various PCET reactions in order to
understand and mimic the efficiency of enzymatic systems.

3 Characterisation of GNF
108
A sequential PCET mechanism can be confirmed if an intermediate can be isolated
experimentally. This may not always be straightforward, and other techniques have
been developed to distinguish the stepwise pathways from a concerted pathway. The
extensive mechanistic studies of phenol oxidation undertaken by Savéant and co-
workers [24, 26] show that cyclic voltammetry experiments in unbuffered media can
confirm or rule out a concerted pathway. If CPET is operative, the oxidation wave is
expected to shift to a higher potential with respect to a buffered electrolyte having the
same pH, while its peak potential should be independent of the pH for pH values below
the pKa of the phenolic OH. The assignment of CPET can be further corroborated by a
kinetic isotope effect which can be revealed by comparing CVs recorded in D2O and
H2O.
In order to explore the mechanism of proton and electron transfer for the H2Q/Q couple,
experiments were carried out in unbuffered media in the pH range 5.5 to 8.2. Cyclic
voltammograms recorded in 0.1 M KCl and the associated oxidation peak potentials
are shown in Figure 3.15. The data show that in unbuffered media the Epa is shifted to
higher potentials compared to buffered solutions and, crucially, the Epa values are
independent of pH over this pH range. The behaviour of hydroquinone in D2O was also
studied. Figure 3.15(c) shows the cyclic voltammogram at clean BDD in D2O. The pD
of the D2O solution, based on the smaller dissociation constant of D2O, is estimated to
be 0.4 units higher than the pH of a corresponding H2O solution and therefore about
6.6. When D2O is used as the solvent, the main oxidation peak potential shifts to higher
values compared to H2O of similar pH.

3 Characterisation of GNF
109
Figure 3.15 (a) CVs of 0.5 × 10⁻³
M hydroquinone at clean BDD electrode (black line) and GNF-COOH modified electrode (red line) in unbuffered H2O pH 6.6. (b) Peak potential of
hydroquinone oxidation in unbuffered KCl electrolyte as a function of pH at a clean BDDelectrode (black) and GNF-COOH modified electrode (red). (c) CVs of 0.5 × 10
−3M
hydroquinone at clean BDD electrode in unbuffered H2O pH 6.5 (black line) and D2O pD 6.6(red line). Supporting electrolyte: 0.1 M KCl. Scan rate: 50 mV s
−1. First scans shown. Adapted
from [27].

3 Characterisation of GNF
110
A second set of peaks at more negative potentials appear in unbuffered solutions after
the initial oxidation wave. Figure 3.16(a) gives a comparison of the CVs at clean BDD
and GNF-COOH modified BDD at pH 8.21. The ratio of peak heights is plotted in
Figure 3.16(b) as a function of pH. The peak separation of ca. 60 mV is indicative of
reversible kinetics, and the peak potentials are independent of pH over the pH range
examined. The fact that the peak height of this reversible redox wave decreases with
decreasing pH suggests it is due to a stepwise PET as described by Costentin et al
[24]. The reversible kinetics support the assignment of this mechanism. Upon
modification of the electrode with GNF-COOH, there is no shift in Epa, but the height of
peak II is smaller, and the ratio of peak currents at GNF-COOH modified electrode
increases more rapidly under acidic conditions. These observations are in agreement
with the conclusions made above regarding the role played by COOH groups in the
reaction mechanism. When GNF-COOH are present on the electrode surface they can
act as a proton source and sink, allowing the reaction to proceed to a greater extent via
the concerted pathway. The results presented here are in agreement with those
reported by Costentin et al. [24] in the above-mentioned paper and strongly suggest
that the oxidation of hydroquinone at both BDD and GNF-COOH modified BDD follows
the CPET mechanism in buffered media. In unbuffered media, two competing
pathways are operative: CPET, which dominates in acidic solutions, and PET in basic
conditions.

3 Characterisation of GNF
111
Figure 3.16 (a) CV of 0.5 × 10⁻³
M hydroquinone at clean BDD electrode (black line) and GNF-COOH modified electrode (red line) in unbuffered H2O. The pH of the H2O electrolyte solution
was adjusted to 8.21 with KOH. Supporting electrolyte: 0.1 M KCl. Scan rate: 50 mV s−1
.Second scans shown. (b) Ratio of peak heights of hydroquinone oxidation as a function of pH at
clean BDD electrode (black) and GNF-COOH modified electrode (red). Adapted from [27].

3 Characterisation of GNF
112
3.3.9 Electrochemistry of [Ru(NH3)6]2+/3+ at GNF-Modified Electrode
[Ru(NH3)6]3+/2+ is considered an outer-sphere redox couple that is often used as a
standard probe as it undergoes a reversible one-electron redox reaction. However,
both the reduced and especially the oxidised species carry a large positive charge and
we can expect the GNF to be negatively charged at pH values above ca. 3. Therefore,
we were interested to see if there was any interaction between the positively charged
redox probe and the negative charge at the modified electrode.
Cyclic voltammograms were recorded in 0.1 M PBS at pH 7 at both clean BDD and
BDD modified with GNF-COOH, and the results are shown in Figure 3.17. Reversible
behaviour was seen in our experiments at a clean BDD electrode (Figure 3.17(a)) with
peaks at −219 mV and −149 mV for reduction and oxidation, respectively. The peak
potentials are independent of scan rate in the range 50–250 mV s−1 and the peak
separation is 70 mV, which is close to the theoretical value of 59 mV. At GNF-COOH
modified electrode, the current peaks occur at the same potentials as at the unmodified
BDD. There is also a slight increase in the reduction current. However, what is
noticeable especially at higher scan rates (Figure 3.17(b)) is the changed shape of the
current response. The reaction clearly doesn’t follow the usual mass transfer regime at
the GNF-COOH modified electrode, but instead there is an additional set of peaks
appearing at ca. −350 mV (reduction) and −300 mV (oxidation).

3 Characterisation of GNF
113
Figure 3.17 Cyclic voltammograms of 0.5 × 10⁻³
M [Ru(NH3)6]Cl3 in 0.1 M PBS pH 7 at (a)clean BDD and (b) GNF-COOH modified BDD. Scan rates 50 mV s
−1(black), 250 mV s
−1(red)
and 500 mV s−1
(blue).
The additional peaks in Figure 3.17(b) are poorly resolved, possibly because there is
only a small amount of GNF-COOH present at the electrode surface and hence the
surface area has not increased appreciably. To be able to analyse the CVs and
determine the mechanism responsible for the redox peaks, a signal enhancement was
needed. To achieve this, GNF complexed with Ca2+ were used. There will be an
increase in the concentration of GNF material on the electrode surface due to the

3 Characterisation of GNF
114
insolubility of the Ca2+ complexed flakes that is expected to increase the intensity of the
additional set of peaks compared to the acid-terminated GNF.
Using GNF-Ca modified BDD, cyclic voltammograms were recorded at scan rates
ranging from 5 to 500 mV s−1 (Figure 3.18). Modifying the electrode with GNF-Ca has
clearly enhanced the second set of peaks compared to Figure 3.17(b).
Figure 3.18 (a) Cyclic voltammograms of 0.5 × 10⁻³
M [Ru(NH3)6]Cl3 in 0.1 M PBS pH 3 atGNF-Ca modified BDD. Scan rates 5 (black), 25 (red), 50 (green), 250 (blue) and 500 (light
blue) mV s−1
. (b) Cyclic voltammograms from (a) with normalised current.

3 Characterisation of GNF
115
The appearance of additional peaks in a cyclic voltammogram may be due to chemical
reactions leading to different species or adsorption onto the electrode surface. The
potential at which the new set of peaks occurs relative to the solution phase process
can reveal whether only the oxidised or the reduced species is adsorbed. Peaks at
potentials more negative than the solution-phase redox peaks are due to the oxidised
species being adsorbed onto the electrode surface. The stronger the adsorption of the
oxidised species, the more the postpeak succeeds the diffusion peak. When adsorption
is weak, the difference in energies for reduction of adsorbed and dissolved species is
small, and a separate postpeak is not observed.
In this case we see a poorly resolved postpeak, especially for the cathodic process,
that could arise from only the oxidised species being adsorbed. To investigate whether
one or both redox states are adsorbed, the scan rate dependence of the peak current
was studied. For a diffusion-controlled redox reaction of a solution species the peak
current increases linearly as a function of the square root of the scan rate, whereas for
an adsorbed species, there is a linear relationship between the peak current and the
scan rate.
The oxidation peak heights, ipa, from Figure 3.18(a) are plotted against either v or v1/2
and shown in Figure 3.19. Only the oxidation peaks were chosen as peak IIa is more
clearly resolved in the cyclic voltammograms than IIc. From Figure 3.19(a), the linear
relationship of ipa confirms that peaks Ia and Ic stem from the solution-phase redox
process:
[Ru(NH3)6]3+ (aq) + e− [Ru(NH3)6]
2+ (aq) (3.13)
As ipa of peak IIa depends linearly on v and not v1/2, it can be concluded that peaks IIa
and IIc arise from adsorbed species:
[Ru(NH3)6]3+ (ads) + e− [Ru(NH3)6]
2+ (ads) (3.14)

3 Characterisation of GNF
116
Figure 3.19 (a) Peak current ipa of peak Ia determined from Figure 3.18(a) plotted against thesquare root of scan rate ν. (d) ipa of peak IIa determined from Figure 3.18(a) plotted against ν.

3 Characterisation of GNF
117
Figure 3.20 log ipa of (a) peak Ia and (b) peak IIa determined from Figure 3.19(a) plottedagainst log ν.
Logarithms were taken of the peak currents and these were plotted against the
logarithm of scan rate in Figure 3.20. A linear relationship is expected and the gradient
can be used to assess the extent of adsorption contributing to the redox process. A
value of 0.5 is indicative of diffusion control, whereas values above that indicate
adsorption alongside diffusion. Figure 3.20(a) shows that the gradient for peak Ia is
significantly above 0.5, suggesting that adsorption contributes to the diffusion-

3 Characterisation of GNF
118
controlled redox reaction. In Figure 3.20(b) the gradient for peak IIa is close to 1,
confirming that only adsorbed species are contributing to this peak.
We assume that a similar adsorption is taking place at the acid-terminated GNF, but
due to the smaller amount of material adhering to the electrode surface the additional
peaks are smaller in size, which restricts any analytical treatment of the peak currents.
GNF-Ca on the other hand is insoluble and therefore will adhere more strongly to the
BDD surface, allowing a greater amount of [Ru(NH3)6]3+/2+ to adsorb onto the modified
electrode surface, which leads to more intense redox peaks arising from the adsorbed
species.
It is unclear whether the [Ru(NH3)6]3+/2+ species is adsorbed onto the basal plane of the
GNF or whether it is interacting electrostatically with the negatively charged
carboxylate functionalities. The presence of carboxylic acids in GNF-Ca can be
detected in the IR spectrum (Figure 3.4) and the ratio of free carboxylate groups to
carboxylates complexed with Ca2+ was estimated from XPS data in Section 3.3.2.
Considering that there is a significant number of non-complexed functionalities present,
it is feasible that [Ru(NH3)6]3+ forms an ion pair with the free COO− groups. To see if the
metal centre could be reduced and oxidised while the ligands are interacting
electrostatically with carboxylate groups, acid-terminated GNF were complexed with
[Ru(NH3)6]3+. Cyclic voltammetry recorded with different scan rates (Figure 3.21(a))
revealed a poorly resolved reduction peak in the form of a shoulder at −326 mV and an
oxidation peak at −184 mV when v = 100 mV s−1. Although oxygen was removed from
the electrolyte prior to recording the CVs, residual oxygen may be present that
undergoes reduction at the modified electrode in the same potential range where
[Ru(NH3)6]3+ is reduced. Additionally, the onset of hydrogen evolution can also interfere
with the current response at more negative potentials, making it difficult to determine
the peak potential and the current arising from [Ru(NH3)6]3+ reduction. Further analysis
will therefore be confined to the oxidation peak only.

3 Characterisation of GNF
119
Figure 3.21 (a) Cyclic voltammograms recorded at a BDD modified with [Ru(NH3)6]3+
complexed GNF. Scan rates 5 (black), 25 (red), 100 (green), 325 (blue) and 500 (light blue)mV s
−1. Electrolyte: 0.1 M K2HPO4. (b) A plot of oxidation peak current ipa against scan rate v.
(c) log ipa plotted against log ν.

3 Characterisation of GNF
120
Scan rate study (Figure 3.21(b)) shows that the oxidation peak current is linearly
dependent on the scan rate, indicating that the redox reaction is not diffusion controlled
and therefore the redox species is bound to the surface. When the scan rate is 5 mV
s−1, several oxidation peaks can be discerned in the current trace. This suggests that
the [Ru(NH3)6]3+ species exists in more than one environment, perhaps due to various
coordination modes and numbers of the amine ligands to the carboxylate groups at the
flake edges.
Table 3.3 shows the oxidation peak potential values at different scan rates together
with peak currents. It can be seen that the main oxidation peak shifts with scan rate
and varies from −145 mV at v = 25 mV s−1 to −225 mV at v = 500 mV s−1. The cathodic
peak potentials are relatively stable with a slight shift to more negative potentials,
although as mentioned earlier it is difficult to determine the Epc with certainty. The shift
in Epa and the asymmetric shape of the oxidation peak further suggests that the
[Ru(NH3)6]3+ species exists in various different environments when the precipitate is
formed. Some of the [Ru(NH3)6]3+ species may be so weakly complexed with the COO−
that the interaction between the charged species can be overcome by immersion in
electrolyte or applying a potential. This results in a population of both surface-bound
and solution-phase [Ru(NH3)6]3+ that would undergo reduction and consequent
oxidation at different potentials. The solution-phase [Ru(NH3)6]3+ would give more
prominent redox peaks at lower scan rates while at higher scan rates the adsorbed
species would present more intense redox peaks.
The existence of both adsorbed and solution-phase species is evident when the plot of
log ipa against log ν is examined (Figure 3.21(c)). The data points can’t be fitted with a
linear regression line, and although the regression coefficient is close to 1 at higher
scan rates, at slow scan rates the relationship between log ipa and log ν deviates
significantly from what is expected of a non-diffusion controlled process.

3 Characterisation of GNF
121
Table 3.3: Scan rates, oxidation peak currents and oxidation peak potentials extracted fromFigure 3.21.
ν / mV s−1 Ipa / µA Epa / V
5 0.0129 −0.119
25 0.0187 −0.145
100 0.0445 −0.184
325 0.148 −0.213
500 0.215 −0.225
3.4 Conclusion
In this chapter, further characterisation of GNF materials is presented to complement
existing data found in literature [7, 8], focusing on the acid/base properties of GNF-
COOH, IR spectroscopy and electrochemical characterisation using cyclic voltammetry
both with and without redox probes.
Modifying the BDD surface with GNF results in a clearly detectable difference in the
voltammetric response compared to the unmodified surface across the whole pH range
examined. Therefore, CV in the aqueous phase can be employed to study the various
GNF samples by using a BDD electrode modified with a layer of adsorbed GNF.
Neither amide nor carboxylic acid –terminated GNF shows a detrimental effect on
electron transfer rate with respect to the outer-sphere FcMeOH redox couple. This
result is consistent with the observed fast electron transfer kinetics towards these
species obtained using single layer graphene electrodes [12, 28]. The high density of
carboxylic acid or amide functionalities does not appear to perturb the electrochemical
response under these reaction conditions.
pH titration experiments reveal that in solution pH of ca. 4 to 8 the edge groups are
present in a range of protonation states. The response towards hydroquinone reduction

3 Characterisation of GNF
122
shows deviation from the response at clean BDD at pH < 7 and in more acidic pH
conditions the edge groups clearly play a role in the reaction mechanism.
At the present time it is unclear in what orientation the GNF are arranged on the
electrode surface, as their small size and transparency makes the immobilised layer
difficult to characterise. However as the coverage and flake orientation will clearly be
important for fully understanding the electrochemical response, further studies into the
determination and control of the electrode layer morphology are needed and these will
be described in Chapter 6.

3 Characterisation of GNF
123
References for Chapter 3
1. McCreery, R. L., Advanced Carbon Electrode Materials for MolecularElectrochemistry. Chem. Rev. 2008, 108 (7), 2646-2687.
2. Wildgoose, G. G.; Abiman, P.; Compton, R. G., Characterising ChemicalFunctionality on Carbon Surfaces. J. Mater. Chem. 2009, 19 (28), 4875-4886.
3. McDermott, C. A.; Kneten, K. R.; McCreery, R. L., Electron Transfer Kinetics ofAquated Fe+3/+2, Eu+3/+2, and V+3/+2 at Carbon Electrodes: Inner Sphere Catalysisby Surface Oxides. J. Electrochem. Soc. 1993, 140 (9), 2593-2599.
4. Chen, P.; Fryling, M. A.; McCreery, R. L., Electron Transfer Kinetics at ModifiedCarbon Electrode Surfaces: The Role of Specific Surface Sites. AnalyticalChemistry 1995, 67 (18), 3115-3122.
5. Chen, P.; McCreery, R. L., Control of Electron Transfer Kinetics at Glassy CarbonElectrodes by Specific Surface Modification. Analytical Chemistry 1996, 68 (22),3958-3965.
6. Lounasvuori, M. M.; Rosillo-Lopez, M.; Salzmann, C. G., et al., ElectrochemicalCharacterisation of Graphene Nanoflakes with Functionalised Edges. FaradayDiscussions 2014, 172 ( ), 293-310.
7. Salzmann, C. G.; Nicolosi, V.; Green, M. L. H., Edge-Carboxylated GrapheneNanoflakes from Nitric Acid Oxidised Arc-Discharge Material. J. Mater. Chem.2010, 20 (2), 314-319.
8. Rosillo-Lopez, M.; Lee, T. J.; Bella, M., et al., Formation and Chemistry ofCarboxylic Anhydrides at the Graphene Edge. RSC Advances 2015, 5 (126),104198-104202.
9. Sutton, C. C. R.; Franks, G. V.; da Silva, G., Modeling the Antisymmetric andSymmetric Stretching Vibrational Modes of Aqueous Carboxylate Anions.Spectrochimica Acta Part A: Molecular and Biomolecular Spectroscopy 2015,134, 535-542.
10. Szabó, T.; Berkesi, O.; Dékány, I., DRIFT Study of Deuterium-ExchangedGraphite Oxide. Carbon 2005, 43 (15), 3186-3189.
11. Lounasvuori, M. M.; Rosillo-Lopez, M.; Salzmann, C. G., et al., The Influence ofAcidic Edge Groups on the Electrochemical Performance of GrapheneNanoflakes. J. Electroanal. Chem. 2015, 753, 28-34.
12. Li, W.; Tan, C.; Lowe, M. A., et al., Electrochemistry of Individual MonolayerGraphene Sheets. ACS Nano 2011, 5 (3), 2264-2270.
13. Bard, A. J.; Faulkner, L. R.; Leddy, J., Electrochemical Methods : Fundamentalsand Applications. 2nd ed.; Wiley: New York ; Chichester, 2001; p xxi, 833 p.
14. Mukherjee, S.; Kumar, S.; Misra, A. K., et al., Removal of Phenols from WaterEnvironment by Activated Carbon, Bagasse Ash and Wood Charcoal. Chem.Eng. J. 2007, 129 (1–3), 133-142.
15. Nordlund, J. J.; Grimes, P. E.; Ortonne, J. P., The Safety of Hydroquinone.Journal of the European Academy of Dermatology and Venereology 2006, 20 (7),781-787.
16. Enguita, F. J.; Leitao, A. L., Hydroquinone: Environmental Pollution, Toxicity, andMicrobial Answers. Biomed Research International 2013.

3 Characterisation of GNF
124
17. Duo, I.; Levy-Clement, C.; Fujishima, A., et al., Electron Transfer Kinetics onBoron-Doped Diamond Part I: Influence of Anodic Treatment. J. Appl.Electrochem. 2004, 34 (9), 935-943.
18. Baxendale, J. H.; Hardy, H. R., The Ionization Constants of SomeHydroquinones. Transactions of the Faraday Society 1953, 49 (0), 1140-1144.
19. Medina-Ramos, J.; Alligrant, T. M.; Clingenpeel, A., et al., Comparing theHydrogen-Bonding Effect of Brönsted Bases in Solution and When They AreCovalently Bound to the Surface of Glassy Carbon Electrodes in theElectrochemical Behavior of Hydroquinone. The Journal of Physical Chemistry C2012, 116 (38), 20447-20457.
20. DuVall, S. H.; McCreery, R. L., Control of Catechol and Hydroquinone Electron-Transfer Kinetics on Native and Modified Glassy Carbon Electrodes. AnalyticalChemistry 1999, 71 (20), 4594-4602.
21. Granger, M. C.; Witek, M.; Xu, J., et al., Standard Electrochemical Behavior ofHigh-Quality, Boron-Doped Polycrystalline Diamond Thin-Film Electrodes.Analytical Chemistry 2000, 72 (16), 3793-3804.
22. Quan, M.; Sanchez, D.; Wasylkiw, M. F., et al., Voltammetry of Quinones inUnbuffered Aqueous Solution: Reassessing the Roles of Proton Transfer and Hydrogen Bonding in the Aqueous Electrochemistry of Quinones. J. Am. Chem.Soc. 2007, 129 (42), 12847-12856.
23. Kern, J.; Renger, G., Photosystem II: Structure and Mechanism of theWater:Plastoquinone Oxidoreductase. Photosynth. Res. 2007, 94 (2), 183-202.
24. Costentin, C.; Louault, C.; Robert, M., et al., Evidence for ConcertedProton−Electron Transfer in the Electrochemical Oxidation of Phenols with Water as Proton Acceptor. Tri-Tert-Butylphenol. J. Am. Chem. Soc. 2008, 130 (47),15817-15819.
25. Hammes-Schiffer, S., Proton-Coupled Electron Transfer: Moving Together andCharging Forward. J. Am. Chem. Soc. 2015, 137 (28), 8860-8871.
26. Costentin, C.; Louault, C.; Robert, M., et al., The Electrochemical Approach toConcerted Proton—Electron Transfers in the Oxidation of Phenols in Water.Proceedings of the National Academy of Sciences 2009, 106 (43), 18143-18148.
27. McCreery, R.; Hu, C.-C.; Macpherson, J., et al., Role of Surface Contaminants,Functionalities, Defects and Electronic Structure: General Discussion. FaradayDiscussions 2014, 172 (0), 365-395.
28. Valota, A. T.; Kinloch, I. A.; Novoselov, K. S., et al., Electrochemical Behavior ofMonolayer and Bilayer Graphene. ACS Nano 2011, 5 (11), 8809-8815.

125
4 GNF-COOH and Ferri/Ferrocyanide
4.1 Introduction
The [Fe(CN)6]3−/4− redox couple is often used as a standard probe to characterise
electrode surface area and to study electrode kinetics, even though some complicating
factors regarding the use of this probe are well documented. Several previous reports
have found that, especially at metal electrodes, the standard heterogeneous electron
transfer rate constant k0 of [Fe(CN)6]3−/4− depends on the identity and concentration of
the supporting electrolyte [1, 2]. Noel and Anantharaman [3] have observed the cation
dependence at glassy carbon electrodes, showing that the effect is not limited to metal
electrodes. An increase in k0 with increasing potassium ion concentration was
attributed to a transition state complex involving K+ [1], in agreement with previous
reports from Sohr et al.[4, 5] who devised a model of the redox species forming a dimer
via a bridging cation.

4 GNF-COOH and ferri/ferrocyanide
126
A systematic investigation into the influence of surface oxygen functionalities using
glassy carbon electrodes showed that the [Fe(CN)6]3−/4− CV response did not show a
dependence on any specific surface oxygen groups, although it was sensitive to the
presence of adsorbates [6]. However, other studies have shown pH dependence in the
electron transfer kinetics of this couple at glassy carbon electrodes, the process
becoming slower as pH is increased [7]. This effect was attributed to the presence of
surface carboxylic acid functionalities that become deprotonated and hence negatively
charged in more alkaline solutions; therefore electrostatic repulsion occurs between the
electrode surface and the negatively charged redox species. At polycrystalline BDD
electrode, the presence of COOH groups slows down the electron transfer kinetics of
[Fe(CN)6]3−/4− dramatically [8, 9], and due to the pH dependence of the reaction,
electrostatic repulsion was inferred as the cause of the change in kinetics. Yagi et al.
[10] also found that oxygen plasma treatment of BDD caused the HET for this couple to
slow down, and although they weren’t able to identify the oxygen functionalities on the
surface, carboxyl groups were proposed to be present and to act as a repulsive site to
negatively charged redox species.
In light of the considerable evidence summarised above showing that carboxylic acid
groups at the surface of carbon electrodes slow down the HET for [Fe(CN)6]3−/4−, we
chose to study this redox couple at GNF-modified BDD. The abundance of COOH
groups present at the edge-carboxylated flakes is expected to magnify any effect the
acidic groups may have on this redox couple. At the same time, the amide-terminated
GNF can be used as control to confirm that any differences in the electrochemical
behaviour are due to the COOH groups and not other factors such as carbonyl groups
or increased sp2 carbon present at the surface.
The work presented in this Chapter has been published in [11].

4 GNF-COOH and ferri/ferrocyanide
127
4.2 Experimental Methods
All aqueous solutions were prepared with doubly deionised water, taken from a Milli-Q
water purification system, with a resistivity of not less than 18.2 MΩ cm at 25 °C.
4.2.1 Electrochemical Experiments
Potassium ferricyanide (K3[Fe(CN)6]) and potassium hexacyanoruthenate(II)
(K4[Ru(CN)6]) were obtained from Sigma-Aldrich and used as received. GNF-COOH
were drop-coated onto the working electrode surface or added to the solution along
with the redox probe. Other experimental details are described in Section 3.2.5.
4.2.2 Infrared Spectroscopy Experiments
Figure 4.1 Spectroscopy cell used in this Chapter.
The stability of [Fe(CN)6]3−/4− in solution was investigated by recording the IR
absorption of the cyanide ligands over a 24-hour period. ATR-FTIR spectra were
recorded with a Bruker ISF 66/S spectrometer (Bruker, UK) fitted with a liquid nitrogen-
cooled MCT A detector and a silicon ATR prism at 4 cm−1 resolution. A stainless steel

4 GNF-COOH and ferri/ferrocyanide
128
cell (Figure 4.1) was placed on top of the IRE with two narrow steel tubes at the top of
the cell that acted as the inlet and outlet for the sample. Plastic tubing was attached to
the steel tubes and the sample was introduced at one end via a syringe. The sample
was then pumped back and forth to remove any air bubbles. The length of the plastic
tubing and the small surface area exposed to the atmosphere meant that
contamination of samples in D2O by atmospheric water was minimised. A single
spectrum was computed by Fourier transformation of 250 averaged interferograms for
background and sample and the software was programmed to record a spectrum every
60 minutes. The background spectrum was of pure water and air for experiments in
H2O and D2O, respectively. Spectra recorded in H2O were manipulated using the
baseline and atmospheric correction functions in OPUS software. Spectra recorded in
D2O were manipulated by subtracting a spectrum of D2O only, which was first scaled to
match the absorbance at 2080–2740 cm−1 in sample spectra.
4.2.3 Spectroelectrochemical Experiments
To probe the effect of solution-phase GNF on the reversibility of the [Fe(CN)6]3−/4−
redox couple, the IR absorption of the cyanide ligands was monitored during oxidation
and reduction using an in situ technique. ATR-FTIR spectra were recorded as detailed
in Section 4.2.2. An electrochemical cell (Figure 4.2) with a volume of 20 µl was used
with a Pt mesh working electrode situated 0.1–0.3 mm above the prism. A Pt sheet
counter and Ag/AgCl reference electrode were placed in a chamber separated from the
sample chamber by a Vycor frit. Working electrode potentials were set at 0 V for
reduction of [Fe(CN)6]3− to [Fe(CN)6]
4− and +350 mV for oxidation of [Fe(CN)6]4− to
[Fe(CN)6]3−. IR difference spectra were constructed by recording a background
spectrum at one potential, then switching to the second potential and recording a
sample spectrum at specific time intervals.

4 GNF-COOH and ferri/ferrocyanide
129
Figure 4.2 (a) Spectroelectrochemical setup used in this Chapter. (b) Schematic of the cellviewed from the top.
4.3 Results and Discussion
4.3.1 The Effect of Solution pH
Figure 4.3(a) shows CVs for 0.5 × 10⁻³ M K3[Fe(CN)6] at a clean BDD electrode in
background electrolyte of 0.1 M pH 4.6 and 9.2 PBS. At the BDD electrode the peak
separation ΔEp remains constant at (65 ± 2) mV over the whole pH range examined
(pH 4.6–9.2) indicating close to reversible electron transfer kinetics. The E0’ of the
couple, taken as ½(Epa + Epc), shifts towards higher values with increasing pH, being
found at ca. 50 mV higher at pH 9.2 than at pH 4.6. The peak currents for oxidation and
reduction also decrease marginally over the same pH range. The [Fe(CN)6]3−/4−
electron transfer process has been shown to be inhibited at oxygen-terminated BDD
surfaces when the oxygen termination is achieved by acid washing [12] or oxygen
plasma treatment [9]; when oxygen termination is introduced by alumina polishing, as
in this study, effectively reversible electron transfer kinetics are observed [9]. Figure
4.3(a) suggests a small degree of interaction of [Fe(CN)6]3−/4− with the BDD surface,
which is possibly due to the presence of non-diamond-like carbon impurities in the
electrode. sp2-hybridised carbon is a common impurity in BDD electrodes, and on sp2-

4 GNF-COOH and ferri/ferrocyanide
130
hybridised carbon such as glassy carbon, the [Fe(CN)6]3−/4− redox reaction is thought to
proceed via an adsorbed intermediate [10] because the HET is affected by a
physisorbed molecular layer [6].
Figure 4.3(b) shows the response of 0.5 × 10⁻³ M K3[Fe(CN)6] at pH 4.6 and 9.2 at a
GNF-COOH modified electrode. The response at this electrode is found to be very
dependent on pH, particularly for pH < 8. Peak currents for both oxidation and
reduction decrease and ΔEp increases as the pH is lowered: at pH 7 ΔEp = 109 mV; pH
6 ΔEp = 120 mV; pH 5 ΔEp = 213 mV and pH 4.6 ΔEp = 250 mV. This indicates that
electron transfer becomes slower under these experimental conditions, which could be
attributed to a change in the nature of the redox molecule, an unfavourable interaction
with the electrode surface (or loss of a favourable interaction) or formation of an
adsorbed inhibiting layer on the electrode. The response doesn’t show a dependence
on time or potential, as it is observed immediately from the first CV scan and the
response does not get worse with cycling (currents rather increase marginally with
consecutive scans). This would indicate that the effect cannot be attributed to formation
of a surface film that deposits as a function of time or applied potential. However it
does not preclude the fast, spontaneous formation of an adsorbed layer, formed
independently of applied potential.
As detailed in the Introduction to this Chapter, [Fe(CN)6]3−/4− has been reported to be
inhibited by deprotonated carboxylic acid moieties at carbon electrodes. Panzer and
Elving [13] reported decreased reversibility on freshly cleaved pyrolytic graphite
electrodes in more alkaline solution, but they also saw a shift to more negative
potentials with increasing pH for both reduction and oxidation peaks, which was
explained by the acid-anion equilibria involving ferrocyanic and ferricyanic acids. What
is observed here is the opposite: the more protonated the GNF are, the more
unfavourable the interaction is with the negatively charged redox species. No shift

4 GNF-COOH and ferri/ferrocyanide
131
attributable to the acid-anion equilibrium is observed here. In fact, E0’ shifts positively
with increasing pH, the opposite of what Panzer and Elving reported.
Figure 4.3(c) shows the response of the GNF-amide modified electrode towards 0.5 ×
10−3 M K3[Fe(CN)6] in 0.1 M pH 4.6 and pH 9.2 PBS. For this electrode there is no pH
dependence on the voltammetric response and the electron transfer kinetics appear
only slightly less reversible than at clean BDD (ΔEp = (70 ± 1) mV at 50 mV s−1) over
pH range 4.6–9.2. In fact the response is less dependent on pH than at a clean BDD
electrode. Thus it is apparent that carbonyl, amide or amine functionalities have little
influence on the electrochemical response of [Fe(CN)6]3−/4− at GNF-modified
electrodes. The observed inhibition of current at the GNF-COOH electrode can
therefore be attributed specifically to the presence of the acid functionalities.
We estimate from titration of the GNF-COOH (Section 3.3.4) that the COOH edge
groups are fully deprotonated at pH higher than 8, hence we might expect the
[Fe(CN)6]3−/4− redox reaction to be inhibited at more alkaline pH. However we observe
relatively reversible electrochemistry at pH 7 and above, and at pH 9.2 (where all of the
COOH will be deprotonated and negatively charged) the response is identical to that at
a clean BDD electrode. Therefore an electrostatic argument for the observed behaviour
is clearly inappropriate in this case. Study of the [Fe(CN)6]3−/4− redox couple is made
still more difficult due to its complex solution chemistry, in particular its preference for
ion-pairing with solution cations [1-3] and propensity to lose ligands and form
aggregates that are intermediates to Prussian Blue film deposition [15-18]. Additionally
acid/base equilibria involving protonation of the nitrogen of the cyanide ligands
becomes important over some pH ranges (pKa of H[Fe(CN)6]3− is ca. 4.2 [19]).

4 GNF-COOH and ferri/ferrocyanide
132
Figure 4.3 Cyclic voltammograms of 0.5 × 10⁻³
M K3[Fe(CN)6] recorded in 0.1 M PBS. Workingelectrode: (a) BDD; (b) BDD modified with GNF-COOH; (c) BDD modified with GNF-amide.
Solution pH 4.6 (black, blue, light blue); 9.2 (red, orange, pink). Scan rate 50 mV s−1
. First scansshown. Adapted from [14].

4 GNF-COOH and ferri/ferrocyanide
133
Due to the differing bonding environments of the COOH groups and electrostatic and
hydrogen-bonding interactions between neighbouring groups,
protonation/deprotonation takes place over a wide pH range, as shown by the titration
curve in Figure 3.5. We see slower kinetics at the GNF-COOH modified electrode at
pH < 8, coinciding with the pH range where GNF-COOH are involved in dynamic
protonation equilibria. The instability of [Fe(CN)6]3−/4− in these conditions may be due to
the environment within the diffusion layer surrounding the GNF, where some of the
carboxylic acid groups may be acidic enough to protonate the redox molecule,
promoting cyanide ligand loss in the form of HCN and allowing deposition of films
similar in nature to Prussian Blue [20]. Solutions of [Fe(CN)6]3− at pH 3.6 have been
reported to have different UV-Vis spectral features to those at higher pH (indicating
protonation or ligand loss) and to develop blue precipitates on standing [21]. Although
our solution pH values of ≥ 4.6 would not be considered acidic enough to cause
decomposition of [Fe(CN)6]3−, a higher concentration of protons may be present close
to the electrode surface due to the high density of carboxylic acid functionalities.
4.3.2 The Effect of Background Electrolyte Concentration
To determine whether a cation dependence is seen at clean BDD, and whether
modifying the electrode with GNF changes the response, cyclic voltammograms of
[Fe(CN)6]3−/4− were recorded in electrolyte solutions of different concentrations. In these
experiments the background electrolyte was KCl so the solutions are not buffered, but
are all in the pH range 5-6. Figure 4.4 shows CVs at clean BDD, GNF-COOH and
GNF-amide with 0.5 × 10⁻³ M K3[Fe(CN)6] in 1 M (a), 0.1 M (b) and 0.01 M KCl (c).
Increasing the concentration of the supporting electrolyte causes a shift in E0’ to more
positive potentials for all electrodes studied here, confirming that the electrolyte plays a
role in the redox equilibrium. At high ionic strength (1 M KCl) the CV response at all
three electrodes is reversible, but at 0.1 M KCl currents at the GNF-COOH electrode
are much reduced and ΔEp is significantly increased. In 0.01 M supporting electrolyte

4 GNF-COOH and ferri/ferrocyanide
134
the responses at clean BDD and GNF-amide modified electrodes are still reversible but
the CV at the GNF-COOH electrode shows significant inhibition. The response appears
sigmoidal, resembling the CV expected at an array of microelectrodes, or response
through pinholes of an electrode partially covered in insulating material. Calculated
values of ΔEp are listed in Table 4.1.
Table 4.1: Calculated values of peak potential separation ΔEp in various concentrations ofsupporting electrolyte KCl.
Electrode
ΔEp / mV
0.01 M KCl 0.1 M KCl 1 M KCl
BDD only 74 ± 6 69 ± 2 75 ± 1
GNF-COOH Unable to calculate 137 ± 27 92 ± 6
GNF-amide 88 ± 3 69 ± 1 68 ± 1
The results are qualitatively the same in other supporting electrolytes of the same
concentration (see Appendix 1). The pH of 0.01 M KCl is around 5, so the experiment
was repeated in 0.01 M KCl solution, the pH of which was brought up to 8.5 with KOH
(see Appendix 1). The rise in pH improved the kinetics of the redox reaction at GNF-
COOH modified BDD, giving ΔEp = (231 ± 21) mV.
At low ionic strength the electrostatic interaction between the electrode and the redox
probe will be enhanced as screening by solution ions in the double layer is less
effective. These conditions seem to amplify the inhibiting effect of the COOH groups on
the [Fe(CN)6]3−/4− electrochemistry, particularly at lower pH. Additionally the stability of
the [Fe(CN)6]3−/4− species may also be affected by the low ionic strength conditions as
ion-pairing with K+ will be less effective at lower cation concentration.

4 GNF-COOH and ferri/ferrocyanide
135
Figure 4.4 Cyclic voltammograms of 0.5 × 10⁻³
M K3[Fe(CN)6] recorded in differentconcentrations of KCl: (a) 1 M; (b) 0.1 M; (c) 0.01 M. Working electrode: BDD (black); BDD
modified with GNF-COOH (red); BDD modified with GNF-amide (blue). Scan rate 50 mV s−1
.First scans shown. Adapted from [14].

4 GNF-COOH and ferri/ferrocyanide
136
Beriet and Pletcher [2] suggested the decomposition of [Fe(CN)6]3−/4− on a platinum
electrode surface to form a blocking species. Other groups have found evidence of
[Fe(CN)6]3−/4− adsorption onto platinum electrodes as a Prussian Blue film that inhibits
electron transfer [22], although Prussian Blue itself is electroactive [23]. Excess free
CN− in the electrolyte solution prevents [Fe(CN)6]3−/4− from chemisorbing on Pt surface
by occupying chemisorption sites and thus prevents [Fe(CN)6]3−/4− decomposition [17,
18]. The inhibiting effect of adsorbed species on the electrode surface was observed to
grow gradually stronger as the adsorption proceeded [22], whereas in the experiments
conducted in this study the effect is seen immediately, and is at its strongest in the first
cycle.
Although it is difficult to provide a definitive explanation, it is known that [Fe(CN)6]3−/4−
can be unstable in solution, particularly at low ionic strength and low pH. Cyanide
ligand loss and subsequent adsorption/decomposition of ferrocyano-species onto metal
and carbon electrodes are well documented [2, 15-17, 22-24]. The [Fe(CN)6]3−/4− redox
reaction is believed to take place via activated ion-paired complexes such as
K2[Fe(CN)6]2−/1−. If these ion-pair complexes cannot form, for example at low ionic
strength, then the electron transfer rate is much slower [1]. The electrochemical
response of [Fe(CN)6]3−/4− in the presence of GNF-COOH at pH < 7 suggests a lack of
stability of the ion-paired redox species and hence sluggish electron transfer kinetics.
At low ionic strength the response is consistent with a spontaneous deposition of
blocking species on the electrode surface, indicating the real lack of stability of the
redox molecule in these solution conditions.
In the previous Section we discovered that the presence of COOH groups at the
electrode greatly inhibits the [Fe(CN)6]3−/4− redox reaction at lower pH. The effect is
exacerbated in low ionic strength solutions, as [Fe(CN)6]3− is considerably less stable in
solution in the absence of ion-pairing to K+. Interestingly, when experiments with the
GNF-COOH are repeated with [Ru(CN)6]3−/4− as the redox couple the CV response is

4 GNF-COOH and ferri/ferrocyanide
137
found to be independent of pH (see Appendix 1). The process appears reversible over
the pH range 4.5–9.2 with no evidence of the inhibition and proposed surface film
formation seen for [Fe(CN)6]3−/4−. This would suggest that a mechanism requiring
specific interaction between the COOH groups and the cyanide ligands of the redox
species can be ruled out and it is more likely the complex solution chemistry of
[Fe(CN)6]3−/4− that results in the observed response.
4.3.3 Cyclic Voltammetric Studies of [Fe(CN)6]3−/4− Redox Couple in
the Presence of GNF-COOH in Solution
To explore further our previous observations that the [Fe(CN)6]3−/4− species are
unstable in the solution environment surrounding the GNF, cyclic voltammetry was
performed with both [Fe(CN)6]3− and GNF present in solution. All CVs were recorded at
a freshly polished, clean BDD electrode. The experiment was also carried out with the
[Ru(CN)6]3−/4− redox species in solution for comparison. It can be seen from Figure 4.5
that presence of GNF in solution influences both redox reactions, but the extent to
which this happens differs greatly. In the case of [Ru(CN)6]3−/4−, the presence of GNF in
solution leads to a small increase in peak separation and a small decrease in peak
height. In the case of [Fe(CN)6]3−/4−, on the other hand, the peak height is drastically
reduced and the voltammogram has a sigmoidal shape, indicative of electrode
blocking. This is the same response as we obtained when COOH-terminated GNF
were immobilised directly on the electrode surface (Figure 4.4(b)). The decrease in
current observed for the [Ru(CN)6]3−/4− couple we attribute to a small lowering of the
effective diffusion coefficient of the probe due to the large GNF particles dispersed in
the solution. We would expect a similar inhibition for [Fe(CN)6]3−/4−; however these
results indicate that GNF have a profound effect on the electron transfer process of this
species, rather than simply blocking diffusion. As discovered in Sections 4.3.1 and
4.3.2 it is specifically the COOH edge groups which affect the [Fe(CN)6]3−/4− in this way,
suggesting a protonation process may be responsible for these observations.

4 GNF-COOH and ferri/ferrocyanide
138
Figure 4.5 Cyclic voltammograms of 0.5 × 10⁻³
M K3[Fe(CN)6] (dashed blue); 0.5 × 10⁻³
MK3[Fe(CN)6] and 34 μg ml
−1GNF (solid blue); 0.5 × 10
−3M K4[Ru(CN)6] (dashed red); 0.5 × 10
−3
M K4[Ru(CN)6] and 34 μg ml−1
GNF (solid red); 34 μg ml−1
GNF only (black). Working electrode:BDD. Supporting electrolyte: 10
−3M KCl. Scan rate: 50 mV s
−1. First scans shown. Reproduced
from [11].
4.3.4 Isotope Effect of H2O and D2O on [Fe(CN)6]3−/4− Redox Couple
at GNF-COOH Modified Electrode
Having established the importance of the acidic functionalities in electron transfer
process for [Fe(CN)6]3−/4−, CV experiments were carried out in low ionic strength
(0.01 M KCl) solutions with GNF immobilised on the electrode surface and either H2O
or D2O as the solvent. The results are presented in Figure 4.6. When H2O is used as
the solvent, the CV shows significant inhibition in the first cycle. The response
improves slightly during repeated cycling, but the 10th cycle still shows significant
irreversibility of the redox reaction. In D2O, the first cycle shows inhibited electron
transfer, but the response improves during repeated cycling with increase in peak
heights and decrease in peak separation. By the tenth scan, the response in D2O is
essentially reversible.

4 GNF-COOH and ferri/ferrocyanide
139
Figure 4.6 Cyclic voltammograms of 0.5 × 10⁻³
M K3[Fe(CN)6] recorded at GNF-COOHmodified BDD in (a) H2O; (b) D2O. First scans (black) and 10th scans (red) shown. Supporting
electrolyte 0.01 M KCl. Scan rate 50 mV s−1
. Adapted from [11].
When the GNF are surrounded with H2O molecules, the constant protonation and
deprotonation of the carboxylic acid edge groups does not lead to a change in the
chemical identity of the acid groups. However, if the H2O molecules are replaced by
D2O, the dynamic acid/base equilibrium will gradually lead to predominantly COOD
around the flake edges as the protons are exchanged and diffuse away from the
electrode surface. Therefore we propose that during the first cycles in D2O, the GNF
edges are still mostly decorated with COOH groups and these inhibit the redox

4 GNF-COOH and ferri/ferrocyanide
140
reaction. However, as COOD groups begin to dominate, the redox reaction is allowed
to proceed uninhibited, leading to a near reversible CV by the 10th scan. The results
also suggest that if an electrode blocking species is responsible for the inhibited
electron transfer, it forms reversibly and can dissolve or desorb from the electrode
surface according to changes in the diffusion layer. Thus the redox reaction is able to
become more reversible with cycling in D2O as the concentration of protons at the
GNF-modified electrode surface decreases.
4.3.5 Spectroelectrochemical Studies of [Fe(CN)6]3−/4−
The [Fe(CN)6]3−/4− redox reaction can be conveniently monitored with ATR-FTIR
because the cyanide stretch is sensitive to the oxidation state of the iron centre.
[Fe(CN)6]3− absorbs at 2116 cm−1, whereas in [Fe(CN)6]
4− the absorption frequency is
shifted to 2036 cm−1 and the extinction coefficient is four times larger.
ATR-FTIR coupled with in situ controlled potential experiments were performed for 1 ×
10−3 M K3[Fe(CN)6] in 0.01 M KCl. The sample was introduced to the in situ
electrochemical cell and a potential of 0 V was applied to drive the reduction of
[Fe(CN)6]3− to [Fe(CN)6]
4−. The resulting IR spectrum shows a negative
[Fe(CN)6]3− band and positive [Fe(CN)6]
4− band (solid line, Figure 4.7(a)). When the
intensity of the [Fe(CN)6]4− band did not increase anymore, all [Fe(CN)6]
3− present in
the sample chamber was assumed to have been converted to [Fe(CN)6]4−. The reaction
reached completion in about 2 minutes, as indicated by the intensity of the
[Fe(CN)6]4− band. The height of the [Fe(CN)6]
4− band as a function of time is plotted in
Figure 4.7(b). The potential was then switched to +350 mV to oxidise [Fe(CN)6]4−back
to [Fe(CN)6]3−. The resulting IR spectrum shows a positive [Fe(CN)6]
3− band and
negative [Fe(CN)6]4− band (dashed line, Figure 4.7(a)). As was the case for the
reduction, the negative [Fe(CN)6]4− band reached full height after about 2 minutes,
indicating full conversion back to [Fe(CN)6]3−.

4 GNF-COOH and ferri/ferrocyanide
141
Figure 4.7 (a) Difference spectra of [Fe(CN)6]3−
and [Fe(CN)6]4−
. After reduction of [Fe(CN)6] 3−
,the IR spectrum shows a negative [Fe(CN)6]
3−band and positive [Fe(CN)6]
4−band (solid line).
Oxidation of [Fe(CN)6]4−
results in a positive [Fe(CN)6]3−
band and negative [Fe(CN)6]4−
band(dashed line). (b) Height of the [Fe(CN)6]
4−CN stretch band at 2036 cm
−1relative to the intensity
of absorption at full conversion as a function of time. Blue squares: 1 × 10⁻³
M K3[Fe(CN)6]; redsquares: 1 × 10
−3M K3[Fe(CN)6] and 3.2 μg ml
−1of GNF. Electrolyte: 0.01 M KCl. Potentials:
0 V (reduction), +350 mV (oxidation). Reproduced from [11].
The [Fe(CN)6]3− solution was then replaced by a solution containing 1 × 10⁻³ M
K3[Fe(CN)6] in 0.01 M KCl and 3.2 μg ml−1 of GNF. The concentration of acidic protons
from the GNF is estimated to be 22 μM and only a small fraction would be dissociated.
Therefore the GNF did not significantly alter the pH of the solution. The experiment was
then repeated and a potential of 0 V applied. With the GNF present, the reaction

4 GNF-COOH and ferri/ferrocyanide
142
proceeded much more slowly. After 2 min, the [Fe(CN)6]4− band was only 40% of the
intensity expected for full conversion of [Fe(CN)6]3− to [Fe(CN)6]
4−. Full conversion took
approximately 9 min, compared to 2 min for the same volume and concentration of the
control solution. The influence of GNF on the oxidation reaction was essentially the
same.
The observations reported here support the CV experiments described in above. The
presence of GNF clearly inhibits the reversibility of the [Fe(CN)6]3−/4− redox couple.
Moreover, it was shown in Figure 4.5 that the observed decrease in current could not
be explained by diffusion effects alone. Therefore, the reason why the reaction takes
longer to complete with GNF in solution is likely to lie in the solution stability of the
redox species.
4.3.6 Stability of [Fe(CN)6]3−/4− in the Presence of GNF-COOH
Beriet and Pletcher [2] made the observation that the poisoning of an electrode surface
by the [Fe(CN)6]3−/4− redox couple required the presence of both Fe(II) and Fe(III)
species. We therefore used an equimolar solution of K3[Fe(CN)6] and K4[Fe(CN)6] in
H2O to probe their stability in solution in the absence of applied potential. To gauge the
impact of GNF on the stability of [Fe(CN)6]3−/4−, a second solution was prepared, this
one also containing 30 μg ml−1 GNF. The concentration of GNF was high enough to
impart a brownish hue to the solution but low enough to not alter the pH significantly
(pH of both solutions was 6.5 ± 0.1).

4 GNF-COOH and ferri/ferrocyanide
143
Figure 4.8 Infrared spectra of 2 × 10⁻³
M K3[Fe(CN)6] and 2 × 10⁻³
M K4[Fe(CN)6] in H2Oat t = 0 h (solid blue) and at t = 24 h (dashed blue); with 30 μg ml
−1GNF at t = 0 h (solid red)
and at t = 24 h (dashed red). Spectra are offset for clarity. Reproduced from [11].
The IR spectrum of both samples initially shows two peaks; the [Fe(CN)6]4− CN stretch
at 2036 cm−1 and the [Fe(CN)6]3− CN stretch at 2116 cm−1 (Figure 4.8). No peaks are
detected in the 1700–1200 cm−1 region that could be associated with GNF, although
the concentration of flakes is too low for this purpose. Over time, a third peak begins to
emerge in both samples. In the control solution, this peak at 2069 cm−1 is detectable
above the noise after about 13 h, whereas with GNF in solution, the intensity of this
third peak surpasses that of the [Fe(CN)6]3− peak after 3 h. Mixing the GNF sample by
pumping gently with a syringe back and forth caused a decrease in the intensity of the
peak at 2069 cm−1.
As described in Section 4.3.4, the identity of solvent has a marked influence on the
reversibility of the [Fe(CN)6]3−/4− redox couple. To further explore this, stability
experiments were repeated in D2O as shown in Figure 4.9. In H2O, a new band
appeared in between the two cyanide stretch bands after a couple of hours. In D2O, no
new band is seen after four hours whereas in H2O, the new band at that point was
already comparable in size to the [Fe(CN)6]4− stretch. After 24 hours in D2O the new

4 GNF-COOH and ferri/ferrocyanide
144
band did become evident, but its appearance is accompanied with a H2O band due to
H2O contamination from atmospheric moisture, leading to the conclusion that the
presence of appreciable concentration of protons is necessary for the
decomposition/precipitation reaction to proceed.
Figure 4.9 ATR-FTIR spectra of 2 × 10⁻³
M K3[Fe(CN)6] and 2 × 10⁻³
M K4[Fe(CN)6] with30 μg ml
−1GNF In H2O at t = 0 h (solid red) and t = 4 h (dashed red), in D2O at t = 0 h (solid
blue) and t = 4 h (dashed blue). Spectra are offset for clarity. Reproduced from [11].
The substitution of deuterium for hydrogen in a water molecule has little effect on the
molecular dimensions defined by bond length and bond angle, but the O–D bond is
slightly stronger than the O–H bond. The difference in bond strength leads to a smaller
dissociation constant for D2O than H2O, making H2O a fivefold stronger acid [25]. Liquid
D2O is more viscous than liquid H2O and has a slower rate of molecular reorientations
and translations [26], leading to the conclusion that there is more structural order in
D2O due to a higher degree of hydrogen bonding [27]. This can be attributed to lower
intermolecular vibrational frequencies caused by isotopic substitution but also the
greater strength of hydrogen bonding in D2O than in H2O [27]. Additionally, protons are
able to diffuse rapidly in water via the Grotthuss mechanism [28]. It has recently been
demonstrated that the mechanism is strongly influenced by the local hydration structure
of the proton and involves the concerted motion of several protons [29]. The

4 GNF-COOH and ferri/ferrocyanide
145
reorganisation and rotation of molecules involved in the Grotthuss mechanism are
slower in D2O than in H2O, making D+ transport in heavy water less efficient than
proton transport in H2O. Thus the instability of [Fe(CN)6]3−/4− in the presence of GNF
appears to be exacerbated by the readily available H+ in the localised acidic conditions
in the region of the carboxylic acid edge groups. Increased stability in D2O can be
attributed either to the increased strength of the O–D bond (making D+ less available)
or slower diffusion of D+ from the GNF to [Fe(CN)6]3−/4−.
4.3.6.1 Identity of decomposition product
The new IR absorption band observed in Figure 4.8 is very high in intensity compared
to the other two CN stretch bands. Given that the [Fe(CN)6]4− and [Fe(CN)6]
3− bands
are not greatly diminished, it is clear that the new cyano species cannot be present in
high concentration. The intensity of the new band may then be due to either a species
present in low concentration with a high extinction coefficient, or the accumulation of a
species in the region near the ATR prism. A new species with a high extinction
coefficient is unlikely, as the most plausible solution species candidate that absorbs in
this region is free cyanide, the absorption coefficient of which is very small compared to
the bound form [30]. The most likely explanation is the accumulation of a non-soluble
species at the surface of the internal reflection element, which in the cell geometry is at
the bottom of the cell. This would also explain why the intensity of the other CN stretch
bands does not change significantly, since the amount of precipitate does not need to
be large in order to give an appreciable signal. UV–Vis spectra taken in situ with the
same solution (see Appendix 1) do not offer evidence of the formation of a coloured
species, but it is important to bear in mind that the UV–Vis probes the bulk solution
(where the overall concentration of this new species is low) whereas ATR-FTIR only
reaches a few microns at the bottom of the cell (where the species accumulates).
The best-known hexacyanoferrate complex is Prussian Blue, which absorbs in the
region of 2070–2100 cm−1 depending on the whether the Fe3+ is hydrolysed (lower

4 GNF-COOH and ferri/ferrocyanide
146
cm−1) or not (higher cm−1) [31] and it could be envisaged to accumulate at the bottom of
the cell by precipitation, although the UV–Vis data does not offer direct evidence of
Prussian Blue. Other well-known related compounds are Prussian White (all ferrous),
which absorbs between 2080–2060 cm−1 and Prussian Yellow/Everitt’s Salt (all ferric),
absorbing near 2175 cm−1. During the reduction of [Fe(CN)6]3− to [Fe(CN)6]
4− an
adsorbed intermediate has been reported that absorbs between 2070–2080 cm−1 [32].
Similarly, an adsorbed species on Pt has been observed during potential cycling that
gives an IR band 2090–2070 cm−1 and inhibits ET, concluded to be a (unnamed)
colourless soluble (i.e. containing K+) mixed-valency compound [22]. Hence although
we have clearly detected a decomposition product formed in the presence of COOH-
terminated GNF, we cannot be absolutely certain of its identity.
4.4 Conclusion
Above, we have described how the presence of GNF influences the
[Fe(CN)6]3−/4− redox system. It was determined that it is specifically the acidic groups
around the edges of GNF that are responsible for the irreversible behaviour of the
[Fe(CN)6]3−/4− redox couple and therefore we have explored further the influence of
protons on this redox reaction. We showed that the acid groups at GNF-COOH
severely inhibit the redox reaction of [Fe(CN)6]3−/4− in acidic solution when more acid
groups are expected to be protonated; therefore, electrostatic repulsion cannot be used
to explain the effect of GNF-COOH on this redox couple.
Although the solutions used in this study at pH ≥ 4.6 would not be considered acidic
enough to cause decomposition of [Fe(CN)6]3−, the high density of COOH groups on
the GNF may lead to localised acidic conditions, promoted by the ready availability of
protons at the edges of the flakes. Thus there are several mechanisms by which the
very acidic local environment of the COOH-GNF could inhibit electron transfer,
including disruption to the ion paired activated species required for fast electron

4 GNF-COOH and ferri/ferrocyanide
147
transfer, protonation of CN ligands, ligand loss or formation of insoluble decomposition
products.
When deuterated water is substituted for H2O, the presence of GNF has much less
influence on the [Fe(CN)6]3−/4− redox reaction. Consecutive cycles in D2O saw the
voltammetric response of [Fe(CN)6]3−/4− quickly return to near reversible. IR
spectroscopic studies also showed the [Fe(CN)6]3−/4− species to be more stable in the
presence of GNF when dissolved in D2O rather than H2O.
The results described in this Chapter lead to the interpretation that the presence of
GNF in an aqueous solution of K3[Fe(CN)6] and K4[Fe(CN)6] promotes the
decomposition of [Fe(CN)6]3− and/or [Fe(CN)6]
4−. The intense new IR absorption band
that emerges after only some hours indicates the formation of a non-soluble species.
However, it was not possible to determine the identity of the decomposition product
from the experimental results and further work would be needed to identify the new
species observed in this study.

4 GNF-COOH and ferri/ferrocyanide
148
References for Chapter 4
1. Peter, L. M.; Dürr, W.; Bindra, P., et al., The Influence of Alkali Metal Cations onthe Rate of the Fe(CN)6
4−/Fe(CN)63− Electrode Process. J. Electroanal. Chem.
1976, 71 (1), 31-50.2. Beriet, C.; Pletcher, D., A Microelectrode Study of the Mechanism and Kinetics of
the Ferro/Ferricyanide Couple in Aqueous Media: The Influence of the Electrolyteand Its Concentration. J. Electroanal. Chem. 1993, 361 (1-2), 93-101.
3. Noel, M.; Anantharaman, P. N., Voltammetric Studies on a Glassy CarbonElectrode. Part II. Factors Influencing the Simple Electron-Transfer Reactions-theK3[Fe(CN)6]-K4[Fe(CN)6] System. Analyst 1985, 110 (9), 1095-1103.
4. Sohr, R.; Müller, L.; Landsberg, R., Elektrochemische Untersuchungen AmRedoxsystem Hexacyanoferrat(II)/Hexacyanoferrat(III) an Graphitelektroden. J.Electroanal. Chem. 1974, 50 (1), 55-63.
5. Sohr, R.; Müller, L., Der Einfluss Des Leitsalzes Auf Die Geschwindigkeit DesElektronenaustausches Im Redoxsystem [Fe(CN)6]
3−/[Fe(CN)6]4−. Electrochim.
Acta 1975, 20 (6), 451-455.6. Chen, P.; McCreery, R. L., Control of Electron Transfer Kinetics at Glassy Carbon
Electrodes by Specific Surface Modification. Analytical Chemistry 1996, 68 (22),3958-3965.
7. Deakin, M. R.; Stutts, K. J.; Wightman, R. M., The Effect of pH on Some Outer-Sphere Electrode Reactions at Carbon Electrodes. J. Electroanal. Chem. 1985,182 (1), 113-122.
8. Granger, M. C.; Swain, G. M., The Influence of Surface Interactions on theReversibility of Ferri/Ferrocyanide at Boron‐Doped Diamond Thin‐FilmElectrodes. J. Electrochem. Soc. 1999, 146 (12), 4551-4558.
9. Hutton, L. A.; Iacobini, J. G.; Bitziou, E., et al., Examination of the FactorsAffecting the Electrochemical Performance of Oxygen-Terminated PolycrystallineBoron-Doped Diamond Electrodes. Analytical Chemistry 2013, 85 (15), 7230-7240.
10. Yagi, I.; Notsu, H.; Kondo, T., et al., Electrochemical Selectivity for RedoxSystems at Oxygen-Terminated Diamond Electrodes. J. Electroanal. Chem.1999, 473 (1–2), 173-178.
11. Lounasvuori, M. M.; Rosillo-Lopez, M.; Salzmann, C. G., et al., The Influence ofAcidic Edge Groups on the Electrochemical Performance of GrapheneNanoflakes. J. Electroanal. Chem. 2015, 753, 28-34.
12. Granger, M. C.; Witek, M.; Xu, J., et al., Standard Electrochemical Behavior ofHigh-Quality, Boron-Doped Polycrystalline Diamond Thin-Film Electrodes.Analytical Chemistry 2000, 72 (16), 3793-3804.
13. Panzer, R. E.; Elving, P. J., Behavior of Carbon Electrodes in Aqueous andNonaqueous Systems. J. Electrochem. Soc. 1972, 119 (7), 864-874.
14. Lounasvuori, M. M.; Rosillo-Lopez, M.; Salzmann, C. G., et al., ElectrochemicalCharacterisation of Graphene Nanoflakes with Functionalised Edges. FaradayDiscussions 2014, 172 ( ), 293-310.

4 GNF-COOH and ferri/ferrocyanide
149
15. Więckowski, A.; Szklarzyk, M., The State of the Polycrystalline Platinum Electrode During the Heterogeneous Electron-Transfer Reaction: Fe(CN)6
3−+e−
Fe(CN)64−. J. Electroanal. Chem. 1982, 142 (1–2), 157-170.
16. Pons, S.; Datta, M.; McAleer, J. F., et al., Infrared Spectroelectrochemistry of theFe(CN)6
4−/Fe(CN)63− Redox System. J. Electroanal. Chem. 1984, 160 (1–2), 369-
376.17. Kawiak, J.; Kulesza, P. J.; Galus, Z., A Search for Conditions Permitting Model
Behavior of the Fe(CN)3−/4−6 System. J. Electroanal. Chem. 1987, 226 (1–2), 305-
314.18. Huang, W.; McCreery, R., Electron Transfer Kinetics of Fe(CN)6
3−4− on Laser-Activated and CN−-Modified Pt Electrodes. J. Electroanal. Chem. 1992, 326 (1–2), 1-12.
19. Domingo, P. L.; Garcia, B.; Leal, J. M., Acid–Base Behaviour of the FerrocyanideIon in Perchloric Acid Media Potentiometric and Spectrophotometric Study. Can.J. Chem. 1987, 65 (3), 583-589.
20. Domingo, P. L.; García, B.; Leal, J. M., Acid–Base Behaviour of the FerricyanideIon in Perchloric Acid Media. Spectrophotometric and Kinetic Study. Can. J.Chem. 1990, 68 (2), 228-235.
21. Yang, R.; Qian, Z.; Deng, J., Electrochemical Deposition of Prussian Blue from aSingle Ferricyanide Solution. J. Electrochem. Soc. 1998, 145 (7), 2231-2236.
22. Pharr, C. M.; Griffiths, P. R., Infrared Spectroelectrochemical Analysis ofAdsorbed Hexacyanoferrate Species Formed During Potential Cycling in theFerrocyanide/Ferricyanide Redox Couple. Analytical Chemistry 1997, 69 (22),4673-4679.
23. Karyakin, A. A., Prussian Blue and Its Analogues: Electrochemistry and AnalyticalApplications. Electroanalysis 2001, 13 (10), 813-819.
24. Lee, C.; Anson, F. C., Inhibition of the Electroreduction of Fe(CN)63− at
Microelectrodes in the Absence of Supporting Electrolyte: Mediation of theInhibited Reduction by Methyl Viologen. J. Electroanal. Chem. 1992, 323 (1–2),381-389.
25. Riley, T.; Long, F. A., Deuterium Isotope and Solvent Effects on the Kinetics ofthe Keto-Enol Interconversion of 2-Acetylcyclohexanone. J. Am. Chem. Soc.1962, 84 (4), 522-526.
26. Vinogradov, S. N.; Linnell, R. H., Hydrogen Bonding. Van Nostrand Reinhold:New York; London, 1971.
27. Némethy, G.; Scheraga, H. A., Structure of Water and Hydrophobic Bonding inProteins. IV. The Thermodynamic Properties of Liquid Deuterium Oxide. TheJournal of Chemical Physics 1964, 41 (3), 680-689.
28. de Grotthuss, C. J. T., Memoir on the Decomposition of Water and of the BodiesThat It Holds in Solution by Means of Galvanic Electricity. Biochimica etBiophysica Acta (BBA) - Bioenergetics 2006, 1757 (8), 871-875.
29. Hassanali, A.; Giberti, F.; Cuny, J., et al., Proton Transfer through the WaterGossamer. Proceedings of the National Academy of Sciences 2013, 110 (34),13723-13728.
30. Le Caër, S.; Vigneron, G.; Renault, J. P., et al., First Coupling between a LINACand FT-IR Spectroscopy: The Aqueous Ferrocyanide System. Chemical PhysicsLetters 2006, 426 (1–3), 71-76.
31. Christensen, P. A.; Hamnett, A.; Higgins, S. J., A Study of ElectrochemicallyGrown Prussian Blue Films Using Fourier-Transform Infra-Red Spectroscopy.Journal of the Chemical Society, Dalton Transactions 1990, (7), 2233-2238.
32. Kunimatsu, K.; Shigematsu, Y.; Uosaki, K., et al., Study of theFe(CN)3−
6/Fe(CN)4−6 Redox System on Pt by EMIRS: Part I. Infrared Spectra of
the Intermediates in the Charge Transfer. J. Electroanal. Chem. 1989, 262 (1–2),195-209.

150
5 Potential-Induced Dissociation of Acid
Groups
5.1 Introduction
It is well-known that the pKa of an acid depends on the local environment. An obvious
example of this are enzymes where functional groups comprising the active site often
have very different pKa values due to charge interactions, such as ion pairing with
charged groups or ions and hydrogen bonding with other functional groups or water
molecules, and different polarity of the surrounding medium, such as being buried in
hydrophobic pockets of the enzyme. The pKa of the metal-bound water molecule in the
active site of histone deacetylase (HDAC) depends on the identity of the metal centre
and shifts from 10.0 in Co(II)-HDAC to 9.1 in Zn(II)-HDAC [1]. The imidazole group of a
histidine side chain is present in the active site of several enzymes and usually
hydrogen bonds with a negatively charged carboxylate, as is the case in myoglobin,

5 Potential-induced dissociation of acid groups
151
where the pKa of the imidazole group is ca. 8 [2]. If the imidazole-carboxylate pair is
buried in a hydrophobic region, the pKa will be significantly higher, and hydrogen
bonding to an uncharged carbonyl lowers the pKa of histidine residues [1].
Due to the importance of self-assembled monolayers (SAMs) and functionalised
surfaces, the effect of surface-immobilisation on the pKa of a molecule has been
studied widely. Many different techniques have been employed, such as contact angle
titration [3], quartz crystal microbalance [4], and surface plasmon resonance
spectroscopy [5]. Sukenik’s group have used in situ infrared spectroscopy to study
siloxane-anchored carboxylic acid –terminated SAMs and reported an increase of ca. 2
units in the pKa of a surface-immobilised acid compared to that in solution (7.5
compared to 5.4) [6]. A later, more detailed analysis undertaken by the same group [7]
was able to distinguish between monomeric and oligomeric/dimeric groups in a SAM
and the pKa values were reported as 4.9 and 9.3, respectively.
In addition to interaction with the solvent and neighbouring molecules in the SAM itself,
the identity and concentration of solution species will also influence the association
constant. A Langmuir monolayer of NH2-terminated lipid at the air-water interface was
observed to have a pK strongly dependent on the ionic strength of the subphase, the
pK ranging from 5.1 to 10.5 as the ionic strength increased from 0 to 0.1 [8].
Carboxylic acid groups are present at many carbon materials, but they form only a
fraction of the functional groups, the identities of which are various and ill-defined,
especially in graphene oxide. Here we take advantage of the well-characterised nature
of the GNF, where carboxylic acid groups are the predominant oxygen-containing
moiety present and hence we are able to interrogate the behaviour of the carboxylic
acid groups in isolation.
The acid-terminated GNF were used to study the effect of applied potential on
protonation state of acid functionalities confined to an electrode surface. The GNF were

5 Potential-induced dissociation of acid groups
152
immobilised onto an electrode surface and ATR-FTIR spectroscopy was used to
monitor how the population of carboxylic acid and carboxylate groups change in
response to an applied potential.
The presence of the COOH edge groups renders the GNF highly water-soluble,
although a few monolayers physisorb sufficiently strongly to an electrode surface to
allow CV investigations to be carried out. In this study an increased coverage of the
electrode surface was required, hence the GNF were complexed by the addition of
Ca2+ cations. This results in crosslinking of the GNF, forming an insoluble, disordered,
three-dimensional structure that can be immobilised onto an electrode surface and
remains intact during electrochemical cycling. The porous nature of this Ca2+-
complexed GNF results in a large surface area and hence increases the sensitivity of
the spectroelectrochemical measurements. As not all of the edge groups are
complexed to Ca2+, a number are free to undergo protonation and deprotonation in
response to applied potential, as described in this study. The work presented in this
Chapter has been published in [9].
5.2 Experimental Methods
All aqueous solutions were prepared with doubly deionised water, taken from a Milli-Q
water purification system, with a resistivity of not less than 18.2 MΩ cm at 25 °C.
In situ spectroelectrochemical experiments were performed using a Bruker Tensor 27
spectrometer (Bruker, UK) fitted with a room temperature DLaTGS detector at 4 cm−1
resolution and a diamond crystal as the internal reflection element. The potential was
controlled with a Palmsens Emstat2 potentiostat (Palmsens, NL) running PSTrace
(v3.0) software. An electrochemical cell with a volume of 2 ml was positioned over the
ATR element. The electrodes were as detailed in Section 3.2.5.

5 Potential-induced dissociation of acid groups
153
3.3 × 10⁻³ g of dry acid-terminated GNF was used to prepare GNF-Ca precipitate.
Further details of the method can be found in Section 3.2.1. In Section 3.3.4, the
number of acidic protons was estimated to be 7 × 10⁻³ mol per gram of GNF. After
washing, the GNF-Ca precipitate was suspended in 8.3 × 10⁻⁴ l of water and 4 × 10⁻⁶ l
of the aqueous precipitate suspension was drop-coated onto the electrode in all
spectroelectrochemical experiments. The amount of GNF-Ca on the electrode is
estimated at (1.8 ± 0.4) × 10−5 g, assuming full complexation and one Ca2+ per two
carboxylate groups.
Spectroelectrochemical experiments were carried out in background electrolyte
solutions of different pH in the range 3.0 to 9.2. The solutions were prepared by mixing
different proportions of KH2PO4, K2HPO4, H3PO4, Na2SO4, H2SO4, HCl, KCl, KOH and
NaOH. The pH of the electrolyte was checked with a pH meter.
IR difference spectra were constructed by recording a background spectrum at one
potential, then switching to the second potential and recording a sample spectrum at
specific time intervals. The potentials used throughout were −0.5 V and +1.0 V. Three
full potential cycles (+1 V followed by −0.5 V) were recorded to assess the
reproducibility of the response. A single spectrum was computed by Fourier
transformation of 100 averaged interferograms for background and sample and the
software was programmed to record a spectrum every 170 seconds. One potential step
was 720 seconds in duration, during which time four sample spectra and one
background spectrum were recorded. After the initial sample spectrum, the subsequent
three spectra were consistently of similar intensity, indicating that the changes upon
polarisation stabilised after about three minutes and remained stable for at least
another 10. These three spectra from each potential step were processed using the
atmospheric compensation function of OPUS software and averaged.
The GNF-Ca modified electrode was located above the diamond internal reflectance
element prism of an ATR-FTIR spectrometer as shown in Figure 5.1. The thickness of

5 Potential-induced dissociation of acid groups
154
the GNF-Ca layer was not determined but the insertion of the electrode into the
electrochemical cell resulted in a fairly rapid swelling of the layer as water penetrated
the pores, resulting in good contact of the GNF-Ca with the internal reflection element
(see Section 5.6).
Figure 5.1 Experimental setup in in situ spectroelectrochemical experiments. Adapted from [9]
5.2.1 Construction of Calibration Curves
For the sulphate calibration curve, 2 ml of aqueous K2SO4 at different concentrations
was placed in the electrochemical cell positioned over the internal reflection element.
IR spectra were recorded with the clean ATR element as background. For the
carboxylate group calibration curve, acetic acid solutions of different concentrations
were prepared and the pH was adjusted with potassium hydroxide to deprotonate all
acid groups. A background of the clean ATR prism was collected and 1 μl of each
solution was then pipetted onto the prism and allowed to dry before recording a sample
spectrum. The sulphate bands and carboxylate stretches were fitted with Gaussian
peak shapes and the peak areas were plotted against either the molarity of the solution
or the number of moles in each sample. Each measurement was repeated three times
and the results were plotted with error bars representing one standard deviation. The
data points were fitted with a linear equation, the intercept of which was fixed to zero to

5 Potential-induced dissociation of acid groups
155
ensure physically meaningful estimations of small numbers of moles from the
calibration curve.
5.3 Estimating the Distance between the Electrode Surface
and the ATR Internal Reflection Element
In the experimental setup, the working electrode surface is located close above the
ATR prism, trapping a small amount of solution. The setup can therefore be considered
as a thin-layer cell and the special conditions of diffusion can be exploited in estimating
the distance between the electrode surface and the internal reflection element [10].
When the thickness of solution is less than about 50 µm, diffusion can homogenise the
solution continuously so that concentration gradients do not exist. Provided that the
potential scan rates are slow enough to maintain a homogeneous solution, mass
transfer effects can be ignored. Theoretical cyclic voltammetric responses in a thin-
layer cell will therefore show identical peak potentials for the forward and reverse
scans, and peak currents that depend linearly on the scan rate. The peak current is
= ∗/4 (5.1)
where n is the number of electrons transferred, F the Faraday constant, ν the scan
rate, V the volume of the thin layer, ∗ the initial concentration of species O, R the gas
constant and T the temperature. Ferrocenemethanol (FcMeOH) was chosen as the
redox probe as it is well known to undergo a reversible, one-electron, outer-sphere
redox reaction. The volume of the thin-layer cell is modelled as a cylinder with
dimensions A × h, where A is the area of the BDD with radius 1.5 mm and h is the
distance to be determined. To eliminate height differences resulting from the ATR
prism not being exactly flush with the base plate, a glass cover slip (diameter 15 mm)
was placed at the bottom of the cell. From six CVs, with scan rates between 5 and 17
mV s−1, the volume was calculated to be (122 ± 4) × 10−9 l, giving h ca. 17 µm. The

5 Potential-induced dissociation of acid groups
156
GNF-Ca layer thickness is assumed to be equal to h (for evidence see Section 5.6).
The peak currents for oxidation and reduction at each scan rate are listed in Table 5.1
along with the thin layer cell volumes calculated from Equation (5.1) and the
corresponding distance h between the IRE and the electrode surface.
Figure 5.2 Cyclic voltammograms of 1.13 × 10⁻³
M FcMeOH in 0.1 M NaCl in IR setup. (a)Black line: BDD positioned 5 mm above ATR prism. Red line: BDD positioned against ATRprism, creating thin-layer conditions. Scan rate 5 mV s
−1. (b) CVs recorded in the thin-layer
geometry with scan rates 5, 8 10, 12, 14 and 17 mV s−1
. Reproduced from [9].

5 Potential-induced dissociation of acid groups
157
Table 5.1: Scan rates, peak currents for forward and backward scans, calculated volumes ofthe thin-layer cell and distance h between electrode and IRE. Adapted from [9].
ν / mV s−1 ip / μA V / 10−9 l h / μm
5 0.65 120 17.0
5 −0.67 123 17.4
8 1.06 123 17.4
8 −1.08 125 17.7
10 1.33 123 17.4
10 −1.37 127 17.9
12 1.58 122 17.2
12 −1.64 126 17.9
14 1.73 114 16.2
14 −1.77 117 16.5
17 2.15 117 16.6
17 −2.18 119 16.8
5.4 Penetration Depth of IR Evanescent Wave
In the attenuated total reflection mode, the infrared beam is incident at a crystal made
of a material with a high refractive index such as diamond. The sample is placed in
contact with the crystal on the other side of the infrared beam. At angles above the so-
called critical angle, total reflection of the light occurs, and an evanescent wave forms
that extends into the sample. The penetration depth is the distance where the
amplitude of the electric field falls to 1/e of its value at the surface and is given by
=
2 ( sin −
) / (5.2)
where λ is wavelength, θ is the angle of incidence of the IR beam and n1 and n2 are the
refractive indices of the crystal and the sample, respectively. The volume of the
evanescent wave can be used to compare sample absorbance in ATR mode to that in
transmission mode and hence gain quantitative information about the sample [11]. This
volume, known as the effective penetration, de, is unique for parallel and perpendicular
polarisation and they are given by:

5 Potential-induced dissociation of acid groups
158
=
( −
)⋅
sin −
(5.3)
∥ = cos
( −
)⋅
2 sin −
( −
) sin − ⋅
sin −
(5.4)
de for an unpolarised beam is given by
= + ∥
2(5.5)
Taking diamond as the crystal, pure water as the sample and θ = 45°, values of dp and
de were calculated at different wavenumbers and listed in Table 5.2.
Table 5.2: Penetration depth dp and the effective penetration de calculated at differentwavenumbers. Values of n1 were found in ref [12] and values of n2 in ref [13]. Reproduced from
[9].
n1 n2 / cm−1 dp / μm de / µm
2.38 1.22 1000 1.37 2.03
2.38 1.33 1400 1.10 1.91
2.38 1.33 1670 0.92 1.59
2.38 1.33 2000 0.77 1.34
2.38 1.35 2500 0.63 1.13
2.38 1.43 3000 0.60 1.20
The penetration depths were calculated above using pure water as the sample. The
refractive index of water will depend on the amount of dissolved ions and n2 will
therefore be slightly different for an electrolyte solution. Berlind’s group have measured
the effect of ion concentration on refractive indices of fluids [14] at wavelengths in the
range 0.93-5.93 eV, and their results can be used to estimate the change in dp at
wavelengths relevant to this study. They found that at 0.93 eV (7500 cm−1) n changed
by 0.01 units for every 1 M change in ion concentration, which translates to a maximum
increase in dp of 2% when the ionic strength changes from 0 to 1 M. Similar estimates
can be made based on data reported in [15] and [16].

5 Potential-induced dissociation of acid groups
159
5.5 Proposed Mechanism for Potential-Induced
Deprotonation of Acid Edge Groups
Figure 5.3 Difference spectra of BDD modified with GNF-Ca in 0.1 M NaCl electrolyte at pH 7.Initial application of +1 V, background spectrum recorded without applied potential (light blue);spectrum after subsequent application of −0.5 V (black); spectrum after subsequent applicationof +1 V (red). Arrows on top spectrum indicate direction of spectral features relative to baseline
as a guide to the eye. Reproduced from [9].
Using the in situ ATR-FTIR cell shown in Figure 5.1, the effect of applied potential on
the acid GNF-Ca edge groups was investigated in 0.1 M NaCl electrolyte at pH 7. A
positive potential of 1.0 V was first applied and changes to the IR spectrum relative to a
background spectrum measured, as shown by the difference spectrum in Figure 5.3
(light blue). The background was a spectrum of the modified electrode equilibrated in
the same electrolyte for 50 min with no applied potential. It can be seen that the initial
application of positive potential results in very weak features in the spectrum, indicating
that only a small change is taking place in the setup. The spectrum recorded at 1.0 V
acted as the background for the subsequent spectrum recorded with applied potential

5 Potential-induced dissociation of acid groups
160
of −0.5 V (Figure 5.3, black). The spectrum now shows decreases in absorbance
(losses) of peaks at 1760 cm−1 and 1635 cm−1 attributed to weakly hydrogen-bonded
monomeric C=O of the carboxylic acid and a water bending mode respectively.
Increases in absorbance (gains) are observed at 1580 cm−1, 1430 cm−1 and 1340 cm−1
attributed to carboxylate stretches. We attribute the changes to deprotonation of
carboxylic acid functionalities on application of a negative potential. Subsequent
application of 1.0 V (with the −0.5 V spectrum acting as the background) gave a mirror-
image response (Figure 5.3, red) with gains of C=O and water modes and losses in
carboxylates.
This set of spectra show that the initial application of a positive potential does not result
in much change in the protonation state of the GNF-Ca edge groups and that
application of −0.5 V is required to induce the first deprotonation step.
Previous studies of the protonation state of carboxylic acid groups as a function of
applied potential can be divided into two categories: those who observe (as we do) that
a negative potential results in deprotonation [17-20] and studies who observe the
opposite, that protonation takes place at negative potentials [21-25]. The latter studies
describe an electric-field mechanism, where the acid head-groups are within close
enough proximity to the electrode surface to respond to changes to the electrode
potential and the negative applied potential drives protonation. This was explained by
the relationship between pKa(app) and surface potential φ given in Equation (5.6):
pKa(app) = pKa −
. (5.6)
Equation (5.6) therefore predicts that when a negative electrode potential is applied (φ
is negative), a positive shift in pKa(app) will take place. This will result in protonation of
any deprotonated acids.

5 Potential-induced dissociation of acid groups
161
As the opposite trend is observed here, another mechanism must be operational in this
case. We rationalise our observations using a mechanism that considers deprotonation
to be driven by electrolyte ion migration [17-20]. In NaCl electrolyte at negative applied
potential Na+ ions will migrate towards the electrode, while Cl− ions will be repelled.
While the pKa of the GNF-COOH groups is defined by the position of equilibrium in
Equation (5.7), it has been shown that the apparent pKa, pKa(app), of an acid in an
electrolyte solution is additionally dependent on the local activity of cations (aM+) and
the equilibrium constant (Kas) for cation association with the deprotonated acid shown
in Equation (5.7) [17].
GNF-COOH + H2O GNF-COO− + H3O+ (5.7)
GNF-COO− + M+ GNF-COO−M+ (5.8)
Hence the observed pKa(app) is given by Equation (5.9)2:
pKa(app) = pKa + pKas − log(aM+) (5.9)
where Kas is the equilibrium constant for the association between conjugate base and
solution cations, M+, and aM+ is the cation activity. Thus when a negative electrode
potential is applied, the local Na+ activity increases, resulting in a negative shift in
pKa(app) of the acid. pKa(app) can then be substituted into Equation (3.3):
pH = pKa(app) + log10[ ]
[ ] (5.10)
If pKa(app) is lowered sufficiently relative to the pH of the solution, then deprotonation
of the acid groups will take place, as is observe here. pH titration studies described in
Section 3.3.4 showed that between pH 3 and pH 8 the GNF acid groups are found in a
range of protonation states with no single defined pKa. Therefore, as the experiments in
2 For derivation of Equation (5.9) see Appendix 2.
.

5 Potential-induced dissociation of acid groups
162
0.1 M NaCl are within this intermediate pH range (pH 7), a small perturbation in a
could result in a sufficiently negative shift in pKa(app) of some of the acid groups to
induce deprotonation, as indicated by the spectral changes in Figure 5.3. Figure 5.4
illustrates the proposed mechanism graphically.
Figure 5.4 Potential-induced changes in cation activity in the electrode-electrolyte interfacialregion drive protonation and deprotonation of acidic surface groups.
The reason for different reported behaviour of electrode-immobilised acids seems to be
related to the distance between the acid groups and the underlying electrode. Acids
located closer to the electrode (e.g. on short chain SAMs) are under a greater influence
of the electric field and therefore respond as predicted by Equation (5.6). A mixture of
behaviours is reported for longer chain SAMs and more disordered systems. The acids
respond either to the change in surface potential of the electrode, or to the change in
cation activity (as we describe) depending on how closely they are bound to the
electrode and on the local environment. For example, acid groups buried within
hydrophobic alkyl chains of SAMs respond to the electrode field, while acids further
from the electrode and in contact with solution are more likely to respond to changes in
solution conditions than changes to surface potential.

5 Potential-induced dissociation of acid groups
163
5.6 Evidence of Electrolyte Ion Migration
To test the above hypothesis and gain evidence of electric field driven ion migration,
experiments were repeated using Na2SO4 and K2SO4 electrolytes. The sulphate anion
is strongly IR active, thus allowing us to monitor both the protonation/deprotonation of
the surface acid groups and the sulphate anion concentration at the
electrode/electrolyte interface simultaneously.
IR spectra were first recorded during equilibration of the modified electrode in a
sulphate electrolyte. This is shown in Figure 5.5 where the black line represents the IR
spectrum of the modified electrode in 0.1 M K2SO4 immediately after insertion, the red
line after 5 minutes’ equilibration and blue line after 35 minutes’ equilibration. The
absorbance bands arising from the carboxylate are seen at 1575 cm−1 (νas(COO−)) and
1420 and 1350 cm−1 (νs(COO−)), and the ν(C=O) of the protonated carboxylic acid is
clearly visible at 1720 cm−1. The increase in the intensity of these bands suggests that
the GNF layer is swelling as water penetrates the structure, resulting in good contact of
the GNF with the IRE as mentioned in Section 5.2. The water bending mode at 1640
cm−1 increases with time, indicating an interaction between water molecules and GNF-
Ca. A small SO42− absorbance band at 1100 cm−1 suggests that the sulphate
concentration is slightly higher at the surface than in the bulk solution. Because the
absorption band appears at the same wavenumber as the solution species and does
not split into several bands, it can be concluded that there is no change in the
symmetry of the anion and the hydration shell of SO42− is retained.

5 Potential-induced dissociation of acid groups
164
Figure 5.5 GNF-Ca modified electrode immersed in 2 ml of 0.1 M K2SO4 electrolyte inspectroelectrochemical setup after 0 minutes (black line), 5 minutes (red line) and 35 minutes
(blue line). Background: electrolyte only. Reproduced from [9].
This supports the hypothesis that application of electrode potential induces electrolyte
ion migration and hence changes in anion concentration are seen in the interfacial
region above the ATR crystal. Although the Na+ cation is IR inactive, it can be assumed
that it also migrates in response to the electrode field in the opposite direction to the
sulphate and hence local changes in the cation activity could lead to deprotonation as
described above.
Difference spectra were also recorded relative to electrode equilibrated for 50 min
without applied potential. The background spectrum was collected before any
application of potential, and all subsequent spectra were recorded relative to that
background. The potential step duration was kept at 720 seconds and four sample
spectra were recorded during the initial 600 seconds in order to keep all other
experimental parameters as similar as possible to all other experiments reported.

5 Potential-induced dissociation of acid groups
165
Figure 5.6 Difference spectra of BDD modified with GNF-Ca in 0.1 M Na2SO4 pH 7.Background recorded at the beginning of experiment before the application of potential.Potentials: +1 V (light blue); −0.5 V (black); +1 V (red); −0.5 V (blue); +1 V (orange). The
sulphate band at 1100 cm−1
is highlighted in green. Reproduced from [9].
The initial application of +1 V (Figure 5.6, light blue) causes only a small increase in
the sulphate band compared to the equilibrium absorbance, whereas applications of
−0.5 V (black, blue) result in a large negative-going band, indicating a loss of SO42−
from the electrode surface at negative potentials. Further applications of +1 V (red,
orange) cause the sulphate band region to return to zero absorbance relative to the
background.

5 Potential-induced dissociation of acid groups
166
Figure 5.6 shows that a measureable change in the local activity of the electrolyte ions
takes place in response to the electric field at the electrode. This supports the
hypothesis that application of electrode potential induces electrolyte ion migration and
hence changes in anion concentration are seen in the interfacial region above the ATR
crystal.
It is evident from Figure 5.6 that only −0.5 V and not +1.0 V results in a change in the
sulphate band. It was determined from Figure 5.3 that a negative potential was
necessary for deprotonation of acid groups to occur and that the initial spectrum
recorded at +1.0 V was nearly featureless. The experimental results presented in
Figure 5.6 and Figure 5.3 can be rationalised by considering the increase in
concentration of sulphate at the electrode surface compared to bulk solution during
equilibration as shown in Figure 5.5. Because the concentration of SO42− is already
higher than in the bulk solution prior to applying a potential, a positive potential of +1 V
forces the anions to migrate against a concentration gradient and hence only a minor
increase is observed (Figure 5.6, light blue). When a negative potential is applied,
SO42− ions are repelled away from the electrode towards a region of lower
concentration, resulting in a large negative sulphate band in the IR difference spectrum
(Figure 5.6, black).
Similarly, we can assume that cations have been depleted from the electrode surface
during equilibration, so upon application of a positive potential the cations migrate
against a concentration gradient, resulting in little change in concentration at the
electrode and therefore only a small number of carboxylate groups can be observed to
undergo protonation as seen in Figure 5.3 (light blue). Upon application of a negative
potential, a larger change in the cation concentration occurs that in turn leads to a
larger number of carboxylic acids to deprotonate.

5 Potential-induced dissociation of acid groups
167
Figure 5.7 Difference spectra in different concentrations of supporting electrolyte Na2SO4 at pH7. BDD modified with GNF-Ca in 0.1 M: application of −0.5 V (black); application of +1 V (red).
BDD modified with GNF-Ca in 1×10⁻³
M: application of −0.5 V (orange); application of +1 V (blue). A background spectrum was collected at each potential immediately prior to switching
the applied potential. Reproduced from [9].
It was then hypothesised that lowering the concentration of the supporting electrolyte,
the activity change would be smaller and consequently the protonation of carboxylate
groups would be suppressed. The experiment was therefore repeated in different
concentrations of Na2SO4 electrolyte, and the results are presented in Figure 5.7.
In 0.1 M Na2SO4 (black and red) identical spectral changes to those seen in NaCl were
observed on application of potential: negative potential resulted in increase in
carboxylate and decrease in C=O (deprotonation) and positive potential resulted in
decrease in carboxylate and increase in C=O (protonation). The feature at 1100 cm−1
arises from νas(SO42−) of the solution-phase sulphate anion and can be seen to
decrease when a negative potential is applied.

5 Potential-induced dissociation of acid groups
168
When the concentration of Na2SO4 was lowered to 1×10⁻³ M, the potential-induced
changes in the sulphate band become too small to detect, as shown in the orange and
blue curves in Figure 5.7. Some protonation/deprotonation of the GNF-Ca acid groups
is still observed; however, the spectral response is significantly less intense than
observed in 0.1 M electrolyte. As was shown in Section 5.4, some of the intensity
decrease can be attributed to a change in solution reflective index at lower ionic
strength; however it is unlikely that a decrease in IR penetration depth of less than 2%
would lead to the extent of signal suppression seen in Figure 5.7. The ionic strength
dependence of the spectral response therefore supports the hypothesis that the
deprotonation is driven by changes to the local cation activity on the application of
potential. As described by Equation (5.9), for deprotonation to be observed, the local
activity of M+ must increase enough to lower pKa(app) of acid groups enough to drive
proton loss at the pH of the solution [18]. At lower electrolyte concentration, only a
small local increase in cation activity can occur; so fewer acid groups will have their
pKa(app) lowered enough to induce dissociation. Therefore, the spectral features
observed in 1×10⁻³ M Na2SO4 (orange and blue curves) are considerably weaker than
in 0.1 M Na2SO4 (black and red curves), as fewer acid groups have a sufficiently low
pKa to deprotonate under these conditions.
5.7 Quantifying Changes in Ion Activity
In the previous Section, we showed that electric field driven changes in the sulphate IR
band allows the indirect monitoring of cation activity at the electrode. In order to
quantify the cation activity, the same indirect approach is adopted. Peak areas of
sulphate bands in the difference spectra are determined by peak fitting and the activity
change of SO42− at the electrode surface is found using a calibration curve. The activity
change of the monovalent cation is then estimated from stoichiometry as 2×∆aSO .

5 Potential-induced dissociation of acid groups
169
Figure 5.8 (a) Infrared spectra of aqueous solutions of K2SO4 at different concentrations. ThepH of all solutions was ca. 7. Inset: Magnification of the SO4
2−absorption bands. (b) Peak fit of
the sulphate absorption band from 0.075 M K2SO4 spectrum. (c) Peak areas from Fig 1.1plotted against concentration of K2SO4 and a linear fit of data points. Error bars represent one
standard deviation. Reproduced from [9].

5 Potential-induced dissociation of acid groups
170
Figure 5.8(a) shows IR spectra of different concentrations of aqueous K2SO4 and the
inset shows the sulphate absorption band at 1100 cm−1. In Figure 5.8(b) the peak
fitting is illustrated for 0.075 M solution. The peak areas were then plotted against
concentration and the data points were fitted with a linear regression line (Figure
5.8(c)). The intercept was fixed to zero to ensure physically meaningful estimations of
small numbers of moles from the calibration curve.
Difference spectra recorded at equilibrated state and under potential control in 0.1 M
K2SO4 electrolyte (pH 7) were fitted with Gaussian peaks and the linear fit equation
was used to calculate the change in sulphate ion concentration at the electrode from
the sulphate peak area. From Figure 5.5 the activity increase at the electrode surface
at equilibrated state was found to be 7.6 × 10⁻³ M and from three different experiments
it was determined that ∆aSO4 changes by (3.5 ± 0.4) × 10−3 M when the potential is
changed from +1 V to −0.5 V. ∆aM+ was therefore estimated to be 1.53 × 10⁻² M at
equilibrated state and (7.0 ± 0.6) × 10−3 M on application of −0.5 V. Table 5.3 lists the
peak areas and corresponding activity changes.
Table 5.3: Peak areas from difference spectra obtained at different potentials and the calculatedactivity change in sulphate ion at the electrode surface. Reproduced from [9].
E / V Conditions Peak area ∆aSO4 / M ∆aM+ / M
Equilibration 0.1 M K2SO4 with O2 0.090 0.0076 0.0153
1 0.1 M K2SO4 with O2 0.041 0.0035 0.0069
−0.5 0.1 M K2SO4 with O2 −0.041 0.0035 0.0069
1 0.1 M K2SO4 with O2 0.046 0.0039 0.0078
−0.5 0.1 M K2SO4 with O2 −0.043 0.0036 0.0073
1 0.1 M K2SO4 no O2 0.034 0.0029 0.0058
−0.5 0.1 M K2SO4 no O2 −0.044 0.0037 0.0074
As was discussed in Section 5.5, the initial application of +1 V leads to very weak
changes in the IR spectra. The reason behind this observation was presented in
Section 5.6, where it was shown that a preconcentration of sulphate occurs at the

5 Potential-induced dissociation of acid groups
171
electrode surface during equilibration. We have successfully quantified that
preconcentration and found it to be larger than the subsequent electric field driven
migratory loss of sulphate on application of −0.5 V. Our calculations are therefore
consistent with our observation that the initial application of a positive potential does
not induce large changes in IR bands arising from the protonation of carboxylates.
5.8 Ruling Out pH Change at Interface
Seeing protonation and deprotonation of the acid groups suggests that there might be
a pH change occurring at the interface that drives the acid association. Especially at
negative potential there are several reactions that can lead to an increase in the pH,
such as oxygen reduction and hydrogen evolution. Experiments were therefore
conducted to investigate the possibility of such reactions.
Cyclic voltammetry was performed in oxygenated and deoxygenated background
electrolyte as shown in Figure 5.9(a), and IR difference spectra under potential control
were recorded in the same electrolyte conditions (Figure 5.10). The presence of
oxygen leads to a small increase in cathodic current attributed to oxygen reduction at
the modified electrode compared to deoxygenated solution Figure 5.9. However, the
effect of deoxygenating the electrolyte has no significant impact on the difference
spectra recorded while applying potentials (Figure 5.10). This suggests that a pH
change at the electrode surface due to oxygen reduction can be discounted as the
cause of the spectral features.
We observed in Figure 5.7 that the spectral changes were almost completely
suppressed when the background electrolyte concentration was lowered while the pH
was held constant. Significant changes in the protonation state of the acid groups are
seen when the electrolyte concentration is 0.1 M, but as the concentration is lowered to
10−3 M, the changes become barely detectable. Figure 5.9(b) shows cyclic
voltammetry in the same background electrolyte concentrations 0.1 M and 10−3 M. CV

5 Potential-induced dissociation of acid groups
172
response in these different ionic strength solutions is within variation of repeated
experiments under the same conditions, indicating that additional redox chemistry that
could result in pH change (O2, H+ or water reduction) does not proceed at a
significantly different rate at lower ionic strength. As the spectral response (Figure 5.7)
is very different in lower ionic strength solution, we can conclude that ion activity rather
than pH change or redox chemistry must be responsible for the observed changes.
Figure 5.9 (a) Cyclic voltammograms in 0.1 M PBS at pH 7 with and without oxygen present insolution. Clean BDD with O2 (black); BDD modified with GNF-Ca with O2 (blue); BDD modifiedwith GNF-Ca without O2 (red). (b) Cyclic voltammograms in different ionic strength solutions.
BDD modified with GNF-Ca in 1 × 10⁻³
M PBS at pH 7 (red); in 0.1 M PBS at pH 7 (blue).Reproduced from [9].

5 Potential-induced dissociation of acid groups
173
Figure 5.10 Difference spectra of BDD modified with GNF-Ca in 0.1 M K2SO4 pH 3.5.Application of −0.5 V (black); application of +1 V (red). Difference spectra under same
conditions but electrolyte deoxygenated with argon for 20 minutes. Application of −0.5 V (blue); application of +1 V (orange). Reproduced from [9].
5.9 Investigating the Effect of Electrolyte Cation
Different supporting electrolytes were also compared to see whether the identity of the
cation would have an effect on the potential-dependent acid ionisation. Difference
spectra recorded in both 0.1 M Na2SO4 and 0.1 M K2SO4 at pH 7 (Figure 5.11) show
that both K+ and Na+ cause nearly identical changes to the protonation state of the
electrode-immobilised acid groups. The sulphate bands are of equal size, suggesting
that the local increase in cation activity is very similar for both K+ and Na+.

5 Potential-induced dissociation of acid groups
174
Figure 5.11 Difference spectra of BDD modified with GNF-Ca in 0.1 M K2SO4 pH 7; applicationof −0.5 V (black); subsequent application of +1 V (red). Difference spectra of BDD modified with GNF-Ca in 0.1 M Na2SO4 pH 6.8; application of −0.5 V (blue); subsequent application of +1 V
(orange). Reproduced from [9].
Experiments were then repeated in an electrolyte solution of 0.1 M CaCl2 at pH 3.5
(Figure 5.12, blue and orange), where the presence of Ca2+ results in essentially
featureless difference spectra at both positive and negative potential. Ca2+ in excess
will bind strongly to any previously non-complexed carboxylate groups in the GNF-Ca
structure and hence suppresses the reversible potential-dependent protonation
observed in NaCl electrolyte. This suggests that the spectral changes observed in NaCl
must be attributed to protonation and deprotonation of non-complexed edge groups
within the GNF-Ca assembly. This assignment is supported by the observation that the
electrode-immobilised precipitate appears intact at the end of the experiment, so it is
clear most of the interlinking Ca2+ complexation in unaffected by the application of
potential. As GNF becomes water-soluble when not complexed, the precipitate would

5 Potential-induced dissociation of acid groups
175
not be present at the end of the experiment if application of potential removed the
bound Ca2+.
Figure 5.12 Difference spectra of BDD modified with GNF-Ca in 0.1 M NaCl electrolyte at pH3.5. Application of −0.5 V (black); subsequent application of +1 V (red).Difference spectra of BDD modified with GNF-Ca in 0.1 M CaCl2 pH 3.5. Application of −0.5 V (blue); subsequent
application of +1 V (orange).
5.10 Estimating the Number of Acid Groups Undergoing
Potential-Induced Changes
The amount of GNF-Ca on the electrode surface is estimated to be 1.8 × 10⁻⁵ g and
the number of COOH groups 7 × 10⁻³ mol per gram of GNF. From this we can estimate
the total number of both protonated and deprotonated COOH groups present on the
electrode as 1.8 × 10−5 g × 7 × 10−3 mol g−1 = 1.26 × 10⁻⁷ mol, and XPS measurements
have allowed us to quantify the fraction of carboxylate groups in GNF-Ca that remain

5 Potential-induced dissociation of acid groups
176
non-complexed and therefore available to contribute to the potential-dependent
spectral features. It is likely that only a fraction of the non-complexed acid groups will
undergo deprotonation due to the modest potential applied in this study. To estimate
the number of non-complexed COO−/COOH groups at the electrode surface
undergoing potential-induced changes, the peak areas in potential difference spectra
were compared with those of a simple carboxylic acid (acetic acid). Because the acid
groups are bound to the surface, a calibration curve of an aqueous acid at different
concentrations was deemed inapplicable and hence a calibration curve was
constructed using varying amounts of a dried deprotonated acetic acid (acetate)
deposited on the ATR prism to mimic a surface layer. A representative peak fit is
shown in Figure 5.13(a) and the resulting calibration curves in Figure 5.13(b)-(c) for
the asymmetric and symmetric stretches, respectively.
Because the number of groups undergoing changes is estimated based on peak areas
in IR spectra, the result is dependent on the distance to the IRE. The dry potassium
acetate film is very thin (thinner than the penetration depth calculated in Section 5.4)
and it can therefore be assumed that the signal represents the total sample amount.
However, when IR spectra are recorded of the thick GNF-Ca layer at the electrode
surface, the signal isn’t a straightforward reflection of the total number of acidic groups
due to the exponential decay of the evanescent wave’s electric field.
We can estimate the number of groups dissociating under applied potential by
adjusting the peak areas in the difference spectra by the ratio of the effective
penetration depth, de (Section 5.4), and the thickness of the GNF-Ca film, h, which is
taken to be 17 µm as calculated in Section 5.3 [11]. The adjusted peak areas were
then compared to the calibration curve to estimate the number of carboxylate groups
lost and gained due to potential-induced protonation and deprotonation.

5 Potential-induced dissociation of acid groups
177
Figure 5.13 (a) Peak fit of drop-coated potassium acetate film containing 5.38 × 10⁻⁹
moles ofacetate groups. Experimental data (black), baseline (green), peak fits (red), cumulative peak fit
(blue). (b) Asymmetric stretch peak areas at 1565 cm−1
plotted against number of acetategroups and a linear fit of data points. (c) Symmetric stretch peak areas at 1415 cm
−1plotted
against number of acetate groups and a linear fit of data points. Error bars represent onestandard deviation. Reproduced from [9].

5 Potential-induced dissociation of acid groups
178
Figure 5.14 shows an example of peak fitted difference spectrum in 0.1 M K2SO4 pH 7.
Peaks used in estimating the number of carboxylate groups were the asymmetric peak
at 1570 cm−1 and the symmetric peak at 1430 cm−1, and spectra from three separate
experiments in 0.1 M K2SO4 pH 7 were evaluated, both with and without oxygen
present in solution. The average areas found from the difference spectra were 0.034
and 0.023 for the asymmetric and symmetric peaks, respectively. These were adjusted
by the ratio de/h, at each wavelength, giving adjusted peak areas of 0.241 and 0.215
for the asymmetric and symmetric peaks, respectively.
From the adjusted peak areas, the number of carboxylate groups changing protonation
state has been evaluated as (4 ± 2) × 10−8 mol using the linear regression lines in
Figure 5.13(b)–(c). The peak areas are listed in Table 5.4.
Figure 5.14 Peak fitted difference spectrum in 0.1 M K2SO4 pH 7 when applying −0.5 V to GNF-Ca modified BDD. Experimental data (black), baseline (green), peak fits (red), cumulative peak
fit (blue). Reproduced from [9].

5 Potential-induced dissociation of acid groups
179
Table 5.4: Carboxylate asymmetric and symmetric stretch peak areas from difference spectraobtained at different potentials. Reproduced from [9].
E / V Conditions νas(COO−) peak area νs(COO−) peak area
1 0.1 M K2SO4 with O2 0.0326 0.0202
−0.5 0.1 M K2SO4 with O2 −0.0453 −0.0261
1 0.1 M K2SO4 with O2 0.00965 0.00882
−0.5 0.1 M K2SO4 with O2 −0.0231 −0.0149
1 0.1 M K2SO4 no O2 0.0582 0.0443
−0.5 0.1 M K2SO4 no O2 −0.0987 −0.0568
Using Equation (5.9) and the modified Henderson-Hasselbalch equation (Equation
(5.10), we can calculate what percentage of the total number of GNF-COOH groups
this value of (1.5 ± 0.6) × 10−9 mol corresponds to. In our estimate of pKa(app) we
assume that the pKa of carboxylic acid groups is 3 and that the pKas of COOK is 0.5.
These values are estimates but the actual values do not affect the relative resulting
pKa(app) in switching to −0.5 V. As for the calculations in Section 5.7, it was assumed
that aM+ changes from 0.2 M at equilibrium to 0.207 M when a negative potential is
applied. Although Equation (5.10) applies to concentrations (or activities) rather than
numbers of molecules we will still use it as an estimate of the ratio of deprotonated to
protonated groups. Using these values, the change in the number of COO− at −0.5 V
compared to equilibrium is found to be +3.5%. Table 5.5 lists the values used in the
calculation.
Table 5.5: Values used to calculate change in the number of carboxylate groups at theelectrode surface when a potential is applied. Reproduced from [9].
E / V aM+pKa(app) =
pKa + pKas − log(aM+) [COO−]/[COOH] =10(pH pKa(app))
Equilibrium 0.2 4.20 399
−0.5 0.207 4.18 413
This calculated 3.5% increase in [COO−] at −0.5 V corresponds to (1.5 ± 0.6) × 10−9
mol of carboxylate, as determined from IR peak area. Because this number represents

5 Potential-induced dissociation of acid groups
180
3.5% of non-complexed groups and the total number of COO−/COOH groups is
estimated to be 1.26 × 10⁻⁷ mol, (35 ± 13)% of all COO−/COOH groups remain non-
complexed. Clearly the error associated with this value is very large and cannot be
used to draw definitive conclusions about the degree of association of the acid groups.
In comparison, the percentage of carboxylic acid groups remaining non-complexed was
also calculated from XPS measurements in Section 3.3.2 and found to be (24 ± 6)%.
Considering that the spectroelectrochemical method included many steps of
calculations with a great number of assumptions and large uncertainties unavoidably
associated with many of the variables, the value is in reasonable agreement with the
value obtained by XPS measurements.
5.11 Predicting Potential-Dependent Changes in Solution
Species
Although this study was initially concerned with the surface-bound carboxylic acids of
the GNF electrode layer, electric field driven changes were observed in solution
species too. As demonstrated in Section 5.7, we were able to quantify changes in ion
activity as a consequence of applied potential. The quantification was performed from
experimental data at pH 7 where no protonation of sulphate was expected. The
intensity and shape of the sulphate bands in IR difference spectra changed when the
solution pH was lowered to 3.5. This led us to consider the pKa of the solution species
as a factor in the appearance of potential-dependent IR features as well as the
electrostatic migration of ions. Calculations were performed to predict the extent of
change in solution speciation coupled with activity change and the results were
compared with experimental difference spectra.

5 Potential-induced dissociation of acid groups
181
5.11.1 Sulphate
IR spectroscopy of sulphate in aqueous solution has been carried out by Hug [26], who
lists the expected absorption frequencies of SO42− and HSO4
− species. Aqueous SO42−
is tetragonal with an IR inactive νs(S–O) at 980 cm−1 and triply degenerate IR active
νas(S–O) at around 1100 cm−1. Protonation to HSO4− lowers the symmetry of the anion,
causing the symmetric stretch to become IR active around 900 cm−1. At the same time
the asymmetric stretch splits into two bands at around 1050 and 1200 cm−1. Hence IR
spectroscopy is an excellent technique to observe protonation of SO42− in situ.
The spectral response of the sulphate bands at different pH is compared in Figure
5.15. At pH 7, an intense sulphate band is seen corresponding to loss of SO42− from
the electrode surface at negative potential (pink line). On application of +1 V, the loss
seen at negative potential is reversed and the concentration of SO42− is restored to
equilibrium values (light blue). When the solution pH is lowered to 3.5, the sulphate
band shows the same trend in response to applied potential as at pH 7, although the
absorbance changes are much weaker and broader (blue, orange lines). At pH 3
(black, red lines) spectral changes for both GNF acid groups and solution sulphate are
much lower in intensity. For the acid groups this is unsurprising, as only a small
number of the most acidic groups can undergo deprotonation at this pH as very few
have a pKa of 3 or below.
Spectral changes in the sulphate region can be rationalised by considering predicted
trends in interfacial activities of solution species in response to changes in aM+ at the
electrode. Sulphuric acid is diprotic and undergoes two dissociations as shown in
Equations (5.11)-(5.12):

5 Potential-induced dissociation of acid groups
182
H2SO4 + H2O HSO4− + H3O
+, pKa1 < 0(5.11)
HSO4− + H2O SO4
2− + H3O+, pKa2 = 1.92
(5.12)
pKa1 in Equation (5.11) is so low that HSO4− cannot be protonated by any realistic
increase in aK+ . We will therefore limit our calculations to the dissociation shown in
Equation (5.12).
Figure 5.15 IR difference spectra of the GNF-Ca modified electrode interface in: 0.1 M pH 7K2SO4, −0.5 V (pink), +1.0 V (light blue); 0.1 M pH 3.5 K2SO4, −0.5 V (blue), +1.0 V (orange);
0.1 M pH 3 K2SO4, −0.5 V (black), +1.0 V (red). Reproduced from [9].

5 Potential-induced dissociation of acid groups
183
Table 5.6: Predicted changes in activity of HSO4−
and SO42−
on application of −0.5 V calculated from Equation (5.9). Reproduced from [9].
pH E / V aK+ / MpKa(app)HSO4
−ΔaHSO4
/
10−3 M
ΔaSO4 /
10−3 M
7 − 0.200 2.62 0 0
7 −0.5 0.207 2.60 0 0
3.5 − 0.198 2.62 0 0
3.5 −0.5 0.205 2.61 −0.35 +0.35
3 − 0.192 2.64 0 0
3 −0.5 0.199 2.62 −0.75 +0.75
Using the value for ΔaK+ of 7 × 10⁻³ M at −0.5 V, determined in section 5.7, Equation
(5.9) can be used to calculate pKa(app) for HSO4− with no applied potential and at −0.5
V. Changes in sulphate and HSO4− activity (approximating to concentration), resulting
from the change in pKa(app), have been calculated at different pH using the modified
Henderson-Hasselbalch equation (Equation (5.10)). The predicted changes are
presented in Table 5.6, and detailed calculations can be found in Appendix 3.
At pH 7, SO42− activity is unperturbed by any change in pKa(app), hence the spectral
changes to the sulphate band result only from migration of the anion away from the
electrode at −0.5 V. At pH 3.5, as the solution pH is closer to pKa(app) values,
deprotonation of 0.4 × 10⁻³ M of HSO4− is predicted at −0.5 V. Upon deprotonation of
HSO4−, a decrease in intensity is predicted over the spectral range spanning ca. 1200
to 900 cm−1; however, this will be concomitant with an increase in intensity centred at
1100 cm−1 as the sulphate activity is increased. Overall spectral changes in the
sulphate region are therefore predicted to be very weak at pH 3.5, due to this
cancelling effect, and broader than at pH 7 due to the contribution from HSO4− which
exhibits bands over a wider wavenumber range than SO42−. This analysis broadly fits
with experimental results (Figure 5.15, blue), where a weaker and broader band is
observed in the sulphate region compared to pH 7 (Figure 5.15, pink). An overall loss
in intensity is still observed, as the above analysis ignores the electrostatic migration of

5 Potential-induced dissociation of acid groups
184
both anionic species away from the electrode. This results in a larger observed loss in
spectral intensity for both species than predicted. The apparently smaller migratory loss
of sulphate compared to pH 7 can be explained by rapid replenishment of any expelled
SO42− by deprotonation of HSO4
− as equilibrium is restored.
The effect of the shift in pKa(app) for HSO4− at −0.5 V is expected to be even more
pronounced at pH 3, where the gain in SO42− and loss of HSO4
− is predicted to be
greater (Table 5.6). However, the experimental results show almost non-existent
spectral bands in the sulphate region (Figure 5.15, black), although a small gain of
sulphate can be observed at 1100 cm−1 along with small losses of HSO4− at 1050 and
1200 cm−1. Again, we must also consider the electrostatic migration of anionic species
away from the electrode as well as deprotonation of HSO4−. Overall, compared to pH 7
and 3.5, the greater gain in SO42− by deprotonation of HSO4
− predicted by calculations
is evident in the experimental spectra, as at higher pH the sulphate νas(S–O) decreases
at −0.5 V but at pH 3 we can see it increasing at negative potential (Figure 5.15,
black).
5.11.2 Phosphate
The analysis that was carried out with sulphate was also used to predict spectral
changes in 0.1 M phosphate solutions at −0.5 V. Phosphoric acid has three
dissociation constants as shown in Equations (5.13)-(5.15):
H3PO40 + H2O H2PO4
− + H3O+, pKa1 = 2.15 (5.13)
H2PO4− + H2O HPO4
2− + H3O+, pKa2 = 7.2 (5.14)
HPO42− + H2O PO4
3−, pKa3 = 12.6(5.15)
Both pKa1 and pKa2 values are in the range where we can expect to observe
deprotonation under our experimental conditions.

5 Potential-induced dissociation of acid groups
185
The number and intensity of infrared absorption bands associated with each species
depends on the symmetry of the ion. Aqueous HPO42− presents an IR active νs(P–O) at
ca. 850 cm−1 and the νas(P–O) vibration is split into two bands at 1080 cm−1 and 990
cm−1. Protonation to H2PO4− reduces the symmetry of the anion and leads to further
splitting of νas(P–O) into three bands located at around 1160, 1075 and 940 cm−1, with
νs(P–O) appearing at ca. 870 cm−1. The fully protonated H3PO40 species shows two
νas(P–O) bands at 1180 and 1005 cm−1 together with νs(P–O) vibration present at 890
cm−1. IR spectra of phosphate solutions at different pH are presented by Tejedor-
Tejedor and Anderson [27] and Arai and Sparks [28].
The effect of potential on both GNF acid groups and solution phosphate species was
studied at pH 3, 7 and 9. The experimental spectra obtained under these conditions are
shown in Figure 5.16. At pH 3, losses are observed at 1005 and 1180 cm−1 on
application of −0.5 V (black line) and these are assigned to νas(P–O) and ν(P=O),
respectively, of H3PO40. Concurrently, gains corresponding to H2PO4
− species are seen
at 940 and 1155 cm−1 arising from the νas(P–O) vibrations and 1077 cm−1 arising from
νs(P–O). At pH 9 and −0.5 V, the stretching modes of H2PO4− decrease while gains are
seen at 1078 and 990 cm−1 that are assigned to νas(P–O) and νs(P–O), respectively, of
HPO42−. The spectral response at pH 7 is very similar to that obtained at pH 9.

5 Potential-induced dissociation of acid groups
186
Figure 5.16 Difference spectra of BDD modified with GNF-Ca in 0.1 M KH2PO4/K2HPO4
electrolytes of different pH: pH 3 at +1 V (red) and −0.5 V (black); pH 7 at +1 V (orange) and−0.5 V (blue); pH 9 at +1 V (light blue) and −0 5 V (pink). Reproduced from [9].
Table 5.7: Changes in activity of H3PO4, H2PO4−
and HPO42−
on application of −0.5 V calculated from Equation (5.9). Reproduced from [9].
pH aK+ / M E / V pKa(app)ΔaH3PO4
/ 10−3 M
ΔaH2PO4
/ 10−3 M
ΔaHPO4
/ 10−3 M
3 0.080 − 3.22 0 0 0
3 0.087 −0.5 3.18 −2.0 +2.0 0
7 0.139 − 8.07 0 0 0
7 0.146 −0.5 8.05 0 −0.36 +0.36
9 0.200 − 7.91 0 0 0
9 0.207 −0.5 7.89 0 −0.23 +0.23
Table 5.7 shows the calculated changes in activities for H3PO4, H2PO4− and HPO4
2− at
pH 3, 7 and 9. Detailed calculations can be found in Appendix 4. At pH 3, our
calculations predict that 2 × 10⁻³ M of phosphoric acid deprotonates to form H2PO4− at
−0.5 V. We therefore expect to see significant losses in spectral intensity for H3PO4
species at 1172, 1005 and 889 cm−1, with gains at 1159, 1077, 940 and 875 cm−1 for

5 Potential-induced dissociation of acid groups
187
H2PO4−. This is broadly observed in the experimental spectrum (Figure 5.16, black),
although as some gain bands are in similar positions to losses, they cancel each other
out. However, a particularly strong absorption loss is seen at 1005 cm−1 for H3PO4,
along with a gain at 1077 cm−1 for H2PO4− as predicted. At both pH 7 and 9, H2PO4
− is
predicted to undergo deprotonation to give HPO42−. Experimentally, at pH 7 and 9 clear
gains are observed at 1078 and 990 cm−1 corresponding to increased HPO42−. The
apparent splitting of the 1078 cm−1 band is due to simultaneous decrease in
absorbance at 1077 cm−1, which along with losses at 940 and 1155 cm−1 indicates
concomitant loss of H2PO4−, exactly as predicted.
The consequential generation of excess protons in this process explains why the
intensity changes for the carbonyl and carboxylate bands in phosphate electrolyte are
anomalously weak at pH 7. The acid edge groups of the GNF span a range of pKa
values from 3 to 8, and in pH 7 solution a decrease in the pKa(app) should lead to
deprotonation of a substantial number of these, as observed in chloride and sulphate
electrolytes. However, in phosphate the local concentration of protons is much higher
than in KCl and K2SO4 under the same conditions, due to the simultaneous potential-
induced deprotonation of H2PO4−. Hence the GNF acid dissociation equilibrium will
strongly favour the protonated species under these conditions and the reversible
deprotonation is subsequently suppressed with resulting low intensity changes in
absorbance observed.
Figure 5.16 illustrates the effect of solution pH on the spectral features arising from the
GNF acid groups with applied negative potential. At pH 3.5 (Figure 5.16, blue and
orange) the trend of deprotonation at negative potential and protonation at positive
potential is the same as that found at pH 7, as shown in Figure 5.3. Similar spectral
changes are observed over a wide pH range from 3.5 to ca. 8; however, the ratio of the
carbonyl bands to the carboxylate bands is pH-dependent, as is the spectral intensity.
Different spectral behaviour is observed below pH 3.5 and above pH 8. At pH 9.2

5 Potential-induced dissociation of acid groups
188
(Figure 5.16, light blue and pink) the spectral features corresponding to carboxylic acid
and carboxylates are very weak, although the trend is the same as observed at lower
pH. At pH 3 (black and red) the carboxylate bands at ca. 1585, 1420 and 1360 cm−1
are weaker than observed at pH 3.5 and above, while the carbonyl band at ca. 1750
cm−1 is of similar intensity. Although there is still a loss of the carbonyl band at 1750
cm−1 on applying a negative potential, instead of a large increase in the carboxylate
features it is instead accompanied with a gain in absorption at 1720 cm−1.
The pH dependence of the response can be understood by considering the pKa of the
GNF edge groups. In Section 3.3.4 we found that these acid groups to undergo
protonation over a wide range of pH from 3.5 to 8, indicating a range of pKa values due
to the different local environments of the COOH functionalities. The spectral data
therefore confirms that over this pH range the GNF readily undergoes deprotonation on
application of a negative potential, as the increase in cation activity under these
conditions lowers the apparent pKa of the acid functionalities enough to induce
detectable loss of protons. At pH 9.2 very little deprotonation is observed, as the
majority of the acid groups have a pKa of < 8 and are therefore already deprotonated
before the potential is applied. Likewise, at pH 3 little deprotonation of the acid groups
is seen on application of negative potential, in this case because the pKa of the COOH
groups is > 3 so deprotonation is thermodynamically disfavoured. However, there is a
very clear shift in the wavenumber for the C=O stretch of the acid groups on application
of negative potential. There is a loss of absorbance at 1750 cm−1 assigned to
monomeric weakly hydrogen bonded carbonyl and a gain at 1720 cm−1, at a
wavenumber consistent with increased hydrogen-bonding to the C=O moiety.
5.12 Conclusion
In this Chapter we have shown, using in situ IR spectroelectrochemistry, that a
negative electrode potential results in deprotonation of electrode-immobilised

5 Potential-induced dissociation of acid groups
189
carboxylic acid GNF edge groups. We also observe deprotonation of solution H3PO4,
H2PO4− and HSO4
− close to the electrode on application of −0.5 V. We attribute both
findings to a decrease in the apparent pKa of the acids in response to a local increase
in cation activity at the electrode at negative potential. This observation implies that
speciation of acids near a biased electrode surface can differ significantly from that in
bulk solution and this can be driven purely by cation migration in the absence of
adsorption, redox chemistry or pH change. Although pKa shifts for electrode-adsorbed
species have been reported previously, here we show these cannot entirely be
attributed to thermodynamic effects of surface immobilisation, as they are also
observed for solution electrolyte ions.
The change in ion activity at the surface of the electrode was shown for the IR active,
negatively charged SO42−. Although monoatomic cations such as K+ and Na+ are IR
inactive and therefore cannot be observed in the difference spectra, it can be assumed
that positively charged particles migrate in the electric field in the opposite direction to
the negatively charged SO42−.
It was shown in Section 3.3.4 that the COOH edge groups of non-complexed GNF
exhibit a wide range of pKa values. Despite all of the edge groups being chemically
identical, they occupy a range of different sites and their high density means that pKa is
strongly influenced by neighbouring groups. In spectroelectrochemical experiments at
solution pH values ranging from 3.5 to 8, significant deprotonation of GNF acid groups
can be observed, consistent with pKa values of the GNF acid edge groups determined
from titration studies.
For solution-phase species with well-defined pKa values, changes in interfacial
speciation on application of negative potential could be predicted. This result supports
the proposed mechanism and shows that deprotonation in the interfacial region is
driven by the lowering of effective pKa by the increased cation activity.

5 Potential-induced dissociation of acid groups
190
Increases and decreases in the water bending mode at 1635 cm−1 are observed in all
difference spectra, but currently it is unclear what induces these changes. Potential-
induced change in the hydrogen-bonding environment of the carbonyl group is also
apparent under various experimental conditions. The mechanism is currently unknown
but may be related to the ion concentration or the applied electric field at the electrode.
These aspects of the work require further investigation.

5 Potential-induced dissociation of acid groups
191
References for Chapter 5
1. Gantt, S. M. L.; Decroos, C.; Lee, M. S., et al., General Base–General AcidCatalysis in Human Histone Deacetylase 8. Biochemistry 2016, 55 (5), 820-832.
2. Bradbury, J. H.; Carver, J. A., Conformational Differences between VariousMyoglobin Ligated States as Monitored by Proton NMR Spectroscopy.Biochemistry 1984, 23 (21), 4905-4913.
3. Wasserman, S. R.; Tao, Y. T.; Whitesides, G. M., Structure and Reactivity ofAlkylsiloxane Monolayers Formed by Reaction of Alkyltrichlorosilanes on SiliconSubstrates. Langmuir 1989, 5 (4), 1074-1087.
4. Wang, J.; Frostman, L. M.; Ward, M. D., Self-Assembled Thiol Monolayers withCarboxylic Acid Functionality: Measuring pH-Dependent Phase Transitions withthe Quartz Crystal Microbalance. The Journal of Physical Chemistry 1992, 96(13), 5224-5228.
5. Fears, K. P.; Creager, S. E.; Latour, R. A., Determination of the Surface pK ofCarboxylic- and Amine-Terminated Alkanethiols Using Surface PlasmonResonance Spectroscopy. Langmuir 2008, 24 (3), 837-843.
6. Cheng, S. S.; Scherson, D. A.; Sukenik, C. N., In Situ Attenuated TotalReflectance Fourier Transform Infrared Spectroscopy Study of Carboxylate-Bearing, Siloxane-Anchored, Self-Assembled Monolayers: A Study ofCarboxylate Reactivity and Acid-Base Properties. Langmuir 1995, 11 (4), 1190-1195.
7. Gershevitz, O.; Sukenik, C. N., In Situ FTIR-ATR Analysis and Titration ofCarboxylic Acid-Terminated SAMs. J. Am. Chem. Soc. 2004, 126 (2), 482-483.
8. Ariga, K.; Nakanishi, T.; Hill, J. P., et al., Tunable pK of Amino Acid Residues atthe Air−Water Interface Gives an L-Zyme (Langmuir Enzyme). J. Am. Chem.Soc. 2005, 127 (34), 12074-12080.
9. Lounasvuori, M. M.; Holt, K. B., Acid Deprotonation Driven by Cation Migration atBiased Graphene Nanoflake Electrodes. Chem. Commun. 2017.
10. Faulkner, L. R., Electrochemical Characterization of Chemical Systems. InPhysical Methods in Modern Chemical Analysis, Kuwana, T., Ed. AcademicPress: New York, 1983; Vol. 3, pp 137-248.
11. Pike Technologies, Depth of Penetration and Effective Penetration in ATRSampling. http://www.azom.com/materials-video-details.aspx?VidID=2545(accessed 14th October 2016).
12. Phillip, H. R.; Taft, E. A., Kramers-Kronig Analysis of Reflectance Data forDiamond. Physical Review 1964, 136 (5A), A1445-A1448.
13. Hale, G. M.; Querry, M. R., Optical Constants of Water in the 200-nm to 200-μm Wavelength Region. Appl. Opt. 1973, 12 (3), 555-563.
14. Berlind, T.; Pribil, G. K.; Thompson, D., et al., Effects of Ion Concentration onRefractive Indices of Fluids Measured by the Minimum Deviation Technique.physica status solidi (c) 2008, 5 (5), 1249-1252.
15. Shippy, B. A.; Burrows, G. H., The Determination of Potassium and Sodium asChlorides through Use of the Refractometer. J. Am. Chem. Soc. 1918, 40 (1),185-187.

5 Potential-induced dissociation of acid groups
192
16. West, C. J.; Hull, C., International Critical Tables of Numerical Data, Physics,Chemistry and Technology, 1933. 1st electronic ed.; Knovel: Norwich, NY, 2003.
17. Sugihara, K.; Shimazu, K.; Uosaki, K., Electrode Potential Effect on the SurfacepKa of a Self-Assembled 15-Mercaptohexadecanoic Acid Monolayer on aGold/Quartz Crystal Microbalance Electrode. Langmuir 2000, 16 (18), 7101-7105.
18. Futamata, M., Characterization of the First Layer and Second Layer Adsorbateson Au Electrodes Using ATR-IR Spectroscopy. J. Electroanal. Chem. 2003, 550–551, 93-103.
19. Goutev, N.; Futamata, M., Attenuated Total Reflection Surface-EnhancedInfrared Absorption Spectroscopy of Carboxyl Terminated Self-AssembledMonolayers on Gold. Appl. Spectrosc. 2003, 57 (5), 506-513.
20. Luque, A. M.; Cuesta, A.; Calvente, J. J., et al., Potentiostatic Infrared Titration of11-Mercaptoundecanoic Acid Monolayers. Electrochem. Commun. 2014, 45, 13-16.
21. White, H. S.; Peterson, J. D.; Cui, Q., et al., Voltammetric Measurement ofInterfacial Acid/Base Reactions. The Journal of Physical Chemistry B 1998, 102(16), 2930-2934.
22. Burgess, I.; Seivewright, B.; Lennox, R. B., Electric Field DrivenProtonation/Deprotonation of Self-Assembled Monolayers of Acid-TerminatedThiols. Langmuir 2006, 22 (9), 4420-4428.
23. Rosendahl, S. M.; Burgess, I. J., Electrochemical and Infrared SpectroscopyStudies of 4-Mercaptobenzoic Acid SAMs on Gold Surfaces. Electrochim. Acta2008, 53 (23), 6759-6767.
24. Ma, C.; Harris, J. M., Surface-Enhanced Raman Spectroscopy Investigation ofthe Potential-Dependent Acid−Base Chemistry of Silver-Immobilized 2-Mercaptobenzoic Acid. Langmuir 2011, 27 (7), 3527-3533.
25. Luque, A. M.; Mulder, W. H.; Calvente, J. J., et al., Proton Transfer Voltammetryat Electrodes Modified with Acid Thiol Monolayers. Analytical Chemistry 2012, 84(13), 5778-5786.
26. Hug, S. J., In Situ Fourier Transform Infrared Measurements of SulfateAdsorption on Hematite in Aqueous Solutions. J. Colloid Interface Sci. 1997, 188(2), 415-422.
27. Tejedor-Tejedor, M. I.; Anderson, M. A., The Protonation of Phosphate on theSurface of Goethite as Studied by CIR-FTIR and Electrophoretic Mobility.Langmuir 1990, 6 (3), 602-611.
28. Arai, Y.; Sparks, D. L., ATR–FTIR Spectroscopic Investigation on PhosphateAdsorption Mechanisms at the Ferrihydrite–Water Interface. J. Colloid InterfaceSci. 2001, 241 (2), 317-326.

193
6 Immobilisation of GNF on Electrode Surface
6.1 Introduction
In Chapters 3–5 GNF were immobilised on BDD electrodes by drop-coating from an
aqueous suspension. This method, widely used in research to achieve electrode
modification and surface immobilisation, is quick and facile but offers little control over
the order and orientation of the immobilised layer. Additionally, when acid-terminated
GNF are used, the high solubility of the flakes in water means that most of the drop-
coated material is removed in the rinsing step. Therefore we estimate that only a few
monolayers remain on the electrode, although it has not been possible to ascertain the
degree of coverage. It is unlikely that drop-coating results in an ordered layer uniformly
covering the area onto which the drop is deposited. Rather, the GNF are randomly
oriented in a disordered layer on the electrode surface, leaving areas of the underlying
electrode uncovered.
GNF-Ca was also drop-coated onto the electrode surface from an aqueous
suspension. The insoluble nature of the GNF complexed with divalent cations means

6 Immobilisation of GNF on Electrode Surface
194
that a thicker layer of immobilised material was achieved on the electrode surface
compared to non-complexed GNF-COOH and GNF-amide.
In this Chapter, we explore two different ways of immobilising GNF onto a surface. The
first method is direct attachment of GNF decorated with thiol groups (GNF-thiol) onto a
gold substrate. STM is employed to image the surfaces after modification. For STM
imaging it was desirable to deposit isolated GNF on the substrate. In order to achieve a
good separation of GNF and to reduce the probability of GNF stacking, either very
dilute solutions were drop-coated onto the substrate or more concentrated suspensions
were spin-coated to achieve a sub-monolayer coverage.
The second approach utilises a small thiol linker molecule that forms a SAM on a gold
substrate and to which GNF can then be attached. Amide bond formation by
carboxylate groups and amines is a widely used reaction that is catalysed by
carbodiimides. We have GNF terminated with carboxylic functionalities (GNF-COOH)
that can be reacted with amine-terminated cysteamine SAMs to graft GNFs onto the
surface. We also have GNF-amide with –(C=O)NH(CH2)2NH2 moieties that can react
with carboxylic acid end groups in a cysteine SAM. Both routes were explored in an
attempt to immobilise GNF onto the substrate via covalent attachment. Similar
methodology has been reported previously by Rahman [1], who attached carbon
nanotubes decorated with carboxylic acid groups onto a 1-aminoundecanethiol SAM on
gold.
A ferrocene derivative is used as an electrochemically active tag to confirm successful
modification of the surface by CV and DPV. GNFs are tagged with ferrocene
derivatives by two different methods: (a) Amine-terminated GNF are reacted with
ferrocene carboxaldehyde via the formation of an imine, which is subsequently reduced
to a secondary amine bond. The result is a covalent bond between GNF and ferrocene.
(b) Deprotonated GNF-COOH and ferrocene carboxylic acid are incubated with CaCl2,

6 Immobilisation of GNF on Electrode Surface
195
resulting in an electrostatic interaction. Scheme 6.1 and Scheme 6.2 depict the
molecular structures of the target materials.
Scheme 6.1 (a) Cystamine dihydrochloride; (b) cysteamine SAM formed by cystamine on gold;(c) GNF-COOH attached onto cysteamine SAM on gold; ((d) ferrocene carboxylic acid attached
onto Au-cysteamine-GNF-COOH.

6 Immobilisation of GNF on Electrode Surface
196
Scheme 6.2 (a) Cysteine molecule; (b) cysteine SAM on gold; (c) GNF-amide attached ontocysteine SAM on gold; (d) ferrocene carboxaldehyde attached onto Au-cysteine-GNF-amide.
XPS analysis is carried out on the surfaces to assess the outcome of the attachment.
Survey spectra are acquired to determine the elements present in the sample, and
high-resolution spectra are then acquired of the relevant regions. The N1s region can
be used to ascertain the presence of nitrogen in the samples and will therefore confirm,
alongside a peak in the S2p region, the successful formation of a self-assembled

6 Immobilisation of GNF on Electrode Surface
197
monolayer. The C1s region will be used to compare the different sample preparations
and the number of components in each peak fit is determined by our knowledge of the
sample composition. In cysteamine SAM (Scheme 6.1(b)), carbon exists in two distinct
chemical environments, –C–C–N and –C–C–S, with very similar C1s binding energies
and therefore they will be fitted with one peak. When GNF-COOH is attached to the
SAM as shown in Scheme 6.1(c) three new carbons in different chemical environments
are introduced: sp2-hybridised carbon, N–C=O and –C–COOH. In cysteine SAM
(Scheme 6.2(b)) we find carbon in three different environments: –C–C–N, –C–C–S and
–C–COOH. The first two will again be fitted with one peak. Upon attachment of GNF-
amide (Scheme 6.2(c)) sp2-hybridised carbon and N–C=O are introduced. The peak
ratios are also expected to change when GNF are grafted onto the surface as the
number of –C–C–N bonds increases and the number of –C–COOH decreases. The
exact ratios will depend on several factors: the number of GNF particles successfully
attached; the size of the particles; the number of edge groups present in a single
particle; and the number of bonds formed per particle. Relevant C1s photoelectron
binding energies are listed in Table 6.1.
Table 6.1: XPS binding energies of some carbon species.
Bonding type BE / eV References
sp2 284.3-284.8 [2-4]
sp3 284.4-285.2 [4-6]
C–S, C–C–N 286.1-286.6 [7-9]
N–C=O 287.8-288.2 [7, 9, 10]
COOH 288.3-289.9 [8, 11, 12]
The high-resolution N1s region can in some cases aid in determining sample
composition. However, although XPS spectra of GNF-amide ([13], supporting
information) shows two distinct peak components for nitrogen corresponding to amine
and amide, some reports have found amine and amide functionalities at such similar
binding energies that they can’t be resolved [7, 14]. Generally both amine and amide

6 Immobilisation of GNF on Electrode Surface
198
peaks have binding energies in the range of 399.5 to 400.5 eV ([15] and references
therein).
6.1.1 Thiol-Functionalised GNF
GNF functionalised with a thiol group have been synthesised from GNF-COOH [13]
that can be directly attached onto a gold surface utilising the strong gold–sulphur bond.
A cartoon of GNF-thiol is presented in Scheme 6.3. The basal plane is significantly
larger than depicted here.
Scheme 6.3 Schematic depiction of edge-thiolated GNF. The image is not to scale; thearomatic region at the core of the flakes is significantly larger than is depicted here.
Infrared spectroscopy of GNF-thiol (Figure 6.1) shows an amide band at ca. 1660
cm−1; N-H stretches at 3350 and 3450 cm−1 arising from the amine and amide
functionalities; and C-H stretches at 2850 and 2920 cm−1. These bands show that the
majority of COOH groups have been converted to amides in the reaction with ethylene
diamine, but some acid groups remain as evidenced by a small feature at 1715 cm−1.

6 Immobilisation of GNF on Electrode Surface
199
Figure 6.1 Infrared spectrum of GNF-thiol.
Liu et al. have reported immobilisation of single-walled carbon nanotubes (SWCNTs)
onto Au(111) [16] via adsorption through thiol functionalities located at the open ends
of the CNTs. Atomic force microscopy (AFM) imaging showed needle-like protrusions
compatible with carbon nanotubes on the substrate and the density of the features
increased with prolonged adsorption times. The substrates were stable to
ultrasonication, strongly indicating chemisorption had taken place. By this method
ordered, perpendicularly oriented CNT structures were achieved.
A similar approach was adopted by Minati et a. [17] who studied the chemisorption of
thiol-functionalised multi-walled CNTs (MWCNTs) on gold. They commented on the
issue of CNT aggregation in suspension that impeded the growth of an order SAM on
the gold substrate. The dimensions of the CNTs were established by AFM as 40–160
nm (length) and 40–80 nm (diameter). The length dimension was found to be shorter
than expected and it was hypothesised that shorter CNTs are preferentially adsorbed.
In this work, STM will be used to image GNF-thiol chemisorbed onto Au(111)
substrates. GNF can bond with the Au surface atoms through one or more thiol groups
and thus the orientation can range from vertical to horizontal. If the flakes bond through
several thiol groups located around the edge and arrange horizontally on the substrate,

6 Immobilisation of GNF on Electrode Surface
200
we would expect the height of features in STM images to be close to the theoretical
thickness of the sp2-hybridised carbon network of 0.34 nm [18]. Although most STM
studies focus on pristine graphene grown directly on the substrate [19-21], Huang et al.
have reported STM images of nanographene platelets deposited onto HOPG of 0.4 nm
thickness [22]. If the GNF only form one bond with the substrate and arrange vertically,
STM images would show a height in the region of 30 nm.
6.1.2 Electrochemistry of Ferrocene Derivatives
Ferrocene is a commonly used redox probe in non-aqueous systems. It is a neutral
molecule consisting of an iron centre in the 2+ oxidation state sandwiched between two
cyclopentadienyl ligands. Ferrocene undergoes a reversible one-electron oxidation to
form the positively charged ferrocenium ion. Due to its reversibility and low oxidation
potential, ferrocene is used as a standard in electrochemistry as Fc+/Fc = 0.64 V vs.
SHE. Electron-withdrawing substitutes, such as carboxylic acid and aldehyde, on the
cyclopentadienyl rings shift E0′ for the couple in the positive direction.
Ferrocene carboxaldehyde (FcCHO) is sparingly water-soluble and has therefore been
mostly studied in non-aqueous systems. Abeed’s group have reported reversible ET
kinetics for FcCHO in DMSO and acetonitrile, with half-wave potential 0.75 V vs.
Ag/AgCl [23]. Sharp et al. modified a Pt electrode with amine groups and anchored
FcCHO molecules onto the surface [24]. The modified electrode exhibited reversible
kinetics typical of surface-bound redox species.
Ferrocene carboxylic acid (FcCOOH) is more water-soluble than ferrocene and has
been studied in aqueous systems. McCormack et al. [25] reported Ep values for the
deprotonated form in pH 9.2 PBS as 0.39 and 0.29 V vs. Ag/AgCl for oxidation and
reduction, respectively. Raoof’s group [26] constructed a FcCOOH-modified carbon
paste electrode that presented redox peaks at 0.38 and 0.27 V vs. Ag/AgCl in pH 7
PBS.

6 Immobilisation of GNF on Electrode Surface
201
6.2 Experimental Methods
All aqueous solutions were prepared with doubly deionised water, taken from a Milli-Q
water purification system, with a resistivity of not less than 18.2 MΩ cm at 25 °C.
6.2.1 Substrate Preparation
To study the self-assembled monolayers with XPS, fluorine-doped tin oxide (FTO)
glass (Sigma-Aldrich, US) was used as the substrate. The glass was cut into 7×7 mm
squares, cleaned with a mild detergent and then rinsed thoroughly with deionised water
and ethanol. After cleaning, Au was deposited onto the substrate with a sputter coater
(Emscope UK). For the deposition, argon pressure was 0.1 Torr, deposition current 40
mA and coating time 90 seconds.
In order to characterise the SAMs electrochemically, they were deposited onto
commercial Au electrodes (BASi, US) according to the protocol described by Long et
al. [27] with some modifications to the method. The electrodes were first polished using
successively finer grades of alumina suspension down to 0.05 μm, rinsed thoroughly
with ultrapure water after each step and dried using an ambient air flow. After
mechanical polishing, electrochemical cleaning step was performed in 0.5 M H2SO4 by
first holding the electrode at 2 V for 5 seconds and then switching to −0.32 V for 10
seconds. Then, 20 CV scans were run in 0.5 M H2SO4 between −0.26 V and 1.55 V at
scan rate 4 V s−1. In a fresh electrolyte solution, another 4 scans were run in the same
potential range at scan rate 0.1 V s−1. The electrodes were rinsed thoroughly with water
and ethanol.
For STM studies, an atomically smooth substrate was needed. For this purpose,
evaporated Au on Mica (Georg Albert PVD, Germany) was used. To further improve
the flatness of the gold surface, flame annealing was performed by placing the

6 Immobilisation of GNF on Electrode Surface
202
substrate onto a quartz plate and systematically sweeping back and forth with a
propane flame for ca. 1 minute.
6.2.2 SAM Deposition
Three different types of SAM were deposited: two different thiols, ʟ-cysteine and
cystamine, were purchased from Sigma-Aldrich and used as received. Solution
concentrations of 5 × 10⁻³ M (ʟ-cysteine) and 2.5 × 10⁻³ M (cystamine) in degassed
ethanol and deposition times of ca. 20 hours were employed. GNF-thiol were dispersed
in water and deposited onto flame annealed Au substrates by either drop-coating or
spin-coating. The drop-coating technique involved placing 15 µl of GNF-thiol solution
onto the substrate for ca. 1 hour and then rinsing the substrate thoroughly with copious
amounts of deionised water. Spin-coating was performed with a Laurell Technologies
WS-650 spin-coater (US) from suspensions of concentrations varying from 8 to 124 μg
ml−1. The suspension was dispensed using a glass pipette in droplets of ca. 1 ml. The
solution concentration, rotating speed and number of drops were varied in search of
optimal deposition conditions.
6.2.3 Attaching GNF onto SAM
The reaction between a carboxylic acid and an amine to form an amide was exploited
to covalently attach GNF onto a SAM. The reaction is catalysed by carbodiimides [28,
29] and coupling efficiency can be enhanced by using N-hydroxysulfosuccinimide
(sulfo-NHS) [30]. The reaction mechanism is depicted in Scheme 6.4.
The general procedure was adapted from [31]. To activate the GNF acid groups, 0.4
mg of 1-ethyl-3-[3-dimethylaminopropyl]carbodiimide (EDC, Sigma-Aldrich, US) and
1.1 mg sulfo-NHS (Santa Cruz Biotechnology, US) were added to 1 ml of 0.1 mg ml−1
GNF-COOH, mixed well and left to react for 15 minutes. The cystamine-modified
electrode was then immersed in the activated GNF-COOH solution for at least two

6 Immobilisation of GNF on Electrode Surface
203
hours, after which the electrode was removed from solution and rinsed thoroughly.
Alternatively, to modify the cysteine acid end groups, the cysteine-modified electrode
was immersed in 1 ml of 0.01 M pH 6 PBS containing EDC and sulfo-NHS for 15
minutes. The activated electrode was then removed and immersed in a suspension of
GNF-amide in H2O or GNF-amide-FcCHO in ethanol for two hours before rinsing
thoroughly.
Scheme 6.4 Reaction scheme illustrating activation of carboxylate with EDC and formation ofreaction intermediate after addition of sulfo-NHS. Adapted from [32].

6 Immobilisation of GNF on Electrode Surface
204
6.2.4 Labelling GNFs with Ferrocene Derivatives
To label GNF-amide with ferrocene carboxaldehyde (FcCHO), GNF-amide were
suspended in 10 × 10−3 M pH 7 PBS at an approximate concentration of 100 μg ml−1,
and the pH was adjusted to ca. 9.3 with 5 weight% K2CO3 solution. In a separate vial,
0.0185 g ferrocene carboxaldehyde (FcCHO) was dissolved in 0.5 ml
dimethylformamide (DMF). The FcCHO solution was added to the GNF suspension
and incubated for 30 minutes. 0.0011 g sodium borohydride (NaBH4) was then added
and the solution incubated for a further 10 minutes, after which the pH was adjusted to
7.3 by adding 0.1 M HCl. The precipitate was centrifuged, washed 4 times and re-
suspended in 500 μl ethanol.
To label GNF-COOH with ferrocene carboxylic acid (FcCOOH), 10 × 10−3 M FcCOOH
was prepared and the acid groups were deprotonated with dilute KOH. 20 μl of dilute
KOH solution (pH 9) was pipetted onto the modified electrode surface to deprotonate
all GNF-COOH. 30 μl of FcCOO− was then added and the solutions were allowed to
mix for 5 minutes before adding 30 μl of 0.02 M CaCl2. The electrode was incubated for
approximately 7 hours and then rinsed thoroughly.
6.2.5 X-ray Photoelectron Spectroscopy
XPS was carried out on a Thermo Scientific K-Alpha spectrometer equipped with a
monochromated Al Kα (hv = 1486.6 eV) X-ray source. All survey scans were scanned 3
times with a resolution of 1 eV, 400 μm spot size and 50 ms dwell time. All elemental
regions were scanned 10 times with a resolution of 0.1 eV, 400 μm spot size and 50
ms dwell time. Elemental composition ratios were calculated from survey spectra using
the element library function and the deconvolution of peaks was conducted using the
quantification function in CasaXPS software. For background subtraction a Shirley
background was used. The C1s region is best fitted with GL(30) line shape due to the
wide natural line widths of the peaks [33]. The full width at half maximum (FWHM) of

6 Immobilisation of GNF on Electrode Surface
205
the main C–C peak was constrained to between 1 and 1.6 eV and all other peaks were
constrained to have the same shape and FWHM as the main C–C peak. All peaks
were then optimised using a Gaussian-Lorentzian sum function and an iterative least-
squares optimisation algorithm.
6.2.6 Scanning Tunnelling Microscopy
STM imaging was carried out using an Agilent 5500 scanning probe microscope
(Agilent Technologies, US) in constant current mode. Lengths of platinum-iridium wire
(Goodfellow, UK) were used as the probe and manually cut at one end to make sharp
tips. The bias voltage and tunnelling current were varied to achieve the best possible
resolution.
6.2.7 Electrochemical Experiments
A 1.6 mm diameter polycrystalline gold disk sealed in polychlorotrifluoroethylene
(PCTFE) (BASi, US) was used as the working electrode. For DPV the following
parameters were used: equilibration time 3 s; modulation time 0.05 s; interval time 0.5
s; step potential 0.0051 V; modulation amplitude 0.02502 V. All other experimental
details are described in Section 3.2.5.
6.3 Results and Discussion
6.3.1 Thiol-Functionalised GNF
The survey spectra of unmodified Au and Au+GNF-thiol are presented in Figure 6.2(a),
and the elemental composition detected from the survey spectra are collated in Table
6.2. In unmodified Au, only gold and carbon are detected in the survey spectra,
whereas in Au+GNF-thiol the overall ratio of gold has decreased and oxygen and
sulphur are present in high enough concentrations to be detected. Nitrogen was not

6 Immobilisation of GNF on Electrode Surface
206
detected in the survey spectra of either sample, but the high resolution spectrum of the
N1s region of Au+GNF-thiol (Figure 6.2(b), red) showed clear, albeit small peaks at
399.7 and 401.7 eV assigned to nitrogen in amine and amide, in agreement with the
expected functional groups present in the sample. No nitrogen peaks were present in
unmodified Au (Figure 6.2(b), black).
Figure 6.2 (a) Survey spectra of unmodified Au (black) and Au+GNF-thiol (red). (b) High-resolution spectrum of the N1s region of unmodified Au (black) and Au+GNF-thiol (red). Spectra
are offset for clarity.
Table 6.2: Elemental composition calculated from peak areas in survey spectra in Figure 6.2.
Sample Name Position / eV Atomic%
Unmodified AuAu4d 336.1 55.5
C1s 285.1 44.5
Au+GNF-thiol
C1s 286.1 48.7
O1s 534.1 25.8
Au4d 336.1 21.8
S2p 162.1 3.7
The high resolution spectra of the C1s regions are compared in Figure 6.3. The
spectrum of unmodified Au in Figure 6.3(a) can be fitted with three peaks at 284.3,
286.2 and 288.4 eV. These binding energies are typical of adventitious carbon, which
is found on the surface of most samples that have been exposed to air [34]. The high

6 Immobilisation of GNF on Electrode Surface
207
resolution spectrum of the Au+GNF-thiol C1s region is shown in Figure 6.3(b) and
shows that there is a distinct difference in the composition of surface carbon in the two
samples. The spectrum of Au+GNF-thiol has been fitted with four peaks at 284.7,
286.6, 287.8 and 289.3 eV. The binding energies of these peaks are very similar to
those found in unmodified Au, but the ratios of peak areas are different, indicating that
the surface has been modified. In addition to aromatic carbon on the GNF basal plane,
we expect to see carbon in three other environments in a 1:1:1 ratio: C-S, C-N and N-
C=O. The peak at 284.7 eV is assigned to C-C carbon and contains contributions of
both sp2 and sp3-hybridised carbon found in GNF and adventitious carbon. The peak at
286.6 eV is attributed to both C-S and C-N carbon, and 287.8 eV is assigned to N-
C=O. There is a small peak at 289.3 eV attributed to COOH functionalities remaining at
the GNF-thiol edge after incomplete functionalisation of GNF-COOH. The ratio of peak
areas at 286.6 eV and 287.8 eV is approximately 2:1, in agreement with our predicted
composition and peak assignment, indicating successful deposition of GNF-thiol on the
substrate. The peak parameters are summarised in Table 6.3.

6 Immobilisation of GNF on Electrode Surface
208
Figure 6.3 High-resolution XPS spectra of the C1s region of (a) Au and (b) Au+GNF-thiol.Experimental data is shown in black, background in green, peak fits in red and the cumulative
peak fit in blue.
Table 6.3: Peak parameters from peak fit of C1s spectra in Figure 6.3.
Sample Name Position / eV FWHM / eV Line shape %area
Unmodified Au
C–C 284.4 1.600 GL(30) 79.8
C–O 286.2 1.600 GL(30) 7.0
COOH 288.2 1.600 GL(30) 13.2
Au+GNF-thiol
C–C 284.7 1.560 GL(30) 51.6
C–N, C–S 286.6 1.560 GL(30) 31.1
N–C=O 287.8 1.560 GL(30) 13.1
COOH 289.3 1.560 GL(30) 4.2

6 Immobilisation of GNF on Electrode Surface
209
6.3.1.1 STM
Having established that GNF-thiol can be successfully deposited onto a gold substrate,
the next step was to image them to see how they are oriented on the surface. For this
purpose, STM was used. Gold evaporated on mica was chosen as substrate for these
experiments because STM provides an extremely high resolution in the z direction and
therefore it is important to use a flat substrate with small height differences. Two
different deposition methods were attempted: spin-coating and drop-coating. It was
hypothesised that spin-coating would reduce the chance of contamination due to
shorter deposition time and because it is a one-step process with no need for a rinsing
step. On the other hand it has been reported that adsorption kinetics of thiol-
functionalised CNTs chemisorbing onto a gold substrate are very slow [16] and it is
reasonable to assume that the same would apply to GNFs. Drop-coating would provide
more time for sulphur-gold bonds to form, thereby allowing the use of a more dilute
suspension that would reduce the possibility of particle agglomeration.
Spin-coated samples
Figure 6.4 shows STM images of a clean Au(111) surface (a) and GNF-thiol spin-
coated onto Au(111) (b). The suspension concentration was 72 μg ml−1 and 10 drops
were applied onto a surface rotating at 5000 rpm. The clean Au(111) surface is
smooth, with terraces spanning over 100 nm. The herringbone reconstruction [35] can
be discerned, indicating a well-prepared substrate. After spin-coating the GNF-thiol
suspension onto the substrate, GNF are observed in the STM image as bright spots.
To determine whether the flakes adsorb preferentially on edge sites, dislocations in the
reconstruction or other defect sites, a lower coverage of the surface is necessary. This
can be achieved by lowering the concentration of the GNF suspension or by reducing
the number of drops applied onto the substrate.

6 Immobilisation of GNF on Electrode Surface
210
Figure 6.4 STM images of (a) clean Au(111); (b) GNF-thiol spin-coated onto Au(111).Suspension concentration 72 μg ml
−1.
In Figure 6.5(a)–(b), different concentrations of suspension are compared. Both
suspensions were spin-coated by applying one drop onto a substrate rotating at 2000
rpm. Figure 6.5(a) shows an image of 8 μg ml−1 GNF-thiol spin-coated onto Au(111)
substrate. Only a few features are visible in the image. In Figure 6.5(b) a high
concentration of 124 μg ml−1 GNF-thiol was used to spin-coat onto the substrate. In this
image many more bright spots are observed. A clear correlation between the
concentration of spin-coated suspension and the number of bright spots in the image
confirms that it is GNF-thiol that is detected on the Au(111) substrate.
When low concentrations of GNF-thiol are used, the flakes are seen to preferentially
adsorb on or near the edge sites. We were not able to achieve high enough resolution
to see whether the adsorption sites coincided with dislocations in the surface
reconstruction.
Figure 6.5(c) and (d) show line profiles across a flake extracted from Figure 6.5(a) and
(b) as indicated with green lines. The profiles from both dilute and concentrated
suspension are similar, showing a rounded shape 15–20 nm in diameter and reaching
a height of 1–1.7 nm. The lateral size was consistently found to be less than 30 nm
which has been reported previously for acid-terminated flakes [13, 36]. This is

6 Immobilisation of GNF on Electrode Surface
211
surprising as the tip convolution effect usually causes features to seem larger in the xy
direction [37]. The height along z axis, although not a straightforward measurement of
the physical height, was also found to be greater than that observed in previous STM
studies of nanographene platelets (ca. 0.4 nm) [22].
The reason why the average particle size observed in STM images is smaller than
expected may be that smaller GNF particles are preferentially adsorbed onto Au(111).
Minati et al. reported of a discrepancy in the length distribution of thiol-CNTs after
preparation and after adsorption on a gold substrate [17]. AFM experiments showed
that on average CNTs adsorbed onto gold were shorter than the suspension they were
adsorbed from, suggesting preferential adsorption of shorter CNTs. A similar result was
arrived at by Wei et al. [38]. On the other hand, if the flakes are curved up in the middle
rather than lying flat on the substrate, the lateral dimension would be reduced and the
height would increase, as observed here. Being composed of a single-layer of carbon
atoms, GNF are expected to be very flexible and able to bend in order to optimise the
bond angle between the sulphur atom in the thiol group and the gold substrate. Such
bending has been reported in single-walled CNTs bound on gold [39] due to the
flexibility of the CNT and the preference to form Au-S bonds through multiple thiol
groups located at both ends of the CNT.
It is also possible that due to the fairly high concentration of the suspension and the
reduced water solubility of GNF-thiol compared to GNF-COOH, we might be seeing
particles stacking together, causing the increased height observed. The height profiles
in Figure 6.5(c)–(d) indicate that the particle height is greater when deposition is
performed from a solution of higher concentration.

6 Immobilisation of GNF on Electrode Surface
212
Figure 6.5 STM images of GNF-thiol spin-coated onto Au(111). Suspension concentration (a)8 μg ml
−1; (b) 124 μg ml
−1. (c) Height profile from (a) along green line. (d) Height profile from (b)
along green line.

6 Immobilisation of GNF on Electrode Surface
213
Drop-coated samples
Drop-coating was also investigated as a method of depositing GNF onto Au substrate.
A control deposition was performed using only doubly ionised water and this is shown
in Figure 6.6. The Au(111) substrate has been well prepared, as indicated by the
herringbone reconstruction and terraces spanning several hundred nanometres, but
the appearance of brighter coloured areas suggests that at some point during the
deposition, the substrate has been contaminated.
Figure 6.6 (a) STM image of Au(111) substrate after drop-coating distilled water. (b) Heightprofile from (a) along green line.
GNF-thiol were then drop-coated from a suspension at concentration 2 μg ml−1 and
imaged with STM (Figure 6.7). Again the Au(111) substrate is well prepared as we can
see the herringbone reconstruction of the surface. Bright features on the substrate that
are assigned to GNF-thiol particles can be discerned on the surface. A height profile
was taken across a flake along the green line in Figure 6.7(a) and is shown in Figure
6.7(b). The height of the flake is ca. 5 Å, which is very close to what was observed by
Huang et al. [22] and indicates that the particles are oriented horizontally on the
substrate and lying flat rather than bending. Therefore it seems likely that the particles
observed in Figure 6.5 were stacking together due to high concentration, forming few-
layer graphene flakes.

6 Immobilisation of GNF on Electrode Surface
214
Figure 6.7 (a) STM image of 2 μg ml−1 GNF-thiol drop-coated on Au(111). (b) Height profile from (a) along green line.
High resolution imaging of GNF
Attempts were made to image the honeycomb structure of the graphene basal plane
but these were unsuccessful. A few possible reasons for our inability to achieve a high
resolution image of a GNF are discussed next.
It is difficult to remove all water from GNF samples Therefore it is possible that, despite
the use of desiccant in the STM chamber, the GNF retain a layer of adsorbed water.
Water molecules can get dragged around by the tip and interfere with the imaging
process. The flakes themselves are mobile and may be easily moved around by the tip.
Lateral manipulation is widely used as a tool to relocate molecules and it was first
demonstrated by IBM researchers [40]. More recently, C60 molecules adsorbed on
Si(100)−2 × 1 have been observed to move around by the influence of the tip even
under UHV conditions [37]. If we are experiencing the flakes being dragged around
then this would completely hinder any attempts to achieve good quality images.
Evidence of water molecules or graphene flakes being picked up by the tip was seen in
some STM images. When the image sharpness suddenly goes from good to poor in

6 Immobilisation of GNF on Electrode Surface
215
the middle of a raster line, it is indicative of the tip picking up something and dragging it
along as it moves over the sample.
The sharpness of the tip is a variable that will to a great extent determine the resolution
that is achieved. It is possible to cut tips by hand to a standard that allows atomic
resolution on for example HOPG. Although it is possible, it seems unlikely that we
never managed to get a good enough tip to see the honeycomb structure of graphene.
Evidence of contamination in the drop-coated sample was shown in Figure 6.6.
Contamination is another variable that will have a detrimental effect on the quality of
STM images.
6.3.2 GNF Attached onto SAM-functionalised Gold
GNF were covalently attached onto a SAM-functionalised Au substrate either with or
without an electrochemically active tag. First, the formation of a SAM on gold was
verified by XPS. Figure 6.8(a) shows high-resolution spectra of the S2p region. We
can see that there is no sulphur present in the bare gold substrate (black line), but a
peak appears in all subsequent samples, confirming successful formation of a SAM.
High-resolution spectra of the N1s region are presented in Figure 6.8(b). No nitrogen is
detected in the bare gold substrate as expected. When trying to determine whether the
GNF attachment onto SAM has been successful, we compare the shape of the peak. In
our case both Au+cysteine and Au+cysteine+GNF-amide are best fitted with just one
peak at ca. 400 eV and with FWHM of ca 3 eV. Irrespective of peak fitting, visual
inspection of the spectra suggests that going from Au+cysteine (red) to
Au+cysteine+GNF-amide (blue) the peak shifts to a higher binding energy, consistent
with inclusion of amide functionalities in the sample. Correspondingly, comparison of
Au+cysteamine (green) and Au+cysteamine+GNF-COOH (light blue) shows a shift to

6 Immobilisation of GNF on Electrode Surface
216
higher binding energy in line with conversion of some amine groups to amides upon
attachment of GNF-COOH.
Figure 6.8 High-resolution spectra of (a) S2p and (b) N1s regions. Au (black), Au+cysteine(red), Au+cysteine+GNF-amide (blue), Au+cysteamine (green), Au+cysteamine+GNF-COOH
(light blue). Spectra are offset for clarity.
To corroborate the information gleaned from the N1s region spectra, high-resolution
spectra of the C1s region was examined. The results are presented in Figure 6.9 and
peak parameters are summarised in Table 6.4.

6 Immobilisation of GNF on Electrode Surface
217
Figure 6.9 Narrow scan XPS spectra of the C1s region. (a) Unmodified Au; (b) Au+cysteine; (c)Au+cysteine+GNF-amide; (d) Au+cysteamine; (e) Au+cysteamine+GNF-COOH. Black squares:
experimental data; green: baseline; red: peak fits; blue: cumulative peak fit.

6 Immobilisation of GNF on Electrode Surface
218
Table 6.4: Peak parameters extracted from peak fits in Figure 6.9.
Sample NamePosition /
eVFWHM /
eVLine
shape%Area
Unmodified Au
C–C 285.1 1.55 GL(30) 78.1
C–O 286.9 1.55 GL(30) 10.5
COOH 288.7 1.55 GL(30) 11.4
Au+cysteine
C–C 284.7 1.56 GL(30) 67.0
C–N, C–S 286.0 1.56 GL(30) 14.7
N–C=O 287.3 1.56 GL(30) 7.9
COOH 288.6 1.56 GL(30) 10.3
Au+cysteine+GNF-amide
C–C 284.7 1.43 GL(30) 63.9
C–N, C–S 286.1 1.43 GL(30) 20.2
N–C=O 287.7 1.43 GL(30) 10.1
COOH 288.9 1.43 GL(30) 5.8
Au+cysteamine
C–C 284.7 1.60 GL(30) 75.0
C–O , C–N,C–S
286.4 1.60 GL(30) 14.9
COOH 288.1 1.60 GL(30) 10.1
Au+cysteamine+GNF-COOH
C–C 285.0 1.56 GL(30) 65.5
C–N, C–S 286.6 1.56 GL(30) 18.5
N–C=O 288.2 1.56 GL(30) 8.3
COOH 289.2 1.56 GL(30) 7.6
Comparison of the C1s region spectra of cysteine SAM and Au+cysteine+GNF-amide
shows small changes in the peak area ratios (Figure 6.9(b)-(c)). The amount of COOH
decreases and the amount of N–C=O increases, as expected when carboxylic acid
groups on the cysteine SAM are converted into amides upon reaction with the GNF.
The number of C–N groups increases as well upon GNF attachment due to the amine
groups on GNF.
C1s region of cysteamine SAM (Figure 6.9(d)) must be fitted with a COOH peak, even
though there aren’t any carboxylic acid groups in the sample. This is most likely due to
adventitious carbon being present in detectable amounts, interfering with the
quantification of the carbon functionalities and making it difficult to compare
Au+cysteamine and Au+cysteamine+GNF-COOH (Figure 6.9(e)) samples. However,
we do see that upon attachment of GNF-COOH a component for N–C=O functionalities

6 Immobilisation of GNF on Electrode Surface
219
appears, in agreement with the formation of a covalent bond between the SAM and
GNF. This indicates that we have successfully grafted GNF particles onto the
substrate.
Au+SAM+GNF samples were also tagged with an electrochemically active ferrocene
derivative (ferrocene carboxaldehyde or ferrocene carboxylic acid) for electrochemical
detection. First, in order to analyse the samples with XPS, they were prepared on thin
films of gold. Iron was not detected in the survey spectra, so high-resolution spectra of
the Fe2p region were collected for these samples. The results are presented in Figure
6.10.
Figure 6.10 Narrow scans of the Fe2p regions of Au+cysteamine+GNF-COOH (black) andAu+cysteine+GNF-amide+FcCHO (red). Spectra are offset for clarity.
The presence of FcCOOH in Au+cysteamine+GNF-COOH is confirmed by the
appearance of peaks in the Fe2p region (Figure 6.10, black line). The spin-orbit
splitting of Fe2p is 13.1 eV, meaning that the 2p3/2 and 2p1/2 peaks are well resolved.
The experimental spectrum shows significant asymmetry to the features and if peak
fitting were attempted, it would be necessary to add two more components to the fit.
Additional components could arise from satellite features, but FcCOOH is a low-spin
compound and Fe2p spectra from low-spin compounds do not exhibit multiplet splitting.

6 Immobilisation of GNF on Electrode Surface
220
Barring spin crossover, satellite peaks can be ruled out as FcCOOH is a low-spin
compound with the iron centre in the 2+ oxidation state. Contamination seems unlikely
as no features are observed in the Fe2p spectrum of Au+cysteine+GNF-amide-FcCHO
(Figure 6.10, red line). We must therefore assume that some oxidation of the surface
has occurred and that we have Fe(III) species present in our sample. Fe(III)
compounds always contain unpaired electrons and will therefore show satellite
features. Peak fitting was not attempted as the complex multiplet structure and
overlapping binding energies [33] make Fe2p region problematic to fit.
The Fe2p region of Au+cysteine+GNF-amide-FcCHO does not show significant peaks
(Figure 6.10, red line), indicating that on this occasion the synthesis method has not
worked and that the procedure needs optimisation for successful attachment of FcCHO
onto GNF.
6.3.2.1 Electrochemical Studies of Au + SAM + GNF Assembly
The deposition method described above was repeated with a polycrystalline gold
electrode as substrate. Differential pulse voltammograms were recorded of
Au+cysteamine+GNF-COOH and Au+cysteamine+GNF-COOH+FcCOOH and the
results are compared in Figure 6.11(a). With only GNF attached onto the SAM (red
line), no voltammetric peaks are observed in the DPV. After FcCOOH attachment to
the assembly (blue line), clear voltammetric peaks can be seen at 0.33 and 0.34 V for
oxidation and reduction, respectively. The peak potentials are in agreement with E0′ of
FcCOOH reported in literature [25, 26] and the very small peak separation indicates
reversible, fast kinetics.
Figure 6.11(b) shows DPV current traces of Au+cysteine and Au+cysteine+GNF-
amide+FcCHO. There are no voltammetric peaks present in the DPVs when the
working electrode is Au+cysteine (red curves). Upon GNF-amide+FcCHO attachment
(blue curves) the ferrocene tag can be detected as evidenced by voltammetric peaks

6 Immobilisation of GNF on Electrode Surface
221
centred at 0.2 V. The fast, reversible ET is not affected by being immobilised onto the
Au+cysteine+GNF-amide+FcCHO assembly as the peak separation between oxidation
and reduction peaks is very small.
Figure 6.11 Differential pulse voltammograms of (a) Au+cysteamine+GNF-COOH (red) andAu+cysteamine+GNF-COOH+FcCOOH (blue); (b) Au+cysteine (red) and Au+cysteine+GNF-
amide+FcCHO (blue). Solid line: oxidation; line and symbols: reduction.
The differential pulse voltammograms presented in Figure 6.11 clearly indicate the
presence of Fc derivatives in both samples. However, the covalent nature of the bond
between ferrocene derivative and GNF in the Au+cysteine+GNF-amide+FcCHO

6 Immobilisation of GNF on Electrode Surface
222
assembly is considered more promising for initial studies and it was therefore
investigated further with cyclic voltammetry. A scan rate study was carried out, the
results of which are presented in Figure 6.12.
Figure 6.12(a) shows cyclic voltammograms of Au+cysteine+GNF-amide+FcCHO at
different scan rates. Clear voltammetric peaks can be seen in the CVs with Ep
independent of scan rate in the range studied here (50 mV–1 V s−1). Epa was found to
be 0.236 V and Epc 0.162 V, giving ΔEp = 75 mV. The theoretical value of ΔEp of
adsorbed species exhibiting fast, reversible kinetics is zero due to the absence of
diffusion. A non-zero ΔEp is usually found experimentally as some resistance is
introduced into the system by the solution and other components. In our case the
modification layer on the electrode may inhibit the electron transfer.
To further characterise the modification of the electrode, the peak currents extracted
from CVs in Figure 6.12(a) were plotted against the scan rate and fitted with a linear
regression line (Figure 6.12(b)). ipc (blue symbols) depends linearly on scan rate,
indicating absence of diffusion as expected of a surface-immobilised redox species.
However, the oxidation currents (red symbols) are less well fitted with a linear
regression line. To investigate this further, log ip was plotted against log ν and fitted
with a linear regression line as shown in Figure 6.12(c). The reduction current fit (blue)
has a slope of 0.86, close to the theoretical value of 1 for a surface-confined redox
process. The slope of the oxidation current fit (red) is 0.62, closer to the theoretical
value of 0.5 for a diffusion-controlled redox species.

6 Immobilisation of GNF on Electrode Surface
223
Figure 6.12 (a) Cyclic voltammograms at Au+cysteine+GNF-amide+FcCHO in 0.1 M PBS pH 7;scan rate 50 (black), 100 (red), 250 (blue), 500 (green), 750 (light blue) and 1000 (pink) mV s
−1;
5th scans shown; (b) ipa (red) and ipc (blue) plotted against ν; (c) log ipa (red) and log |ipc| (blue)plotted against log ν.

6 Immobilisation of GNF on Electrode Surface
224
The log-log plot presented in Figure 6.12(c) suggests poor immobilisation of the
reduced species onto the electrode surface. On the other hand, the oxidised species is
clearly confined to the surface. It is possible that the redox probe is physisorbed onto
the surface rather than covalently bonded onto the GNF. The oxidised species carries
positive charge and may therefore be more strongly adsorbed than the neutral reduced
FcCHO. A possible physisorption site is the basal plane of the graphene flakes via π–π
interactions, although no evidence of physisorption of another ferrocene derivative,
ferrocenemethanol, onto GNF-COOH was found in experiments described in Section
3.3.7.
The amount of charge passed was calculated for each CV and converted to number of
moles of ferrocene groups at the electrode. The data is tabulated in Table 6.5.
Table 6.5: Peak currents found from cyclic voltammograms in Figure 6.12(b), amount of chargeq calculated by integrating peak areas under CV curve in Coulombs and corresponding number
of FcCHO molecules in moles.
ν / V s−1
ipa
/ 10−9 Aq
/ 10−8 CFcCHO
/ 10−13 molipc
/ 10−9 Aq
/ 10−8 CFcCHO
/ 10−13 mol
0.05 −6.24 −1.33 1.38 16.0 4.49 4.65
0.10 −10.2 −1.13 1.17 22.5 3.49 3.61
0.25 −24.4 −1.11 1.15 41.4 2.30 2.38
0.50 −46.9 −1.13 1.18 66.6 2.15 2.22
0.75 −60.0 −1.03 1.06 82.2 1.72 1.78
1.0 −78.4 −1.03 1.07 100 1.37 1.42
The number of moles of Fc groups calculated from the reduction peak decreases
slightly as the scan rate increases. When the corresponding number is calculated from
the oxidation peak, the values decrease rapidly. This supports the conclusion that the
covalent bond formation has failed and we are instead seeing physisorption onto the
GNF, where the positively charged FcCHO+ species is more tightly adsorbed than the
neutral FcCHO species.

6 Immobilisation of GNF on Electrode Surface
225
6.4 Conclusion
The majority of work presented in this thesis was conducted after immobilising GNF
onto the electrode surface by drop-coating, which is quick and convenient but offers
little control over the surface coverage and morphology of the drop-coated layer. In this
Chapter, different methods of attaching GNF onto electrodes were discussed.
Thiol-functionalised GNF have been successfully deposited onto gold substrate by self-
assembly and the chemisorption was verified by XPS. Individual GNF were imaged on
Au(111) substrate using STM, however, high resolution images proved elusive. A
significant amount of time was dedicated to STM imaging, and many hours were spent
varying the main imaging parameters, bias voltage and tunnelling current. Despite our
best efforts, we were unable to find settings that would have allowed us to image the
basal plane of a GNF with atomic resolution. Although not attempted in this work, STM
under UHV conditions or low temperature conditions could facilitate the imaging of
GNF.
Because the bulk of our STM experiments were directed towards imaging individual
flakes, only sub-monolayer coverages were investigated. At these very low coverages
GNF were found to preferentially adsorb on or near edge sites on Au(111) and lie flat
on the surface. This type of orientation would not necessarily be seen for higher
surface coverage. Further work would be needed to study self-assembly from higher
concentration or at longer deposition times to see how closely packed a GNF
monolayer would be and to determine the kinetics of adsorption.
GNF decorated with amide and COOH functionalities have also been deposited onto
Au by attachment onto a self-assembled monolayer of a short-chained thiol on a gold
substrate. Gold sputter-coated onto FTO glass was used for XPS studies and
polycrystalline gold electrodes for electrochemical experiments. Narrow scan C1s

6 Immobilisation of GNF on Electrode Surface
226
spectra indicated successful attachment and bond formation between the SAM end
groups and the GNF.
The SAM-GNF assembly was also tagged with an electrochemically active ferrocene
derivative. Narrow scan Fe2p spectra showed the presence of a ferrocene moiety in
Au+cysteamine+GNF-COOH+FcCOOH sample but not in Au+cysteine+GNF-
amide+FcCHO. Electrochemical experiments suggested the presence of ferrocene
moieties in both Au+cysteamine+GNF-COOH+FcCOOH and Au+cysteine+GNF-
amide+FcCHO samples, but in-depth analysis of cyclic voltammograms showed poor
immobilisation of FcCHO, indicating a lack of covalent bond formation. Further
optimisation of the deposition method is therefore needed in order to achieve covalent
attachment of ferrocene onto GNF.

6 Immobilisation of GNF on Electrode Surface
227
References for Chapter 6
1. Rahman, M. M., Fabrication of Self-Assembled Monolayer Using CarbonNanotubes Conjugated 1-Aminoundecanethiol on Gold Substrates. NaturalScience 2011, 3, 208-217.
2. Smith, K. L.; Black, K. M., Characterization of the Treated Surfaces of SiliconAlloyed Pyrolytic Carbon and SiC. Journal of Vacuum Science & Technology A1984, 2 (2), 744-747.
3. Bachman, B. J.; Vasile, M. J., Ion Bombardment of Polyimide Films. Journal ofVacuum Science & Technology A 1989, 7 (4), 2709-2716.
4. Mérel, P.; Tabbal, M.; Chaker, M., et al., Direct Evaluation of the sp3 Content inDiamond-Like-Carbon Films by XPS. Appl. Surf. Sci. 1998, 136 (1–2), 105-110.
5. Morar, J. F.; Himpsel, F. J.; Hollinger, G., et al., C 1s Excitation Studies ofDiamond (111). I. Surface Core Levels. Physical Review B 1986, 33 (2), 1340-1345.
6. Schmieg, S. J.; Belton, D. N., Polycrystalline Diamond Film on Si(100) by XPS.Surf. Sci. Spectra 1992, 1 (4), 329-332.
7. Ramanathan, T.; Fisher, F. T.; Ruoff, R. S., et al., Amino-Functionalized CarbonNanotubes for Binding to Polymers and Biological Systems. Chem. Mater. 2005,17 (6), 1290-1295.
8. Techane, S. D.; Gamble, L. J.; Castner, D. G., Multitechnique Characterization ofSelf-Assembled Carboxylic Acid-Terminated Alkanethiol Monolayers onNanoparticle and Flat Gold Surfaces. The Journal of Physical Chemistry C 2011,115 (19), 9432-9441.
9. Zorn, G.; Liu, L.-H.; Árnadóttir, L., et al., X-Ray Photoelectron SpectroscopyInvestigation of the Nitrogen Species in Photoactive Perfluorophenylazide-Modified Surfaces. The journal of physical chemistry. C, Nanomaterials andinterfaces 2014, 118 (1), 376-383.
10. Tang, X.-Z.; Li, W.; Yu, Z.-Z., et al., Enhanced Thermal Stability in GrapheneOxide Covalently Functionalized with 2-Amino-4,6-Didodecylamino-1,3,5-Triazine. Carbon 2011, 49 (4), 1258-1265.
11. Hammond, J. S.; Holubka, J. W.; deVries, J. E., et al., The Application of X-RayPhoto-Electron Spectroscopy to a Study of Interfacial Composition in Corrosion-Induced Paint De-Adhesion. Corros. Sci. 1981, 21 (3), 239-253.
12. Johansson, E.; Nyborg, L., XPS Study of Carboxylic Acid Layers on OxidizedMetals with Reference to Particulate Materials. Surf. Interface Anal. 2003, 35 (4),375-381.
13. Rosillo-Lopez, M.; Lee, T. J.; Bella, M., et al., Formation and Chemistry ofCarboxylic Anhydrides at the Graphene Edge. RSC Advances 2015, 5 (126),104198-104202.
14. França, R.; Mbeh, D. A.; Samani, T. D., et al., The Effect of Ethylene OxideSterilization on the Surface Chemistry and in Vitro Cytotoxicity of Several Kindsof Chitosan. Journal of Biomedical Materials Research Part B: AppliedBiomaterials 2013.

6 Immobilisation of GNF on Electrode Surface
228
15. Baker, S. E.; Cai, W.; Lasseter, T. L., et al., Covalently Bonded Adducts ofDeoxyribonucleic Acid (DNA) Oligonucleotides with Single-Wall CarbonNanotubes: Synthesis and Hybridization. Nano Lett. 2002, 2 (12), 1413-1417.
16. Liu, Z.; Shen, Z.; Zhu, T., et al., Organizing Single-Walled Carbon Nanotubes onGold Using a Wet Chemical Self-Assembling Technique. Langmuir 2000, 16 (8),3569-3573.
17. Minati, L.; Speranza, G.; Torrengo, S., et al., Characterization of Thiol-Functionalized Carbon Nanotubes on Gold Surfaces. Surf. Sci. 2010, 604 (17–18), 1414-1419.
18. Kim, Y.-R.; Bong, S.; Kang, Y.-J., et al., Electrochemical Detection of Dopaminein the Presence of Ascorbic Acid Using Graphene Modified Electrodes. Biosens.Bioelectron. 2010, 25 (10), 2366-2369.
19. Yu, Q.; Jauregui, L. A.; Wu, W., et al., Control and Characterization of IndividualGrains and Grain Boundaries in Graphene Grown by Chemical VapourDeposition. Nat Mater 2011, 10 (6), 443-449.
20. Gottardi, S.; Müller, K.; Bignardi, L., et al., Comparing Graphene Growth onCu(111) Versus Oxidized Cu(111). Nano Lett. 2015, 15 (2), 917-922.
21. Feng, X.; Wu, J.; Bell, A. T., et al., An Atomic-Scale View of the Nucleation andGrowth of Graphene Islands on Pt Surfaces. The Journal of Physical Chemistry C2015, 119 (13), 7124-7129.
22. Huang, K.; Delport, G.; Orcin-Chaix, L., et al., Single Layer Nano GraphenePlatelets Derived from Graphite Nanofibres. Nanoscale 2016, 8 (16), 8810-8818.
23. Abeed, F. A.; Al-Allaf, T. A. K.; Sulaiman, S. T., Electroanalytical Studies ofFerrocene and Substituted Ferrocene in Non-Aqueous Solvents by Rotating DiscVoltammetry. Analyst 1988, 113 (2), 333-336.
24. Sharp, M.; Petersson, M.; Edström, K., Preliminary Determinations of ElectronTransfer Kinetics Involving Ferrocene Covalently Attached to a Platinum Surface.J. Electroanal. Chem. 1979, 95 (1), 123-130.
25. McCormack, S.; Russell, N. R.; Cassidy, J. F., Cyclic Voltammetry of FerroceneCarboxylic Acid Cyclodextrin Inclusion Complexes. Electrochim. Acta 1992, 37(11), 1939-1944.
26. Raoof, J. B.; Ojani, R.; Kolbadinezhad, M., Electrocatalytic Characteristics ofFerrocenecarboxylic Acid Modified Carbon Paste Electrode in the Oxidation andDetermination of L-Cysteine. Electroanalysis 2005, 17 (22), 2043-2051.
27. Ma, W.; Ying, Y.-L.; Qin, L.-X., et al., Investigating Electron-Transfer ProcessesUsing a Biomimetic Hybrid Bilayer Membrane System. Nat. Protocols 2013, 8 (3),439-450.
28. Khorana, H. G., The Chemistry of Carbodiimides. Chem. Rev. 1953, 53 (2), 145-166.
29. DeTar, D. F.; Silverstein, R., Reactions of Carbodiimides. I. The Mechanisms ofthe Reactions of Acetic Acid with Dicyclohexylcarbodiimide1,2. J. Am. Chem.Soc. 1966, 88 (5), 1013-1019.
30. Staros, J. V.; Wright, R. W.; Swingle, D. M., Enhancement by n-Hydroxysulfosuccinimide of Water-Soluble Carbodiimide-Mediated CouplingReactions. Anal. Biochem. 1986, 156 (1), 220-222.
31. Thermo Scientific, Crosslinking Technical Handbook.https://tools.thermofisher.com/content/sfs/brochures/1602163-Crosslinking-Reagents-Handbook.pdf (accessed 22 September 2016).
32. Xia, N.; Xing, Y.; Wang, G., et al., Probing of EDC/NHSS-Mediated CovalentCoupling Reaction by the Immobilization of Electrochemically ActiveBiomolecules. Int. J. Electrochem. Sci 2013, 8, 2459-2467.
33. Biesinger, M. C.; Payne, B. P.; Grosvenor, A. P., et al., Resolving SurfaceChemical States in XPS Analysis of First Row Transition Metals, Oxides andHydroxides: Cr, Mn, Fe, Co and Ni. Appl. Surf. Sci. 2011, 257 (7), 2717-2730.

6 Immobilisation of GNF on Electrode Surface
229
34. Barr, T. L.; Seal, S., Nature of the Use of Adventitious Carbon as a BindingEnergy Standard. Journal of Vacuum Science & Technology A 1995, 13 (3),1239-1246.
35. Engbæk, J.; Schiøtz, J.; Dahl-Madsen, B., et al., Atomic Structure of ScrewDislocations Intersecting the Au(111) Surface: A Combined Scanning TunnelingMicroscopy and Molecular Dynamics Study. Physical Review B 2006, 74 (19),195434.
36. Salzmann, C. G.; Nicolosi, V.; Green, M. L. H., Edge-Carboxylated GrapheneNanoflakes from Nitric Acid Oxidised Arc-Discharge Material. J. Mater. Chem.2010, 20 (2), 314-319.
37. Sakurai, T.; Watanabe, Y., Advances in Scanning Probe Microscopy. Springer-Verlag: Berlin, 2000.
38. Wei, H.; Kim, S.; Kim, S. N., et al., Patterned Forest-Assembly of Single-WallCarbon Nanotubes on Gold Using a Non-Thiol Functionalization Technique. J.Mater. Chem. 2007, 17 (43), 4577-4585.
39. Lim, J. K.; Yun, W. S.; Yoon, M.-h., et al., Selective Thiolation of Single-WalledCarbon Nanotubes. Synth. Met. 2003, 139 (2), 521-527.
40. Eigler, D. M.; Lutz, C. P.; Rudge, W. E., An Atomic Switch Realized with theScanning Tunnelling Microscope. Nature 1991, 352 (6336), 600-603.

230
7 Concluding Remarks
This thesis set out to achieve three goals: to examine the effect of specific surface
functionalities present at carbon electrodes on common redox probes; to study the
potential-dependent dissociation of acidic surface functionalities; and to explore
different ways of attaching functionalised carbon nanomaterials onto a surface. In this
work graphene nanoflakes with well-defined edge functionalities were used as a novel
carbon nanomaterial. Characterisation of GNF has been reported before [1], but in this
thesis we have added to the existing knowledge of the acid-terminated GNF by
performing pH titration and in-situ monitoring of acid dissociation by infrared
spectroscopy. Complexation of GNF-COOH was also studied by using different
cations.

7 Concluding Remarks
231
7.1 Influence of GNF on the Electrochemistry of Redox
Probes
Oxidised carbon electrodes will present a range of surface oxygen functionalities;
hence it can be difficult to isolate the interaction of redox probes with a specific surface
moiety. The strength of this study are the well-characterised and uniform GNF that
enabled me to attribute changes in electrochemical response to specific functionalities.
The very high density of carboxylic acid groups of the GNF-COOH flakes and the
absence of other oxygen-containing functionalities allowed me to specifically
investigate the effect of these highly charged and acidic groups on the electrochemical
response of GNF.
The presence of an immobilised layer of GNF on the surface of a boron-doped
diamond electrode did not inhibit electron transfer of ferrocene methanol, a common
outer-sphere redox probe, irrespective of edge termination. When a proton-coupled
electron transfer reaction was examined, carboxylic acid –terminated GNF were found
to participate in the redox reaction by providing a non-solution proton source and sink.
A whole Chapter was devoted to the [Fe(CN)6]3−/4− redox couple, which is often used in
electrochemical studies as a redox probe despite a large body of evidence showing
complex behaviour at electrodes and instability in solution. At BDD electrode, the
presence of COOH groups has been shown to have an adverse effect the electron
transfer kinetics of [Fe(CN)6]3−/4− especially in alkaline solutions attributed to
electrostatic repulsion between negatively charged carboxylates and the negatively
charged redox species [2, 3]. The reversibility and electron transfer rate of the
[Fe(CN)6]3−/4− redox system has been shown by others to depend on the concentration
and identity of cations in solution [4, 5]. Additionally, it is known that [Fe(CN)6]3−/4− can
be unstable in solution of low ionic strength and low pH, and cyanide ligand loss and
subsequent decomposition and adsorption onto electrodes have been observed by

7 Concluding Remarks
232
several groups [5-11]. In this work it is shown that the acid groups at GNF-COOH
severely inhibit the redox reaction of [Fe(CN)6]3−/4− in acidic solution when more acid
groups are expected to be protonated; therefore, electrostatic repulsion cannot be used
to explain the effect of GNF-COOH on this redox couple. By monitoring the stability of
[Fe(CN)6]3−/4− in the presence of GNF, it is demonstrated that the acid-terminated flakes
accelerate the decomposition of the redox species.
7.2 Potential-Driven Deprotonation of Acid Groups
In Chapter 5, the effect of applied potential on carboxylic acid groups at the GNF edge
was studied. Numerous reports on the dissociation of self-assembled monolayers exist,
but the findings are contradictory. Some groups have reported deprotonation occurring
at positive applied potential in response to the electric field at the electrode [12-16],
whereas others have observed deprotonation at negative potentials in response to
changes in the apparent pKa of the acid groups due to changes in cation activity at the
electrode [17-20].
By complexing COOH-terminated GNF with divalent cations and immobilising them on
BDD, a large surface area electrode with a high concentration of acid groups was
constructed. The dissociation of carboxylic acid groups at the GNF edge was then
monitored in situ by combining potentiostatic control with infrared spectroscopy.
Deprotonation was observed on application of a negative potential of the surface-
immobilised acid groups as well as the supporting electrolyte. The deprotonation was
confirmed to stem from changes in the apparent pKa of all species near the electrode.
The observation of deprotonation of electrode-immobilised acids is not new; however,
in this thesis we have provided convincing evidence of the mechanism behind the
observed behaviour. There are few studies that can provide in situ measurement of
changes in interfacial speciation as a function of applied potential as has been done in

7 Concluding Remarks
233
this thesis. To the best of our knowledge, potential-induced deprotonation of solution
species has never previously been reported.
7.3 Immobilisation of GNF
In Chapter 6, different methods of attaching GNF onto a substrate are discussed. The
main immobilisation technique used in this work is drop-coating, which is quick and
convenient but offers little control over the surface coverage and morphology of the
drop-coated layer. To study the immobilisation of GNF onto a substrate in a more
controlled fashion, other techniques were used.
Firstly, thiol-terminated GNF were attached onto a gold substrate by self-assembly and
the successful attachment was confirmed by XPS. Sub-monolayer coverages were
used in order to be able to image the surface with scanning tunnelling microscopy. At
low coverages, the GNF were found to orientate horizontally on the surface and adsorb
preferentially onto step edges. Secondly, self-assembled monolayers on gold with
different head groups were utilised to attach GNF onto the substrate through covalent
bonding, and narrow scan C1s spectra indicated successful attachment and bond
formation between the SAM end groups and the GNF.
7.4 Future Work
It was not possible to determine the identity of the [Fe(CN)6]3−/4− decomposition product
from the experimental results presented in this thesis. To identify the new species
observed in this study, a few techniques could be tried. UV-Vis in the total internal
reflection mode would allow further in situ characterisation of the precipitate by
discriminating between interfacial and solution species. If the precipitate can be
separated from the solution, X-ray diffraction (XRD) could be used to study the crystal
structure of the decomposition product.

7 Concluding Remarks
234
Although we were unable to achieve atomic resolution STM images of the GNF in this
study, the use of UHV conditions or low temperature conditions could facilitate the
imaging of GNF. Further work would also be useful to study self-assembly of thiol-
terminated GNF from higher concentration or at longer deposition times to see how
closely packed a GNF monolayer would be and to determine the kinetics of adsorption.
Additionally, scanning electron microscopy (SEM) imaging could be used to probe the
orientation on freestanding BDD discs.
Recent developments in the synthesis of functional graphene nanocomposites have led
to advances in electrochemical biosensing applications for graphene materials [21],
and this is an area in which potential use for GNF can be envisaged. Another field
where graphene is expected to be widely utilised is composite materials for energy
devices, for example to improve the mechanical stability of NiO [22] or polyaniline [23]
in supercapacitor electrodes; hence, GNF are a promising candidate for use in similar
applications.

7 Concluding Remarks
235
References for Chapter 7
1. Rosillo-Lopez, M.; Lee, T. J.; Bella, M., et al., Formation and Chemistry ofCarboxylic Anhydrides at the Graphene Edge. RSC Advances 2015, 5 (126),104198-104202.
2. Granger, M. C.; Swain, G. M., The Influence of Surface Interactions on theReversibility of Ferri/Ferrocyanide at Boron‐Doped Diamond Thin‐FilmElectrodes. J. Electrochem. Soc. 1999, 146 (12), 4551-4558.
3. Hutton, L. A.; Iacobini, J. G.; Bitziou, E., et al., Examination of the FactorsAffecting the Electrochemical Performance of Oxygen-Terminated PolycrystallineBoron-Doped Diamond Electrodes. Analytical Chemistry 2013, 85 (15), 7230-7240.
4. Peter, L. M.; Dürr, W.; Bindra, P., et al., The Influence of Alkali Metal Cations onthe Rate of the Fe(CN)6
4−/Fe(CN)63− Electrode Process. J. Electroanal. Chem.
1976, 71 (1), 31-50.5. Beriet, C.; Pletcher, D., A Microelectrode Study of the Mechanism and Kinetics of
the Ferro/Ferricyanide Couple in Aqueous Media: The Influence of the Electrolyteand Its Concentration. J. Electroanal. Chem. 1993, 361 (1-2), 93-101.
6. Więckowski, A.; Szklarzyk, M., The State of the Polycrystalline Platinum Electrode During the Heterogeneous Electron-Transfer Reaction: Fe(CN)6
3−+e−
Fe(CN)64−. J. Electroanal. Chem. 1982, 142 (1–2), 157-170.
7. Pons, S.; Datta, M.; McAleer, J. F., et al., Infrared Spectroelectrochemistry of theFe(CN)6
4−/Fe(CN)63− Redox System. J. Electroanal. Chem. 1984, 160 (1–2), 369-
376.8. Kawiak, J.; Kulesza, P. J.; Galus, Z., A Search for Conditions Permitting Model
Behavior of the Fe(CN)3−/4−6 System. J. Electroanal. Chem. 1987, 226 (1–2), 305-
314.9. Lee, C.; Anson, F. C., Inhibition of the Electroreduction of Fe(CN)6
3− atMicroelectrodes in the Absence of Supporting Electrolyte: Mediation of theInhibited Reduction by Methyl Viologen. J. Electroanal. Chem. 1992, 323 (1–2),381-389.
10. Pharr, C. M.; Griffiths, P. R., Infrared Spectroelectrochemical Analysis ofAdsorbed Hexacyanoferrate Species Formed During Potential Cycling in theFerrocyanide/Ferricyanide Redox Couple. Analytical Chemistry 1997, 69 (22),4673-4679.
11. Karyakin, A. A., Prussian Blue and Its Analogues: Electrochemistry and AnalyticalApplications. Electroanalysis 2001, 13 (10), 813-819.
12. White, H. S.; Peterson, J. D.; Cui, Q., et al., Voltammetric Measurement ofInterfacial Acid/Base Reactions. The Journal of Physical Chemistry B 1998, 102(16), 2930-2934.
13. Burgess, I.; Seivewright, B.; Lennox, R. B., Electric Field DrivenProtonation/Deprotonation of Self-Assembled Monolayers of Acid-TerminatedThiols. Langmuir 2006, 22 (9), 4420-4428.

7 Concluding Remarks
236
14. Rosendahl, S. M.; Burgess, I. J., Electrochemical and Infrared SpectroscopyStudies of 4-Mercaptobenzoic Acid SAMs on Gold Surfaces. Electrochim. Acta2008, 53 (23), 6759-6767.
15. Ma, C.; Harris, J. M., Surface-Enhanced Raman Spectroscopy Investigation ofthe Potential-Dependent Acid−Base Chemistry of Silver-Immobilized 2-Mercaptobenzoic Acid. Langmuir 2011, 27 (7), 3527-3533.
16. Luque, A. M.; Mulder, W. H.; Calvente, J. J., et al., Proton Transfer Voltammetryat Electrodes Modified with Acid Thiol Monolayers. Analytical Chemistry 2012, 84(13), 5778-5786.
17. Sugihara, K.; Shimazu, K.; Uosaki, K., Electrode Potential Effect on the SurfacepKa of a Self-Assembled 15-Mercaptohexadecanoic Acid Monolayer on aGold/Quartz Crystal Microbalance Electrode. Langmuir 2000, 16 (18), 7101-7105.
18. Futamata, M., Characterization of the First Layer and Second Layer Adsorbateson Au Electrodes Using ATR-IR Spectroscopy. J. Electroanal. Chem. 2003, 550–551, 93-103.
19. Goutev, N.; Futamata, M., Attenuated Total Reflection Surface-EnhancedInfrared Absorption Spectroscopy of Carboxyl Terminated Self-AssembledMonolayers on Gold. Appl. Spectrosc. 2003, 57 (5), 506-513.
20. Luque, A. M.; Cuesta, A.; Calvente, J. J., et al., Potentiostatic Infrared Titration of11-Mercaptoundecanoic Acid Monolayers. Electrochem. Commun. 2014, 45, 13-16.
21. Song, Y.; Luo, Y.; Zhu, C., et al., Recent Advances in ElectrochemicalBiosensors Based on Graphene Two-Dimensional Nanomaterials. Biosens.Bioelectron. 2016, 76, 195-212.
22. Lee, G.; Cheng, Y.; Varanasi, C. V., et al., Influence of the Nickel OxideNanostructure Morphology on the Effectiveness of Reduced Graphene OxideCoating in Supercapacitor Electrodes. The Journal of Physical Chemistry C 2014,118 (5), 2281-2286.
23. Ma, L.; Su, L.; Zhang, J., et al., A Controllable Morphology GO/PANI/MetalHydroxide Composite for Supercapacitor. J. Electroanal. Chem. 2016, 777, 75-84.

237
Appendix 1: Additional Figures for Chapter 4
Figure A1.1 Cyclic voltammograms of 0.5 × 10⁻³
M K3[Fe(CN)6] at a BDD modified with GNF-COOH in different concentrations of pH 5 PBS: 1 M (blue); 0.1 M (red); 0.01 M (black). Scan
rate 50 mV s−1
. First scans shown.

Appendix 1: Additional Figures for Chapter 4
238
Figure A1.2 Cyclic voltammograms of 0.5 × 10⁻³
M K4[Ru(CN)6] at (a) clean BDD; (b) BDDmodified with GNF-COOH. Supporting electrolyte: 0.1 M PBS at pH 6 (black), pH 7 (red), pH 8
(blue). Scan rate 50 mV s−1
. First scans shown.

Appendix 1: Additional Figures for Chapter 4
239
Figure A1.3 Cyclic voltammograms of 0.5 × 10⁻³
M K3[Fe(CN)6] at a BDD modified with GNF-COOH in 0.01 M NaCl at pH 5 (black) and pH 8.4 (red). Scan rate 50 mV s
−1. First scans
shown.
Figure A1.4 UV Vis spectra of 2 × 10⁻³
M K3[Fe(CN)6] and 2 × 10⁻³
M K4[Fe(CN)6] with30 μg ml
−1GNF in H2O at t = 0 h (black), t = 7 h (red) and t = 24 h (blue).

240
Appendix 2: Derivation of Equation (5.9)
For an acid HA:
HA = H+ + A− (A.1)
K =a a
a (A.2)
However, if excess cation M+ is present, this can associate with A− and change its
activity:
M+ + A− = MA (A.3)
K =a
a a (A.4)
From Equation (A.4):
a =a
K a (A.5)
Substituting into Equation (A.5):
K =a a
a K a (A.6)
Taking logs:

Appendix 2: Derivation of Equation (5.9)
241
log Ka = loga a
a − log Kas − log a (A.7)
By definition, the first term in Equation (A.7) is pKa(app), i.e. the measured pKa when
the activity of M+ is not zero.
Therefore:
−pK = −pK (app) + pK − log a (A.8)
Equation (A.8) then rearranges into Equation (5.9).

242
Appendix 3: Calculation of the values presented
in Table 5.6
The asymmetric stretch of sulphate ion absorbs strongly in infrared around 1100 cm−1
and this band was found to decrease and increase with applied potential. This change
in the activity of sulphate ions, ΔaSO4 , at the electrode surface, due to electrostatic
migration effects on application of −0.5 V, was quantified with help of calibration
experiments in Section 5.7 and it was found to be −3.5 × 10⁻³ M. Therefore, on
application of −0.5 V, it is expected that the change in the activity of potassium cations,
ΔaK+, is 2 × ΔaSO4 = +7 × 10⁻³ M.
aK+ in the equilibrated state and on application of −0.5 V was calculated from the
amount of K2SO4 used to prepare solutions at specific pH. pKa(app) values were
determined using Equation (5.9), and activity changes in sulphate species on
application of −0.5 V were then calculated using the modified Henderson-Hasselbalch
equation (Equation (5.10)).
The following assumptions are made in the calculations: ΔaK+ is taken to be +7 × 10⁻³
M regardless of equilibrium concentration of K+; concentration is approximated with
activity; and the increased sulphate concentration at the interface due to pre-
concentration is neglected (it is clear from IR spectra in Figure 5.5 that aSO4 is higher
at the electrode interface than in the bulk solution).

Appendix 3: Calculation of the values presented in Table 5.6
243
0.1 M pH 7 K2SO4 solution
K2SO4 is expected to dissociate fully, thus giving aK+ = 0.200 M at equilibrium. On
application of −0.5 V the activity of K+ increases to aK+ = 0.207 M. Using these activity
values, pKa(HSO4−) = 1.92 and assuming pKas = 0, pKa(app) can be calculated using
Equation (5.9): pKa(app) = pKa + pKas – log(aK+).
At equilibrium: pKa(app) = 1.92 + 0 – log(0.200) = 2.619
At −0.5 V: pKa(app) = 1.92 + 0 – log(0.207) = 2.604
To determine the speciation at a specific pH Equation (5.10) is used:
pH = pKa(app) + log([aSO4
2 ]/[aHSO4 ])
At equilibrium:a
SO42
aHSO4
=10pH pKa(app) = 24045
At −0.5 V: a
SO42
aHSO4
=10pH pKa(app) = 24887
Therefore, for 0.1 M pH 7 solution on application of −0.5 V:
ΔaSO4
2 = 0.1 M ×
−
ΔaSO4
2 = +0.14 × 10⁻⁶ M
The above calculation predicts that as a negative potential is applied, 0.14 × 10⁻⁶ M
HSO4− will deprotonate and form SO4
2−. In experimental conditions this value is too
small to be detected and we can therefore expect to see no protonation of SO42− and
all changes in ΔaSO4
2 will result from migration effects.

Appendix 3: Calculation of the values presented in Table 5.6
244
0.1 M pH 3.5 K2SO4 solution
pH 3.5 K2SO4 was prepared by combining 0.1 M H2SO4 and 0.1 M K2SO4. The final
concentrations were 0.0988 M K2SO4 and 0.0012 M H2SO4, giving 0.198 M K+.
Therefore, at equilibrium and 1.0 V: aK+ = 0.198 M
On application of −0.5 V: aK+ = 0.205 M
Using Equation (5.9): pKa(app) = pKa + pKas – log(aK+):
At equilibrium: pKa(app) = 1.92 + 0 – log(0.198) = 2.623
At −0.5 V: pKa(app) = 1.92 + 0 – log(0.205) = 2.608
Using pH = pKa(app) + log([aSO4
2 ]/[aHSO4 ]) to determine speciation:
At equilibrium:a
SO42
aHSO4
=10pH pKa(app) = 7.604
At −0.5 V: a
SO42
aHSO4
=10pH pKa(app) = 7.870
Therefore, on application of −0.5 V: ΔaSO4
2 = +0.355 × 10⁻³ M
From the calculation above, in 0.1 M K2SO4 solution at pH 3.5 and on application of
−0.5 V, we predict 0.36 × 10⁻³ M HSO4− to deprotonate and form SO4
2−.

Appendix 3: Calculation of the values presented in Table 5.6
245
0.1 M pH 3 K2SO4 solution
pH 3 K2SO4 solution was prepared by combining 0.1 M H2SO4 and 0.1 M K2SO4. The
final concentrations were 0.096 M K2SO4 and 0.004 M H2SO4, giving 0.192 M K+.
Therefore, at equilibrium and 1.0 V: aK+ = 0.192 M
On application of −0.5 V: aK+ = 0.199 M
As above, Equation (5.9) is used to find pKa(app):
At equilibrium: pKa(app) = 2.637
At −0.5 V: pKa(app) = 2.621
Using pH = pKa(app) + log([aSO4
2 ]/[aHSO4 ]) to determine speciation:
At equilibrium:a
SO42
aHSO4
=10pH pKa(app) = 2.405
At −0.5 V: a
SO42
aHSO4
=10pH pKa(app) = 2.489
Therefore, at −0.5 V: ΔaSO4
2 = +0.75 × 10⁻³ M
In 0.1 M K2SO4 solution at pH 3 and on application of −0.5 V, we expect to see 0.75 ×
10−3 M HSO4− deprotonating to form SO4
2−.

246
Appendix 4: Calculation of the values presented
in Table 5.7
Following the same methodology as in Appendix 3, changes in phosphate speciation
were calculated using the value of ΔaK+ determined in Section 5.7 (+7 × 10⁻³ M). aK+ in
the equilibrated state and on application of −0.5 V was calculated from the amounts of
KH2PO4 and 0.1 M K2HPO4 used to prepare solutions at specific pH. pKa(app) values
were determined using Equation (5.9), and activity changes in sulphate species on
application of −0.5 V were then calculated using the modified Henderson-Hasselbalch
equation (Equation (5.10)).
0.1 M pH 7 phosphate
pH 7 phosphate solution was prepared by combining 0.1 M KH2PO4 and 0.1 M K2HPO4
in approximately 1:1 ratio. Assuming that both KH2PO4 and K2HPO4 dissociate fully to
K+ and HPO4−, the concentration of K+ in equilibrated state is calculated to be 0.15 M.
Therefore, at equilibrium and 1.0 V: aK+ = 0.150 M
On application of −0.5 V: aK+ = 0.157 M
pKa(app) is calculated using Equation (5.9): pKa(app) = pKa + pKas – log(aK+ ) with
values pKa(H2PO4−) = 7.2 and pKas = 0:

Appendix 4: Calculation of the values presented in Table 5.7
247
At equilibrium and 1.0 V: pKa(app) = 8.033
On application of −0.5 V: pKa(app) = 8.014
Using pH = pKa(app) + log([aHPO4
2 ]/ [aH2PO4 ]) to determine speciation:
At equilibrium and 1.0 V:a
HPO42
aH2PO4
=10pH pKa(app) = 0.092
At −0.5 V: a
HPO42
aH2PO4
=10pH pKa(app) = 0.097
Therefore, on application of −0.5 V: ΔaHPO4
2 = +0.36 × 10⁻³ M.
From the calculation above, in 0.1 M phosphate solution at pH 7 and on application of
−0.5 V, we predict 0.36 × 10⁻³ M H2PO4− to deprotonate and form HPO4
2−.
0.1 M pH 9 phosphate
pH 9 phosphate solution was prepared from 0.1 M K2HPO4, which dissociates fully to
give 0.2 M K+ and 0.1 M HPO42−. Therefore, at equilibrium and 1.0 V we have aK+ =
0.200 M, and on application of −0.5 V we have aK+ = 0.207 M.
pKa(app) is calculated using Equation (5.9): pKa(app) = pKa + pKas – log(aK+ ) with
values pKa(H2PO4−) = 7.2 and pKas = 0:
At equilibrium and 1.0 V: pKa(app) = 7.909
On application of −0.5 V: pKa(app) = 7.894
Using pH = pKa(app) + log([aHPO4
2 ]/ [aH2PO4 ]) to determine speciation:
At equilibrium:a
HPO42
aH2PO4
=10pH pKa(app) = 12.33

Appendix 4: Calculation of the values presented in Table 5.7
248
At −0.5 V: a
HPO42
aH2PO4
=10pH pKa(app) = 12.76
Corresponds to a ΔaHPO4
2 = +0.24 × 10⁻³ M
In 0.1 M phosphate solution at pH 9 and on application of −0.5 V, we expect to see
0.24 × 10⁻³ M H2PO4− deprotonating to form HPO4
2−.
0.1 M pH 3 phosphate
At pH 3, the phosphate will exist as H2PO4− and H3PO4. The solution was prepared by
combining 0.1 M KH2PO4 and 0.1 M H3PO4 with final concentrations of 0.08 M KH2PO4
and 0.02 M H3PO4.
Therefore, at equilibrium and 1.0 V: aK+ = 0.08 M
On application of −0.5 V: aK+ = 0.087 M
pKa(app) is calculated using Equation (5.9): pKa(app) = pKa + pKas – log(aK+ ) with
values pKa(H3PO4) = 2.12 and pKas = 0:
At equilibrium and 1.0 V: pKa(app) = 3.217
On application of −0.5 V: pKa(app) = 3.180
Using pH = pKa(app) + log([aH2PO4 ]/ [a
H3PO40]) to determine speciation:
At equilibrium:aH2PO
4
aH3PO
40
=10pH pKa(app) = 0.092
At −0.5 V: aH2PO
4
aH3PO
40
=10pH pKa(app) = 0.097
Corresponds to a ΔaH2PO4 = +2.0 × 10⁻³ M.

Appendix 4: Calculation of the values presented in Table 5.7
249
From the calculation above, in 0.1 M phosphate solution at pH 3 and on application of
−0.5 V, we predict 2.0 × 10⁻³ M H3PO4 to deprotonate and form H2PO4−.
Related Documents